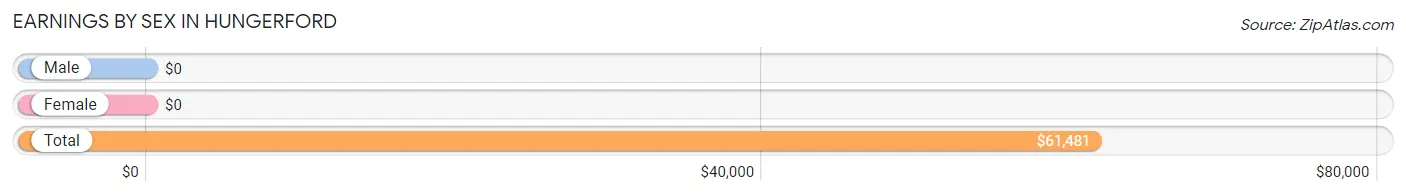
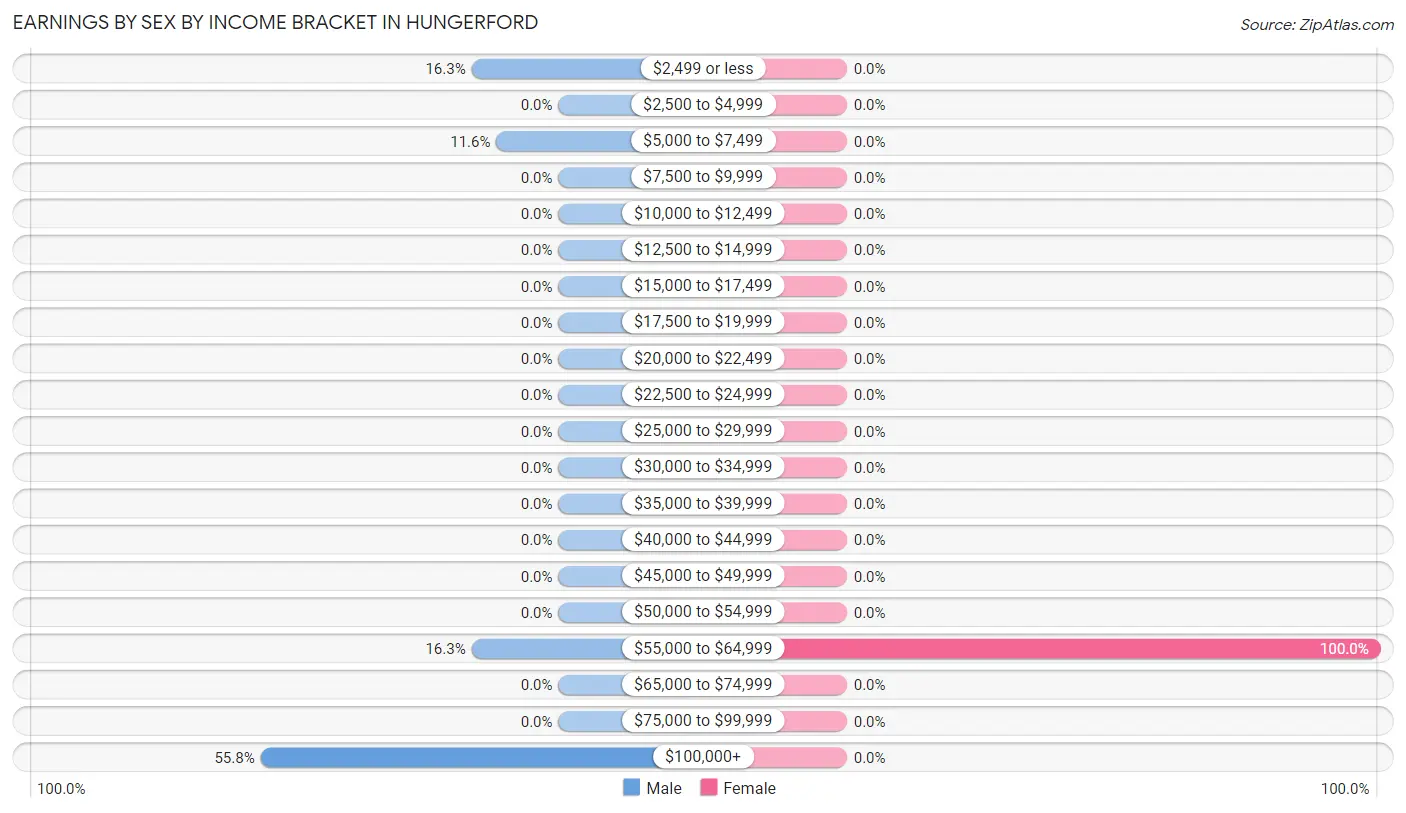
The most common earnings brackets in Hungerford are $100,000+ for men (24 | 55.8%) and $55,000 to $64,999 for women (27 | 100.0%).
Income
Male
Female
$2,499 or less
7 (16.3%)
0 (0.0%)
$2,500 to $4,999
0 (0.0%)
0 (0.0%)
$5,000 to $7,499
5 (11.6%)
0 (0.0%)
$7,500 to $9,999
0 (0.0%)
0 (0.0%)
$10,000 to $12,499
0 (0.0%)
0 (0.0%)
$12,500 to $14,999
0 (0.0%)
0 (0.0%)
$15,000 to $17,499
0 (0.0%)
0 (0.0%)
$17,500 to $19,999
0 (0.0%)
0 (0.0%)
$20,000 to $22,499
0 (0.0%)
0 (0.0%)
$22,500 to $24,999
0 (0.0%)
0 (0.0%)
$25,000 to $29,999
0 (0.0%)
0 (0.0%)
$30,000 to $34,999
0 (0.0%)
0 (0.0%)
$35,000 to $39,999
0 (0.0%)
0 (0.0%)
$40,000 to $44,999
0 (0.0%)
0 (0.0%)
$45,000 to $49,999
0 (0.0%)
0 (0.0%)
$50,000 to $54,999
0 (0.0%)
0 (0.0%)
$55,000 to $64,999
7 (16.3%)
27 (100.0%)
$65,000 to $74,999
0 (0.0%)
0 (0.0%)
$75,000 to $99,999
0 (0.0%)
0 (0.0%)
$100,000+
24 (55.8%)
0 (0.0%)
Total
43 (100.0%)
27 (100.0%)
Earnings by Sex by Educational Attainment in Hungerford
Educational Attainment
Male Income
Female Income
Less than High School
-
-
High School Diploma
-
-
College or Associate's Degree
-
-
Bachelor's Degree
-
-
Graduate Degree
-
-
Total
-
-
Family Income in Hungerford
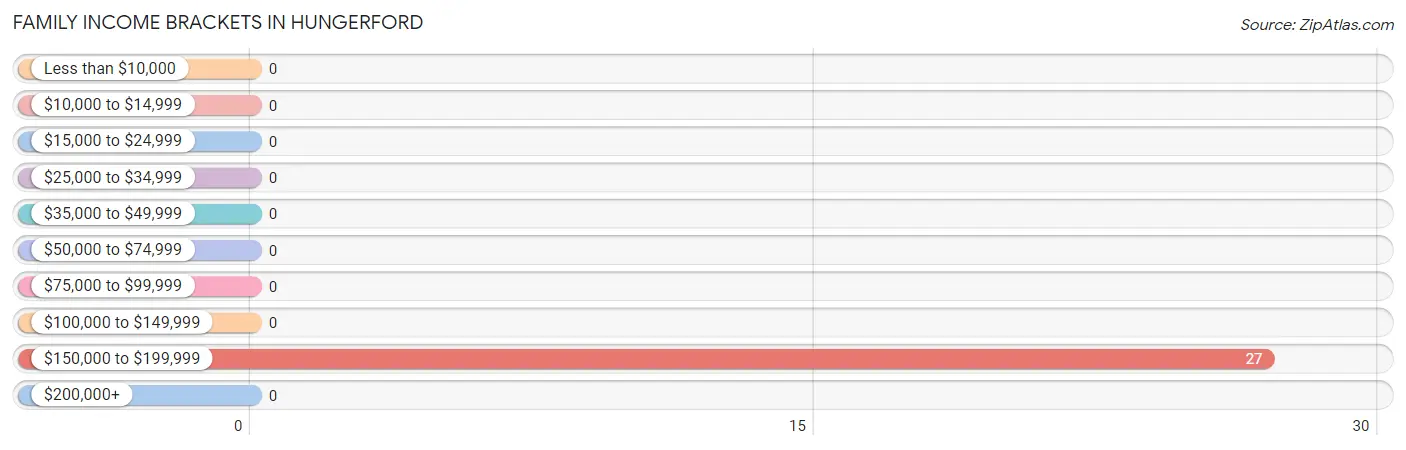
Family Income Brackets in Hungerford
According to the Hungerford family income data, there are 27 families falling into the $150,000 to $199,999 income range, which is the most common income bracket and makes up 100.0% of all families.
Income Bracket
# Families
% Families
Less than $10,000
0
0.0%
$10,000 to $14,999
0
0.0%
$15,000 to $24,999
0
0.0%
$25,000 to $34,999
0
0.0%
$35,000 to $49,999
0
0.0%
$50,000 to $74,999
0
0.0%
$75,000 to $99,999
0
0.0%
$100,000 to $149,999
0
0.0%
$150,000 to $199,999
27
100.0%
$200,000+
0
0.0%
Family Income by Famaliy Size in Hungerford
Income Bracket
# Families
Median Income
2-Person Families
0 (0.0%)
$0
3-Person Families
0 (0.0%)
$0
4-Person Families
27 (100.0%)
$0
5-Person Families
0 (0.0%)
$0
6-Person Families
0 (0.0%)
$0
7+ Person Families
0 (0.0%)
$0
Total
27 (100.0%)
$0
Family Income by Number of Earners in Hungerford
Number of Earners
# Families
Median Income
No Earners
0 (0.0%)
$0
1 Earner
0 (0.0%)
$0
2 Earners
27 (100.0%)
$0
3+ Earners
0 (0.0%)
$0
Total
27 (100.0%)
$0
Household Income in Hungerford
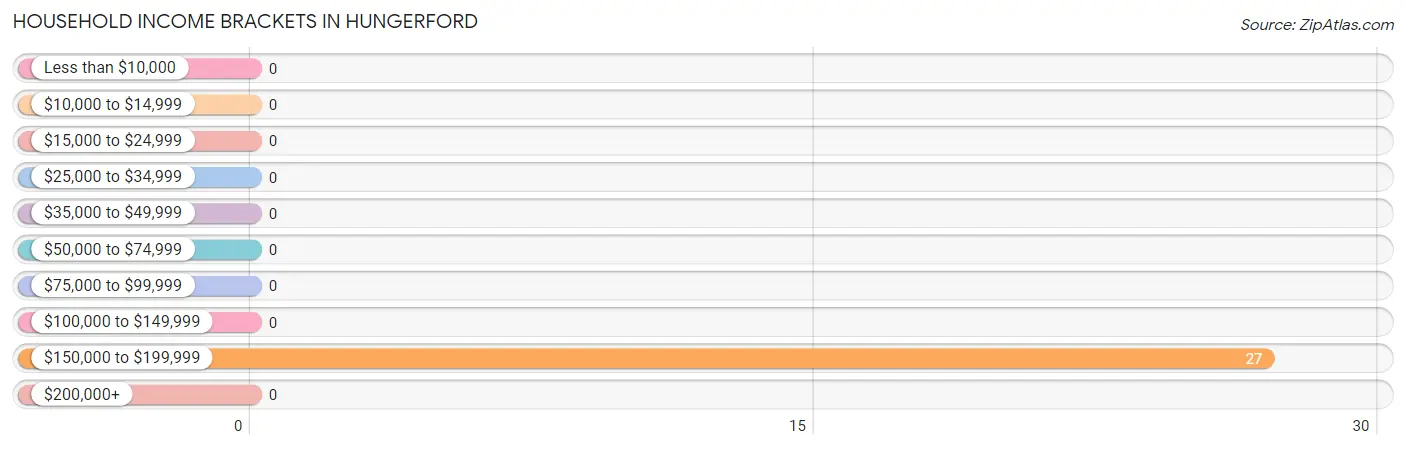
Household Income Brackets in Hungerford
With 27 households falling in the category, the $150,000 to $199,999 income range is the most frequent in Hungerford, accounting for 100.0% of all households.
Income Bracket
# Households
% Households
Less than $10,000
0
0.0%
$10,000 to $14,999
0
0.0%
$15,000 to $24,999
0
0.0%
$25,000 to $34,999
0
0.0%
$35,000 to $49,999
0
0.0%
$50,000 to $74,999
0
0.0%
$75,000 to $99,999
0
0.0%
$100,000 to $149,999
0
0.0%
$150,000 to $199,999
27
100.0%
$200,000+
0
0.0%
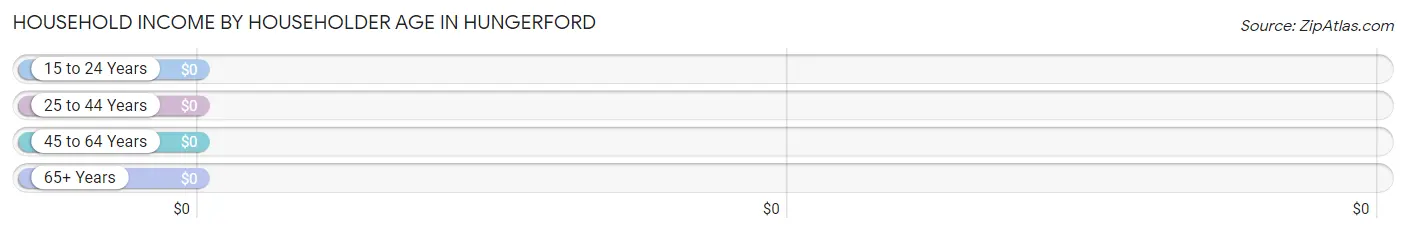
Household Income by Householder Age in Hungerford
Income Bracket
# Households
Median Income
15 to 24 Years
0 (0.0%)
$0
25 to 44 Years
27 (100.0%)
$0
45 to 64 Years
0 (0.0%)
$0
65+ Years
0 (0.0%)
$0
Total
27 (100.0%)
$0
Poverty in Hungerford
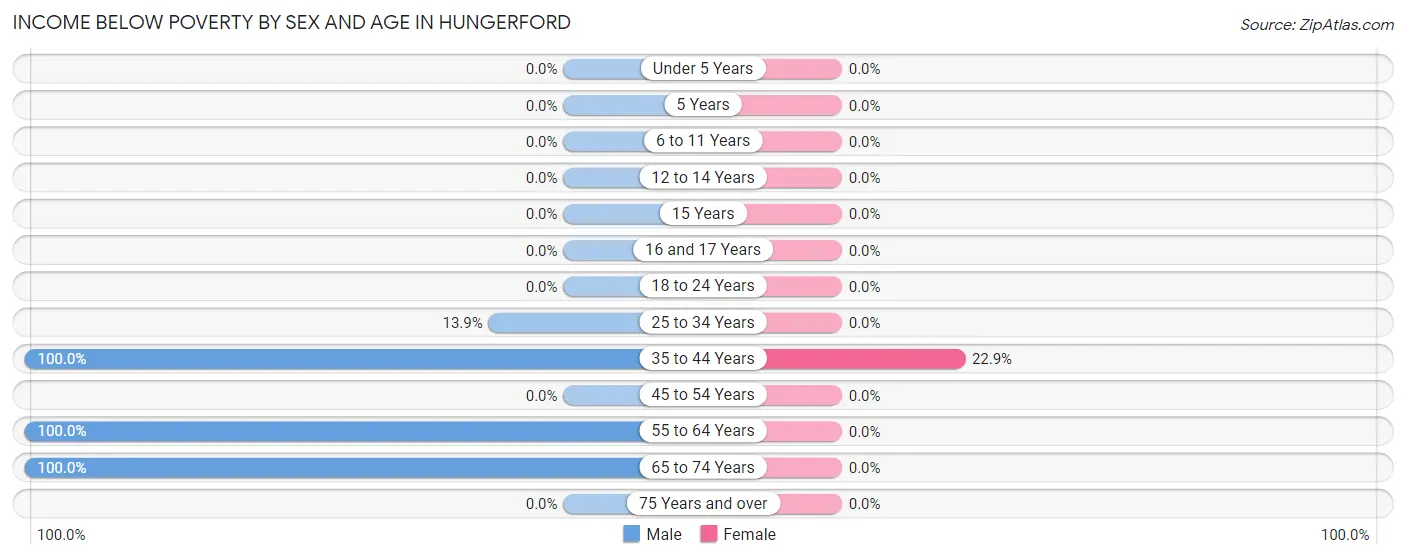
Income Below Poverty by Sex and Age in Hungerford
With 29.7% poverty level for males and 13.3% for females among the residents of Hungerford, 35 to 44 year old males and 35 to 44 year old females are the most vulnerable to poverty, with 5 males (100.0%) and 8 females (22.9%) in their respective age groups living below the poverty level.
Age Bracket
Male
Female
Under 5 Years
0 (0.0%)
0 (0.0%)
5 Years
0 (0.0%)
0 (0.0%)
6 to 11 Years
0 (0.0%)
0 (0.0%)
12 to 14 Years
0 (0.0%)
0 (0.0%)
15 Years
0 (0.0%)
0 (0.0%)
16 and 17 Years
0 (0.0%)
0 (0.0%)
18 to 24 Years
0 (0.0%)
0 (0.0%)
25 to 34 Years
5 (13.9%)
0 (0.0%)
35 to 44 Years
5 (100.0%)
8 (22.9%)
45 to 54 Years
0 (0.0%)
0 (0.0%)
55 to 64 Years
7 (100.0%)
0 (0.0%)
65 to 74 Years
5 (100.0%)
0 (0.0%)
75 Years and over
0 (0.0%)
0 (0.0%)
Total
22 (29.7%)
8 (13.3%)
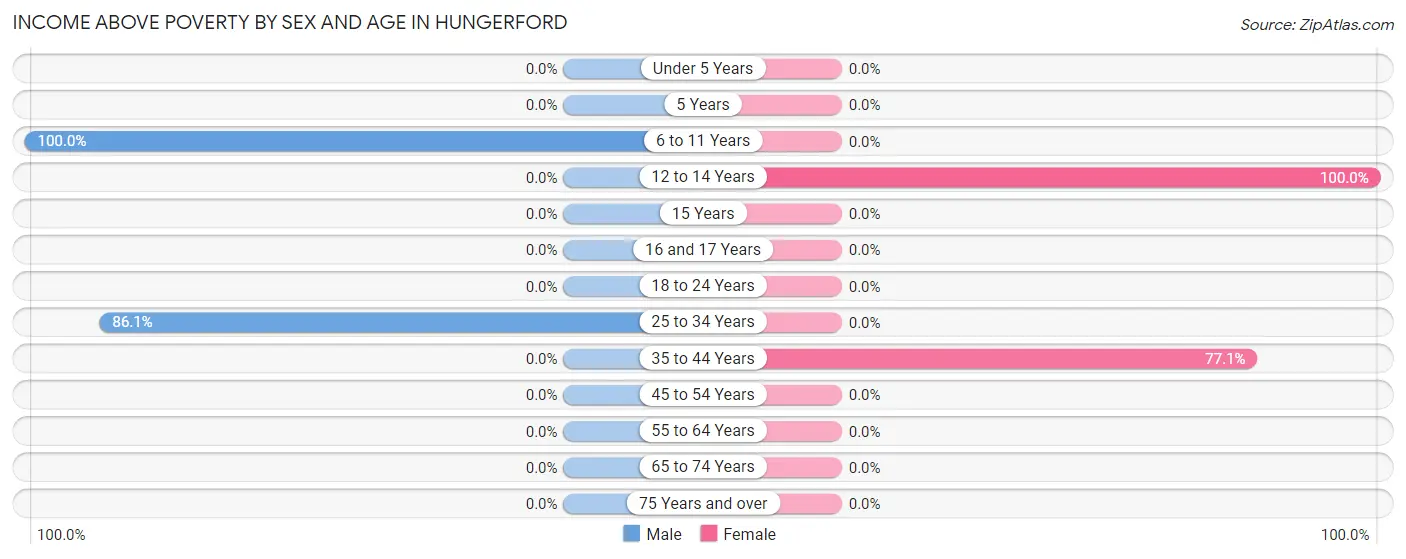
Income Above Poverty by Sex and Age in Hungerford
According to the poverty statistics in Hungerford, males aged 6 to 11 years and females aged 12 to 14 years are the age groups that are most secure financially, with 100.0% of males and 100.0% of females in these age groups living above the poverty line.
Age Bracket
Male
Female
Under 5 Years
0 (0.0%)
0 (0.0%)
5 Years
0 (0.0%)
0 (0.0%)
6 to 11 Years
21 (100.0%)
0 (0.0%)
12 to 14 Years
0 (0.0%)
25 (100.0%)
15 Years
0 (0.0%)
0 (0.0%)
16 and 17 Years
0 (0.0%)
0 (0.0%)
18 to 24 Years
0 (0.0%)
0 (0.0%)
25 to 34 Years
31 (86.1%)
0 (0.0%)
35 to 44 Years
0 (0.0%)
27 (77.1%)
45 to 54 Years
0 (0.0%)
0 (0.0%)
55 to 64 Years
0 (0.0%)
0 (0.0%)
65 to 74 Years
0 (0.0%)
0 (0.0%)
75 Years and over
0 (0.0%)
0 (0.0%)
Total
52 (70.3%)
52 (86.7%)
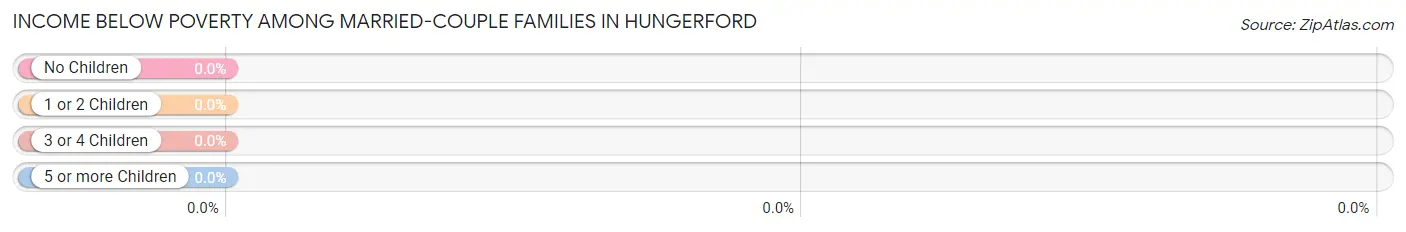
Income Below Poverty Among Married-Couple Families in Hungerford
Children
Above Poverty
Below Poverty
No Children
0 (0.0%)
0 (0.0%)
1 or 2 Children
27 (100.0%)
0 (0.0%)
3 or 4 Children
0 (0.0%)
0 (0.0%)
5 or more Children
0 (0.0%)
0 (0.0%)
Total
27 (100.0%)
0 (0.0%)
Income Below Poverty Among Single-Parent Households in Hungerford
Children
Single Father
Single Mother
No Children
0 (0.0%)
0 (0.0%)
1 or 2 Children
0 (0.0%)
0 (0.0%)
3 or 4 Children
0 (0.0%)
0 (0.0%)
5 or more Children
0 (0.0%)
0 (0.0%)
Total
0 (0.0%)
0 (0.0%)
Income Below Poverty Among Married-Couple vs Single-Parent Households in Hungerford
Children
Married-Couple Families
Single-Parent Households
No Children
0 (0.0%)
0 (0.0%)
1 or 2 Children
0 (0.0%)
0 (0.0%)
3 or 4 Children
0 (0.0%)
0 (0.0%)
5 or more Children
0 (0.0%)
0 (0.0%)
Total
0 (0.0%)
0 (0.0%)
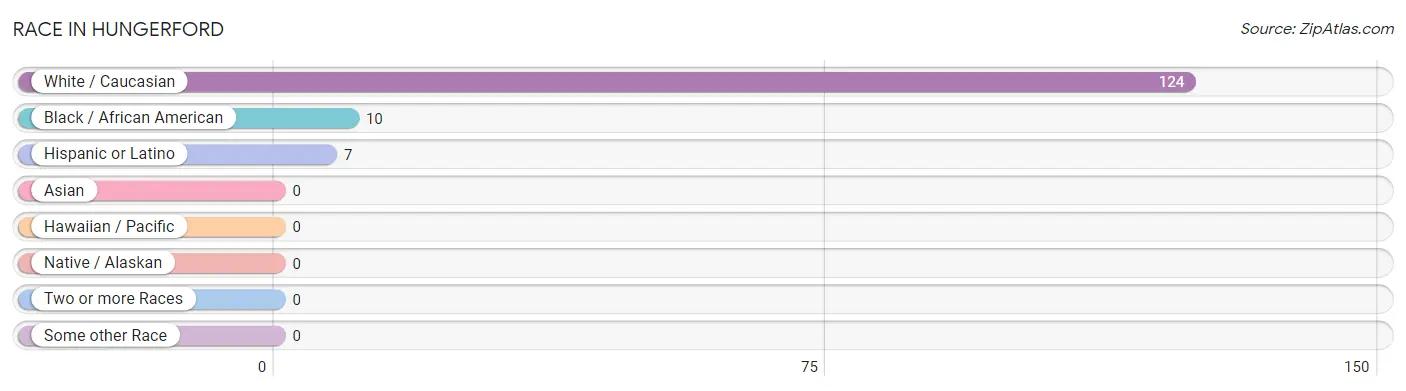
Race in Hungerford
The most populous races in Hungerford are White / Caucasian (124 | 92.5%), Black / African American (10 | 7.5%), and Hispanic or Latino (7 | 5.2%).
Race
# Population
% Population
Asian
0
0.0%
Black / African American
10
7.5%
Hawaiian / Pacific
0
0.0%
Hispanic or Latino
7
5.2%
Native / Alaskan
0
0.0%
White / Caucasian
124
92.5%
Two or more Races
0
0.0%
Some other Race
0
0.0%
Total
134
100.0%
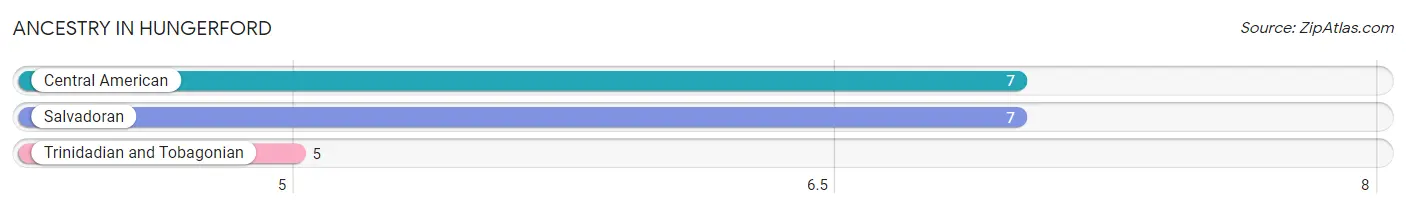
Ancestry in Hungerford
The most populous ancestries reported in Hungerford are Central American (7 | 5.2%), Salvadoran (7 | 5.2%), and Trinidadian and Tobagonian (5 | 3.7%), together accounting for 14.2% of all Hungerford residents.
Ancestry
# Population
% Population
Central American
7
5.2%
Salvadoran
7
5.2%
Trinidadian and Tobagonian
5
3.7%
View All 3 Rows
Immigrants in Hungerford
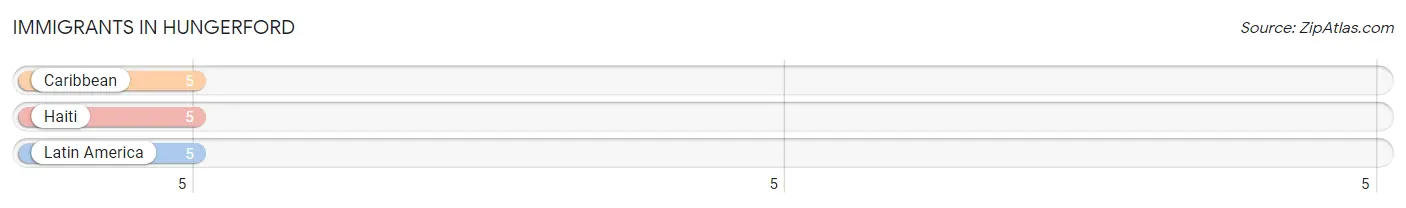
The most numerous immigrant groups reported in Hungerford came from Caribbean (5 | 3.7%), Haiti (5 | 3.7%), and Latin America (5 | 3.7%), together accounting for 11.2% of all Hungerford residents.
Immigration Origin
# Population
% Population
Caribbean
5
3.7%
Haiti
5
3.7%
Latin America
5
3.7%
View All 3 Rows
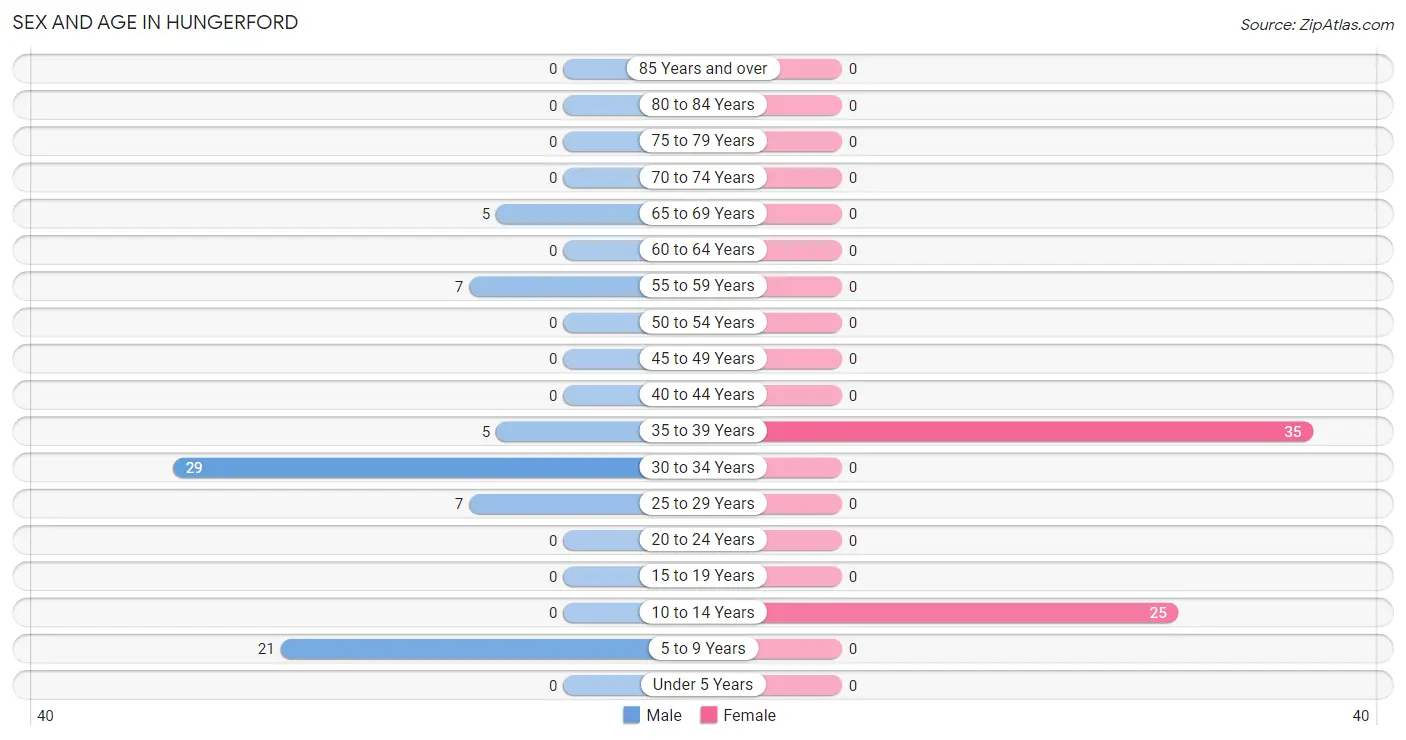
Sex and Age in Hungerford
Sex and Age in Hungerford
The most populous age groups in Hungerford are 30 to 34 Years (29 | 39.2%) for men and 35 to 39 Years (35 | 58.3%) for women.
Age Bracket
Male
Female
Under 5 Years
0 (0.0%)
0 (0.0%)
5 to 9 Years
21 (28.4%)
0 (0.0%)
10 to 14 Years
0 (0.0%)
25 (41.7%)
15 to 19 Years
0 (0.0%)
0 (0.0%)
20 to 24 Years
0 (0.0%)
0 (0.0%)
25 to 29 Years
7 (9.5%)
0 (0.0%)
30 to 34 Years
29 (39.2%)
0 (0.0%)
35 to 39 Years
5 (6.8%)
35 (58.3%)
40 to 44 Years
0 (0.0%)
0 (0.0%)
45 to 49 Years
0 (0.0%)
0 (0.0%)
50 to 54 Years
0 (0.0%)
0 (0.0%)
55 to 59 Years
7 (9.5%)
0 (0.0%)
60 to 64 Years
0 (0.0%)
0 (0.0%)
65 to 69 Years
5 (6.8%)
0 (0.0%)
70 to 74 Years
0 (0.0%)
0 (0.0%)
75 to 79 Years
0 (0.0%)
0 (0.0%)
80 to 84 Years
0 (0.0%)
0 (0.0%)
85 Years and over
0 (0.0%)
0 (0.0%)
Total
74 (100.0%)
60 (100.0%)
Families and Households in Hungerford
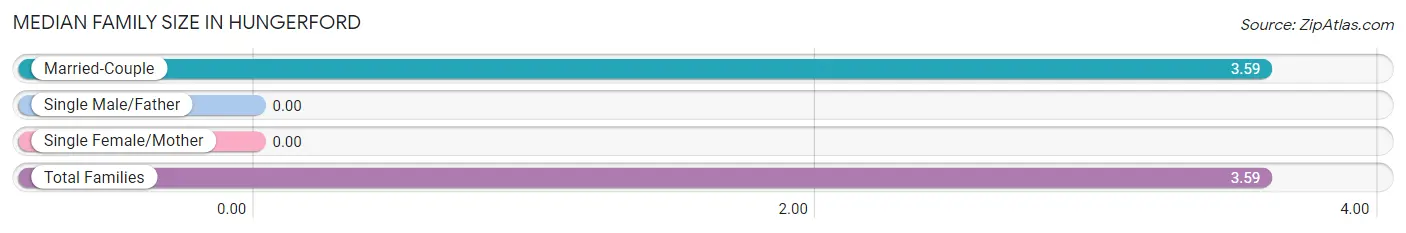
Median Family Size in Hungerford
Family Type
# Families
Family Size
Married-Couple
27 (100.0%)
3.59
Single Male/Father
0 (0.0%)
-
Single Female/Mother
0 (0.0%)
-
Total Families
27 (100.0%)
3.59
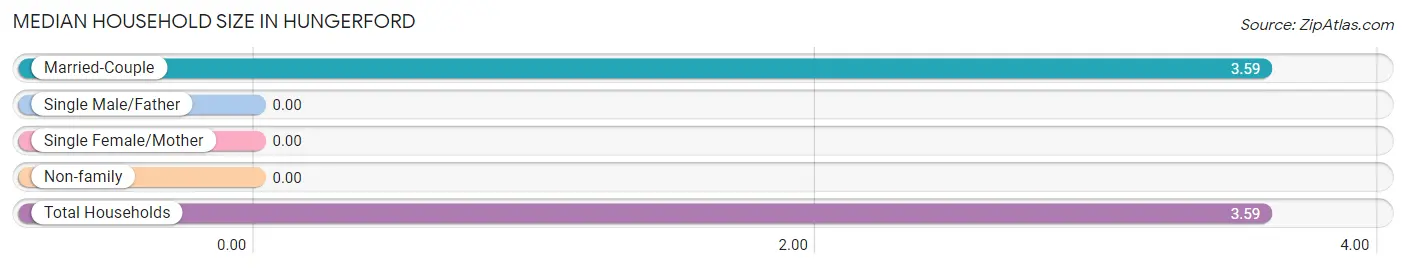
Median Household Size in Hungerford
Household Type
# Households
Household Size
Married-Couple
27 (100.0%)
3.59
Single Male/Father
0 (0.0%)
-
Single Female/Mother
0 (0.0%)
-
Non-family
0 (0.0%)
-
Total Households
27 (100.0%)
3.59
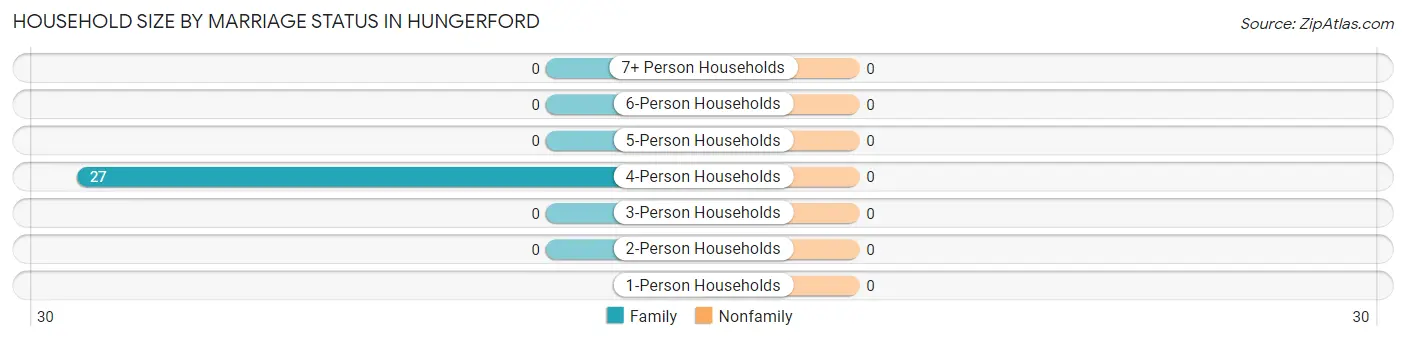
Household Size by Marriage Status in Hungerford
Household Size
Family Households
Nonfamily Households
1-Person Households
-
0 (0.0%)
2-Person Households
0 (0.0%)
0 (0.0%)
3-Person Households
0 (0.0%)
0 (0.0%)
4-Person Households
27 (100.0%)
0 (0.0%)
5-Person Households
0 (0.0%)
0 (0.0%)
6-Person Households
0 (0.0%)
0 (0.0%)
7+ Person Households
0 (0.0%)
0 (0.0%)
Total
27 (100.0%)
0 (0.0%)
Female Fertility in Hungerford
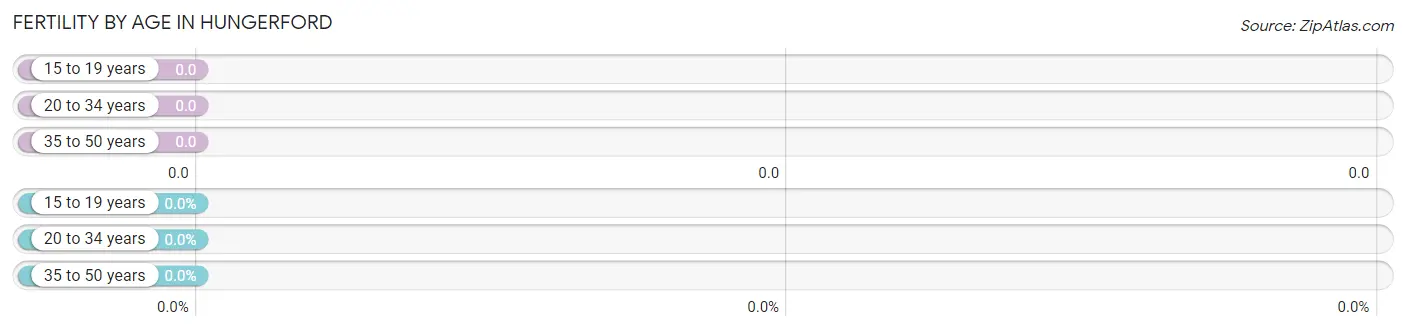
Fertility by Age in Hungerford
Age Bracket
Women with Births
Births / 1,000 Women
15 to 19 years
0 (0.0%)
0.0
20 to 34 years
0 (0.0%)
0.0
35 to 50 years
0 (0.0%)
0.0
Total
0 (0.0%)
0.0
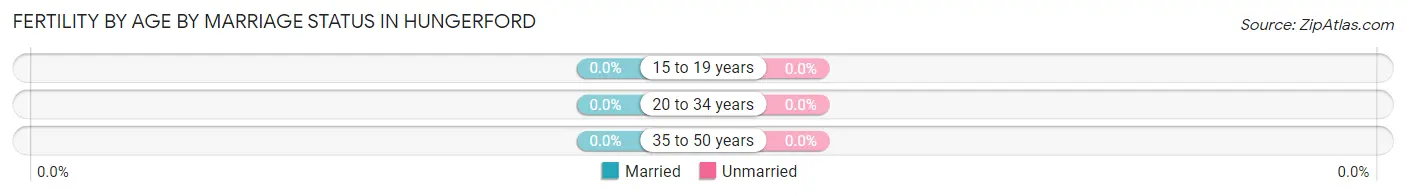
Fertility by Age by Marriage Status in Hungerford
Age Bracket
Married
Unmarried
15 to 19 years
0 (0.0%)
0 (0.0%)
20 to 34 years
0 (0.0%)
0 (0.0%)
35 to 50 years
0 (0.0%)
0 (0.0%)
Total
0 (0.0%)
0 (0.0%)
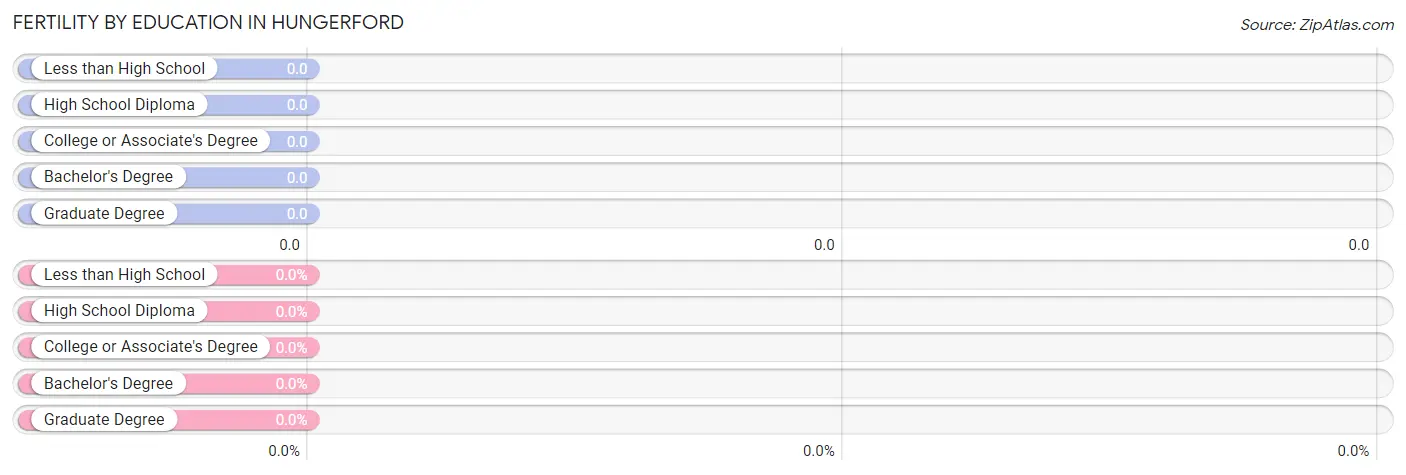
Fertility by Education in Hungerford
Educational Attainment
Women with Births
Births / 1,000 Women
Less than High School
0 (0.0%)
0.0
High School Diploma
0 (0.0%)
0.0
College or Associate's Degree
0 (0.0%)
0.0
Bachelor's Degree
0 (0.0%)
0.0
Graduate Degree
0 (0.0%)
0.0
Total
0 (0.0%)
0.0
Fertility by Education by Marriage Status in Hungerford
Educational Attainment
Married
Unmarried
Less than High School
0 (0.0%)
0 (0.0%)
High School Diploma
0 (0.0%)
0 (0.0%)
College or Associate's Degree
0 (0.0%)
0 (0.0%)
Bachelor's Degree
0 (0.0%)
0 (0.0%)
Graduate Degree
0 (0.0%)
0 (0.0%)
Total
0 (0.0%)
0 (0.0%)
Employment Characteristics in Hungerford
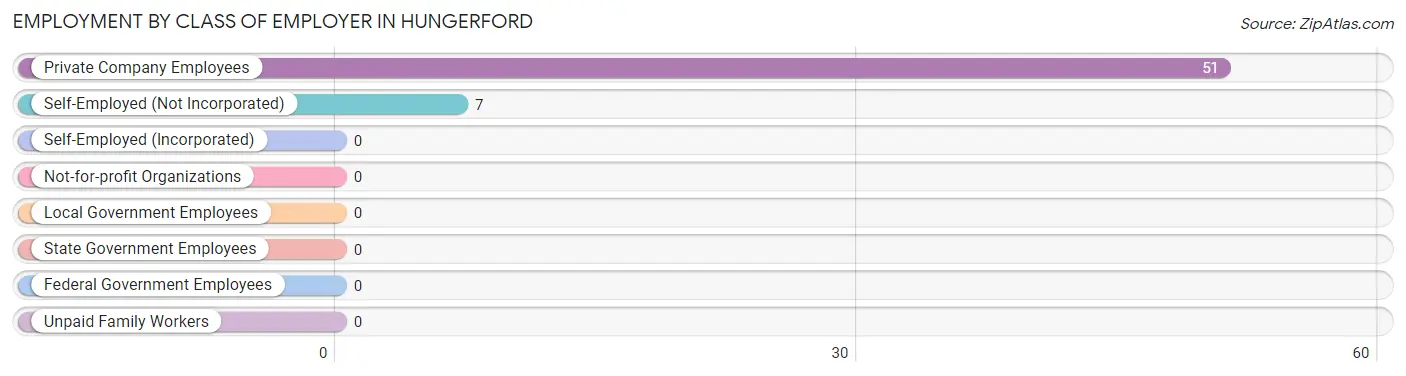
Employment by Class of Employer in Hungerford
Among the 58 employed individuals in Hungerford, private company employees (51 | 87.9%), and self-employed (not incorporated) (7 | 12.1%) make up the most common classes of employment.
Employer Class
# Employees
% Employees
Private Company Employees
51
87.9%
Self-Employed (Incorporated)
0
0.0%
Self-Employed (Not Incorporated)
7
12.1%
Not-for-profit Organizations
0
0.0%
Local Government Employees
0
0.0%
State Government Employees
0
0.0%
Federal Government Employees
0
0.0%
Unpaid Family Workers
0
0.0%
Total
58
100.0%
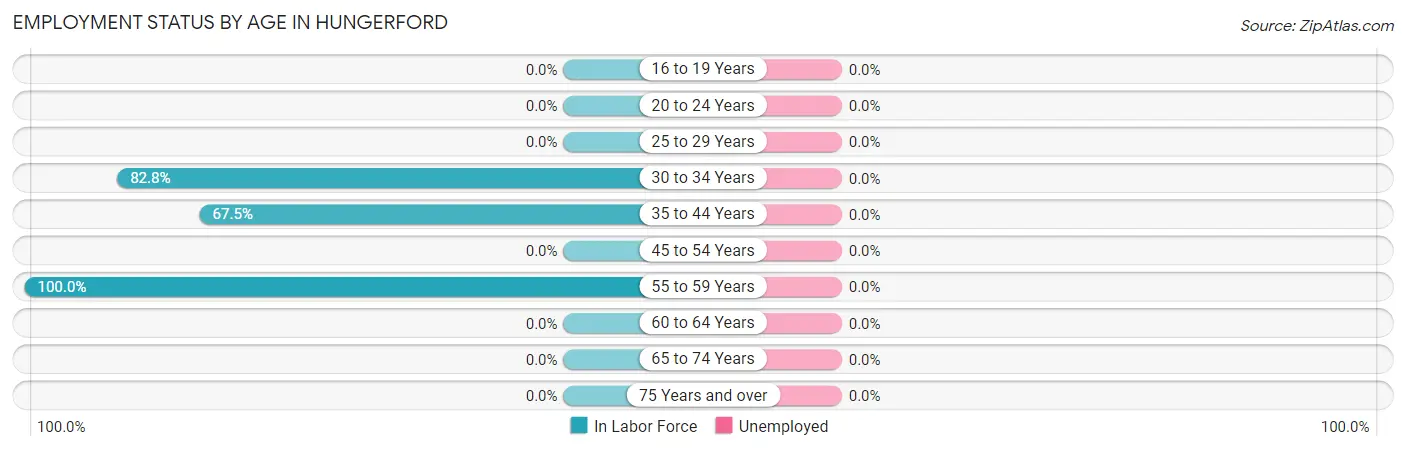
Employment Status by Age in Hungerford
Age Bracket
In Labor Force
Unemployed
16 to 19 Years
0 (0.0%)
0 (0.0%)
20 to 24 Years
0 (0.0%)
0 (0.0%)
25 to 29 Years
0 (0.0%)
0 (0.0%)
30 to 34 Years
24 (82.8%)
0 (0.0%)
35 to 44 Years
27 (67.5%)
0 (0.0%)
45 to 54 Years
0 (0.0%)
0 (0.0%)
55 to 59 Years
7 (100.0%)
0 (0.0%)
60 to 64 Years
0 (0.0%)
0 (0.0%)
65 to 74 Years
0 (0.0%)
0 (0.0%)
75 Years and over
0 (0.0%)
0 (0.0%)
Total
58 (65.9%)
0 (0.0%)
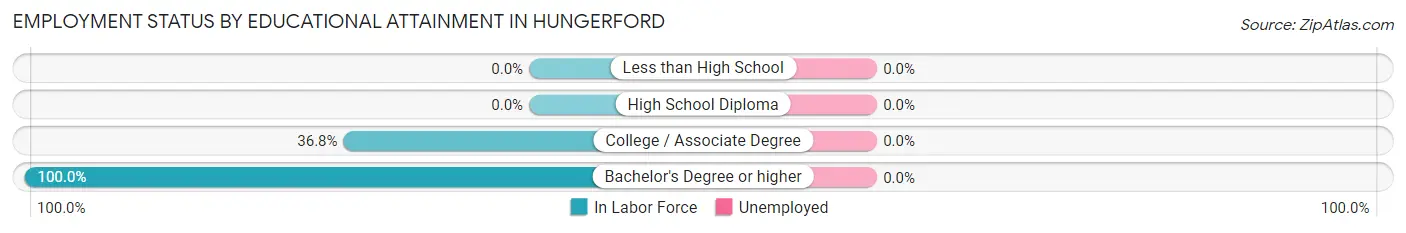
Employment Status by Educational Attainment in Hungerford
Educational Attainment
In Labor Force
Unemployed
Less than High School
0 (0.0%)
0 (0.0%)
High School Diploma
0 (0.0%)
0 (0.0%)
College / Associate Degree
7 (36.8%)
0 (0.0%)
Bachelor's Degree or higher
51 (100.0%)
0 (0.0%)
Total
58 (69.9%)
0 (0.0%)
Employment Occupations by Sex in Hungerford
Management, Business, Science and Arts Occupations
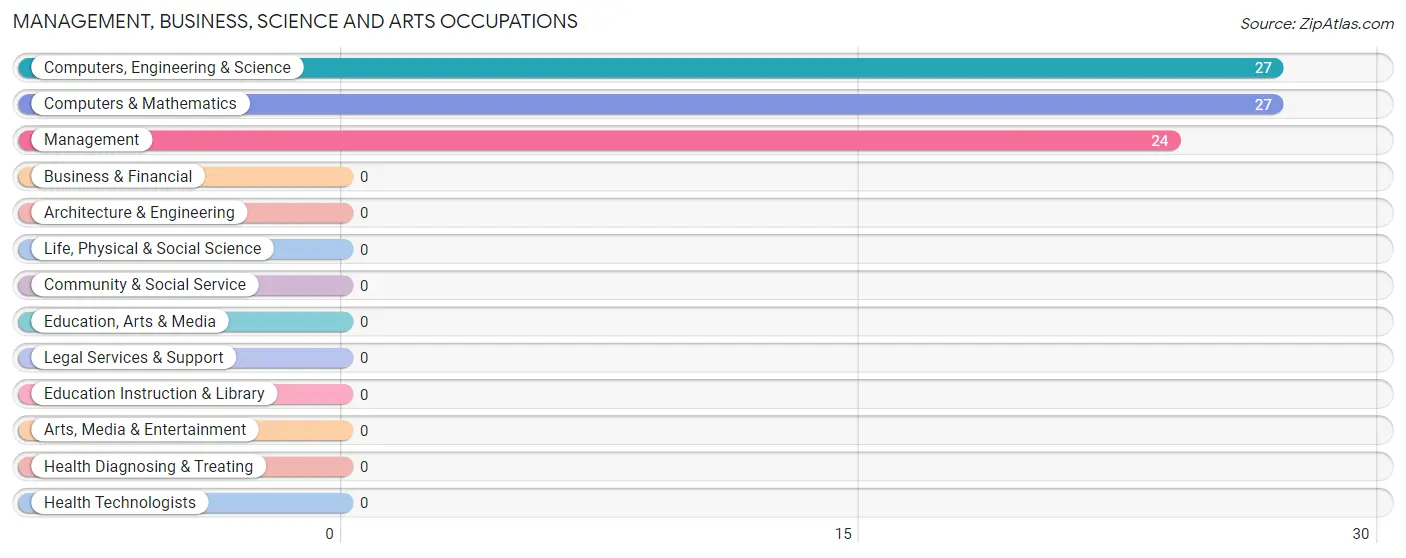
The most common Management, Business, Science and Arts occupations in Hungerford are Computers, Engineering & Science (27 | 46.6%), Computers & Mathematics (27 | 46.6%), and Management (24 | 41.4%).
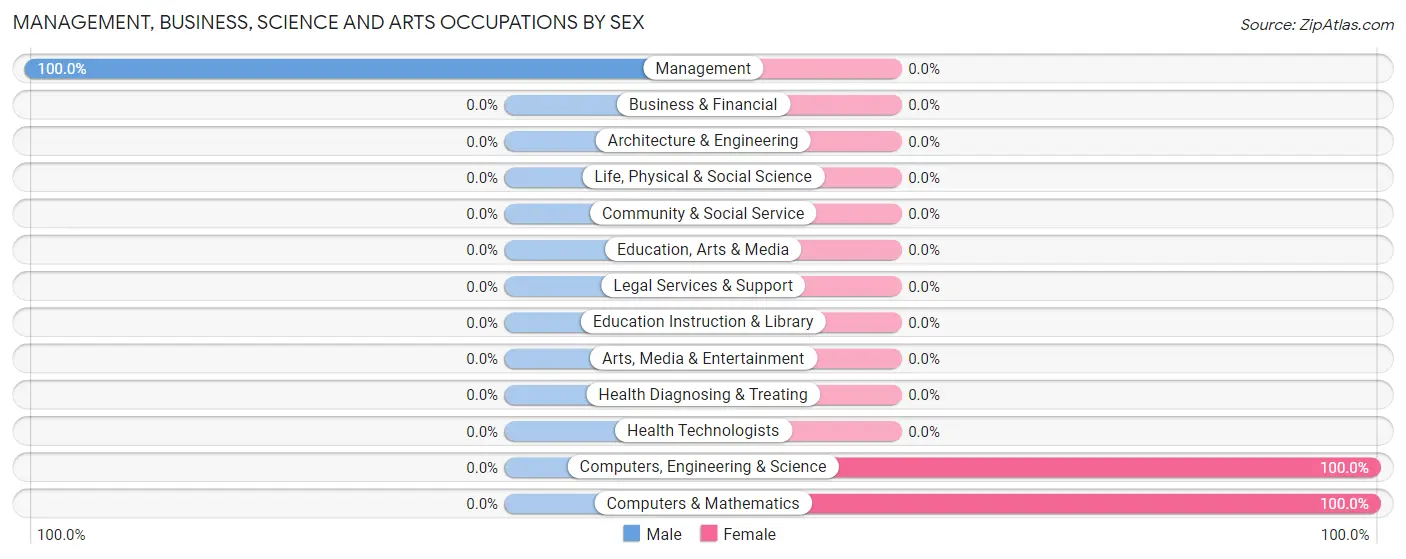
Management, Business, Science and Arts Occupations by Sex
Occupation
Male
Female
Management
24 (100.0%)
0 (0.0%)
Business & Financial
0 (0.0%)
0 (0.0%)
Computers, Engineering & Science
0 (0.0%)
27 (100.0%)
Computers & Mathematics
0 (0.0%)
27 (100.0%)
Architecture & Engineering
0 (0.0%)
0 (0.0%)
Life, Physical & Social Science
0 (0.0%)
0 (0.0%)
Community & Social Service
0 (0.0%)
0 (0.0%)
Education, Arts & Media
0 (0.0%)
0 (0.0%)
Legal Services & Support
0 (0.0%)
0 (0.0%)
Education Instruction & Library
0 (0.0%)
0 (0.0%)
Arts, Media & Entertainment
0 (0.0%)
0 (0.0%)
Health Diagnosing & Treating
0 (0.0%)
0 (0.0%)
Health Technologists
0 (0.0%)
0 (0.0%)
Total (Category)
24 (47.1%)
27 (52.9%)
Total (Overall)
31 (53.4%)
27 (46.6%)
Services Occupations
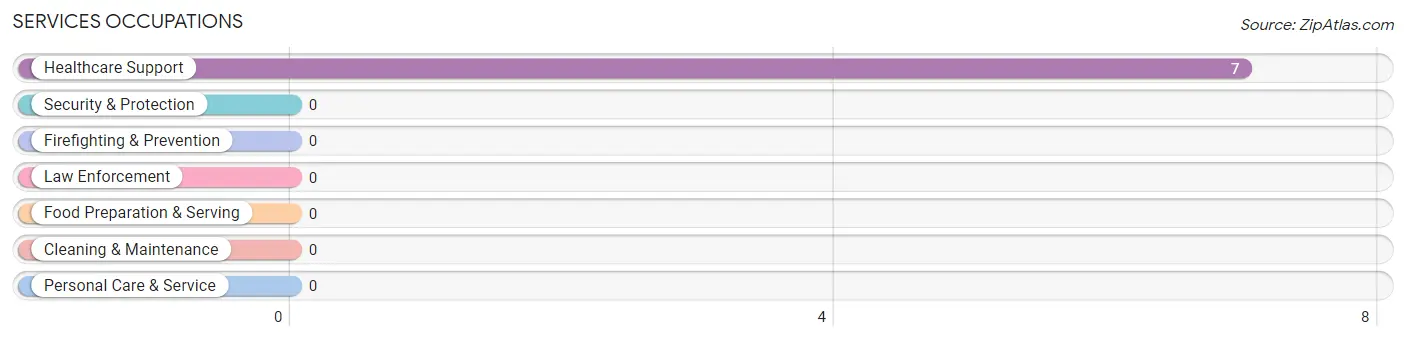
The most common Services occupations in Hungerford are , and Healthcare Support (7 | 12.1%).
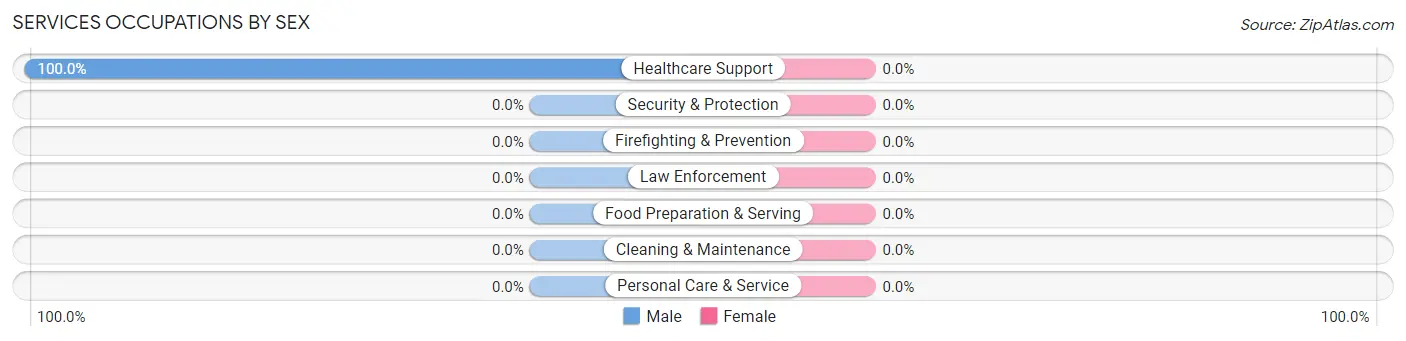
Services Occupations by Sex
Occupation
Male
Female
Healthcare Support
7 (100.0%)
0 (0.0%)
Security & Protection
0 (0.0%)
0 (0.0%)
Firefighting & Prevention
0 (0.0%)
0 (0.0%)
Law Enforcement
0 (0.0%)
0 (0.0%)
Food Preparation & Serving
0 (0.0%)
0 (0.0%)
Cleaning & Maintenance
0 (0.0%)
0 (0.0%)
Personal Care & Service
0 (0.0%)
0 (0.0%)
Total (Category)
7 (100.0%)
0 (0.0%)
Total (Overall)
31 (53.4%)
27 (46.6%)
Sales and Office Occupations
Sales and Office Occupations by Sex
Occupation
Male
Female
Sales & Related
0 (0.0%)
0 (0.0%)
Office & Administration
0 (0.0%)
0 (0.0%)
Total (Category)
0 (0.0%)
0 (0.0%)
Total (Overall)
31 (53.4%)
27 (46.6%)
Natural Resources, Construction and Maintenance Occupations
Natural Resources, Construction and Maintenance Occupations by Sex
Occupation
Male
Female
Farming, Fishing & Forestry
0 (0.0%)
0 (0.0%)
Construction & Extraction
0 (0.0%)
0 (0.0%)
Installation, Maintenance & Repair
0 (0.0%)
0 (0.0%)
Total (Category)
0 (0.0%)
0 (0.0%)
Total (Overall)
31 (53.4%)
27 (46.6%)
Production, Transportation and Moving Occupations
Production, Transportation and Moving Occupations by Sex
Occupation
Male
Female
Production
0 (0.0%)
0 (0.0%)
Transportation
0 (0.0%)
0 (0.0%)
Material Moving
0 (0.0%)
0 (0.0%)
Total (Category)
0 (0.0%)
0 (0.0%)
Total (Overall)
31 (53.4%)
27 (46.6%)
Employment Industries by Sex in Hungerford
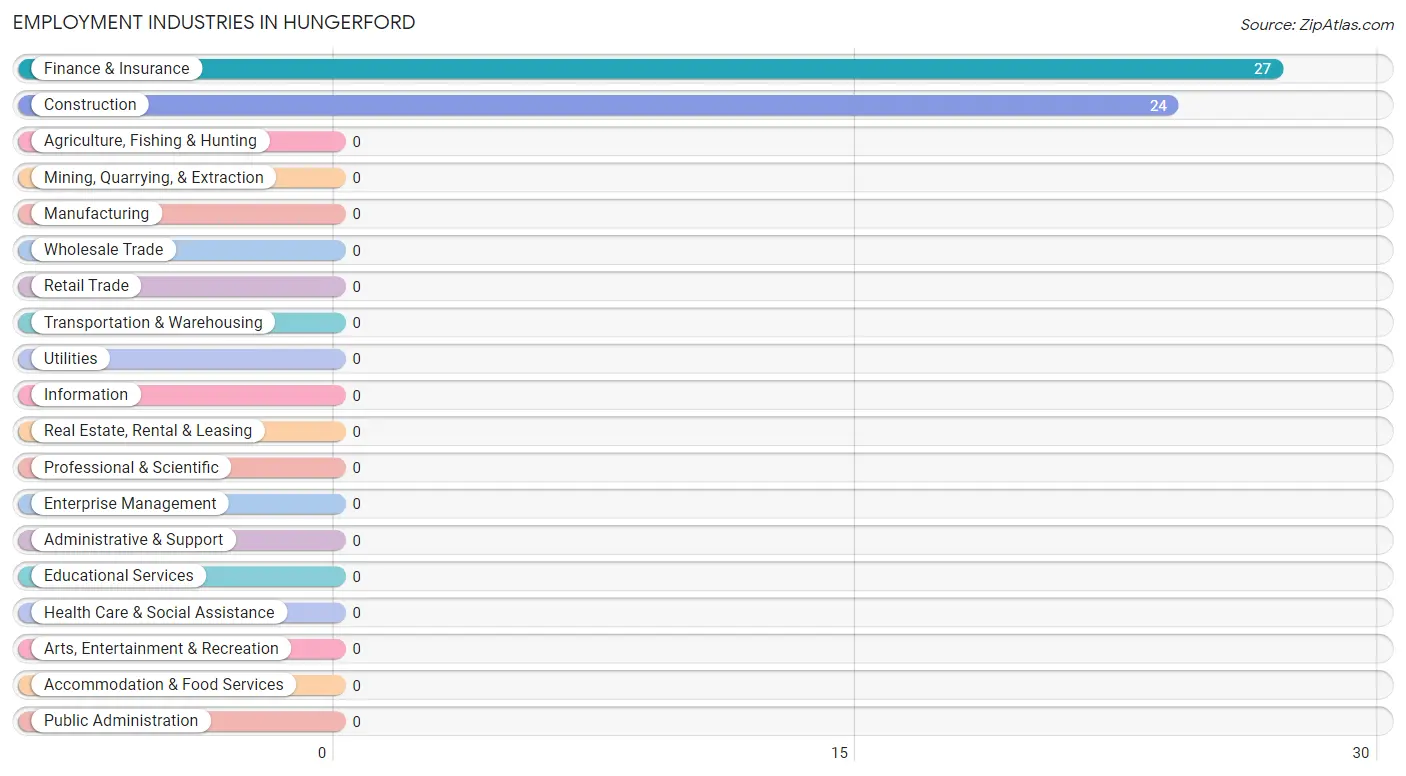
Employment Industries in Hungerford
The major employment industries in Hungerford include Finance & Insurance (27 | 46.6%), and Construction (24 | 41.4%).
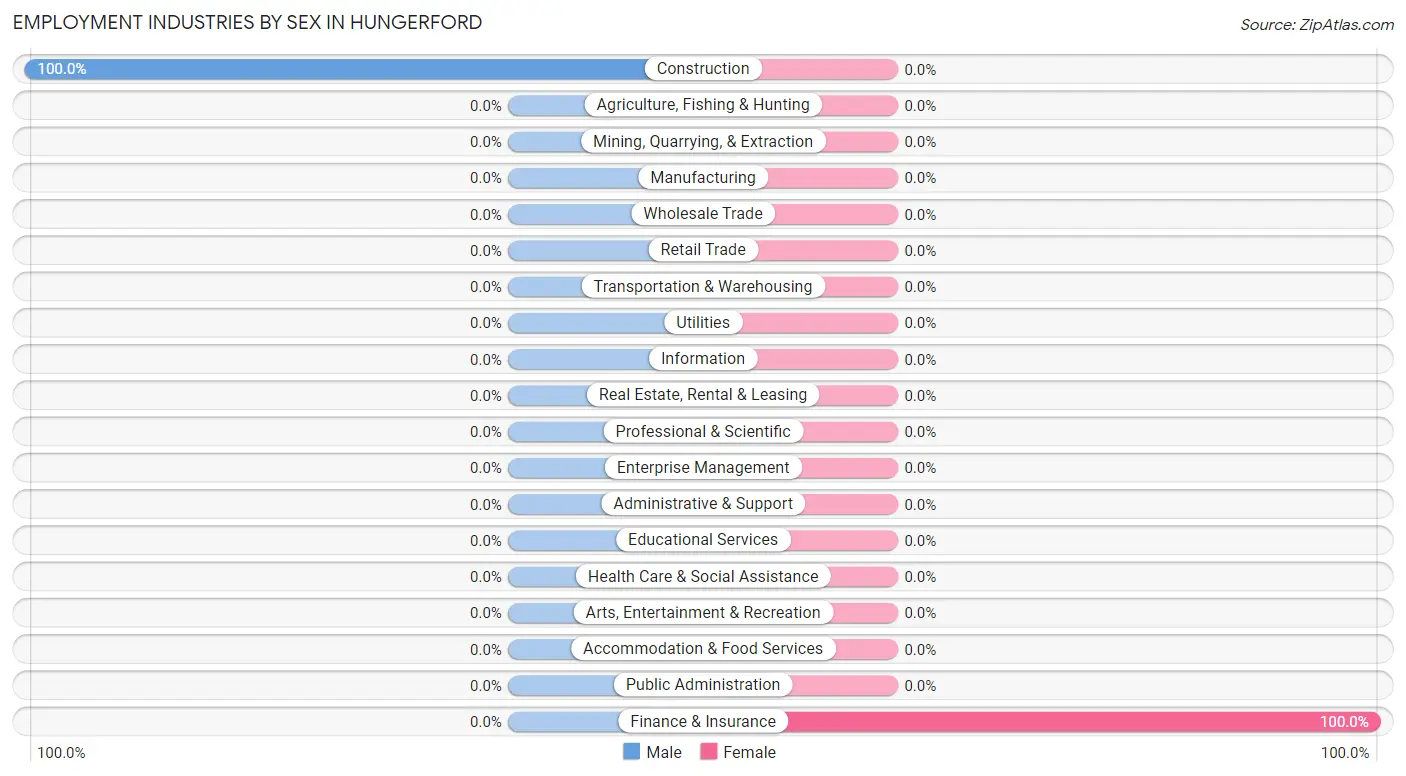
Employment Industries by Sex in Hungerford
Industry
Male
Female
Agriculture, Fishing & Hunting
0 (0.0%)
0 (0.0%)
Mining, Quarrying, & Extraction
0 (0.0%)
0 (0.0%)
Construction
24 (100.0%)
0 (0.0%)
Manufacturing
0 (0.0%)
0 (0.0%)
Wholesale Trade
0 (0.0%)
0 (0.0%)
Retail Trade
0 (0.0%)
0 (0.0%)
Transportation & Warehousing
0 (0.0%)
0 (0.0%)
Utilities
0 (0.0%)
0 (0.0%)
Information
0 (0.0%)
0 (0.0%)
Finance & Insurance
0 (0.0%)
27 (100.0%)
Real Estate, Rental & Leasing
0 (0.0%)
0 (0.0%)
Professional & Scientific
0 (0.0%)
0 (0.0%)
Enterprise Management
0 (0.0%)
0 (0.0%)
Administrative & Support
0 (0.0%)
0 (0.0%)
Educational Services
0 (0.0%)
0 (0.0%)
Health Care & Social Assistance
0 (0.0%)
0 (0.0%)
Arts, Entertainment & Recreation
0 (0.0%)
0 (0.0%)
Accommodation & Food Services
0 (0.0%)
0 (0.0%)
Public Administration
0 (0.0%)
0 (0.0%)
Total
31 (53.4%)
27 (46.6%)
Education in Hungerford
School Enrollment in Hungerford
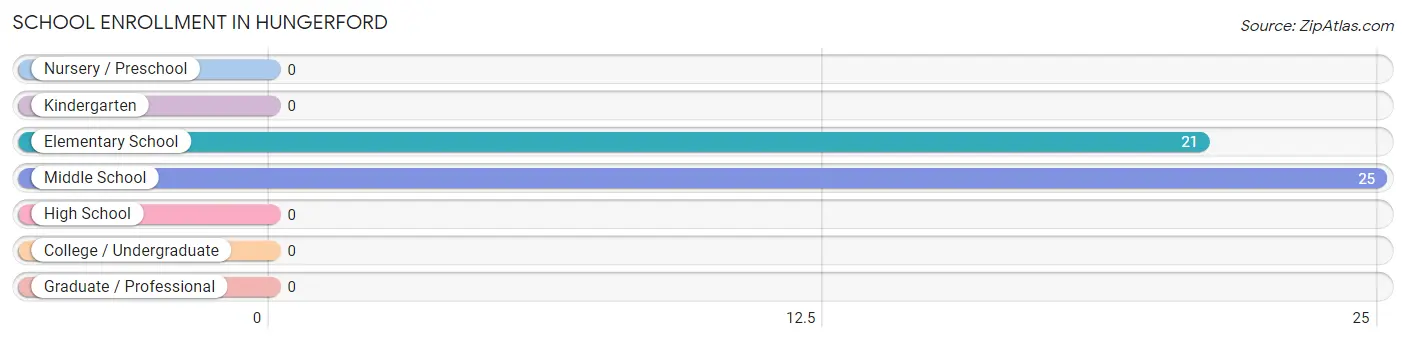
The most common levels of schooling among the 46 students in Hungerford are middle school (25 | 54.3%), and elementary school (21 | 45.7%).
School Level
# Students
% Students
Nursery / Preschool
0
0.0%
Kindergarten
0
0.0%
Elementary School
21
45.7%
Middle School
25
54.3%
High School
0
0.0%
College / Undergraduate
0
0.0%
Graduate / Professional
0
0.0%
Total
46
100.0%
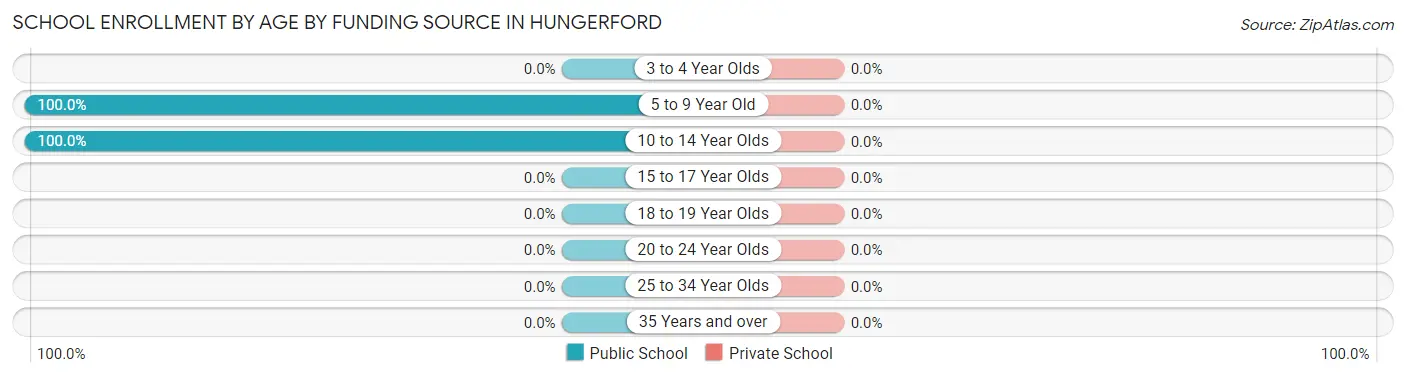
School Enrollment by Age by Funding Source in Hungerford
Age Bracket
Public School
Private School
3 to 4 Year Olds
0 (0.0%)
0 (0.0%)
5 to 9 Year Old
21 (100.0%)
0 (0.0%)
10 to 14 Year Olds
25 (100.0%)
0 (0.0%)
15 to 17 Year Olds
0 (0.0%)
0 (0.0%)
18 to 19 Year Olds
0 (0.0%)
0 (0.0%)
20 to 24 Year Olds
0 (0.0%)
0 (0.0%)
25 to 34 Year Olds
0 (0.0%)
0 (0.0%)
35 Years and over
0 (0.0%)
0 (0.0%)
Total
46 (100.0%)
0 (0.0%)
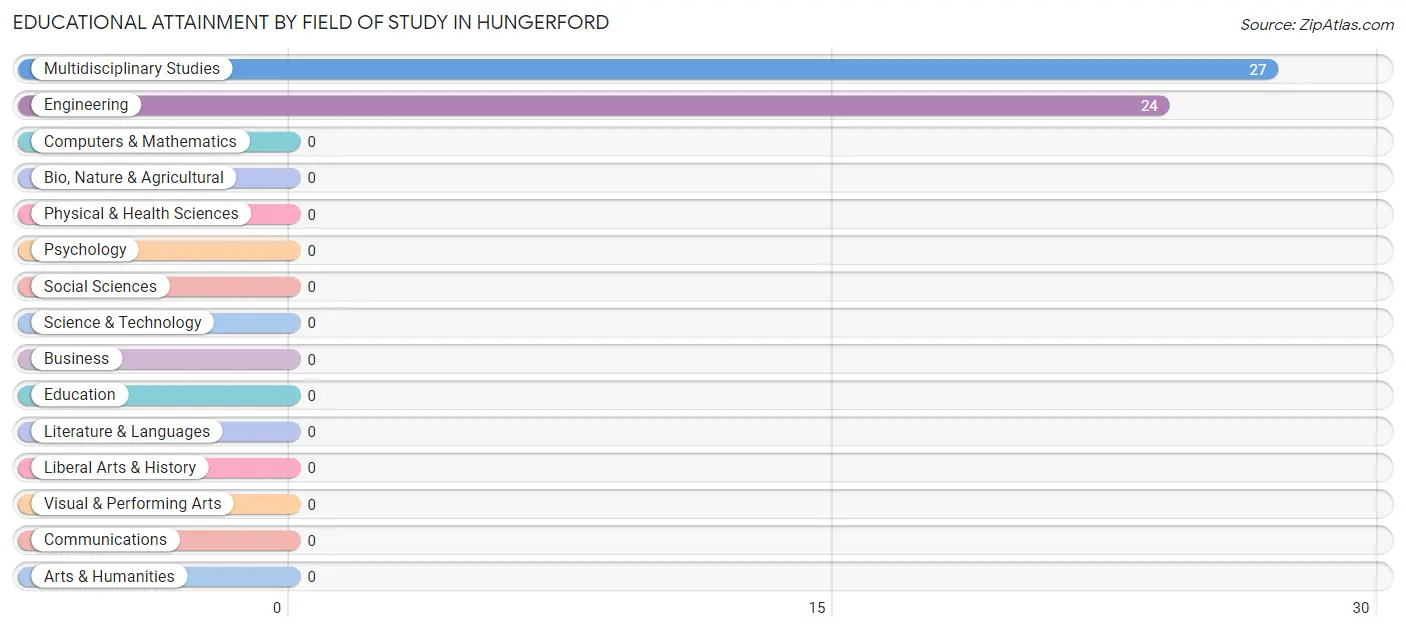
Educational Attainment by Field of Study in Hungerford
Multidisciplinary studies (27 | 52.9%), and engineering (24 | 47.1%) are the most common fields of study among 51 individuals in Hungerford who have obtained a bachelor's degree or higher.
Field of Study
# Graduates
% Graduates
Computers & Mathematics
0
0.0%
Bio, Nature & Agricultural
0
0.0%
Physical & Health Sciences
0
0.0%
Psychology
0
0.0%
Social Sciences
0
0.0%
Engineering
24
47.1%
Multidisciplinary Studies
27
52.9%
Science & Technology
0
0.0%
Business
0
0.0%
Education
0
0.0%
Literature & Languages
0
0.0%
Liberal Arts & History
0
0.0%
Visual & Performing Arts
0
0.0%
Communications
0
0.0%
Arts & Humanities
0
0.0%
Total
51
100.0%
Transportation & Commute in Hungerford
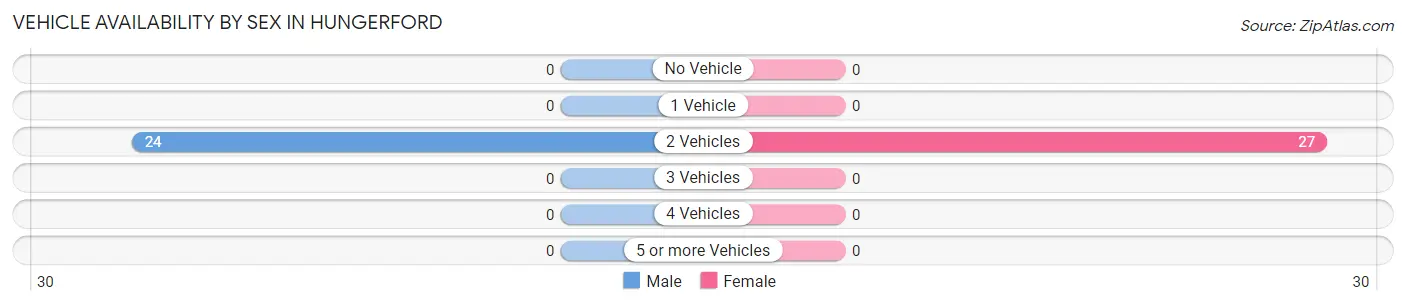
Vehicle Availability by Sex in Hungerford
The most prevalent vehicle ownership categories in Hungerford are males with 2 vehicles (24, accounting for 100.0%) and females with 2 vehicles (27, making up 88.9%).
Vehicles Available
Male
Female
No Vehicle
0 (0.0%)
0 (0.0%)
1 Vehicle
0 (0.0%)
0 (0.0%)
2 Vehicles
24 (100.0%)
27 (100.0%)
3 Vehicles
0 (0.0%)
0 (0.0%)
4 Vehicles
0 (0.0%)
0 (0.0%)
5 or more Vehicles
0 (0.0%)
0 (0.0%)
Total
24 (100.0%)
27 (100.0%)
Commute Time in Hungerford
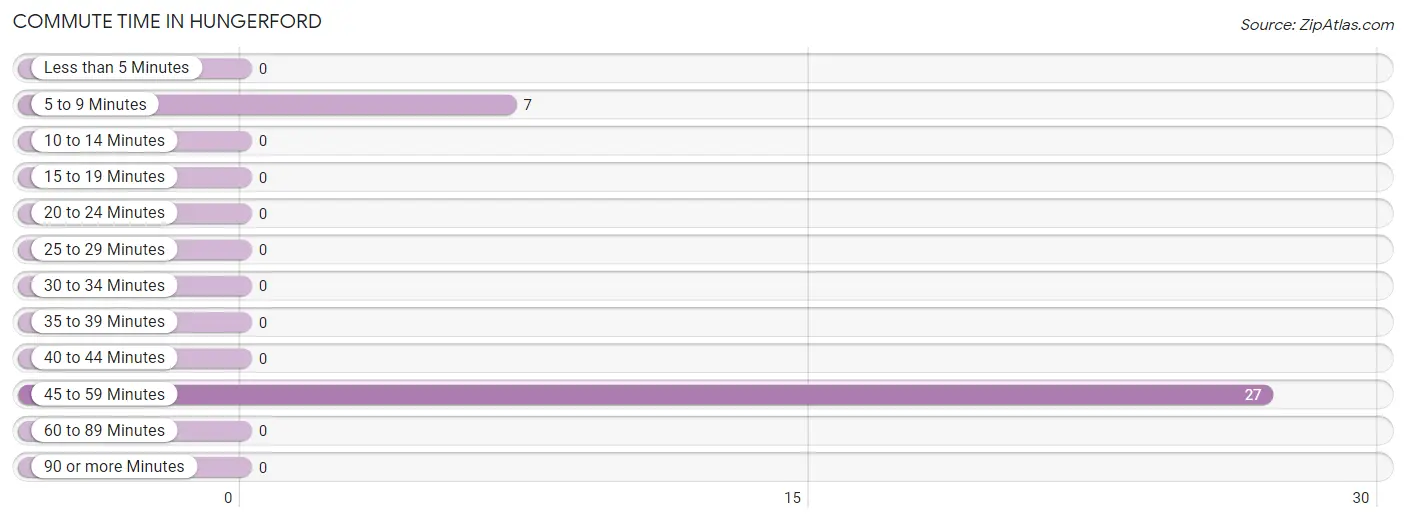
The most frequently occuring commute durations in Hungerford are 45 to 59 minutes (27 commuters, 79.4%), 5 to 9 minutes (7 commuters, 20.6%), and less than 5 minutes (0 commuters, 0.0%).
Commute Time
# Commuters
% Commuters
Less than 5 Minutes
0
0.0%
5 to 9 Minutes
7
20.6%
10 to 14 Minutes
0
0.0%
15 to 19 Minutes
0
0.0%
20 to 24 Minutes
0
0.0%
25 to 29 Minutes
0
0.0%
30 to 34 Minutes
0
0.0%
35 to 39 Minutes
0
0.0%
40 to 44 Minutes
0
0.0%
45 to 59 Minutes
27
79.4%
60 to 89 Minutes
0
0.0%
90 or more Minutes
0
0.0%
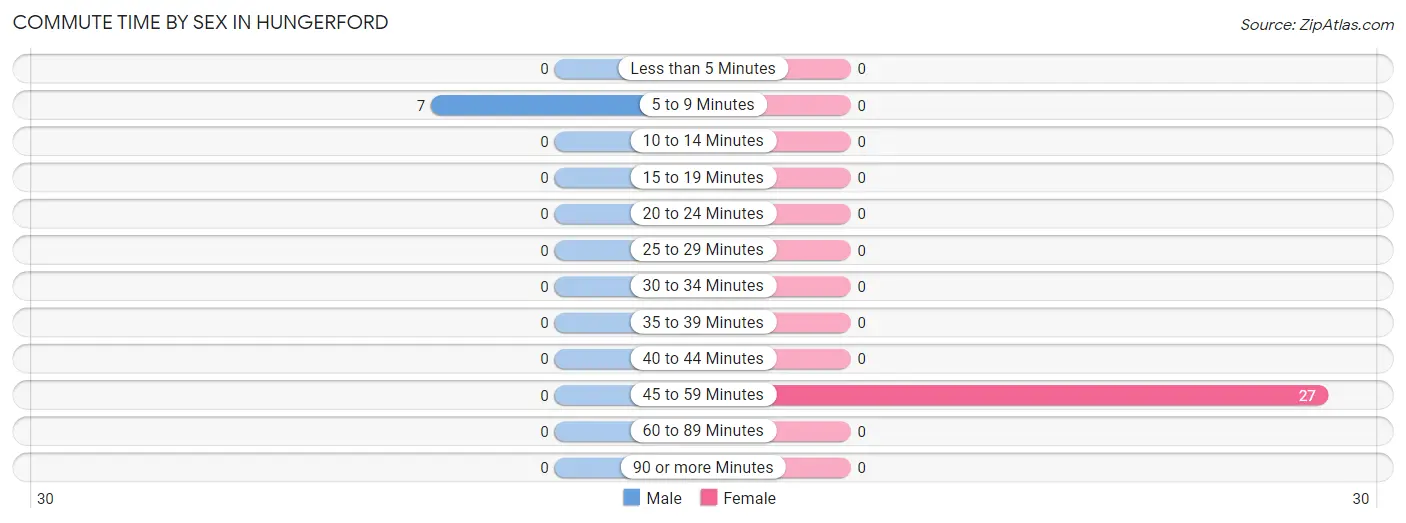
Commute Time by Sex in Hungerford
The most common commute times in Hungerford are 5 to 9 minutes (7 commuters, 100.0%) for males and 45 to 59 minutes (27 commuters, 100.0%) for females.
Commute Time
Male
Female
Less than 5 Minutes
0 (0.0%)
0 (0.0%)
5 to 9 Minutes
7 (100.0%)
0 (0.0%)
10 to 14 Minutes
0 (0.0%)
0 (0.0%)
15 to 19 Minutes
0 (0.0%)
0 (0.0%)
20 to 24 Minutes
0 (0.0%)
0 (0.0%)
25 to 29 Minutes
0 (0.0%)
0 (0.0%)
30 to 34 Minutes
0 (0.0%)
0 (0.0%)
35 to 39 Minutes
0 (0.0%)
0 (0.0%)
40 to 44 Minutes
0 (0.0%)
0 (0.0%)
45 to 59 Minutes
0 (0.0%)
27 (100.0%)
60 to 89 Minutes
0 (0.0%)
0 (0.0%)
90 or more Minutes
0 (0.0%)
0 (0.0%)
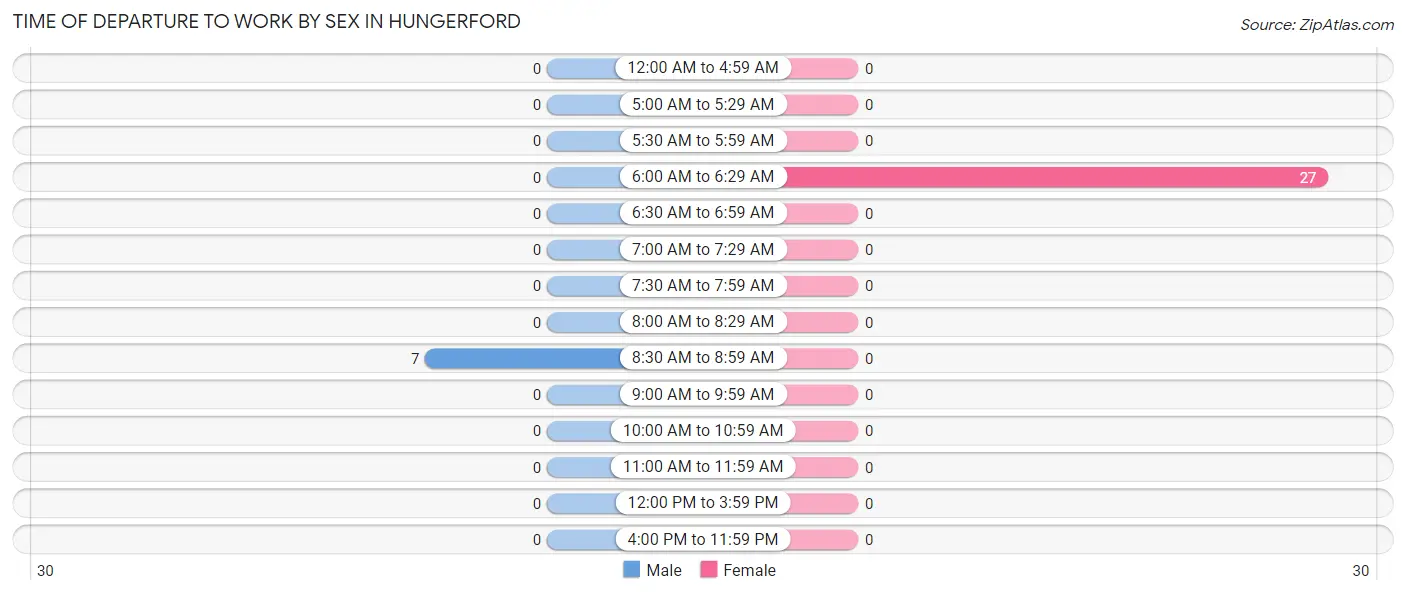
Time of Departure to Work by Sex in Hungerford
The most frequent times of departure to work in Hungerford are 8:30 AM to 8:59 AM (7, 100.0%) for males and 6:00 AM to 6:29 AM (27, 100.0%) for females.
Time of Departure
Male
Female
12:00 AM to 4:59 AM
0 (0.0%)
0 (0.0%)
5:00 AM to 5:29 AM
0 (0.0%)
0 (0.0%)
5:30 AM to 5:59 AM
0 (0.0%)
0 (0.0%)
6:00 AM to 6:29 AM
0 (0.0%)
27 (100.0%)
6:30 AM to 6:59 AM
0 (0.0%)
0 (0.0%)
7:00 AM to 7:29 AM
0 (0.0%)
0 (0.0%)
7:30 AM to 7:59 AM
0 (0.0%)
0 (0.0%)
8:00 AM to 8:29 AM
0 (0.0%)
0 (0.0%)
8:30 AM to 8:59 AM
7 (100.0%)
0 (0.0%)
9:00 AM to 9:59 AM
0 (0.0%)
0 (0.0%)
10:00 AM to 10:59 AM
0 (0.0%)
0 (0.0%)
11:00 AM to 11:59 AM
0 (0.0%)
0 (0.0%)
12:00 PM to 3:59 PM
0 (0.0%)
0 (0.0%)
4:00 PM to 11:59 PM
0 (0.0%)
0 (0.0%)
Total
7 (100.0%)
27 (100.0%)
Housing Occupancy in Hungerford
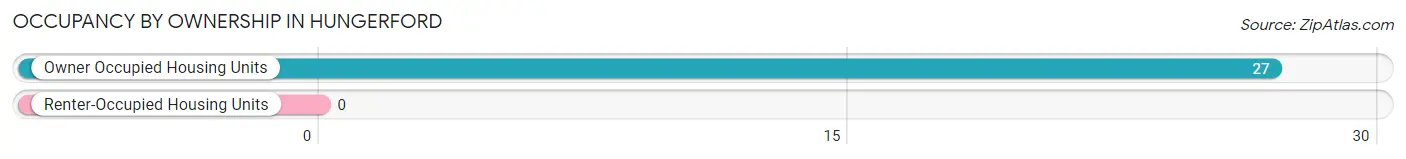
Occupancy by Ownership in Hungerford
Of the total 27 dwellings in Hungerford, owner-occupied units account for 27 (100.0%), while renter-occupied units make up 0 (0.0%).
Occupancy
# Housing Units
% Housing Units
Owner Occupied Housing Units
27
100.0%
Renter-Occupied Housing Units
0
0.0%
Total Occupied Housing Units
27
100.0%
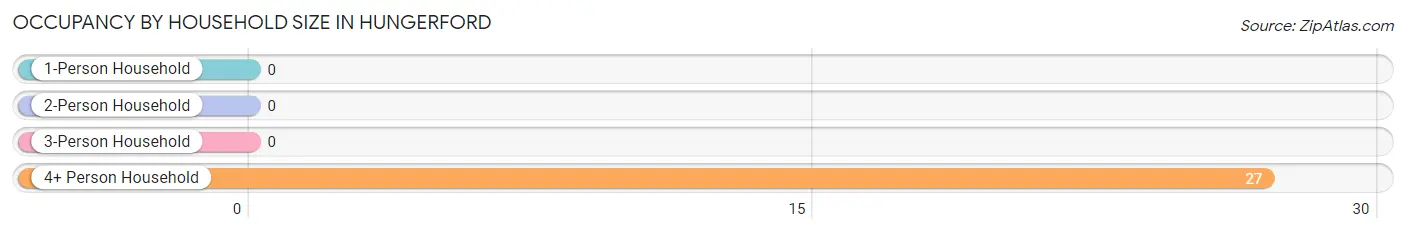
Occupancy by Household Size in Hungerford
Household Size
# Housing Units
% Housing Units
1-Person Household
0
0.0%
2-Person Household
0
0.0%
3-Person Household
0
0.0%
4+ Person Household
27
100.0%
Total Housing Units
27
100.0%
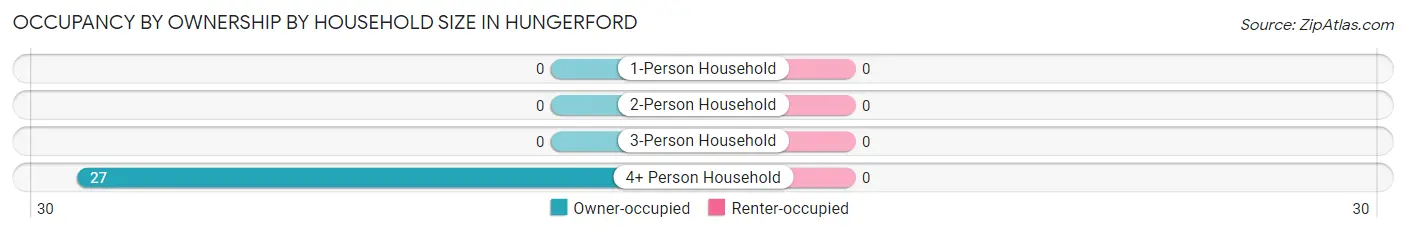
Occupancy by Ownership by Household Size in Hungerford
Household Size
Owner-occupied
Renter-occupied
1-Person Household
0 (0.0%)
0 (0.0%)
2-Person Household
0 (0.0%)
0 (0.0%)
3-Person Household
0 (0.0%)
0 (0.0%)
4+ Person Household
27 (100.0%)
0 (0.0%)
Total Housing Units
27 (100.0%)
0 (0.0%)
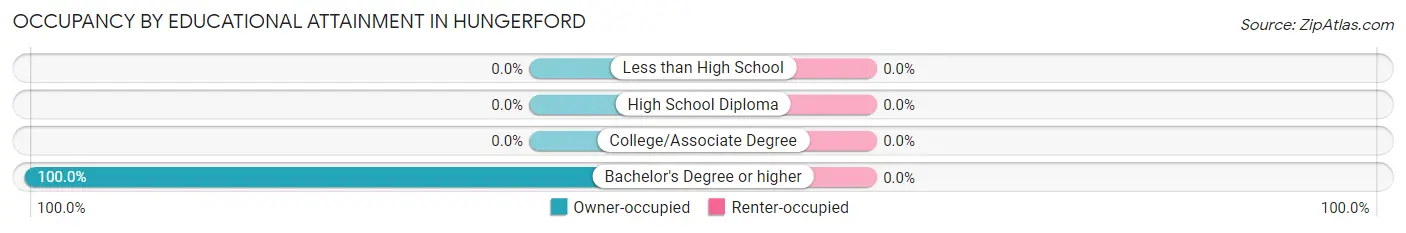
Occupancy by Educational Attainment in Hungerford
Household Size
Owner-occupied
Renter-occupied
Less than High School
0 (0.0%)
0 (0.0%)
High School Diploma
0 (0.0%)
0 (0.0%)
College/Associate Degree
0 (0.0%)
0 (0.0%)
Bachelor's Degree or higher
27 (100.0%)
0 (0.0%)
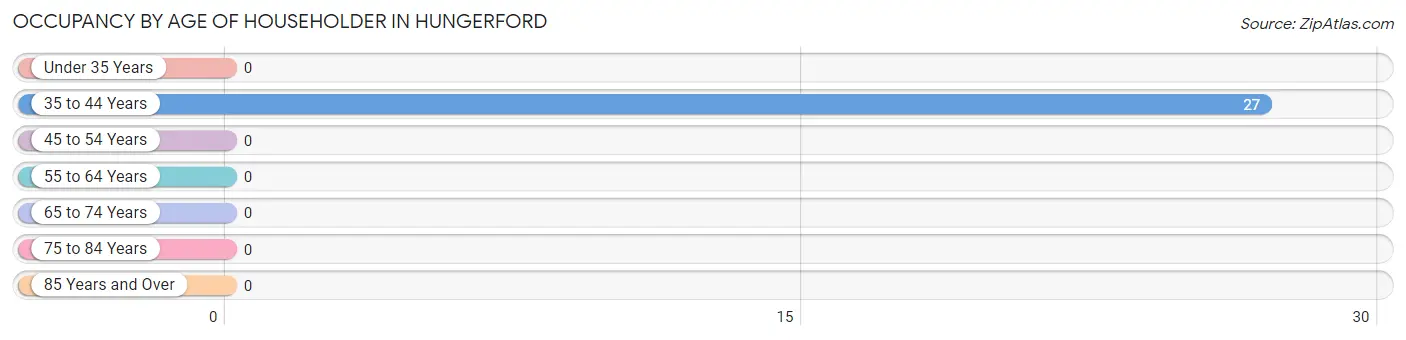
Occupancy by Age of Householder in Hungerford
Age Bracket
# Households
% Households
Under 35 Years
0
0.0%
35 to 44 Years
27
100.0%
45 to 54 Years
0
0.0%
55 to 64 Years
0
0.0%
65 to 74 Years
0
0.0%
75 to 84 Years
0
0.0%
85 Years and Over
0
0.0%
Total
27
100.0%
Housing Finances in Hungerford
Median Income by Occupancy in Hungerford
Occupancy Type
# Households
Median Income
Owner-Occupied
27 (100.0%)
$0
Renter-Occupied
0 (0.0%)
$0
Average
27 (100.0%)
$0
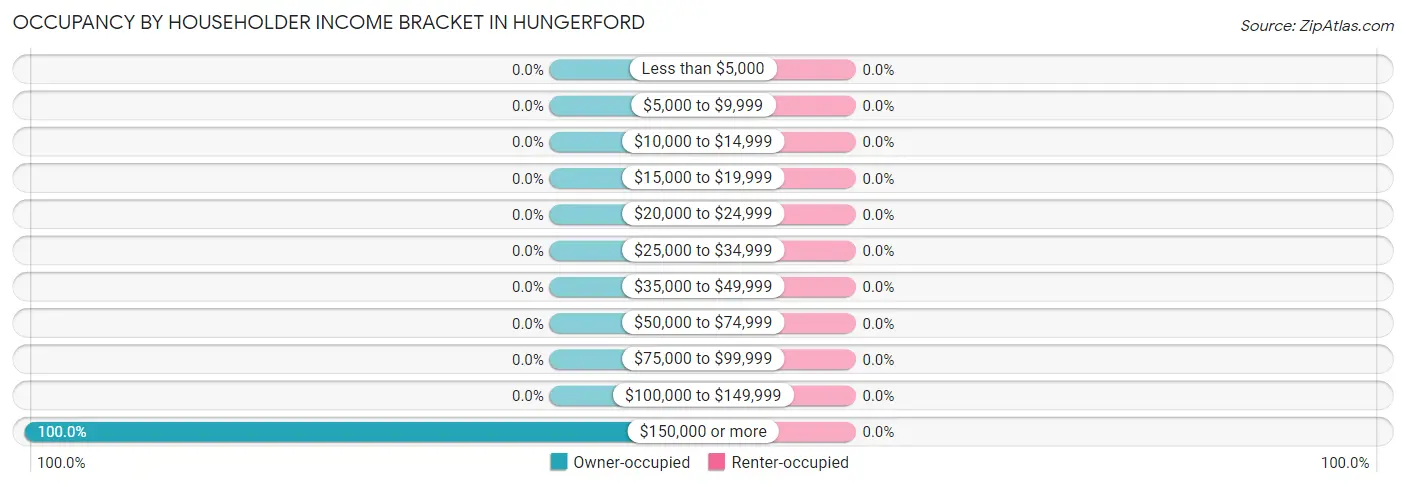
Occupancy by Householder Income Bracket in Hungerford
Income Bracket
Owner-occupied
Renter-occupied
Less than $5,000
0 (0.0%)
0 (0.0%)
$5,000 to $9,999
0 (0.0%)
0 (0.0%)
$10,000 to $14,999
0 (0.0%)
0 (0.0%)
$15,000 to $19,999
0 (0.0%)
0 (0.0%)
$20,000 to $24,999
0 (0.0%)
0 (0.0%)
$25,000 to $34,999
0 (0.0%)
0 (0.0%)
$35,000 to $49,999
0 (0.0%)
0 (0.0%)
$50,000 to $74,999
0 (0.0%)
0 (0.0%)
$75,000 to $99,999
0 (0.0%)
0 (0.0%)
$100,000 to $149,999
0 (0.0%)
0 (0.0%)
$150,000 or more
27 (100.0%)
0 (0.0%)
Total
27 (100.0%)
0 (0.0%)
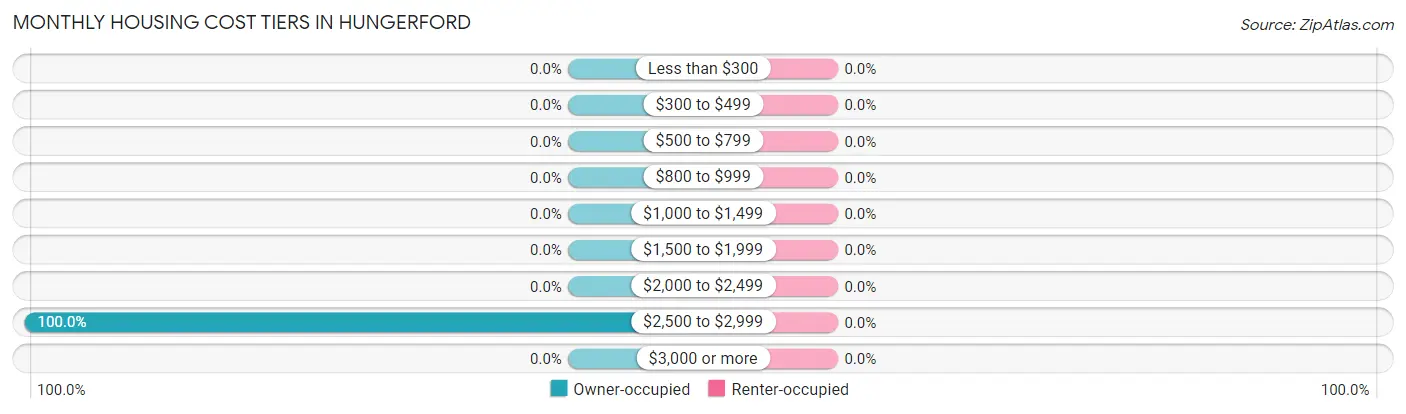
Monthly Housing Cost Tiers in Hungerford
Monthly Cost
Owner-occupied
Renter-occupied
Less than $300
0 (0.0%)
0 (0.0%)
$300 to $499
0 (0.0%)
0 (0.0%)
$500 to $799
0 (0.0%)
0 (0.0%)
$800 to $999
0 (0.0%)
0 (0.0%)
$1,000 to $1,499
0 (0.0%)
0 (0.0%)
$1,500 to $1,999
0 (0.0%)
0 (0.0%)
$2,000 to $2,499
0 (0.0%)
0 (0.0%)
$2,500 to $2,999
27 (100.0%)
0 (0.0%)
$3,000 or more
0 (0.0%)
0 (0.0%)
Total
27 (100.0%)
0 (0.0%)
Physical Housing Characteristics in Hungerford
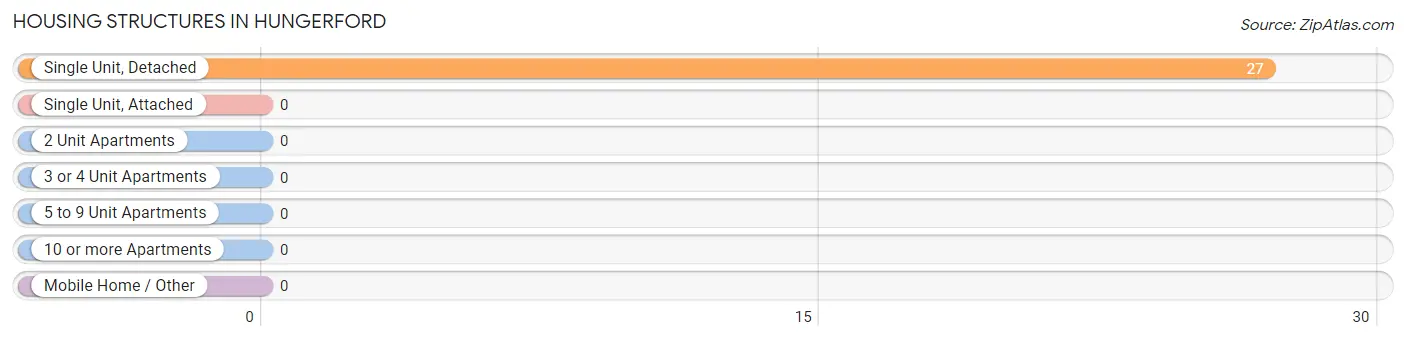
Housing Structures in Hungerford
Structure Type
# Housing Units
% Housing Units
Single Unit, Detached
27
100.0%
Single Unit, Attached
0
0.0%
2 Unit Apartments
0
0.0%
3 or 4 Unit Apartments
0
0.0%
5 to 9 Unit Apartments
0
0.0%
10 or more Apartments
0
0.0%
Mobile Home / Other
0
0.0%
Total
27
100.0%
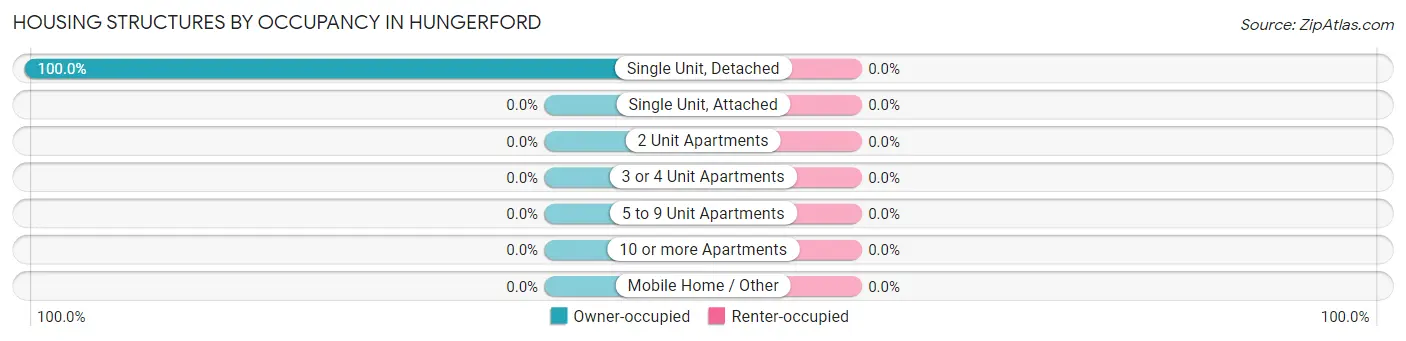
Housing Structures by Occupancy in Hungerford
Structure Type
Owner-occupied
Renter-occupied
Single Unit, Detached
27 (100.0%)
0 (0.0%)
Single Unit, Attached
0 (0.0%)
0 (0.0%)
2 Unit Apartments
0 (0.0%)
0 (0.0%)
3 or 4 Unit Apartments
0 (0.0%)
0 (0.0%)
5 to 9 Unit Apartments
0 (0.0%)
0 (0.0%)
10 or more Apartments
0 (0.0%)
0 (0.0%)
Mobile Home / Other
0 (0.0%)
0 (0.0%)
Total
27 (100.0%)
0 (0.0%)
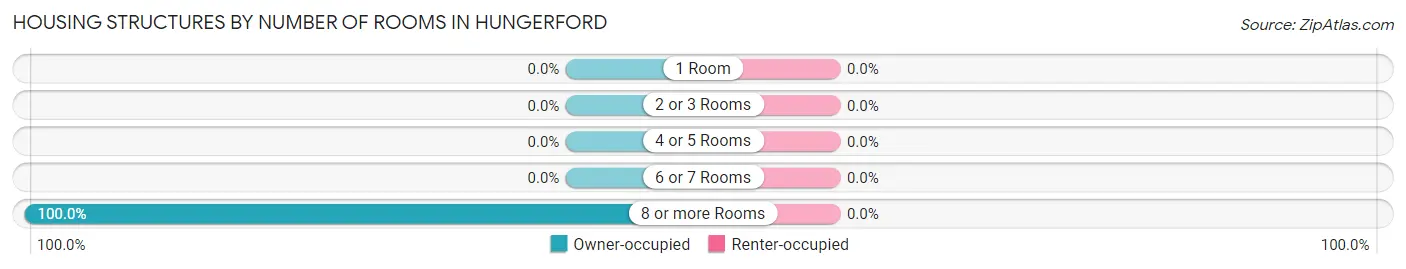
Housing Structures by Number of Rooms in Hungerford
Number of Rooms
Owner-occupied
Renter-occupied
1 Room
0 (0.0%)
0 (0.0%)
2 or 3 Rooms
0 (0.0%)
0 (0.0%)
4 or 5 Rooms
0 (0.0%)
0 (0.0%)
6 or 7 Rooms
0 (0.0%)
0 (0.0%)
8 or more Rooms
27 (100.0%)
0 (0.0%)
Total
27 (100.0%)
0 (0.0%)
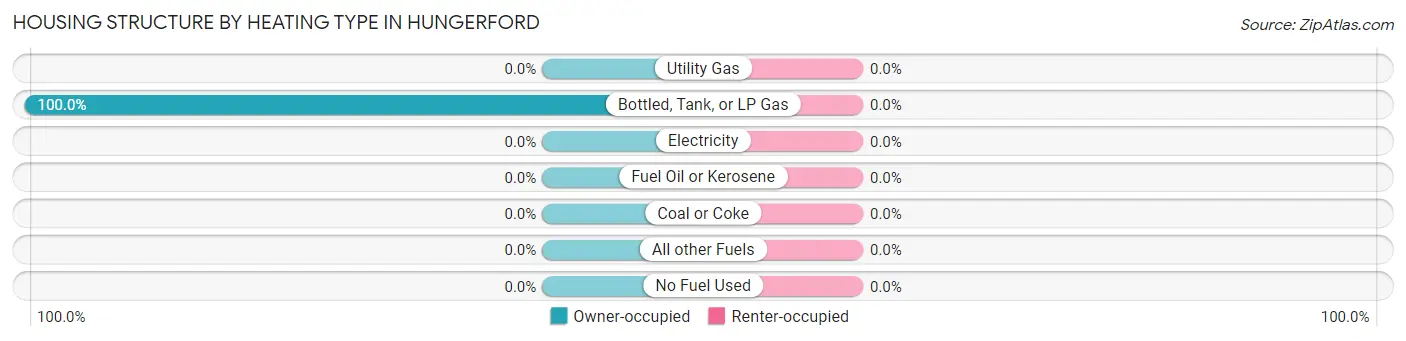
Housing Structure by Heating Type in Hungerford
Heating Type
Owner-occupied
Renter-occupied
Utility Gas
0 (0.0%)
0 (0.0%)
Bottled, Tank, or LP Gas
27 (100.0%)
0 (0.0%)
Electricity
0 (0.0%)
0 (0.0%)
Fuel Oil or Kerosene
0 (0.0%)
0 (0.0%)
Coal or Coke
0 (0.0%)
0 (0.0%)
All other Fuels
0 (0.0%)
0 (0.0%)
No Fuel Used
0 (0.0%)
0 (0.0%)
Total
27 (100.0%)
0 (0.0%)
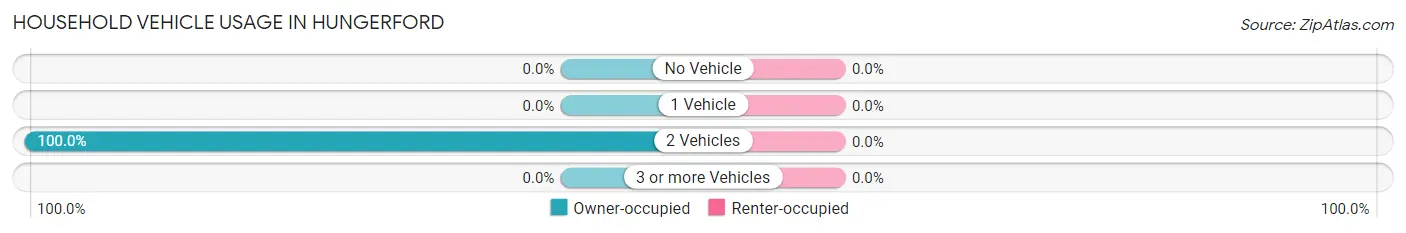
Household Vehicle Usage in Hungerford
Vehicles per Household
Owner-occupied
Renter-occupied
No Vehicle
0 (0.0%)
0 (0.0%)
1 Vehicle
0 (0.0%)
0 (0.0%)
2 Vehicles
27 (100.0%)
0 (0.0%)
3 or more Vehicles
0 (0.0%)
0 (0.0%)
Total
27 (100.0%)
0 (0.0%)
Real Estate & Mortgages in Hungerford
Real Estate and Mortgage Overview in Hungerford
Characteristic
Without Mortgage
With Mortgage
Housing Units
0
27
Median Property Value
-
-
Median Household Income
-
-
Monthly Housing Costs
-
-
Real Estate Taxes
-
-
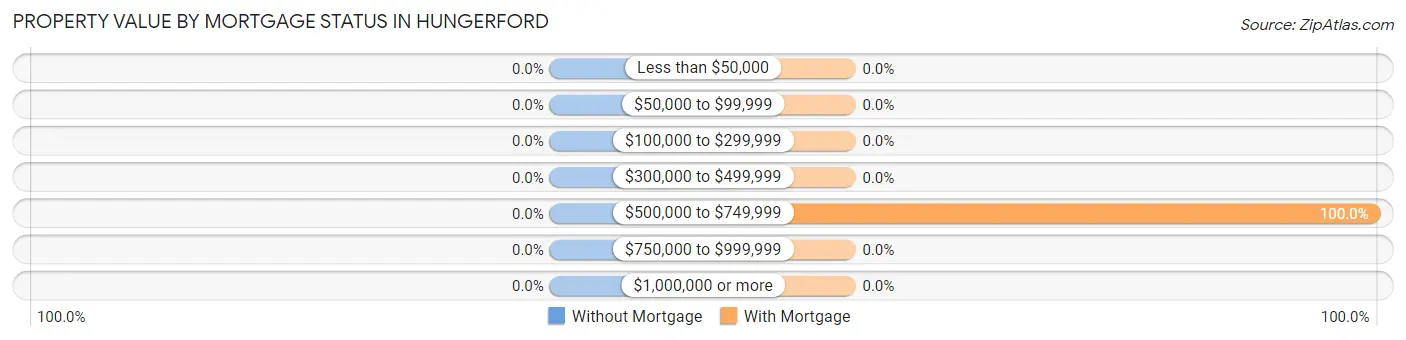
Property Value by Mortgage Status in Hungerford
Property Value
Without Mortgage
With Mortgage
Less than $50,000
0 (0.0%)
0 (0.0%)
$50,000 to $99,999
0 (0.0%)
0 (0.0%)
$100,000 to $299,999
0 (0.0%)
0 (0.0%)
$300,000 to $499,999
0 (0.0%)
0 (0.0%)
$500,000 to $749,999
0 (0.0%)
27 (100.0%)
$750,000 to $999,999
0 (0.0%)
0 (0.0%)
$1,000,000 or more
0 (0.0%)
0 (0.0%)
Total
0 (0.0%)
27 (100.0%)
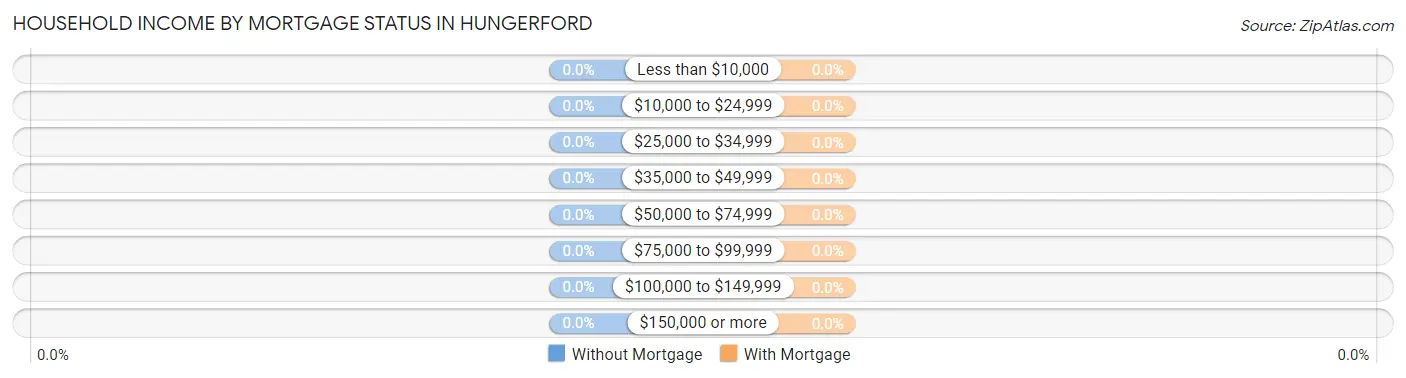
Household Income by Mortgage Status in Hungerford
Household Income
Without Mortgage
With Mortgage
Less than $10,000
0 (0.0%)
0 (0.0%)
$10,000 to $24,999
0 (0.0%)
0 (0.0%)
$25,000 to $34,999
0 (0.0%)
0 (0.0%)
$35,000 to $49,999
0 (0.0%)
0 (0.0%)
$50,000 to $74,999
0 (0.0%)
0 (0.0%)
$75,000 to $99,999
0 (0.0%)
0 (0.0%)
$100,000 to $149,999
0 (0.0%)
0 (0.0%)
$150,000 or more
0 (0.0%)
0 (0.0%)
Total
0 (0.0%)
27 (100.0%)
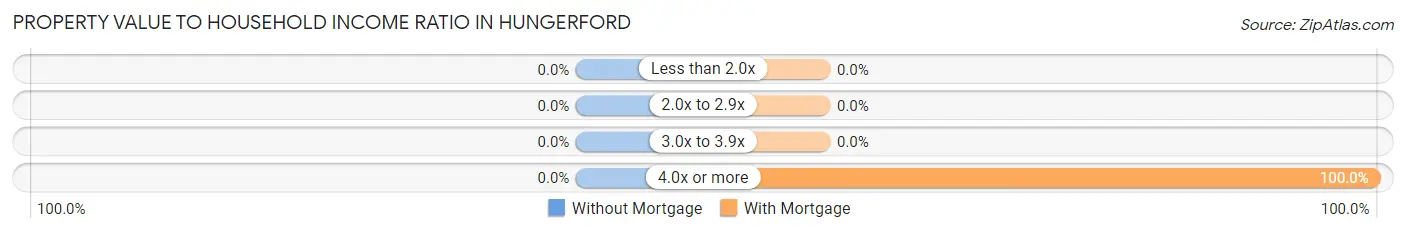
Property Value to Household Income Ratio in Hungerford
Value-to-Income Ratio
Without Mortgage
With Mortgage
Less than 2.0x
0 (0.0%)
0 (0.0%)
2.0x to 2.9x
0 (0.0%)
0 (0.0%)
3.0x to 3.9x
0 (0.0%)
0 (0.0%)
4.0x or more
0 (0.0%)
27 (100.0%)
Total
0 (0.0%)
27 (100.0%)
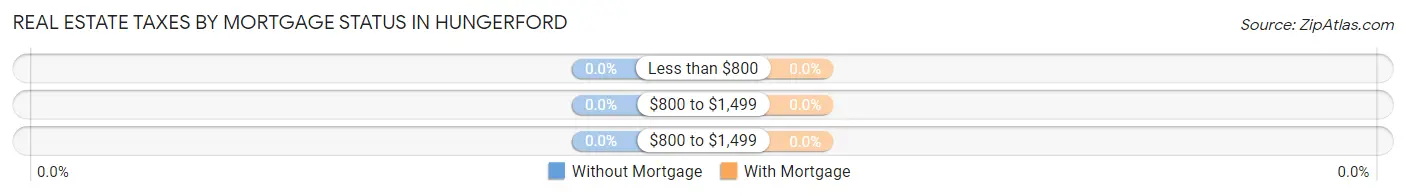
Real Estate Taxes by Mortgage Status in Hungerford
Property Taxes
Without Mortgage
With Mortgage
Less than $800
0 (0.0%)
0 (0.0%)
$800 to $1,499
0 (0.0%)
0 (0.0%)
$800 to $1,499
0 (0.0%)
0 (0.0%)
Total
0 (0.0%)
27 (100.0%)
Health & Disability in Hungerford
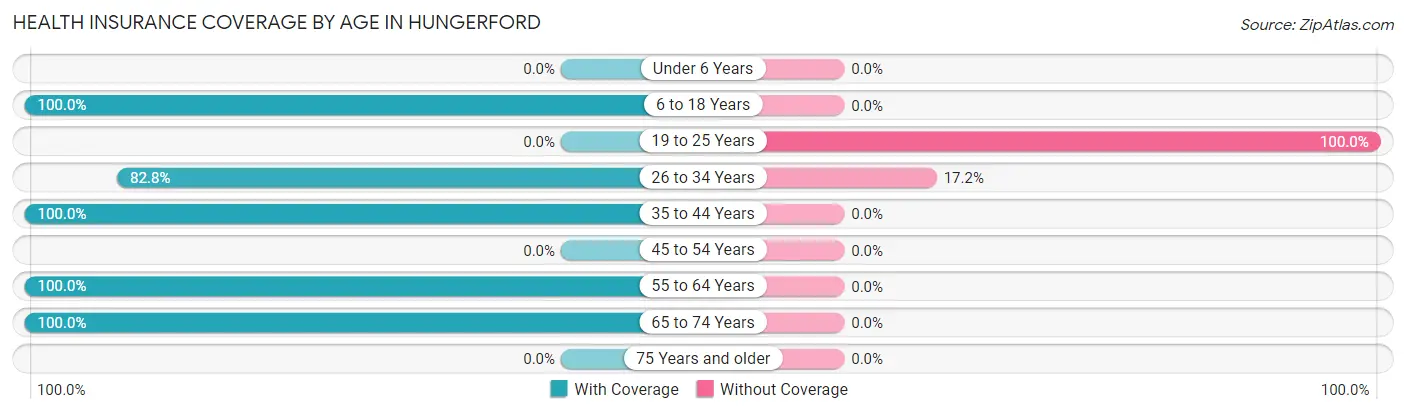
Health Insurance Coverage by Age in Hungerford
Age Bracket
With Coverage
Without Coverage
Under 6 Years
0 (0.0%)
0 (0.0%)
6 to 18 Years
46 (100.0%)
0 (0.0%)
19 to 25 Years
0 (0.0%)
7 (100.0%)
26 to 34 Years
24 (82.8%)
5 (17.2%)
35 to 44 Years
40 (100.0%)
0 (0.0%)
45 to 54 Years
0 (0.0%)
0 (0.0%)
55 to 64 Years
7 (100.0%)
0 (0.0%)
65 to 74 Years
5 (100.0%)
0 (0.0%)
75 Years and older
0 (0.0%)
0 (0.0%)
Total
122 (91.0%)
12 (9.0%)
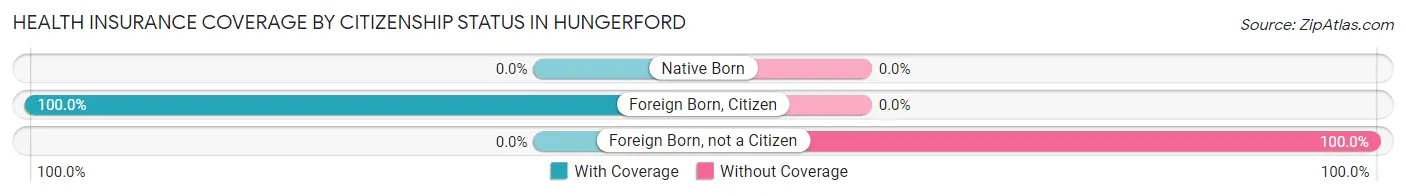
Health Insurance Coverage by Citizenship Status in Hungerford
Citizenship Status
With Coverage
Without Coverage
Native Born
0 (0.0%)
0 (0.0%)
Foreign Born, Citizen
46 (100.0%)
0 (0.0%)
Foreign Born, not a Citizen
0 (0.0%)
7 (100.0%)
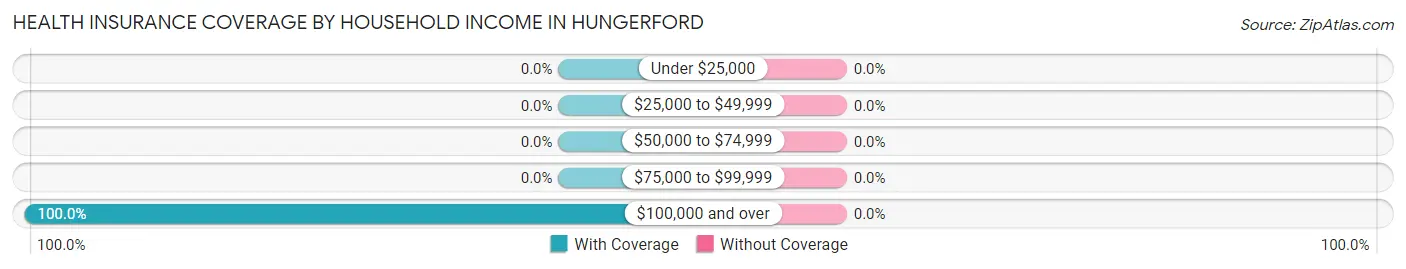
Health Insurance Coverage by Household Income in Hungerford
Household Income
With Coverage
Without Coverage
Under $25,000
0 (0.0%)
0 (0.0%)
$25,000 to $49,999
0 (0.0%)
0 (0.0%)
$50,000 to $74,999
0 (0.0%)
0 (0.0%)
$75,000 to $99,999
0 (0.0%)
0 (0.0%)
$100,000 and over
97 (100.0%)
0 (0.0%)
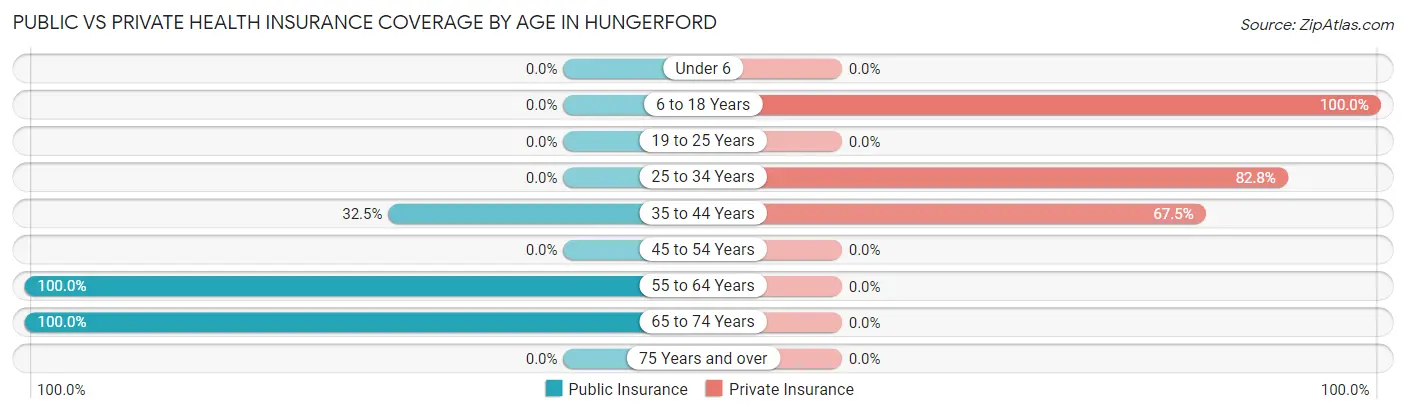
Public vs Private Health Insurance Coverage by Age in Hungerford
Age Bracket
Public Insurance
Private Insurance
Under 6
0 (0.0%)
0 (0.0%)
6 to 18 Years
0 (0.0%)
46 (100.0%)
19 to 25 Years
0 (0.0%)
0 (0.0%)
25 to 34 Years
0 (0.0%)
24 (82.8%)
35 to 44 Years
13 (32.5%)
27 (67.5%)
45 to 54 Years
0 (0.0%)
0 (0.0%)
55 to 64 Years
7 (100.0%)
0 (0.0%)
65 to 74 Years
5 (100.0%)
0 (0.0%)
75 Years and over
0 (0.0%)
0 (0.0%)
Total
25 (18.7%)
97 (72.4%)
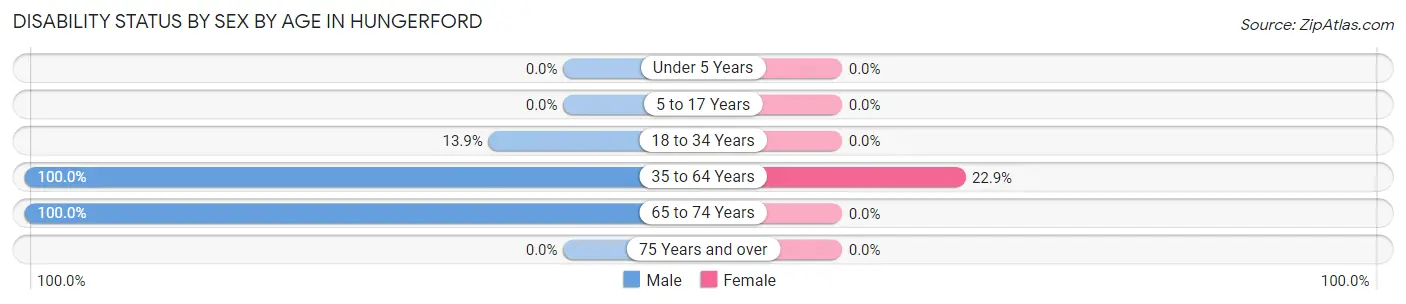
Disability Status by Sex by Age in Hungerford
Age Bracket
Male
Female
Under 5 Years
0 (0.0%)
0 (0.0%)
5 to 17 Years
0 (0.0%)
0 (0.0%)
18 to 34 Years
5 (13.9%)
0 (0.0%)
35 to 64 Years
12 (100.0%)
8 (22.9%)
65 to 74 Years
5 (100.0%)
0 (0.0%)
75 Years and over
0 (0.0%)
0 (0.0%)
Disability Class by Sex by Age in Hungerford
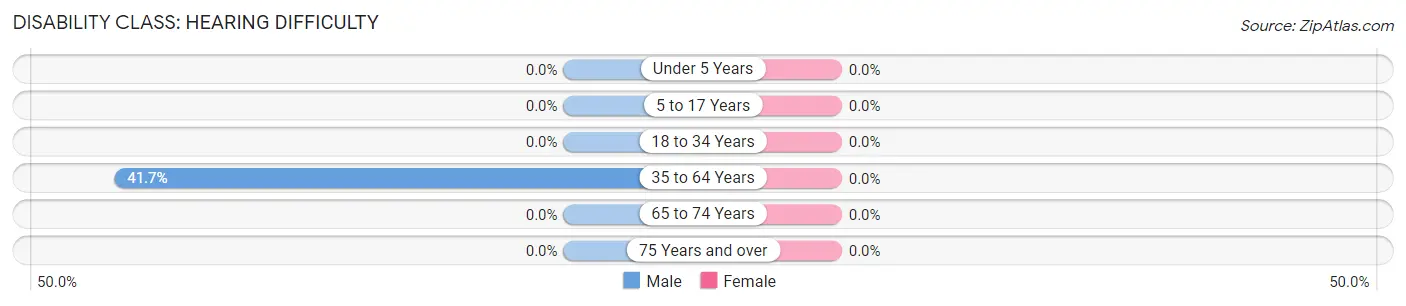
Disability Class: Hearing Difficulty
Age Bracket
Male
Female
Under 5 Years
0 (0.0%)
0 (0.0%)
5 to 17 Years
0 (0.0%)
0 (0.0%)
18 to 34 Years
0 (0.0%)
0 (0.0%)
35 to 64 Years
5 (41.7%)
0 (0.0%)
65 to 74 Years
0 (0.0%)
0 (0.0%)
75 Years and over
0 (0.0%)
0 (0.0%)
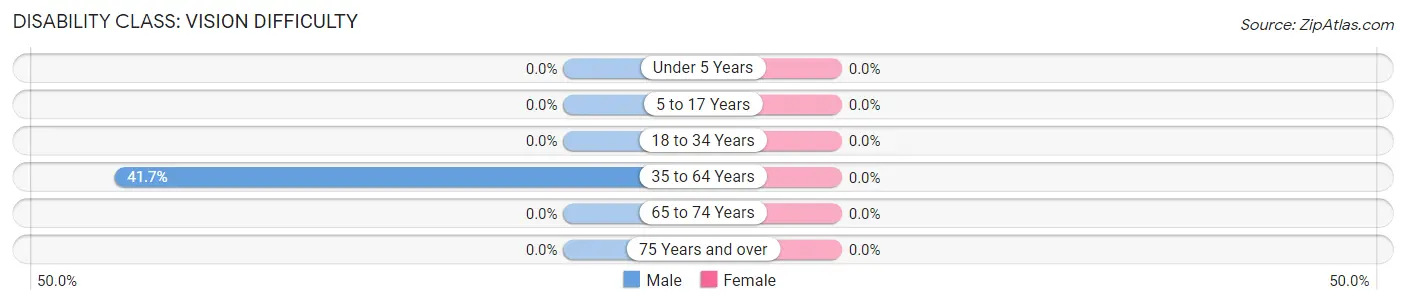
Disability Class: Vision Difficulty
Age Bracket
Male
Female
Under 5 Years
0 (0.0%)
0 (0.0%)
5 to 17 Years
0 (0.0%)
0 (0.0%)
18 to 34 Years
0 (0.0%)
0 (0.0%)
35 to 64 Years
5 (41.7%)
0 (0.0%)
65 to 74 Years
0 (0.0%)
0 (0.0%)
75 Years and over
0 (0.0%)
0 (0.0%)
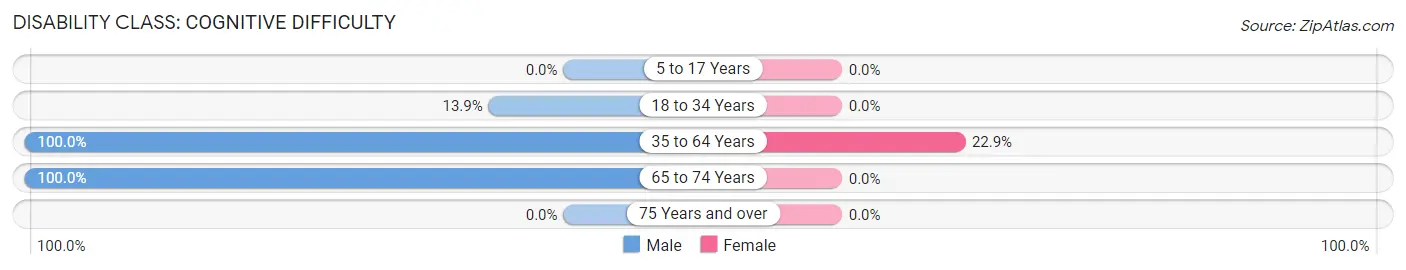
Disability Class: Cognitive Difficulty
Age Bracket
Male
Female
5 to 17 Years
0 (0.0%)
0 (0.0%)
18 to 34 Years
5 (13.9%)
0 (0.0%)
35 to 64 Years
12 (100.0%)
8 (22.9%)
65 to 74 Years
5 (100.0%)
0 (0.0%)
75 Years and over
0 (0.0%)
0 (0.0%)
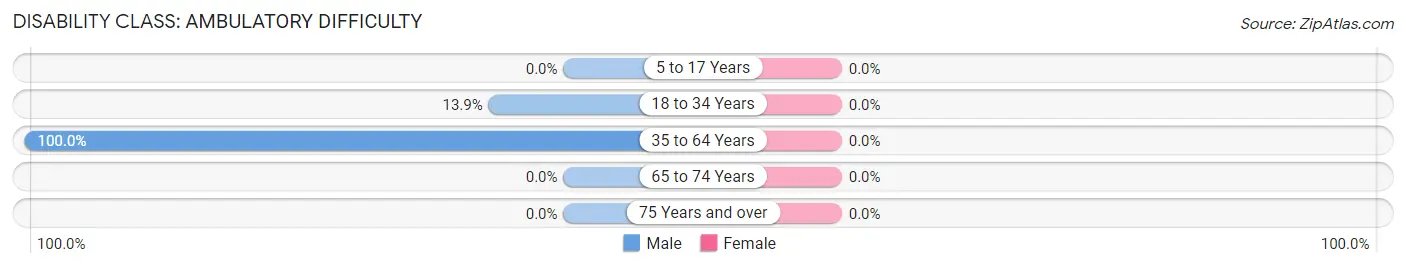
Disability Class: Ambulatory Difficulty
Age Bracket
Male
Female
5 to 17 Years
0 (0.0%)
0 (0.0%)
18 to 34 Years
5 (13.9%)
0 (0.0%)
35 to 64 Years
12 (100.0%)
0 (0.0%)
65 to 74 Years
0 (0.0%)
0 (0.0%)
75 Years and over
0 (0.0%)
0 (0.0%)
Disability Class: Self-Care Difficulty
Age Bracket
Male
Female
5 to 17 Years
0 (0.0%)
0 (0.0%)
18 to 34 Years
5 (13.9%)
0 (0.0%)
35 to 64 Years
5 (41.7%)
0 (0.0%)
65 to 74 Years
0 (0.0%)
0 (0.0%)
75 Years and over
0 (0.0%)
0 (0.0%)
Technology Access in Hungerford
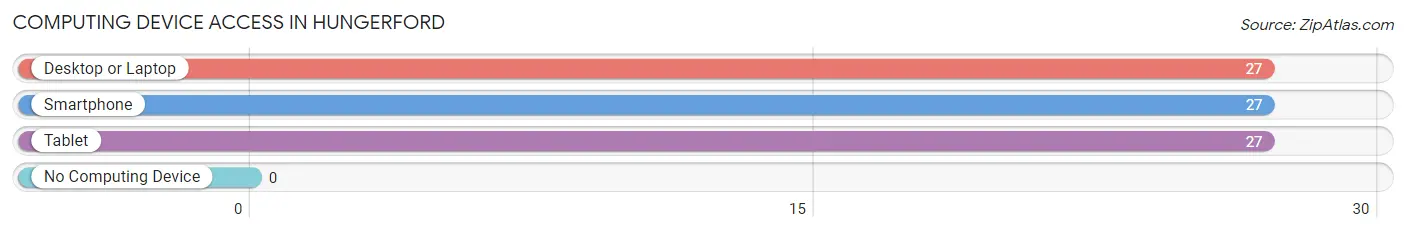
Computing Device Access in Hungerford
Device Type
# Households
% Households
Desktop or Laptop
27
100.0%
Smartphone
27
100.0%
Tablet
27
100.0%
No Computing Device
0
0.0%
Total
27
100.0%
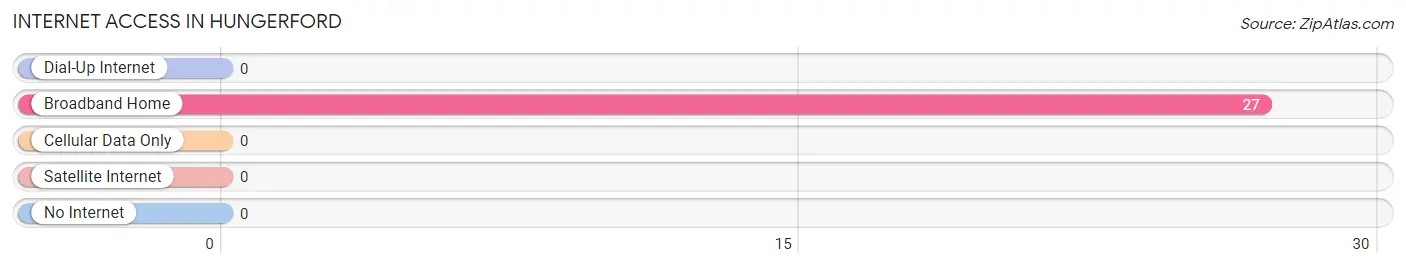
Internet Access in Hungerford
Internet Type
# Households
% Households
Dial-Up Internet
0
0.0%
Broadband Home
27
100.0%
Cellular Data Only
0
0.0%
Satellite Internet
0
0.0%
No Internet
0
0.0%
Total
27
100.0%
Hungerford Summary
Hungerford, Texas is a small town located in Wharton County, Texas. It is situated about 50 miles southwest of Houston and is part of the Houston–The Woodlands–Sugar Land metropolitan area. The population of Hungerford was estimated to be 545 in 2019.
History
Hungerford was founded in 1883 by the Hungerford family, who had moved to the area from Kentucky. The town was named after the family’s patriarch, William Hungerford. The town was originally a farming community, but it soon became a center for the oil and gas industry. In the early 1900s, the town was home to several oil refineries and a cotton gin.
Geography
Hungerford is located in the southeastern part of Wharton County, Texas. It is situated about 50 miles southwest of Houston and is part of the Houston–The Woodlands–Sugar Land metropolitan area. The town is situated on the banks of the Colorado River, which flows through the area. The terrain is mostly flat, with some rolling hills in the area. The climate is humid subtropical, with hot summers and mild winters.
Economy
Hungerford’s economy is largely based on the oil and gas industry. The town is home to several oil refineries and a cotton gin. The town also has a few small businesses, including a grocery store, a hardware store, and a few restaurants.
Demographics
As of 2019, the population of Hungerford was estimated to be 545. The racial makeup of the town was 79.2% White, 16.2% Hispanic or Latino, 1.8% African American, 0.7% Native American, 0.4% Asian, and 1.7% from other races. The median household income was $37,917, and the median home value was $90,000.
Conclusion
Hungerford, Texas is a small town located in Wharton County, Texas. It is situated about 50 miles southwest of Houston and is part of the Houston–The Woodlands–Sugar Land metropolitan area. The population of Hungerford was estimated to be 545 in 2019. The town’s economy is largely based on the oil and gas industry, and the racial makeup of the town is 79.2% White, 16.2% Hispanic or Latino, 1.8% African American, 0.7% Native American, 0.4% Asian, and 1.7% from other races. The median household income was $37,917, and the median home value was $90,000.
Common Questions
What is Per Capita Income in Hungerford?
Per Capita income in Hungerford is $36,363.
What is the Total Population of Hungerford?
Total Population of Hungerford is 134.
What is the Total Male Population of Hungerford?
Total Male Population of Hungerford is 74.
What is the Total Female Population of Hungerford?
Total Female Population of Hungerford is 60.
What is the Ratio of Males per 100 Females in Hungerford?
There are 123.33 Males per 100 Females in Hungerford.
What is the Ratio of Females per 100 Males in Hungerford?
There are 81.08 Females per 100 Males in Hungerford.
What is the Median Population Age in Hungerford?
Median Population Age in Hungerford is 34.5 Years.
What is the Average Family Size in Hungerford
Average Family Size in Hungerford is 3.6 People.
What is the Average Household Size in Hungerford
Average Household Size in Hungerford is 3.6 People.
How Large is the Labor Force in Hungerford?
There are 58 People in the Labor Forcein in Hungerford.
What is the Percentage of People in the Labor Force in Hungerford?
65.9% of People are in the Labor Force in Hungerford.
Report Title
Report Link
HTML Copy & Paste Link
Social Media
Copy and paste the folowing code into any webpage where you would like this interactive chart to display