Oakhurst, NJ Map & Demographics
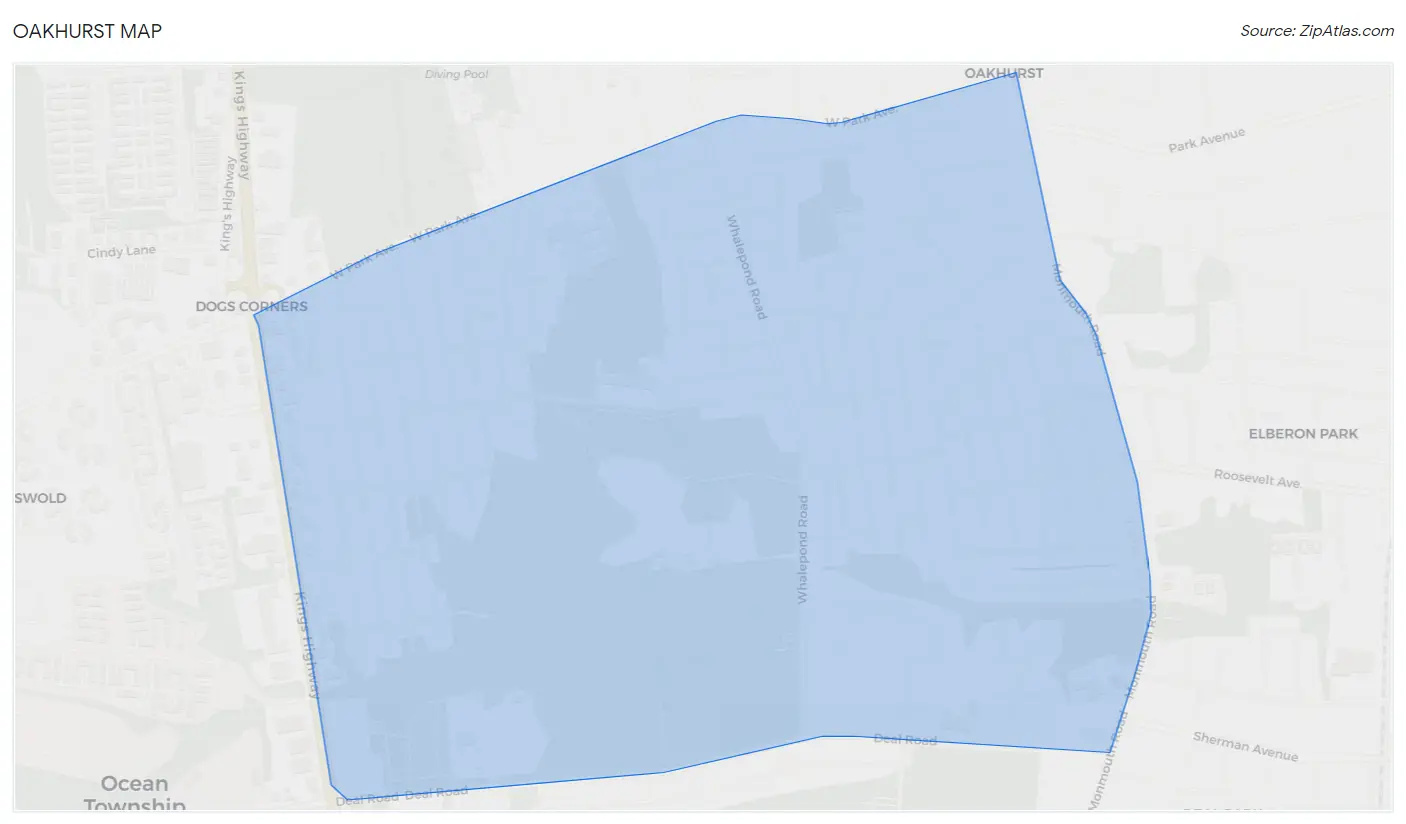
Oakhurst Map
Oakhurst Overview
$47,709
PER CAPITA INCOME
$133,594
AVG FAMILY INCOME
$130,313
AVG HOUSEHOLD INCOME
31.7%
WAGE / INCOME GAP [ % ]
68.3¢/ $1
WAGE / INCOME GAP [ $ ]
0.36
INEQUALITY / GINI INDEX
3,912
TOTAL POPULATION
1,876
MALE POPULATION
2,036
FEMALE POPULATION
92.14
MALES / 100 FEMALES
108.53
FEMALES / 100 MALES
37.0
MEDIAN AGE
3.3
AVG FAMILY SIZE
3.2
AVG HOUSEHOLD SIZE
1,862
LABOR FORCE [ PEOPLE ]
63.6%
PERCENT IN LABOR FORCE
6.8%
UNEMPLOYMENT RATE
Oakhurst Zip Codes
Income in Oakhurst
Income Overview in Oakhurst
Per Capita Income in Oakhurst is $47,709, while median incomes of families and households are $133,594 and $130,313 respectively.
| Characteristic | Number | Measure |
| Per Capita Income | 3,912 | $47,709 |
| Median Family Income | 1,053 | $133,594 |
| Mean Family Income | 1,053 | $157,016 |
| Median Household Income | 1,224 | $130,313 |
| Mean Household Income | 1,224 | $151,362 |
| Income Deficit | 1,053 | $0 |
| Wage / Income Gap (%) | 3,912 | 31.65% |
| Wage / Income Gap ($) | 3,912 | 68.35¢ per $1 |
| Gini / Inequality Index | 3,912 | 0.36 |
Earnings by Sex in Oakhurst
Average Earnings in Oakhurst are $63,625, $78,750 for men and $53,822 for women, a difference of 31.7%.
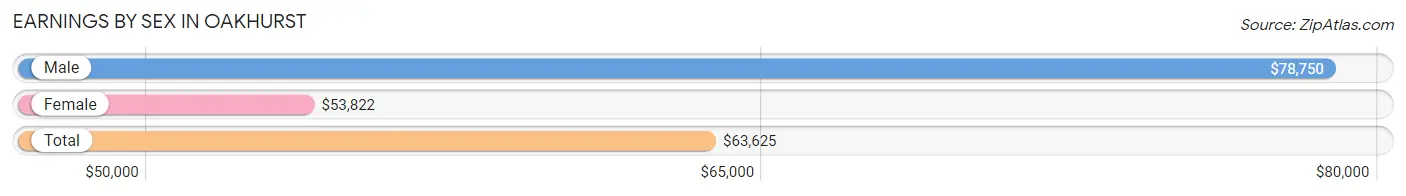
| Sex | Number | Average Earnings |
| Male | 1,000 (54.6%) | $78,750 |
| Female | 833 (45.4%) | $53,822 |
| Total | 1,833 (100.0%) | $63,625 |
Earnings by Sex by Income Bracket in Oakhurst
The most common earnings brackets in Oakhurst are $100,000+ for men (272 | 27.2%) and $75,000 to $99,999 for women (167 | 20.1%).
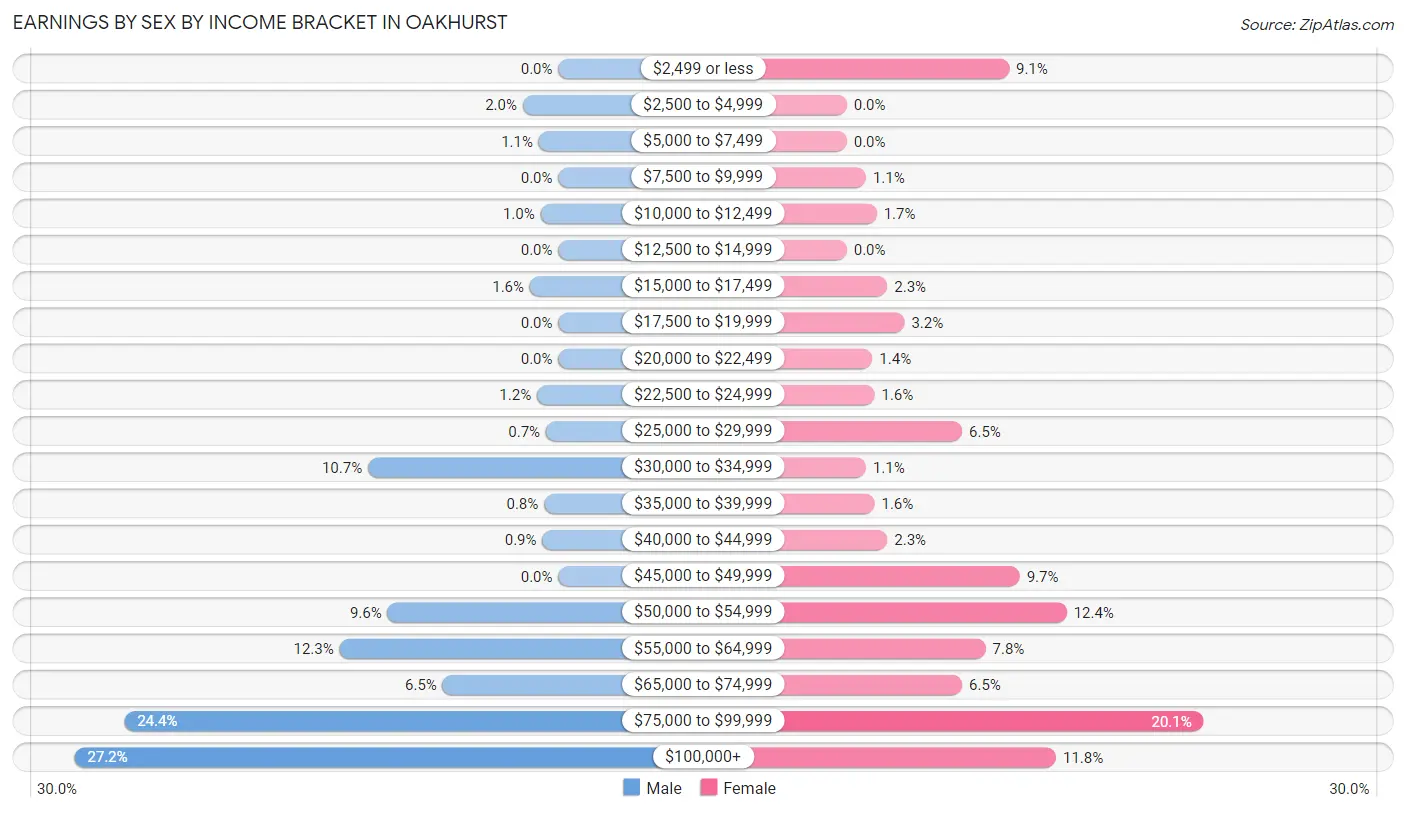
| Income | Male | Female |
| $2,499 or less | 0 (0.0%) | 76 (9.1%) |
| $2,500 to $4,999 | 20 (2.0%) | 0 (0.0%) |
| $5,000 to $7,499 | 11 (1.1%) | 0 (0.0%) |
| $7,500 to $9,999 | 0 (0.0%) | 9 (1.1%) |
| $10,000 to $12,499 | 10 (1.0%) | 14 (1.7%) |
| $12,500 to $14,999 | 0 (0.0%) | 0 (0.0%) |
| $15,000 to $17,499 | 16 (1.6%) | 19 (2.3%) |
| $17,500 to $19,999 | 0 (0.0%) | 27 (3.2%) |
| $20,000 to $22,499 | 0 (0.0%) | 12 (1.4%) |
| $22,500 to $24,999 | 12 (1.2%) | 13 (1.6%) |
| $25,000 to $29,999 | 7 (0.7%) | 54 (6.5%) |
| $30,000 to $34,999 | 107 (10.7%) | 9 (1.1%) |
| $35,000 to $39,999 | 8 (0.8%) | 13 (1.6%) |
| $40,000 to $44,999 | 9 (0.9%) | 19 (2.3%) |
| $45,000 to $49,999 | 0 (0.0%) | 81 (9.7%) |
| $50,000 to $54,999 | 96 (9.6%) | 103 (12.4%) |
| $55,000 to $64,999 | 123 (12.3%) | 65 (7.8%) |
| $65,000 to $74,999 | 65 (6.5%) | 54 (6.5%) |
| $75,000 to $99,999 | 244 (24.4%) | 167 (20.1%) |
| $100,000+ | 272 (27.2%) | 98 (11.8%) |
| Total | 1,000 (100.0%) | 833 (100.0%) |
Earnings by Sex by Educational Attainment in Oakhurst
Average earnings in Oakhurst are $84,205 for men and $59,777 for women, a difference of 29.0%. Men with an educational attainment of graduate degree enjoy the highest average annual earnings of $101,563, while those with college or associate's degree education earn the least with $59,628. Women with an educational attainment of graduate degree earn the most with the average annual earnings of $82,500, while those with high school diploma education have the smallest earnings of $53,311.
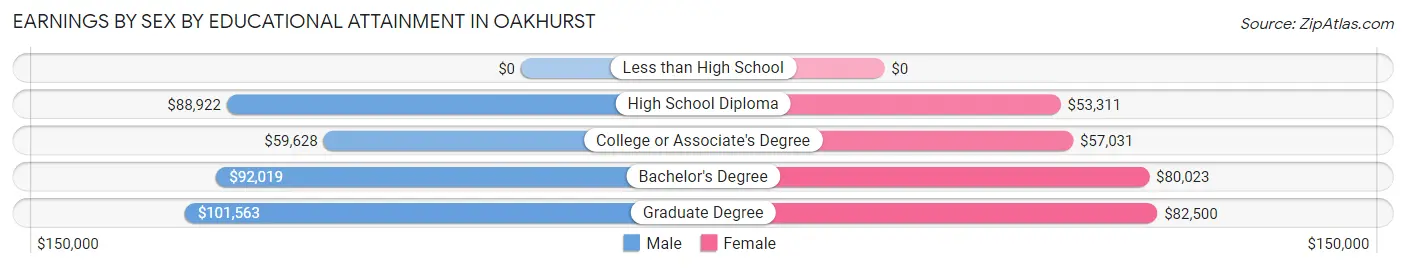
| Educational Attainment | Male Income | Female Income |
| Less than High School | - | - |
| High School Diploma | $88,922 | $53,311 |
| College or Associate's Degree | $59,628 | $57,031 |
| Bachelor's Degree | $92,019 | $80,023 |
| Graduate Degree | $101,563 | $82,500 |
| Total | $84,205 | $59,777 |
Family Income in Oakhurst
Family Income Brackets in Oakhurst
According to the Oakhurst family income data, there are 307 families falling into the $100,000 to $149,999 income range, which is the most common income bracket and makes up 29.1% of all families.
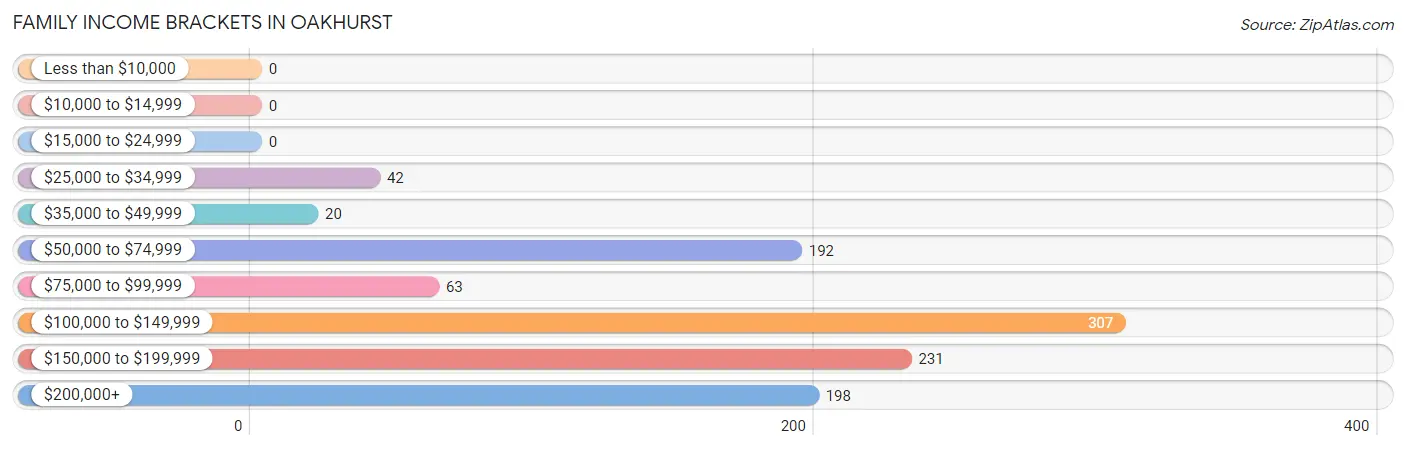
| Income Bracket | # Families | % Families |
| Less than $10,000 | 0 | 0.0% |
| $10,000 to $14,999 | 0 | 0.0% |
| $15,000 to $24,999 | 0 | 0.0% |
| $25,000 to $34,999 | 42 | 4.0% |
| $35,000 to $49,999 | 20 | 1.9% |
| $50,000 to $74,999 | 192 | 18.2% |
| $75,000 to $99,999 | 63 | 6.0% |
| $100,000 to $149,999 | 307 | 29.2% |
| $150,000 to $199,999 | 231 | 21.9% |
| $200,000+ | 198 | 18.8% |
Family Income by Famaliy Size in Oakhurst
3-person families (169 | 16.1%) account for the highest median family income in Oakhurst with $250,001 per family, while 3-person families (169 | 16.1%) have the highest median income of $83,334 per family member.
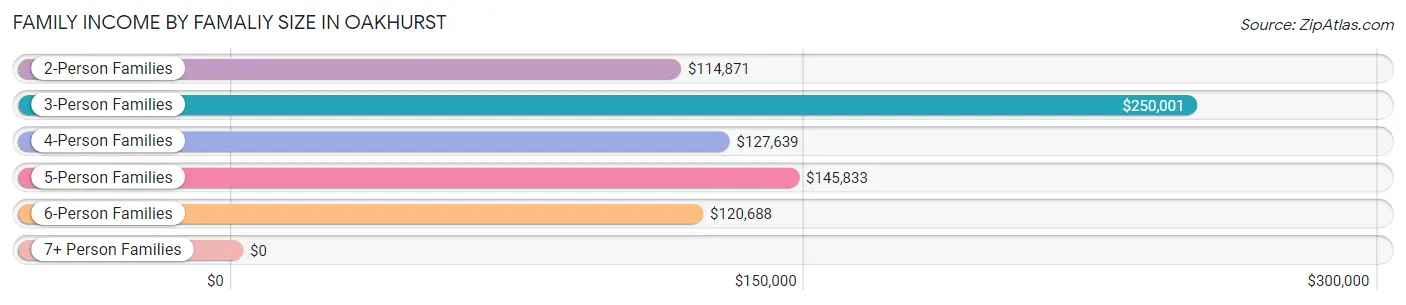
| Income Bracket | # Families | Median Income |
| 2-Person Families | 399 (37.9%) | $114,871 |
| 3-Person Families | 169 (16.1%) | $250,001 |
| 4-Person Families | 363 (34.5%) | $127,639 |
| 5-Person Families | 46 (4.4%) | $145,833 |
| 6-Person Families | 61 (5.8%) | $120,688 |
| 7+ Person Families | 15 (1.4%) | $0 |
| Total | 1,053 (100.0%) | $133,594 |
Family Income by Number of Earners in Oakhurst
The median family income in Oakhurst is $133,594, with families comprising 3+ earners (109) having the highest median family income of $236,719, while families with no earners (133) have the lowest median family income of $87,125, accounting for 10.3% and 12.6% of families, respectively.
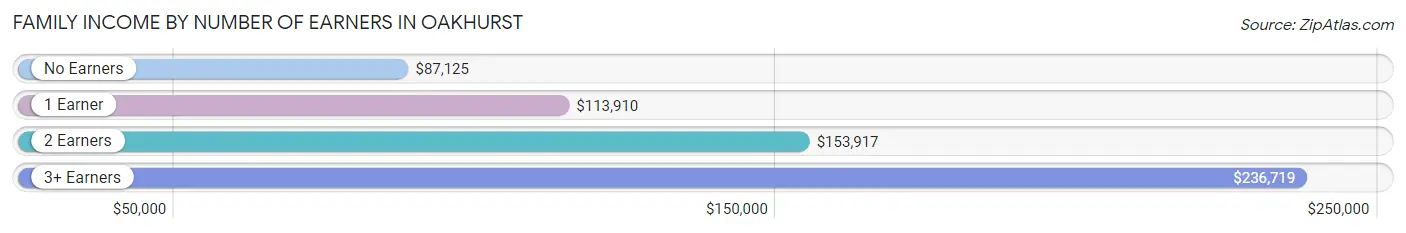
| Number of Earners | # Families | Median Income |
| No Earners | 133 (12.6%) | $87,125 |
| 1 Earner | 384 (36.5%) | $113,910 |
| 2 Earners | 427 (40.6%) | $153,917 |
| 3+ Earners | 109 (10.3%) | $236,719 |
| Total | 1,053 (100.0%) | $133,594 |
Household Income in Oakhurst
Household Income Brackets in Oakhurst
With 341 households falling in the category, the $100,000 to $149,999 income range is the most frequent in Oakhurst, accounting for 27.9% of all households.
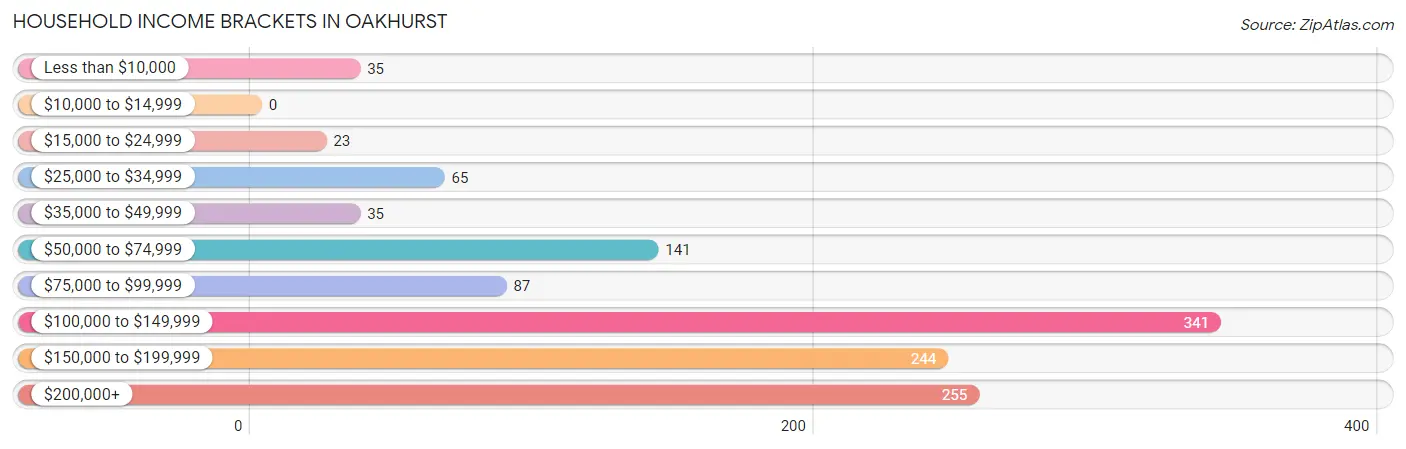
| Income Bracket | # Households | % Households |
| Less than $10,000 | 35 | 2.9% |
| $10,000 to $14,999 | 0 | 0.0% |
| $15,000 to $24,999 | 23 | 1.9% |
| $25,000 to $34,999 | 65 | 5.3% |
| $35,000 to $49,999 | 35 | 2.9% |
| $50,000 to $74,999 | 141 | 11.5% |
| $75,000 to $99,999 | 87 | 7.1% |
| $100,000 to $149,999 | 341 | 27.9% |
| $150,000 to $199,999 | 244 | 19.9% |
| $200,000+ | 255 | 20.8% |
Household Income by Householder Age in Oakhurst
The median household income in Oakhurst is $130,313, with the highest median household income of $155,833 found in the 45 to 64 years age bracket for the primary householder. A total of 522 households (42.6%) fall into this category.
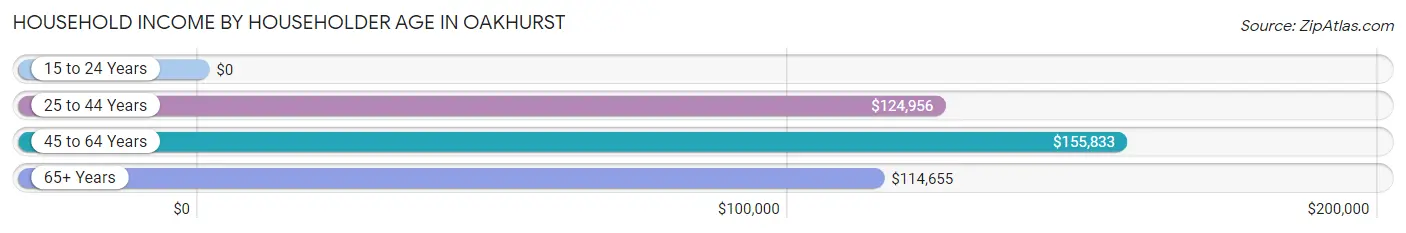
| Income Bracket | # Households | Median Income |
| 15 to 24 Years | 0 (0.0%) | $0 |
| 25 to 44 Years | 328 (26.8%) | $124,956 |
| 45 to 64 Years | 522 (42.6%) | $155,833 |
| 65+ Years | 374 (30.6%) | $114,655 |
| Total | 1,224 (100.0%) | $130,313 |
Poverty in Oakhurst
Income Below Poverty by Sex and Age in Oakhurst
With 0.2% poverty level for males and 2.5% for females among the residents of Oakhurst, 18 to 24 year old males and 55 to 64 year old females are the most vulnerable to poverty, with 1 males (0.6%) and 38 females (10.6%) in their respective age groups living below the poverty level.
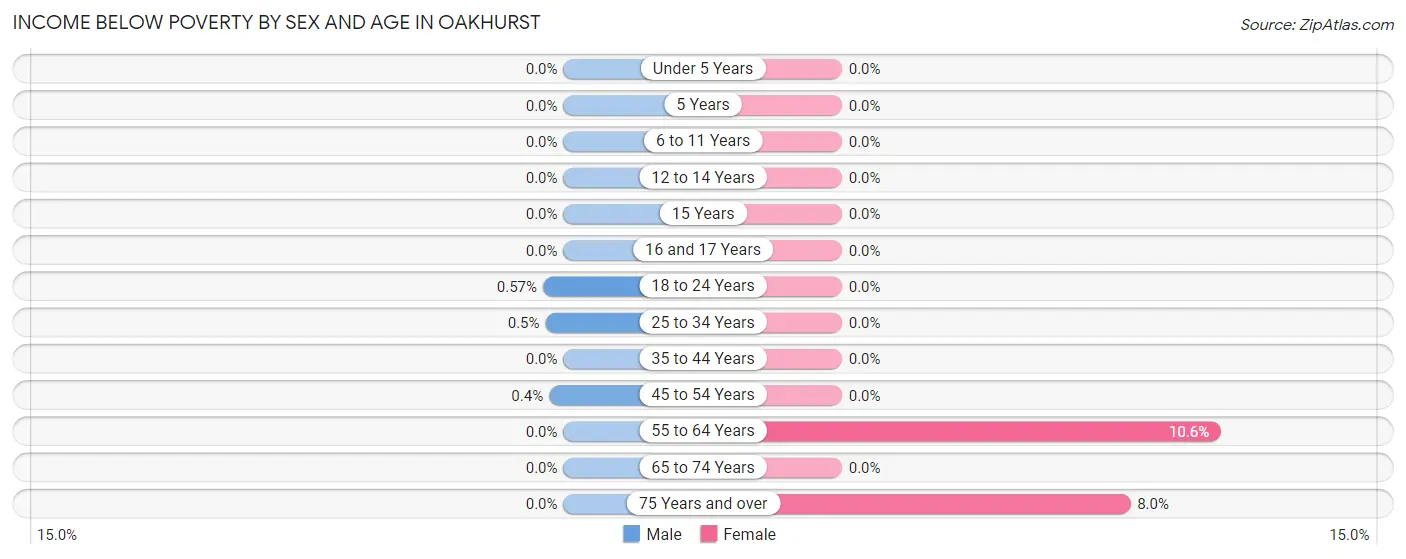
| Age Bracket | Male | Female |
| Under 5 Years | 0 (0.0%) | 0 (0.0%) |
| 5 Years | 0 (0.0%) | 0 (0.0%) |
| 6 to 11 Years | 0 (0.0%) | 0 (0.0%) |
| 12 to 14 Years | 0 (0.0%) | 0 (0.0%) |
| 15 Years | 0 (0.0%) | 0 (0.0%) |
| 16 and 17 Years | 0 (0.0%) | 0 (0.0%) |
| 18 to 24 Years | 1 (0.6%) | 0 (0.0%) |
| 25 to 34 Years | 1 (0.5%) | 0 (0.0%) |
| 35 to 44 Years | 0 (0.0%) | 0 (0.0%) |
| 45 to 54 Years | 1 (0.4%) | 0 (0.0%) |
| 55 to 64 Years | 0 (0.0%) | 38 (10.6%) |
| 65 to 74 Years | 0 (0.0%) | 0 (0.0%) |
| 75 Years and over | 0 (0.0%) | 11 (8.0%) |
| Total | 3 (0.2%) | 49 (2.5%) |
Income Above Poverty by Sex and Age in Oakhurst
According to the poverty statistics in Oakhurst, males aged under 5 years and females aged under 5 years are the age groups that are most secure financially, with 100.0% of males and 100.0% of females in these age groups living above the poverty line.
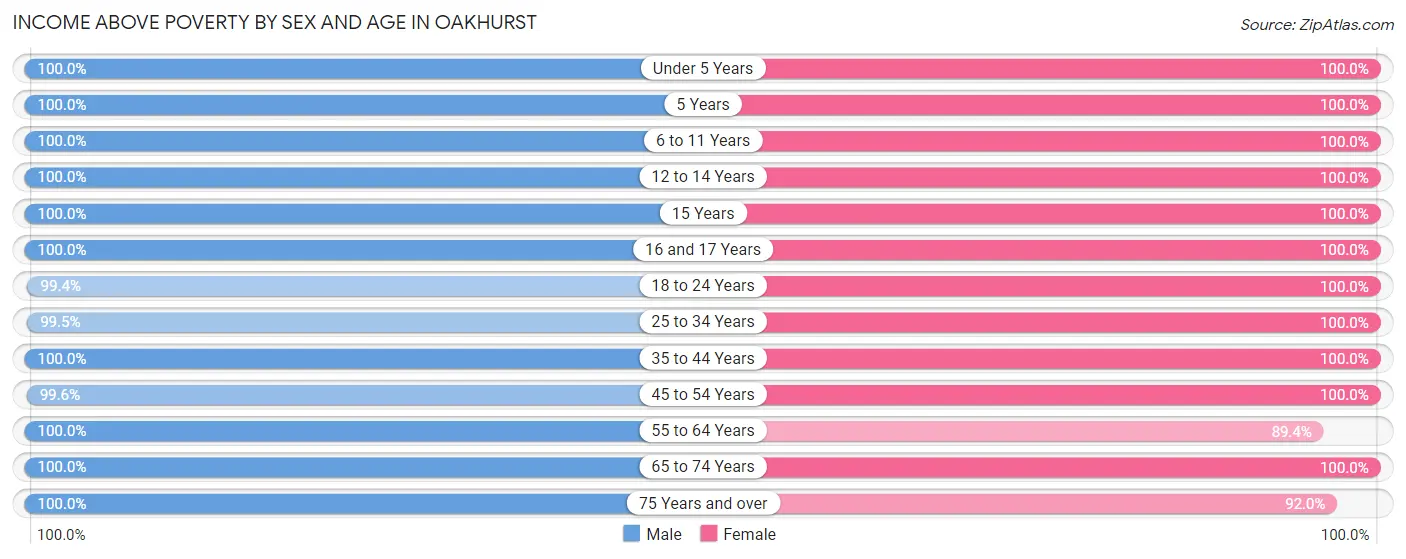
| Age Bracket | Male | Female |
| Under 5 Years | 251 (100.0%) | 160 (100.0%) |
| 5 Years | 30 (100.0%) | 9 (100.0%) |
| 6 to 11 Years | 108 (100.0%) | 254 (100.0%) |
| 12 to 14 Years | 46 (100.0%) | 48 (100.0%) |
| 15 Years | 16 (100.0%) | 17 (100.0%) |
| 16 and 17 Years | 42 (100.0%) | 91 (100.0%) |
| 18 to 24 Years | 175 (99.4%) | 114 (100.0%) |
| 25 to 34 Years | 200 (99.5%) | 223 (100.0%) |
| 35 to 44 Years | 199 (100.0%) | 230 (100.0%) |
| 45 to 54 Years | 250 (99.6%) | 150 (100.0%) |
| 55 to 64 Years | 209 (100.0%) | 322 (89.4%) |
| 65 to 74 Years | 190 (100.0%) | 198 (100.0%) |
| 75 Years and over | 157 (100.0%) | 126 (92.0%) |
| Total | 1,873 (99.8%) | 1,942 (97.5%) |
Income Below Poverty Among Married-Couple Families in Oakhurst
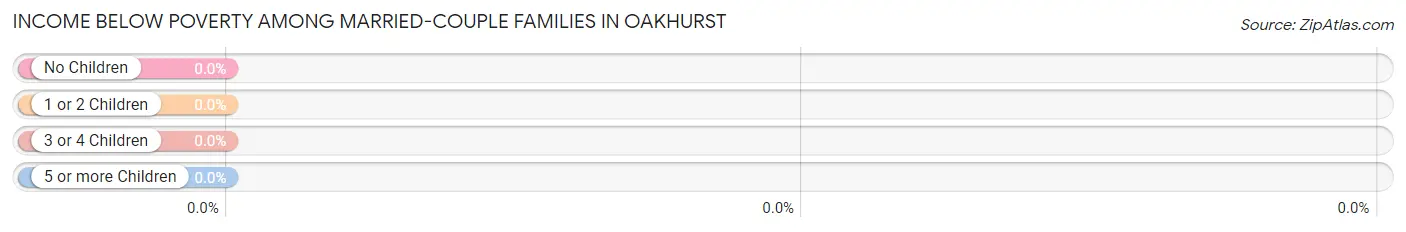
| Children | Above Poverty | Below Poverty |
| No Children | 541 (100.0%) | 0 (0.0%) |
| 1 or 2 Children | 244 (100.0%) | 0 (0.0%) |
| 3 or 4 Children | 75 (100.0%) | 0 (0.0%) |
| 5 or more Children | 15 (100.0%) | 0 (0.0%) |
| Total | 875 (100.0%) | 0 (0.0%) |
Income Below Poverty Among Single-Parent Households in Oakhurst
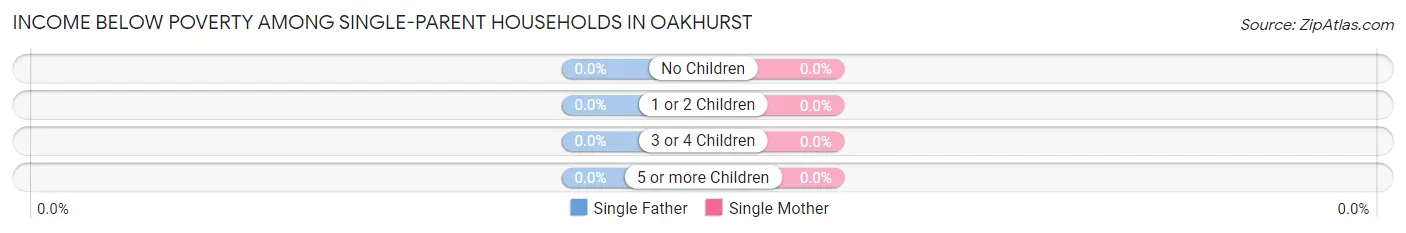
| Children | Single Father | Single Mother |
| No Children | 0 (0.0%) | 0 (0.0%) |
| 1 or 2 Children | 0 (0.0%) | 0 (0.0%) |
| 3 or 4 Children | 0 (0.0%) | 0 (0.0%) |
| 5 or more Children | 0 (0.0%) | 0 (0.0%) |
| Total | 0 (0.0%) | 0 (0.0%) |
Income Below Poverty Among Married-Couple vs Single-Parent Households in Oakhurst
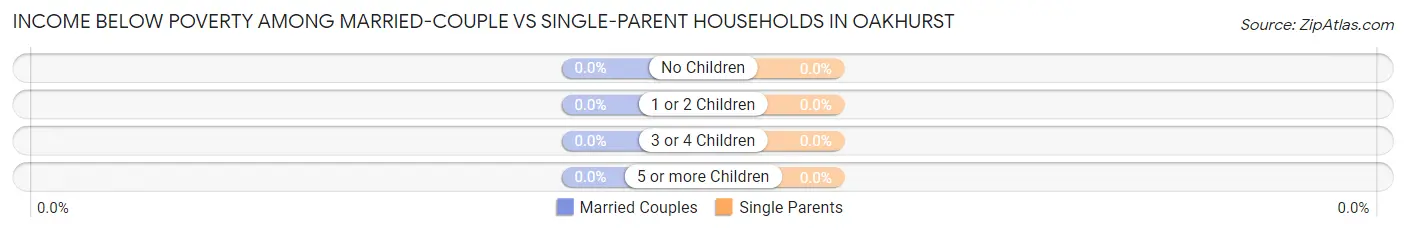
| Children | Married-Couple Families | Single-Parent Households |
| No Children | 0 (0.0%) | 0 (0.0%) |
| 1 or 2 Children | 0 (0.0%) | 0 (0.0%) |
| 3 or 4 Children | 0 (0.0%) | 0 (0.0%) |
| 5 or more Children | 0 (0.0%) | 0 (0.0%) |
| Total | 0 (0.0%) | 0 (0.0%) |
Race in Oakhurst
The most populous races in Oakhurst are White / Caucasian (3,206 | 82.0%), Two or more Races (457 | 11.7%), and Black / African American (201 | 5.1%).
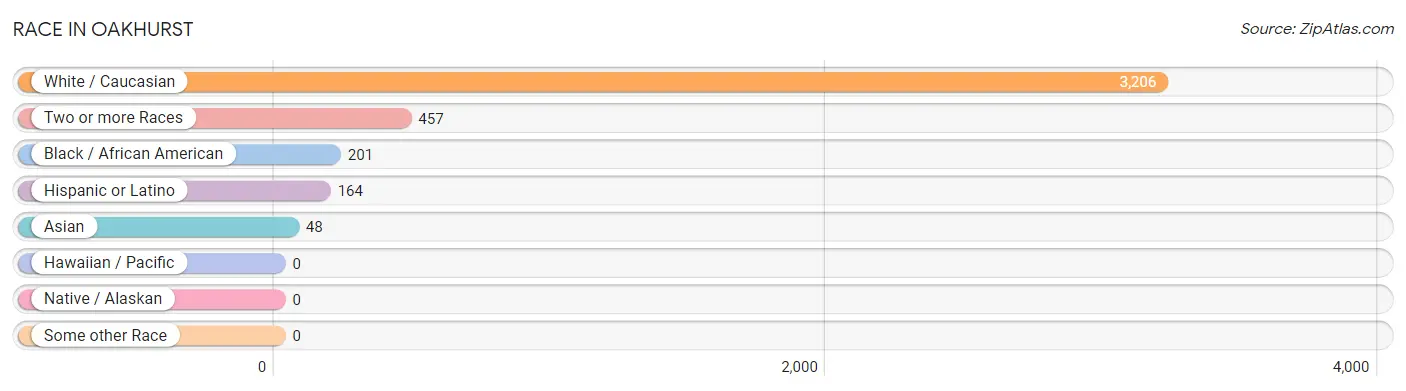
| Race | # Population | % Population |
| Asian | 48 | 1.2% |
| Black / African American | 201 | 5.1% |
| Hawaiian / Pacific | 0 | 0.0% |
| Hispanic or Latino | 164 | 4.2% |
| Native / Alaskan | 0 | 0.0% |
| White / Caucasian | 3,206 | 82.0% |
| Two or more Races | 457 | 11.7% |
| Some other Race | 0 | 0.0% |
| Total | 3,912 | 100.0% |
Ancestry in Oakhurst
The most populous ancestries reported in Oakhurst are Italian (1,014 | 25.9%), Irish (702 | 17.9%), German (464 | 11.9%), Arab (298 | 7.6%), and English (280 | 7.2%), together accounting for 70.5% of all Oakhurst residents.
| Ancestry | # Population | % Population |
| American | 202 | 5.2% |
| Arab | 298 | 7.6% |
| Armenian | 18 | 0.5% |
| Austrian | 10 | 0.3% |
| Bhutanese | 10 | 0.3% |
| British | 21 | 0.5% |
| Cuban | 27 | 0.7% |
| Czechoslovakian | 8 | 0.2% |
| Dutch | 24 | 0.6% |
| Ecuadorian | 14 | 0.4% |
| Egyptian | 25 | 0.6% |
| English | 280 | 7.2% |
| European | 125 | 3.2% |
| French | 87 | 2.2% |
| German | 464 | 11.9% |
| Greek | 42 | 1.1% |
| Haitian | 96 | 2.5% |
| Hungarian | 42 | 1.1% |
| Indian (Asian) | 20 | 0.5% |
| Irish | 702 | 17.9% |
| Israeli | 67 | 1.7% |
| Italian | 1,014 | 25.9% |
| Lebanese | 4 | 0.1% |
| Mexican | 13 | 0.3% |
| Nigerian | 104 | 2.7% |
| Norwegian | 24 | 0.6% |
| Peruvian | 96 | 2.5% |
| Polish | 190 | 4.9% |
| Portuguese | 18 | 0.5% |
| Puerto Rican | 14 | 0.4% |
| Romanian | 16 | 0.4% |
| Russian | 35 | 0.9% |
| Scottish | 90 | 2.3% |
| Slovak | 22 | 0.6% |
| South American | 110 | 2.8% |
| Subsaharan African | 104 | 2.7% |
| Swedish | 22 | 0.6% |
| Syrian | 187 | 4.8% |
| Thai | 18 | 0.5% |
| Welsh | 10 | 0.3% | View All 40 Rows |
Immigrants in Oakhurst
The most numerous immigrant groups reported in Oakhurst came from Latin America (164 | 4.2%), Caribbean (96 | 2.5%), Haiti (96 | 2.5%), Africa (79 | 2.0%), and Nigeria (79 | 2.0%), together accounting for 13.1% of all Oakhurst residents.
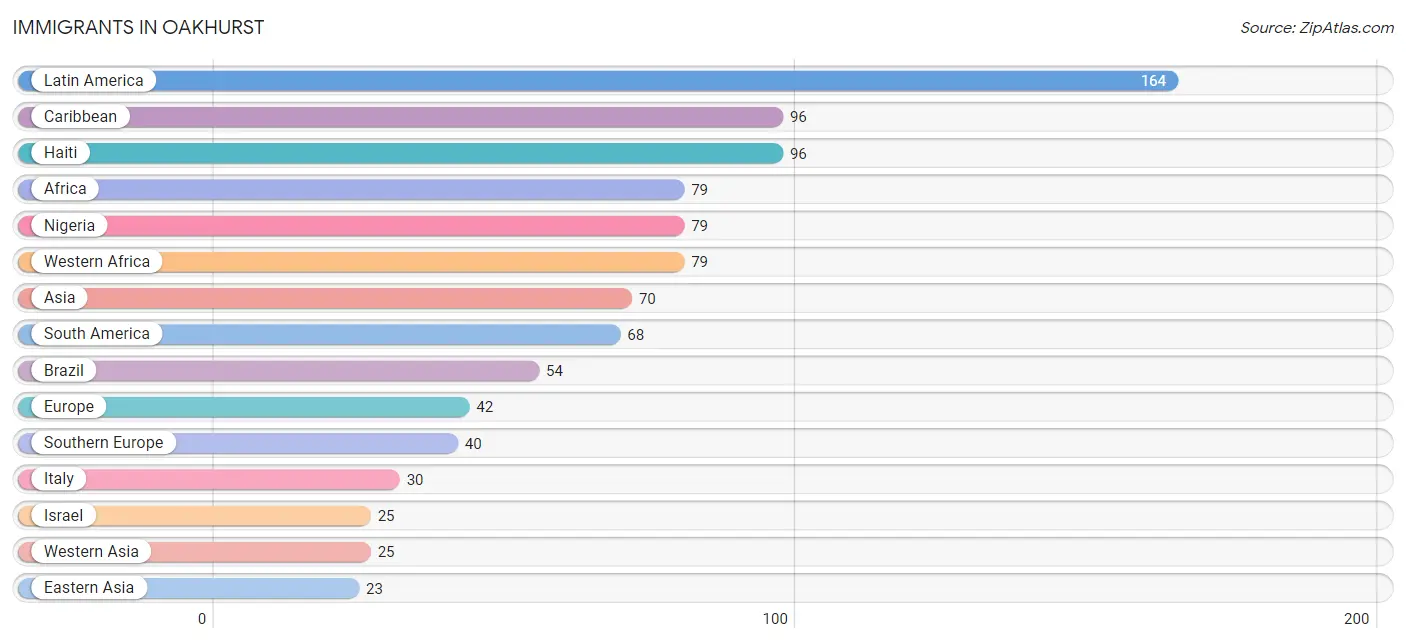
| Immigration Origin | # Population | % Population |
| Africa | 79 | 2.0% |
| Asia | 70 | 1.8% |
| Brazil | 54 | 1.4% |
| Caribbean | 96 | 2.5% |
| China | 13 | 0.3% |
| Eastern Asia | 23 | 0.6% |
| Ecuador | 14 | 0.4% |
| Europe | 42 | 1.1% |
| Germany | 2 | 0.1% |
| Greece | 10 | 0.3% |
| Haiti | 96 | 2.5% |
| India | 18 | 0.5% |
| Israel | 25 | 0.6% |
| Italy | 30 | 0.8% |
| Japan | 10 | 0.3% |
| Latin America | 164 | 4.2% |
| Nigeria | 79 | 2.0% |
| Philippines | 4 | 0.1% |
| South America | 68 | 1.7% |
| South Central Asia | 18 | 0.5% |
| South Eastern Asia | 4 | 0.1% |
| Southern Europe | 40 | 1.0% |
| Western Africa | 79 | 2.0% |
| Western Asia | 25 | 0.6% |
| Western Europe | 2 | 0.1% | View All 25 Rows |
Sex and Age in Oakhurst
Sex and Age in Oakhurst
The most populous age groups in Oakhurst are Under 5 Years (251 | 13.4%) for men and 55 to 59 Years (206 | 10.1%) for women.
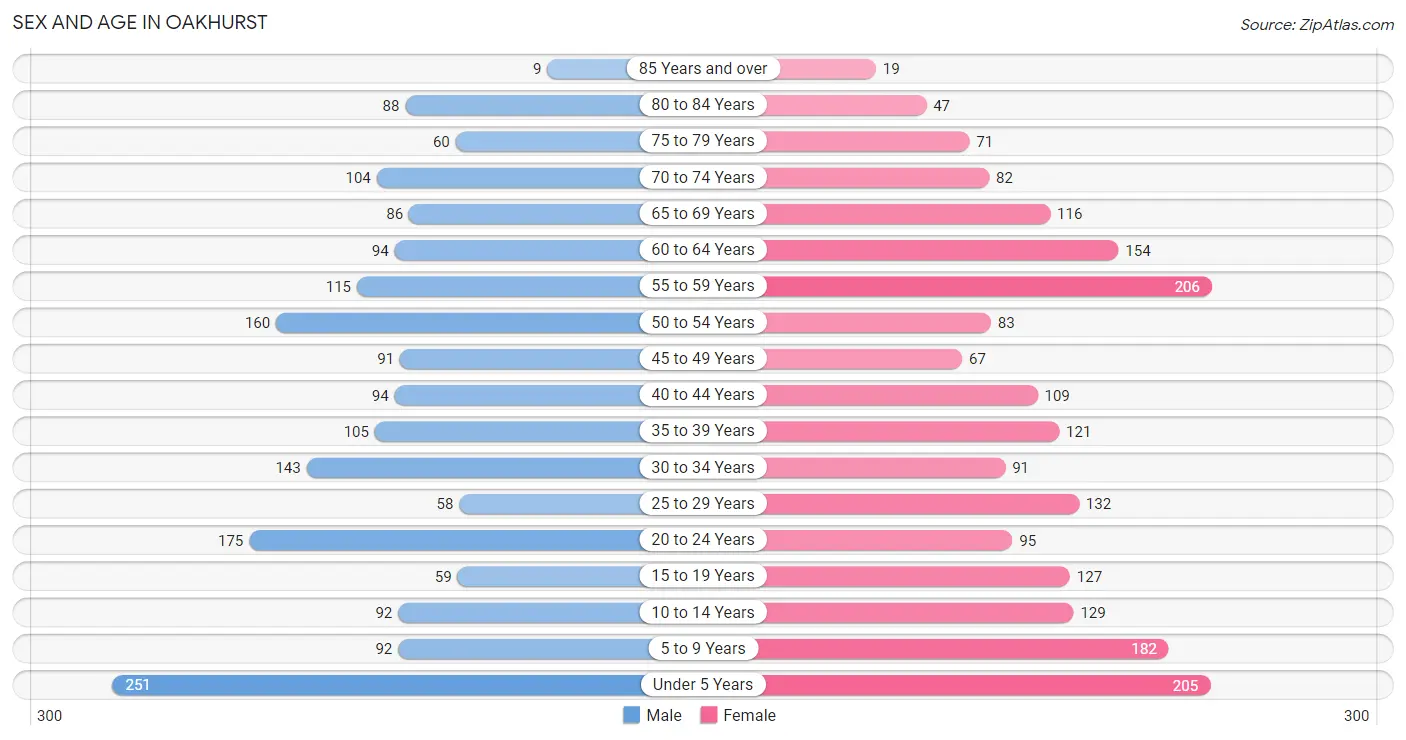
| Age Bracket | Male | Female |
| Under 5 Years | 251 (13.4%) | 205 (10.1%) |
| 5 to 9 Years | 92 (4.9%) | 182 (8.9%) |
| 10 to 14 Years | 92 (4.9%) | 129 (6.3%) |
| 15 to 19 Years | 59 (3.1%) | 127 (6.2%) |
| 20 to 24 Years | 175 (9.3%) | 95 (4.7%) |
| 25 to 29 Years | 58 (3.1%) | 132 (6.5%) |
| 30 to 34 Years | 143 (7.6%) | 91 (4.5%) |
| 35 to 39 Years | 105 (5.6%) | 121 (5.9%) |
| 40 to 44 Years | 94 (5.0%) | 109 (5.3%) |
| 45 to 49 Years | 91 (4.9%) | 67 (3.3%) |
| 50 to 54 Years | 160 (8.5%) | 83 (4.1%) |
| 55 to 59 Years | 115 (6.1%) | 206 (10.1%) |
| 60 to 64 Years | 94 (5.0%) | 154 (7.6%) |
| 65 to 69 Years | 86 (4.6%) | 116 (5.7%) |
| 70 to 74 Years | 104 (5.5%) | 82 (4.0%) |
| 75 to 79 Years | 60 (3.2%) | 71 (3.5%) |
| 80 to 84 Years | 88 (4.7%) | 47 (2.3%) |
| 85 Years and over | 9 (0.5%) | 19 (0.9%) |
| Total | 1,876 (100.0%) | 2,036 (100.0%) |
Families and Households in Oakhurst
Median Family Size in Oakhurst
The median family size in Oakhurst is 3.33 persons per family, with single female/mother families (101 | 9.6%) accounting for the largest median family size of 3.4 persons per family. On the other hand, single male/father families (77 | 7.3%) represent the smallest median family size with 2.88 persons per family.
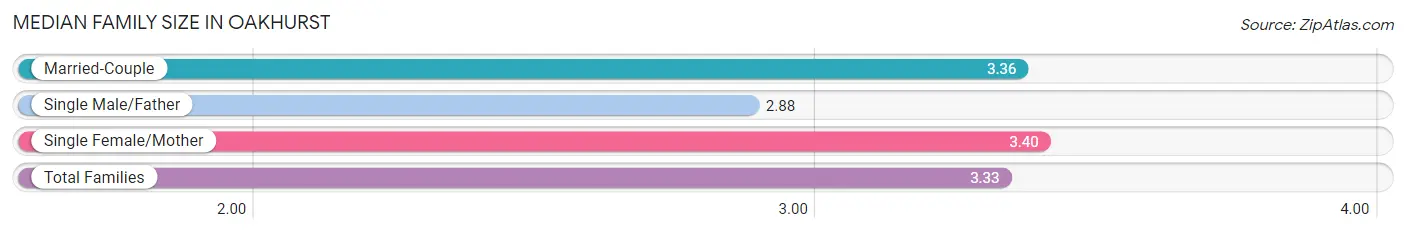
| Family Type | # Families | Family Size |
| Married-Couple | 875 (83.1%) | 3.36 |
| Single Male/Father | 77 (7.3%) | 2.88 |
| Single Female/Mother | 101 (9.6%) | 3.40 |
| Total Families | 1,053 (100.0%) | 3.33 |
Median Household Size in Oakhurst
The median household size in Oakhurst is 3.19 persons per household, with single female/mother households (101 | 8.3%) accounting for the largest median household size of 3.99 persons per household. non-family households (171 | 14.0%) represent the smallest median household size with 1.04 persons per household.
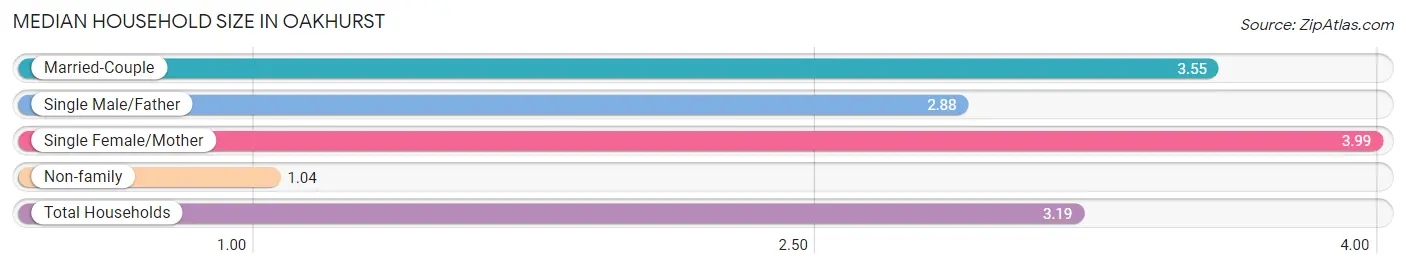
| Household Type | # Households | Household Size |
| Married-Couple | 875 (71.5%) | 3.55 |
| Single Male/Father | 77 (6.3%) | 2.88 |
| Single Female/Mother | 101 (8.3%) | 3.99 |
| Non-family | 171 (14.0%) | 1.04 |
| Total Households | 1,224 (100.0%) | 3.19 |
Household Size by Marriage Status in Oakhurst
Out of a total of 1,224 households in Oakhurst, 1,053 (86.0%) are family households, while 171 (14.0%) are nonfamily households. The most numerous type of family households are 2-person households, comprising 399, and the most common type of nonfamily households are 1-person households, comprising 164.
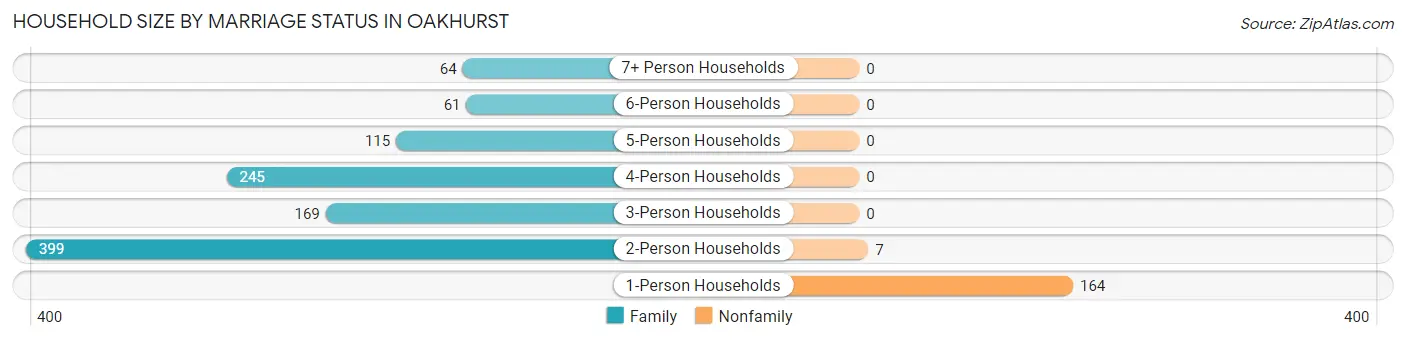
| Household Size | Family Households | Nonfamily Households |
| 1-Person Households | - | 164 (13.4%) |
| 2-Person Households | 399 (32.6%) | 7 (0.6%) |
| 3-Person Households | 169 (13.8%) | 0 (0.0%) |
| 4-Person Households | 245 (20.0%) | 0 (0.0%) |
| 5-Person Households | 115 (9.4%) | 0 (0.0%) |
| 6-Person Households | 61 (5.0%) | 0 (0.0%) |
| 7+ Person Households | 64 (5.2%) | 0 (0.0%) |
| Total | 1,053 (86.0%) | 171 (14.0%) |
Female Fertility in Oakhurst
Fertility by Age in Oakhurst
Average fertility rate in Oakhurst is 65.0 births per 1,000 women. Women in the age bracket of 35 to 50 years have the highest fertility rate with 108.0 births per 1,000 women. Women in the age bracket of 35 to 50 years acount for 66.7% of all women with births.
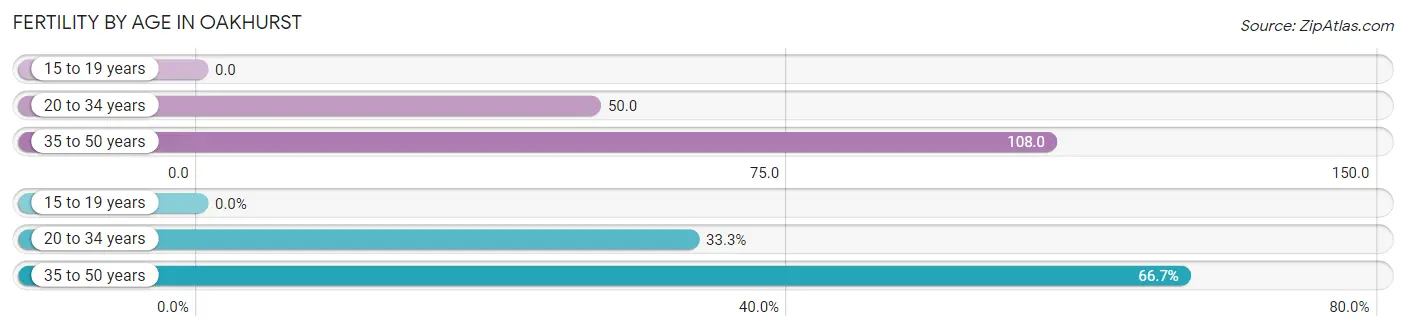
| Age Bracket | Women with Births | Births / 1,000 Women |
| 15 to 19 years | 0 (0.0%) | 0.0 |
| 20 to 34 years | 16 (33.3%) | 50.0 |
| 35 to 50 years | 32 (66.7%) | 108.0 |
| Total | 48 (100.0%) | 65.0 |
Fertility by Age by Marriage Status in Oakhurst
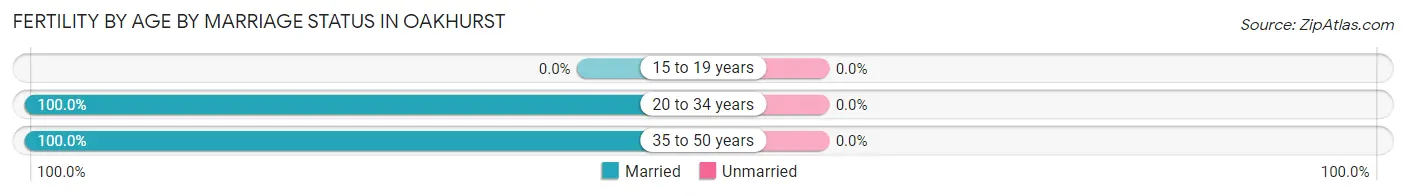
| Age Bracket | Married | Unmarried |
| 15 to 19 years | 0 (0.0%) | 0 (0.0%) |
| 20 to 34 years | 16 (100.0%) | 0 (0.0%) |
| 35 to 50 years | 32 (100.0%) | 0 (0.0%) |
| Total | 48 (100.0%) | 0 (0.0%) |
Fertility by Education in Oakhurst
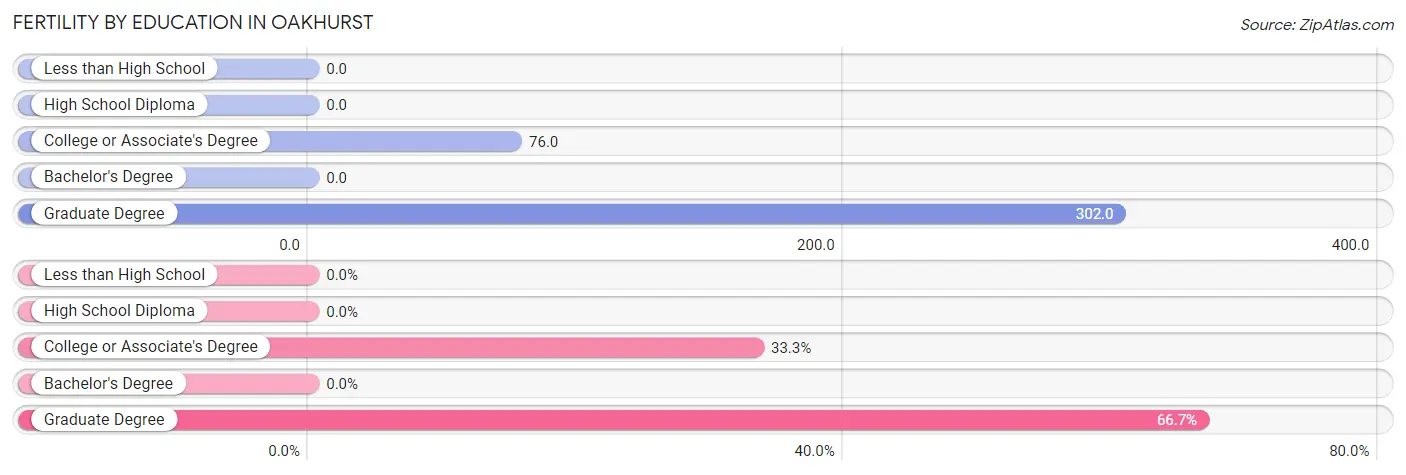
| Educational Attainment | Women with Births | Births / 1,000 Women |
| Less than High School | 0 (0.0%) | 0.0 |
| High School Diploma | 0 (0.0%) | 0.0 |
| College or Associate's Degree | 16 (33.3%) | 76.0 |
| Bachelor's Degree | 0 (0.0%) | 0.0 |
| Graduate Degree | 32 (66.7%) | 302.0 |
| Total | 48 (100.0%) | 65.0 |
Fertility by Education by Marriage Status in Oakhurst
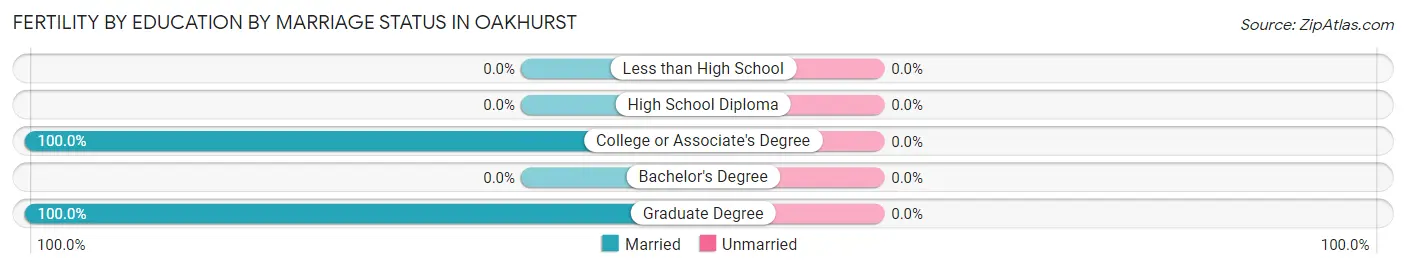
| Educational Attainment | Married | Unmarried |
| Less than High School | 0 (0.0%) | 0 (0.0%) |
| High School Diploma | 0 (0.0%) | 0 (0.0%) |
| College or Associate's Degree | 16 (100.0%) | 0 (0.0%) |
| Bachelor's Degree | 0 (0.0%) | 0 (0.0%) |
| Graduate Degree | 32 (100.0%) | 0 (0.0%) |
| Total | 48 (100.0%) | 0 (0.0%) |
Employment Characteristics in Oakhurst
Employment by Class of Employer in Oakhurst
Among the 1,699 employed individuals in Oakhurst, private company employees (1,025 | 60.3%), local government employees (178 | 10.5%), and not-for-profit organizations (174 | 10.2%) make up the most common classes of employment.
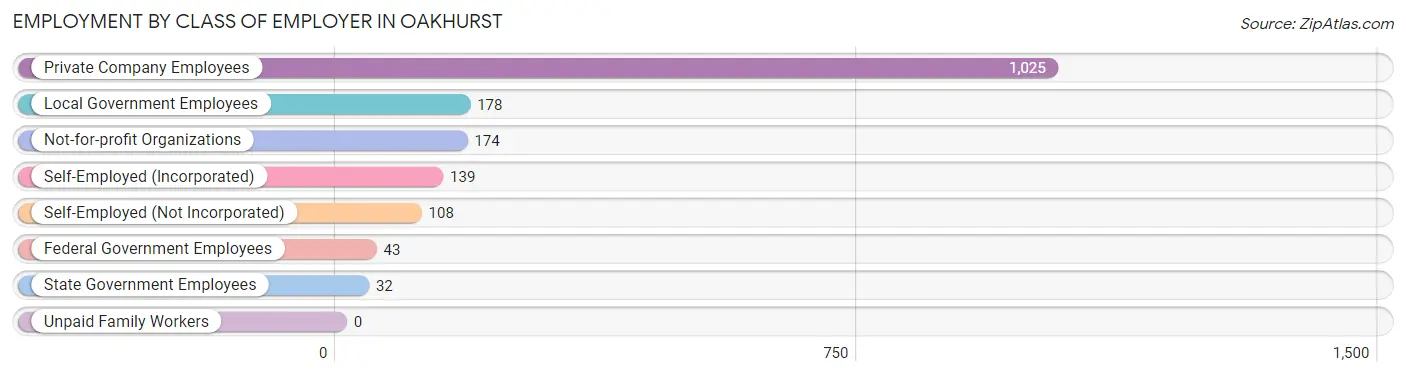
| Employer Class | # Employees | % Employees |
| Private Company Employees | 1,025 | 60.3% |
| Self-Employed (Incorporated) | 139 | 8.2% |
| Self-Employed (Not Incorporated) | 108 | 6.4% |
| Not-for-profit Organizations | 174 | 10.2% |
| Local Government Employees | 178 | 10.5% |
| State Government Employees | 32 | 1.9% |
| Federal Government Employees | 43 | 2.5% |
| Unpaid Family Workers | 0 | 0.0% |
| Total | 1,699 | 100.0% |
Employment Status by Age in Oakhurst
According to the labor force statistics for Oakhurst, out of the total population over 16 years of age (2,928), 63.6% or 1,862 individuals are in the labor force, with 6.8% or 127 of them unemployed. The age group with the highest labor force participation rate is 25 to 29 years, with 99.5% or 189 individuals in the labor force. Within the labor force, the 20 to 24 years age range has the highest percentage of unemployed individuals, with 25.0% or 40 of them being unemployed.
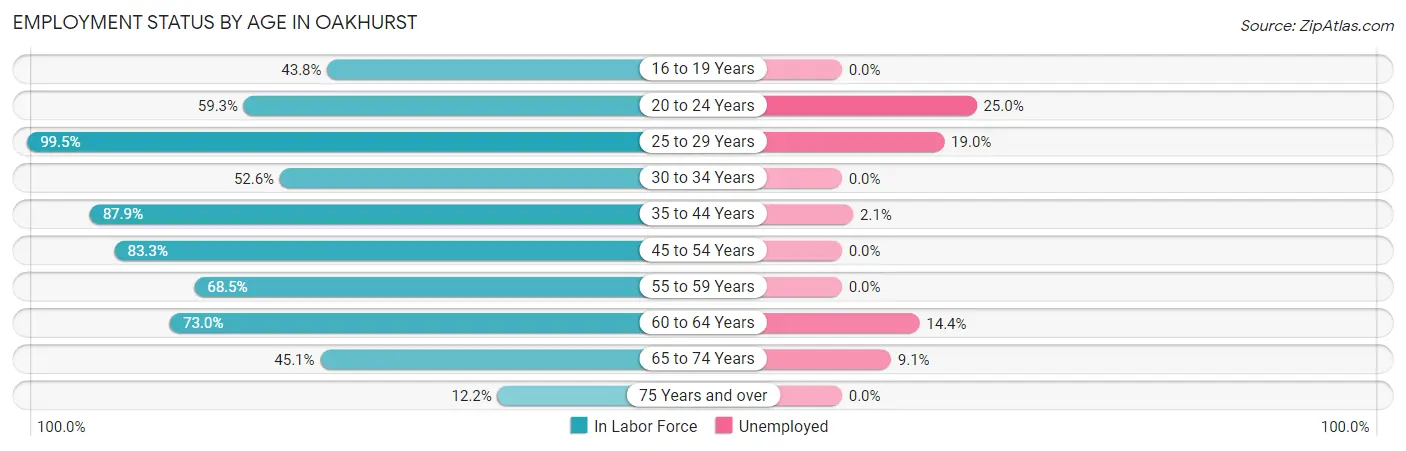
| Age Bracket | In Labor Force | Unemployed |
| 16 to 19 Years | 67 (43.8%) | 0 (0.0%) |
| 20 to 24 Years | 160 (59.3%) | 40 (25.0%) |
| 25 to 29 Years | 189 (99.5%) | 36 (19.0%) |
| 30 to 34 Years | 123 (52.6%) | 0 (0.0%) |
| 35 to 44 Years | 377 (87.9%) | 8 (2.1%) |
| 45 to 54 Years | 334 (83.3%) | 0 (0.0%) |
| 55 to 59 Years | 220 (68.5%) | 0 (0.0%) |
| 60 to 64 Years | 181 (73.0%) | 26 (14.4%) |
| 65 to 74 Years | 175 (45.1%) | 16 (9.1%) |
| 75 Years and over | 36 (12.2%) | 0 (0.0%) |
| Total | 1,862 (63.6%) | 127 (6.8%) |
Employment Status by Educational Attainment in Oakhurst
According to labor force statistics for Oakhurst, 78.1% of individuals (1,424) out of the total population between 25 and 64 years of age (1,823) are in the labor force, with 4.9% or 70 of them being unemployed. The group with the highest labor force participation rate are those with the educational attainment of bachelor's degree or higher, with 92.0% or 829 individuals in the labor force. Within the labor force, individuals with high school diploma education have the highest percentage of unemployment, with 13.9% or 29 of them being unemployed.
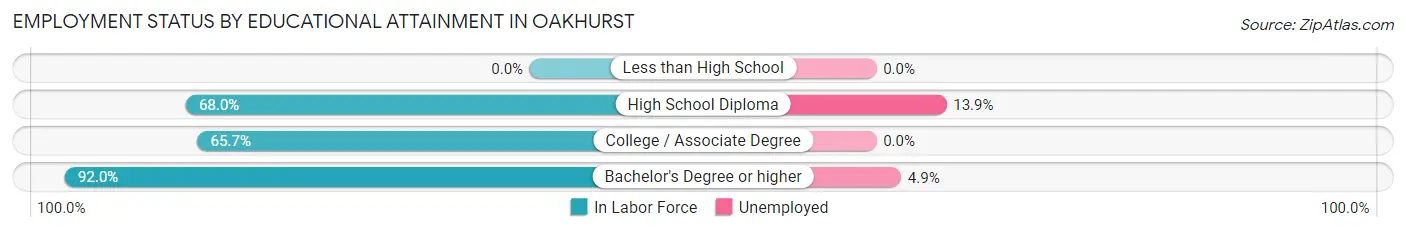
| Educational Attainment | In Labor Force | Unemployed |
| Less than High School | 0 (0.0%) | 0 (0.0%) |
| High School Diploma | 208 (68.0%) | 43 (13.9%) |
| College / Associate Degree | 387 (65.7%) | 0 (0.0%) |
| Bachelor's Degree or higher | 829 (92.0%) | 44 (4.9%) |
| Total | 1,424 (78.1%) | 89 (4.9%) |
Employment Occupations by Sex in Oakhurst
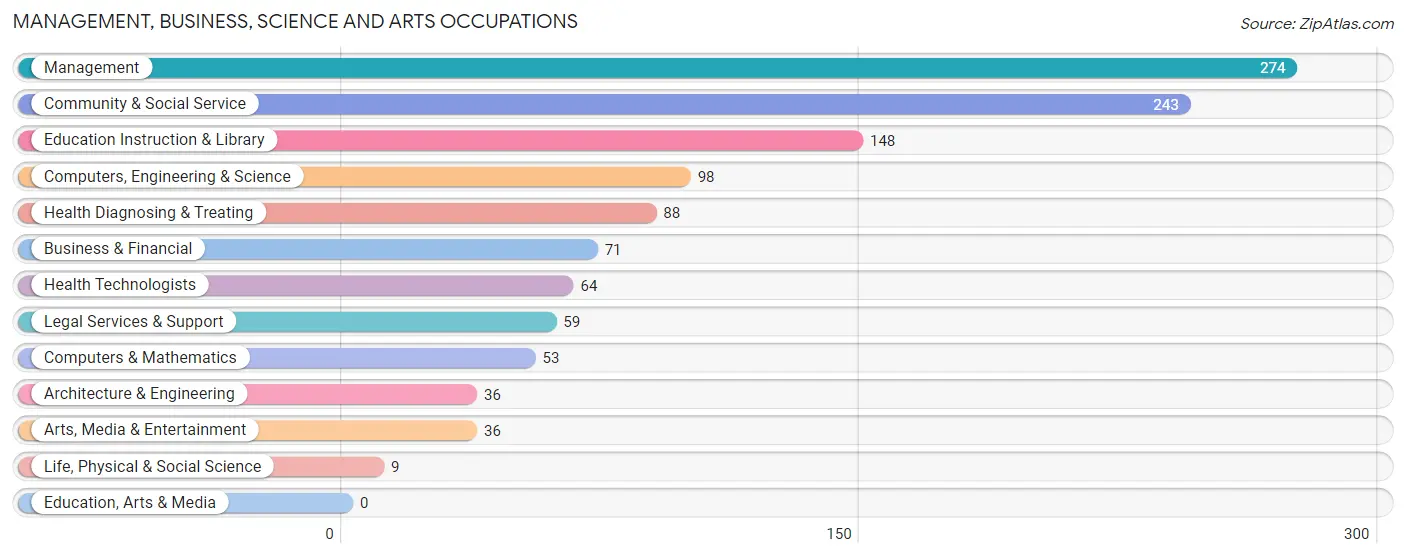
Management, Business, Science and Arts Occupations
The most common Management, Business, Science and Arts occupations in Oakhurst are Management (274 | 15.8%), Community & Social Service (243 | 14.0%), Education Instruction & Library (148 | 8.5%), Computers, Engineering & Science (98 | 5.7%), and Health Diagnosing & Treating (88 | 5.1%).
Management, Business, Science and Arts Occupations by Sex
Within the Management, Business, Science and Arts occupations in Oakhurst, the most male-oriented occupations are Computers, Engineering & Science (100.0%), Computers & Mathematics (100.0%), and Architecture & Engineering (100.0%), while the most female-oriented occupations are Health Diagnosing & Treating (100.0%), Health Technologists (100.0%), and Education Instruction & Library (91.2%).
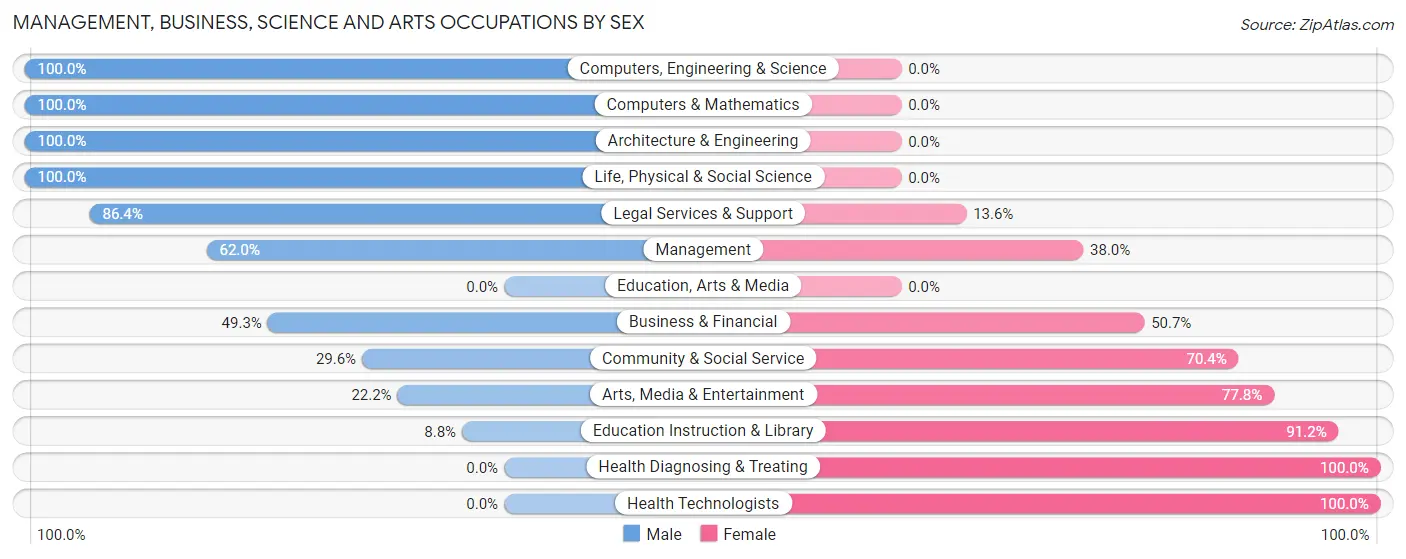
| Occupation | Male | Female |
| Management | 170 (62.0%) | 104 (38.0%) |
| Business & Financial | 35 (49.3%) | 36 (50.7%) |
| Computers, Engineering & Science | 98 (100.0%) | 0 (0.0%) |
| Computers & Mathematics | 53 (100.0%) | 0 (0.0%) |
| Architecture & Engineering | 36 (100.0%) | 0 (0.0%) |
| Life, Physical & Social Science | 9 (100.0%) | 0 (0.0%) |
| Community & Social Service | 72 (29.6%) | 171 (70.4%) |
| Education, Arts & Media | 0 (0.0%) | 0 (0.0%) |
| Legal Services & Support | 51 (86.4%) | 8 (13.6%) |
| Education Instruction & Library | 13 (8.8%) | 135 (91.2%) |
| Arts, Media & Entertainment | 8 (22.2%) | 28 (77.8%) |
| Health Diagnosing & Treating | 0 (0.0%) | 88 (100.0%) |
| Health Technologists | 0 (0.0%) | 64 (100.0%) |
| Total (Category) | 375 (48.4%) | 399 (51.5%) |
| Total (Overall) | 952 (54.8%) | 784 (45.2%) |
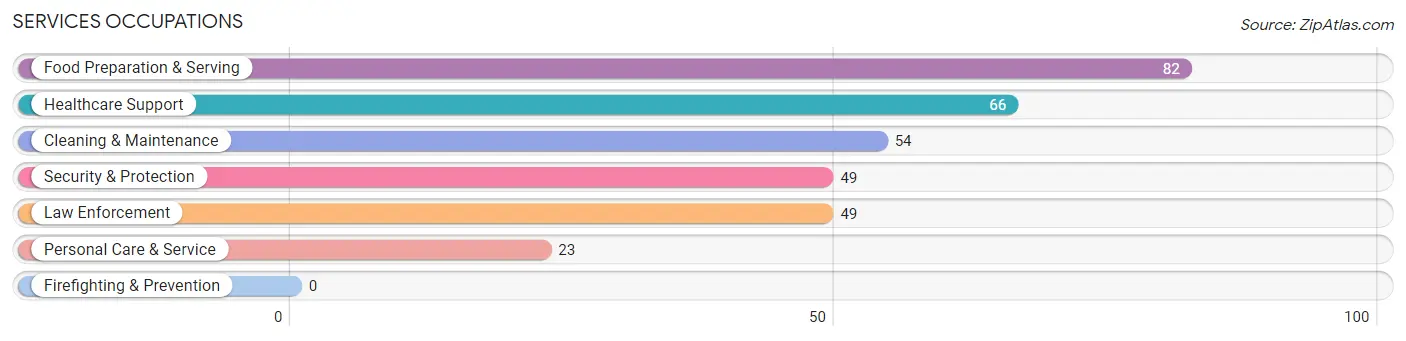
Services Occupations
The most common Services occupations in Oakhurst are Food Preparation & Serving (82 | 4.7%), Healthcare Support (66 | 3.8%), Cleaning & Maintenance (54 | 3.1%), Security & Protection (49 | 2.8%), and Law Enforcement (49 | 2.8%).
Services Occupations by Sex
Within the Services occupations in Oakhurst, the most male-oriented occupations are Security & Protection (100.0%), Law Enforcement (100.0%), and Cleaning & Maintenance (100.0%), while the most female-oriented occupations are Healthcare Support (100.0%), Food Preparation & Serving (100.0%), and Personal Care & Service (43.5%).
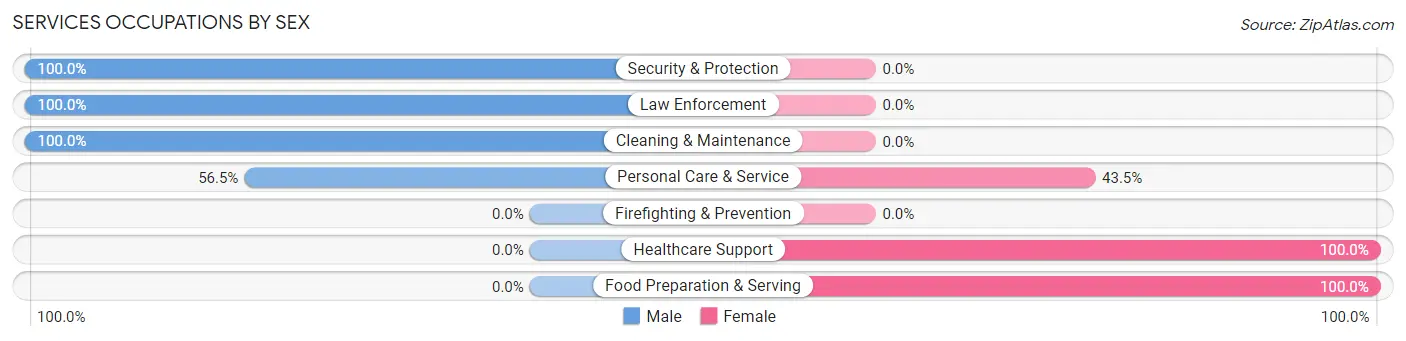
| Occupation | Male | Female |
| Healthcare Support | 0 (0.0%) | 66 (100.0%) |
| Security & Protection | 49 (100.0%) | 0 (0.0%) |
| Firefighting & Prevention | 0 (0.0%) | 0 (0.0%) |
| Law Enforcement | 49 (100.0%) | 0 (0.0%) |
| Food Preparation & Serving | 0 (0.0%) | 82 (100.0%) |
| Cleaning & Maintenance | 54 (100.0%) | 0 (0.0%) |
| Personal Care & Service | 13 (56.5%) | 10 (43.5%) |
| Total (Category) | 116 (42.3%) | 158 (57.7%) |
| Total (Overall) | 952 (54.8%) | 784 (45.2%) |
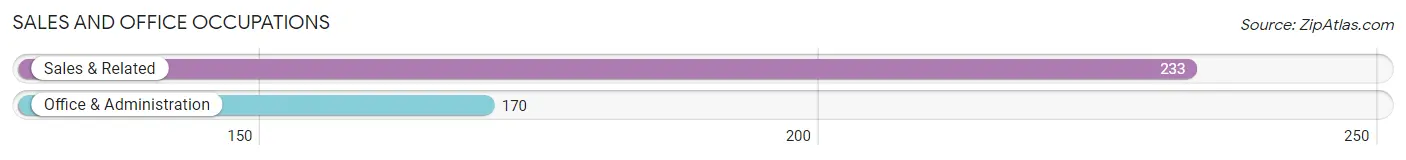
Sales and Office Occupations
The most common Sales and Office occupations in Oakhurst are Sales & Related (233 | 13.4%), and Office & Administration (170 | 9.8%).
Sales and Office Occupations by Sex
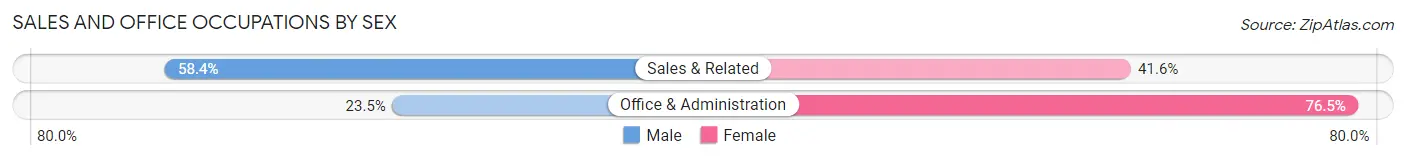
| Occupation | Male | Female |
| Sales & Related | 136 (58.4%) | 97 (41.6%) |
| Office & Administration | 40 (23.5%) | 130 (76.5%) |
| Total (Category) | 176 (43.7%) | 227 (56.3%) |
| Total (Overall) | 952 (54.8%) | 784 (45.2%) |
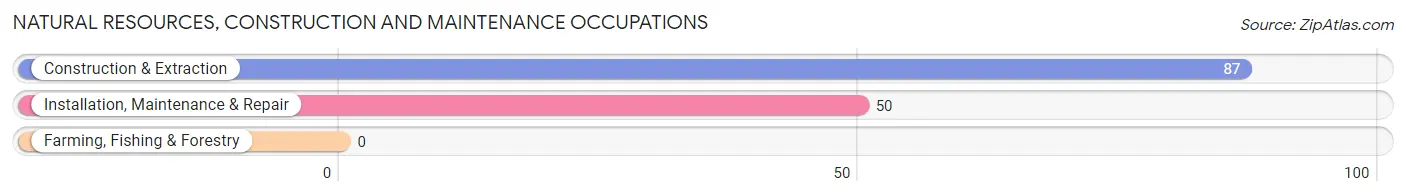
Natural Resources, Construction and Maintenance Occupations
The most common Natural Resources, Construction and Maintenance occupations in Oakhurst are Construction & Extraction (87 | 5.0%), and Installation, Maintenance & Repair (50 | 2.9%).
Natural Resources, Construction and Maintenance Occupations by Sex
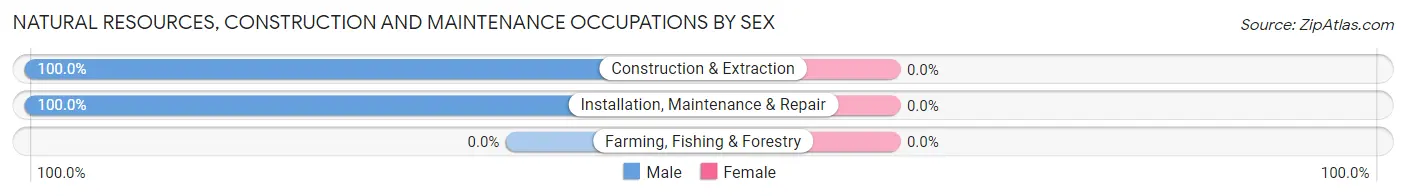
| Occupation | Male | Female |
| Farming, Fishing & Forestry | 0 (0.0%) | 0 (0.0%) |
| Construction & Extraction | 87 (100.0%) | 0 (0.0%) |
| Installation, Maintenance & Repair | 50 (100.0%) | 0 (0.0%) |
| Total (Category) | 137 (100.0%) | 0 (0.0%) |
| Total (Overall) | 952 (54.8%) | 784 (45.2%) |
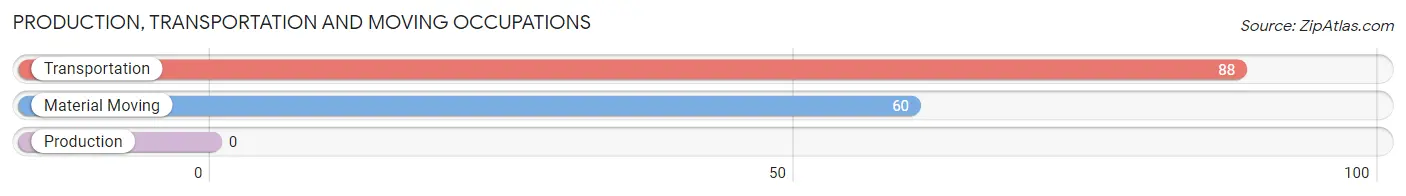
Production, Transportation and Moving Occupations
The most common Production, Transportation and Moving occupations in Oakhurst are Transportation (88 | 5.1%), and Material Moving (60 | 3.5%).
Production, Transportation and Moving Occupations by Sex
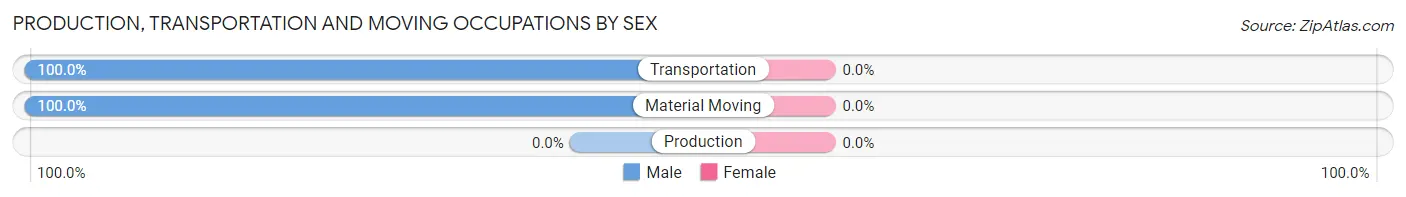
| Occupation | Male | Female |
| Production | 0 (0.0%) | 0 (0.0%) |
| Transportation | 88 (100.0%) | 0 (0.0%) |
| Material Moving | 60 (100.0%) | 0 (0.0%) |
| Total (Category) | 148 (100.0%) | 0 (0.0%) |
| Total (Overall) | 952 (54.8%) | 784 (45.2%) |
Employment Industries by Sex in Oakhurst
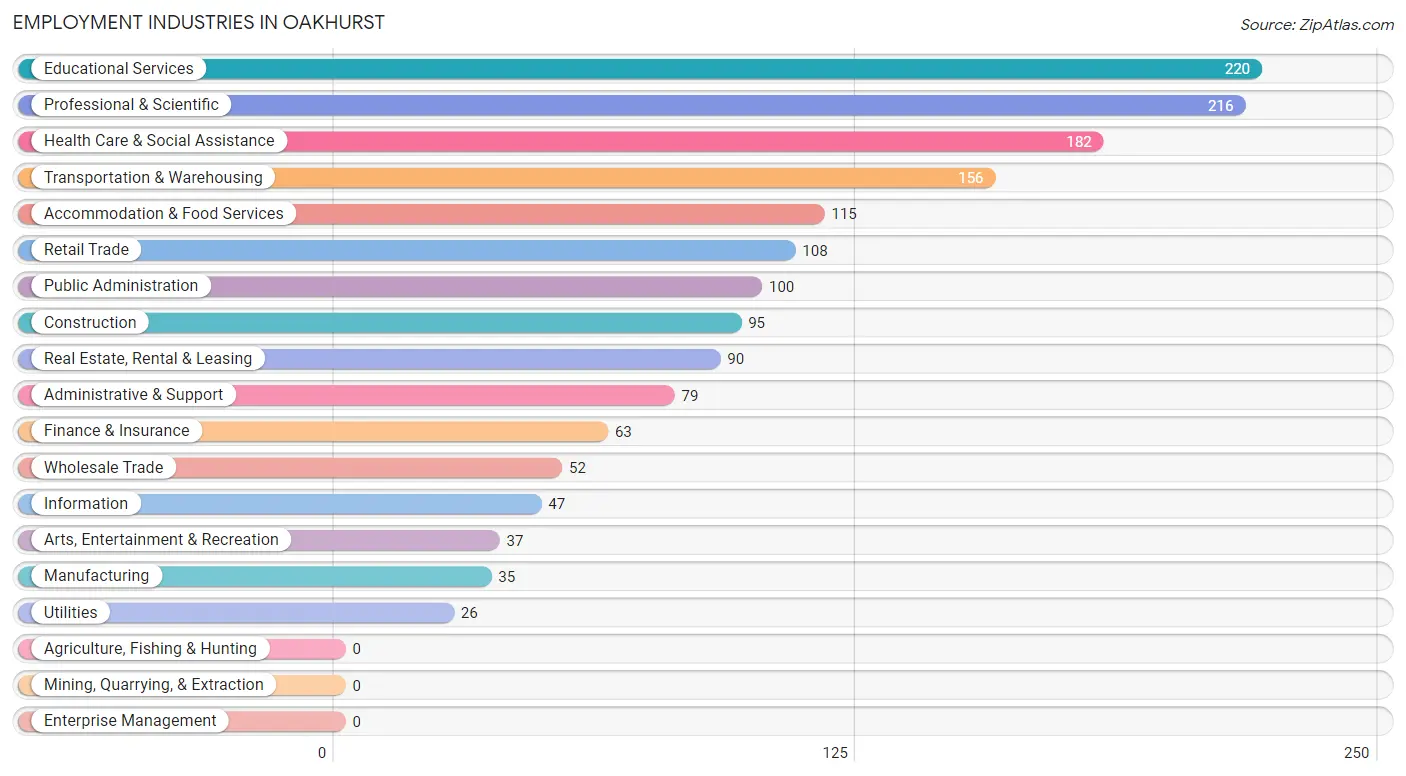
Employment Industries in Oakhurst
The major employment industries in Oakhurst include Educational Services (220 | 12.7%), Professional & Scientific (216 | 12.4%), Health Care & Social Assistance (182 | 10.5%), Transportation & Warehousing (156 | 9.0%), and Accommodation & Food Services (115 | 6.6%).
Employment Industries by Sex in Oakhurst
The Oakhurst industries that see more men than women are Transportation & Warehousing (100.0%), Construction (90.5%), and Retail Trade (87.0%), whereas the industries that tend to have a higher number of women are Accommodation & Food Services (93.9%), Health Care & Social Assistance (91.2%), and Finance & Insurance (82.5%).
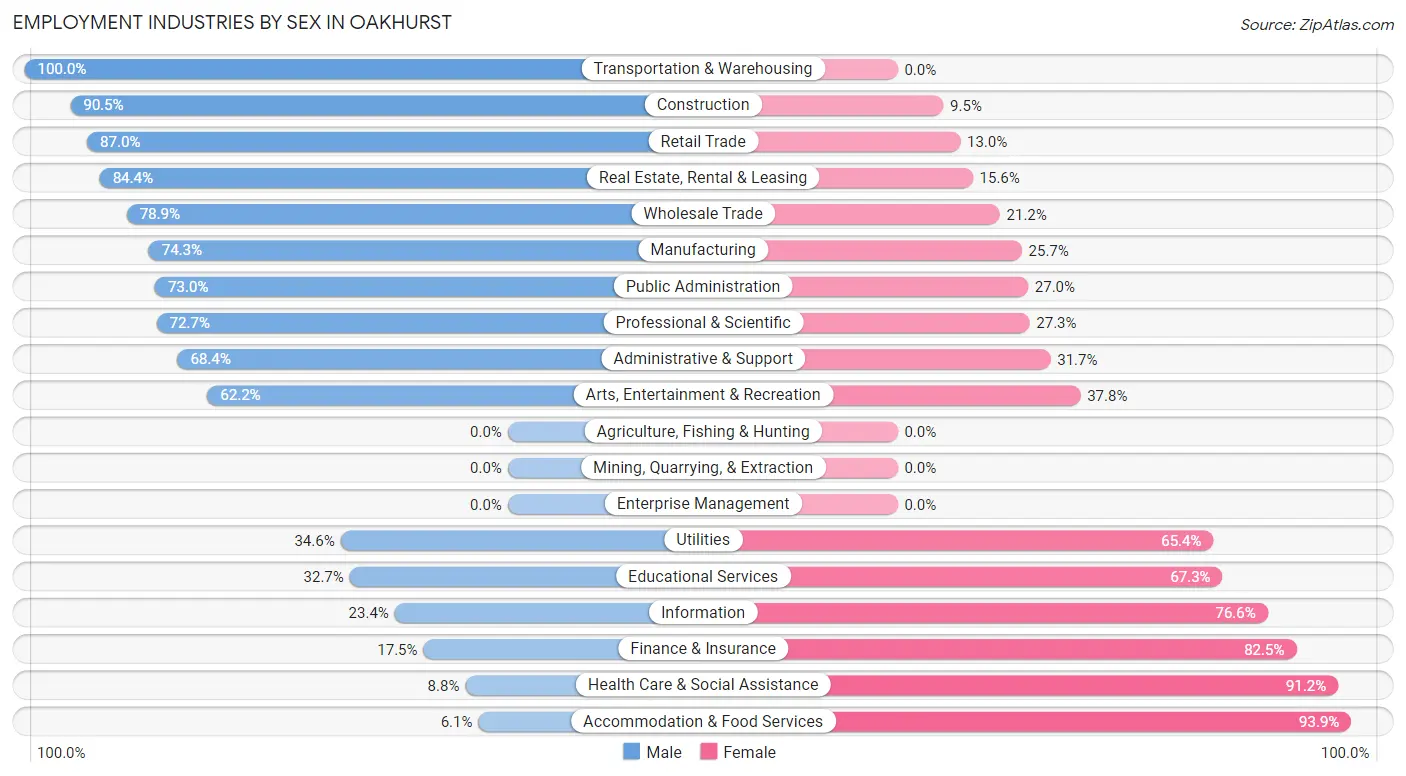
| Industry | Male | Female |
| Agriculture, Fishing & Hunting | 0 (0.0%) | 0 (0.0%) |
| Mining, Quarrying, & Extraction | 0 (0.0%) | 0 (0.0%) |
| Construction | 86 (90.5%) | 9 (9.5%) |
| Manufacturing | 26 (74.3%) | 9 (25.7%) |
| Wholesale Trade | 41 (78.8%) | 11 (21.1%) |
| Retail Trade | 94 (87.0%) | 14 (13.0%) |
| Transportation & Warehousing | 156 (100.0%) | 0 (0.0%) |
| Utilities | 9 (34.6%) | 17 (65.4%) |
| Information | 11 (23.4%) | 36 (76.6%) |
| Finance & Insurance | 11 (17.5%) | 52 (82.5%) |
| Real Estate, Rental & Leasing | 76 (84.4%) | 14 (15.6%) |
| Professional & Scientific | 157 (72.7%) | 59 (27.3%) |
| Enterprise Management | 0 (0.0%) | 0 (0.0%) |
| Administrative & Support | 54 (68.3%) | 25 (31.7%) |
| Educational Services | 72 (32.7%) | 148 (67.3%) |
| Health Care & Social Assistance | 16 (8.8%) | 166 (91.2%) |
| Arts, Entertainment & Recreation | 23 (62.2%) | 14 (37.8%) |
| Accommodation & Food Services | 7 (6.1%) | 108 (93.9%) |
| Public Administration | 73 (73.0%) | 27 (27.0%) |
| Total | 952 (54.8%) | 784 (45.2%) |
Education in Oakhurst
School Enrollment in Oakhurst
The most common levels of schooling among the 970 students in Oakhurst are high school (252 | 26.0%), elementary school (206 | 21.2%), and middle school (195 | 20.1%).
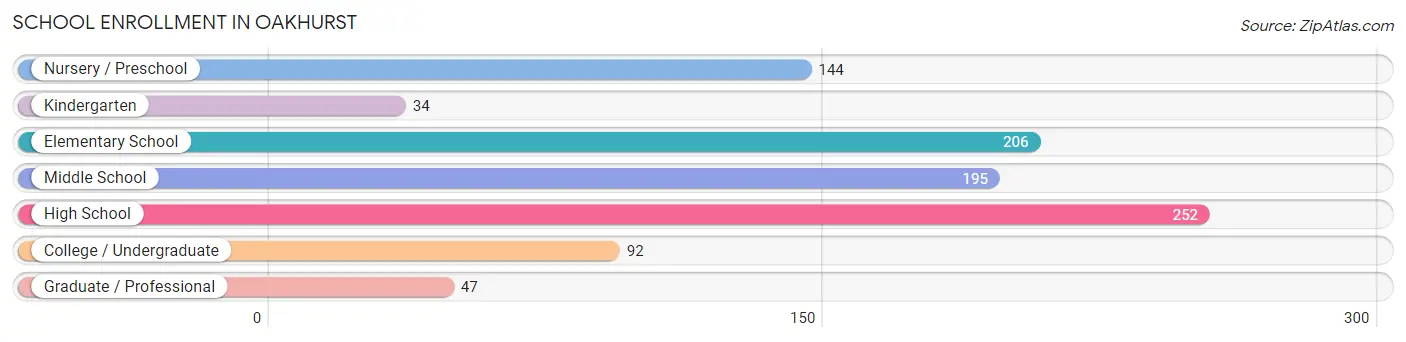
| School Level | # Students | % Students |
| Nursery / Preschool | 144 | 14.8% |
| Kindergarten | 34 | 3.5% |
| Elementary School | 206 | 21.2% |
| Middle School | 195 | 20.1% |
| High School | 252 | 26.0% |
| College / Undergraduate | 92 | 9.5% |
| Graduate / Professional | 47 | 4.9% |
| Total | 970 | 100.0% |
School Enrollment by Age by Funding Source in Oakhurst
Out of a total of 970 students who are enrolled in schools in Oakhurst, 644 (66.4%) attend a private institution, while the remaining 326 (33.6%) are enrolled in public schools. The age group of 3 to 4 year olds has the highest likelihood of being enrolled in private schools, with 119 (100.0% in the age bracket) enrolled. Conversely, the age group of 18 to 19 year olds has the lowest likelihood of being enrolled in a private school, with 20 (100.0% in the age bracket) attending a public institution.
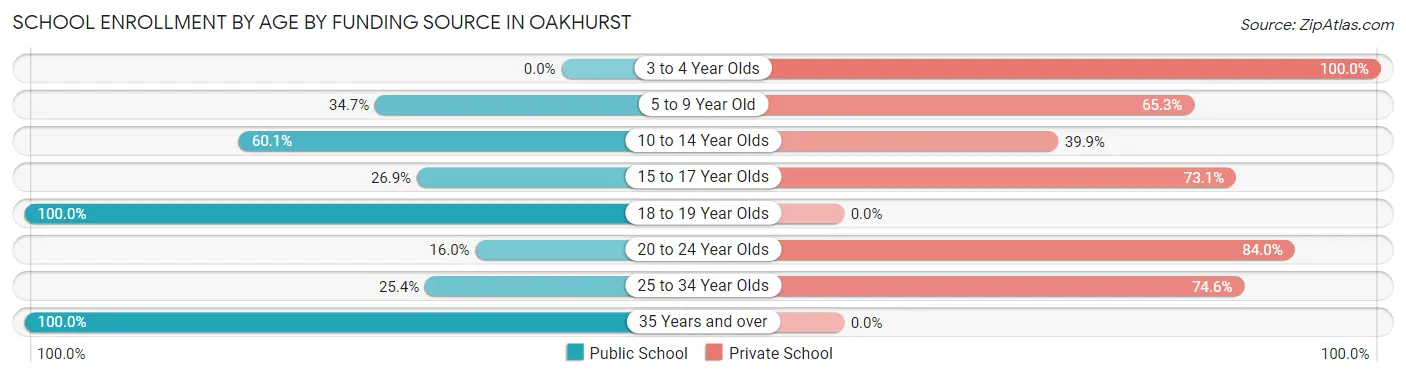
| Age Bracket | Public School | Private School |
| 3 to 4 Year Olds | 0 (0.0%) | 119 (100.0%) |
| 5 to 9 Year Old | 92 (34.7%) | 173 (65.3%) |
| 10 to 14 Year Olds | 122 (60.1%) | 81 (39.9%) |
| 15 to 17 Year Olds | 42 (26.9%) | 114 (73.1%) |
| 18 to 19 Year Olds | 20 (100.0%) | 0 (0.0%) |
| 20 to 24 Year Olds | 21 (16.0%) | 110 (84.0%) |
| 25 to 34 Year Olds | 16 (25.4%) | 47 (74.6%) |
| 35 Years and over | 13 (100.0%) | 0 (0.0%) |
| Total | 326 (33.6%) | 644 (66.4%) |
Educational Attainment by Field of Study in Oakhurst
Business (270 | 23.1%), education (197 | 16.8%), social sciences (147 | 12.6%), communications (106 | 9.0%), and science & technology (80 | 6.8%) are the most common fields of study among 1,171 individuals in Oakhurst who have obtained a bachelor's degree or higher.
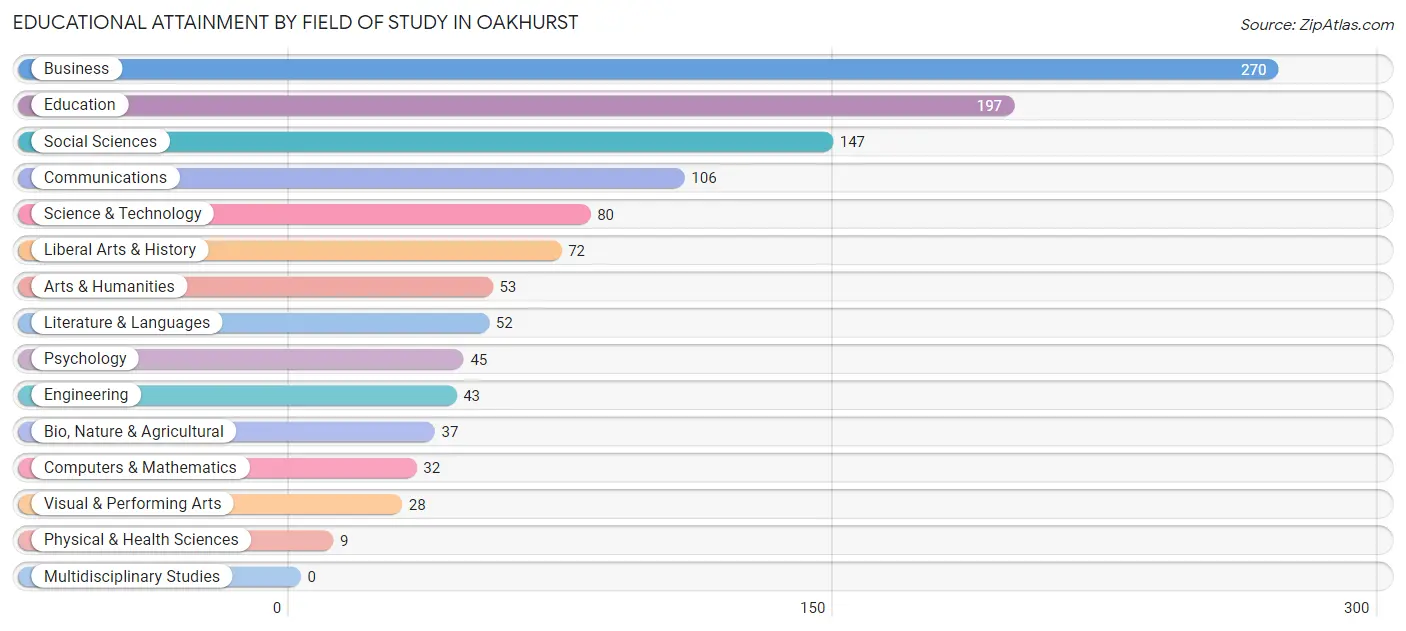
| Field of Study | # Graduates | % Graduates |
| Computers & Mathematics | 32 | 2.7% |
| Bio, Nature & Agricultural | 37 | 3.2% |
| Physical & Health Sciences | 9 | 0.8% |
| Psychology | 45 | 3.8% |
| Social Sciences | 147 | 12.6% |
| Engineering | 43 | 3.7% |
| Multidisciplinary Studies | 0 | 0.0% |
| Science & Technology | 80 | 6.8% |
| Business | 270 | 23.1% |
| Education | 197 | 16.8% |
| Literature & Languages | 52 | 4.4% |
| Liberal Arts & History | 72 | 6.1% |
| Visual & Performing Arts | 28 | 2.4% |
| Communications | 106 | 9.0% |
| Arts & Humanities | 53 | 4.5% |
| Total | 1,171 | 100.0% |
Transportation & Commute in Oakhurst
Vehicle Availability by Sex in Oakhurst
The most prevalent vehicle ownership categories in Oakhurst are males with 2 vehicles (459, accounting for 49.0%) and females with 2 vehicles (351, making up 60.2%).
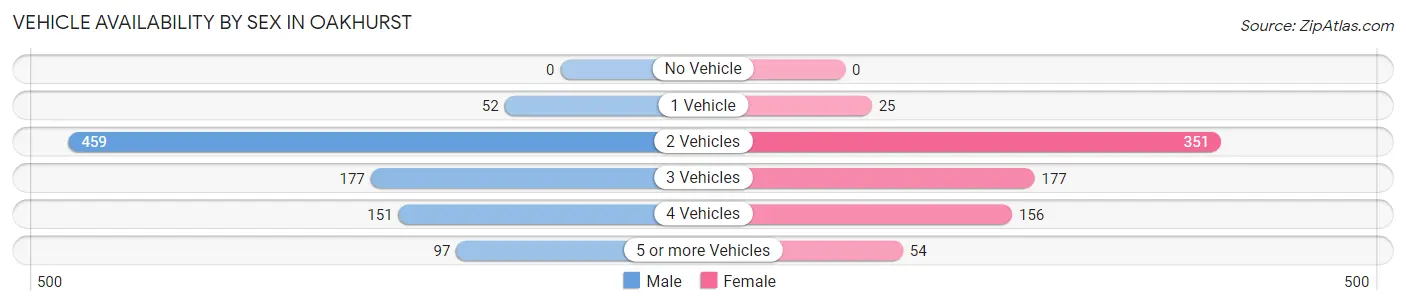
| Vehicles Available | Male | Female |
| No Vehicle | 0 (0.0%) | 0 (0.0%) |
| 1 Vehicle | 52 (5.6%) | 25 (3.3%) |
| 2 Vehicles | 459 (49.0%) | 351 (46.0%) |
| 3 Vehicles | 177 (18.9%) | 177 (23.2%) |
| 4 Vehicles | 151 (16.1%) | 156 (20.4%) |
| 5 or more Vehicles | 97 (10.4%) | 54 (7.1%) |
| Total | 936 (100.0%) | 763 (100.0%) |
Commute Time in Oakhurst
The most frequently occuring commute durations in Oakhurst are 10 to 14 minutes (312 commuters, 20.9%), 15 to 19 minutes (267 commuters, 17.9%), and 5 to 9 minutes (162 commuters, 10.9%).
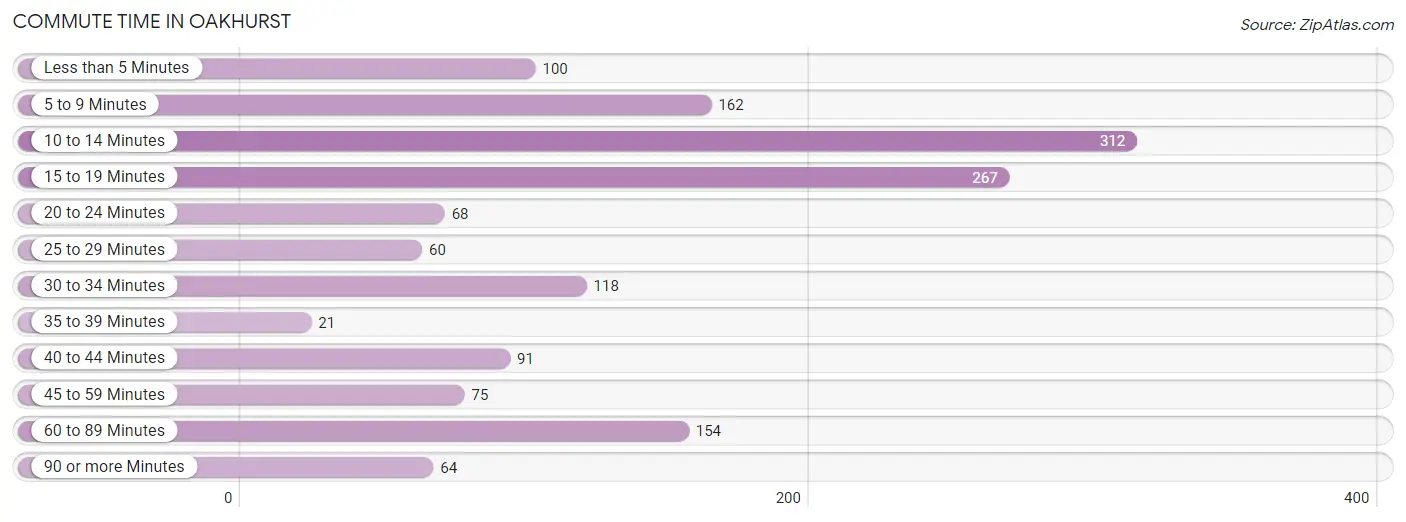
| Commute Time | # Commuters | % Commuters |
| Less than 5 Minutes | 100 | 6.7% |
| 5 to 9 Minutes | 162 | 10.9% |
| 10 to 14 Minutes | 312 | 20.9% |
| 15 to 19 Minutes | 267 | 17.9% |
| 20 to 24 Minutes | 68 | 4.6% |
| 25 to 29 Minutes | 60 | 4.0% |
| 30 to 34 Minutes | 118 | 7.9% |
| 35 to 39 Minutes | 21 | 1.4% |
| 40 to 44 Minutes | 91 | 6.1% |
| 45 to 59 Minutes | 75 | 5.0% |
| 60 to 89 Minutes | 154 | 10.3% |
| 90 or more Minutes | 64 | 4.3% |
Commute Time by Sex in Oakhurst
The most common commute times in Oakhurst are 10 to 14 minutes (139 commuters, 16.7%) for males and 10 to 14 minutes (173 commuters, 26.3%) for females.
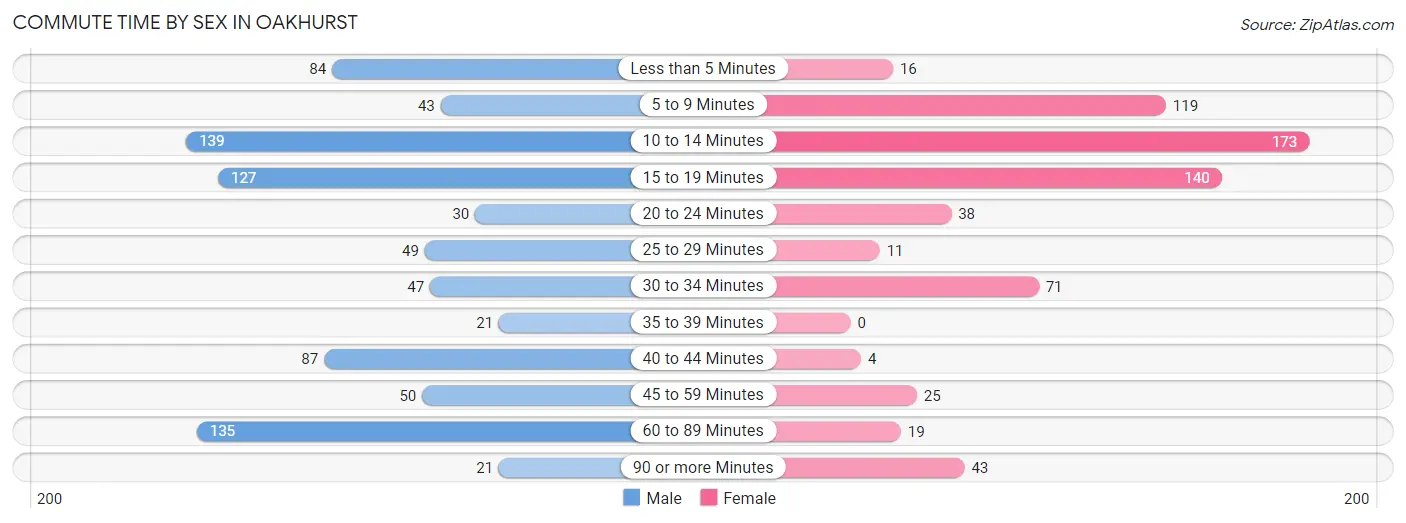
| Commute Time | Male | Female |
| Less than 5 Minutes | 84 (10.1%) | 16 (2.4%) |
| 5 to 9 Minutes | 43 (5.2%) | 119 (18.1%) |
| 10 to 14 Minutes | 139 (16.7%) | 173 (26.3%) |
| 15 to 19 Minutes | 127 (15.2%) | 140 (21.2%) |
| 20 to 24 Minutes | 30 (3.6%) | 38 (5.8%) |
| 25 to 29 Minutes | 49 (5.9%) | 11 (1.7%) |
| 30 to 34 Minutes | 47 (5.6%) | 71 (10.8%) |
| 35 to 39 Minutes | 21 (2.5%) | 0 (0.0%) |
| 40 to 44 Minutes | 87 (10.4%) | 4 (0.6%) |
| 45 to 59 Minutes | 50 (6.0%) | 25 (3.8%) |
| 60 to 89 Minutes | 135 (16.2%) | 19 (2.9%) |
| 90 or more Minutes | 21 (2.5%) | 43 (6.5%) |
Time of Departure to Work by Sex in Oakhurst
The most frequent times of departure to work in Oakhurst are 6:30 AM to 6:59 AM (157, 18.9%) for males and 8:30 AM to 8:59 AM (141, 21.4%) for females.
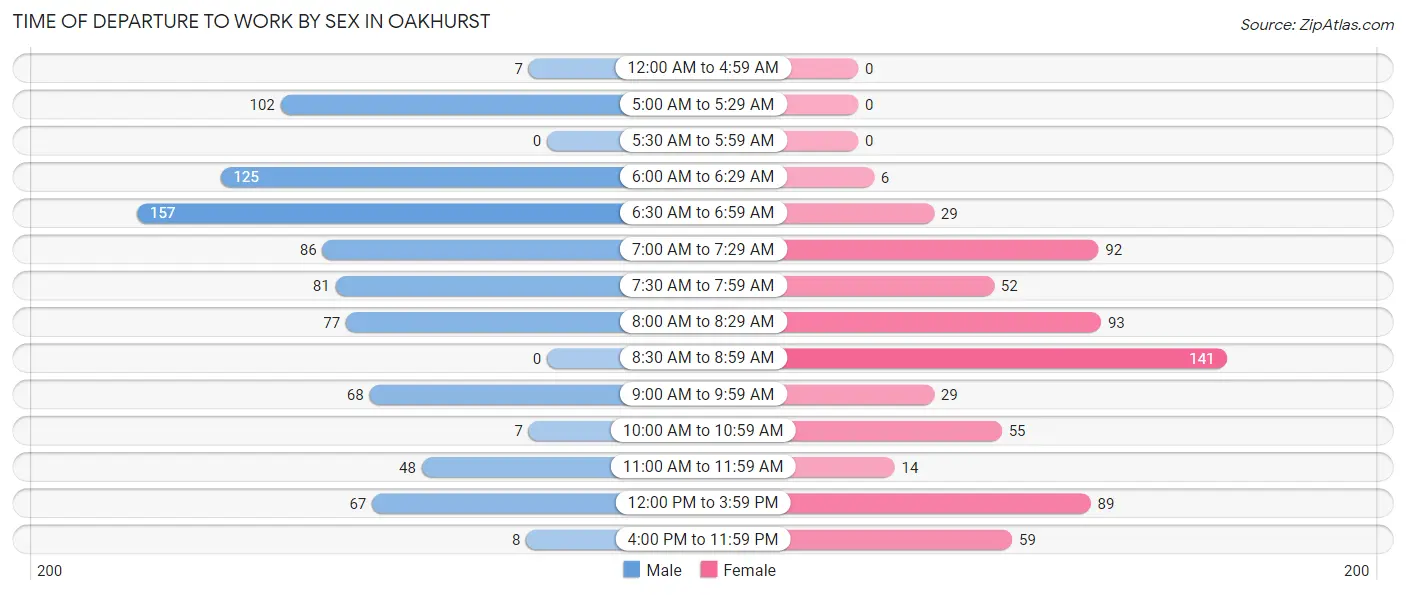
| Time of Departure | Male | Female |
| 12:00 AM to 4:59 AM | 7 (0.8%) | 0 (0.0%) |
| 5:00 AM to 5:29 AM | 102 (12.2%) | 0 (0.0%) |
| 5:30 AM to 5:59 AM | 0 (0.0%) | 0 (0.0%) |
| 6:00 AM to 6:29 AM | 125 (15.0%) | 6 (0.9%) |
| 6:30 AM to 6:59 AM | 157 (18.9%) | 29 (4.4%) |
| 7:00 AM to 7:29 AM | 86 (10.3%) | 92 (14.0%) |
| 7:30 AM to 7:59 AM | 81 (9.7%) | 52 (7.9%) |
| 8:00 AM to 8:29 AM | 77 (9.2%) | 93 (14.1%) |
| 8:30 AM to 8:59 AM | 0 (0.0%) | 141 (21.4%) |
| 9:00 AM to 9:59 AM | 68 (8.2%) | 29 (4.4%) |
| 10:00 AM to 10:59 AM | 7 (0.8%) | 55 (8.4%) |
| 11:00 AM to 11:59 AM | 48 (5.8%) | 14 (2.1%) |
| 12:00 PM to 3:59 PM | 67 (8.0%) | 89 (13.5%) |
| 4:00 PM to 11:59 PM | 8 (1.0%) | 59 (8.9%) |
| Total | 833 (100.0%) | 659 (100.0%) |
Housing Occupancy in Oakhurst
Occupancy by Ownership in Oakhurst
Of the total 1,224 dwellings in Oakhurst, owner-occupied units account for 1,062 (86.8%), while renter-occupied units make up 162 (13.2%).
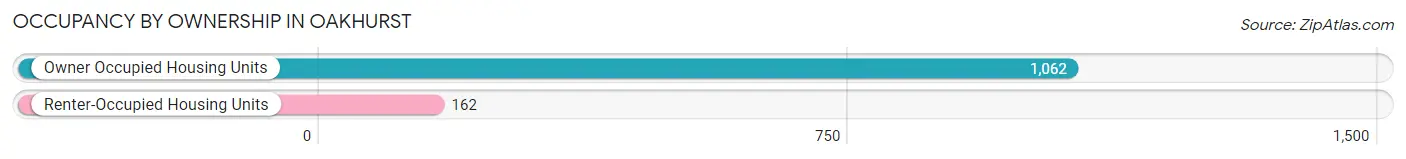
| Occupancy | # Housing Units | % Housing Units |
| Owner Occupied Housing Units | 1,062 | 86.8% |
| Renter-Occupied Housing Units | 162 | 13.2% |
| Total Occupied Housing Units | 1,224 | 100.0% |
Occupancy by Household Size in Oakhurst
| Household Size | # Housing Units | % Housing Units |
| 1-Person Household | 164 | 13.4% |
| 2-Person Household | 406 | 33.2% |
| 3-Person Household | 169 | 13.8% |
| 4+ Person Household | 485 | 39.6% |
| Total Housing Units | 1,224 | 100.0% |
Occupancy by Ownership by Household Size in Oakhurst
| Household Size | Owner-occupied | Renter-occupied |
| 1-Person Household | 153 (93.3%) | 11 (6.7%) |
| 2-Person Household | 406 (100.0%) | 0 (0.0%) |
| 3-Person Household | 169 (100.0%) | 0 (0.0%) |
| 4+ Person Household | 334 (68.9%) | 151 (31.1%) |
| Total Housing Units | 1,062 (86.8%) | 162 (13.2%) |
Occupancy by Educational Attainment in Oakhurst
| Household Size | Owner-occupied | Renter-occupied |
| Less than High School | 21 (100.0%) | 0 (0.0%) |
| High School Diploma | 216 (79.1%) | 57 (20.9%) |
| College/Associate Degree | 372 (100.0%) | 0 (0.0%) |
| Bachelor's Degree or higher | 453 (81.2%) | 105 (18.8%) |
Occupancy by Age of Householder in Oakhurst
| Age Bracket | # Households | % Households |
| Under 35 Years | 152 | 12.4% |
| 35 to 44 Years | 176 | 14.4% |
| 45 to 54 Years | 239 | 19.5% |
| 55 to 64 Years | 283 | 23.1% |
| 65 to 74 Years | 209 | 17.1% |
| 75 to 84 Years | 156 | 12.8% |
| 85 Years and Over | 9 | 0.7% |
| Total | 1,224 | 100.0% |
Housing Finances in Oakhurst
Median Income by Occupancy in Oakhurst
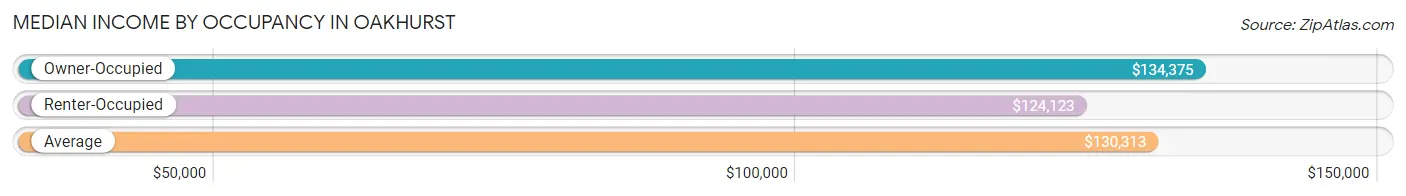
| Occupancy Type | # Households | Median Income |
| Owner-Occupied | 1,062 (86.8%) | $134,375 |
| Renter-Occupied | 162 (13.2%) | $124,123 |
| Average | 1,224 (100.0%) | $130,313 |
Occupancy by Householder Income Bracket in Oakhurst
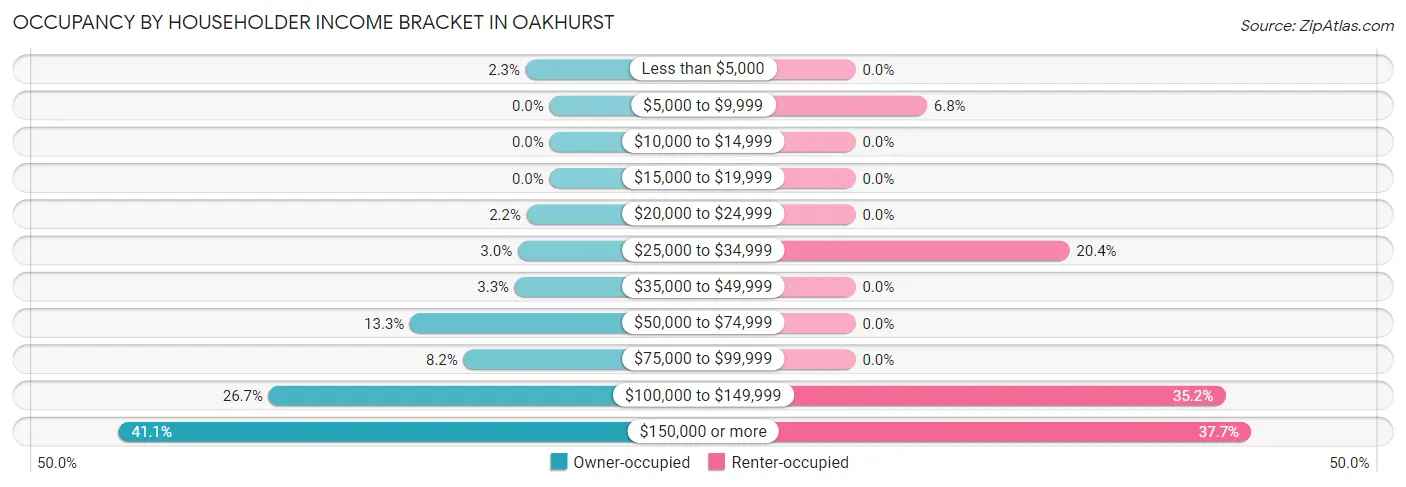
| Income Bracket | Owner-occupied | Renter-occupied |
| Less than $5,000 | 24 (2.3%) | 0 (0.0%) |
| $5,000 to $9,999 | 0 (0.0%) | 11 (6.8%) |
| $10,000 to $14,999 | 0 (0.0%) | 0 (0.0%) |
| $15,000 to $19,999 | 0 (0.0%) | 0 (0.0%) |
| $20,000 to $24,999 | 23 (2.2%) | 0 (0.0%) |
| $25,000 to $34,999 | 32 (3.0%) | 33 (20.4%) |
| $35,000 to $49,999 | 35 (3.3%) | 0 (0.0%) |
| $50,000 to $74,999 | 141 (13.3%) | 0 (0.0%) |
| $75,000 to $99,999 | 87 (8.2%) | 0 (0.0%) |
| $100,000 to $149,999 | 284 (26.7%) | 57 (35.2%) |
| $150,000 or more | 436 (41.0%) | 61 (37.7%) |
| Total | 1,062 (100.0%) | 162 (100.0%) |
Monthly Housing Cost Tiers in Oakhurst
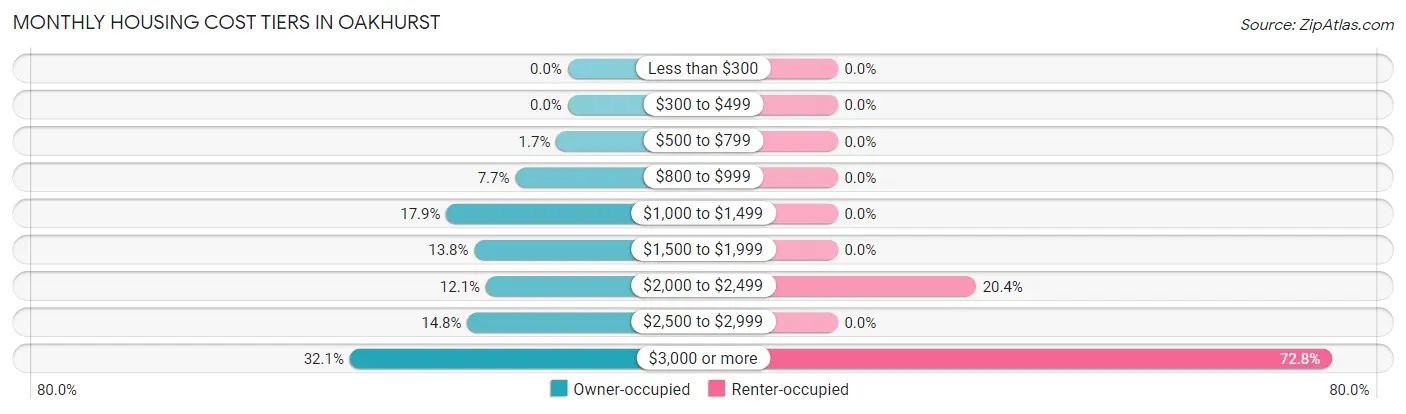
| Monthly Cost | Owner-occupied | Renter-occupied |
| Less than $300 | 0 (0.0%) | 0 (0.0%) |
| $300 to $499 | 0 (0.0%) | 0 (0.0%) |
| $500 to $799 | 18 (1.7%) | 0 (0.0%) |
| $800 to $999 | 82 (7.7%) | 0 (0.0%) |
| $1,000 to $1,499 | 190 (17.9%) | 0 (0.0%) |
| $1,500 to $1,999 | 146 (13.8%) | 0 (0.0%) |
| $2,000 to $2,499 | 128 (12.0%) | 33 (20.4%) |
| $2,500 to $2,999 | 157 (14.8%) | 0 (0.0%) |
| $3,000 or more | 341 (32.1%) | 118 (72.8%) |
| Total | 1,062 (100.0%) | 162 (100.0%) |
Physical Housing Characteristics in Oakhurst
Housing Structures in Oakhurst
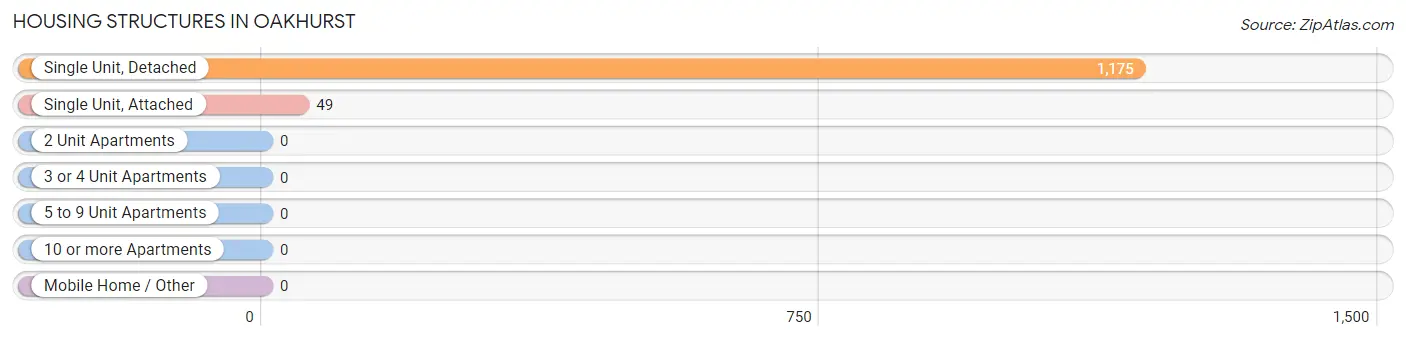
| Structure Type | # Housing Units | % Housing Units |
| Single Unit, Detached | 1,175 | 96.0% |
| Single Unit, Attached | 49 | 4.0% |
| 2 Unit Apartments | 0 | 0.0% |
| 3 or 4 Unit Apartments | 0 | 0.0% |
| 5 to 9 Unit Apartments | 0 | 0.0% |
| 10 or more Apartments | 0 | 0.0% |
| Mobile Home / Other | 0 | 0.0% |
| Total | 1,224 | 100.0% |
Housing Structures by Occupancy in Oakhurst
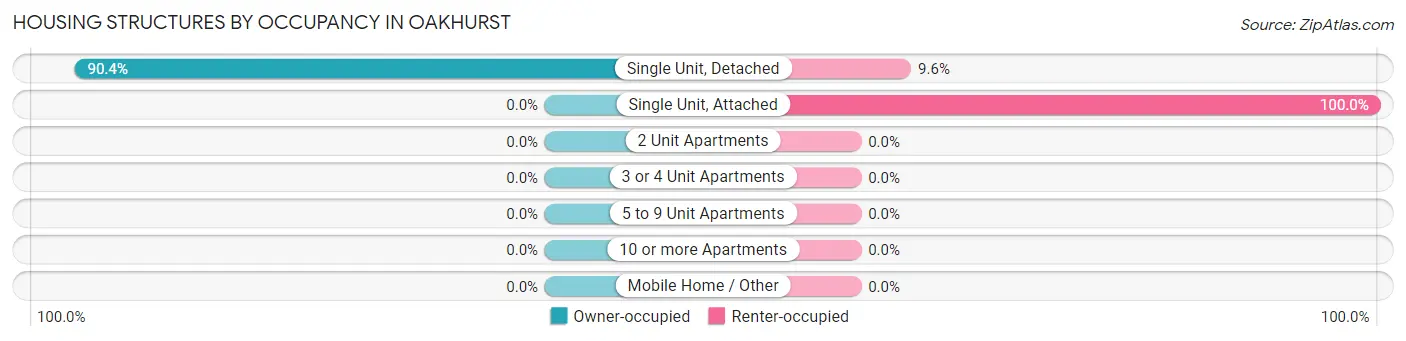
| Structure Type | Owner-occupied | Renter-occupied |
| Single Unit, Detached | 1,062 (90.4%) | 113 (9.6%) |
| Single Unit, Attached | 0 (0.0%) | 49 (100.0%) |
| 2 Unit Apartments | 0 (0.0%) | 0 (0.0%) |
| 3 or 4 Unit Apartments | 0 (0.0%) | 0 (0.0%) |
| 5 to 9 Unit Apartments | 0 (0.0%) | 0 (0.0%) |
| 10 or more Apartments | 0 (0.0%) | 0 (0.0%) |
| Mobile Home / Other | 0 (0.0%) | 0 (0.0%) |
| Total | 1,062 (86.8%) | 162 (13.2%) |
Housing Structures by Number of Rooms in Oakhurst
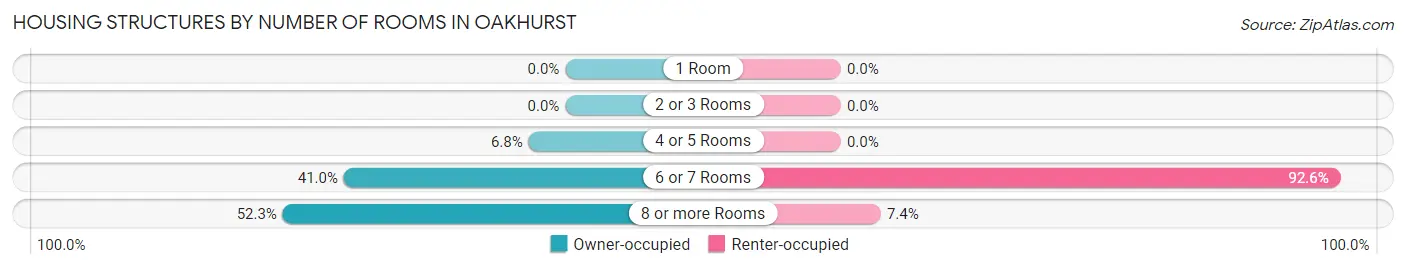
| Number of Rooms | Owner-occupied | Renter-occupied |
| 1 Room | 0 (0.0%) | 0 (0.0%) |
| 2 or 3 Rooms | 0 (0.0%) | 0 (0.0%) |
| 4 or 5 Rooms | 72 (6.8%) | 0 (0.0%) |
| 6 or 7 Rooms | 435 (41.0%) | 150 (92.6%) |
| 8 or more Rooms | 555 (52.3%) | 12 (7.4%) |
| Total | 1,062 (100.0%) | 162 (100.0%) |
Housing Structure by Heating Type in Oakhurst

| Heating Type | Owner-occupied | Renter-occupied |
| Utility Gas | 967 (91.0%) | 162 (100.0%) |
| Bottled, Tank, or LP Gas | 0 (0.0%) | 0 (0.0%) |
| Electricity | 32 (3.0%) | 0 (0.0%) |
| Fuel Oil or Kerosene | 63 (5.9%) | 0 (0.0%) |
| Coal or Coke | 0 (0.0%) | 0 (0.0%) |
| All other Fuels | 0 (0.0%) | 0 (0.0%) |
| No Fuel Used | 0 (0.0%) | 0 (0.0%) |
| Total | 1,062 (100.0%) | 162 (100.0%) |
Household Vehicle Usage in Oakhurst
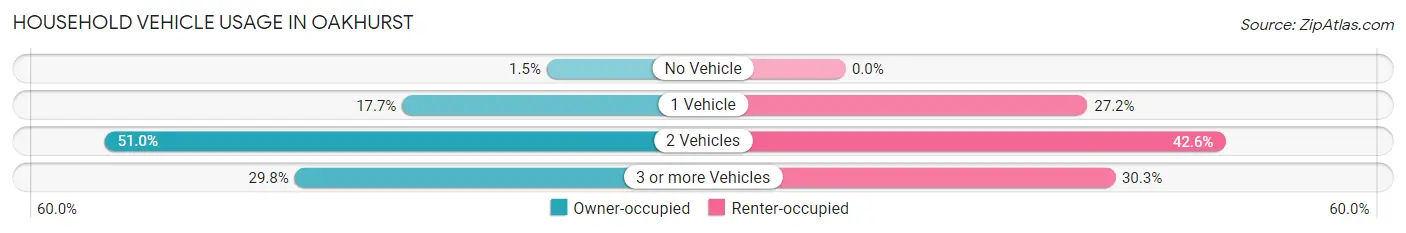
| Vehicles per Household | Owner-occupied | Renter-occupied |
| No Vehicle | 16 (1.5%) | 0 (0.0%) |
| 1 Vehicle | 188 (17.7%) | 44 (27.2%) |
| 2 Vehicles | 542 (51.0%) | 69 (42.6%) |
| 3 or more Vehicles | 316 (29.8%) | 49 (30.2%) |
| Total | 1,062 (100.0%) | 162 (100.0%) |
Real Estate & Mortgages in Oakhurst
Real Estate and Mortgage Overview in Oakhurst
| Characteristic | Without Mortgage | With Mortgage |
| Housing Units | 372 | 690 |
| Median Property Value | $562,500 | $592,400 |
| Median Household Income | $82,813 | $363 |
| Monthly Housing Costs | $1,098 | $326 |
| Real Estate Taxes | $9,571 | $0 |
Property Value by Mortgage Status in Oakhurst
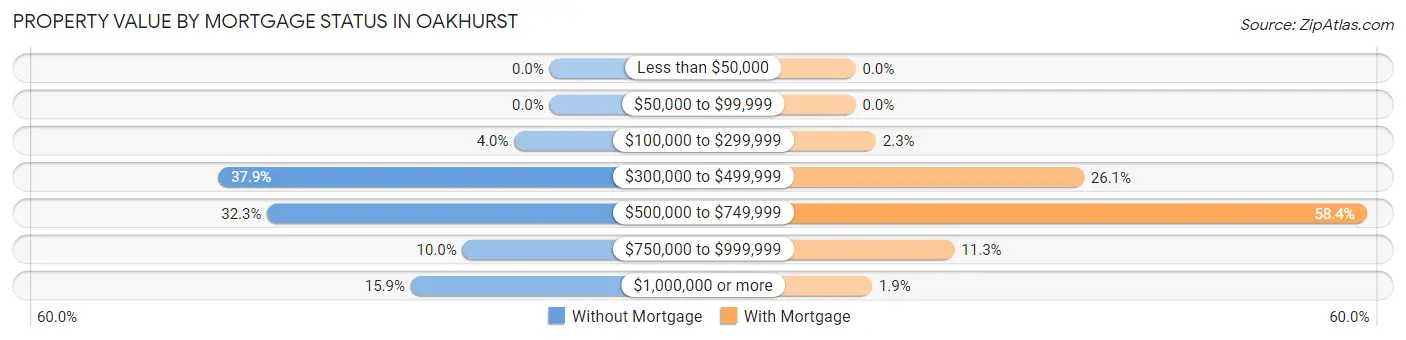
| Property Value | Without Mortgage | With Mortgage |
| Less than $50,000 | 0 (0.0%) | 0 (0.0%) |
| $50,000 to $99,999 | 0 (0.0%) | 0 (0.0%) |
| $100,000 to $299,999 | 15 (4.0%) | 16 (2.3%) |
| $300,000 to $499,999 | 141 (37.9%) | 180 (26.1%) |
| $500,000 to $749,999 | 120 (32.3%) | 403 (58.4%) |
| $750,000 to $999,999 | 37 (10.0%) | 78 (11.3%) |
| $1,000,000 or more | 59 (15.9%) | 13 (1.9%) |
| Total | 372 (100.0%) | 690 (100.0%) |
Household Income by Mortgage Status in Oakhurst
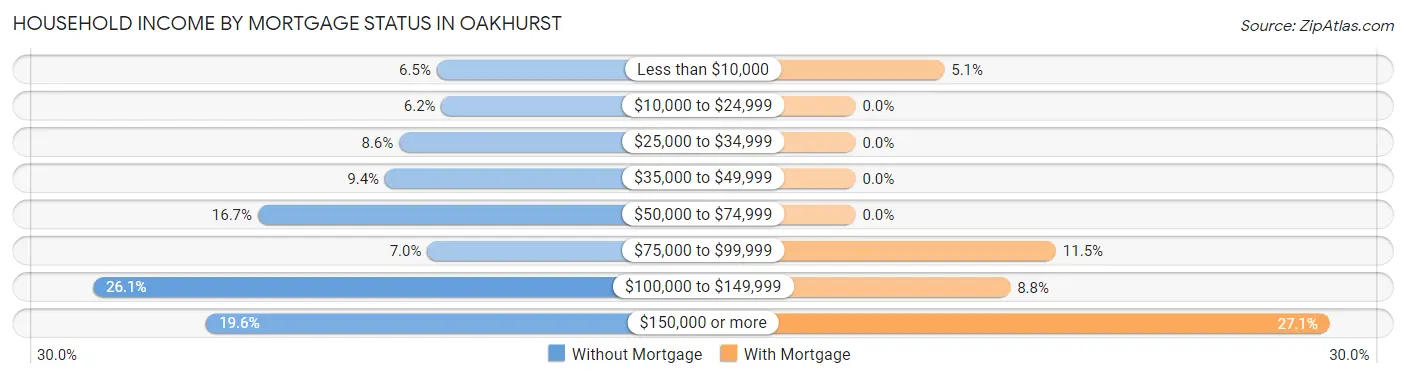
| Household Income | Without Mortgage | With Mortgage |
| Less than $10,000 | 24 (6.5%) | 35 (5.1%) |
| $10,000 to $24,999 | 23 (6.2%) | 0 (0.0%) |
| $25,000 to $34,999 | 32 (8.6%) | 0 (0.0%) |
| $35,000 to $49,999 | 35 (9.4%) | 0 (0.0%) |
| $50,000 to $74,999 | 62 (16.7%) | 0 (0.0%) |
| $75,000 to $99,999 | 26 (7.0%) | 79 (11.5%) |
| $100,000 to $149,999 | 97 (26.1%) | 61 (8.8%) |
| $150,000 or more | 73 (19.6%) | 187 (27.1%) |
| Total | 372 (100.0%) | 690 (100.0%) |
Property Value to Household Income Ratio in Oakhurst
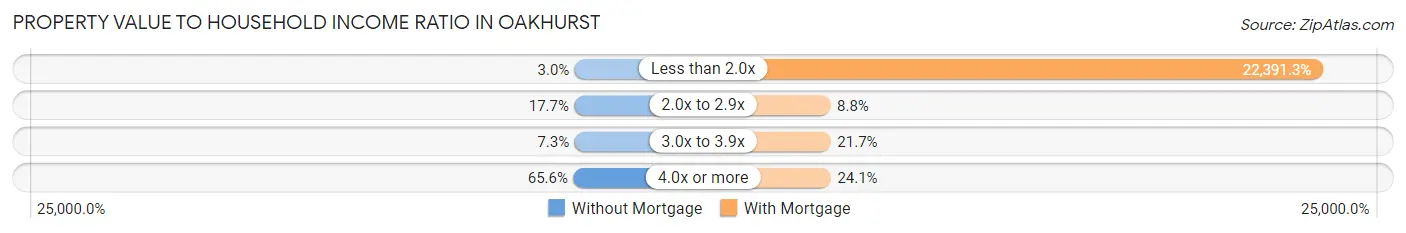
| Value-to-Income Ratio | Without Mortgage | With Mortgage |
| Less than 2.0x | 11 (3.0%) | 154,500 (22,391.3%) |
| 2.0x to 2.9x | 66 (17.7%) | 61 (8.8%) |
| 3.0x to 3.9x | 27 (7.3%) | 150 (21.7%) |
| 4.0x or more | 244 (65.6%) | 166 (24.1%) |
| Total | 372 (100.0%) | 690 (100.0%) |
Real Estate Taxes by Mortgage Status in Oakhurst
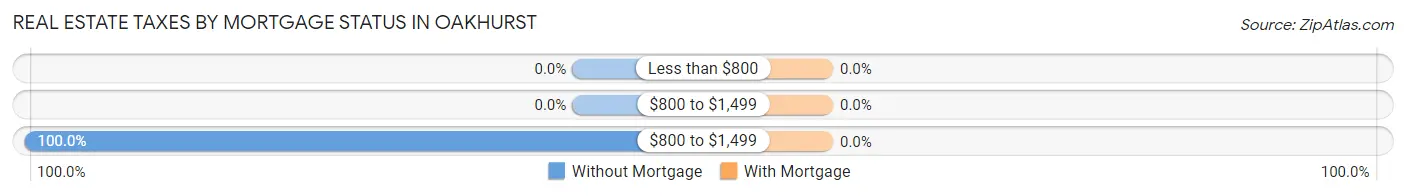
| Property Taxes | Without Mortgage | With Mortgage |
| Less than $800 | 0 (0.0%) | 0 (0.0%) |
| $800 to $1,499 | 0 (0.0%) | 0 (0.0%) |
| $800 to $1,499 | 372 (100.0%) | 0 (0.0%) |
| Total | 372 (100.0%) | 690 (100.0%) |
Health & Disability in Oakhurst
Health Insurance Coverage by Age in Oakhurst
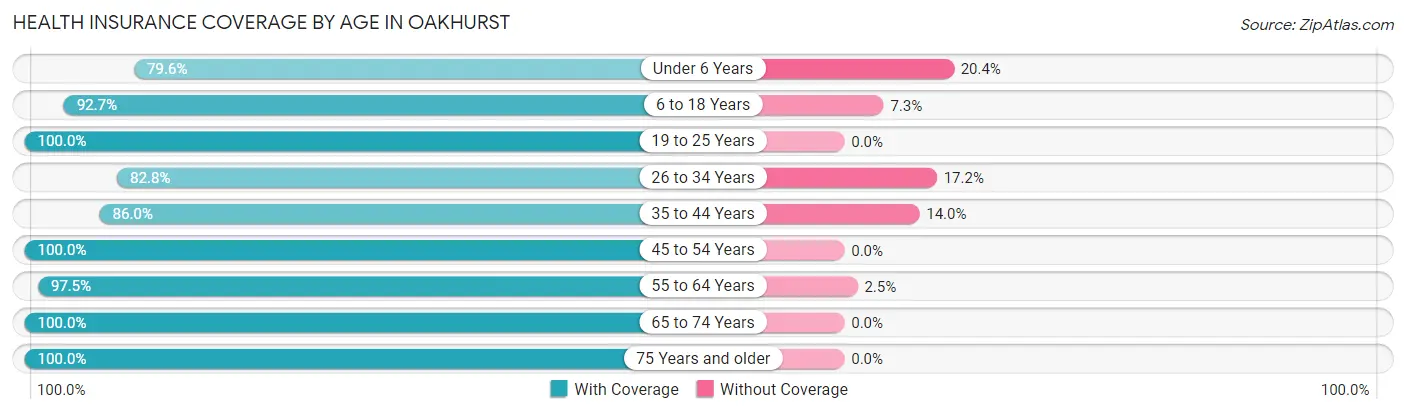
| Age Bracket | With Coverage | Without Coverage |
| Under 6 Years | 394 (79.6%) | 101 (20.4%) |
| 6 to 18 Years | 584 (92.7%) | 46 (7.3%) |
| 19 to 25 Years | 329 (100.0%) | 0 (0.0%) |
| 26 to 34 Years | 312 (82.8%) | 65 (17.2%) |
| 35 to 44 Years | 369 (86.0%) | 60 (14.0%) |
| 45 to 54 Years | 401 (100.0%) | 0 (0.0%) |
| 55 to 64 Years | 555 (97.5%) | 14 (2.5%) |
| 65 to 74 Years | 388 (100.0%) | 0 (0.0%) |
| 75 Years and older | 294 (100.0%) | 0 (0.0%) |
| Total | 3,626 (92.7%) | 286 (7.3%) |
Health Insurance Coverage by Citizenship Status in Oakhurst
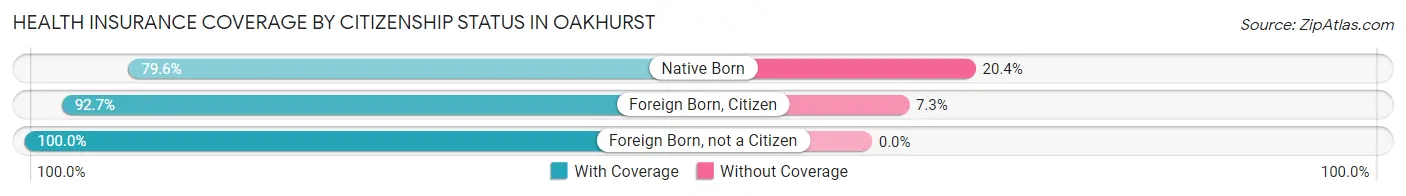
| Citizenship Status | With Coverage | Without Coverage |
| Native Born | 394 (79.6%) | 101 (20.4%) |
| Foreign Born, Citizen | 584 (92.7%) | 46 (7.3%) |
| Foreign Born, not a Citizen | 329 (100.0%) | 0 (0.0%) |
Health Insurance Coverage by Household Income in Oakhurst
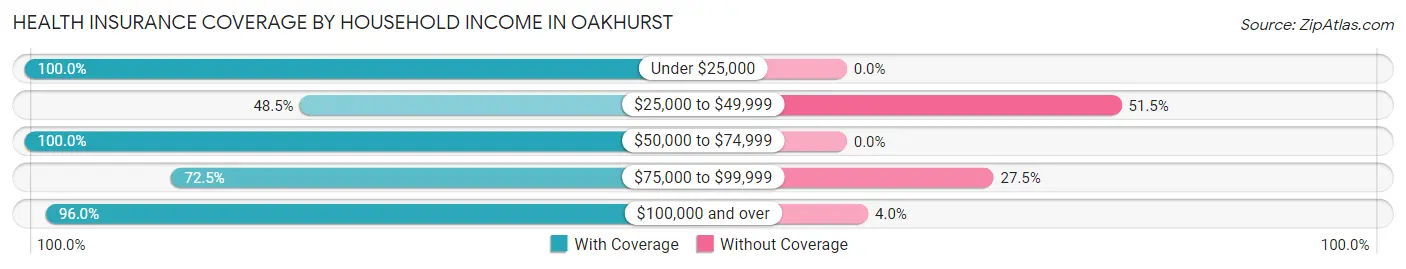
| Household Income | With Coverage | Without Coverage |
| Under $25,000 | 58 (100.0%) | 0 (0.0%) |
| $25,000 to $49,999 | 98 (48.5%) | 104 (51.5%) |
| $50,000 to $74,999 | 435 (100.0%) | 0 (0.0%) |
| $75,000 to $99,999 | 166 (72.5%) | 63 (27.5%) |
| $100,000 and over | 2,864 (96.0%) | 119 (4.0%) |
Public vs Private Health Insurance Coverage by Age in Oakhurst

| Age Bracket | Public Insurance | Private Insurance |
| Under 6 | 250 (50.5%) | 194 (39.2%) |
| 6 to 18 Years | 208 (33.0%) | 445 (70.6%) |
| 19 to 25 Years | 1 (0.3%) | 328 (99.7%) |
| 25 to 34 Years | 97 (25.7%) | 311 (82.5%) |
| 35 to 44 Years | 136 (31.7%) | 276 (64.3%) |
| 45 to 54 Years | 13 (3.2%) | 388 (96.8%) |
| 55 to 64 Years | 46 (8.1%) | 532 (93.5%) |
| 65 to 74 Years | 363 (93.6%) | 275 (70.9%) |
| 75 Years and over | 294 (100.0%) | 216 (73.5%) |
| Total | 1,408 (36.0%) | 2,965 (75.8%) |
Disability Status by Sex by Age in Oakhurst
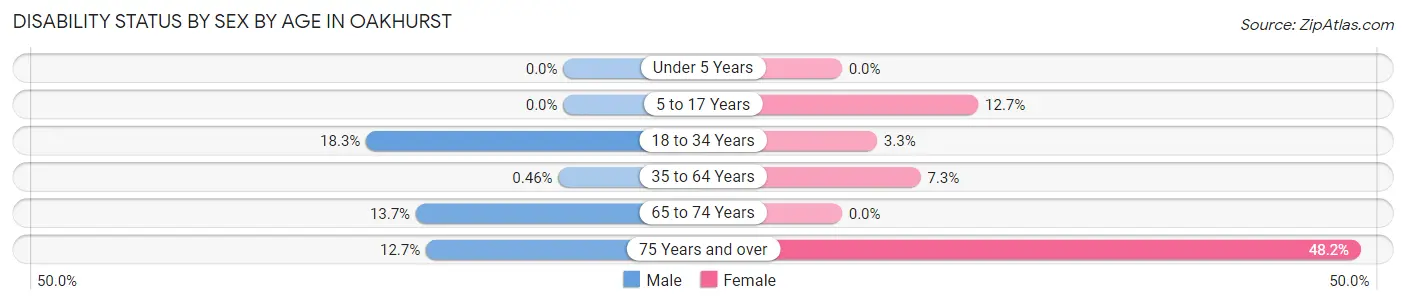
| Age Bracket | Male | Female |
| Under 5 Years | 0 (0.0%) | 0 (0.0%) |
| 5 to 17 Years | 0 (0.0%) | 53 (12.7%) |
| 18 to 34 Years | 69 (18.3%) | 11 (3.3%) |
| 35 to 64 Years | 3 (0.5%) | 54 (7.3%) |
| 65 to 74 Years | 26 (13.7%) | 0 (0.0%) |
| 75 Years and over | 20 (12.7%) | 66 (48.2%) |
Disability Class by Sex by Age in Oakhurst
Disability Class: Hearing Difficulty
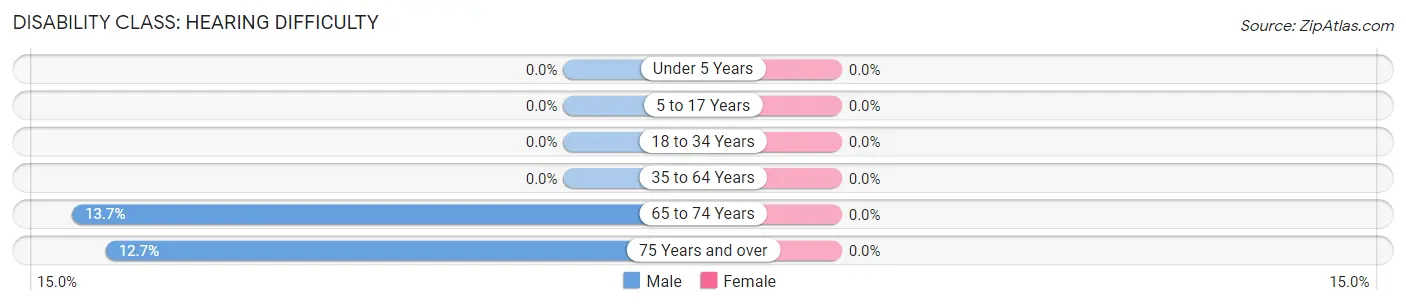
| Age Bracket | Male | Female |
| Under 5 Years | 0 (0.0%) | 0 (0.0%) |
| 5 to 17 Years | 0 (0.0%) | 0 (0.0%) |
| 18 to 34 Years | 0 (0.0%) | 0 (0.0%) |
| 35 to 64 Years | 0 (0.0%) | 0 (0.0%) |
| 65 to 74 Years | 26 (13.7%) | 0 (0.0%) |
| 75 Years and over | 20 (12.7%) | 0 (0.0%) |
Disability Class: Vision Difficulty
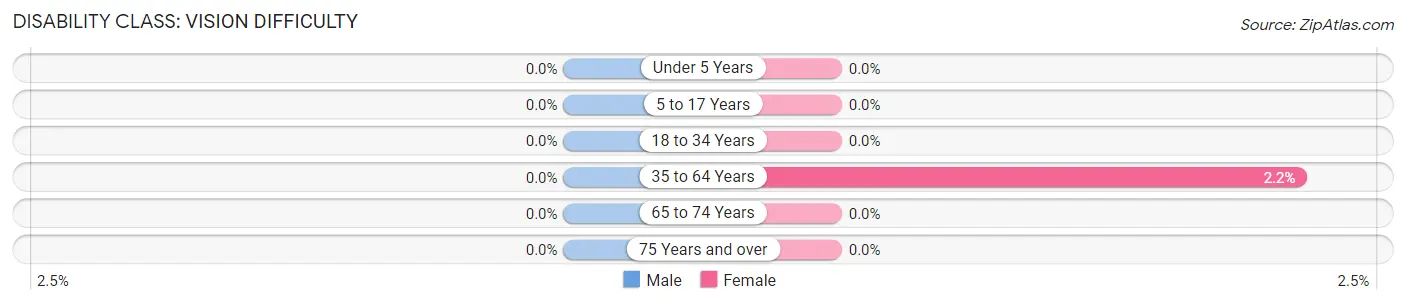
| Age Bracket | Male | Female |
| Under 5 Years | 0 (0.0%) | 0 (0.0%) |
| 5 to 17 Years | 0 (0.0%) | 0 (0.0%) |
| 18 to 34 Years | 0 (0.0%) | 0 (0.0%) |
| 35 to 64 Years | 0 (0.0%) | 16 (2.2%) |
| 65 to 74 Years | 0 (0.0%) | 0 (0.0%) |
| 75 Years and over | 0 (0.0%) | 0 (0.0%) |
Disability Class: Cognitive Difficulty
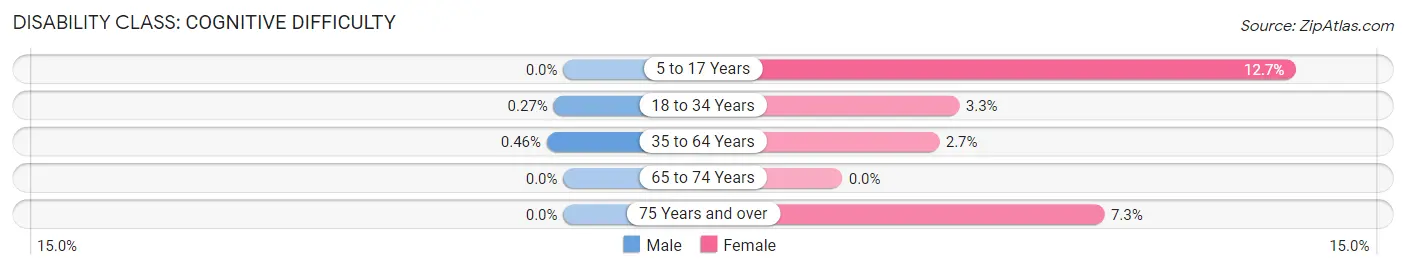
| Age Bracket | Male | Female |
| 5 to 17 Years | 0 (0.0%) | 53 (12.7%) |
| 18 to 34 Years | 1 (0.3%) | 11 (3.3%) |
| 35 to 64 Years | 3 (0.5%) | 20 (2.7%) |
| 65 to 74 Years | 0 (0.0%) | 0 (0.0%) |
| 75 Years and over | 0 (0.0%) | 10 (7.3%) |
Disability Class: Ambulatory Difficulty

| Age Bracket | Male | Female |
| 5 to 17 Years | 0 (0.0%) | 0 (0.0%) |
| 18 to 34 Years | 1 (0.3%) | 0 (0.0%) |
| 35 to 64 Years | 0 (0.0%) | 28 (3.8%) |
| 65 to 74 Years | 16 (8.4%) | 0 (0.0%) |
| 75 Years and over | 9 (5.7%) | 56 (40.9%) |
Disability Class: Self-Care Difficulty
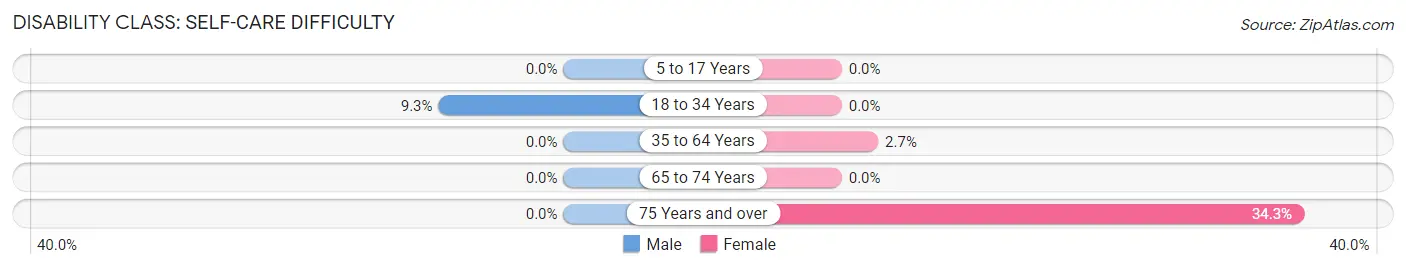
| Age Bracket | Male | Female |
| 5 to 17 Years | 0 (0.0%) | 0 (0.0%) |
| 18 to 34 Years | 35 (9.3%) | 0 (0.0%) |
| 35 to 64 Years | 0 (0.0%) | 20 (2.7%) |
| 65 to 74 Years | 0 (0.0%) | 0 (0.0%) |
| 75 Years and over | 0 (0.0%) | 47 (34.3%) |
Technology Access in Oakhurst
Computing Device Access in Oakhurst
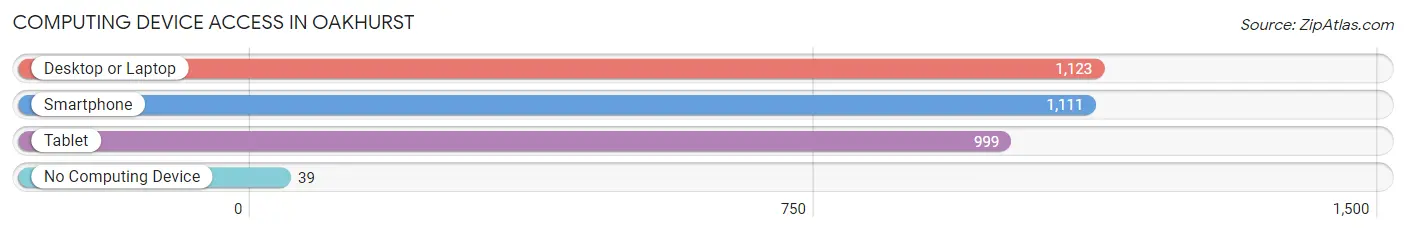
| Device Type | # Households | % Households |
| Desktop or Laptop | 1,123 | 91.7% |
| Smartphone | 1,111 | 90.8% |
| Tablet | 999 | 81.6% |
| No Computing Device | 39 | 3.2% |
| Total | 1,224 | 100.0% |
Internet Access in Oakhurst
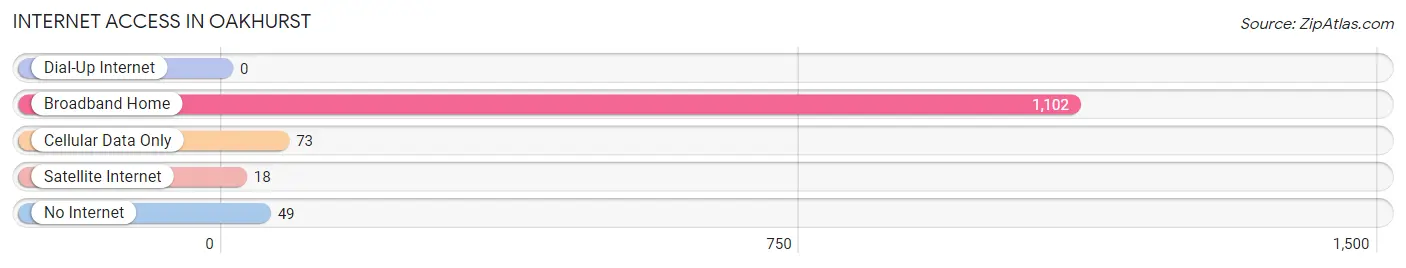
| Internet Type | # Households | % Households |
| Dial-Up Internet | 0 | 0.0% |
| Broadband Home | 1,102 | 90.0% |
| Cellular Data Only | 73 | 6.0% |
| Satellite Internet | 18 | 1.5% |
| No Internet | 49 | 4.0% |
| Total | 1,224 | 100.0% |
Oakhurst Summary
Oakhurst is a small unincorporated community located in Monmouth County, New Jersey. It is situated in the northern part of the county, just south of the borough of Ocean Township. The community is bordered by the townships of Wall, Neptune, and Tinton Falls. Oakhurst is a small, rural community with a population of approximately 4,000 people.
History
Oakhurst was originally part of the Township of Ocean, which was established in 1849. The area was first settled in the late 1700s by a group of German immigrants. The community was originally known as “Oakhurst” due to the abundance of oak trees in the area. The name was officially adopted in 1875 when the post office was established.
In the late 1800s, Oakhurst was a thriving agricultural community. The area was known for its dairy farms and apple orchards. The community also had a number of small businesses, including a general store, a blacksmith shop, and a sawmill.
In the early 1900s, Oakhurst began to experience a period of growth and development. The area was served by the Central Railroad of New Jersey, which provided access to the larger cities of New York and Philadelphia. This allowed the community to become a popular summer destination for city dwellers.
In the 1950s, Oakhurst began to experience a period of decline. The railroad was abandoned and the local businesses began to close. The population of the community began to decline as well.
Geography
Oakhurst is located in northern Monmouth County, New Jersey. It is situated in the northern part of the county, just south of the borough of Ocean Township. The community is bordered by the townships of Wall, Neptune, and Tinton Falls.
The area is mostly flat, with some rolling hills. The soil is mostly sandy and loamy. The climate is humid subtropical, with hot, humid summers and cold, wet winters.
Economy
Oakhurst is a small, rural community with a population of approximately 4,000 people. The economy of the community is largely based on agriculture and tourism.
Agriculture is the main industry in Oakhurst. The area is known for its dairy farms and apple orchards. The community also has a number of small businesses, including a general store, a blacksmith shop, and a sawmill.
Tourism is also an important part of the economy. The area is a popular summer destination for city dwellers. The community is home to a number of attractions, including the Monmouth County Park System, the Monmouth County Historical Society, and the Monmouth County Library.
Demographics
As of the 2010 census, the population of Oakhurst was 4,039. The racial makeup of the community was 87.3% White, 5.3% African American, 0.7% Native American, 1.2% Asian, and 4.5% from other races. Hispanic or Latino of any race were 8.2% of the population.
The median household income in Oakhurst was $68,958, and the median family income was $76,958. The per capita income was $30,958. About 4.3% of families and 5.7% of the population were below the poverty line.
Conclusion
Oakhurst is a small, rural community located in Monmouth County, New Jersey. It is situated in the northern part of the county, just south of the borough of Ocean Township. The community is bordered by the townships of Wall, Neptune, and Tinton Falls. Oakhurst is a small, rural community with a population of approximately 4,000 people. The economy of the community is largely based on agriculture and tourism. The area is known for its dairy farms and apple orchards, and is a popular summer destination for city dwellers. The racial makeup of the community is mostly White, with a small percentage of African American, Native American, Asian, and other races. The median household income in Oakhurst was $68,958, and the median family income was $76,958.
Common Questions
What is Per Capita Income in Oakhurst?
Per Capita income in Oakhurst is $47,709.
What is the Median Family Income in Oakhurst?
Median Family Income in Oakhurst is $133,594.
What is the Median Household income in Oakhurst?
Median Household Income in Oakhurst is $130,313.
What is Income or Wage Gap in Oakhurst?
Income or Wage Gap in Oakhurst is 31.7%.
Women in Oakhurst earn 68.3 cents for every dollar earned by a man.
What is Inequality or Gini Index in Oakhurst?
Inequality or Gini Index in Oakhurst is 0.36.
What is the Total Population of Oakhurst?
Total Population of Oakhurst is 3,912.
What is the Total Male Population of Oakhurst?
Total Male Population of Oakhurst is 1,876.
What is the Total Female Population of Oakhurst?
Total Female Population of Oakhurst is 2,036.
What is the Ratio of Males per 100 Females in Oakhurst?
There are 92.14 Males per 100 Females in Oakhurst.
What is the Ratio of Females per 100 Males in Oakhurst?
There are 108.53 Females per 100 Males in Oakhurst.
What is the Median Population Age in Oakhurst?
Median Population Age in Oakhurst is 37.0 Years.
What is the Average Family Size in Oakhurst
Average Family Size in Oakhurst is 3.3 People.
What is the Average Household Size in Oakhurst
Average Household Size in Oakhurst is 3.2 People.
How Large is the Labor Force in Oakhurst?
There are 1,862 People in the Labor Forcein in Oakhurst.
What is the Percentage of People in the Labor Force in Oakhurst?
63.6% of People are in the Labor Force in Oakhurst.
What is the Unemployment Rate in Oakhurst?
Unemployment Rate in Oakhurst is 6.8%.