Coldwater, MI Map & Demographics
Coldwater Map
Coldwater Overview
$22,254
PER CAPITA INCOME
$63,333
AVG FAMILY INCOME
$48,531
AVG HOUSEHOLD INCOME
2.4%
WAGE / INCOME GAP [ % ]
97.6¢/ $1
WAGE / INCOME GAP [ $ ]
0.41
INEQUALITY / GINI INDEX
13,704
TOTAL POPULATION
7,258
MALE POPULATION
6,446
FEMALE POPULATION
112.60
MALES / 100 FEMALES
88.81
FEMALES / 100 MALES
40.2
MEDIAN AGE
3.4
AVG FAMILY SIZE
2.6
AVG HOUSEHOLD SIZE
5,534
LABOR FORCE [ PEOPLE ]
49.9%
PERCENT IN LABOR FORCE
3.8%
UNEMPLOYMENT RATE
Coldwater Zip Codes
Coldwater Area Codes
Income in Coldwater
Income Overview in Coldwater
Per Capita Income in Coldwater is $22,254, while median incomes of families and households are $63,333 and $48,531 respectively.
| Characteristic | Number | Measure |
| Per Capita Income | 13,704 | $22,254 |
| Median Family Income | 2,630 | $63,333 |
| Mean Family Income | 2,630 | $73,686 |
| Median Household Income | 4,518 | $48,531 |
| Mean Household Income | 4,518 | $61,463 |
| Income Deficit | 2,630 | $0 |
| Wage / Income Gap (%) | 13,704 | 2.39% |
| Wage / Income Gap ($) | 13,704 | 97.61¢ per $1 |
| Gini / Inequality Index | 13,704 | 0.41 |
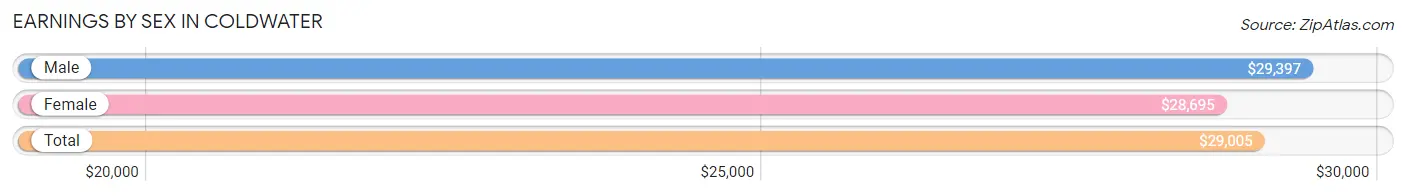
Earnings by Sex in Coldwater
Average Earnings in Coldwater are $29,005, $29,397 for men and $28,695 for women, a difference of 2.4%.
| Sex | Number | Average Earnings |
| Male | 3,834 (58.1%) | $29,397 |
| Female | 2,763 (41.9%) | $28,695 |
| Total | 6,597 (100.0%) | $29,005 |
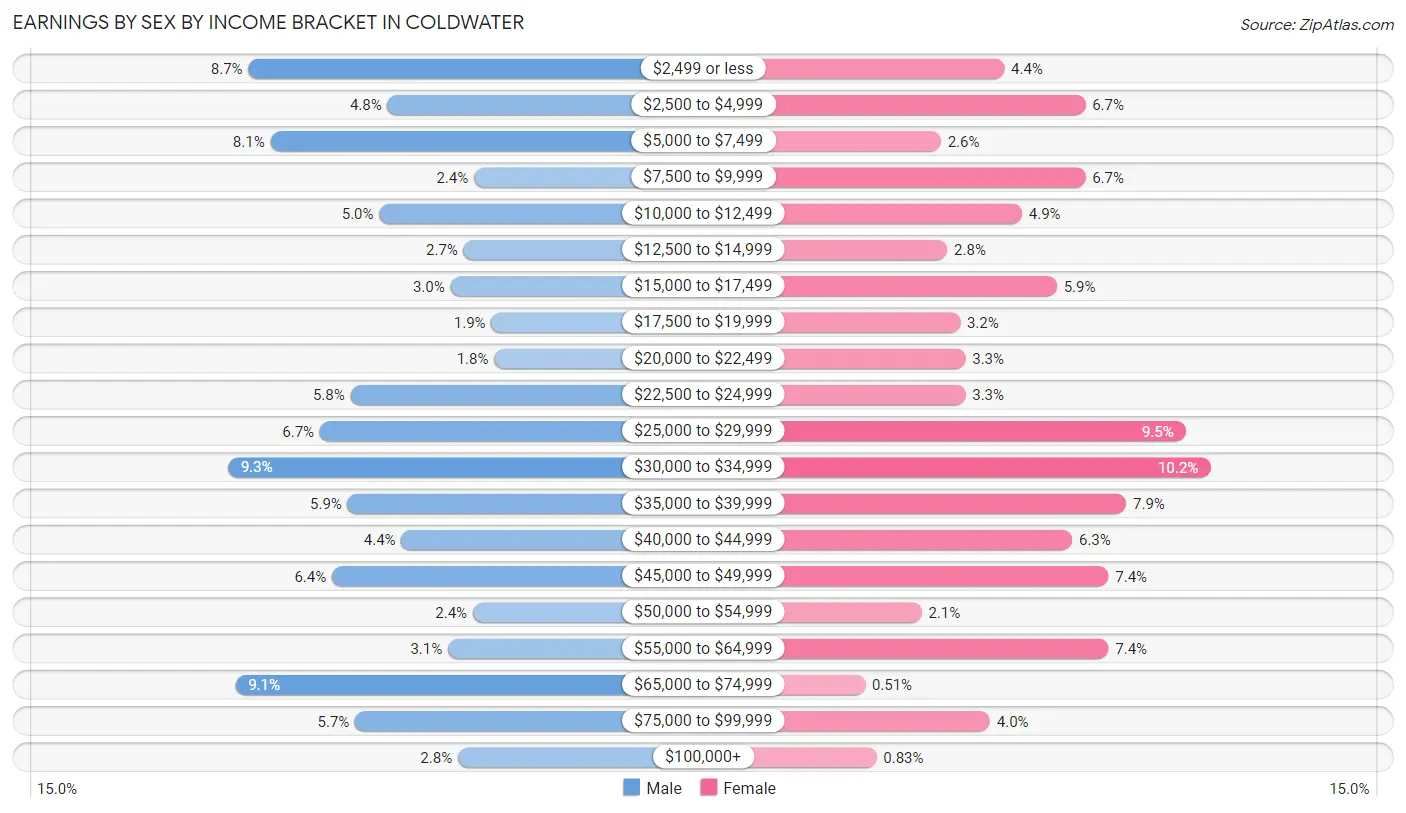
Earnings by Sex by Income Bracket in Coldwater
The most common earnings brackets in Coldwater are $30,000 to $34,999 for men (356 | 9.3%) and $30,000 to $34,999 for women (282 | 10.2%).
| Income | Male | Female |
| $2,499 or less | 334 (8.7%) | 122 (4.4%) |
| $2,500 to $4,999 | 184 (4.8%) | 185 (6.7%) |
| $5,000 to $7,499 | 310 (8.1%) | 73 (2.6%) |
| $7,500 to $9,999 | 91 (2.4%) | 185 (6.7%) |
| $10,000 to $12,499 | 193 (5.0%) | 136 (4.9%) |
| $12,500 to $14,999 | 102 (2.7%) | 78 (2.8%) |
| $15,000 to $17,499 | 116 (3.0%) | 163 (5.9%) |
| $17,500 to $19,999 | 72 (1.9%) | 88 (3.2%) |
| $20,000 to $22,499 | 69 (1.8%) | 92 (3.3%) |
| $22,500 to $24,999 | 224 (5.8%) | 92 (3.3%) |
| $25,000 to $29,999 | 257 (6.7%) | 263 (9.5%) |
| $30,000 to $34,999 | 356 (9.3%) | 282 (10.2%) |
| $35,000 to $39,999 | 227 (5.9%) | 217 (7.9%) |
| $40,000 to $44,999 | 169 (4.4%) | 175 (6.3%) |
| $45,000 to $49,999 | 244 (6.4%) | 203 (7.3%) |
| $50,000 to $54,999 | 92 (2.4%) | 58 (2.1%) |
| $55,000 to $64,999 | 119 (3.1%) | 203 (7.3%) |
| $65,000 to $74,999 | 348 (9.1%) | 14 (0.5%) |
| $75,000 to $99,999 | 219 (5.7%) | 111 (4.0%) |
| $100,000+ | 108 (2.8%) | 23 (0.8%) |
| Total | 3,834 (100.0%) | 2,763 (100.0%) |
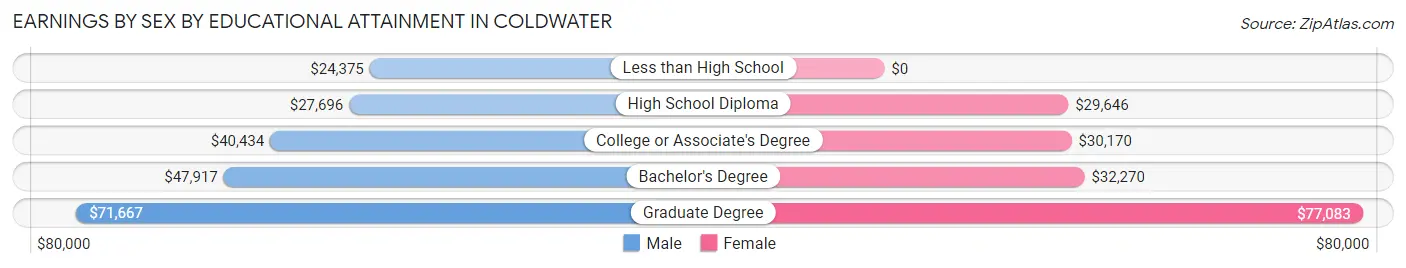
Earnings by Sex by Educational Attainment in Coldwater
Average earnings in Coldwater are $31,001 for men and $31,038 for women, a difference of 0.1%. Men with an educational attainment of graduate degree enjoy the highest average annual earnings of $71,667, while those with less than high school education earn the least with $24,375. Women with an educational attainment of graduate degree earn the most with the average annual earnings of $77,083, while those with high school diploma education have the smallest earnings of $29,646.
| Educational Attainment | Male Income | Female Income |
| Less than High School | $24,375 | $0 |
| High School Diploma | $27,696 | $29,646 |
| College or Associate's Degree | $40,434 | $30,170 |
| Bachelor's Degree | $47,917 | $32,270 |
| Graduate Degree | $71,667 | $77,083 |
| Total | $31,001 | $31,038 |
Family Income in Coldwater
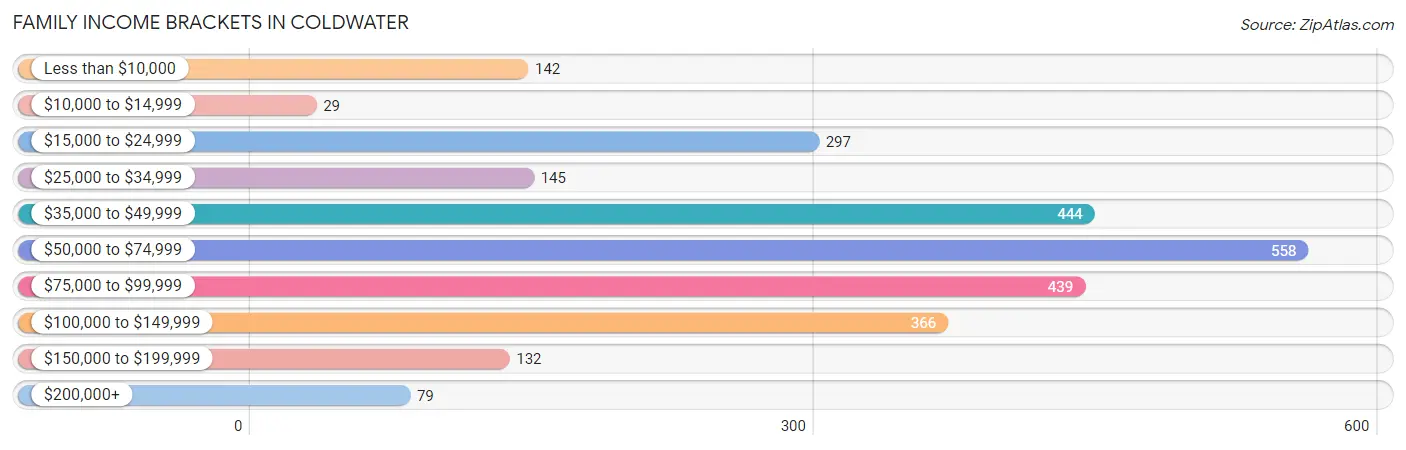
Family Income Brackets in Coldwater
According to the Coldwater family income data, there are 558 families falling into the $50,000 to $74,999 income range, which is the most common income bracket and makes up 21.2% of all families. Conversely, the $10,000 to $14,999 income bracket is the least frequent group with only 29 families (1.1%) belonging to this category.
| Income Bracket | # Families | % Families |
| Less than $10,000 | 142 | 5.4% |
| $10,000 to $14,999 | 29 | 1.1% |
| $15,000 to $24,999 | 297 | 11.3% |
| $25,000 to $34,999 | 145 | 5.5% |
| $35,000 to $49,999 | 444 | 16.9% |
| $50,000 to $74,999 | 558 | 21.2% |
| $75,000 to $99,999 | 439 | 16.7% |
| $100,000 to $149,999 | 366 | 13.9% |
| $150,000 to $199,999 | 132 | 5.0% |
| $200,000+ | 79 | 3.0% |
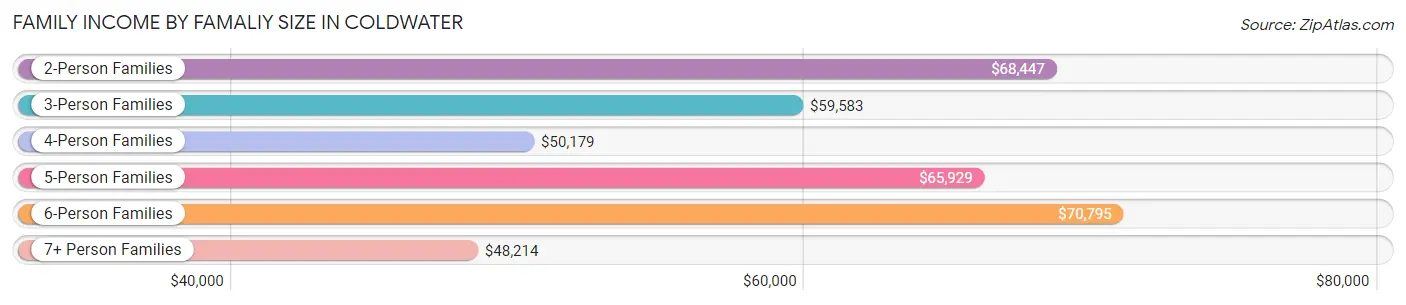
Family Income by Famaliy Size in Coldwater
6-person families (95 | 3.6%) account for the highest median family income in Coldwater with $70,795 per family, while 2-person families (1,089 | 41.4%) have the highest median income of $34,224 per family member.
| Income Bracket | # Families | Median Income |
| 2-Person Families | 1,089 (41.4%) | $68,447 |
| 3-Person Families | 694 (26.4%) | $59,583 |
| 4-Person Families | 406 (15.4%) | $50,179 |
| 5-Person Families | 208 (7.9%) | $65,929 |
| 6-Person Families | 95 (3.6%) | $70,795 |
| 7+ Person Families | 138 (5.2%) | $48,214 |
| Total | 2,630 (100.0%) | $63,333 |
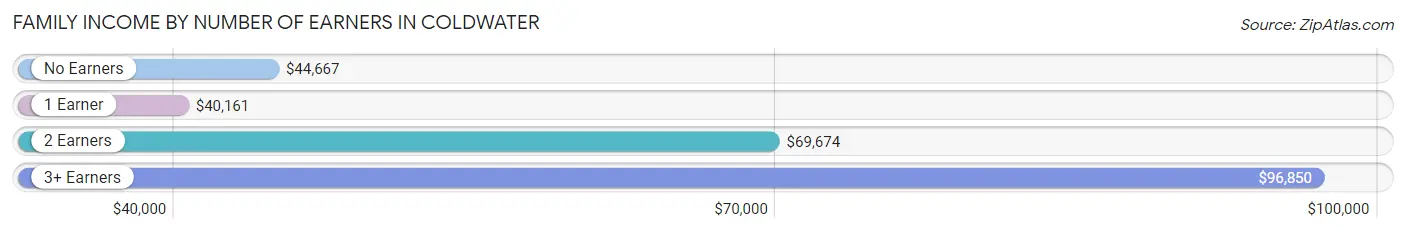
Family Income by Number of Earners in Coldwater
The median family income in Coldwater is $63,333, with families comprising 3+ earners (388) having the highest median family income of $96,850, while families with 1 earner (900) have the lowest median family income of $40,161, accounting for 14.7% and 34.2% of families, respectively.
| Number of Earners | # Families | Median Income |
| No Earners | 430 (16.4%) | $44,667 |
| 1 Earner | 900 (34.2%) | $40,161 |
| 2 Earners | 912 (34.7%) | $69,674 |
| 3+ Earners | 388 (14.7%) | $96,850 |
| Total | 2,630 (100.0%) | $63,333 |
Household Income in Coldwater
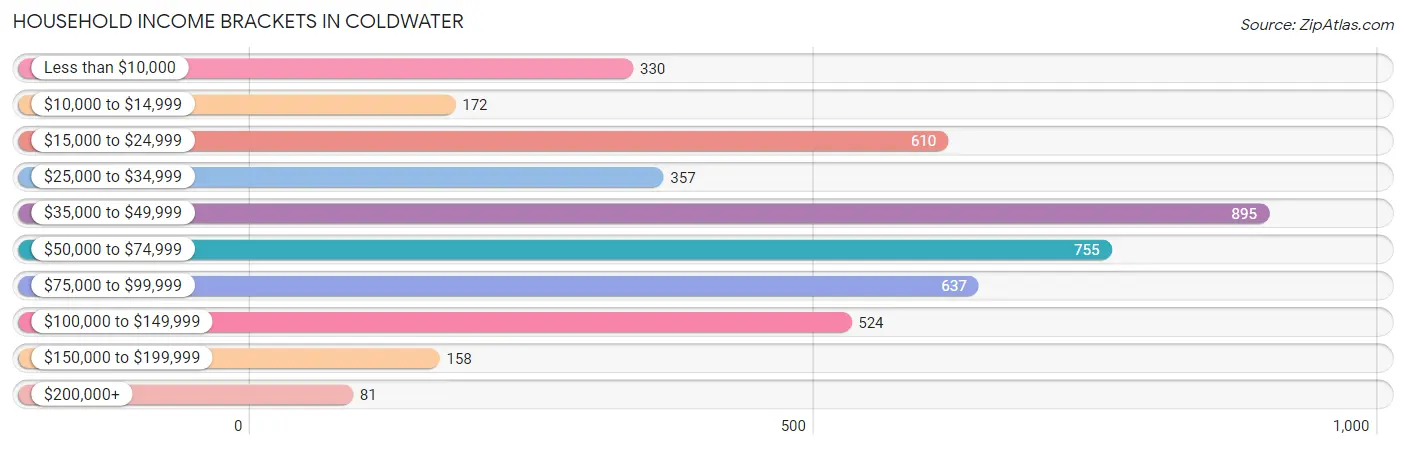
Household Income Brackets in Coldwater
With 895 households falling in the category, the $35,000 to $49,999 income range is the most frequent in Coldwater, accounting for 19.8% of all households. In contrast, only 81 households (1.8%) fall into the $200,000+ income bracket, making it the least populous group.
| Income Bracket | # Households | % Households |
| Less than $10,000 | 330 | 7.3% |
| $10,000 to $14,999 | 172 | 3.8% |
| $15,000 to $24,999 | 610 | 13.5% |
| $25,000 to $34,999 | 357 | 7.9% |
| $35,000 to $49,999 | 895 | 19.8% |
| $50,000 to $74,999 | 755 | 16.7% |
| $75,000 to $99,999 | 637 | 14.1% |
| $100,000 to $149,999 | 524 | 11.6% |
| $150,000 to $199,999 | 158 | 3.5% |
| $200,000+ | 81 | 1.8% |
Household Income by Householder Age in Coldwater
The median household income in Coldwater is $48,531, with the highest median household income of $62,762 found in the 25 to 44 years age bracket for the primary householder. A total of 1,409 households (31.2%) fall into this category. Meanwhile, the 15 to 24 years age bracket for the primary householder has the lowest median household income of $33,214, with 224 households (5.0%) in this group.
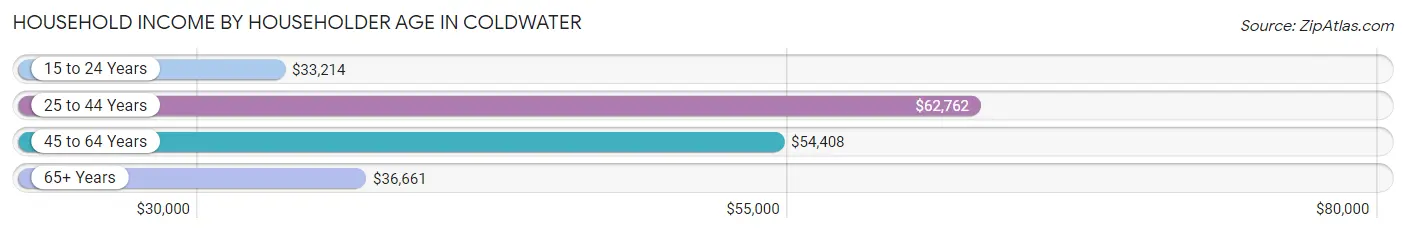
| Income Bracket | # Households | Median Income |
| 15 to 24 Years | 224 (5.0%) | $33,214 |
| 25 to 44 Years | 1,409 (31.2%) | $62,762 |
| 45 to 64 Years | 1,565 (34.6%) | $54,408 |
| 65+ Years | 1,320 (29.2%) | $36,661 |
| Total | 4,518 (100.0%) | $48,531 |
Poverty in Coldwater
Income Below Poverty by Sex and Age in Coldwater
With 19.5% poverty level for males and 23.6% for females among the residents of Coldwater, 5 year old males and 5 year old females are the most vulnerable to poverty, with 29 males (30.5%) and 44 females (49.4%) in their respective age groups living below the poverty level.
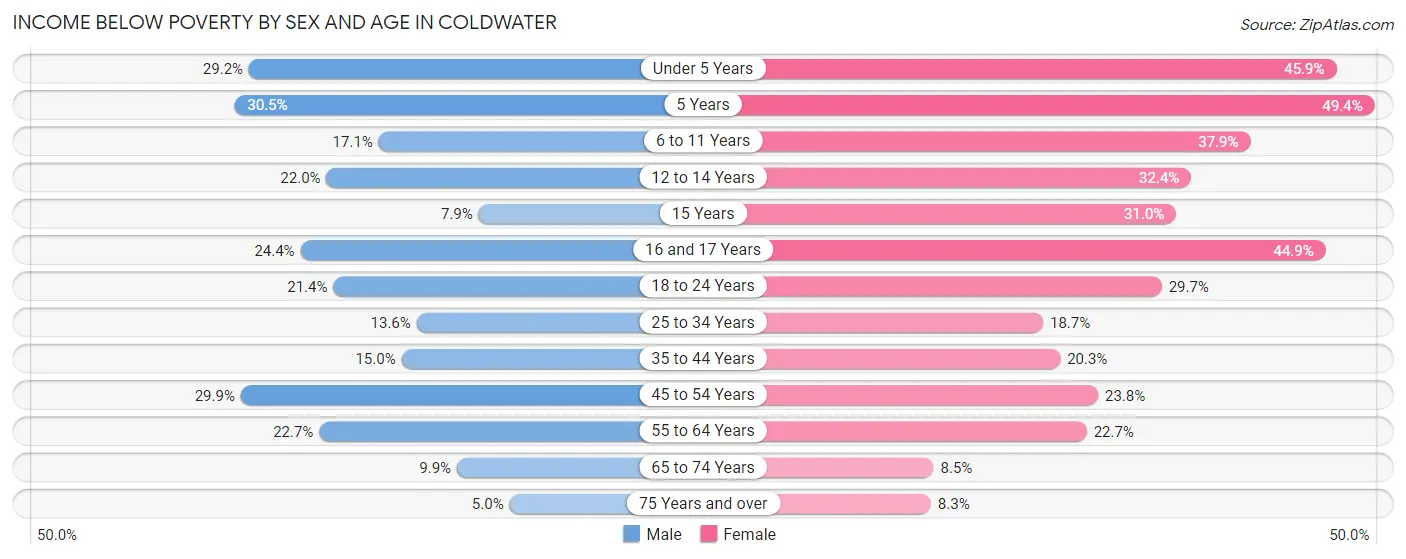
| Age Bracket | Male | Female |
| Under 5 Years | 124 (29.2%) | 134 (45.9%) |
| 5 Years | 29 (30.5%) | 44 (49.4%) |
| 6 to 11 Years | 90 (17.1%) | 163 (37.9%) |
| 12 to 14 Years | 53 (22.0%) | 107 (32.4%) |
| 15 Years | 7 (7.9%) | 9 (31.0%) |
| 16 and 17 Years | 41 (24.4%) | 79 (44.9%) |
| 18 to 24 Years | 114 (21.3%) | 223 (29.7%) |
| 25 to 34 Years | 108 (13.6%) | 156 (18.7%) |
| 35 to 44 Years | 111 (15.0%) | 150 (20.3%) |
| 45 to 54 Years | 215 (29.9%) | 127 (23.8%) |
| 55 to 64 Years | 133 (22.7%) | 183 (22.7%) |
| 65 to 74 Years | 40 (9.9%) | 65 (8.5%) |
| 75 Years and over | 10 (5.0%) | 41 (8.3%) |
| Total | 1,075 (19.5%) | 1,481 (23.6%) |
Income Above Poverty by Sex and Age in Coldwater
According to the poverty statistics in Coldwater, males aged 75 years and over and females aged 75 years and over are the age groups that are most secure financially, with 95.0% of males and 91.7% of females in these age groups living above the poverty line.
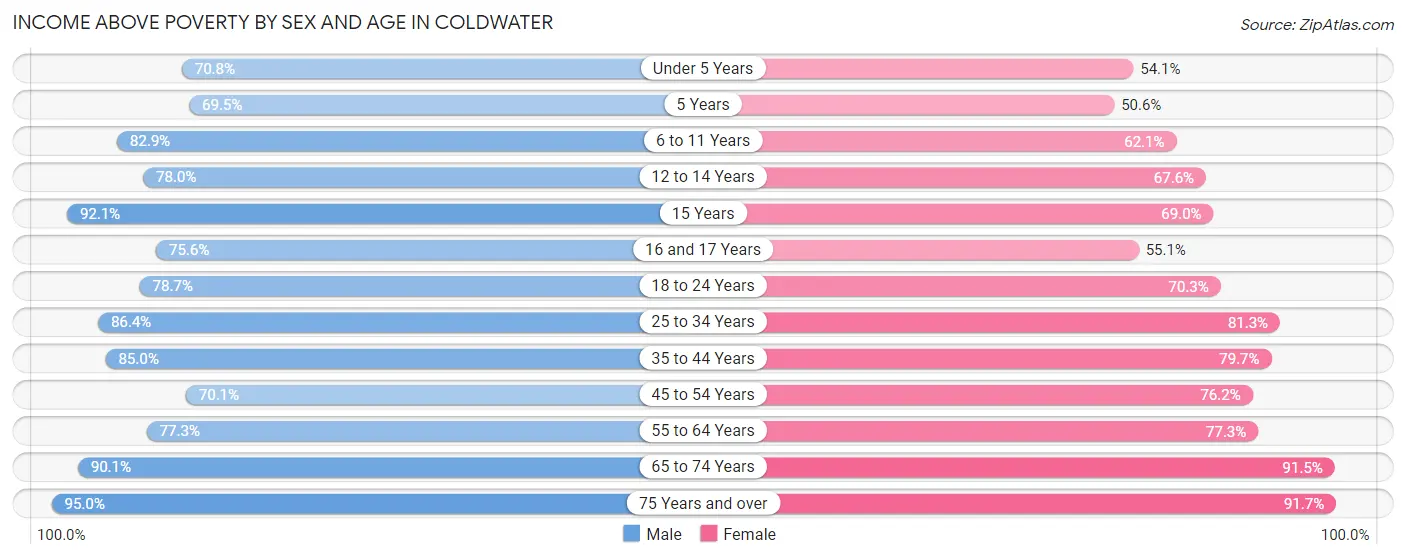
| Age Bracket | Male | Female |
| Under 5 Years | 301 (70.8%) | 158 (54.1%) |
| 5 Years | 66 (69.5%) | 45 (50.6%) |
| 6 to 11 Years | 435 (82.9%) | 267 (62.1%) |
| 12 to 14 Years | 188 (78.0%) | 223 (67.6%) |
| 15 Years | 82 (92.1%) | 20 (69.0%) |
| 16 and 17 Years | 127 (75.6%) | 97 (55.1%) |
| 18 to 24 Years | 420 (78.6%) | 528 (70.3%) |
| 25 to 34 Years | 685 (86.4%) | 679 (81.3%) |
| 35 to 44 Years | 628 (85.0%) | 590 (79.7%) |
| 45 to 54 Years | 503 (70.1%) | 407 (76.2%) |
| 55 to 64 Years | 454 (77.3%) | 622 (77.3%) |
| 65 to 74 Years | 365 (90.1%) | 698 (91.5%) |
| 75 Years and over | 190 (95.0%) | 455 (91.7%) |
| Total | 4,444 (80.5%) | 4,789 (76.4%) |
Income Below Poverty Among Married-Couple Families in Coldwater
The poverty statistics for married-couple families in Coldwater show that 15.1% or 260 of the total 1,725 families live below the poverty line. Families with 5 or more children have the highest poverty rate of 80.3%, comprising of 57 families. On the other hand, families with no children have the lowest poverty rate of 3.6%, which includes 35 families.
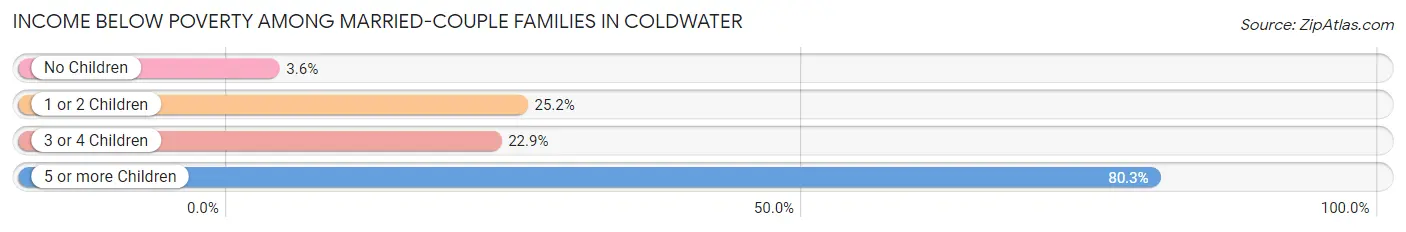
| Children | Above Poverty | Below Poverty |
| No Children | 936 (96.4%) | 35 (3.6%) |
| 1 or 2 Children | 377 (74.8%) | 127 (25.2%) |
| 3 or 4 Children | 138 (77.1%) | 41 (22.9%) |
| 5 or more Children | 14 (19.7%) | 57 (80.3%) |
| Total | 1,465 (84.9%) | 260 (15.1%) |
Income Below Poverty Among Single-Parent Households in Coldwater
According to the poverty data in Coldwater, 7.6% or 18 single-father households and 16.8% or 112 single-mother households are living below the poverty line. Among single-father households, those with 1 or 2 children have the highest poverty rate, with 18 households (11.5%) experiencing poverty. Likewise, among single-mother households, those with 3 or 4 children have the highest poverty rate, with 22 households (33.3%) falling below the poverty line.
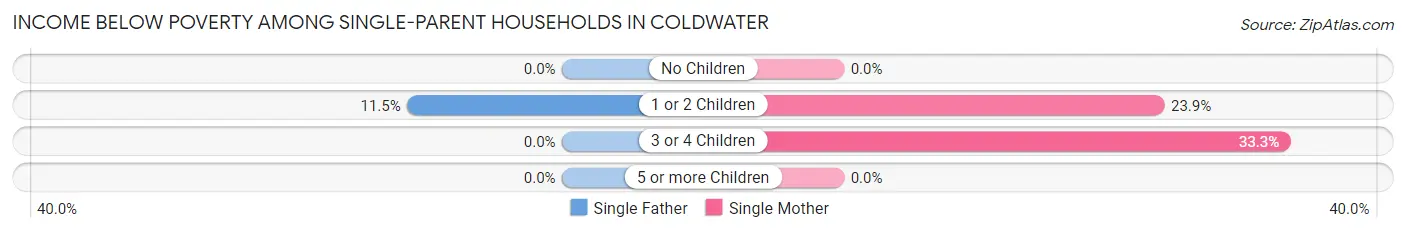
| Children | Single Father | Single Mother |
| No Children | 0 (0.0%) | 0 (0.0%) |
| 1 or 2 Children | 18 (11.5%) | 90 (23.9%) |
| 3 or 4 Children | 0 (0.0%) | 22 (33.3%) |
| 5 or more Children | 0 (0.0%) | 0 (0.0%) |
| Total | 18 (7.6%) | 112 (16.8%) |
Income Below Poverty Among Married-Couple vs Single-Parent Households in Coldwater
The poverty data for Coldwater shows that 260 of the married-couple family households (15.1%) and 130 of the single-parent households (14.4%) are living below the poverty level. Within the married-couple family households, those with 5 or more children have the highest poverty rate, with 57 households (80.3%) falling below the poverty line. Among the single-parent households, those with 3 or 4 children have the highest poverty rate, with 22 household (33.3%) living below poverty.
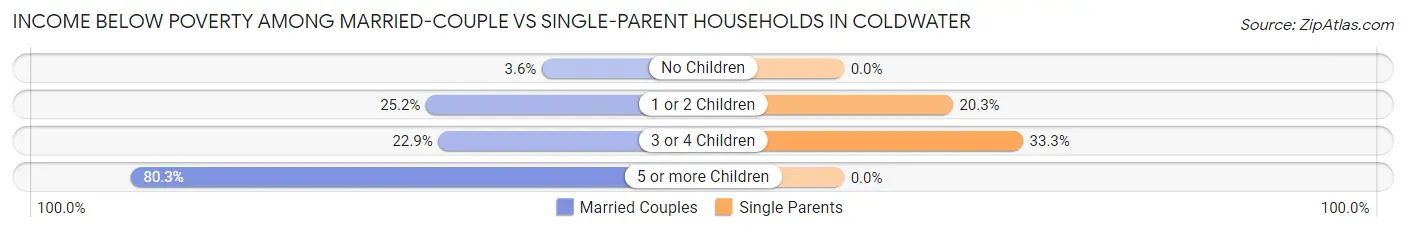
| Children | Married-Couple Families | Single-Parent Households |
| No Children | 35 (3.6%) | 0 (0.0%) |
| 1 or 2 Children | 127 (25.2%) | 108 (20.3%) |
| 3 or 4 Children | 41 (22.9%) | 22 (33.3%) |
| 5 or more Children | 57 (80.3%) | 0 (0.0%) |
| Total | 260 (15.1%) | 130 (14.4%) |
Race in Coldwater
The most populous races in Coldwater are White / Caucasian (11,967 | 87.3%), Hispanic or Latino (1,138 | 8.3%), and Black / African American (695 | 5.1%).
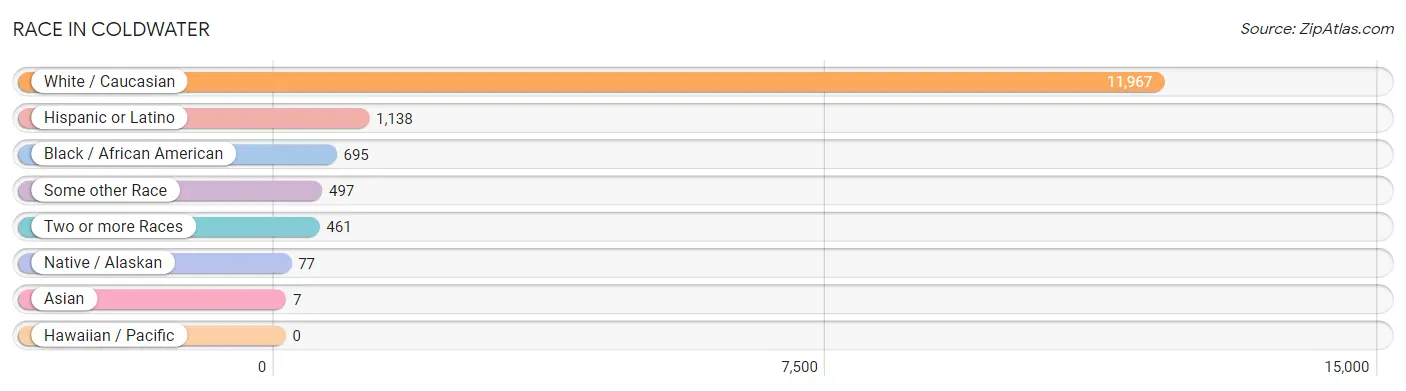
| Race | # Population | % Population |
| Asian | 7 | 0.1% |
| Black / African American | 695 | 5.1% |
| Hawaiian / Pacific | 0 | 0.0% |
| Hispanic or Latino | 1,138 | 8.3% |
| Native / Alaskan | 77 | 0.6% |
| White / Caucasian | 11,967 | 87.3% |
| Two or more Races | 461 | 3.4% |
| Some other Race | 497 | 3.6% |
| Total | 13,704 | 100.0% |
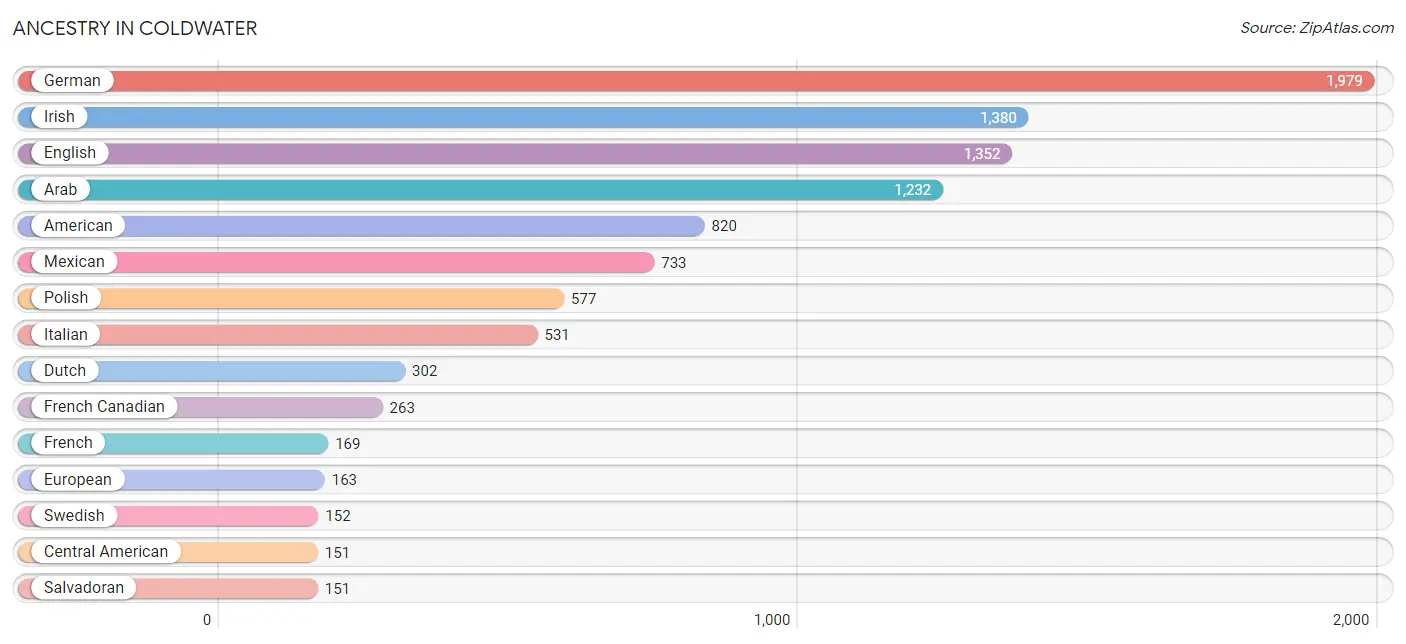
Ancestry in Coldwater
The most populous ancestries reported in Coldwater are German (1,979 | 14.4%), Irish (1,380 | 10.1%), English (1,352 | 9.9%), Arab (1,232 | 9.0%), and American (820 | 6.0%), together accounting for 49.3% of all Coldwater residents.
| Ancestry | # Population | % Population |
| African | 120 | 0.9% |
| American | 820 | 6.0% |
| Arab | 1,232 | 9.0% |
| Belgian | 10 | 0.1% |
| Blackfeet | 48 | 0.4% |
| British | 43 | 0.3% |
| Burmese | 16 | 0.1% |
| Canadian | 16 | 0.1% |
| Central American | 151 | 1.1% |
| Cherokee | 16 | 0.1% |
| Chilean | 18 | 0.1% |
| Chippewa | 19 | 0.1% |
| Cuban | 58 | 0.4% |
| Czech | 28 | 0.2% |
| Danish | 21 | 0.2% |
| Delaware | 7 | 0.1% |
| Dominican | 6 | 0.0% |
| Dutch | 302 | 2.2% |
| Eastern European | 13 | 0.1% |
| English | 1,352 | 9.9% |
| European | 163 | 1.2% |
| Finnish | 21 | 0.2% |
| French | 169 | 1.2% |
| French Canadian | 263 | 1.9% |
| German | 1,979 | 14.4% |
| Hungarian | 56 | 0.4% |
| Irish | 1,380 | 10.1% |
| Israeli | 102 | 0.7% |
| Italian | 531 | 3.9% |
| Jamaican | 7 | 0.1% |
| Lebanese | 10 | 0.1% |
| Mexican | 733 | 5.3% |
| Mexican American Indian | 52 | 0.4% |
| Moroccan | 7 | 0.1% |
| Norwegian | 81 | 0.6% |
| Pennsylvania German | 37 | 0.3% |
| Polish | 577 | 4.2% |
| Puerto Rican | 69 | 0.5% |
| Russian | 31 | 0.2% |
| Salvadoran | 151 | 1.1% |
| Scandinavian | 4 | 0.0% |
| Scotch-Irish | 113 | 0.8% |
| Scottish | 128 | 0.9% |
| Slovak | 50 | 0.4% |
| South American | 82 | 0.6% |
| Subsaharan African | 120 | 0.9% |
| Swedish | 152 | 1.1% |
| Swiss | 45 | 0.3% |
| Thai | 31 | 0.2% |
| Venezuelan | 64 | 0.5% |
| Welsh | 84 | 0.6% | View All 51 Rows |
Immigrants in Coldwater
The most numerous immigrant groups reported in Coldwater came from Asia (953 | 7.0%), Western Asia (943 | 6.9%), Yemen (943 | 6.9%), Latin America (534 | 3.9%), and Central America (416 | 3.0%), together accounting for 27.7% of all Coldwater residents.
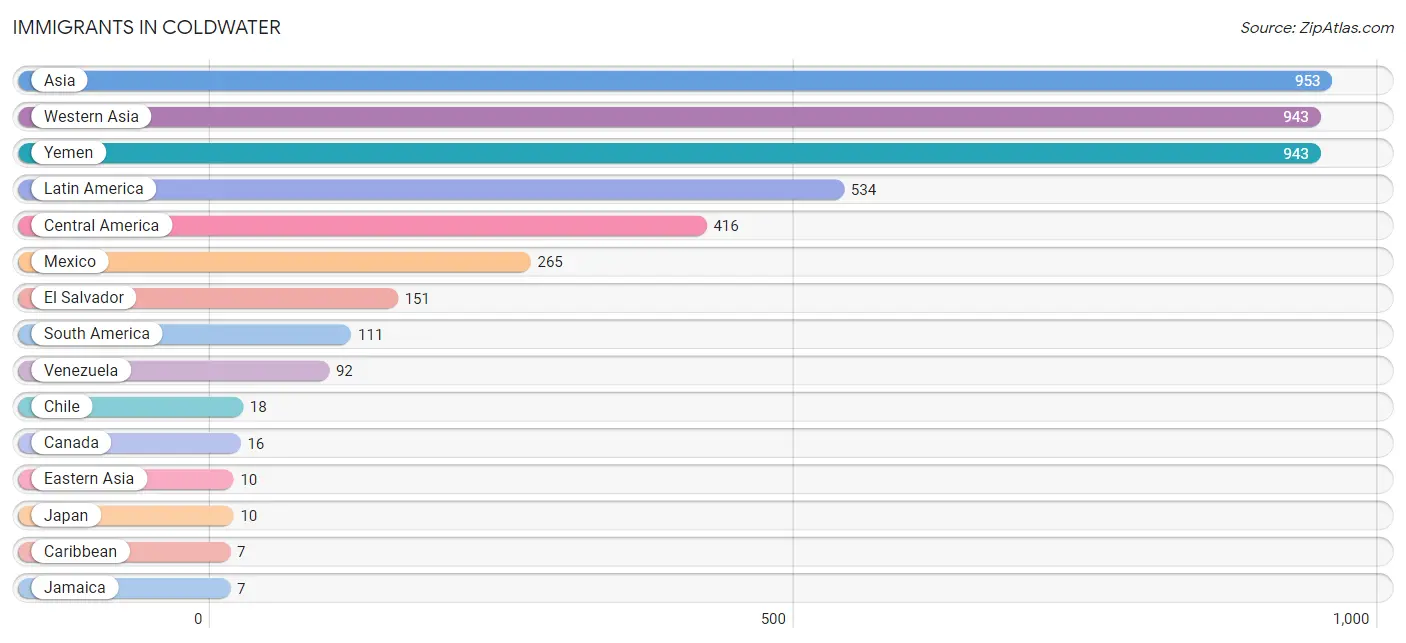
| Immigration Origin | # Population | % Population |
| Africa | 1 | 0.0% |
| Asia | 953 | 7.0% |
| Brazil | 1 | 0.0% |
| Canada | 16 | 0.1% |
| Caribbean | 7 | 0.1% |
| Central America | 416 | 3.0% |
| Chile | 18 | 0.1% |
| Eastern Asia | 10 | 0.1% |
| El Salvador | 151 | 1.1% |
| Jamaica | 7 | 0.1% |
| Japan | 10 | 0.1% |
| Latin America | 534 | 3.9% |
| Mexico | 265 | 1.9% |
| South Africa | 1 | 0.0% |
| South America | 111 | 0.8% |
| Venezuela | 92 | 0.7% |
| Western Asia | 943 | 6.9% |
| Yemen | 943 | 6.9% | View All 18 Rows |
Sex and Age in Coldwater
Sex and Age in Coldwater
The most populous age groups in Coldwater are 40 to 44 Years (655 | 9.0%) for men and 10 to 14 Years (609 | 9.5%) for women.
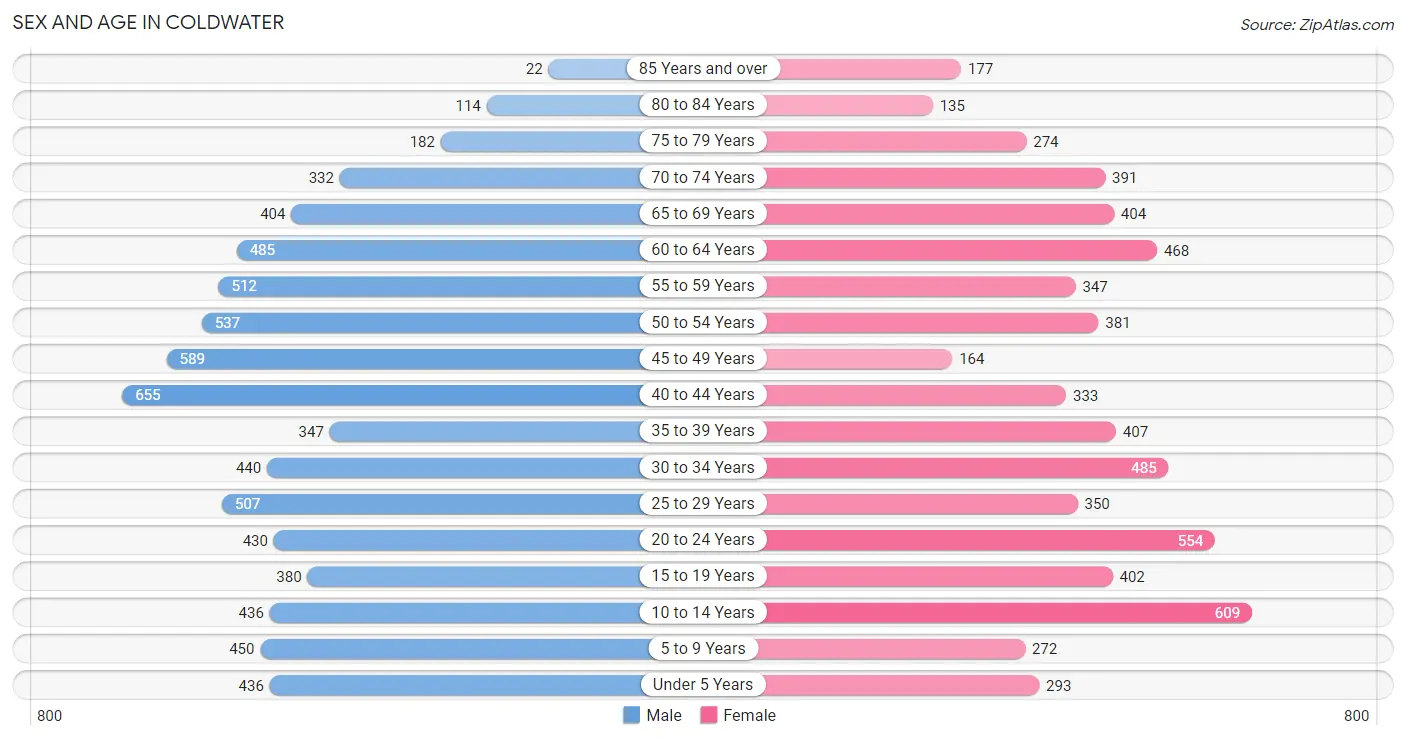
| Age Bracket | Male | Female |
| Under 5 Years | 436 (6.0%) | 293 (4.5%) |
| 5 to 9 Years | 450 (6.2%) | 272 (4.2%) |
| 10 to 14 Years | 436 (6.0%) | 609 (9.5%) |
| 15 to 19 Years | 380 (5.2%) | 402 (6.2%) |
| 20 to 24 Years | 430 (5.9%) | 554 (8.6%) |
| 25 to 29 Years | 507 (7.0%) | 350 (5.4%) |
| 30 to 34 Years | 440 (6.1%) | 485 (7.5%) |
| 35 to 39 Years | 347 (4.8%) | 407 (6.3%) |
| 40 to 44 Years | 655 (9.0%) | 333 (5.2%) |
| 45 to 49 Years | 589 (8.1%) | 164 (2.5%) |
| 50 to 54 Years | 537 (7.4%) | 381 (5.9%) |
| 55 to 59 Years | 512 (7.0%) | 347 (5.4%) |
| 60 to 64 Years | 485 (6.7%) | 468 (7.3%) |
| 65 to 69 Years | 404 (5.6%) | 404 (6.3%) |
| 70 to 74 Years | 332 (4.6%) | 391 (6.1%) |
| 75 to 79 Years | 182 (2.5%) | 274 (4.3%) |
| 80 to 84 Years | 114 (1.6%) | 135 (2.1%) |
| 85 Years and over | 22 (0.3%) | 177 (2.8%) |
| Total | 7,258 (100.0%) | 6,446 (100.0%) |
Families and Households in Coldwater
Median Family Size in Coldwater
The median family size in Coldwater is 3.38 persons per family, with married-couple families (1,725 | 65.6%) accounting for the largest median family size of 3.41 persons per family. On the other hand, single male/father families (238 | 9.0%) represent the smallest median family size with 3.27 persons per family.
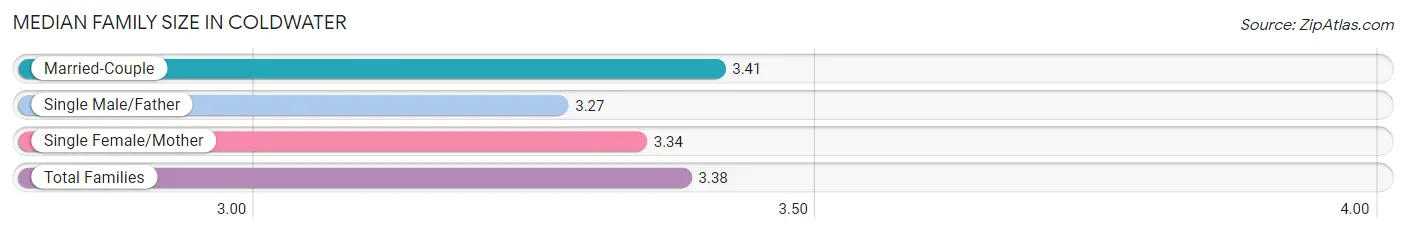
| Family Type | # Families | Family Size |
| Married-Couple | 1,725 (65.6%) | 3.41 |
| Single Male/Father | 238 (9.0%) | 3.27 |
| Single Female/Mother | 667 (25.4%) | 3.34 |
| Total Families | 2,630 (100.0%) | 3.38 |
Median Household Size in Coldwater
The median household size in Coldwater is 2.61 persons per household, with single female/mother households (667 | 14.8%) accounting for the largest median household size of 3.66 persons per household. non-family households (1,888 | 41.8%) represent the smallest median household size with 1.37 persons per household.
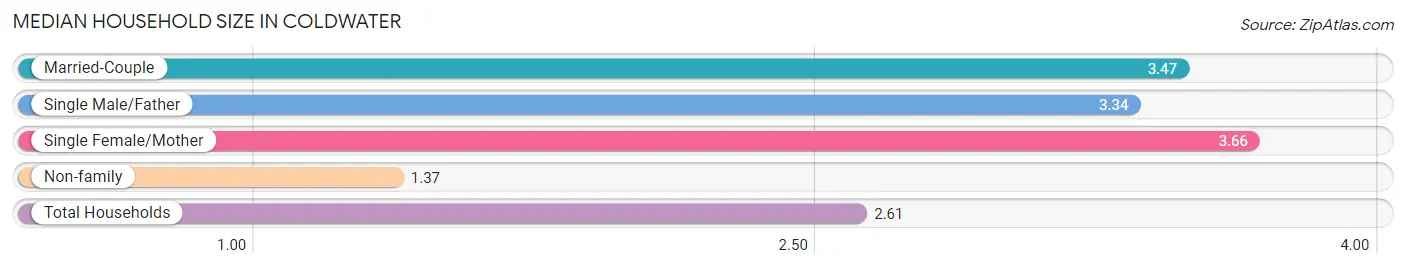
| Household Type | # Households | Household Size |
| Married-Couple | 1,725 (38.2%) | 3.47 |
| Single Male/Father | 238 (5.3%) | 3.34 |
| Single Female/Mother | 667 (14.8%) | 3.66 |
| Non-family | 1,888 (41.8%) | 1.37 |
| Total Households | 4,518 (100.0%) | 2.61 |
Household Size by Marriage Status in Coldwater
Out of a total of 4,518 households in Coldwater, 2,630 (58.2%) are family households, while 1,888 (41.8%) are nonfamily households. The most numerous type of family households are 2-person households, comprising 1,071, and the most common type of nonfamily households are 1-person households, comprising 1,411.
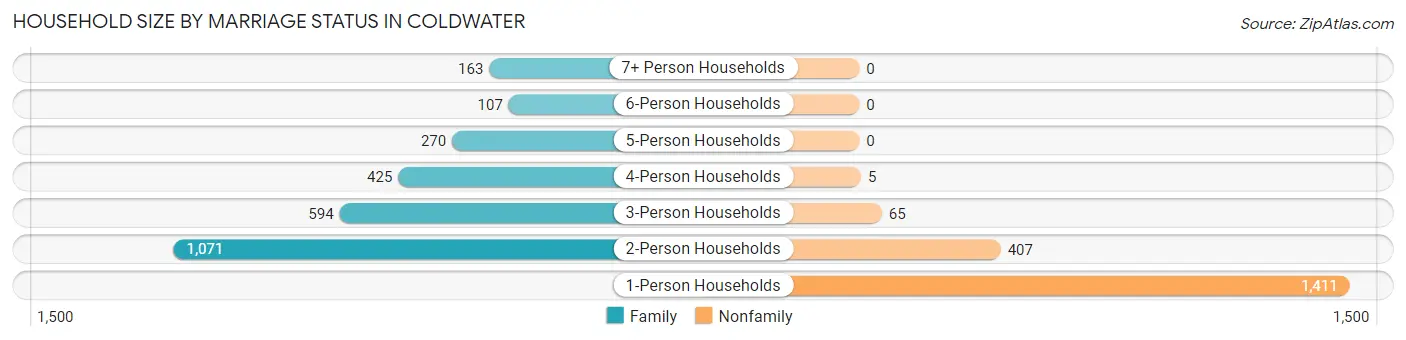
| Household Size | Family Households | Nonfamily Households |
| 1-Person Households | - | 1,411 (31.2%) |
| 2-Person Households | 1,071 (23.7%) | 407 (9.0%) |
| 3-Person Households | 594 (13.2%) | 65 (1.4%) |
| 4-Person Households | 425 (9.4%) | 5 (0.1%) |
| 5-Person Households | 270 (6.0%) | 0 (0.0%) |
| 6-Person Households | 107 (2.4%) | 0 (0.0%) |
| 7+ Person Households | 163 (3.6%) | 0 (0.0%) |
| Total | 2,630 (58.2%) | 1,888 (41.8%) |
Female Fertility in Coldwater
Fertility by Age in Coldwater
Average fertility rate in Coldwater is 65.0 births per 1,000 women. Women in the age bracket of 20 to 34 years have the highest fertility rate with 105.0 births per 1,000 women. Women in the age bracket of 20 to 34 years acount for 81.1% of all women with births.
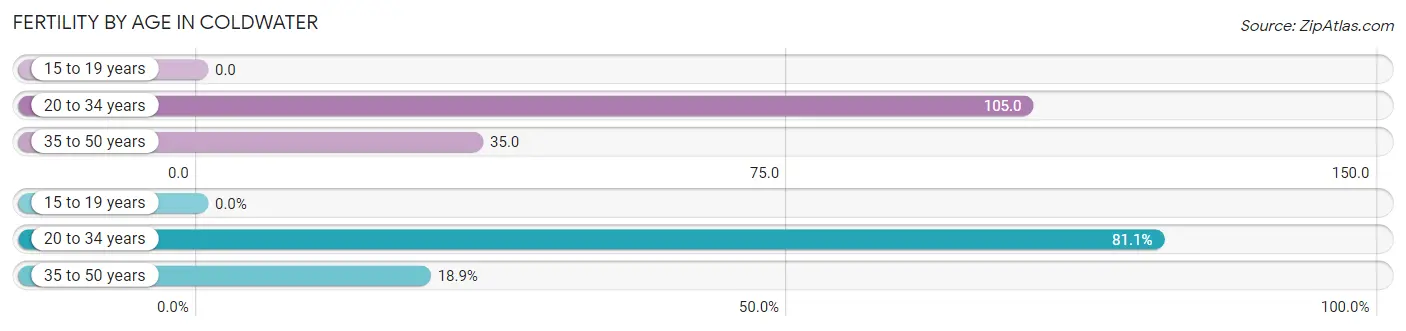
| Age Bracket | Women with Births | Births / 1,000 Women |
| 15 to 19 years | 0 (0.0%) | 0.0 |
| 20 to 34 years | 146 (81.1%) | 105.0 |
| 35 to 50 years | 34 (18.9%) | 35.0 |
| Total | 180 (100.0%) | 65.0 |
Fertility by Age by Marriage Status in Coldwater
82.2% of women with births (180) in Coldwater are married. The highest percentage of unmarried women with births falls into 20 to 34 years age bracket with 21.9% of them unmarried at the time of birth, while the lowest percentage of unmarried women with births belong to 35 to 50 years age bracket with 0.0% of them unmarried.
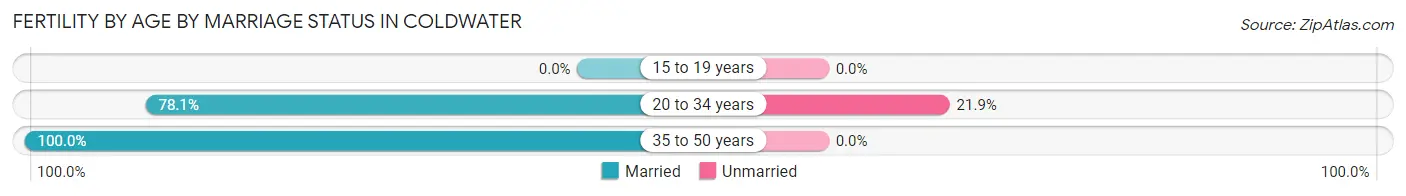
| Age Bracket | Married | Unmarried |
| 15 to 19 years | 0 (0.0%) | 0 (0.0%) |
| 20 to 34 years | 114 (78.1%) | 32 (21.9%) |
| 35 to 50 years | 34 (100.0%) | 0 (0.0%) |
| Total | 148 (82.2%) | 32 (17.8%) |
Fertility by Education in Coldwater
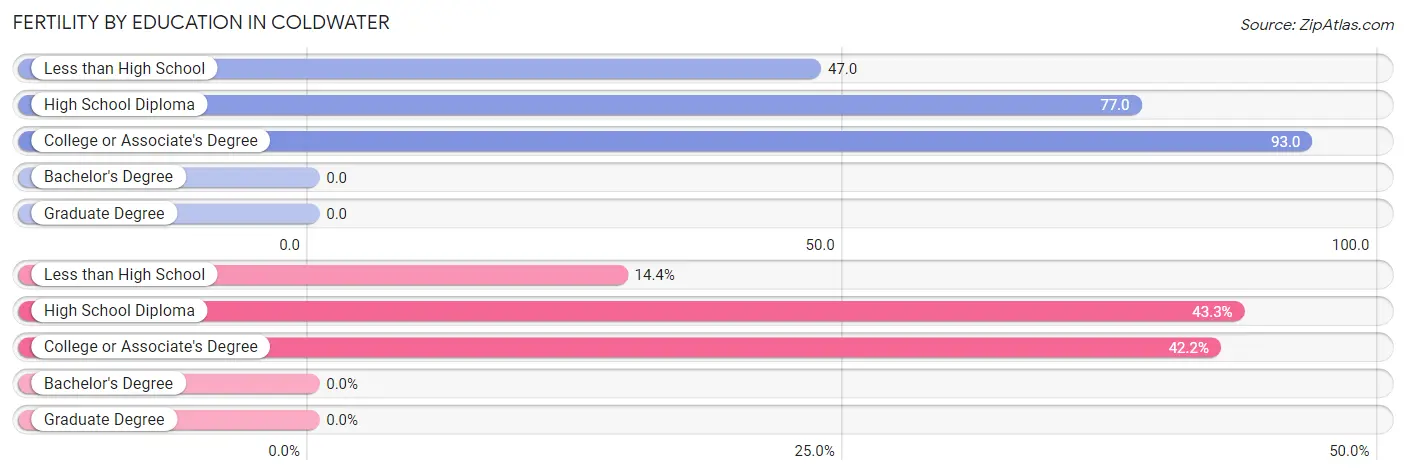
| Educational Attainment | Women with Births | Births / 1,000 Women |
| Less than High School | 26 (14.4%) | 47.0 |
| High School Diploma | 78 (43.3%) | 77.0 |
| College or Associate's Degree | 76 (42.2%) | 93.0 |
| Bachelor's Degree | 0 (0.0%) | 0.0 |
| Graduate Degree | 0 (0.0%) | 0.0 |
| Total | 180 (100.0%) | 65.0 |
Fertility by Education by Marriage Status in Coldwater
17.8% of women with births in Coldwater are unmarried. Women with the educational attainment of less than high school are most likely to be married with 100.0% of them married at childbirth, while women with the educational attainment of high school diploma are least likely to be married with 35.9% of them unmarried at childbirth.
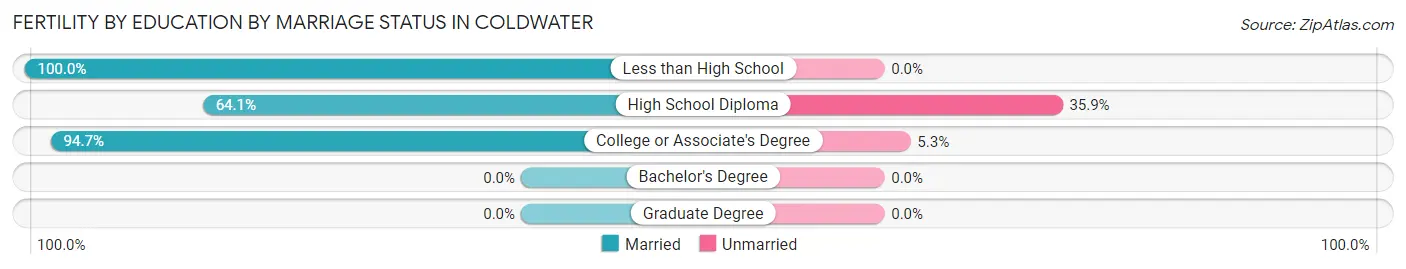
| Educational Attainment | Married | Unmarried |
| Less than High School | 26 (100.0%) | 0 (0.0%) |
| High School Diploma | 50 (64.1%) | 28 (35.9%) |
| College or Associate's Degree | 72 (94.7%) | 4 (5.3%) |
| Bachelor's Degree | 0 (0.0%) | 0 (0.0%) |
| Graduate Degree | 0 (0.0%) | 0 (0.0%) |
| Total | 148 (82.2%) | 32 (17.8%) |
Employment Characteristics in Coldwater
Employment by Class of Employer in Coldwater
Among the 5,256 employed individuals in Coldwater, private company employees (3,987 | 75.9%), local government employees (462 | 8.8%), and self-employed (not incorporated) (404 | 7.7%) make up the most common classes of employment.
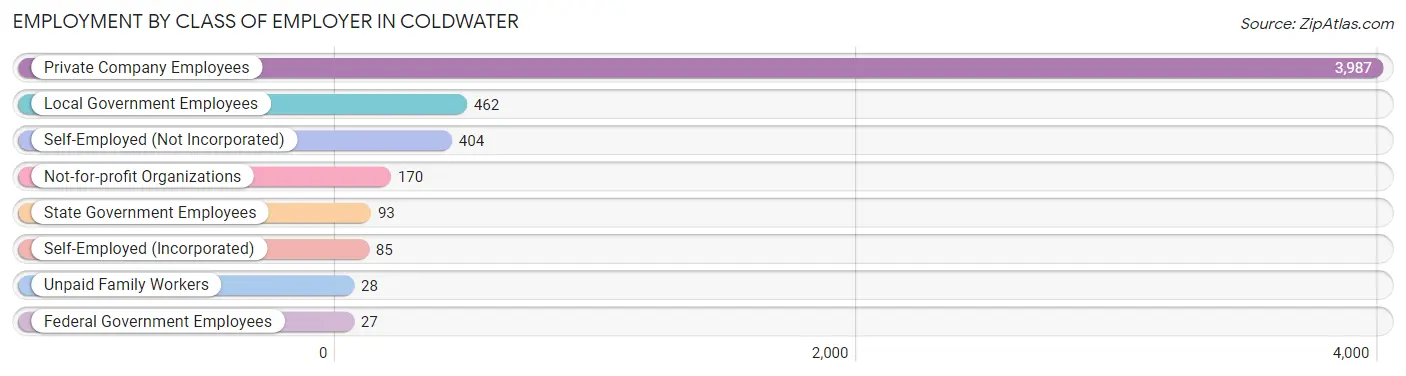
| Employer Class | # Employees | % Employees |
| Private Company Employees | 3,987 | 75.9% |
| Self-Employed (Incorporated) | 85 | 1.6% |
| Self-Employed (Not Incorporated) | 404 | 7.7% |
| Not-for-profit Organizations | 170 | 3.2% |
| Local Government Employees | 462 | 8.8% |
| State Government Employees | 93 | 1.8% |
| Federal Government Employees | 27 | 0.5% |
| Unpaid Family Workers | 28 | 0.5% |
| Total | 5,256 | 100.0% |
Employment Status by Age in Coldwater
According to the labor force statistics for Coldwater, out of the total population over 16 years of age (11,090), 49.9% or 5,534 individuals are in the labor force, with 3.8% or 210 of them unemployed. The age group with the highest labor force participation rate is 25 to 29 years, with 81.8% or 701 individuals in the labor force. Within the labor force, the 20 to 24 years age range has the highest percentage of unemployed individuals, with 6.1% or 39 of them being unemployed.
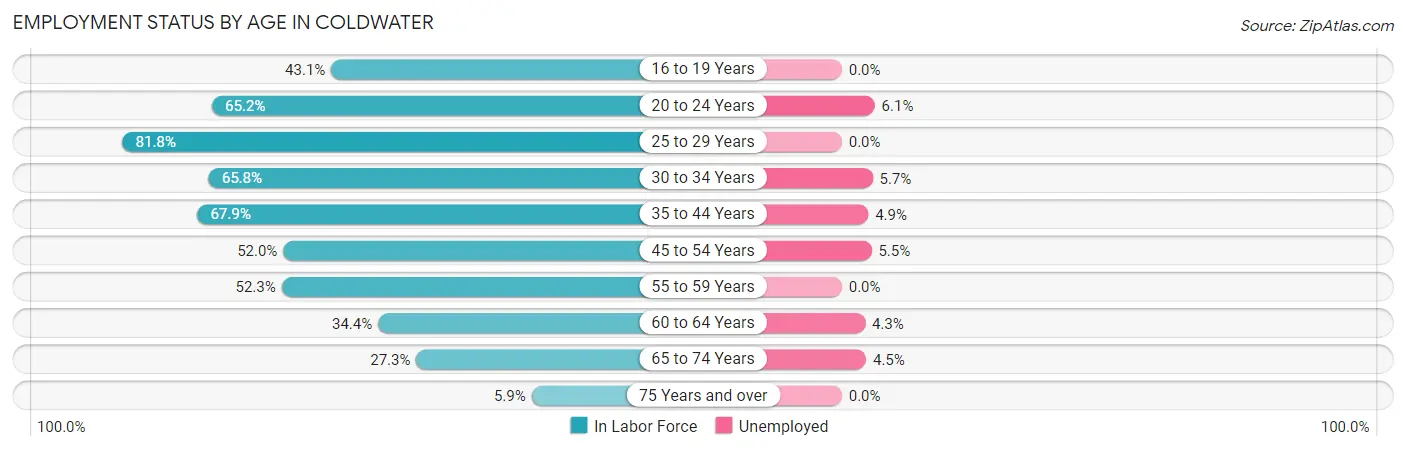
| Age Bracket | In Labor Force | Unemployed |
| 16 to 19 Years | 286 (43.1%) | 0 (0.0%) |
| 20 to 24 Years | 642 (65.2%) | 39 (6.1%) |
| 25 to 29 Years | 701 (81.8%) | 0 (0.0%) |
| 30 to 34 Years | 609 (65.8%) | 35 (5.7%) |
| 35 to 44 Years | 1,183 (67.9%) | 58 (4.9%) |
| 45 to 54 Years | 869 (52.0%) | 48 (5.5%) |
| 55 to 59 Years | 449 (52.3%) | 0 (0.0%) |
| 60 to 64 Years | 328 (34.4%) | 14 (4.3%) |
| 65 to 74 Years | 418 (27.3%) | 19 (4.5%) |
| 75 Years and over | 53 (5.9%) | 0 (0.0%) |
| Total | 5,534 (49.9%) | 210 (3.8%) |
Employment Status by Educational Attainment in Coldwater
According to labor force statistics for Coldwater, 59.1% of individuals (4,141) out of the total population between 25 and 64 years of age (7,007) are in the labor force, with 3.7% or 153 of them being unemployed. The group with the highest labor force participation rate are those with the educational attainment of bachelor's degree or higher, with 75.4% or 582 individuals in the labor force. Within the labor force, individuals with college / associate degree education have the highest percentage of unemployment, with 5.5% or 99 of them being unemployed.
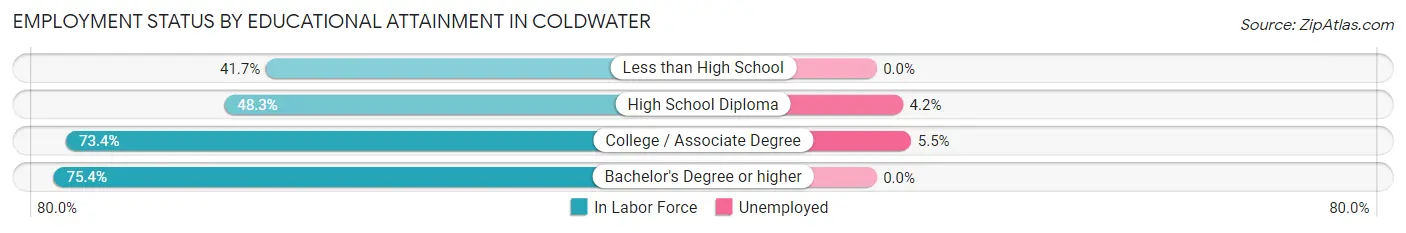
| Educational Attainment | In Labor Force | Unemployed |
| Less than High School | 425 (41.7%) | 0 (0.0%) |
| High School Diploma | 1,340 (48.3%) | 117 (4.2%) |
| College / Associate Degree | 1,792 (73.4%) | 134 (5.5%) |
| Bachelor's Degree or higher | 582 (75.4%) | 0 (0.0%) |
| Total | 4,141 (59.1%) | 259 (3.7%) |
Employment Occupations by Sex in Coldwater
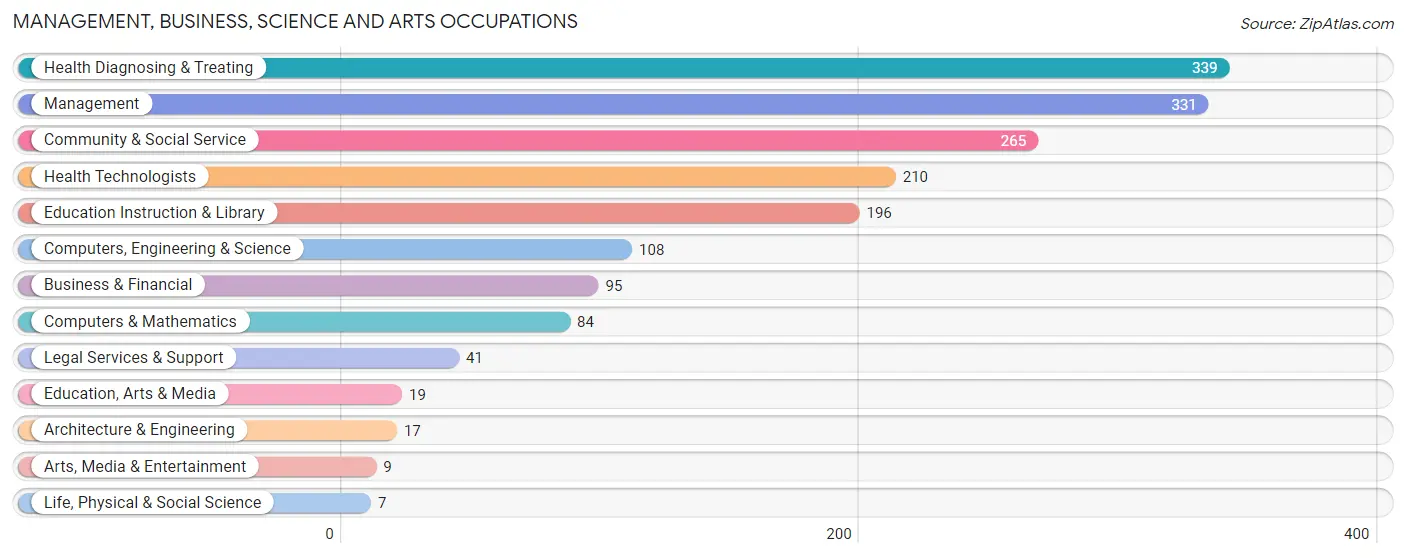
Management, Business, Science and Arts Occupations
The most common Management, Business, Science and Arts occupations in Coldwater are Health Diagnosing & Treating (339 | 6.4%), Management (331 | 6.2%), Community & Social Service (265 | 5.0%), Health Technologists (210 | 3.9%), and Education Instruction & Library (196 | 3.7%).
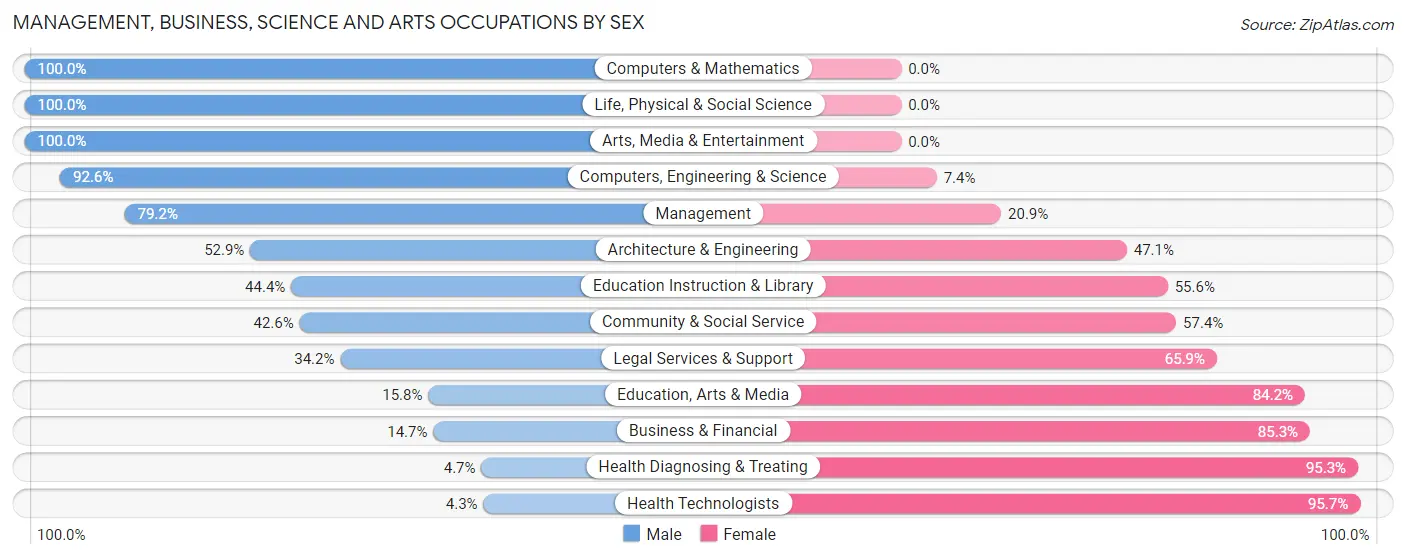
Management, Business, Science and Arts Occupations by Sex
Within the Management, Business, Science and Arts occupations in Coldwater, the most male-oriented occupations are Computers & Mathematics (100.0%), Life, Physical & Social Science (100.0%), and Arts, Media & Entertainment (100.0%), while the most female-oriented occupations are Health Technologists (95.7%), Health Diagnosing & Treating (95.3%), and Business & Financial (85.3%).
| Occupation | Male | Female |
| Management | 262 (79.1%) | 69 (20.8%) |
| Business & Financial | 14 (14.7%) | 81 (85.3%) |
| Computers, Engineering & Science | 100 (92.6%) | 8 (7.4%) |
| Computers & Mathematics | 84 (100.0%) | 0 (0.0%) |
| Architecture & Engineering | 9 (52.9%) | 8 (47.1%) |
| Life, Physical & Social Science | 7 (100.0%) | 0 (0.0%) |
| Community & Social Service | 113 (42.6%) | 152 (57.4%) |
| Education, Arts & Media | 3 (15.8%) | 16 (84.2%) |
| Legal Services & Support | 14 (34.2%) | 27 (65.8%) |
| Education Instruction & Library | 87 (44.4%) | 109 (55.6%) |
| Arts, Media & Entertainment | 9 (100.0%) | 0 (0.0%) |
| Health Diagnosing & Treating | 16 (4.7%) | 323 (95.3%) |
| Health Technologists | 9 (4.3%) | 201 (95.7%) |
| Total (Category) | 505 (44.4%) | 633 (55.6%) |
| Total (Overall) | 2,691 (50.5%) | 2,633 (49.5%) |
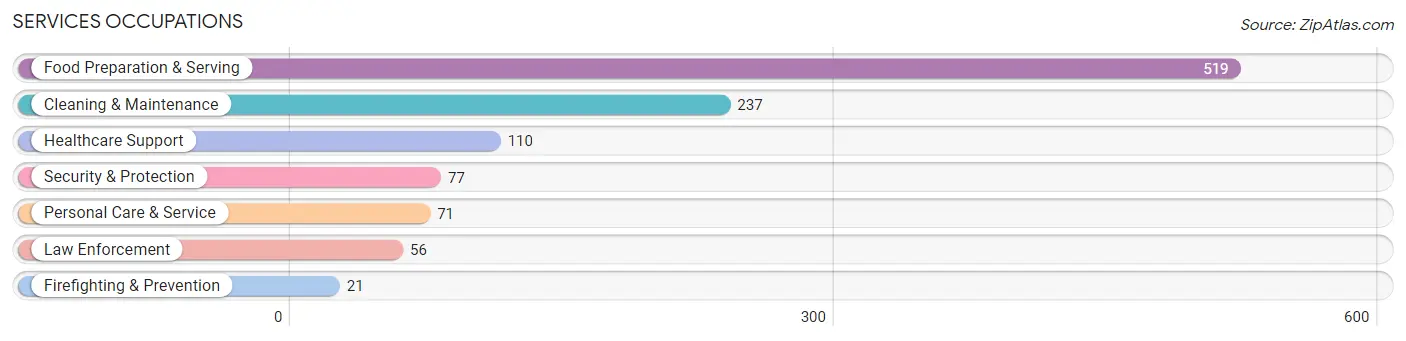
Services Occupations
The most common Services occupations in Coldwater are Food Preparation & Serving (519 | 9.8%), Cleaning & Maintenance (237 | 4.4%), Healthcare Support (110 | 2.1%), Security & Protection (77 | 1.5%), and Personal Care & Service (71 | 1.3%).
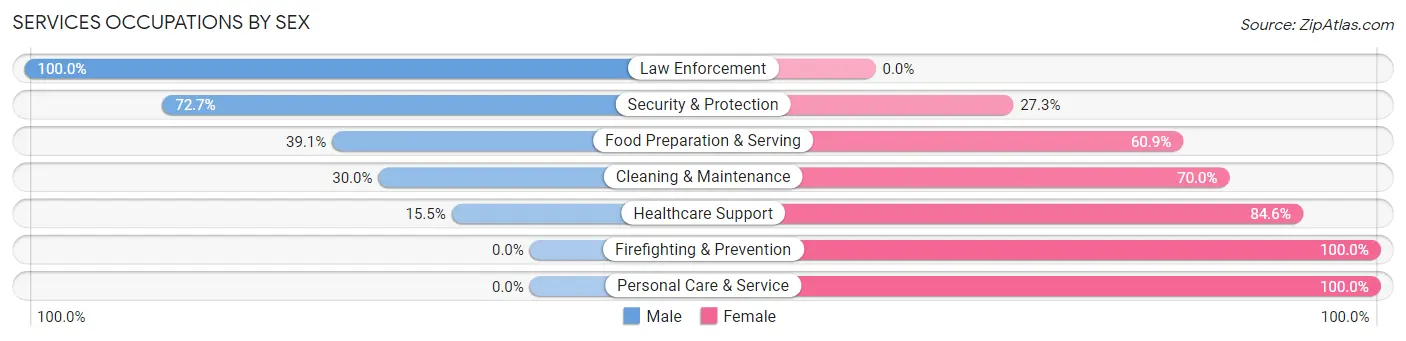
Services Occupations by Sex
Within the Services occupations in Coldwater, the most male-oriented occupations are Law Enforcement (100.0%), Security & Protection (72.7%), and Food Preparation & Serving (39.1%), while the most female-oriented occupations are Firefighting & Prevention (100.0%), Personal Care & Service (100.0%), and Healthcare Support (84.6%).
| Occupation | Male | Female |
| Healthcare Support | 17 (15.4%) | 93 (84.6%) |
| Security & Protection | 56 (72.7%) | 21 (27.3%) |
| Firefighting & Prevention | 0 (0.0%) | 21 (100.0%) |
| Law Enforcement | 56 (100.0%) | 0 (0.0%) |
| Food Preparation & Serving | 203 (39.1%) | 316 (60.9%) |
| Cleaning & Maintenance | 71 (30.0%) | 166 (70.0%) |
| Personal Care & Service | 0 (0.0%) | 71 (100.0%) |
| Total (Category) | 347 (34.2%) | 667 (65.8%) |
| Total (Overall) | 2,691 (50.5%) | 2,633 (49.5%) |
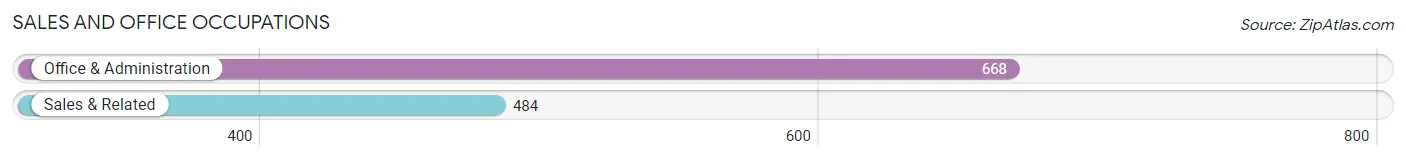
Sales and Office Occupations
The most common Sales and Office occupations in Coldwater are Office & Administration (668 | 12.6%), and Sales & Related (484 | 9.1%).
Sales and Office Occupations by Sex
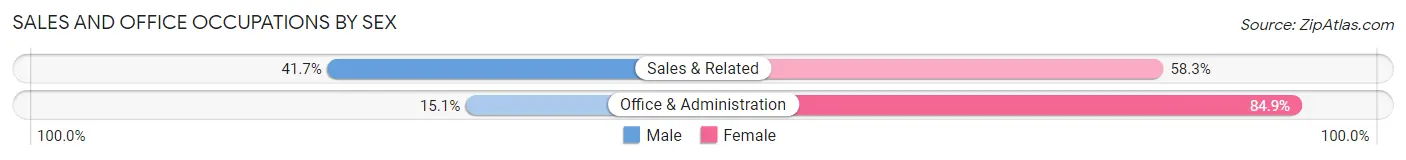
| Occupation | Male | Female |
| Sales & Related | 202 (41.7%) | 282 (58.3%) |
| Office & Administration | 101 (15.1%) | 567 (84.9%) |
| Total (Category) | 303 (26.3%) | 849 (73.7%) |
| Total (Overall) | 2,691 (50.5%) | 2,633 (49.5%) |
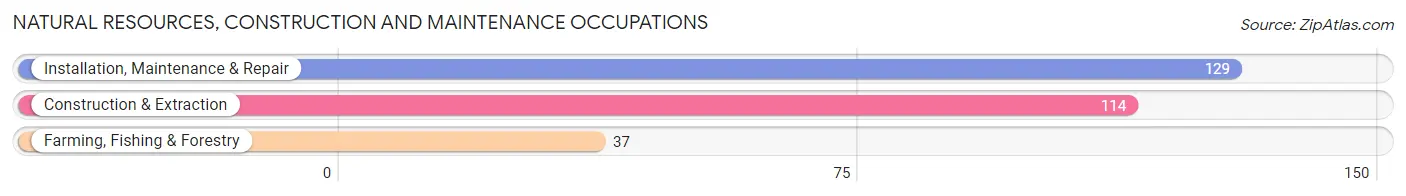
Natural Resources, Construction and Maintenance Occupations
The most common Natural Resources, Construction and Maintenance occupations in Coldwater are Installation, Maintenance & Repair (129 | 2.4%), Construction & Extraction (114 | 2.1%), and Farming, Fishing & Forestry (37 | 0.7%).
Natural Resources, Construction and Maintenance Occupations by Sex
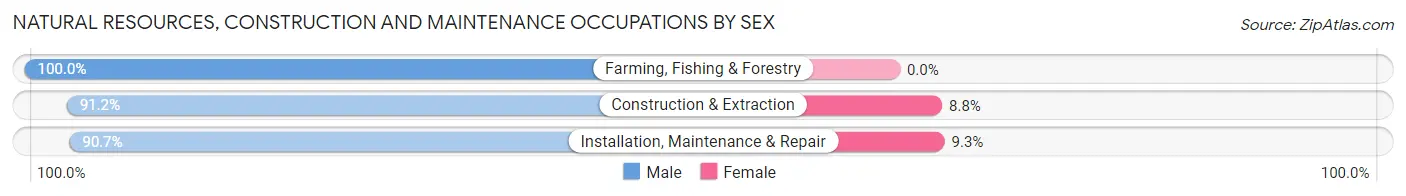
| Occupation | Male | Female |
| Farming, Fishing & Forestry | 37 (100.0%) | 0 (0.0%) |
| Construction & Extraction | 104 (91.2%) | 10 (8.8%) |
| Installation, Maintenance & Repair | 117 (90.7%) | 12 (9.3%) |
| Total (Category) | 258 (92.1%) | 22 (7.9%) |
| Total (Overall) | 2,691 (50.5%) | 2,633 (49.5%) |
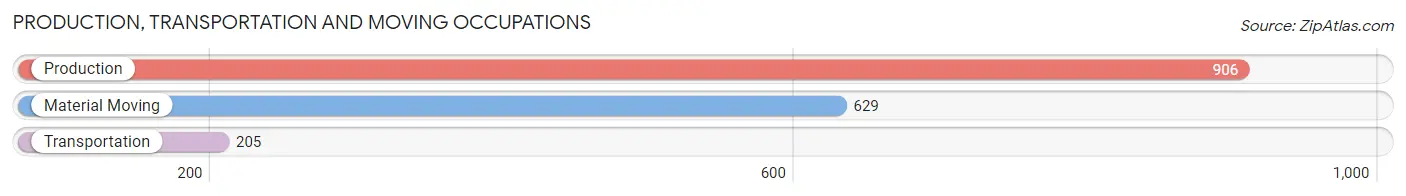
Production, Transportation and Moving Occupations
The most common Production, Transportation and Moving occupations in Coldwater are Production (906 | 17.0%), Material Moving (629 | 11.8%), and Transportation (205 | 3.8%).
Production, Transportation and Moving Occupations by Sex
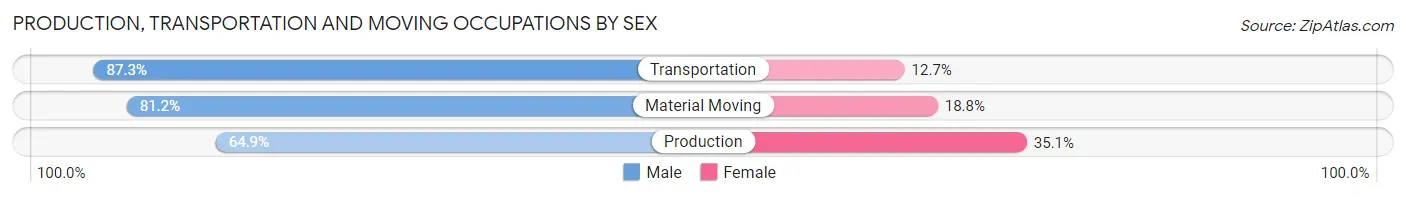
| Occupation | Male | Female |
| Production | 588 (64.9%) | 318 (35.1%) |
| Transportation | 179 (87.3%) | 26 (12.7%) |
| Material Moving | 511 (81.2%) | 118 (18.8%) |
| Total (Category) | 1,278 (73.5%) | 462 (26.6%) |
| Total (Overall) | 2,691 (50.5%) | 2,633 (49.5%) |
Employment Industries by Sex in Coldwater
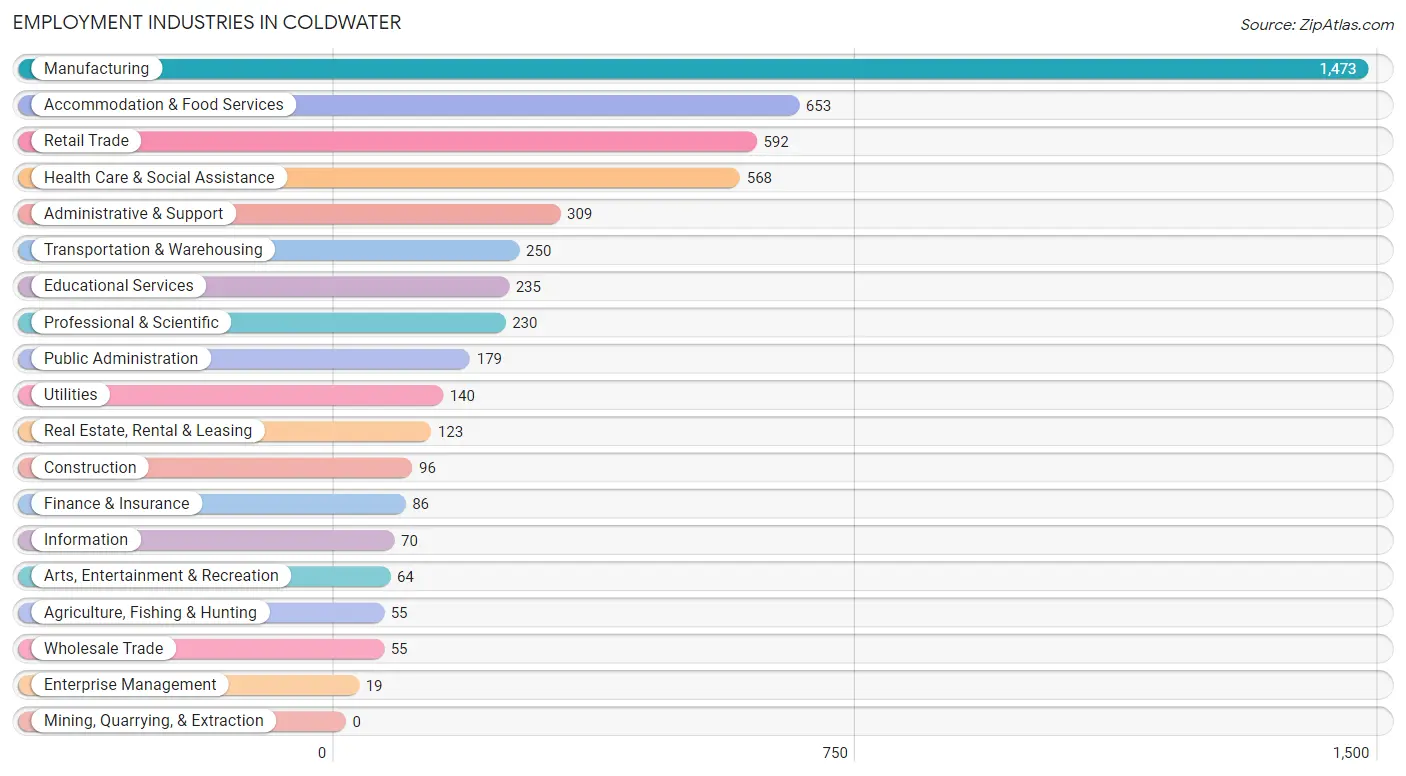
Employment Industries in Coldwater
The major employment industries in Coldwater include Manufacturing (1,473 | 27.7%), Accommodation & Food Services (653 | 12.3%), Retail Trade (592 | 11.1%), Health Care & Social Assistance (568 | 10.7%), and Administrative & Support (309 | 5.8%).
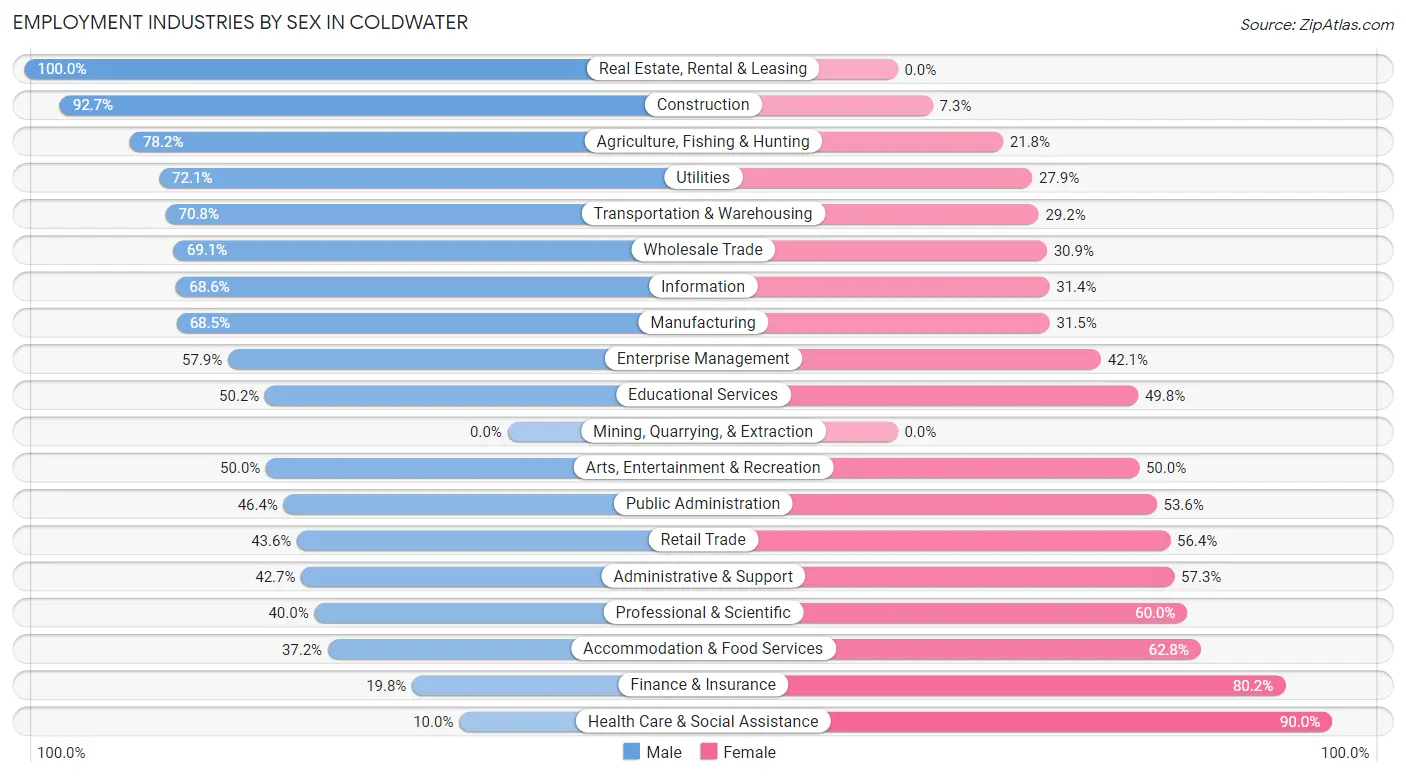
Employment Industries by Sex in Coldwater
The Coldwater industries that see more men than women are Real Estate, Rental & Leasing (100.0%), Construction (92.7%), and Agriculture, Fishing & Hunting (78.2%), whereas the industries that tend to have a higher number of women are Health Care & Social Assistance (90.0%), Finance & Insurance (80.2%), and Accommodation & Food Services (62.8%).
| Industry | Male | Female |
| Agriculture, Fishing & Hunting | 43 (78.2%) | 12 (21.8%) |
| Mining, Quarrying, & Extraction | 0 (0.0%) | 0 (0.0%) |
| Construction | 89 (92.7%) | 7 (7.3%) |
| Manufacturing | 1,009 (68.5%) | 464 (31.5%) |
| Wholesale Trade | 38 (69.1%) | 17 (30.9%) |
| Retail Trade | 258 (43.6%) | 334 (56.4%) |
| Transportation & Warehousing | 177 (70.8%) | 73 (29.2%) |
| Utilities | 101 (72.1%) | 39 (27.9%) |
| Information | 48 (68.6%) | 22 (31.4%) |
| Finance & Insurance | 17 (19.8%) | 69 (80.2%) |
| Real Estate, Rental & Leasing | 123 (100.0%) | 0 (0.0%) |
| Professional & Scientific | 92 (40.0%) | 138 (60.0%) |
| Enterprise Management | 11 (57.9%) | 8 (42.1%) |
| Administrative & Support | 132 (42.7%) | 177 (57.3%) |
| Educational Services | 118 (50.2%) | 117 (49.8%) |
| Health Care & Social Assistance | 57 (10.0%) | 511 (90.0%) |
| Arts, Entertainment & Recreation | 32 (50.0%) | 32 (50.0%) |
| Accommodation & Food Services | 243 (37.2%) | 410 (62.8%) |
| Public Administration | 83 (46.4%) | 96 (53.6%) |
| Total | 2,691 (50.5%) | 2,633 (49.5%) |
Education in Coldwater
School Enrollment in Coldwater
The most common levels of schooling among the 2,804 students in Coldwater are middle school (865 | 30.8%), high school (664 | 23.7%), and elementary school (634 | 22.6%).
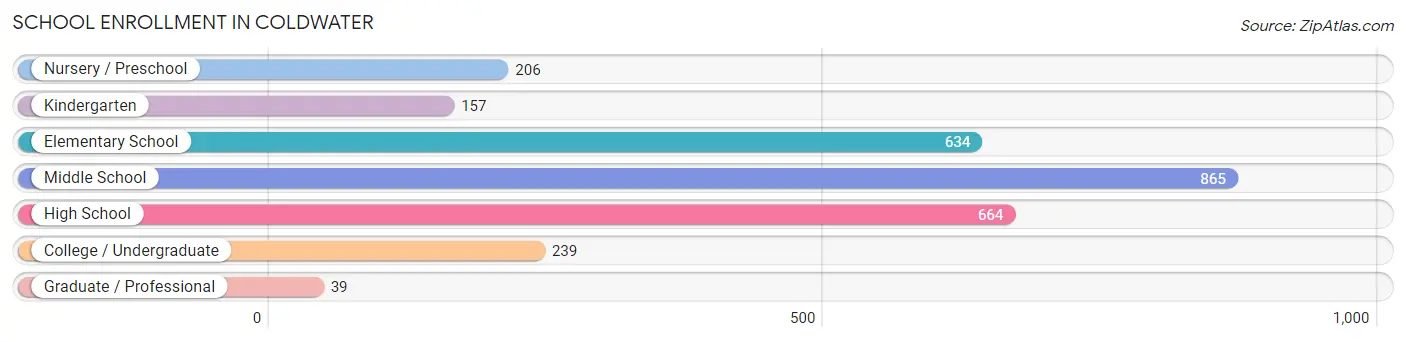
| School Level | # Students | % Students |
| Nursery / Preschool | 206 | 7.3% |
| Kindergarten | 157 | 5.6% |
| Elementary School | 634 | 22.6% |
| Middle School | 865 | 30.8% |
| High School | 664 | 23.7% |
| College / Undergraduate | 239 | 8.5% |
| Graduate / Professional | 39 | 1.4% |
| Total | 2,804 | 100.0% |
School Enrollment by Age by Funding Source in Coldwater
Out of a total of 2,804 students who are enrolled in schools in Coldwater, 196 (7.0%) attend a private institution, while the remaining 2,608 (93.0%) are enrolled in public schools. The age group of 35 years and over has the highest likelihood of being enrolled in private schools, with 55 (85.9% in the age bracket) enrolled. Conversely, the age group of 15 to 17 year olds has the lowest likelihood of being enrolled in a private school, with 462 (100.0% in the age bracket) attending a public institution.
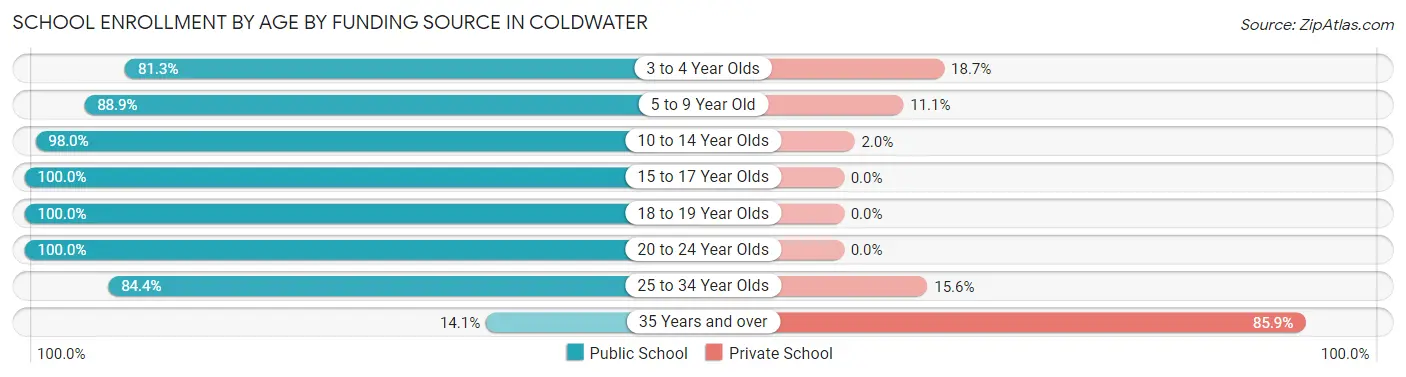
| Age Bracket | Public School | Private School |
| 3 to 4 Year Olds | 126 (81.3%) | 29 (18.7%) |
| 5 to 9 Year Old | 632 (88.9%) | 79 (11.1%) |
| 10 to 14 Year Olds | 1,024 (98.0%) | 21 (2.0%) |
| 15 to 17 Year Olds | 462 (100.0%) | 0 (0.0%) |
| 18 to 19 Year Olds | 151 (100.0%) | 0 (0.0%) |
| 20 to 24 Year Olds | 139 (100.0%) | 0 (0.0%) |
| 25 to 34 Year Olds | 65 (84.4%) | 12 (15.6%) |
| 35 Years and over | 9 (14.1%) | 55 (85.9%) |
| Total | 2,608 (93.0%) | 196 (7.0%) |
Educational Attainment by Field of Study in Coldwater
Business (352 | 27.9%), education (284 | 22.5%), science & technology (195 | 15.5%), social sciences (129 | 10.2%), and literature & languages (75 | 5.9%) are the most common fields of study among 1,260 individuals in Coldwater who have obtained a bachelor's degree or higher.
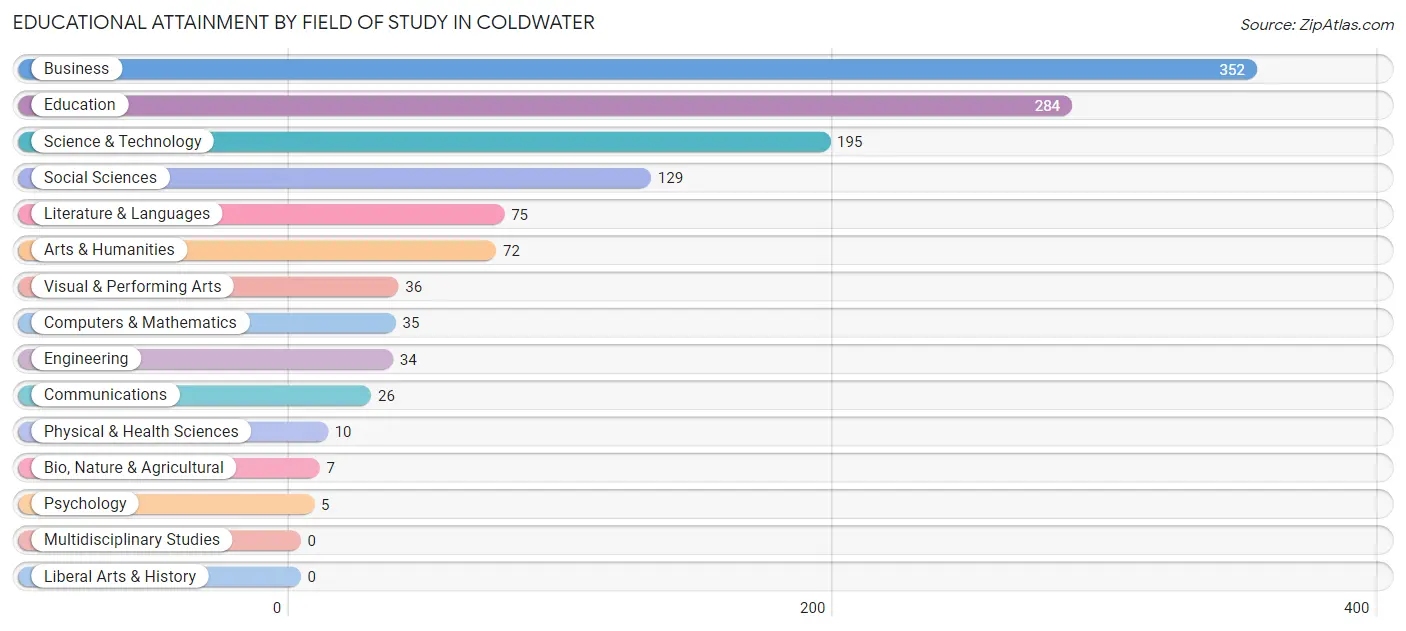
| Field of Study | # Graduates | % Graduates |
| Computers & Mathematics | 35 | 2.8% |
| Bio, Nature & Agricultural | 7 | 0.6% |
| Physical & Health Sciences | 10 | 0.8% |
| Psychology | 5 | 0.4% |
| Social Sciences | 129 | 10.2% |
| Engineering | 34 | 2.7% |
| Multidisciplinary Studies | 0 | 0.0% |
| Science & Technology | 195 | 15.5% |
| Business | 352 | 27.9% |
| Education | 284 | 22.5% |
| Literature & Languages | 75 | 5.9% |
| Liberal Arts & History | 0 | 0.0% |
| Visual & Performing Arts | 36 | 2.9% |
| Communications | 26 | 2.1% |
| Arts & Humanities | 72 | 5.7% |
| Total | 1,260 | 100.0% |
Transportation & Commute in Coldwater
Vehicle Availability by Sex in Coldwater
The most prevalent vehicle ownership categories in Coldwater are males with 2 vehicles (1,379, accounting for 51.8%) and females with 2 vehicles (1,168, making up 53.4%).
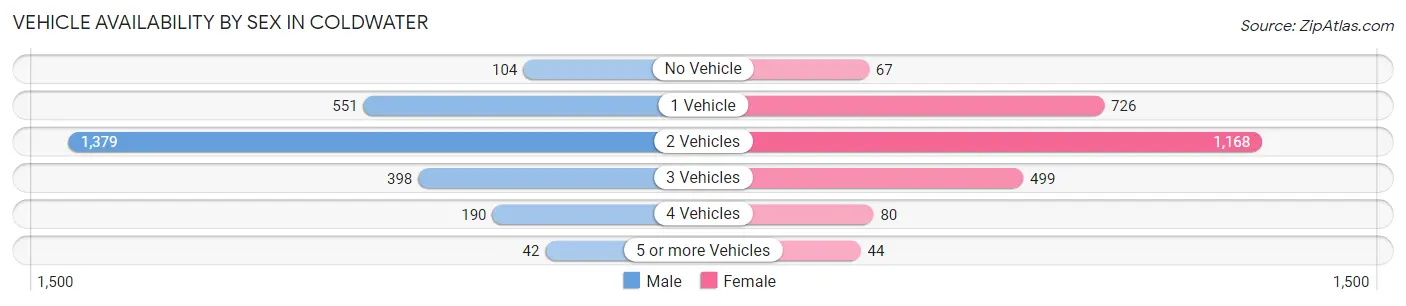
| Vehicles Available | Male | Female |
| No Vehicle | 104 (3.9%) | 67 (2.6%) |
| 1 Vehicle | 551 (20.7%) | 726 (28.1%) |
| 2 Vehicles | 1,379 (51.8%) | 1,168 (45.2%) |
| 3 Vehicles | 398 (14.9%) | 499 (19.3%) |
| 4 Vehicles | 190 (7.1%) | 80 (3.1%) |
| 5 or more Vehicles | 42 (1.6%) | 44 (1.7%) |
| Total | 2,664 (100.0%) | 2,584 (100.0%) |
Commute Time in Coldwater
The most frequently occuring commute durations in Coldwater are 5 to 9 minutes (1,508 commuters, 29.9%), 10 to 14 minutes (1,087 commuters, 21.5%), and 15 to 19 minutes (522 commuters, 10.3%).
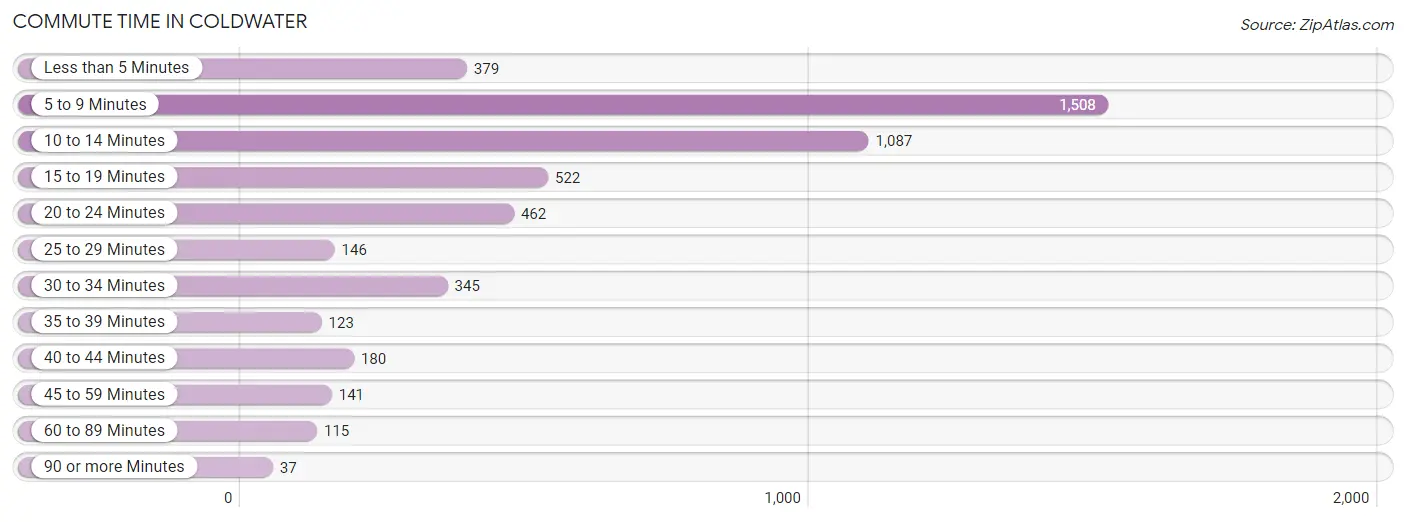
| Commute Time | # Commuters | % Commuters |
| Less than 5 Minutes | 379 | 7.5% |
| 5 to 9 Minutes | 1,508 | 29.9% |
| 10 to 14 Minutes | 1,087 | 21.5% |
| 15 to 19 Minutes | 522 | 10.3% |
| 20 to 24 Minutes | 462 | 9.2% |
| 25 to 29 Minutes | 146 | 2.9% |
| 30 to 34 Minutes | 345 | 6.8% |
| 35 to 39 Minutes | 123 | 2.4% |
| 40 to 44 Minutes | 180 | 3.6% |
| 45 to 59 Minutes | 141 | 2.8% |
| 60 to 89 Minutes | 115 | 2.3% |
| 90 or more Minutes | 37 | 0.7% |
Commute Time by Sex in Coldwater
The most common commute times in Coldwater are 5 to 9 minutes (761 commuters, 29.0%) for males and 5 to 9 minutes (747 commuters, 30.9%) for females.
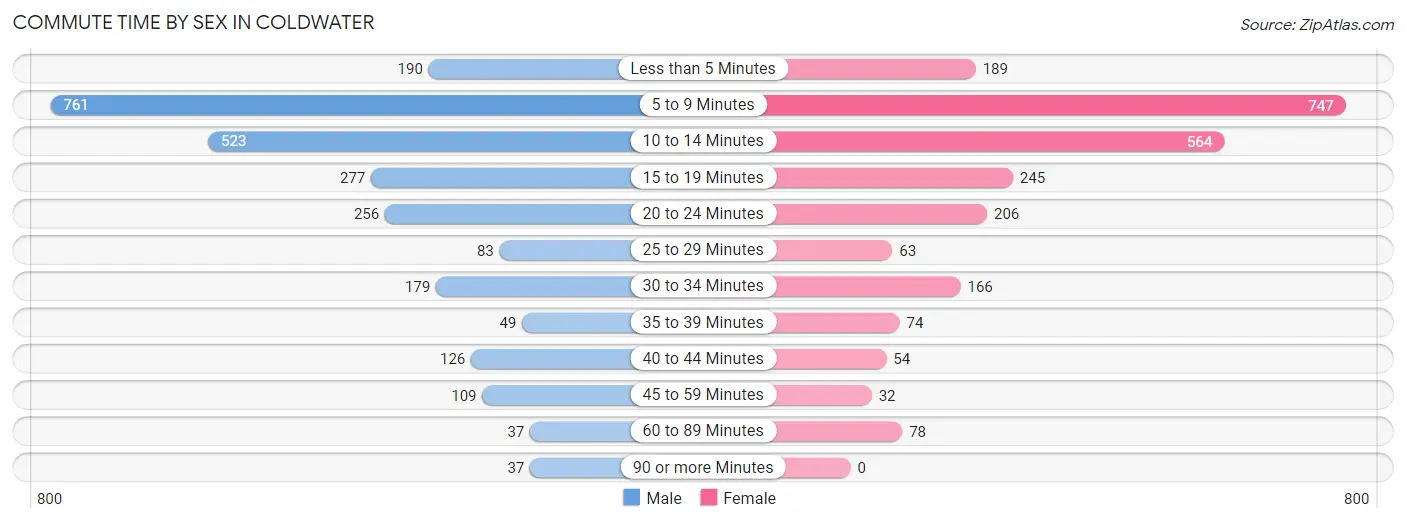
| Commute Time | Male | Female |
| Less than 5 Minutes | 190 (7.2%) | 189 (7.8%) |
| 5 to 9 Minutes | 761 (29.0%) | 747 (30.9%) |
| 10 to 14 Minutes | 523 (19.9%) | 564 (23.3%) |
| 15 to 19 Minutes | 277 (10.5%) | 245 (10.1%) |
| 20 to 24 Minutes | 256 (9.7%) | 206 (8.5%) |
| 25 to 29 Minutes | 83 (3.2%) | 63 (2.6%) |
| 30 to 34 Minutes | 179 (6.8%) | 166 (6.9%) |
| 35 to 39 Minutes | 49 (1.9%) | 74 (3.1%) |
| 40 to 44 Minutes | 126 (4.8%) | 54 (2.2%) |
| 45 to 59 Minutes | 109 (4.2%) | 32 (1.3%) |
| 60 to 89 Minutes | 37 (1.4%) | 78 (3.2%) |
| 90 or more Minutes | 37 (1.4%) | 0 (0.0%) |
Time of Departure to Work by Sex in Coldwater
The most frequent times of departure to work in Coldwater are 5:30 AM to 5:59 AM (506, 19.3%) for males and 7:30 AM to 7:59 AM (626, 25.9%) for females.
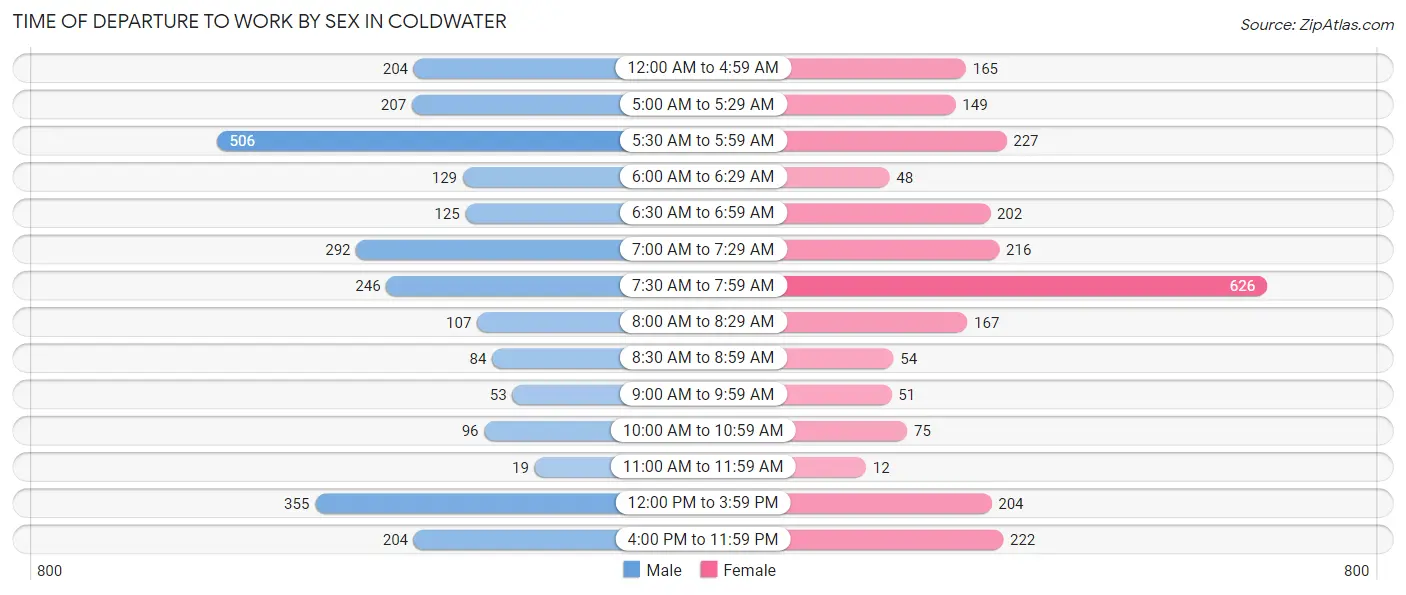
| Time of Departure | Male | Female |
| 12:00 AM to 4:59 AM | 204 (7.8%) | 165 (6.8%) |
| 5:00 AM to 5:29 AM | 207 (7.9%) | 149 (6.2%) |
| 5:30 AM to 5:59 AM | 506 (19.3%) | 227 (9.4%) |
| 6:00 AM to 6:29 AM | 129 (4.9%) | 48 (2.0%) |
| 6:30 AM to 6:59 AM | 125 (4.8%) | 202 (8.4%) |
| 7:00 AM to 7:29 AM | 292 (11.1%) | 216 (8.9%) |
| 7:30 AM to 7:59 AM | 246 (9.4%) | 626 (25.9%) |
| 8:00 AM to 8:29 AM | 107 (4.1%) | 167 (6.9%) |
| 8:30 AM to 8:59 AM | 84 (3.2%) | 54 (2.2%) |
| 9:00 AM to 9:59 AM | 53 (2.0%) | 51 (2.1%) |
| 10:00 AM to 10:59 AM | 96 (3.6%) | 75 (3.1%) |
| 11:00 AM to 11:59 AM | 19 (0.7%) | 12 (0.5%) |
| 12:00 PM to 3:59 PM | 355 (13.5%) | 204 (8.4%) |
| 4:00 PM to 11:59 PM | 204 (7.8%) | 222 (9.2%) |
| Total | 2,627 (100.0%) | 2,418 (100.0%) |
Housing Occupancy in Coldwater
Occupancy by Ownership in Coldwater
Of the total 4,518 dwellings in Coldwater, owner-occupied units account for 2,752 (60.9%), while renter-occupied units make up 1,766 (39.1%).
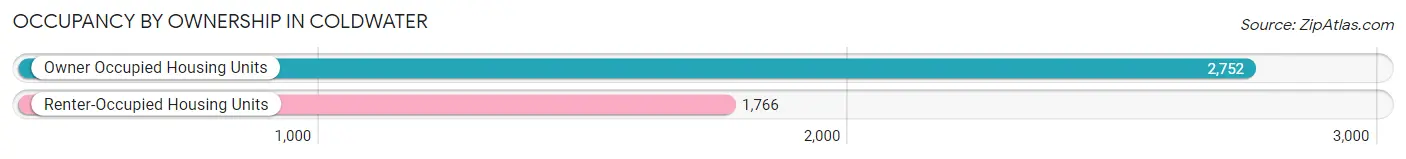
| Occupancy | # Housing Units | % Housing Units |
| Owner Occupied Housing Units | 2,752 | 60.9% |
| Renter-Occupied Housing Units | 1,766 | 39.1% |
| Total Occupied Housing Units | 4,518 | 100.0% |
Occupancy by Household Size in Coldwater
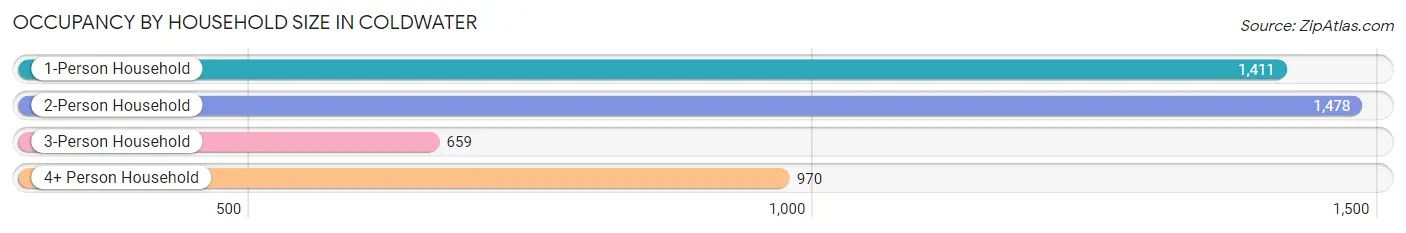
| Household Size | # Housing Units | % Housing Units |
| 1-Person Household | 1,411 | 31.2% |
| 2-Person Household | 1,478 | 32.7% |
| 3-Person Household | 659 | 14.6% |
| 4+ Person Household | 970 | 21.5% |
| Total Housing Units | 4,518 | 100.0% |
Occupancy by Ownership by Household Size in Coldwater
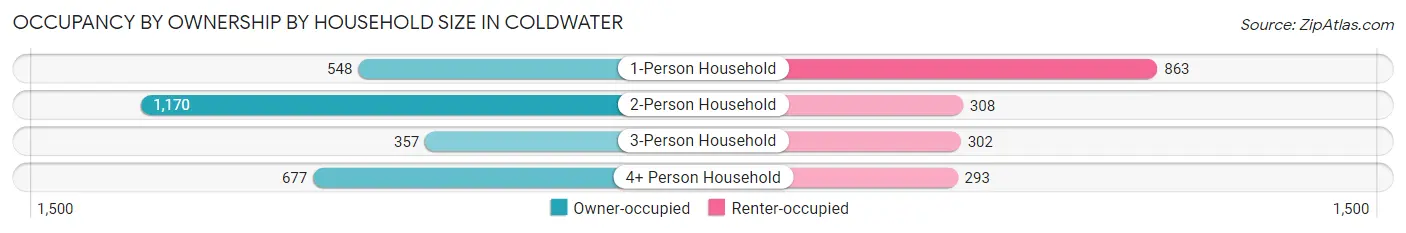
| Household Size | Owner-occupied | Renter-occupied |
| 1-Person Household | 548 (38.8%) | 863 (61.2%) |
| 2-Person Household | 1,170 (79.2%) | 308 (20.8%) |
| 3-Person Household | 357 (54.2%) | 302 (45.8%) |
| 4+ Person Household | 677 (69.8%) | 293 (30.2%) |
| Total Housing Units | 2,752 (60.9%) | 1,766 (39.1%) |
Occupancy by Educational Attainment in Coldwater
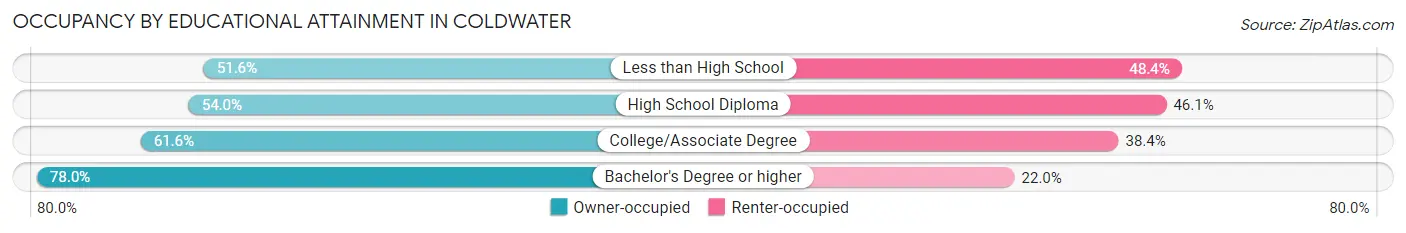
| Household Size | Owner-occupied | Renter-occupied |
| Less than High School | 182 (51.6%) | 171 (48.4%) |
| High School Diploma | 840 (53.9%) | 717 (46.1%) |
| College/Associate Degree | 1,140 (61.6%) | 712 (38.4%) |
| Bachelor's Degree or higher | 590 (78.0%) | 166 (22.0%) |
Occupancy by Age of Householder in Coldwater
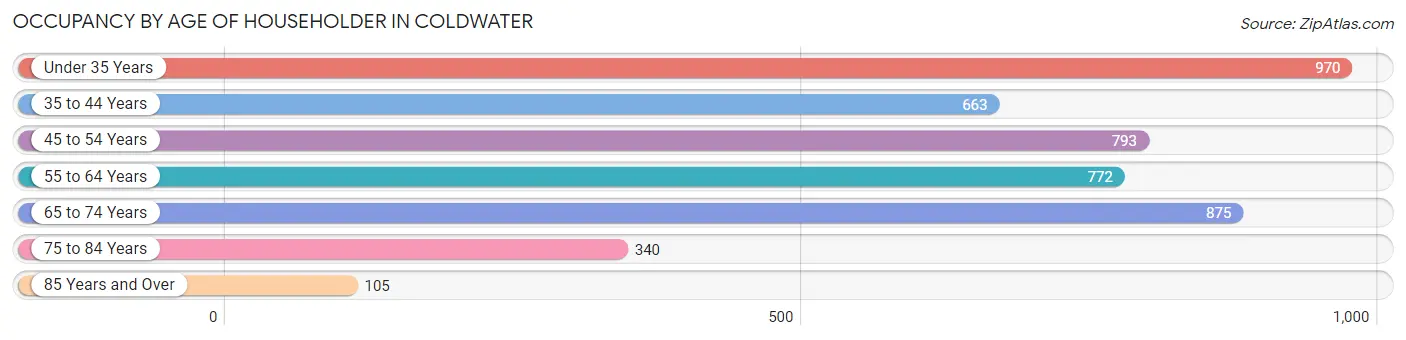
| Age Bracket | # Households | % Households |
| Under 35 Years | 970 | 21.5% |
| 35 to 44 Years | 663 | 14.7% |
| 45 to 54 Years | 793 | 17.5% |
| 55 to 64 Years | 772 | 17.1% |
| 65 to 74 Years | 875 | 19.4% |
| 75 to 84 Years | 340 | 7.5% |
| 85 Years and Over | 105 | 2.3% |
| Total | 4,518 | 100.0% |
Housing Finances in Coldwater
Median Income by Occupancy in Coldwater
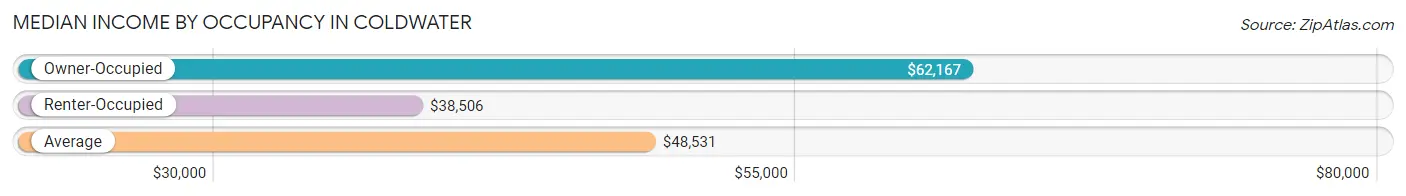
| Occupancy Type | # Households | Median Income |
| Owner-Occupied | 2,752 (60.9%) | $62,167 |
| Renter-Occupied | 1,766 (39.1%) | $38,506 |
| Average | 4,518 (100.0%) | $48,531 |
Occupancy by Householder Income Bracket in Coldwater
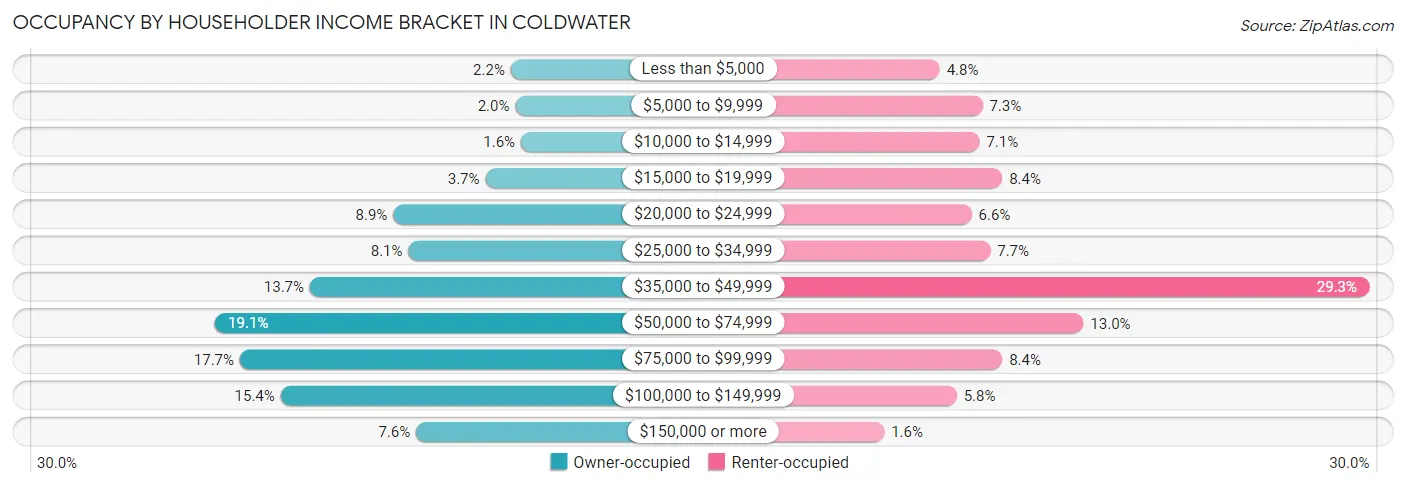
| Income Bracket | Owner-occupied | Renter-occupied |
| Less than $5,000 | 61 (2.2%) | 85 (4.8%) |
| $5,000 to $9,999 | 54 (2.0%) | 128 (7.2%) |
| $10,000 to $14,999 | 45 (1.6%) | 125 (7.1%) |
| $15,000 to $19,999 | 101 (3.7%) | 148 (8.4%) |
| $20,000 to $24,999 | 246 (8.9%) | 117 (6.6%) |
| $25,000 to $34,999 | 222 (8.1%) | 136 (7.7%) |
| $35,000 to $49,999 | 377 (13.7%) | 518 (29.3%) |
| $50,000 to $74,999 | 526 (19.1%) | 230 (13.0%) |
| $75,000 to $99,999 | 487 (17.7%) | 148 (8.4%) |
| $100,000 to $149,999 | 423 (15.4%) | 102 (5.8%) |
| $150,000 or more | 210 (7.6%) | 29 (1.6%) |
| Total | 2,752 (100.0%) | 1,766 (100.0%) |
Monthly Housing Cost Tiers in Coldwater
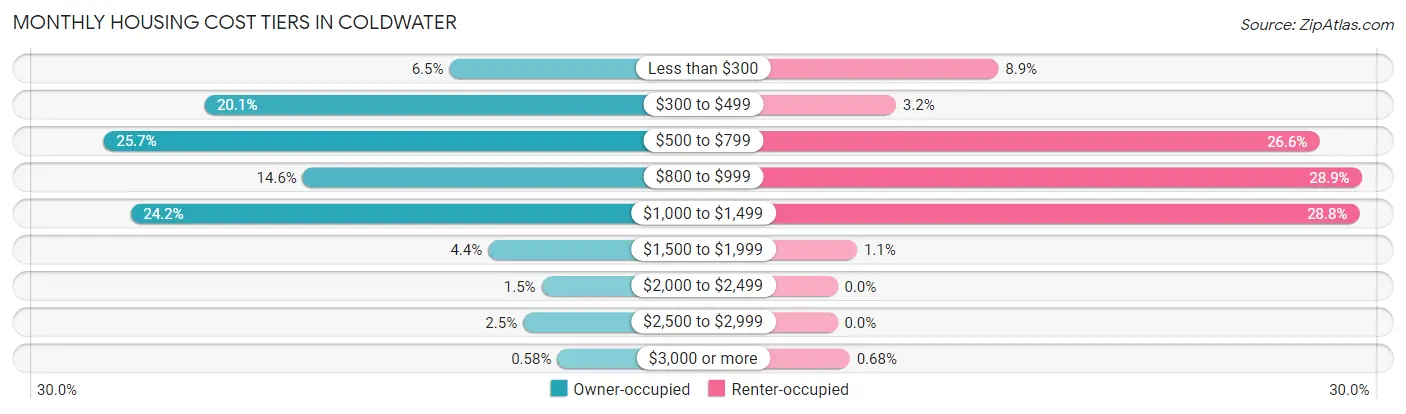
| Monthly Cost | Owner-occupied | Renter-occupied |
| Less than $300 | 180 (6.5%) | 157 (8.9%) |
| $300 to $499 | 553 (20.1%) | 57 (3.2%) |
| $500 to $799 | 706 (25.7%) | 470 (26.6%) |
| $800 to $999 | 403 (14.6%) | 511 (28.9%) |
| $1,000 to $1,499 | 665 (24.2%) | 509 (28.8%) |
| $1,500 to $1,999 | 121 (4.4%) | 19 (1.1%) |
| $2,000 to $2,499 | 40 (1.5%) | 0 (0.0%) |
| $2,500 to $2,999 | 68 (2.5%) | 0 (0.0%) |
| $3,000 or more | 16 (0.6%) | 12 (0.7%) |
| Total | 2,752 (100.0%) | 1,766 (100.0%) |
Physical Housing Characteristics in Coldwater
Housing Structures in Coldwater
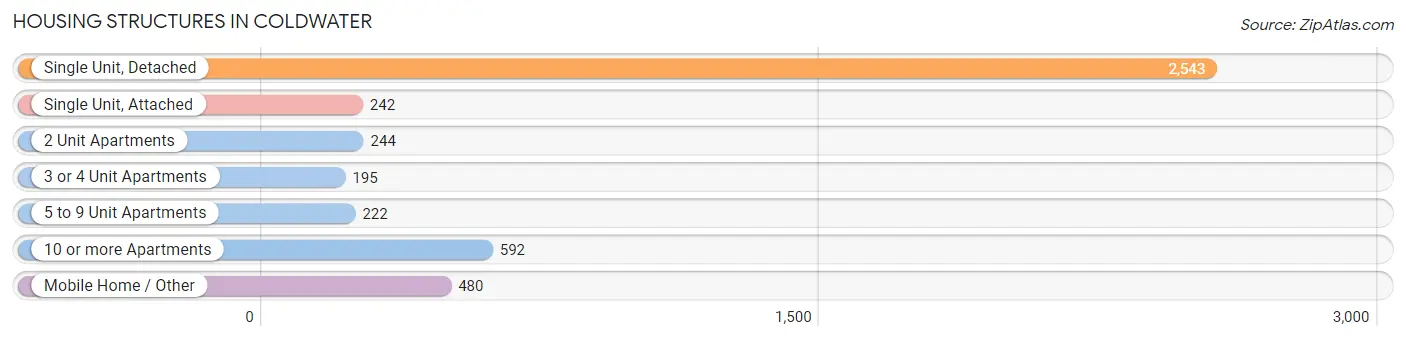
| Structure Type | # Housing Units | % Housing Units |
| Single Unit, Detached | 2,543 | 56.3% |
| Single Unit, Attached | 242 | 5.4% |
| 2 Unit Apartments | 244 | 5.4% |
| 3 or 4 Unit Apartments | 195 | 4.3% |
| 5 to 9 Unit Apartments | 222 | 4.9% |
| 10 or more Apartments | 592 | 13.1% |
| Mobile Home / Other | 480 | 10.6% |
| Total | 4,518 | 100.0% |
Housing Structures by Occupancy in Coldwater
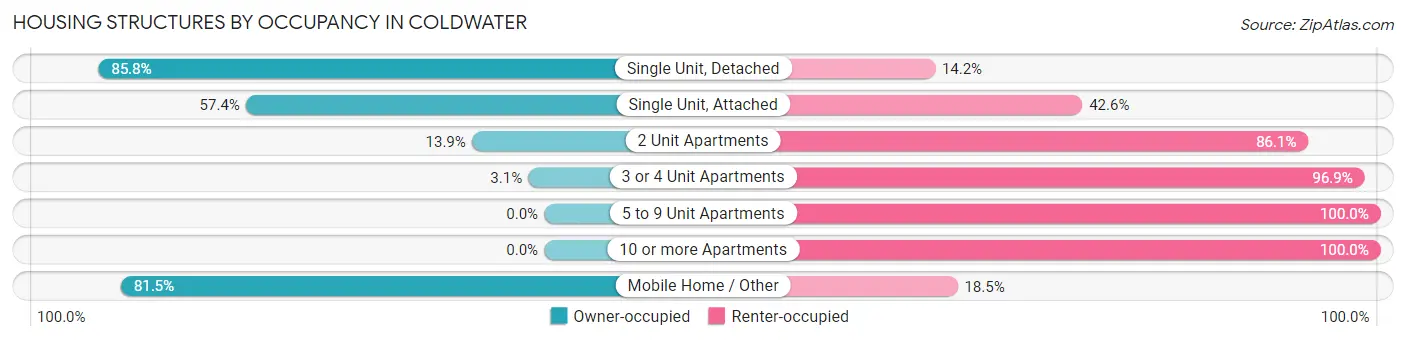
| Structure Type | Owner-occupied | Renter-occupied |
| Single Unit, Detached | 2,182 (85.8%) | 361 (14.2%) |
| Single Unit, Attached | 139 (57.4%) | 103 (42.6%) |
| 2 Unit Apartments | 34 (13.9%) | 210 (86.1%) |
| 3 or 4 Unit Apartments | 6 (3.1%) | 189 (96.9%) |
| 5 to 9 Unit Apartments | 0 (0.0%) | 222 (100.0%) |
| 10 or more Apartments | 0 (0.0%) | 592 (100.0%) |
| Mobile Home / Other | 391 (81.5%) | 89 (18.5%) |
| Total | 2,752 (60.9%) | 1,766 (39.1%) |
Housing Structures by Number of Rooms in Coldwater
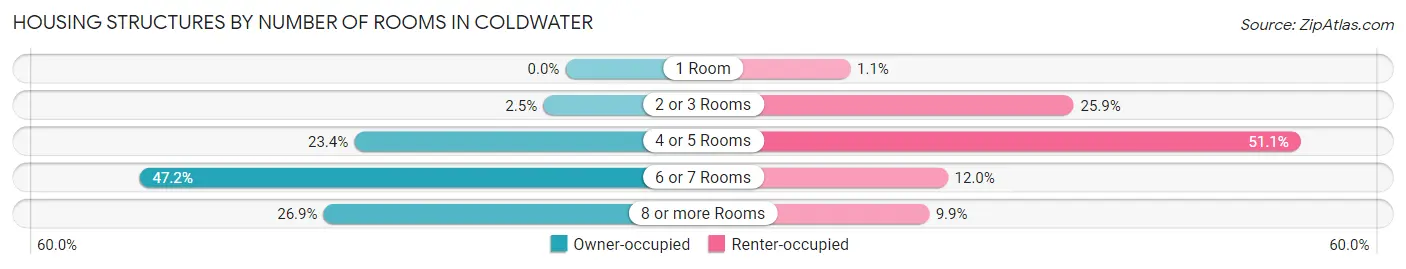
| Number of Rooms | Owner-occupied | Renter-occupied |
| 1 Room | 0 (0.0%) | 20 (1.1%) |
| 2 or 3 Rooms | 68 (2.5%) | 458 (25.9%) |
| 4 or 5 Rooms | 645 (23.4%) | 903 (51.1%) |
| 6 or 7 Rooms | 1,300 (47.2%) | 211 (11.9%) |
| 8 or more Rooms | 739 (26.9%) | 174 (9.9%) |
| Total | 2,752 (100.0%) | 1,766 (100.0%) |
Housing Structure by Heating Type in Coldwater
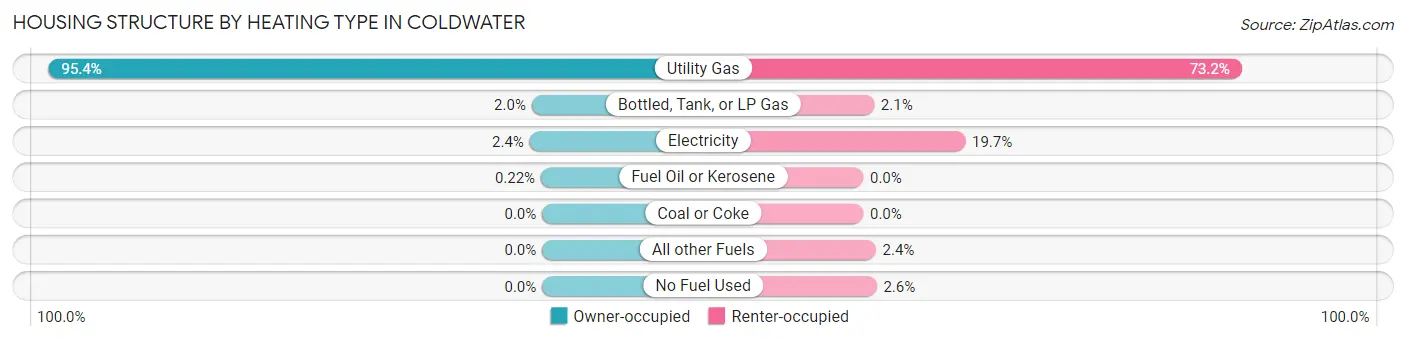
| Heating Type | Owner-occupied | Renter-occupied |
| Utility Gas | 2,625 (95.4%) | 1,292 (73.2%) |
| Bottled, Tank, or LP Gas | 55 (2.0%) | 37 (2.1%) |
| Electricity | 66 (2.4%) | 348 (19.7%) |
| Fuel Oil or Kerosene | 6 (0.2%) | 0 (0.0%) |
| Coal or Coke | 0 (0.0%) | 0 (0.0%) |
| All other Fuels | 0 (0.0%) | 43 (2.4%) |
| No Fuel Used | 0 (0.0%) | 46 (2.6%) |
| Total | 2,752 (100.0%) | 1,766 (100.0%) |
Household Vehicle Usage in Coldwater
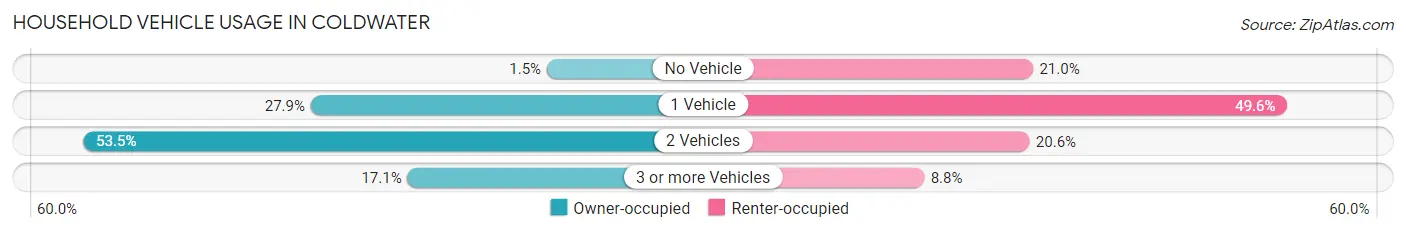
| Vehicles per Household | Owner-occupied | Renter-occupied |
| No Vehicle | 41 (1.5%) | 371 (21.0%) |
| 1 Vehicle | 769 (27.9%) | 875 (49.5%) |
| 2 Vehicles | 1,471 (53.4%) | 364 (20.6%) |
| 3 or more Vehicles | 471 (17.1%) | 156 (8.8%) |
| Total | 2,752 (100.0%) | 1,766 (100.0%) |
Real Estate & Mortgages in Coldwater
Real Estate and Mortgage Overview in Coldwater
| Characteristic | Without Mortgage | With Mortgage |
| Housing Units | 1,159 | 1,593 |
| Median Property Value | $100,300 | $115,600 |
| Median Household Income | $49,386 | $156 |
| Monthly Housing Costs | $462 | $16 |
| Real Estate Taxes | $1,510 | $153 |
Property Value by Mortgage Status in Coldwater
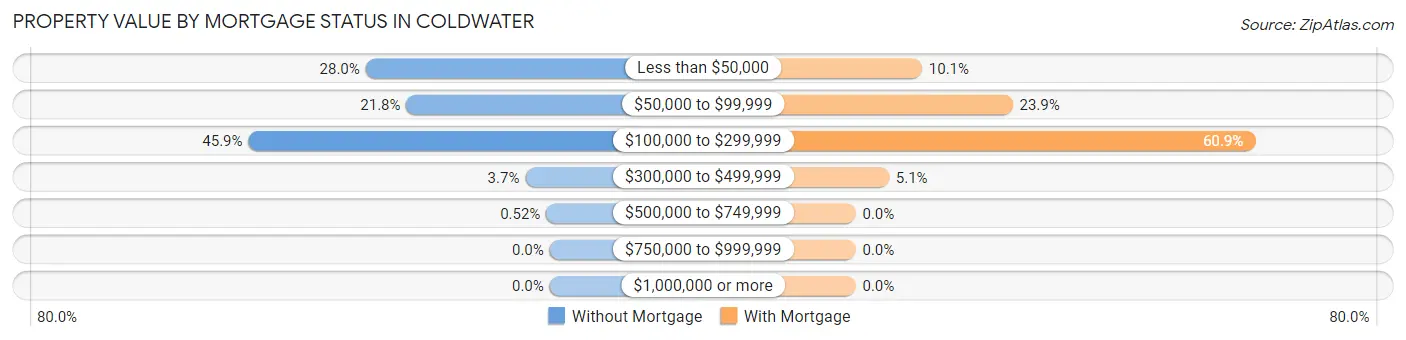
| Property Value | Without Mortgage | With Mortgage |
| Less than $50,000 | 325 (28.0%) | 161 (10.1%) |
| $50,000 to $99,999 | 253 (21.8%) | 381 (23.9%) |
| $100,000 to $299,999 | 532 (45.9%) | 970 (60.9%) |
| $300,000 to $499,999 | 43 (3.7%) | 81 (5.1%) |
| $500,000 to $749,999 | 6 (0.5%) | 0 (0.0%) |
| $750,000 to $999,999 | 0 (0.0%) | 0 (0.0%) |
| $1,000,000 or more | 0 (0.0%) | 0 (0.0%) |
| Total | 1,159 (100.0%) | 1,593 (100.0%) |
Household Income by Mortgage Status in Coldwater
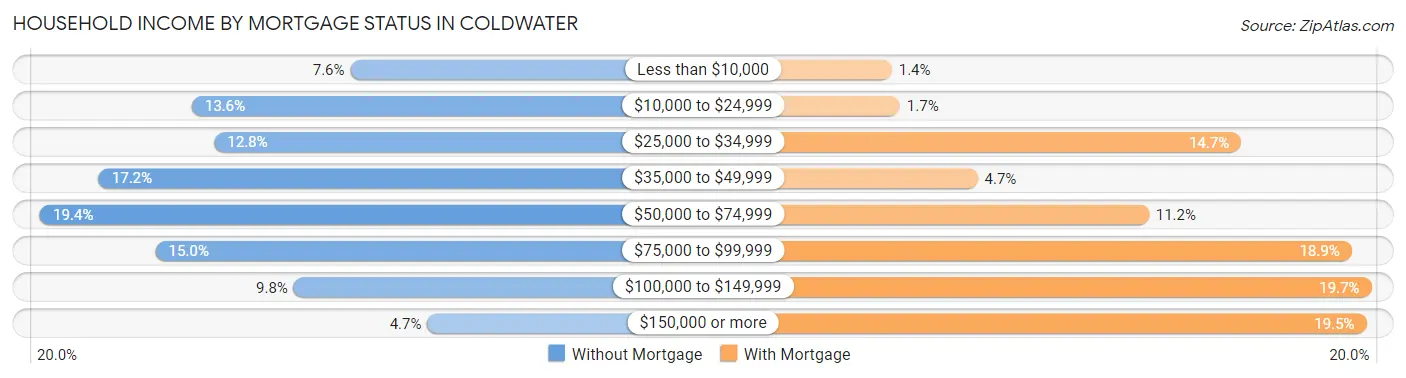
| Household Income | Without Mortgage | With Mortgage |
| Less than $10,000 | 88 (7.6%) | 22 (1.4%) |
| $10,000 to $24,999 | 158 (13.6%) | 27 (1.7%) |
| $25,000 to $34,999 | 148 (12.8%) | 234 (14.7%) |
| $35,000 to $49,999 | 199 (17.2%) | 74 (4.6%) |
| $50,000 to $74,999 | 225 (19.4%) | 178 (11.2%) |
| $75,000 to $99,999 | 174 (15.0%) | 301 (18.9%) |
| $100,000 to $149,999 | 113 (9.8%) | 313 (19.7%) |
| $150,000 or more | 54 (4.7%) | 310 (19.5%) |
| Total | 1,159 (100.0%) | 1,593 (100.0%) |
Property Value to Household Income Ratio in Coldwater
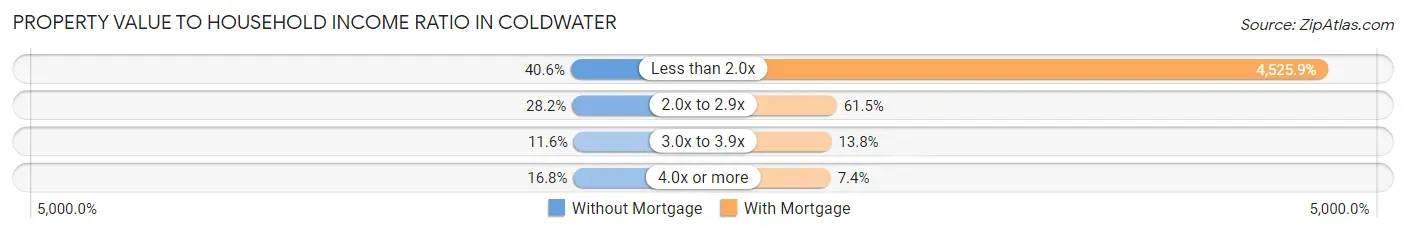
| Value-to-Income Ratio | Without Mortgage | With Mortgage |
| Less than 2.0x | 471 (40.6%) | 72,098 (4,525.9%) |
| 2.0x to 2.9x | 327 (28.2%) | 980 (61.5%) |
| 3.0x to 3.9x | 134 (11.6%) | 219 (13.8%) |
| 4.0x or more | 195 (16.8%) | 118 (7.4%) |
| Total | 1,159 (100.0%) | 1,593 (100.0%) |
Real Estate Taxes by Mortgage Status in Coldwater
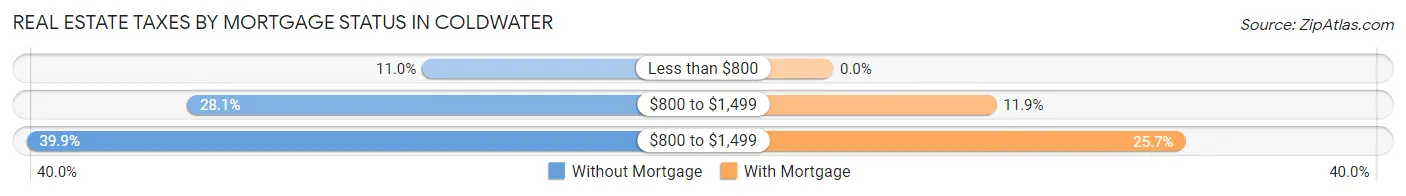
| Property Taxes | Without Mortgage | With Mortgage |
| Less than $800 | 127 (11.0%) | 0 (0.0%) |
| $800 to $1,499 | 326 (28.1%) | 190 (11.9%) |
| $800 to $1,499 | 462 (39.9%) | 410 (25.7%) |
| Total | 1,159 (100.0%) | 1,593 (100.0%) |
Health & Disability in Coldwater
Health Insurance Coverage by Age in Coldwater
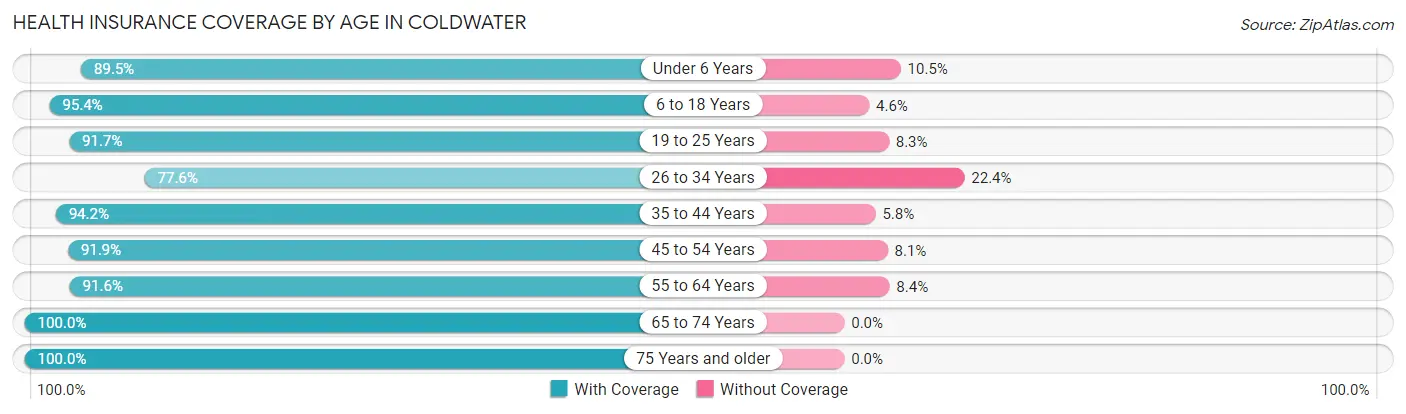
| Age Bracket | With Coverage | Without Coverage |
| Under 6 Years | 817 (89.5%) | 96 (10.5%) |
| 6 to 18 Years | 2,080 (95.4%) | 101 (4.6%) |
| 19 to 25 Years | 1,162 (91.7%) | 105 (8.3%) |
| 26 to 34 Years | 1,175 (77.6%) | 339 (22.4%) |
| 35 to 44 Years | 1,393 (94.2%) | 86 (5.8%) |
| 45 to 54 Years | 1,151 (91.9%) | 101 (8.1%) |
| 55 to 64 Years | 1,275 (91.6%) | 117 (8.4%) |
| 65 to 74 Years | 1,168 (100.0%) | 0 (0.0%) |
| 75 Years and older | 696 (100.0%) | 0 (0.0%) |
| Total | 10,917 (92.0%) | 945 (8.0%) |
Health Insurance Coverage by Citizenship Status in Coldwater
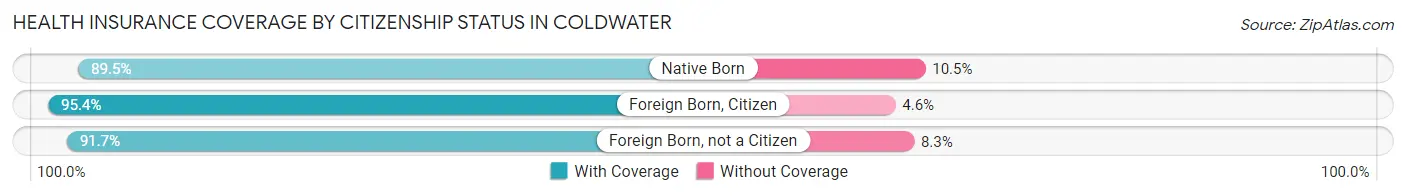
| Citizenship Status | With Coverage | Without Coverage |
| Native Born | 817 (89.5%) | 96 (10.5%) |
| Foreign Born, Citizen | 2,080 (95.4%) | 101 (4.6%) |
| Foreign Born, not a Citizen | 1,162 (91.7%) | 105 (8.3%) |
Health Insurance Coverage by Household Income in Coldwater
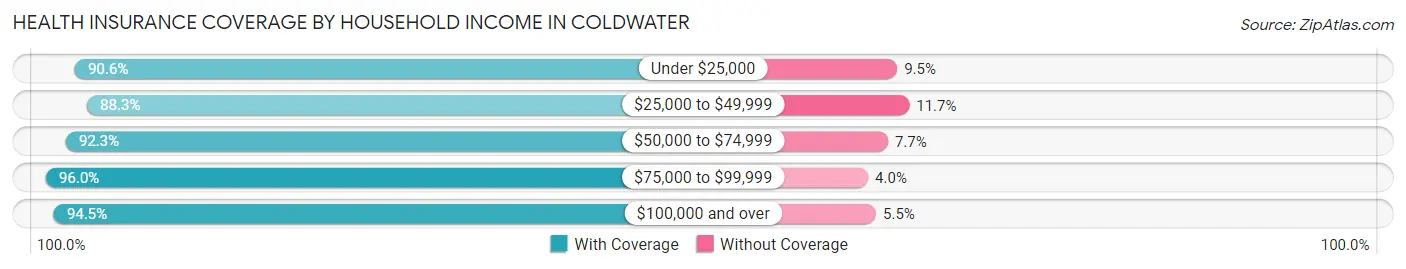
| Household Income | With Coverage | Without Coverage |
| Under $25,000 | 2,223 (90.5%) | 232 (9.5%) |
| $25,000 to $49,999 | 2,541 (88.3%) | 337 (11.7%) |
| $50,000 to $74,999 | 2,009 (92.3%) | 168 (7.7%) |
| $75,000 to $99,999 | 2,041 (96.0%) | 85 (4.0%) |
| $100,000 and over | 2,048 (94.5%) | 119 (5.5%) |
Public vs Private Health Insurance Coverage by Age in Coldwater
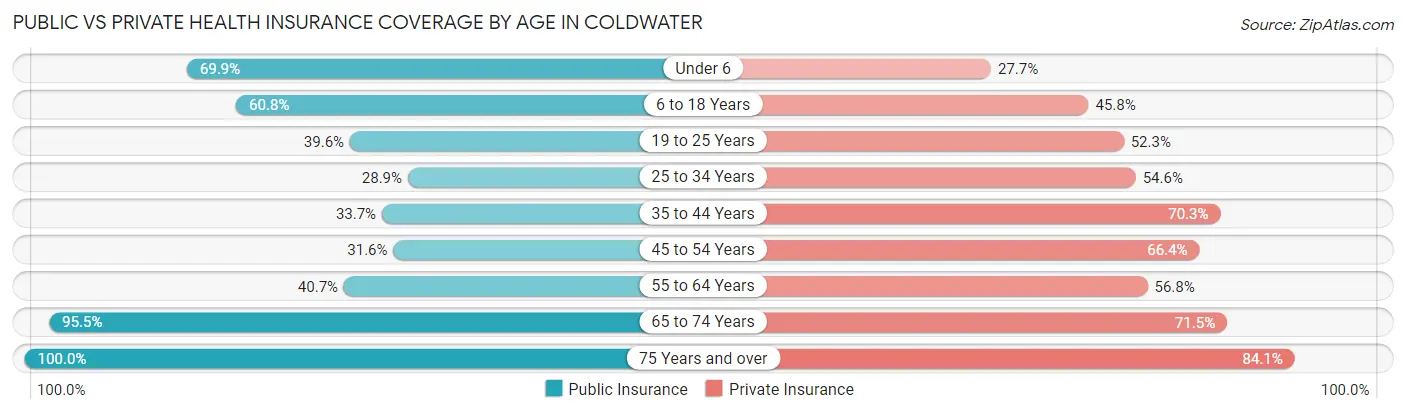
| Age Bracket | Public Insurance | Private Insurance |
| Under 6 | 638 (69.9%) | 253 (27.7%) |
| 6 to 18 Years | 1,325 (60.8%) | 999 (45.8%) |
| 19 to 25 Years | 502 (39.6%) | 663 (52.3%) |
| 25 to 34 Years | 437 (28.9%) | 826 (54.6%) |
| 35 to 44 Years | 498 (33.7%) | 1,039 (70.3%) |
| 45 to 54 Years | 395 (31.6%) | 831 (66.4%) |
| 55 to 64 Years | 567 (40.7%) | 790 (56.8%) |
| 65 to 74 Years | 1,115 (95.5%) | 835 (71.5%) |
| 75 Years and over | 696 (100.0%) | 585 (84.1%) |
| Total | 6,173 (52.0%) | 6,821 (57.5%) |
Disability Status by Sex by Age in Coldwater
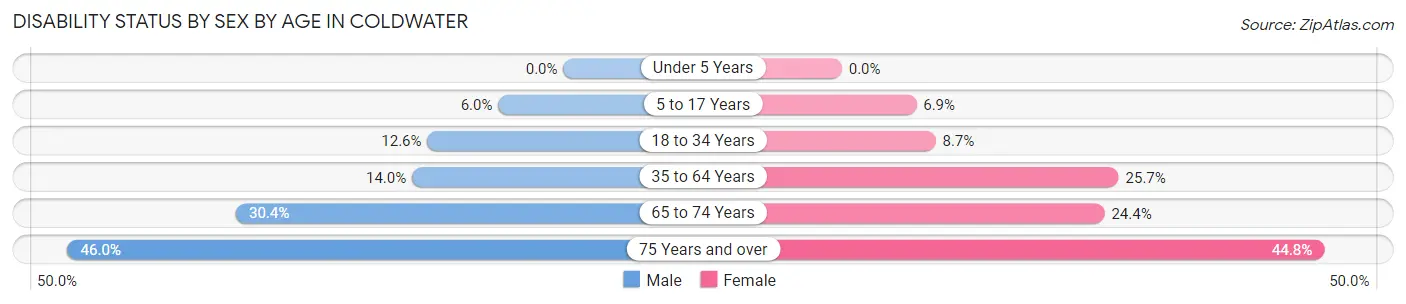
| Age Bracket | Male | Female |
| Under 5 Years | 0 (0.0%) | 0 (0.0%) |
| 5 to 17 Years | 69 (6.0%) | 75 (6.9%) |
| 18 to 34 Years | 168 (12.6%) | 138 (8.7%) |
| 35 to 64 Years | 287 (14.0%) | 534 (25.7%) |
| 65 to 74 Years | 123 (30.4%) | 186 (24.4%) |
| 75 Years and over | 92 (46.0%) | 222 (44.8%) |
Disability Class by Sex by Age in Coldwater
Disability Class: Hearing Difficulty
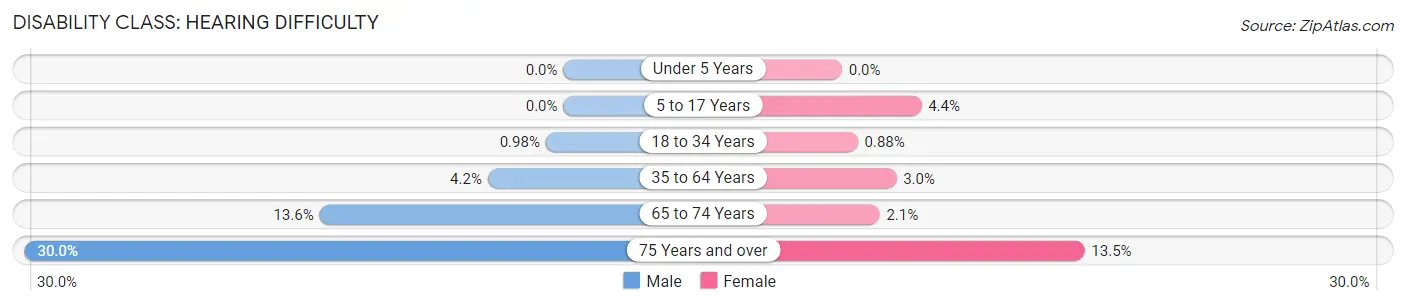
| Age Bracket | Male | Female |
| Under 5 Years | 0 (0.0%) | 0 (0.0%) |
| 5 to 17 Years | 0 (0.0%) | 48 (4.4%) |
| 18 to 34 Years | 13 (1.0%) | 14 (0.9%) |
| 35 to 64 Years | 86 (4.2%) | 63 (3.0%) |
| 65 to 74 Years | 55 (13.6%) | 16 (2.1%) |
| 75 Years and over | 60 (30.0%) | 67 (13.5%) |
Disability Class: Vision Difficulty
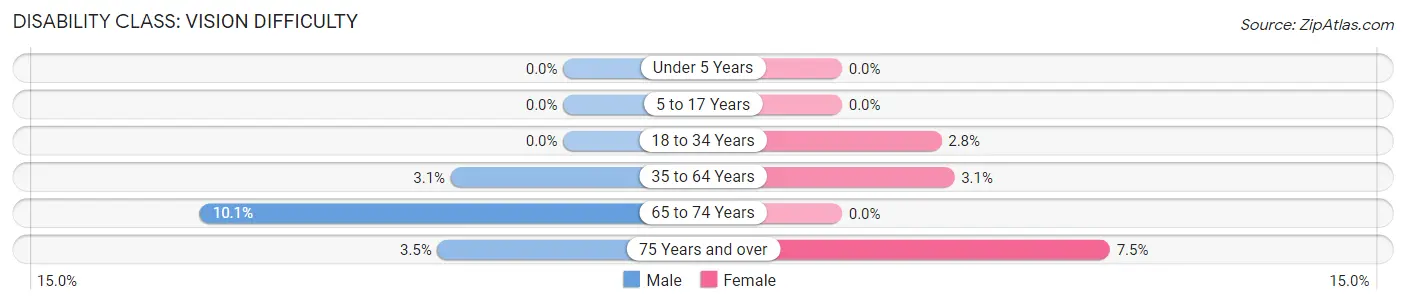
| Age Bracket | Male | Female |
| Under 5 Years | 0 (0.0%) | 0 (0.0%) |
| 5 to 17 Years | 0 (0.0%) | 0 (0.0%) |
| 18 to 34 Years | 0 (0.0%) | 44 (2.8%) |
| 35 to 64 Years | 64 (3.1%) | 65 (3.1%) |
| 65 to 74 Years | 41 (10.1%) | 0 (0.0%) |
| 75 Years and over | 7 (3.5%) | 37 (7.5%) |
Disability Class: Cognitive Difficulty
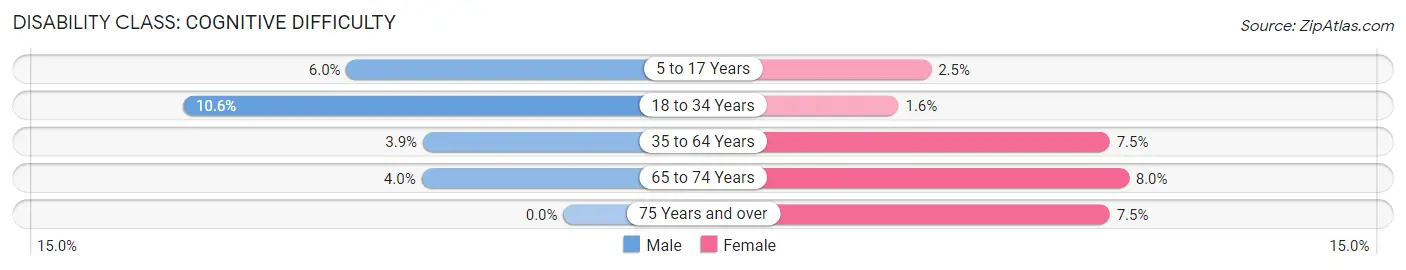
| Age Bracket | Male | Female |
| 5 to 17 Years | 69 (6.0%) | 27 (2.5%) |
| 18 to 34 Years | 141 (10.6%) | 25 (1.6%) |
| 35 to 64 Years | 80 (3.9%) | 155 (7.5%) |
| 65 to 74 Years | 16 (4.0%) | 61 (8.0%) |
| 75 Years and over | 0 (0.0%) | 37 (7.5%) |
Disability Class: Ambulatory Difficulty
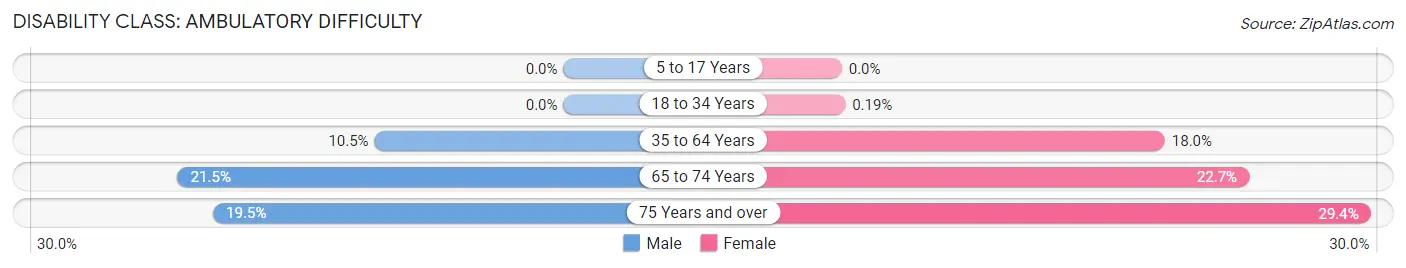
| Age Bracket | Male | Female |
| 5 to 17 Years | 0 (0.0%) | 0 (0.0%) |
| 18 to 34 Years | 0 (0.0%) | 3 (0.2%) |
| 35 to 64 Years | 215 (10.5%) | 374 (18.0%) |
| 65 to 74 Years | 87 (21.5%) | 173 (22.7%) |
| 75 Years and over | 39 (19.5%) | 146 (29.4%) |
Disability Class: Self-Care Difficulty
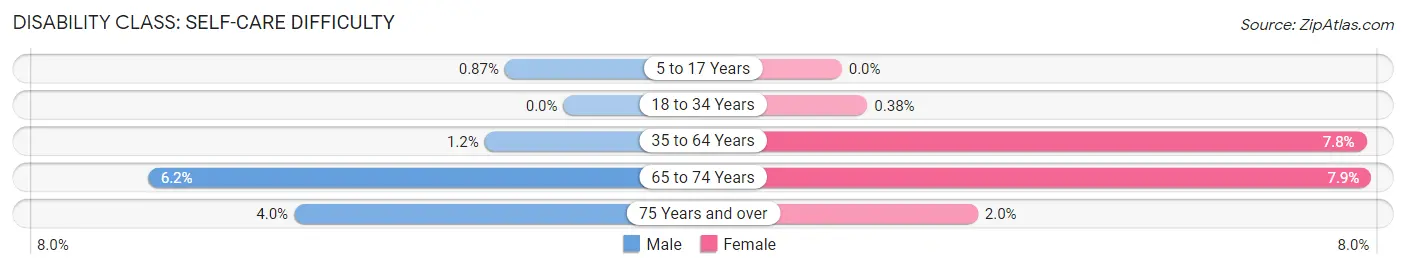
| Age Bracket | Male | Female |
| 5 to 17 Years | 10 (0.9%) | 0 (0.0%) |
| 18 to 34 Years | 0 (0.0%) | 6 (0.4%) |
| 35 to 64 Years | 24 (1.2%) | 162 (7.8%) |
| 65 to 74 Years | 25 (6.2%) | 60 (7.9%) |
| 75 Years and over | 8 (4.0%) | 10 (2.0%) |
Technology Access in Coldwater
Computing Device Access in Coldwater
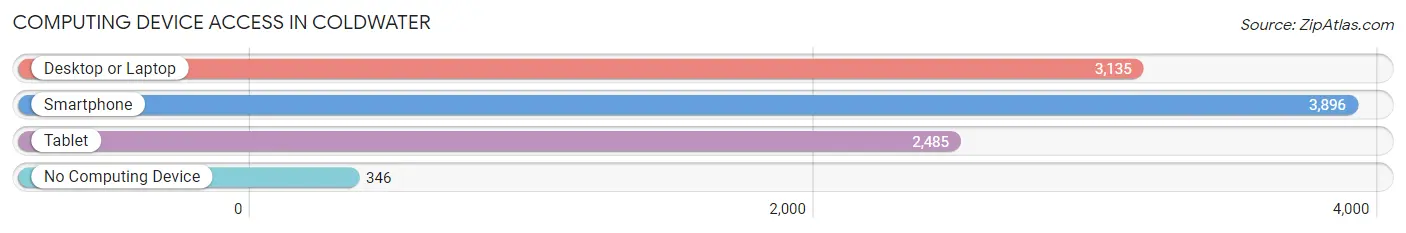
| Device Type | # Households | % Households |
| Desktop or Laptop | 3,135 | 69.4% |
| Smartphone | 3,896 | 86.2% |
| Tablet | 2,485 | 55.0% |
| No Computing Device | 346 | 7.7% |
| Total | 4,518 | 100.0% |
Internet Access in Coldwater
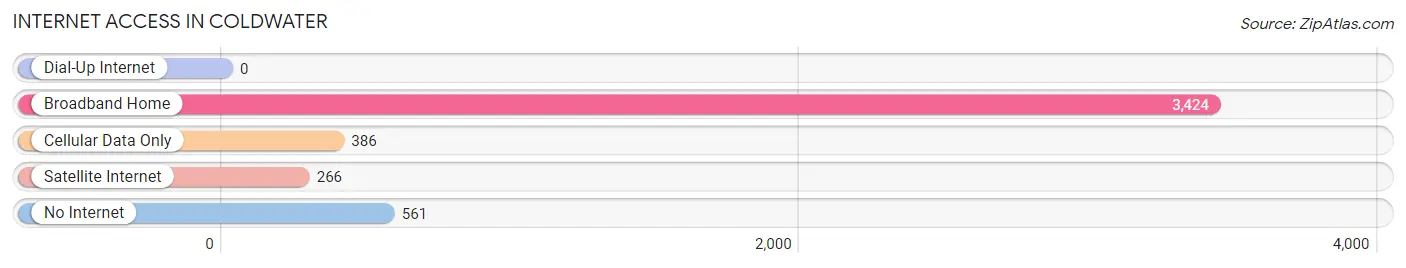
| Internet Type | # Households | % Households |
| Dial-Up Internet | 0 | 0.0% |
| Broadband Home | 3,424 | 75.8% |
| Cellular Data Only | 386 | 8.5% |
| Satellite Internet | 266 | 5.9% |
| No Internet | 561 | 12.4% |
| Total | 4,518 | 100.0% |
Coldwater Summary
Coldwater, Michigan is a city located in Branch County in the south-central region of the state. It is the county seat and the largest city in Branch County. The city is situated on the Coldwater River, which is a tributary of the St. Joseph River. The city is located approximately 50 miles south of Kalamazoo and 60 miles north of Fort Wayne, Indiana. As of the 2010 census, the city had a population of 10,945.
History
The area that is now Coldwater was first settled in 1829 by a group of settlers from New York. The settlement was originally known as “Coldwater Village” and was incorporated as a city in 1837. The city was named after the nearby Coldwater River.
In the late 19th century, Coldwater was a major center for the lumber industry. The city was also home to several factories, including a paper mill, a furniture factory, and a canning factory.
In the early 20th century, Coldwater was a major center for the automotive industry. The city was home to several auto parts manufacturers, including the Coldwater Manufacturing Company, which produced parts for the Ford Model T.
Geography
Coldwater is located at 41°56'N 84°59'W (41.9333, -84.9833). The city is situated on the Coldwater River, which is a tributary of the St. Joseph River. The city is located approximately 50 miles south of Kalamazoo and 60 miles north of Fort Wayne, Indiana.
The city has a total area of 5.2 square miles, all of which is land. The terrain is generally flat, with some rolling hills in the northern part of the city.
Economy
The economy of Coldwater is largely based on manufacturing. The city is home to several factories, including a paper mill, a furniture factory, and a canning factory. The city is also home to several auto parts manufacturers, including the Coldwater Manufacturing Company, which produces parts for the Ford Model T.
The city is also home to several retail stores, including a Walmart Supercenter, a Meijer, and several smaller stores.
Demographics
As of the 2010 census, the city had a population of 10,945. The racial makeup of the city was 92.3% White, 2.7% African American, 0.4% Native American, 0.7% Asian, 0.1% Pacific Islander, 1.7% from other races, and 2.1% from two or more races. Hispanic or Latino of any race were 4.2% of the population.
The median household income in the city was $37,945, and the median family income was $45,945. The per capita income in the city was $19,945. About 11.3% of the population was below the poverty line.
Common Questions
What is Per Capita Income in Coldwater?
Per Capita income in Coldwater is $22,254.
What is the Median Family Income in Coldwater?
Median Family Income in Coldwater is $63,333.
What is the Median Household income in Coldwater?
Median Household Income in Coldwater is $48,531.
What is Income or Wage Gap in Coldwater?
Income or Wage Gap in Coldwater is 2.4%.
Women in Coldwater earn 97.6 cents for every dollar earned by a man.
What is Inequality or Gini Index in Coldwater?
Inequality or Gini Index in Coldwater is 0.41.
What is the Total Population of Coldwater?
Total Population of Coldwater is 13,704.
What is the Total Male Population of Coldwater?
Total Male Population of Coldwater is 7,258.
What is the Total Female Population of Coldwater?
Total Female Population of Coldwater is 6,446.
What is the Ratio of Males per 100 Females in Coldwater?
There are 112.60 Males per 100 Females in Coldwater.
What is the Ratio of Females per 100 Males in Coldwater?
There are 88.81 Females per 100 Males in Coldwater.
What is the Median Population Age in Coldwater?
Median Population Age in Coldwater is 40.2 Years.
What is the Average Family Size in Coldwater
Average Family Size in Coldwater is 3.4 People.
What is the Average Household Size in Coldwater
Average Household Size in Coldwater is 2.6 People.
How Large is the Labor Force in Coldwater?
There are 5,534 People in the Labor Forcein in Coldwater.
What is the Percentage of People in the Labor Force in Coldwater?
49.9% of People are in the Labor Force in Coldwater.
What is the Unemployment Rate in Coldwater?
Unemployment Rate in Coldwater is 3.8%.