Millfield, OH Map & Demographics
Millfield Map
Millfield Overview
$27,642
PER CAPITA INCOME
$31,434
AVG FAMILY INCOME
$32,090
AVG HOUSEHOLD INCOME
0.34
INEQUALITY / GINI INDEX
258
TOTAL POPULATION
143
MALE POPULATION
115
FEMALE POPULATION
124.35
MALES / 100 FEMALES
80.42
FEMALES / 100 MALES
56.5
MEDIAN AGE
2.0
AVG FAMILY SIZE
1.8
AVG HOUSEHOLD SIZE
106
LABOR FORCE [ PEOPLE ]
54.4%
PERCENT IN LABOR FORCE
Millfield Zip Codes
Millfield Area Codes
Income in Millfield
Income Overview in Millfield
Per Capita Income in Millfield is $27,642, while median incomes of families and households are $31,434 and $32,090 respectively.
| Characteristic | Number | Measure |
| Per Capita Income | 258 | $27,642 |
| Median Family Income | 94 | $31,434 |
| Mean Family Income | 94 | $52,113 |
| Median Household Income | 140 | $32,090 |
| Mean Household Income | 140 | $48,377 |
| Income Deficit | 94 | $0 |
| Wage / Income Gap (%) | 258 | 0.00% |
| Wage / Income Gap ($) | 258 | 100.00¢ per $1 |
| Gini / Inequality Index | 258 | 0.34 |
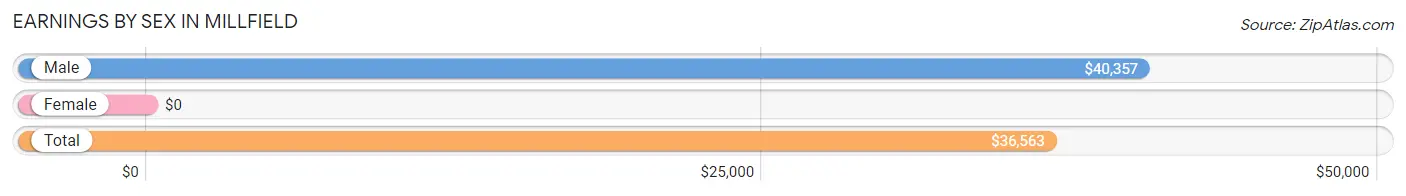
Earnings by Sex in Millfield
| Sex | Number | Average Earnings |
| Male | 70 (66.0%) | $40,357 |
| Female | 36 (34.0%) | $0 |
| Total | 106 (100.0%) | $36,563 |
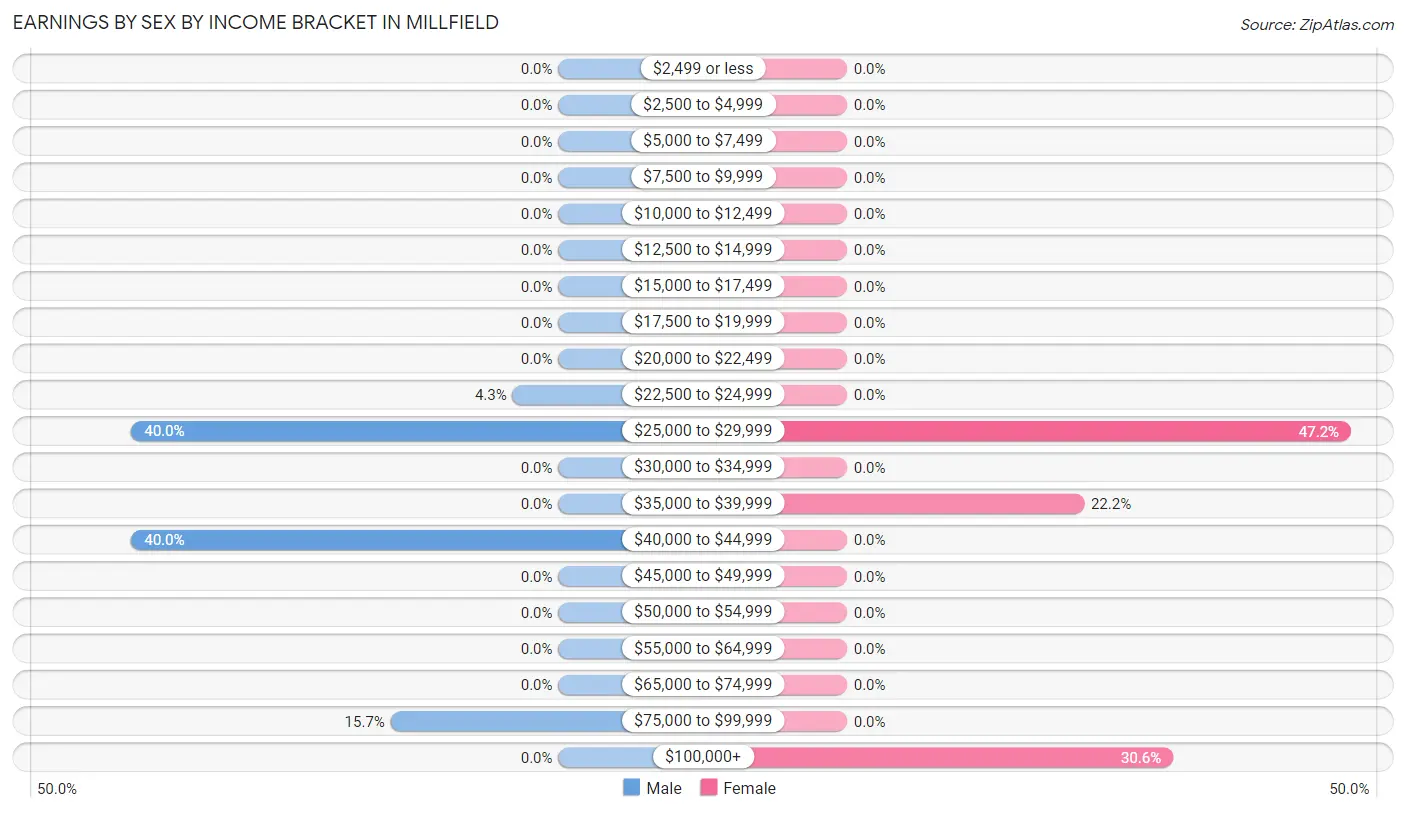
Earnings by Sex by Income Bracket in Millfield
The most common earnings brackets in Millfield are $25,000 to $29,999 for men (28 | 40.0%) and $25,000 to $29,999 for women (17 | 47.2%).
| Income | Male | Female |
| $2,499 or less | 0 (0.0%) | 0 (0.0%) |
| $2,500 to $4,999 | 0 (0.0%) | 0 (0.0%) |
| $5,000 to $7,499 | 0 (0.0%) | 0 (0.0%) |
| $7,500 to $9,999 | 0 (0.0%) | 0 (0.0%) |
| $10,000 to $12,499 | 0 (0.0%) | 0 (0.0%) |
| $12,500 to $14,999 | 0 (0.0%) | 0 (0.0%) |
| $15,000 to $17,499 | 0 (0.0%) | 0 (0.0%) |
| $17,500 to $19,999 | 0 (0.0%) | 0 (0.0%) |
| $20,000 to $22,499 | 0 (0.0%) | 0 (0.0%) |
| $22,500 to $24,999 | 3 (4.3%) | 0 (0.0%) |
| $25,000 to $29,999 | 28 (40.0%) | 17 (47.2%) |
| $30,000 to $34,999 | 0 (0.0%) | 0 (0.0%) |
| $35,000 to $39,999 | 0 (0.0%) | 8 (22.2%) |
| $40,000 to $44,999 | 28 (40.0%) | 0 (0.0%) |
| $45,000 to $49,999 | 0 (0.0%) | 0 (0.0%) |
| $50,000 to $54,999 | 0 (0.0%) | 0 (0.0%) |
| $55,000 to $64,999 | 0 (0.0%) | 0 (0.0%) |
| $65,000 to $74,999 | 0 (0.0%) | 0 (0.0%) |
| $75,000 to $99,999 | 11 (15.7%) | 0 (0.0%) |
| $100,000+ | 0 (0.0%) | 11 (30.6%) |
| Total | 70 (100.0%) | 36 (100.0%) |
Earnings by Sex by Educational Attainment in Millfield
| Educational Attainment | Male Income | Female Income |
| Less than High School | - | - |
| High School Diploma | - | - |
| College or Associate's Degree | - | - |
| Bachelor's Degree | - | - |
| Graduate Degree | - | - |
| Total | $40,491 | $0 |
Family Income in Millfield
Family Income Brackets in Millfield
According to the Millfield family income data, there are 73 families falling into the $25,000 to $34,999 income range, which is the most common income bracket and makes up 77.7% of all families.
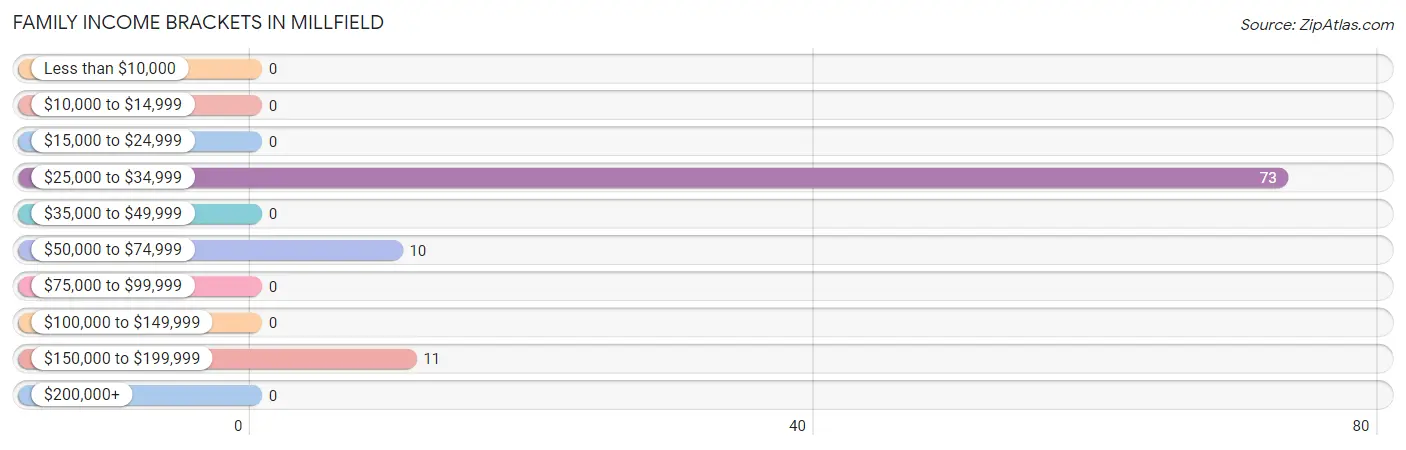
| Income Bracket | # Families | % Families |
| Less than $10,000 | 0 | 0.0% |
| $10,000 to $14,999 | 0 | 0.0% |
| $15,000 to $24,999 | 0 | 0.0% |
| $25,000 to $34,999 | 73 | 77.7% |
| $35,000 to $49,999 | 0 | 0.0% |
| $50,000 to $74,999 | 10 | 10.6% |
| $75,000 to $99,999 | 0 | 0.0% |
| $100,000 to $149,999 | 0 | 0.0% |
| $150,000 to $199,999 | 11 | 11.7% |
| $200,000+ | 0 | 0.0% |
Family Income by Famaliy Size in Millfield
2-person families (94 | 100.0%) account for the highest median family income in Millfield with $31,434 per family, while 2-person families (94 | 100.0%) have the highest median income of $15,717 per family member.
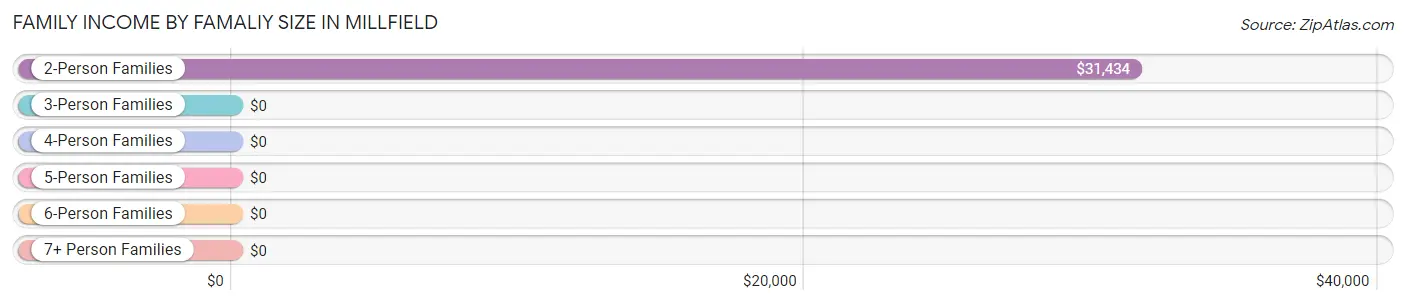
| Income Bracket | # Families | Median Income |
| 2-Person Families | 94 (100.0%) | $31,434 |
| 3-Person Families | 0 (0.0%) | $0 |
| 4-Person Families | 0 (0.0%) | $0 |
| 5-Person Families | 0 (0.0%) | $0 |
| 6-Person Families | 0 (0.0%) | $0 |
| 7+ Person Families | 0 (0.0%) | $0 |
| Total | 94 (100.0%) | $31,434 |
Family Income by Number of Earners in Millfield
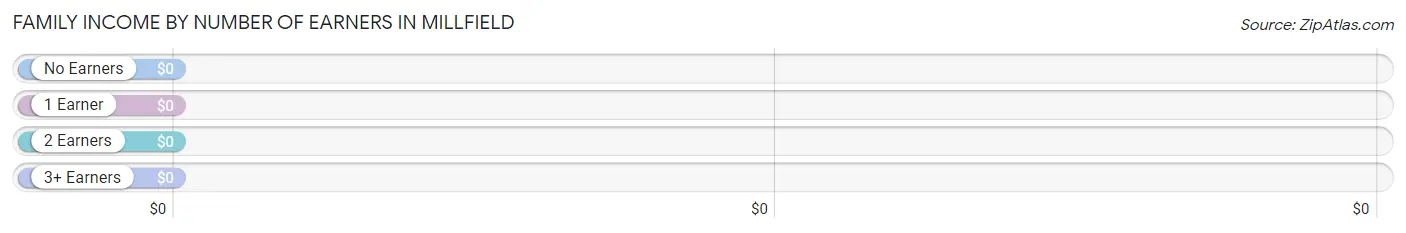
| Number of Earners | # Families | Median Income |
| No Earners | 61 (64.9%) | $0 |
| 1 Earner | 22 (23.4%) | $0 |
| 2 Earners | 11 (11.7%) | $0 |
| 3+ Earners | 0 (0.0%) | $0 |
| Total | 94 (100.0%) | $31,434 |
Household Income in Millfield
Household Income Brackets in Millfield
With 73 households falling in the category, the $25,000 to $34,999 income range is the most frequent in Millfield, accounting for 52.1% of all households.
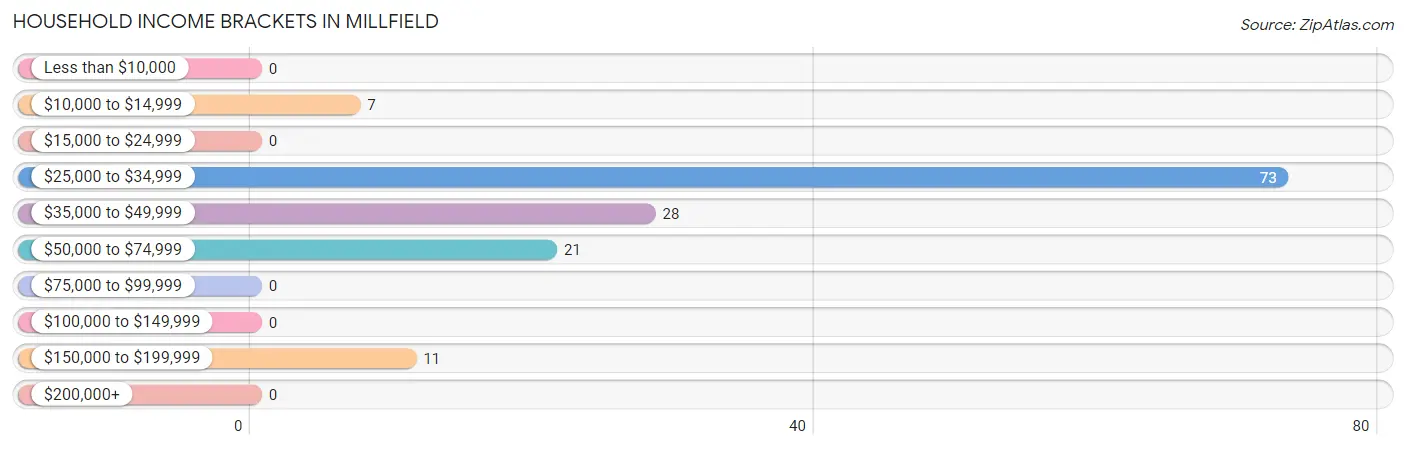
| Income Bracket | # Households | % Households |
| Less than $10,000 | 0 | 0.0% |
| $10,000 to $14,999 | 7 | 5.0% |
| $15,000 to $24,999 | 0 | 0.0% |
| $25,000 to $34,999 | 73 | 52.1% |
| $35,000 to $49,999 | 28 | 20.0% |
| $50,000 to $74,999 | 21 | 15.0% |
| $75,000 to $99,999 | 0 | 0.0% |
| $100,000 to $149,999 | 0 | 0.0% |
| $150,000 to $199,999 | 11 | 7.9% |
| $200,000+ | 0 | 0.0% |
Household Income by Householder Age in Millfield
The median household income in Millfield is $32,090, with the highest median household income of $31,086 found in the 45 to 64 years age bracket for the primary householder. A total of 91 households (65.0%) fall into this category. Meanwhile, the 15 to 24 years age bracket for the primary householder has the lowest median household income of $0, with 11 households (7.9%) in this group.
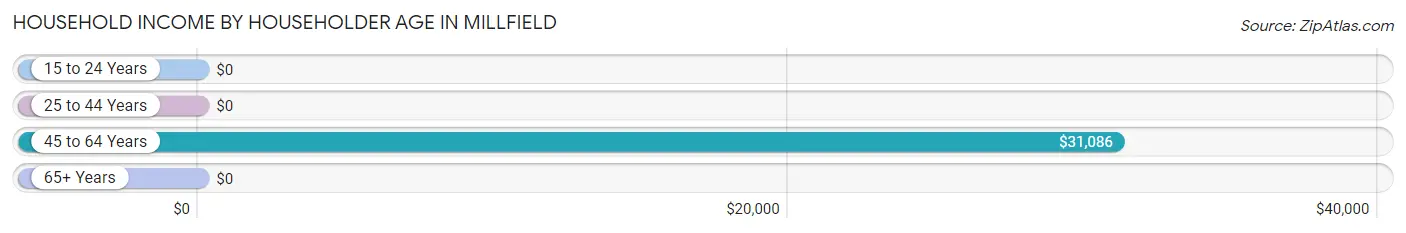
| Income Bracket | # Households | Median Income |
| 15 to 24 Years | 11 (7.9%) | $0 |
| 25 to 44 Years | 28 (20.0%) | $0 |
| 45 to 64 Years | 91 (65.0%) | $31,086 |
| 65+ Years | 10 (7.1%) | $0 |
| Total | 140 (100.0%) | $32,090 |
Poverty in Millfield
Income Below Poverty by Sex and Age in Millfield
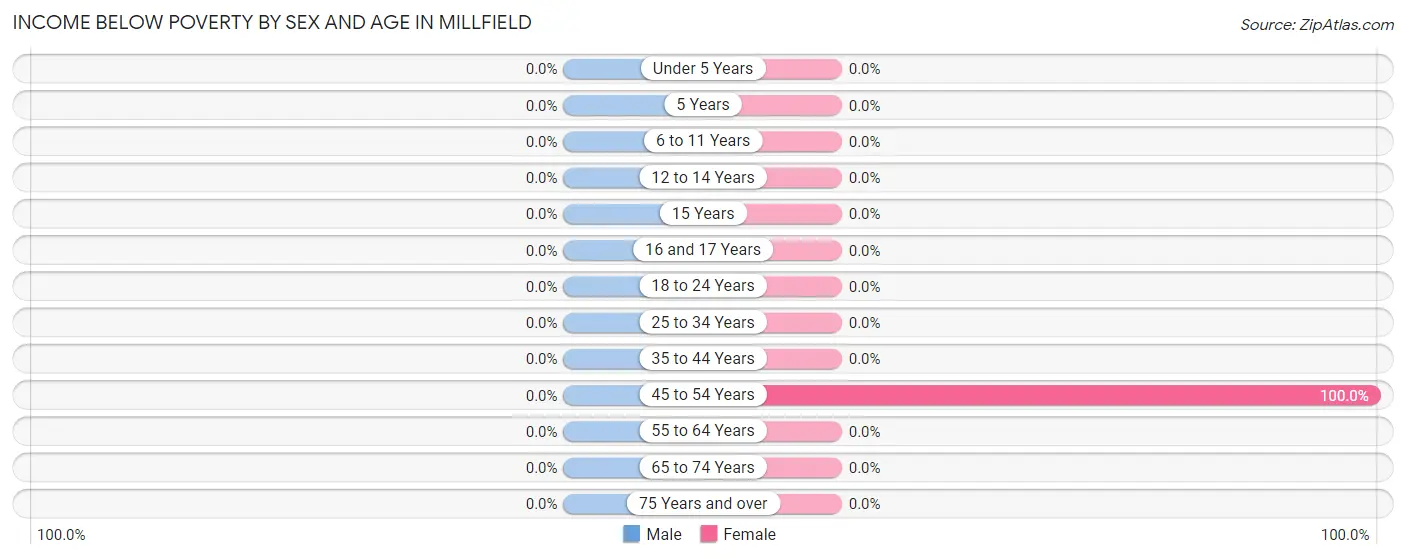
| Age Bracket | Male | Female |
| Under 5 Years | 0 (0.0%) | 0 (0.0%) |
| 5 Years | 0 (0.0%) | 0 (0.0%) |
| 6 to 11 Years | 0 (0.0%) | 0 (0.0%) |
| 12 to 14 Years | 0 (0.0%) | 0 (0.0%) |
| 15 Years | 0 (0.0%) | 0 (0.0%) |
| 16 and 17 Years | 0 (0.0%) | 0 (0.0%) |
| 18 to 24 Years | 0 (0.0%) | 0 (0.0%) |
| 25 to 34 Years | 0 (0.0%) | 0 (0.0%) |
| 35 to 44 Years | 0 (0.0%) | 0 (0.0%) |
| 45 to 54 Years | 0 (0.0%) | 7 (100.0%) |
| 55 to 64 Years | 0 (0.0%) | 0 (0.0%) |
| 65 to 74 Years | 0 (0.0%) | 0 (0.0%) |
| 75 Years and over | 0 (0.0%) | 0 (0.0%) |
| Total | 0 (0.0%) | 7 (6.1%) |
Income Above Poverty by Sex and Age in Millfield
According to the poverty statistics in Millfield, males aged 6 to 11 years and females aged 18 to 24 years are the age groups that are most secure financially, with 100.0% of males and 100.0% of females in these age groups living above the poverty line.
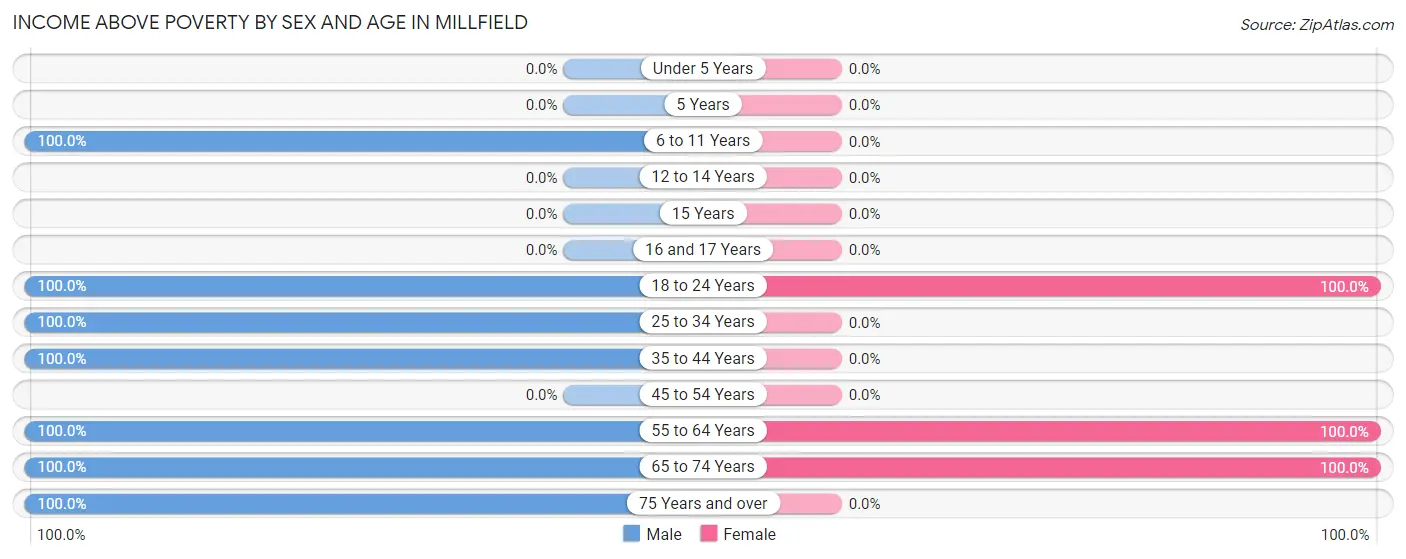
| Age Bracket | Male | Female |
| Under 5 Years | 0 (0.0%) | 0 (0.0%) |
| 5 Years | 0 (0.0%) | 0 (0.0%) |
| 6 to 11 Years | 63 (100.0%) | 0 (0.0%) |
| 12 to 14 Years | 0 (0.0%) | 0 (0.0%) |
| 15 Years | 0 (0.0%) | 0 (0.0%) |
| 16 and 17 Years | 0 (0.0%) | 0 (0.0%) |
| 18 to 24 Years | 3 (100.0%) | 12 (100.0%) |
| 25 to 34 Years | 16 (100.0%) | 0 (0.0%) |
| 35 to 44 Years | 28 (100.0%) | 0 (0.0%) |
| 45 to 54 Years | 0 (0.0%) | 0 (0.0%) |
| 55 to 64 Years | 12 (100.0%) | 83 (100.0%) |
| 65 to 74 Years | 11 (100.0%) | 13 (100.0%) |
| 75 Years and over | 10 (100.0%) | 0 (0.0%) |
| Total | 143 (100.0%) | 108 (93.9%) |
Income Below Poverty Among Married-Couple Families in Millfield
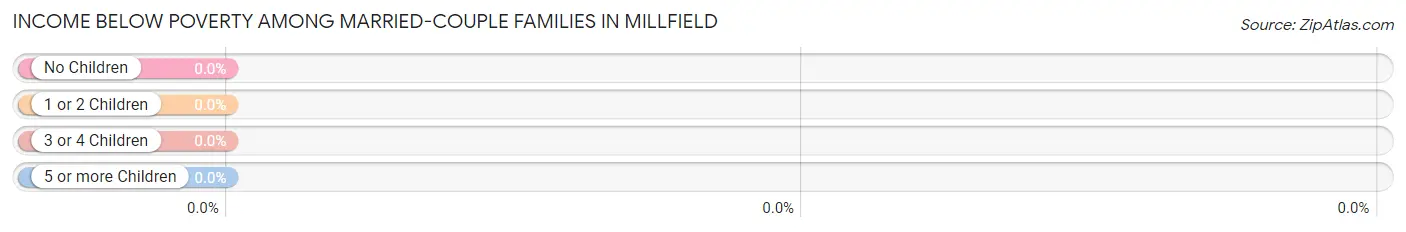
| Children | Above Poverty | Below Poverty |
| No Children | 33 (100.0%) | 0 (0.0%) |
| 1 or 2 Children | 0 (0.0%) | 0 (0.0%) |
| 3 or 4 Children | 0 (0.0%) | 0 (0.0%) |
| 5 or more Children | 0 (0.0%) | 0 (0.0%) |
| Total | 33 (100.0%) | 0 (0.0%) |
Income Below Poverty Among Single-Parent Households in Millfield
| Children | Single Father | Single Mother |
| No Children | 0 (0.0%) | 0 (0.0%) |
| 1 or 2 Children | 0 (0.0%) | 0 (0.0%) |
| 3 or 4 Children | 0 (0.0%) | 0 (0.0%) |
| 5 or more Children | 0 (0.0%) | 0 (0.0%) |
| Total | 0 (0.0%) | 0 (0.0%) |
Income Below Poverty Among Married-Couple vs Single-Parent Households in Millfield
| Children | Married-Couple Families | Single-Parent Households |
| No Children | 0 (0.0%) | 0 (0.0%) |
| 1 or 2 Children | 0 (0.0%) | 0 (0.0%) |
| 3 or 4 Children | 0 (0.0%) | 0 (0.0%) |
| 5 or more Children | 0 (0.0%) | 0 (0.0%) |
| Total | 0 (0.0%) | 0 (0.0%) |
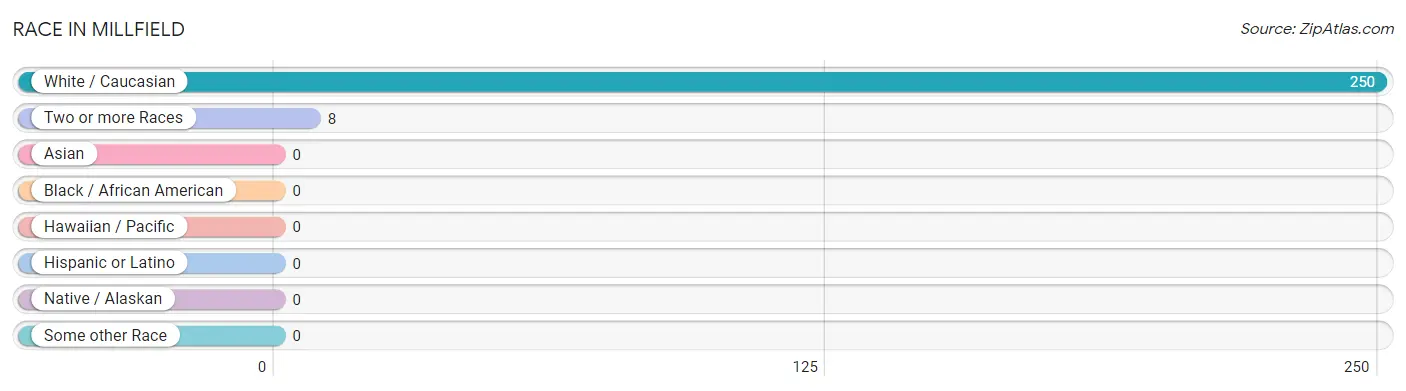
Race in Millfield
The most populous races in Millfield are White / Caucasian (250 | 96.9%), and Two or more Races (8 | 3.1%).
| Race | # Population | % Population |
| Asian | 0 | 0.0% |
| Black / African American | 0 | 0.0% |
| Hawaiian / Pacific | 0 | 0.0% |
| Hispanic or Latino | 0 | 0.0% |
| Native / Alaskan | 0 | 0.0% |
| White / Caucasian | 250 | 96.9% |
| Two or more Races | 8 | 3.1% |
| Some other Race | 0 | 0.0% |
| Total | 258 | 100.0% |
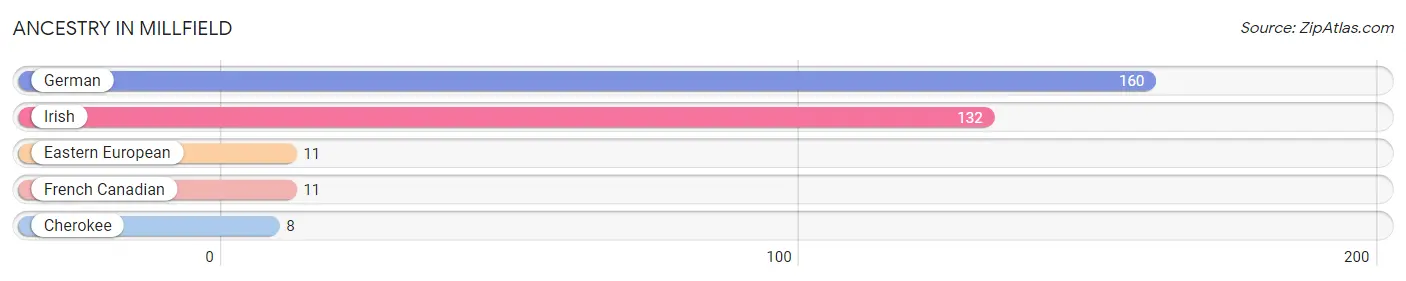
Ancestry in Millfield
The most populous ancestries reported in Millfield are German (160 | 62.0%), Irish (132 | 51.2%), Eastern European (11 | 4.3%), French Canadian (11 | 4.3%), and Cherokee (8 | 3.1%), together accounting for 124.8% of all Millfield residents.
| Ancestry | # Population | % Population |
| Cherokee | 8 | 3.1% |
| Eastern European | 11 | 4.3% |
| French Canadian | 11 | 4.3% |
| German | 160 | 62.0% |
| Irish | 132 | 51.2% | View All 5 Rows |
Immigrants in Millfield

| Immigration Origin | # Population | % Population | View All 0 Rows |
Sex and Age in Millfield
Sex and Age in Millfield
The most populous age groups in Millfield are 5 to 9 Years (63 | 44.1%) for men and 60 to 64 Years (83 | 72.2%) for women.
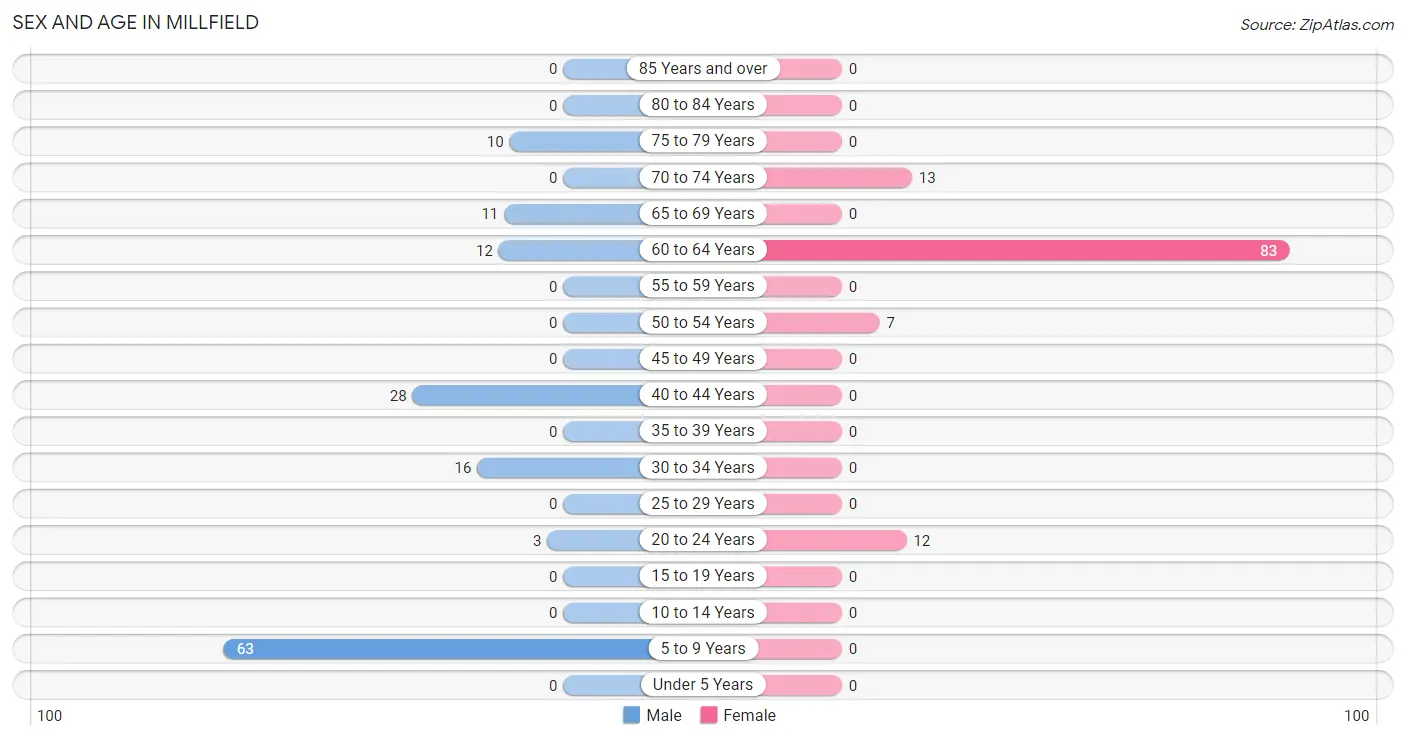
| Age Bracket | Male | Female |
| Under 5 Years | 0 (0.0%) | 0 (0.0%) |
| 5 to 9 Years | 63 (44.1%) | 0 (0.0%) |
| 10 to 14 Years | 0 (0.0%) | 0 (0.0%) |
| 15 to 19 Years | 0 (0.0%) | 0 (0.0%) |
| 20 to 24 Years | 3 (2.1%) | 12 (10.4%) |
| 25 to 29 Years | 0 (0.0%) | 0 (0.0%) |
| 30 to 34 Years | 16 (11.2%) | 0 (0.0%) |
| 35 to 39 Years | 0 (0.0%) | 0 (0.0%) |
| 40 to 44 Years | 28 (19.6%) | 0 (0.0%) |
| 45 to 49 Years | 0 (0.0%) | 0 (0.0%) |
| 50 to 54 Years | 0 (0.0%) | 7 (6.1%) |
| 55 to 59 Years | 0 (0.0%) | 0 (0.0%) |
| 60 to 64 Years | 12 (8.4%) | 83 (72.2%) |
| 65 to 69 Years | 11 (7.7%) | 0 (0.0%) |
| 70 to 74 Years | 0 (0.0%) | 13 (11.3%) |
| 75 to 79 Years | 10 (7.0%) | 0 (0.0%) |
| 80 to 84 Years | 0 (0.0%) | 0 (0.0%) |
| 85 Years and over | 0 (0.0%) | 0 (0.0%) |
| Total | 143 (100.0%) | 115 (100.0%) |
Families and Households in Millfield
Median Family Size in Millfield
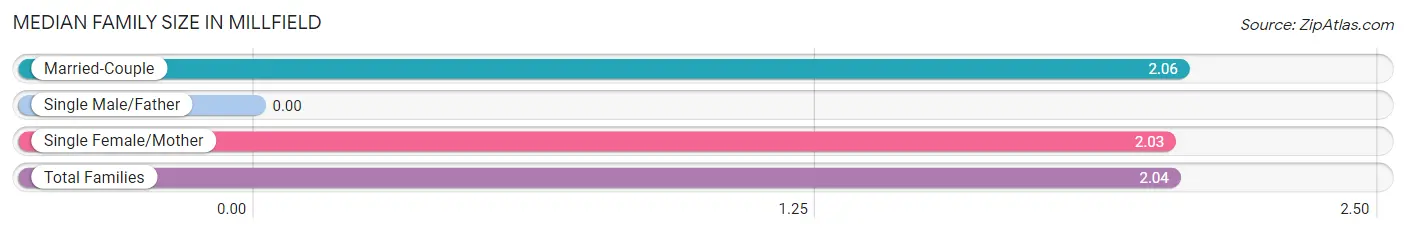
| Family Type | # Families | Family Size |
| Married-Couple | 33 (35.1%) | 2.06 |
| Single Male/Father | 0 (0.0%) | - |
| Single Female/Mother | 61 (64.9%) | 2.03 |
| Total Families | 94 (100.0%) | 2.04 |
Median Household Size in Millfield
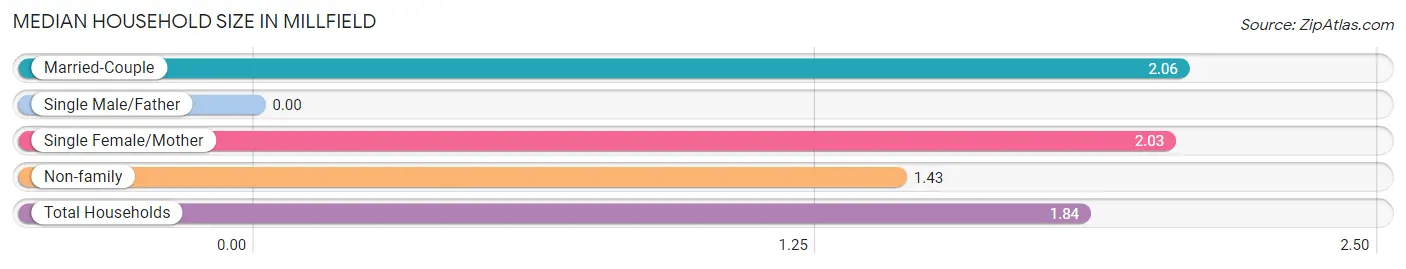
| Household Type | # Households | Household Size |
| Married-Couple | 33 (23.6%) | 2.06 |
| Single Male/Father | 0 (0.0%) | - |
| Single Female/Mother | 61 (43.6%) | 2.03 |
| Non-family | 46 (32.9%) | 1.43 |
| Total Households | 140 (100.0%) | 1.84 |
Household Size by Marriage Status in Millfield
Out of a total of 140 households in Millfield, 94 (67.1%) are family households, while 46 (32.9%) are nonfamily households. The most numerous type of family households are 2-person households, comprising 94, and the most common type of nonfamily households are 1-person households, comprising 35.
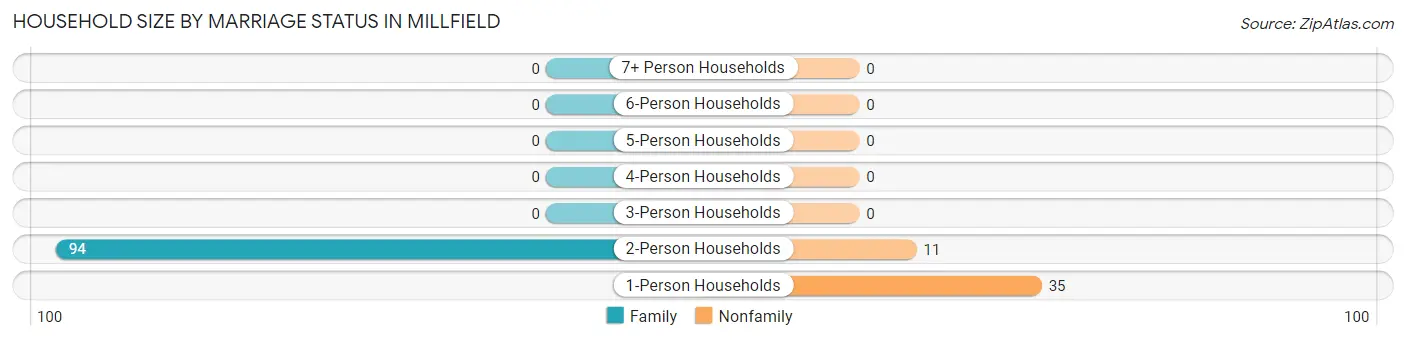
| Household Size | Family Households | Nonfamily Households |
| 1-Person Households | - | 35 (25.0%) |
| 2-Person Households | 94 (67.1%) | 11 (7.9%) |
| 3-Person Households | 0 (0.0%) | 0 (0.0%) |
| 4-Person Households | 0 (0.0%) | 0 (0.0%) |
| 5-Person Households | 0 (0.0%) | 0 (0.0%) |
| 6-Person Households | 0 (0.0%) | 0 (0.0%) |
| 7+ Person Households | 0 (0.0%) | 0 (0.0%) |
| Total | 94 (67.1%) | 46 (32.9%) |
Female Fertility in Millfield
Fertility by Age in Millfield
| Age Bracket | Women with Births | Births / 1,000 Women |
| 15 to 19 years | 0 (0.0%) | 0.0 |
| 20 to 34 years | 0 (0.0%) | 0.0 |
| 35 to 50 years | 0 (0.0%) | 0.0 |
| Total | 0 (0.0%) | 0.0 |
Fertility by Age by Marriage Status in Millfield
| Age Bracket | Married | Unmarried |
| 15 to 19 years | 0 (0.0%) | 0 (0.0%) |
| 20 to 34 years | 0 (0.0%) | 0 (0.0%) |
| 35 to 50 years | 0 (0.0%) | 0 (0.0%) |
| Total | 0 (0.0%) | 0 (0.0%) |
Fertility by Education in Millfield
| Educational Attainment | Women with Births | Births / 1,000 Women |
| Less than High School | 0 (0.0%) | 0.0 |
| High School Diploma | 0 (0.0%) | 0.0 |
| College or Associate's Degree | 0 (0.0%) | 0.0 |
| Bachelor's Degree | 0 (0.0%) | 0.0 |
| Graduate Degree | 0 (0.0%) | 0.0 |
| Total | 0 (0.0%) | 0.0 |
Fertility by Education by Marriage Status in Millfield
| Educational Attainment | Married | Unmarried |
| Less than High School | 0 (0.0%) | 0 (0.0%) |
| High School Diploma | 0 (0.0%) | 0 (0.0%) |
| College or Associate's Degree | 0 (0.0%) | 0 (0.0%) |
| Bachelor's Degree | 0 (0.0%) | 0 (0.0%) |
| Graduate Degree | 0 (0.0%) | 0 (0.0%) |
| Total | 0 (0.0%) | 0 (0.0%) |
Employment Characteristics in Millfield
Employment by Class of Employer in Millfield
Among the 106 employed individuals in Millfield, private company employees (92 | 86.8%), local government employees (11 | 10.4%), and not-for-profit organizations (3 | 2.8%) make up the most common classes of employment.
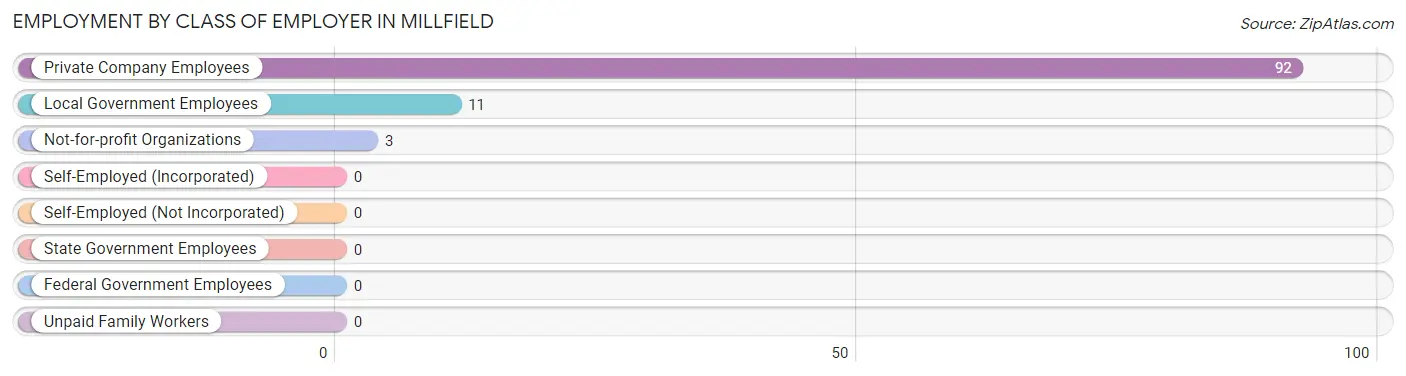
| Employer Class | # Employees | % Employees |
| Private Company Employees | 92 | 86.8% |
| Self-Employed (Incorporated) | 0 | 0.0% |
| Self-Employed (Not Incorporated) | 0 | 0.0% |
| Not-for-profit Organizations | 3 | 2.8% |
| Local Government Employees | 11 | 10.4% |
| State Government Employees | 0 | 0.0% |
| Federal Government Employees | 0 | 0.0% |
| Unpaid Family Workers | 0 | 0.0% |
| Total | 106 | 100.0% |
Employment Status by Age in Millfield
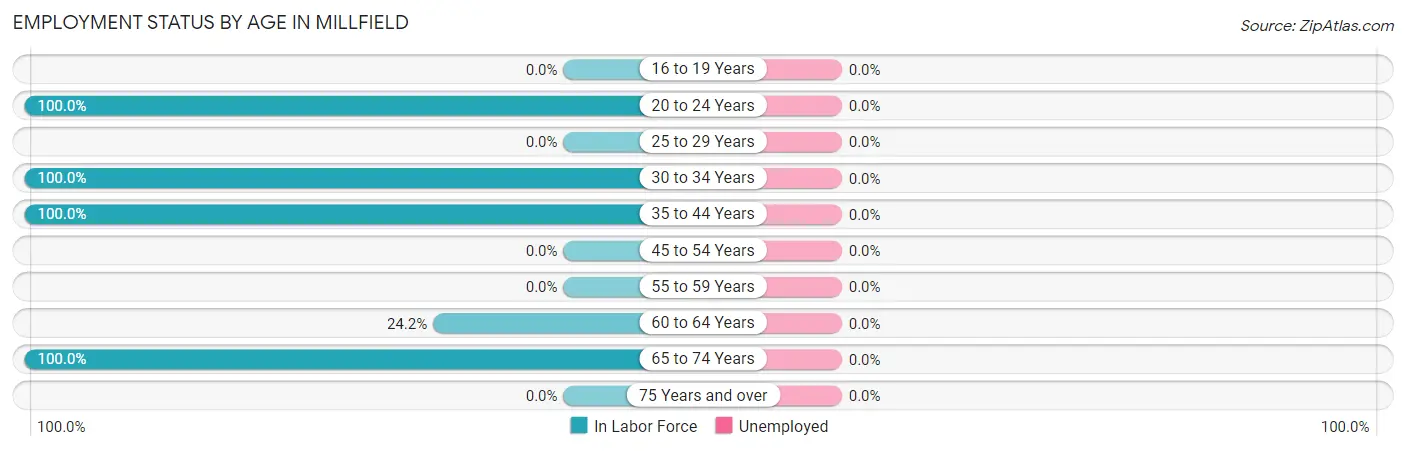
| Age Bracket | In Labor Force | Unemployed |
| 16 to 19 Years | 0 (0.0%) | 0 (0.0%) |
| 20 to 24 Years | 15 (100.0%) | 0 (0.0%) |
| 25 to 29 Years | 0 (0.0%) | 0 (0.0%) |
| 30 to 34 Years | 16 (100.0%) | 0 (0.0%) |
| 35 to 44 Years | 28 (100.0%) | 0 (0.0%) |
| 45 to 54 Years | 0 (0.0%) | 0 (0.0%) |
| 55 to 59 Years | 0 (0.0%) | 0 (0.0%) |
| 60 to 64 Years | 23 (24.2%) | 0 (0.0%) |
| 65 to 74 Years | 24 (100.0%) | 0 (0.0%) |
| 75 Years and over | 0 (0.0%) | 0 (0.0%) |
| Total | 106 (54.4%) | 0 (0.0%) |
Employment Status by Educational Attainment in Millfield
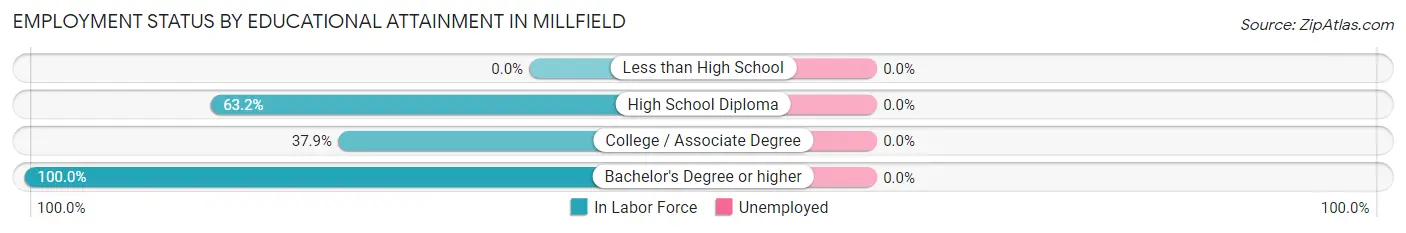
| Educational Attainment | In Labor Force | Unemployed |
| Less than High School | 0 (0.0%) | 0 (0.0%) |
| High School Diploma | 12 (63.2%) | 0 (0.0%) |
| College / Associate Degree | 44 (37.9%) | 0 (0.0%) |
| Bachelor's Degree or higher | 11 (100.0%) | 0 (0.0%) |
| Total | 67 (45.9%) | 0 (0.0%) |
Employment Occupations by Sex in Millfield
Management, Business, Science and Arts Occupations
The most common Management, Business, Science and Arts occupations in Millfield are Management (11 | 10.4%), Community & Social Service (8 | 7.5%), and Arts, Media & Entertainment (8 | 7.5%).
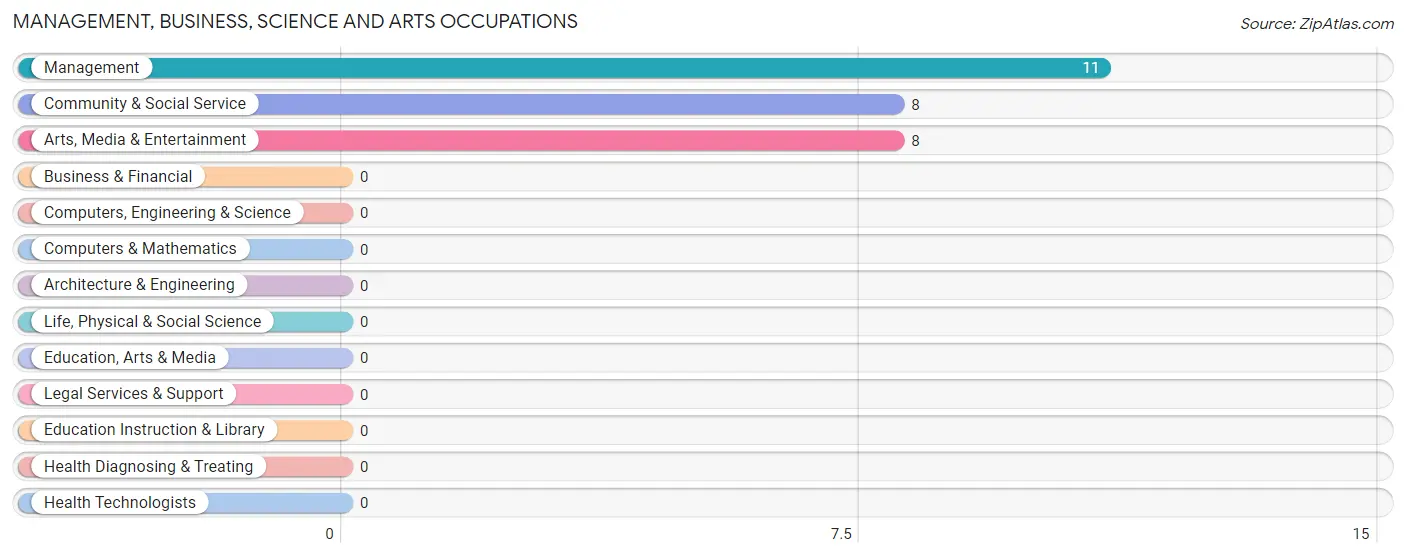
Management, Business, Science and Arts Occupations by Sex
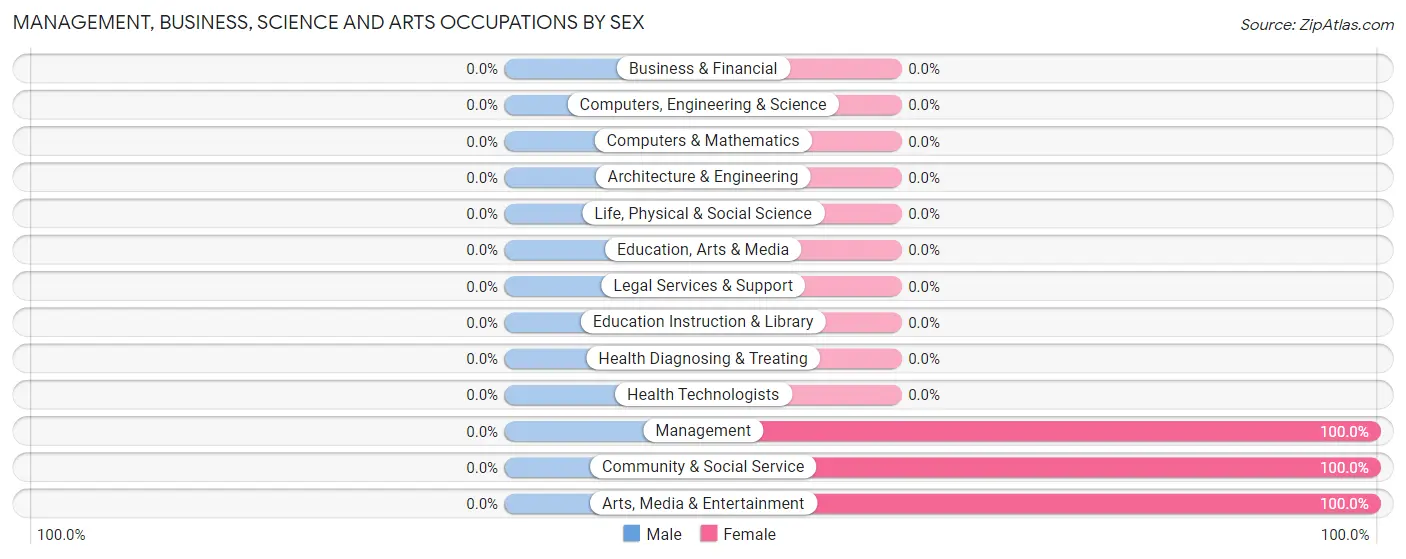
| Occupation | Male | Female |
| Management | 0 (0.0%) | 11 (100.0%) |
| Business & Financial | 0 (0.0%) | 0 (0.0%) |
| Computers, Engineering & Science | 0 (0.0%) | 0 (0.0%) |
| Computers & Mathematics | 0 (0.0%) | 0 (0.0%) |
| Architecture & Engineering | 0 (0.0%) | 0 (0.0%) |
| Life, Physical & Social Science | 0 (0.0%) | 0 (0.0%) |
| Community & Social Service | 0 (0.0%) | 8 (100.0%) |
| Education, Arts & Media | 0 (0.0%) | 0 (0.0%) |
| Legal Services & Support | 0 (0.0%) | 0 (0.0%) |
| Education Instruction & Library | 0 (0.0%) | 0 (0.0%) |
| Arts, Media & Entertainment | 0 (0.0%) | 8 (100.0%) |
| Health Diagnosing & Treating | 0 (0.0%) | 0 (0.0%) |
| Health Technologists | 0 (0.0%) | 0 (0.0%) |
| Total (Category) | 0 (0.0%) | 19 (100.0%) |
| Total (Overall) | 70 (66.0%) | 36 (34.0%) |
Services Occupations
The most common Services occupations in Millfield are Cleaning & Maintenance (13 | 12.3%), and Healthcare Support (4 | 3.8%).
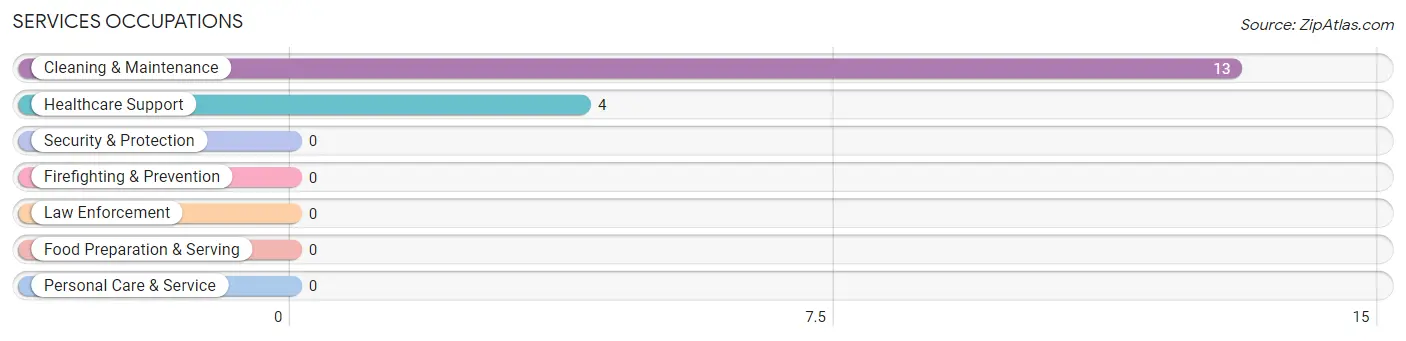
Services Occupations by Sex
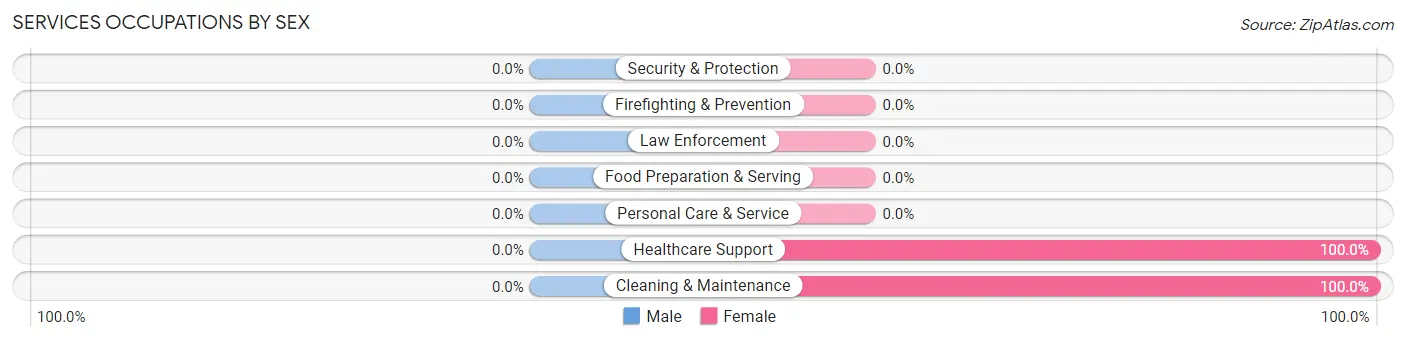
| Occupation | Male | Female |
| Healthcare Support | 0 (0.0%) | 4 (100.0%) |
| Security & Protection | 0 (0.0%) | 0 (0.0%) |
| Firefighting & Prevention | 0 (0.0%) | 0 (0.0%) |
| Law Enforcement | 0 (0.0%) | 0 (0.0%) |
| Food Preparation & Serving | 0 (0.0%) | 0 (0.0%) |
| Cleaning & Maintenance | 0 (0.0%) | 13 (100.0%) |
| Personal Care & Service | 0 (0.0%) | 0 (0.0%) |
| Total (Category) | 0 (0.0%) | 17 (100.0%) |
| Total (Overall) | 70 (66.0%) | 36 (34.0%) |
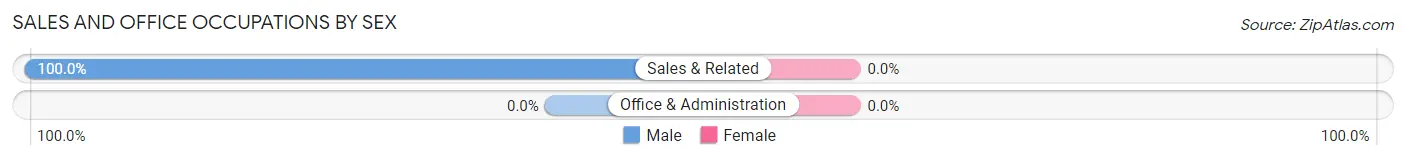
Sales and Office Occupations
The most common Sales and Office occupations in Millfield are , and Sales & Related (16 | 15.1%).
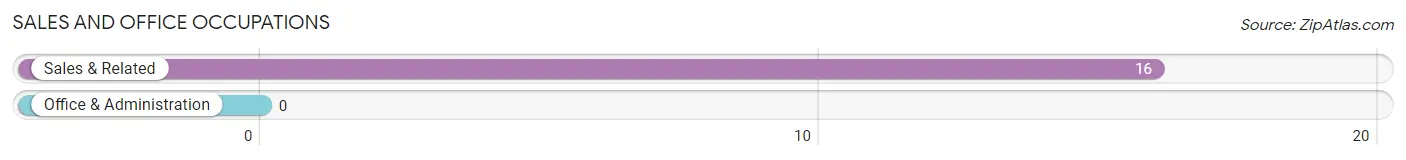
Sales and Office Occupations by Sex
| Occupation | Male | Female |
| Sales & Related | 16 (100.0%) | 0 (0.0%) |
| Office & Administration | 0 (0.0%) | 0 (0.0%) |
| Total (Category) | 16 (100.0%) | 0 (0.0%) |
| Total (Overall) | 70 (66.0%) | 36 (34.0%) |
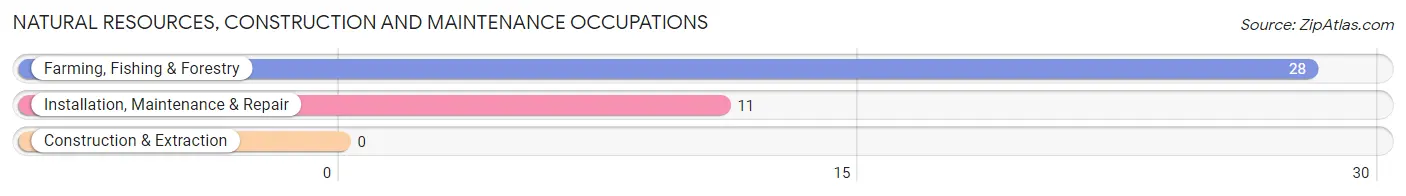
Natural Resources, Construction and Maintenance Occupations
The most common Natural Resources, Construction and Maintenance occupations in Millfield are Farming, Fishing & Forestry (28 | 26.4%), and Installation, Maintenance & Repair (11 | 10.4%).
Natural Resources, Construction and Maintenance Occupations by Sex
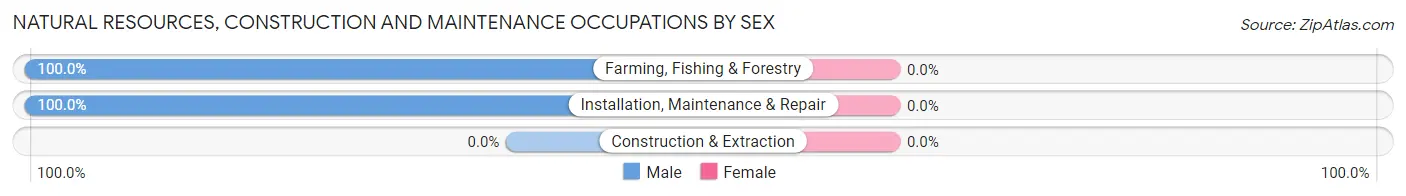
| Occupation | Male | Female |
| Farming, Fishing & Forestry | 28 (100.0%) | 0 (0.0%) |
| Construction & Extraction | 0 (0.0%) | 0 (0.0%) |
| Installation, Maintenance & Repair | 11 (100.0%) | 0 (0.0%) |
| Total (Category) | 39 (100.0%) | 0 (0.0%) |
| Total (Overall) | 70 (66.0%) | 36 (34.0%) |
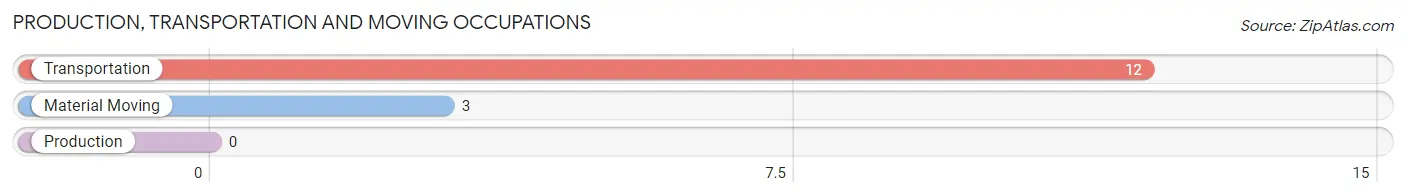
Production, Transportation and Moving Occupations
The most common Production, Transportation and Moving occupations in Millfield are Transportation (12 | 11.3%), and Material Moving (3 | 2.8%).
Production, Transportation and Moving Occupations by Sex
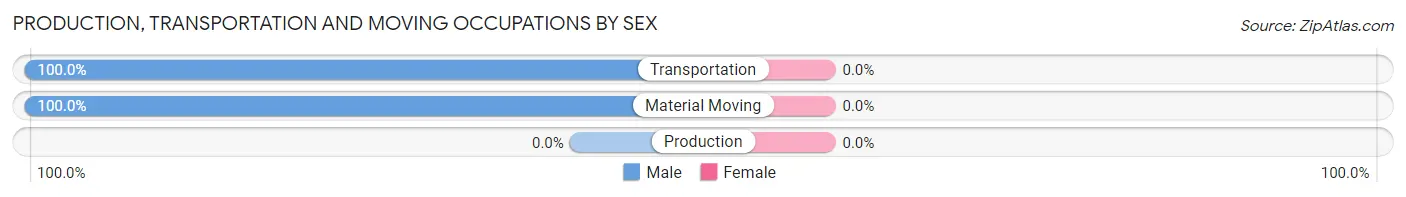
| Occupation | Male | Female |
| Production | 0 (0.0%) | 0 (0.0%) |
| Transportation | 12 (100.0%) | 0 (0.0%) |
| Material Moving | 3 (100.0%) | 0 (0.0%) |
| Total (Category) | 15 (100.0%) | 0 (0.0%) |
| Total (Overall) | 70 (66.0%) | 36 (34.0%) |
Employment Industries by Sex in Millfield
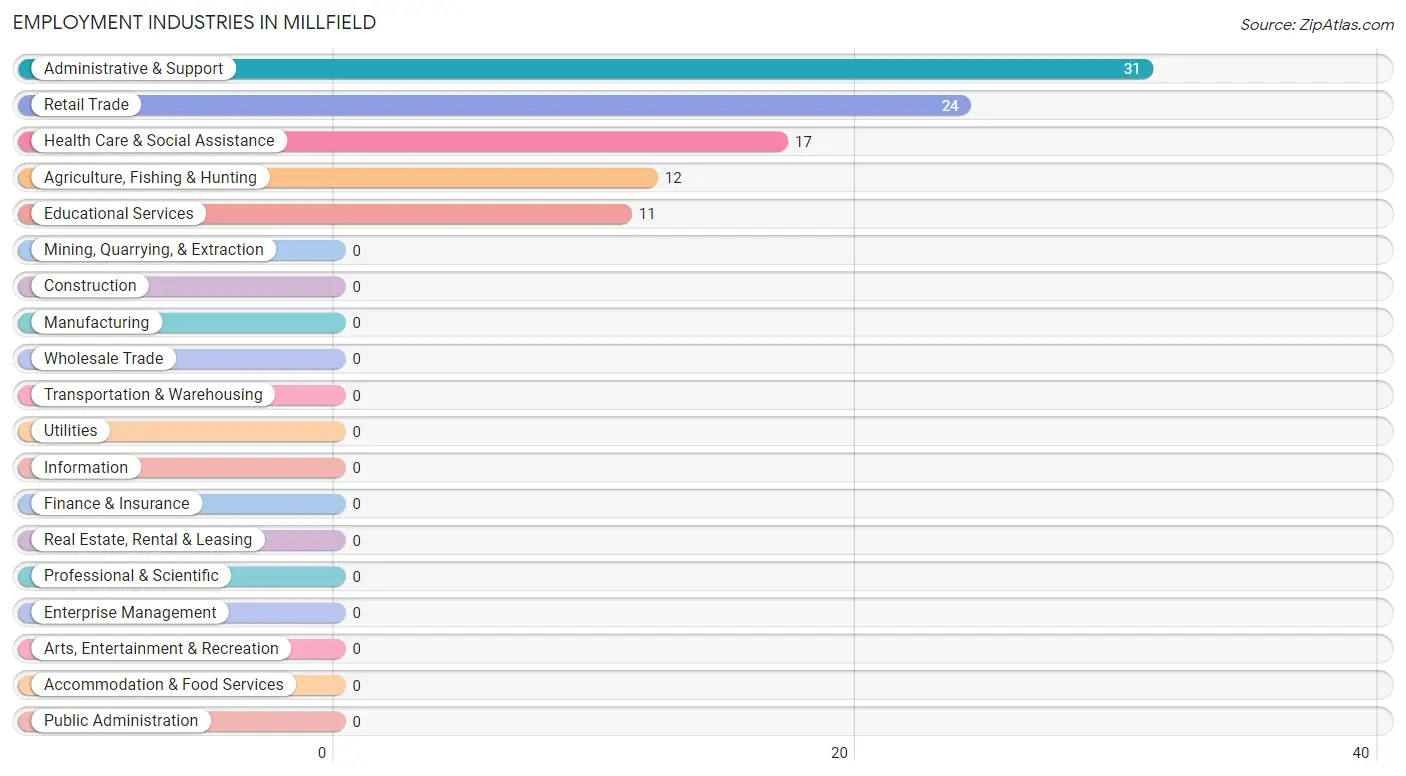
Employment Industries in Millfield
The major employment industries in Millfield include Administrative & Support (31 | 29.2%), Retail Trade (24 | 22.6%), Health Care & Social Assistance (17 | 16.0%), Agriculture, Fishing & Hunting (12 | 11.3%), and Educational Services (11 | 10.4%).
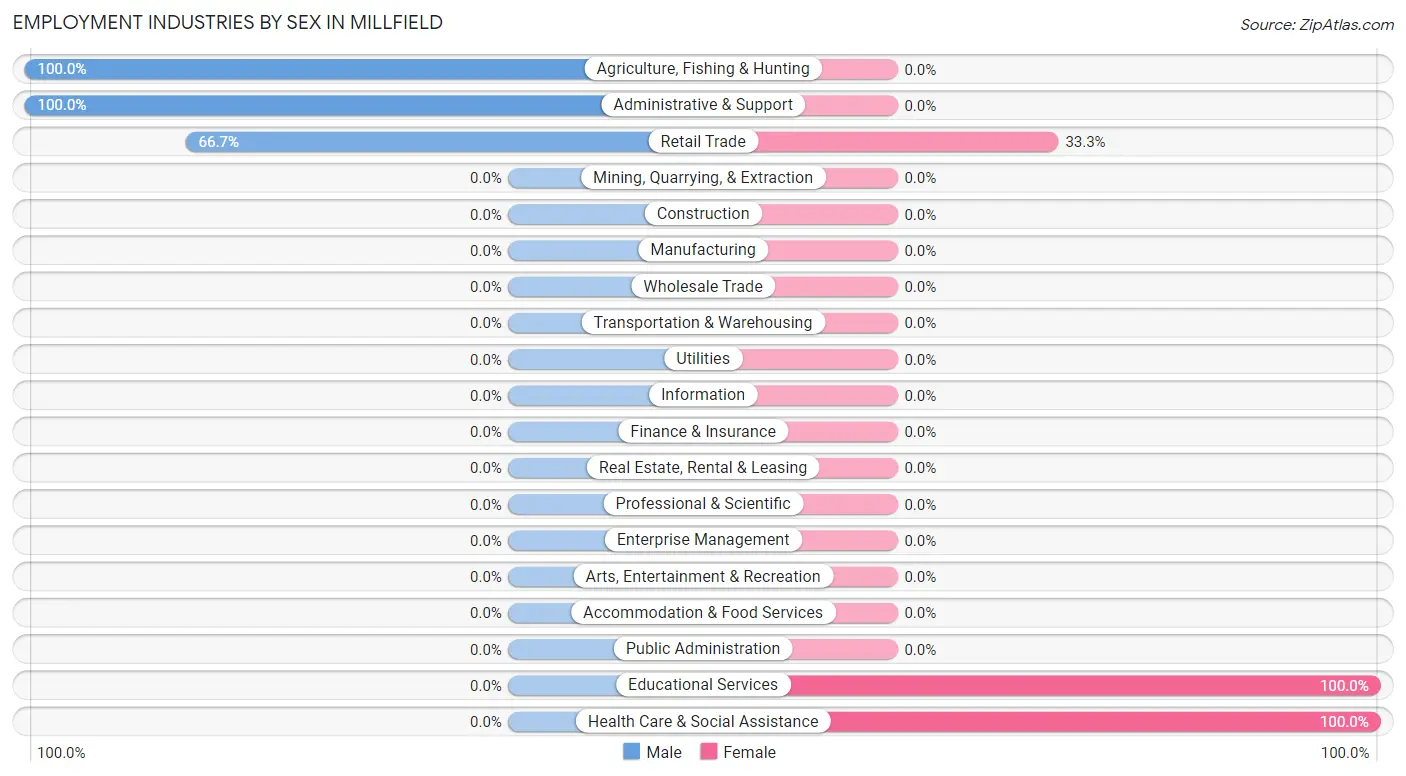
Employment Industries by Sex in Millfield
The Millfield industries that see more men than women are Agriculture, Fishing & Hunting (100.0%), Administrative & Support (100.0%), and Retail Trade (66.7%), whereas the industries that tend to have a higher number of women are Educational Services (100.0%), Health Care & Social Assistance (100.0%), and Retail Trade (33.3%).
| Industry | Male | Female |
| Agriculture, Fishing & Hunting | 12 (100.0%) | 0 (0.0%) |
| Mining, Quarrying, & Extraction | 0 (0.0%) | 0 (0.0%) |
| Construction | 0 (0.0%) | 0 (0.0%) |
| Manufacturing | 0 (0.0%) | 0 (0.0%) |
| Wholesale Trade | 0 (0.0%) | 0 (0.0%) |
| Retail Trade | 16 (66.7%) | 8 (33.3%) |
| Transportation & Warehousing | 0 (0.0%) | 0 (0.0%) |
| Utilities | 0 (0.0%) | 0 (0.0%) |
| Information | 0 (0.0%) | 0 (0.0%) |
| Finance & Insurance | 0 (0.0%) | 0 (0.0%) |
| Real Estate, Rental & Leasing | 0 (0.0%) | 0 (0.0%) |
| Professional & Scientific | 0 (0.0%) | 0 (0.0%) |
| Enterprise Management | 0 (0.0%) | 0 (0.0%) |
| Administrative & Support | 31 (100.0%) | 0 (0.0%) |
| Educational Services | 0 (0.0%) | 11 (100.0%) |
| Health Care & Social Assistance | 0 (0.0%) | 17 (100.0%) |
| Arts, Entertainment & Recreation | 0 (0.0%) | 0 (0.0%) |
| Accommodation & Food Services | 0 (0.0%) | 0 (0.0%) |
| Public Administration | 0 (0.0%) | 0 (0.0%) |
| Total | 70 (66.0%) | 36 (34.0%) |
Education in Millfield
School Enrollment in Millfield
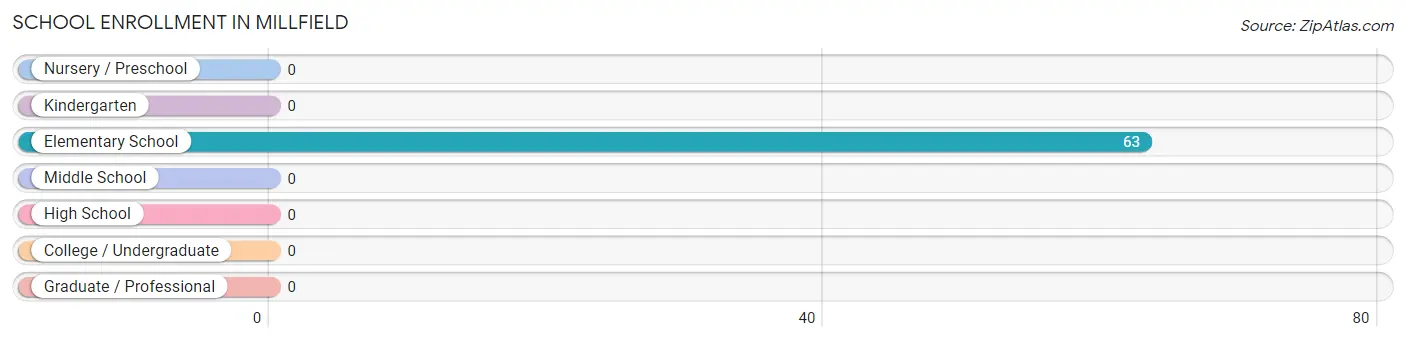
| School Level | # Students | % Students |
| Nursery / Preschool | 0 | 0.0% |
| Kindergarten | 0 | 0.0% |
| Elementary School | 63 | 100.0% |
| Middle School | 0 | 0.0% |
| High School | 0 | 0.0% |
| College / Undergraduate | 0 | 0.0% |
| Graduate / Professional | 0 | 0.0% |
| Total | 63 | 100.0% |
School Enrollment by Age by Funding Source in Millfield
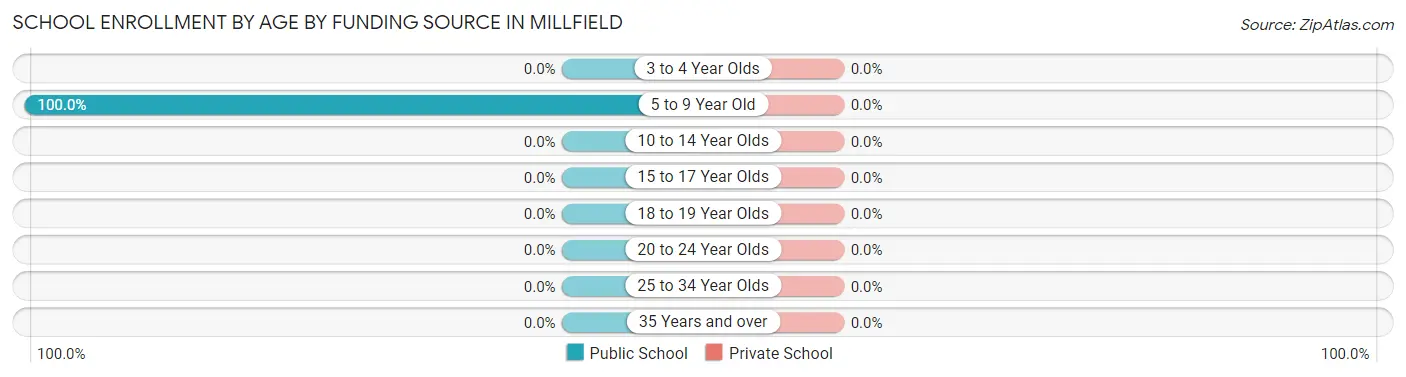
| Age Bracket | Public School | Private School |
| 3 to 4 Year Olds | 0 (0.0%) | 0 (0.0%) |
| 5 to 9 Year Old | 63 (100.0%) | 0 (0.0%) |
| 10 to 14 Year Olds | 0 (0.0%) | 0 (0.0%) |
| 15 to 17 Year Olds | 0 (0.0%) | 0 (0.0%) |
| 18 to 19 Year Olds | 0 (0.0%) | 0 (0.0%) |
| 20 to 24 Year Olds | 0 (0.0%) | 0 (0.0%) |
| 25 to 34 Year Olds | 0 (0.0%) | 0 (0.0%) |
| 35 Years and over | 0 (0.0%) | 0 (0.0%) |
| Total | 63 (100.0%) | 0 (0.0%) |
Educational Attainment by Field of Study in Millfield
Business (11 | 50.0%), and education (11 | 50.0%) are the most common fields of study among 22 individuals in Millfield who have obtained a bachelor's degree or higher.
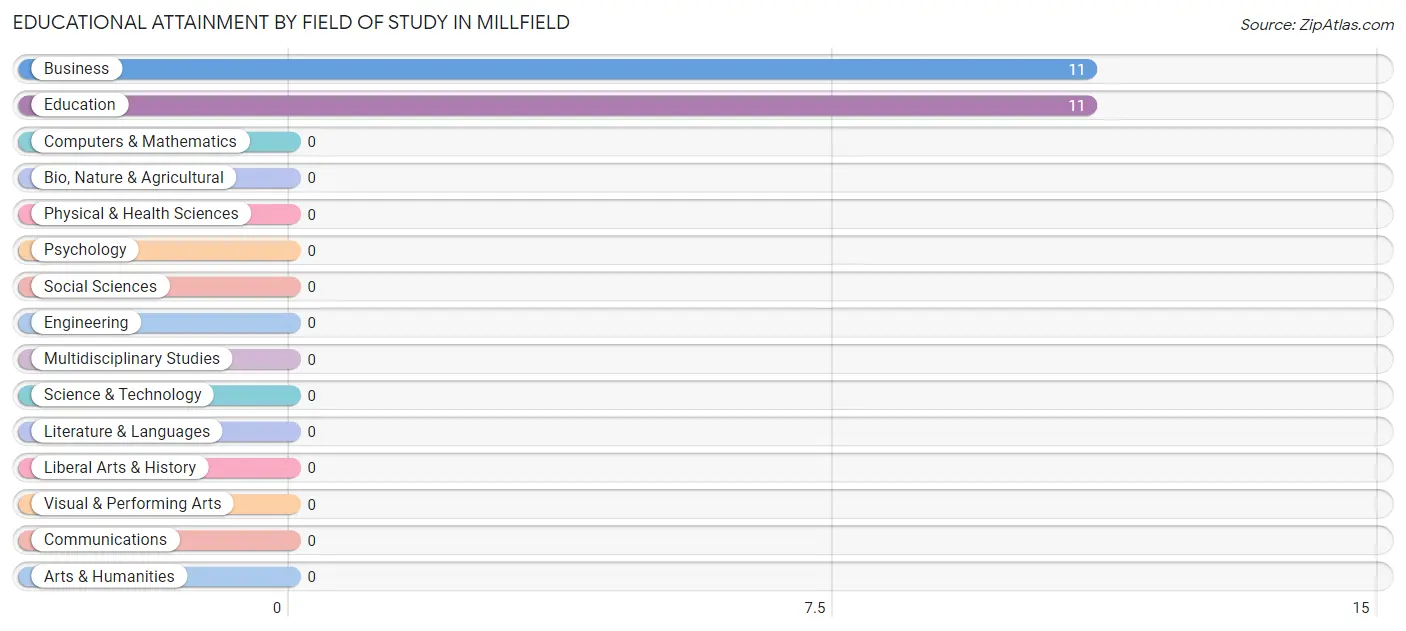
| Field of Study | # Graduates | % Graduates |
| Computers & Mathematics | 0 | 0.0% |
| Bio, Nature & Agricultural | 0 | 0.0% |
| Physical & Health Sciences | 0 | 0.0% |
| Psychology | 0 | 0.0% |
| Social Sciences | 0 | 0.0% |
| Engineering | 0 | 0.0% |
| Multidisciplinary Studies | 0 | 0.0% |
| Science & Technology | 0 | 0.0% |
| Business | 11 | 50.0% |
| Education | 11 | 50.0% |
| Literature & Languages | 0 | 0.0% |
| Liberal Arts & History | 0 | 0.0% |
| Visual & Performing Arts | 0 | 0.0% |
| Communications | 0 | 0.0% |
| Arts & Humanities | 0 | 0.0% |
| Total | 22 | 100.0% |
Transportation & Commute in Millfield
Vehicle Availability by Sex in Millfield
The most prevalent vehicle ownership categories in Millfield are males with 1 vehicle (44, accounting for 62.9%) and females with 1 vehicle (8, making up 122.2%).
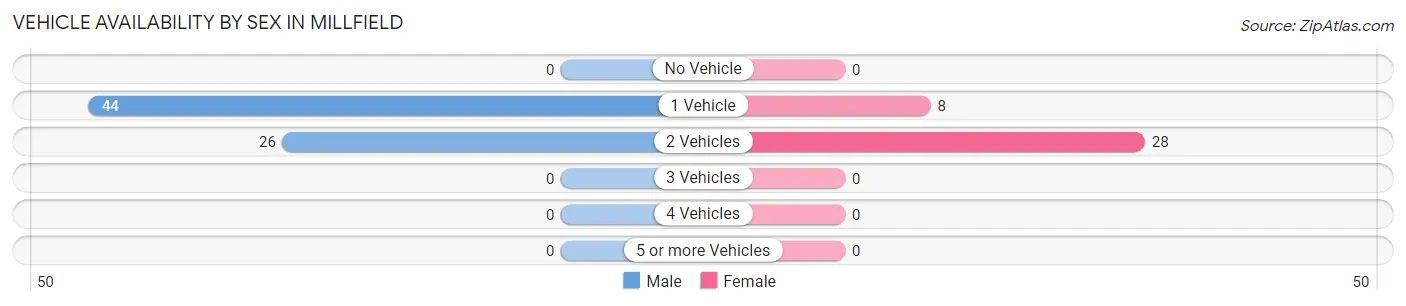
| Vehicles Available | Male | Female |
| No Vehicle | 0 (0.0%) | 0 (0.0%) |
| 1 Vehicle | 44 (62.9%) | 8 (22.2%) |
| 2 Vehicles | 26 (37.1%) | 28 (77.8%) |
| 3 Vehicles | 0 (0.0%) | 0 (0.0%) |
| 4 Vehicles | 0 (0.0%) | 0 (0.0%) |
| 5 or more Vehicles | 0 (0.0%) | 0 (0.0%) |
| Total | 70 (100.0%) | 36 (100.0%) |
Commute Time in Millfield
The most frequently occuring commute durations in Millfield are 15 to 19 minutes (31 commuters, 32.6%), 60 to 89 minutes (28 commuters, 29.5%), and 30 to 34 minutes (24 commuters, 25.3%).
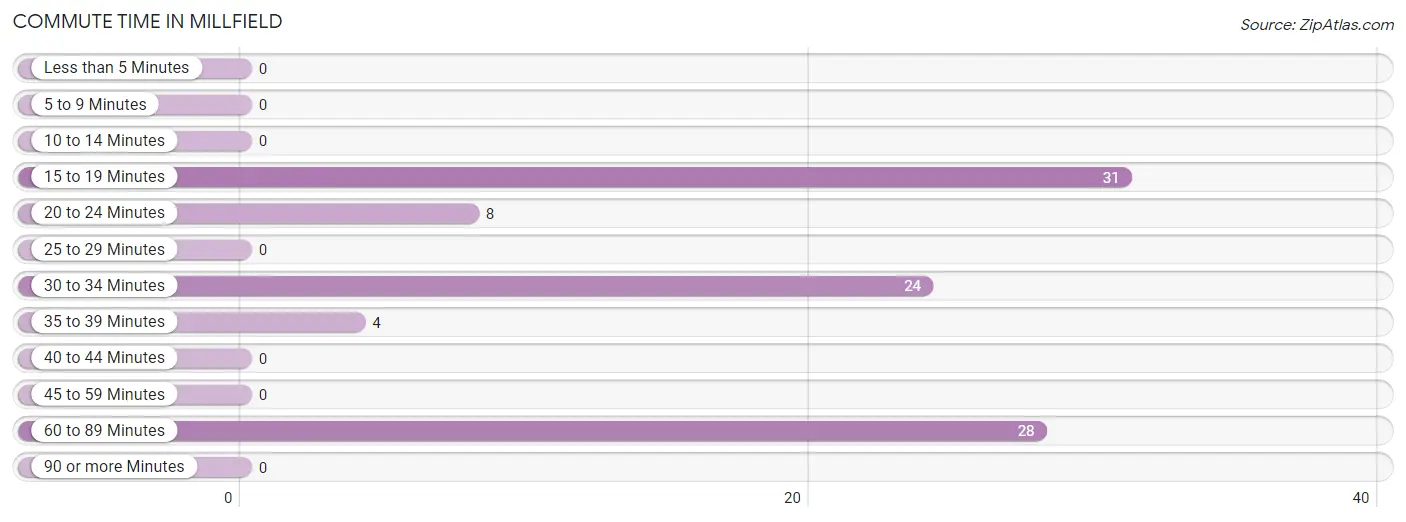
| Commute Time | # Commuters | % Commuters |
| Less than 5 Minutes | 0 | 0.0% |
| 5 to 9 Minutes | 0 | 0.0% |
| 10 to 14 Minutes | 0 | 0.0% |
| 15 to 19 Minutes | 31 | 32.6% |
| 20 to 24 Minutes | 8 | 8.4% |
| 25 to 29 Minutes | 0 | 0.0% |
| 30 to 34 Minutes | 24 | 25.3% |
| 35 to 39 Minutes | 4 | 4.2% |
| 40 to 44 Minutes | 0 | 0.0% |
| 45 to 59 Minutes | 0 | 0.0% |
| 60 to 89 Minutes | 28 | 29.5% |
| 90 or more Minutes | 0 | 0.0% |
Commute Time by Sex in Millfield
The most common commute times in Millfield are 15 to 19 minutes (31 commuters, 44.3%) for males and 30 to 34 minutes (13 commuters, 52.0%) for females.
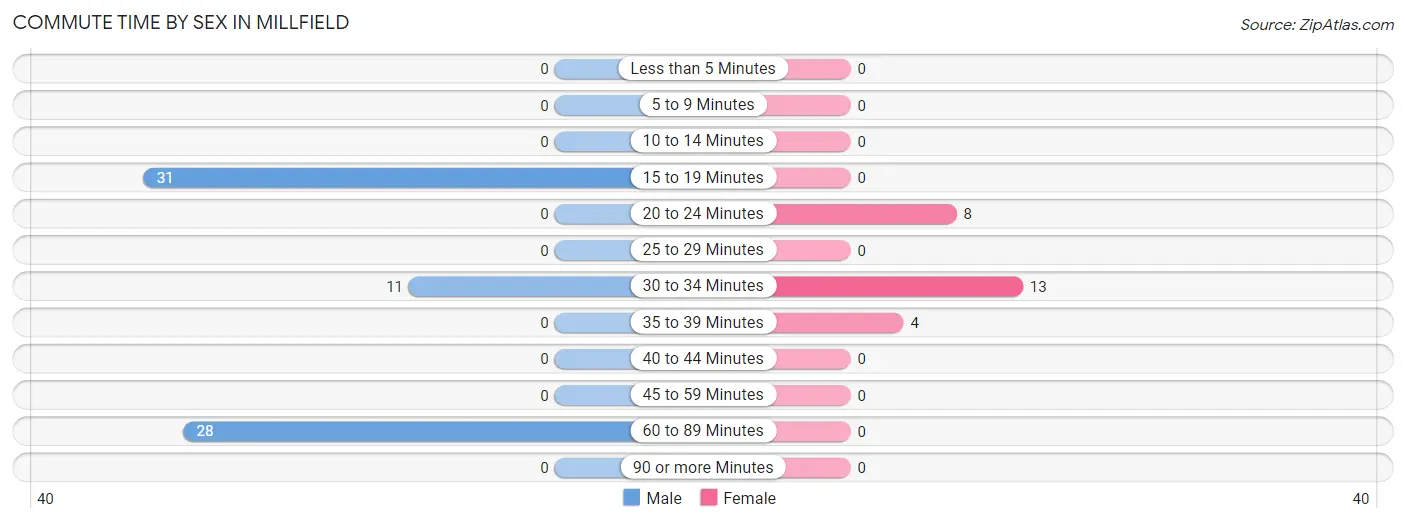
| Commute Time | Male | Female |
| Less than 5 Minutes | 0 (0.0%) | 0 (0.0%) |
| 5 to 9 Minutes | 0 (0.0%) | 0 (0.0%) |
| 10 to 14 Minutes | 0 (0.0%) | 0 (0.0%) |
| 15 to 19 Minutes | 31 (44.3%) | 0 (0.0%) |
| 20 to 24 Minutes | 0 (0.0%) | 8 (32.0%) |
| 25 to 29 Minutes | 0 (0.0%) | 0 (0.0%) |
| 30 to 34 Minutes | 11 (15.7%) | 13 (52.0%) |
| 35 to 39 Minutes | 0 (0.0%) | 4 (16.0%) |
| 40 to 44 Minutes | 0 (0.0%) | 0 (0.0%) |
| 45 to 59 Minutes | 0 (0.0%) | 0 (0.0%) |
| 60 to 89 Minutes | 28 (40.0%) | 0 (0.0%) |
| 90 or more Minutes | 0 (0.0%) | 0 (0.0%) |
Time of Departure to Work by Sex in Millfield
The most frequent times of departure to work in Millfield are 5:30 AM to 5:59 AM (28, 40.0%) for males and 4:00 PM to 11:59 PM (13, 52.0%) for females.
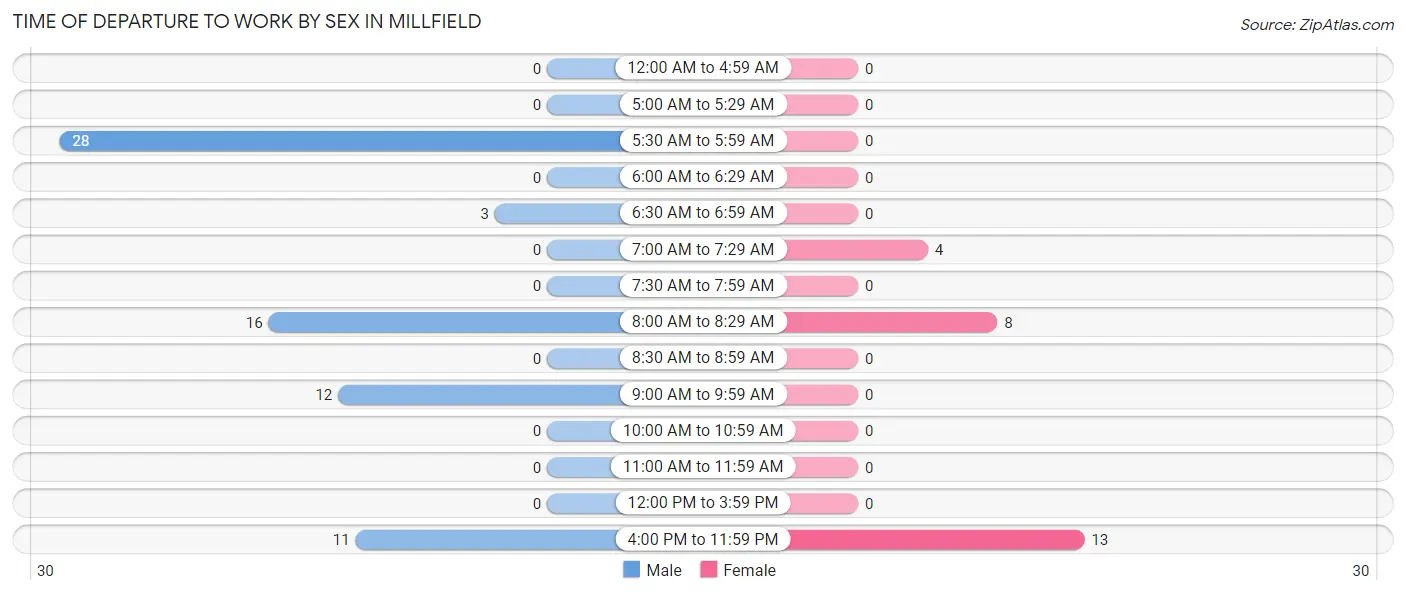
| Time of Departure | Male | Female |
| 12:00 AM to 4:59 AM | 0 (0.0%) | 0 (0.0%) |
| 5:00 AM to 5:29 AM | 0 (0.0%) | 0 (0.0%) |
| 5:30 AM to 5:59 AM | 28 (40.0%) | 0 (0.0%) |
| 6:00 AM to 6:29 AM | 0 (0.0%) | 0 (0.0%) |
| 6:30 AM to 6:59 AM | 3 (4.3%) | 0 (0.0%) |
| 7:00 AM to 7:29 AM | 0 (0.0%) | 4 (16.0%) |
| 7:30 AM to 7:59 AM | 0 (0.0%) | 0 (0.0%) |
| 8:00 AM to 8:29 AM | 16 (22.9%) | 8 (32.0%) |
| 8:30 AM to 8:59 AM | 0 (0.0%) | 0 (0.0%) |
| 9:00 AM to 9:59 AM | 12 (17.1%) | 0 (0.0%) |
| 10:00 AM to 10:59 AM | 0 (0.0%) | 0 (0.0%) |
| 11:00 AM to 11:59 AM | 0 (0.0%) | 0 (0.0%) |
| 12:00 PM to 3:59 PM | 0 (0.0%) | 0 (0.0%) |
| 4:00 PM to 11:59 PM | 11 (15.7%) | 13 (52.0%) |
| Total | 70 (100.0%) | 25 (100.0%) |
Housing Occupancy in Millfield
Occupancy by Ownership in Millfield
Of the total 140 dwellings in Millfield, owner-occupied units account for 94 (67.1%), while renter-occupied units make up 46 (32.9%).
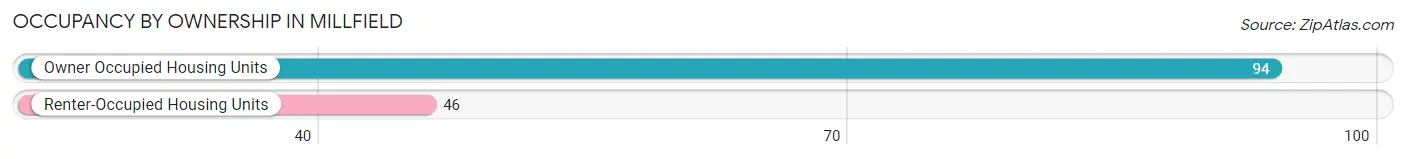
| Occupancy | # Housing Units | % Housing Units |
| Owner Occupied Housing Units | 94 | 67.1% |
| Renter-Occupied Housing Units | 46 | 32.9% |
| Total Occupied Housing Units | 140 | 100.0% |
Occupancy by Household Size in Millfield
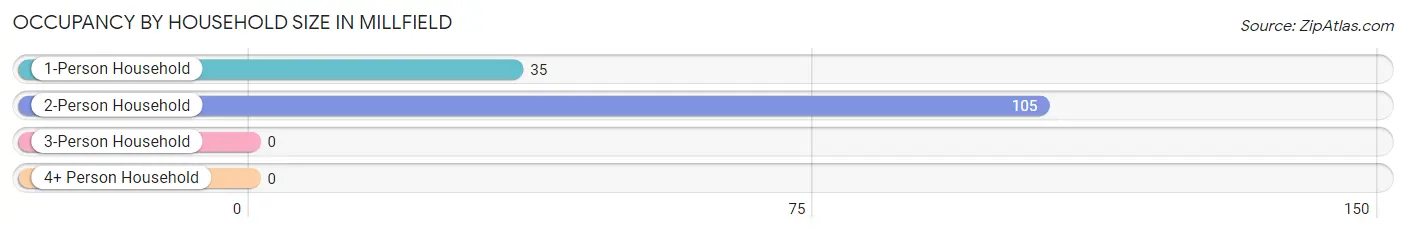
| Household Size | # Housing Units | % Housing Units |
| 1-Person Household | 35 | 25.0% |
| 2-Person Household | 105 | 75.0% |
| 3-Person Household | 0 | 0.0% |
| 4+ Person Household | 0 | 0.0% |
| Total Housing Units | 140 | 100.0% |
Occupancy by Ownership by Household Size in Millfield
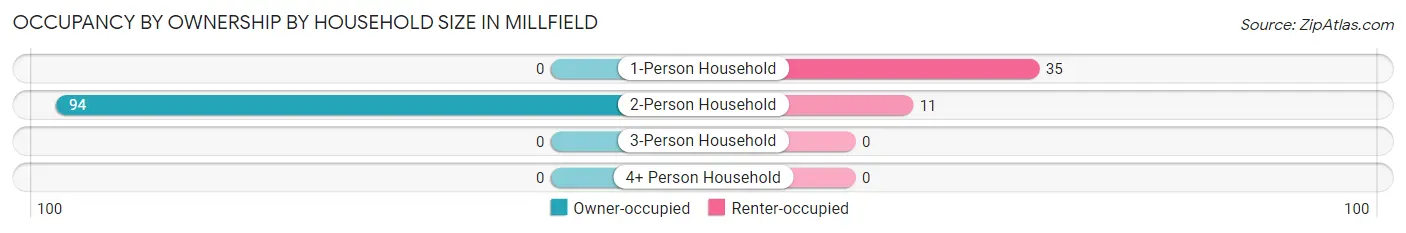
| Household Size | Owner-occupied | Renter-occupied |
| 1-Person Household | 0 (0.0%) | 35 (100.0%) |
| 2-Person Household | 94 (89.5%) | 11 (10.5%) |
| 3-Person Household | 0 (0.0%) | 0 (0.0%) |
| 4+ Person Household | 0 (0.0%) | 0 (0.0%) |
| Total Housing Units | 94 (67.1%) | 46 (32.9%) |
Occupancy by Educational Attainment in Millfield
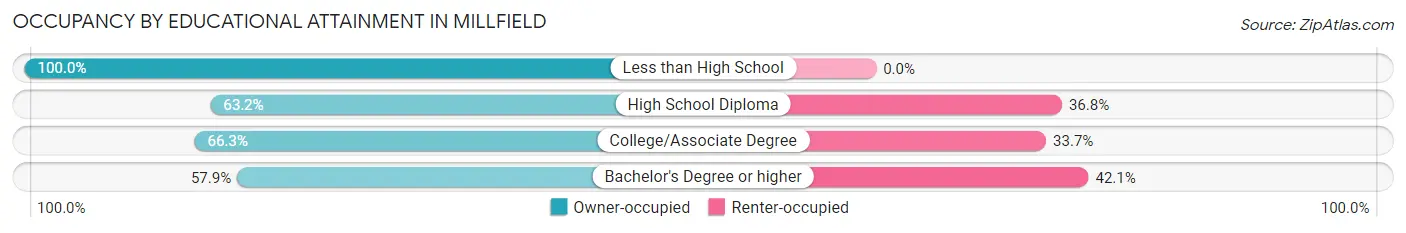
| Household Size | Owner-occupied | Renter-occupied |
| Less than High School | 10 (100.0%) | 0 (0.0%) |
| High School Diploma | 12 (63.2%) | 7 (36.8%) |
| College/Associate Degree | 61 (66.3%) | 31 (33.7%) |
| Bachelor's Degree or higher | 11 (57.9%) | 8 (42.1%) |
Occupancy by Age of Householder in Millfield
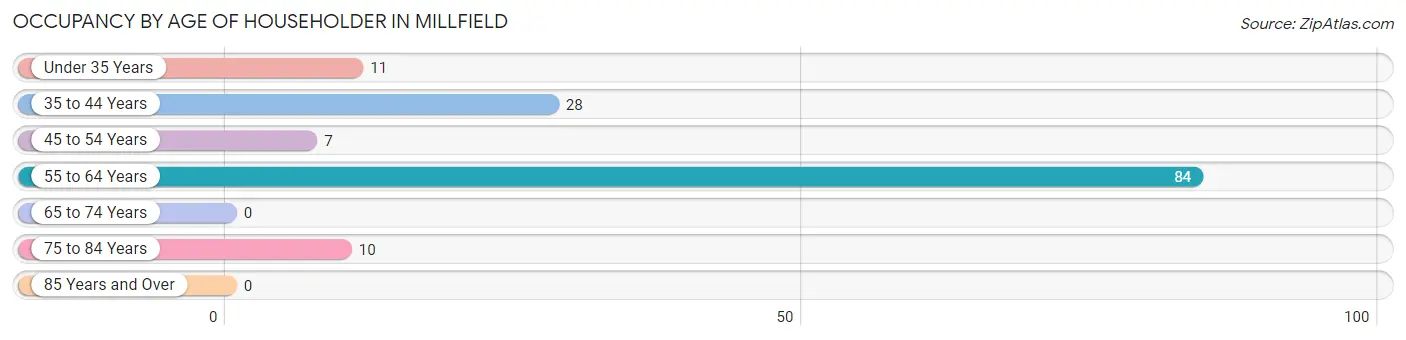
| Age Bracket | # Households | % Households |
| Under 35 Years | 11 | 7.9% |
| 35 to 44 Years | 28 | 20.0% |
| 45 to 54 Years | 7 | 5.0% |
| 55 to 64 Years | 84 | 60.0% |
| 65 to 74 Years | 0 | 0.0% |
| 75 to 84 Years | 10 | 7.1% |
| 85 Years and Over | 0 | 0.0% |
| Total | 140 | 100.0% |
Housing Finances in Millfield
Median Income by Occupancy in Millfield
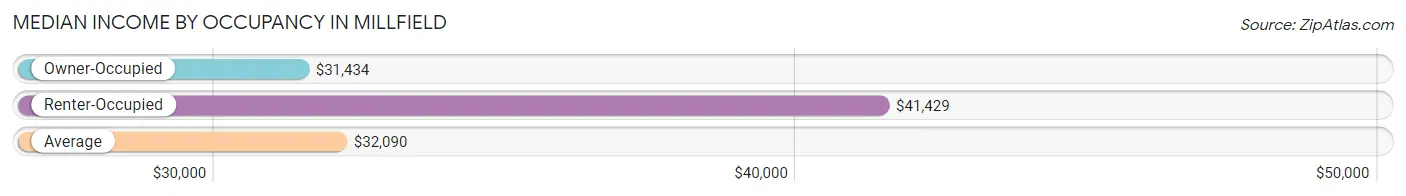
| Occupancy Type | # Households | Median Income |
| Owner-Occupied | 94 (67.1%) | $31,434 |
| Renter-Occupied | 46 (32.9%) | $41,429 |
| Average | 140 (100.0%) | $32,090 |
Occupancy by Householder Income Bracket in Millfield
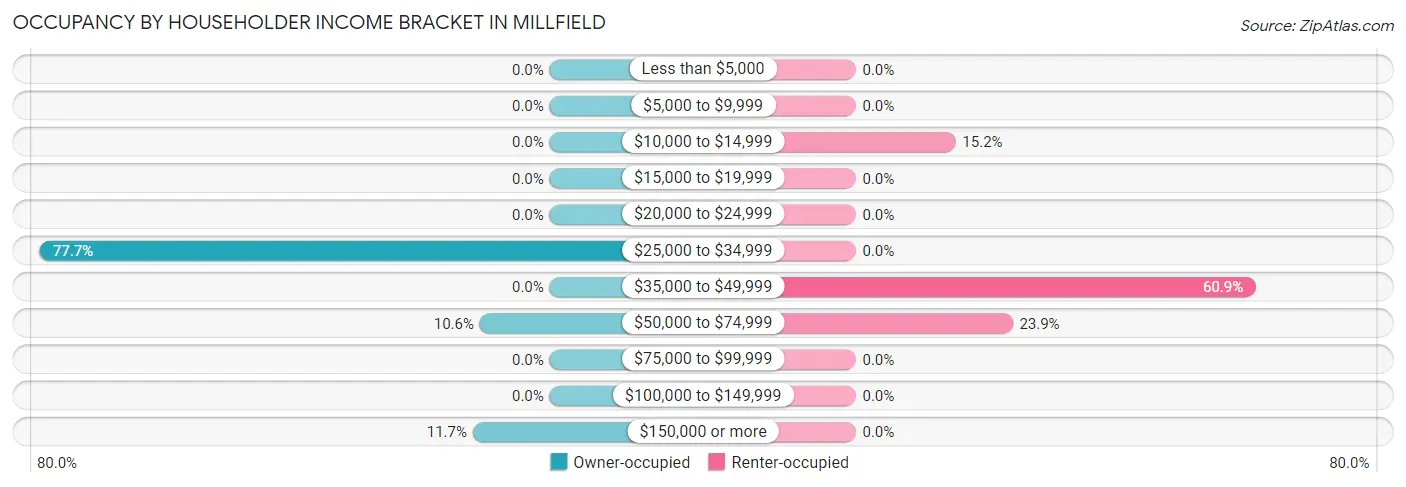
| Income Bracket | Owner-occupied | Renter-occupied |
| Less than $5,000 | 0 (0.0%) | 0 (0.0%) |
| $5,000 to $9,999 | 0 (0.0%) | 0 (0.0%) |
| $10,000 to $14,999 | 0 (0.0%) | 7 (15.2%) |
| $15,000 to $19,999 | 0 (0.0%) | 0 (0.0%) |
| $20,000 to $24,999 | 0 (0.0%) | 0 (0.0%) |
| $25,000 to $34,999 | 73 (77.7%) | 0 (0.0%) |
| $35,000 to $49,999 | 0 (0.0%) | 28 (60.9%) |
| $50,000 to $74,999 | 10 (10.6%) | 11 (23.9%) |
| $75,000 to $99,999 | 0 (0.0%) | 0 (0.0%) |
| $100,000 to $149,999 | 0 (0.0%) | 0 (0.0%) |
| $150,000 or more | 11 (11.7%) | 0 (0.0%) |
| Total | 94 (100.0%) | 46 (100.0%) |
Monthly Housing Cost Tiers in Millfield
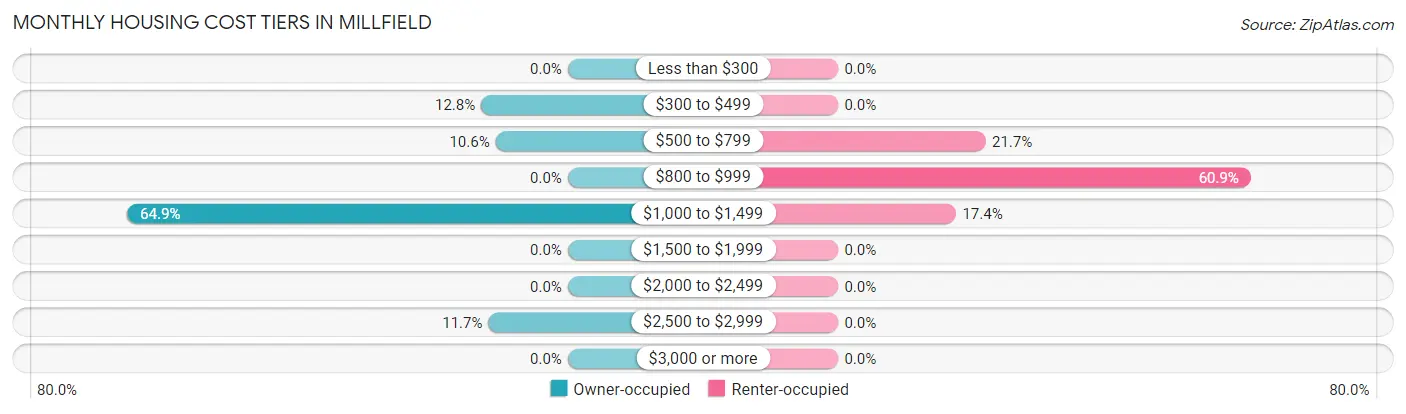
| Monthly Cost | Owner-occupied | Renter-occupied |
| Less than $300 | 0 (0.0%) | 0 (0.0%) |
| $300 to $499 | 12 (12.8%) | 0 (0.0%) |
| $500 to $799 | 10 (10.6%) | 10 (21.7%) |
| $800 to $999 | 0 (0.0%) | 28 (60.9%) |
| $1,000 to $1,499 | 61 (64.9%) | 8 (17.4%) |
| $1,500 to $1,999 | 0 (0.0%) | 0 (0.0%) |
| $2,000 to $2,499 | 0 (0.0%) | 0 (0.0%) |
| $2,500 to $2,999 | 11 (11.7%) | 0 (0.0%) |
| $3,000 or more | 0 (0.0%) | 0 (0.0%) |
| Total | 94 (100.0%) | 46 (100.0%) |
Physical Housing Characteristics in Millfield
Housing Structures in Millfield
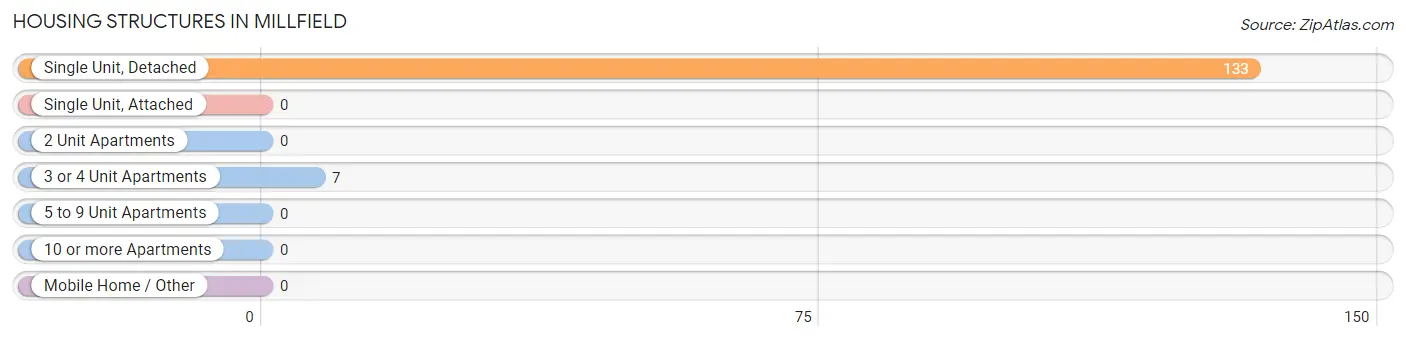
| Structure Type | # Housing Units | % Housing Units |
| Single Unit, Detached | 133 | 95.0% |
| Single Unit, Attached | 0 | 0.0% |
| 2 Unit Apartments | 0 | 0.0% |
| 3 or 4 Unit Apartments | 7 | 5.0% |
| 5 to 9 Unit Apartments | 0 | 0.0% |
| 10 or more Apartments | 0 | 0.0% |
| Mobile Home / Other | 0 | 0.0% |
| Total | 140 | 100.0% |
Housing Structures by Occupancy in Millfield
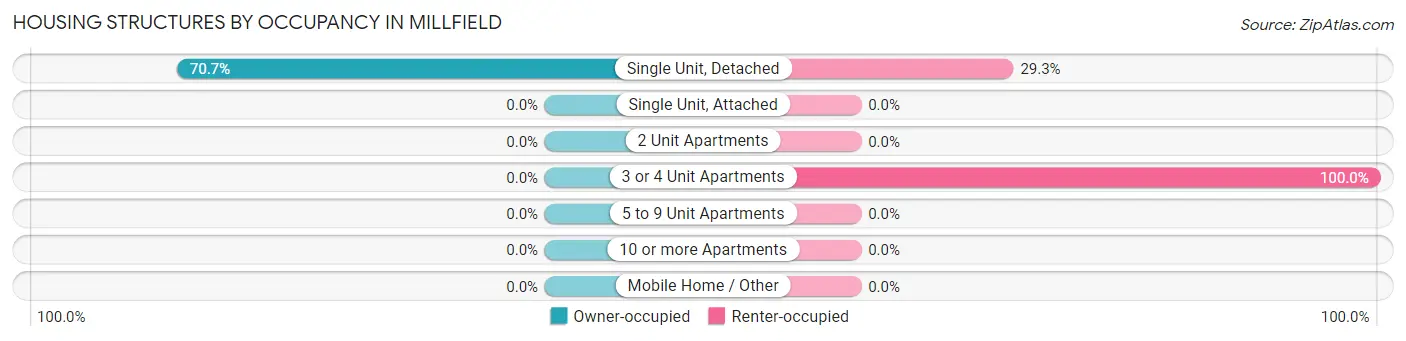
| Structure Type | Owner-occupied | Renter-occupied |
| Single Unit, Detached | 94 (70.7%) | 39 (29.3%) |
| Single Unit, Attached | 0 (0.0%) | 0 (0.0%) |
| 2 Unit Apartments | 0 (0.0%) | 0 (0.0%) |
| 3 or 4 Unit Apartments | 0 (0.0%) | 7 (100.0%) |
| 5 to 9 Unit Apartments | 0 (0.0%) | 0 (0.0%) |
| 10 or more Apartments | 0 (0.0%) | 0 (0.0%) |
| Mobile Home / Other | 0 (0.0%) | 0 (0.0%) |
| Total | 94 (67.1%) | 46 (32.9%) |
Housing Structures by Number of Rooms in Millfield
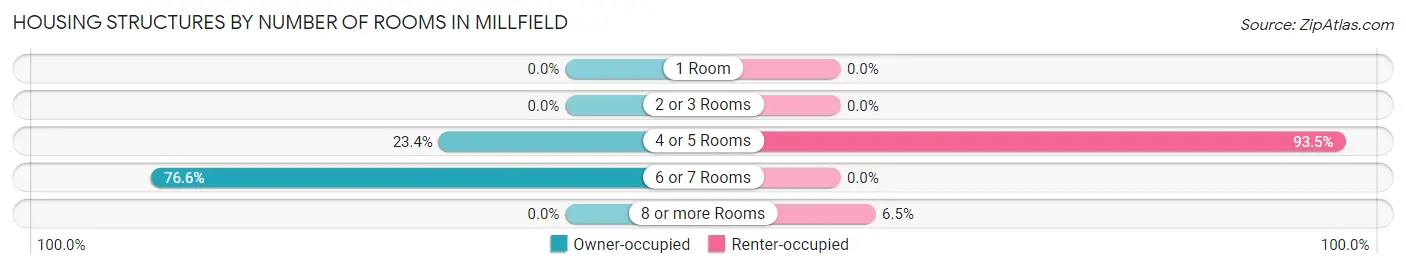
| Number of Rooms | Owner-occupied | Renter-occupied |
| 1 Room | 0 (0.0%) | 0 (0.0%) |
| 2 or 3 Rooms | 0 (0.0%) | 0 (0.0%) |
| 4 or 5 Rooms | 22 (23.4%) | 43 (93.5%) |
| 6 or 7 Rooms | 72 (76.6%) | 0 (0.0%) |
| 8 or more Rooms | 0 (0.0%) | 3 (6.5%) |
| Total | 94 (100.0%) | 46 (100.0%) |
Housing Structure by Heating Type in Millfield
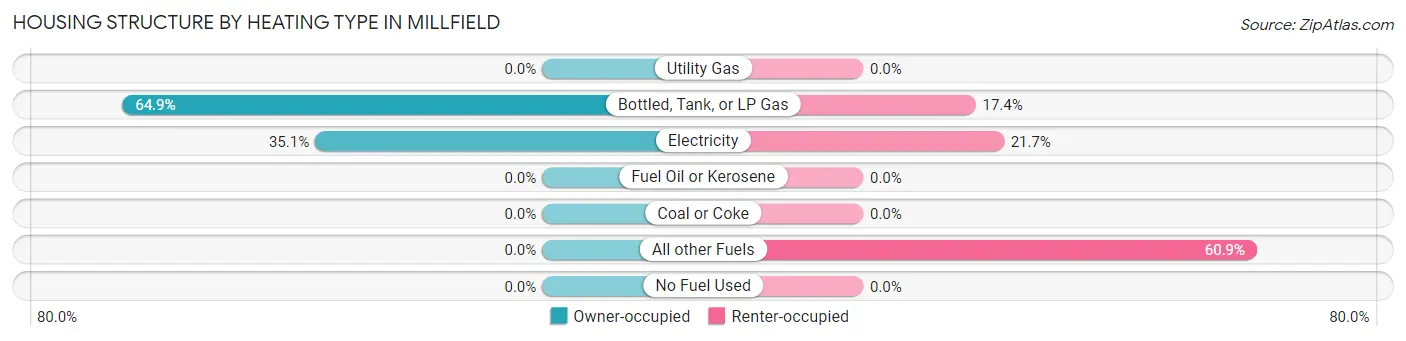
| Heating Type | Owner-occupied | Renter-occupied |
| Utility Gas | 0 (0.0%) | 0 (0.0%) |
| Bottled, Tank, or LP Gas | 61 (64.9%) | 8 (17.4%) |
| Electricity | 33 (35.1%) | 10 (21.7%) |
| Fuel Oil or Kerosene | 0 (0.0%) | 0 (0.0%) |
| Coal or Coke | 0 (0.0%) | 0 (0.0%) |
| All other Fuels | 0 (0.0%) | 28 (60.9%) |
| No Fuel Used | 0 (0.0%) | 0 (0.0%) |
| Total | 94 (100.0%) | 46 (100.0%) |
Household Vehicle Usage in Millfield
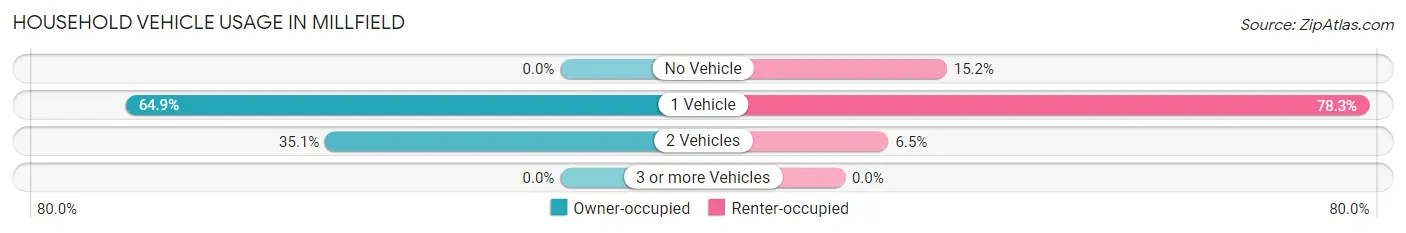
| Vehicles per Household | Owner-occupied | Renter-occupied |
| No Vehicle | 0 (0.0%) | 7 (15.2%) |
| 1 Vehicle | 61 (64.9%) | 36 (78.3%) |
| 2 Vehicles | 33 (35.1%) | 3 (6.5%) |
| 3 or more Vehicles | 0 (0.0%) | 0 (0.0%) |
| Total | 94 (100.0%) | 46 (100.0%) |
Real Estate & Mortgages in Millfield
Real Estate and Mortgage Overview in Millfield
| Characteristic | Without Mortgage | With Mortgage |
| Housing Units | 22 | 72 |
| Median Property Value | - | - |
| Median Household Income | - | - |
| Monthly Housing Costs | - | - |
| Real Estate Taxes | - | - |
Property Value by Mortgage Status in Millfield
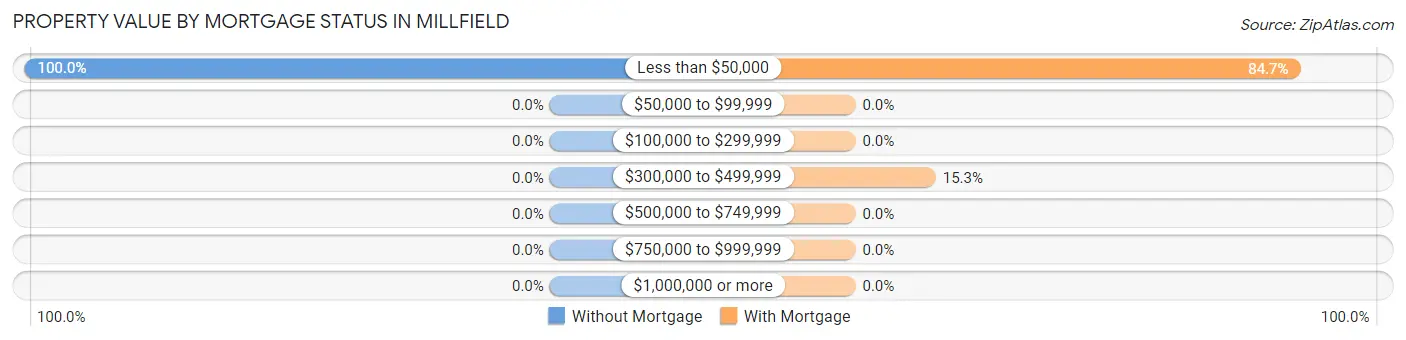
| Property Value | Without Mortgage | With Mortgage |
| Less than $50,000 | 22 (100.0%) | 61 (84.7%) |
| $50,000 to $99,999 | 0 (0.0%) | 0 (0.0%) |
| $100,000 to $299,999 | 0 (0.0%) | 0 (0.0%) |
| $300,000 to $499,999 | 0 (0.0%) | 11 (15.3%) |
| $500,000 to $749,999 | 0 (0.0%) | 0 (0.0%) |
| $750,000 to $999,999 | 0 (0.0%) | 0 (0.0%) |
| $1,000,000 or more | 0 (0.0%) | 0 (0.0%) |
| Total | 22 (100.0%) | 72 (100.0%) |
Household Income by Mortgage Status in Millfield
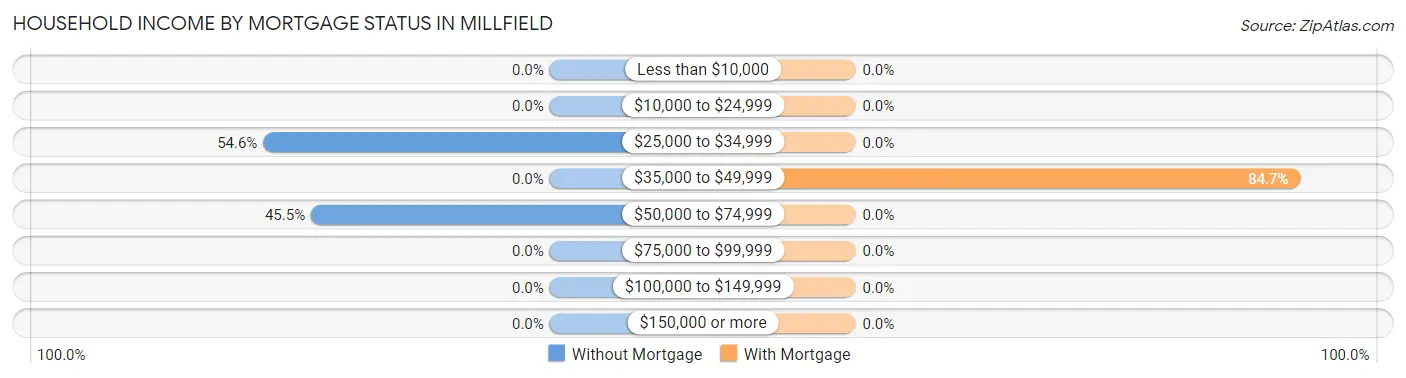
| Household Income | Without Mortgage | With Mortgage |
| Less than $10,000 | 0 (0.0%) | 0 (0.0%) |
| $10,000 to $24,999 | 0 (0.0%) | 0 (0.0%) |
| $25,000 to $34,999 | 12 (54.5%) | 0 (0.0%) |
| $35,000 to $49,999 | 0 (0.0%) | 61 (84.7%) |
| $50,000 to $74,999 | 10 (45.5%) | 0 (0.0%) |
| $75,000 to $99,999 | 0 (0.0%) | 0 (0.0%) |
| $100,000 to $149,999 | 0 (0.0%) | 0 (0.0%) |
| $150,000 or more | 0 (0.0%) | 0 (0.0%) |
| Total | 22 (100.0%) | 72 (100.0%) |
Property Value to Household Income Ratio in Millfield
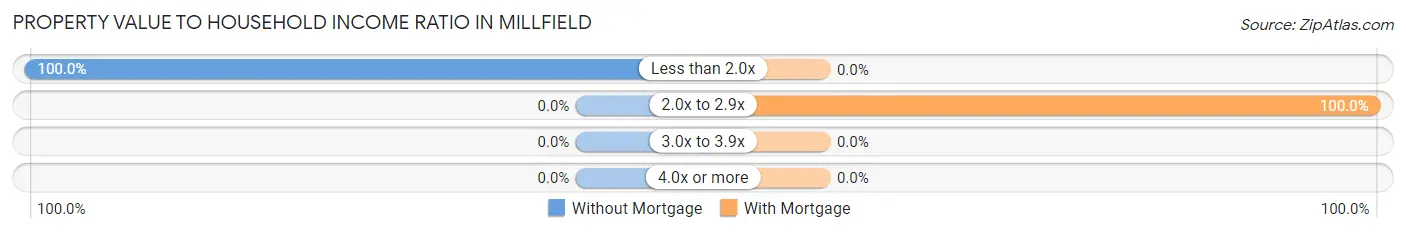
| Value-to-Income Ratio | Without Mortgage | With Mortgage |
| Less than 2.0x | 22 (100.0%) | 0 (0.0%) |
| 2.0x to 2.9x | 0 (0.0%) | 72 (100.0%) |
| 3.0x to 3.9x | 0 (0.0%) | 0 (0.0%) |
| 4.0x or more | 0 (0.0%) | 0 (0.0%) |
| Total | 22 (100.0%) | 72 (100.0%) |
Real Estate Taxes by Mortgage Status in Millfield
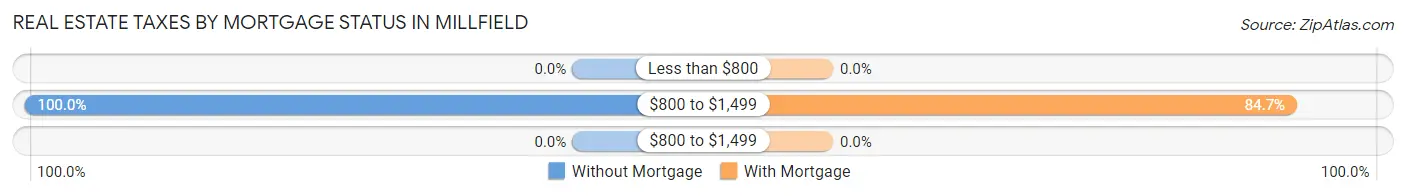
| Property Taxes | Without Mortgage | With Mortgage |
| Less than $800 | 0 (0.0%) | 0 (0.0%) |
| $800 to $1,499 | 22 (100.0%) | 61 (84.7%) |
| $800 to $1,499 | 0 (0.0%) | 0 (0.0%) |
| Total | 22 (100.0%) | 72 (100.0%) |
Health & Disability in Millfield
Health Insurance Coverage by Age in Millfield
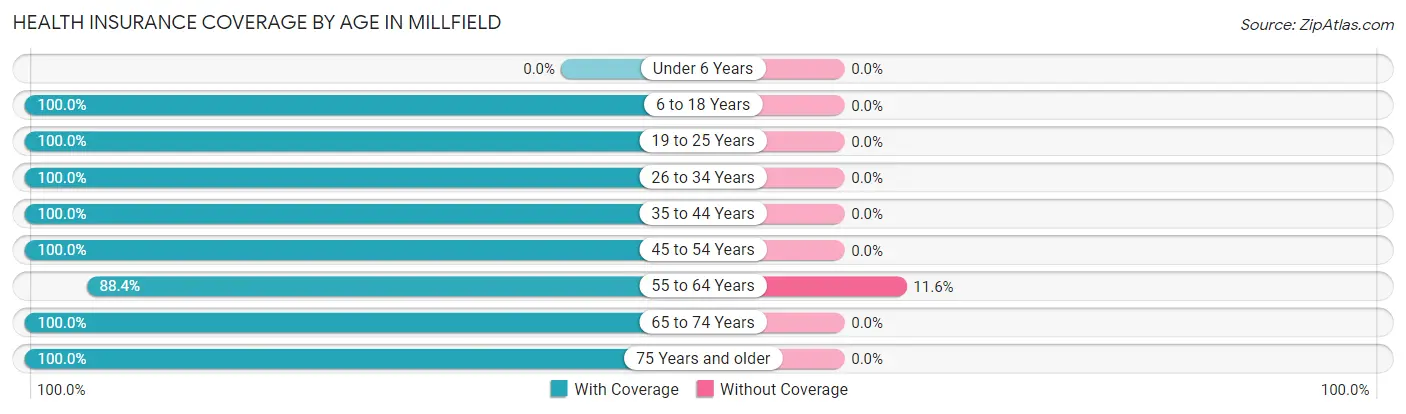
| Age Bracket | With Coverage | Without Coverage |
| Under 6 Years | 0 (0.0%) | 0 (0.0%) |
| 6 to 18 Years | 63 (100.0%) | 0 (0.0%) |
| 19 to 25 Years | 15 (100.0%) | 0 (0.0%) |
| 26 to 34 Years | 16 (100.0%) | 0 (0.0%) |
| 35 to 44 Years | 28 (100.0%) | 0 (0.0%) |
| 45 to 54 Years | 7 (100.0%) | 0 (0.0%) |
| 55 to 64 Years | 84 (88.4%) | 11 (11.6%) |
| 65 to 74 Years | 24 (100.0%) | 0 (0.0%) |
| 75 Years and older | 10 (100.0%) | 0 (0.0%) |
| Total | 247 (95.7%) | 11 (4.3%) |
Health Insurance Coverage by Citizenship Status in Millfield
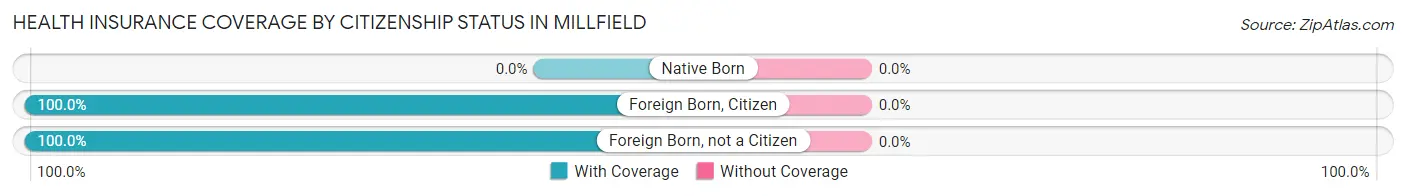
| Citizenship Status | With Coverage | Without Coverage |
| Native Born | 0 (0.0%) | 0 (0.0%) |
| Foreign Born, Citizen | 63 (100.0%) | 0 (0.0%) |
| Foreign Born, not a Citizen | 15 (100.0%) | 0 (0.0%) |
Health Insurance Coverage by Household Income in Millfield
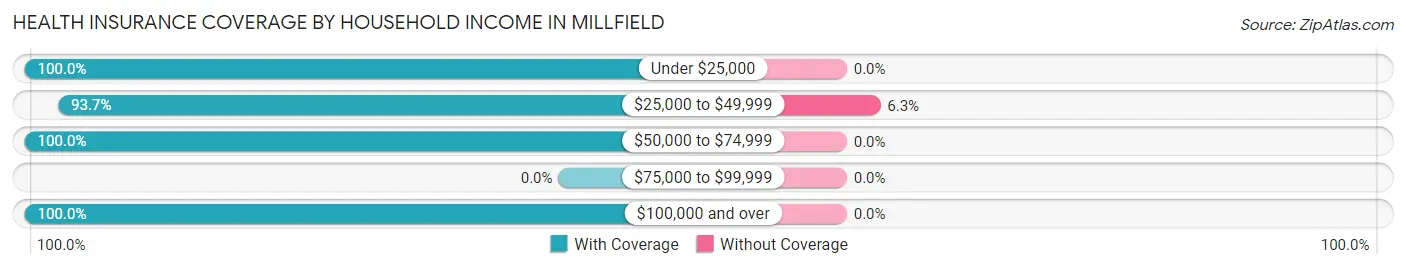
| Household Income | With Coverage | Without Coverage |
| Under $25,000 | 7 (100.0%) | 0 (0.0%) |
| $25,000 to $49,999 | 164 (93.7%) | 11 (6.3%) |
| $50,000 to $74,999 | 54 (100.0%) | 0 (0.0%) |
| $75,000 to $99,999 | 0 (0.0%) | 0 (0.0%) |
| $100,000 and over | 22 (100.0%) | 0 (0.0%) |
Public vs Private Health Insurance Coverage by Age in Millfield
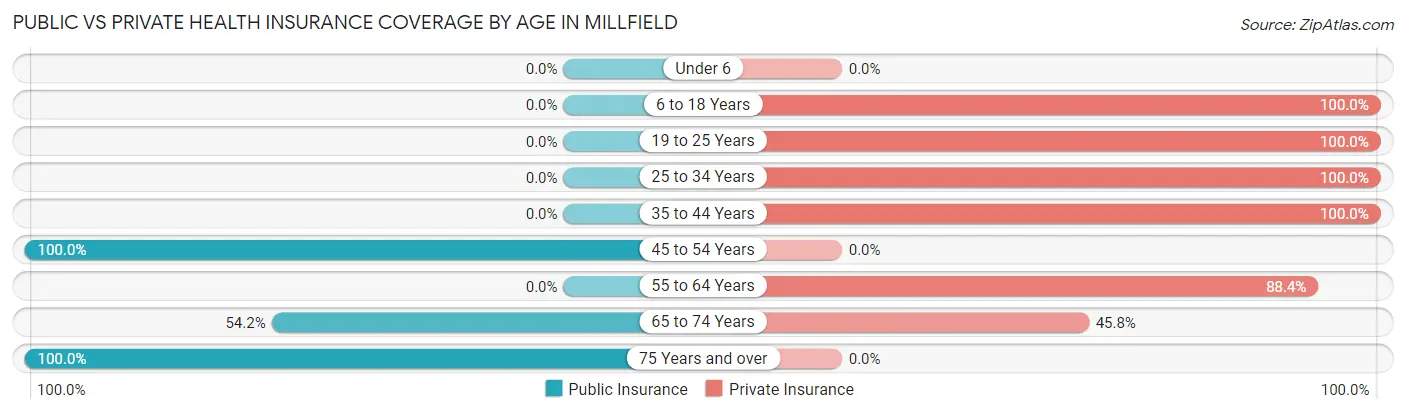
| Age Bracket | Public Insurance | Private Insurance |
| Under 6 | 0 (0.0%) | 0 (0.0%) |
| 6 to 18 Years | 0 (0.0%) | 63 (100.0%) |
| 19 to 25 Years | 0 (0.0%) | 15 (100.0%) |
| 25 to 34 Years | 0 (0.0%) | 16 (100.0%) |
| 35 to 44 Years | 0 (0.0%) | 28 (100.0%) |
| 45 to 54 Years | 7 (100.0%) | 0 (0.0%) |
| 55 to 64 Years | 0 (0.0%) | 84 (88.4%) |
| 65 to 74 Years | 13 (54.2%) | 11 (45.8%) |
| 75 Years and over | 10 (100.0%) | 0 (0.0%) |
| Total | 30 (11.6%) | 217 (84.1%) |
Disability Status by Sex by Age in Millfield
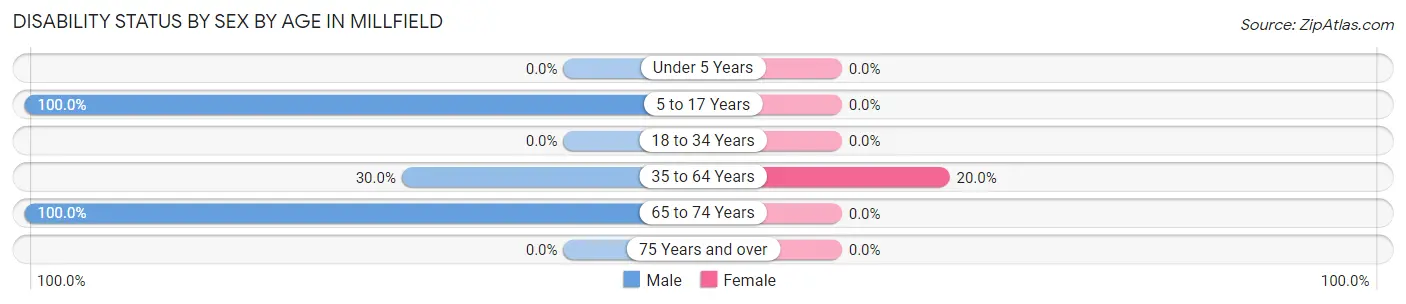
| Age Bracket | Male | Female |
| Under 5 Years | 0 (0.0%) | 0 (0.0%) |
| 5 to 17 Years | 63 (100.0%) | 0 (0.0%) |
| 18 to 34 Years | 0 (0.0%) | 0 (0.0%) |
| 35 to 64 Years | 12 (30.0%) | 18 (20.0%) |
| 65 to 74 Years | 11 (100.0%) | 0 (0.0%) |
| 75 Years and over | 0 (0.0%) | 0 (0.0%) |
Disability Class by Sex by Age in Millfield
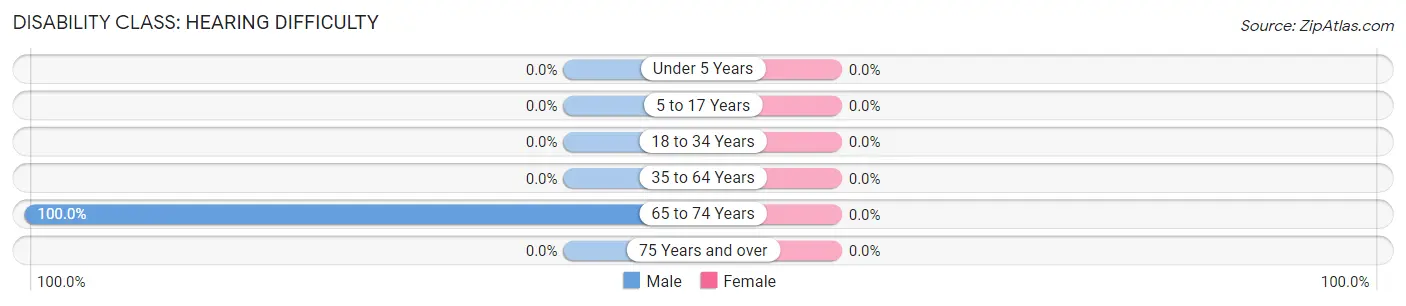
Disability Class: Hearing Difficulty
| Age Bracket | Male | Female |
| Under 5 Years | 0 (0.0%) | 0 (0.0%) |
| 5 to 17 Years | 0 (0.0%) | 0 (0.0%) |
| 18 to 34 Years | 0 (0.0%) | 0 (0.0%) |
| 35 to 64 Years | 0 (0.0%) | 0 (0.0%) |
| 65 to 74 Years | 11 (100.0%) | 0 (0.0%) |
| 75 Years and over | 0 (0.0%) | 0 (0.0%) |
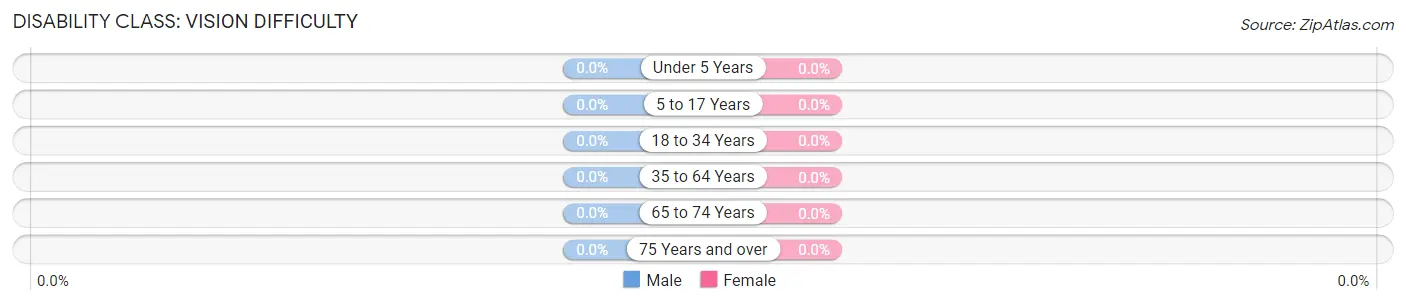
Disability Class: Vision Difficulty
| Age Bracket | Male | Female |
| Under 5 Years | 0 (0.0%) | 0 (0.0%) |
| 5 to 17 Years | 0 (0.0%) | 0 (0.0%) |
| 18 to 34 Years | 0 (0.0%) | 0 (0.0%) |
| 35 to 64 Years | 0 (0.0%) | 0 (0.0%) |
| 65 to 74 Years | 0 (0.0%) | 0 (0.0%) |
| 75 Years and over | 0 (0.0%) | 0 (0.0%) |
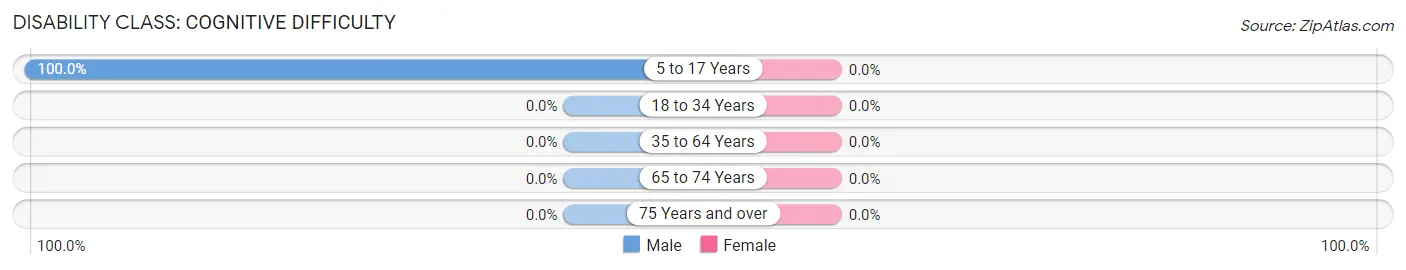
Disability Class: Cognitive Difficulty
| Age Bracket | Male | Female |
| 5 to 17 Years | 63 (100.0%) | 0 (0.0%) |
| 18 to 34 Years | 0 (0.0%) | 0 (0.0%) |
| 35 to 64 Years | 0 (0.0%) | 0 (0.0%) |
| 65 to 74 Years | 0 (0.0%) | 0 (0.0%) |
| 75 Years and over | 0 (0.0%) | 0 (0.0%) |
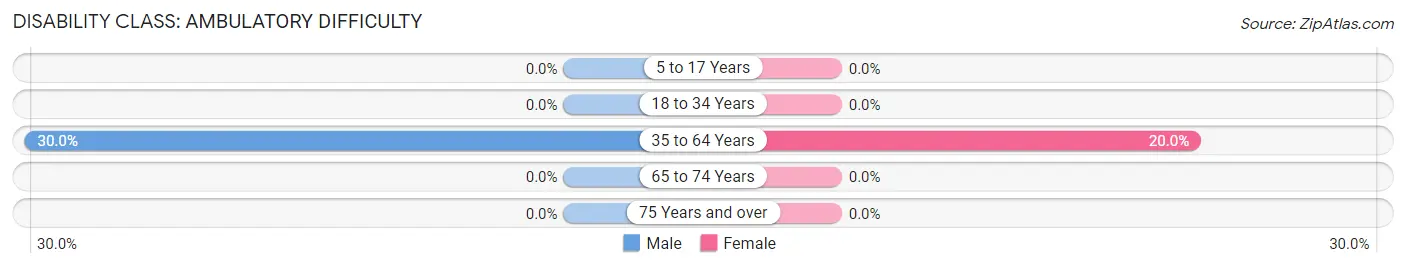
Disability Class: Ambulatory Difficulty
| Age Bracket | Male | Female |
| 5 to 17 Years | 0 (0.0%) | 0 (0.0%) |
| 18 to 34 Years | 0 (0.0%) | 0 (0.0%) |
| 35 to 64 Years | 12 (30.0%) | 18 (20.0%) |
| 65 to 74 Years | 0 (0.0%) | 0 (0.0%) |
| 75 Years and over | 0 (0.0%) | 0 (0.0%) |
Disability Class: Self-Care Difficulty
| Age Bracket | Male | Female |
| 5 to 17 Years | 0 (0.0%) | 0 (0.0%) |
| 18 to 34 Years | 0 (0.0%) | 0 (0.0%) |
| 35 to 64 Years | 0 (0.0%) | 0 (0.0%) |
| 65 to 74 Years | 0 (0.0%) | 0 (0.0%) |
| 75 Years and over | 0 (0.0%) | 0 (0.0%) |
Technology Access in Millfield
Computing Device Access in Millfield
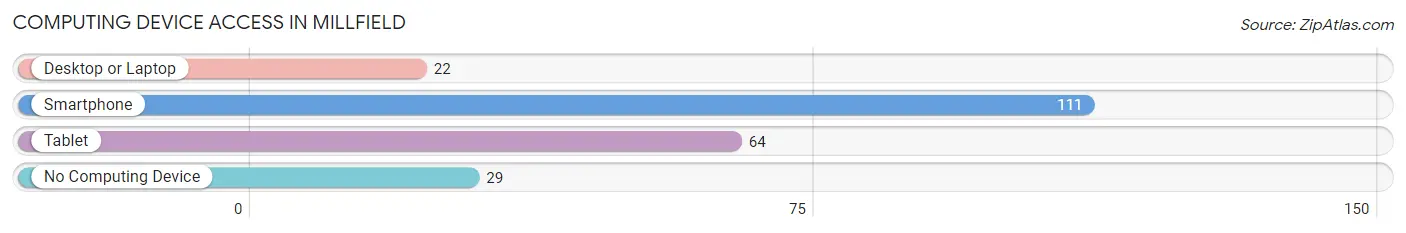
| Device Type | # Households | % Households |
| Desktop or Laptop | 22 | 15.7% |
| Smartphone | 111 | 79.3% |
| Tablet | 64 | 45.7% |
| No Computing Device | 29 | 20.7% |
| Total | 140 | 100.0% |
Internet Access in Millfield
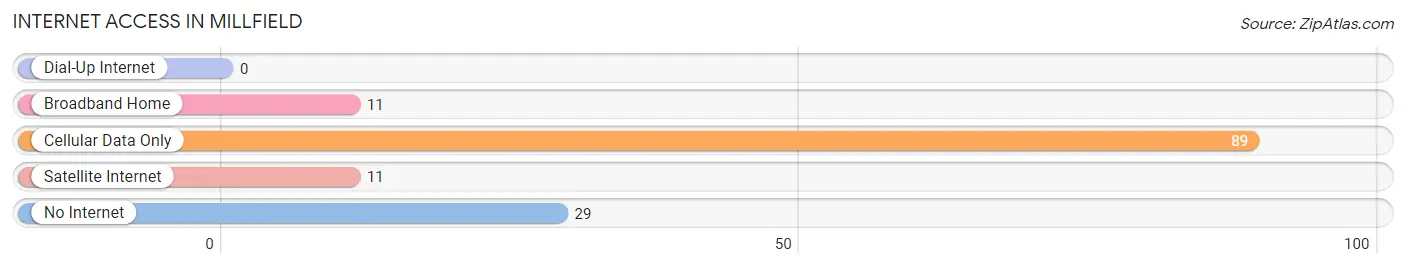
| Internet Type | # Households | % Households |
| Dial-Up Internet | 0 | 0.0% |
| Broadband Home | 11 | 7.9% |
| Cellular Data Only | 89 | 63.6% |
| Satellite Internet | 11 | 7.9% |
| No Internet | 29 | 20.7% |
| Total | 140 | 100.0% |
Millfield Summary
History
The small village of Millfield, Ohio is located in Athens County, in the southeastern part of the state. It is situated on the banks of the Hocking River, and is surrounded by rolling hills and lush forests. The area was first settled in the early 1800s by a group of pioneers from Pennsylvania. They were attracted to the area by its abundant natural resources, including timber, coal, and iron ore.
The village was originally known as Millfield Station, and was a stop on the Marietta and Cincinnati Railroad. The railroad was built in 1851, and it connected the village to the larger cities of Marietta and Cincinnati. The railroad brought with it a new wave of settlers, and the village quickly grew. By the late 1800s, the village had a population of over 500 people.
The village was officially incorporated in 1891, and the name was changed to Millfield. The village was named after the local mill, which was built in 1887. The mill was used to grind grain and produce flour, and it was a major source of employment for the village.
The village continued to grow throughout the early 1900s, and by the 1950s, the population had reached over 1,000 people. The village was home to several businesses, including a grocery store, a hardware store, a bank, and a post office.
Geography
Millfield is located in Athens County, in the southeastern part of Ohio. It is situated on the banks of the Hocking River, and is surrounded by rolling hills and lush forests. The village is located about 25 miles from the city of Athens, and about 50 miles from the state capital of Columbus.
The village is located in a temperate climate, with hot summers and cold winters. The average temperature in the summer is around 75 degrees Fahrenheit, and the average temperature in the winter is around 35 degrees Fahrenheit. The village receives an average of 40 inches of precipitation each year.
Economy
Millfield’s economy is largely based on agriculture and tourism. The village is home to several farms, which produce a variety of crops, including corn, soybeans, and wheat. The village also has several wineries, which produce a variety of wines.
The village is also a popular tourist destination. It is home to several historic sites, including the Millfield Historic District, which is listed on the National Register of Historic Places. The village also has several parks and recreational areas, including the Millfield Nature Preserve.
Demographics
As of the 2010 census, the population of Millfield was 1,093. The population is largely white (94.3%), with small percentages of African American (2.2%), Asian (1.2%), and Hispanic (1.2%) residents. The median household income is $41,250, and the median home value is $117,000. The village has a poverty rate of 15.3%.
Common Questions
What is Per Capita Income in Millfield?
Per Capita income in Millfield is $27,642.
What is the Median Family Income in Millfield?
Median Family Income in Millfield is $31,434.
What is the Median Household income in Millfield?
Median Household Income in Millfield is $32,090.
What is Inequality or Gini Index in Millfield?
Inequality or Gini Index in Millfield is 0.34.
What is the Total Population of Millfield?
Total Population of Millfield is 258.
What is the Total Male Population of Millfield?
Total Male Population of Millfield is 143.
What is the Total Female Population of Millfield?
Total Female Population of Millfield is 115.
What is the Ratio of Males per 100 Females in Millfield?
There are 124.35 Males per 100 Females in Millfield.
What is the Ratio of Females per 100 Males in Millfield?
There are 80.42 Females per 100 Males in Millfield.
What is the Median Population Age in Millfield?
Median Population Age in Millfield is 56.5 Years.
What is the Average Family Size in Millfield
Average Family Size in Millfield is 2.0 People.
What is the Average Household Size in Millfield
Average Household Size in Millfield is 1.8 People.
How Large is the Labor Force in Millfield?
There are 106 People in the Labor Forcein in Millfield.
What is the Percentage of People in the Labor Force in Millfield?
54.4% of People are in the Labor Force in Millfield.