Fenton, LA Map & Demographics
Fenton Map
Fenton Overview
$18,024
PER CAPITA INCOME
$19,063
AVG HOUSEHOLD INCOME
0.47
INEQUALITY / GINI INDEX
213
TOTAL POPULATION
82
MALE POPULATION
131
FEMALE POPULATION
62.60
MALES / 100 FEMALES
159.76
FEMALES / 100 MALES
58.9
MEDIAN AGE
2.0
AVG FAMILY SIZE
1.6
AVG HOUSEHOLD SIZE
118
LABOR FORCE [ PEOPLE ]
61.1%
PERCENT IN LABOR FORCE
Fenton Zip Codes
Fenton Area Codes
Income in Fenton
Income Overview in Fenton
| Characteristic | Number | Measure |
| Per Capita Income | 213 | $18,024 |
| Median Family Income | 74 | $0 |
| Mean Family Income | 74 | $37,618 |
| Median Household Income | 135 | $19,063 |
| Mean Household Income | 135 | $28,922 |
| Income Deficit | 74 | $0 |
| Wage / Income Gap (%) | 213 | 0.00% |
| Wage / Income Gap ($) | 213 | 100.00¢ per $1 |
| Gini / Inequality Index | 213 | 0.47 |
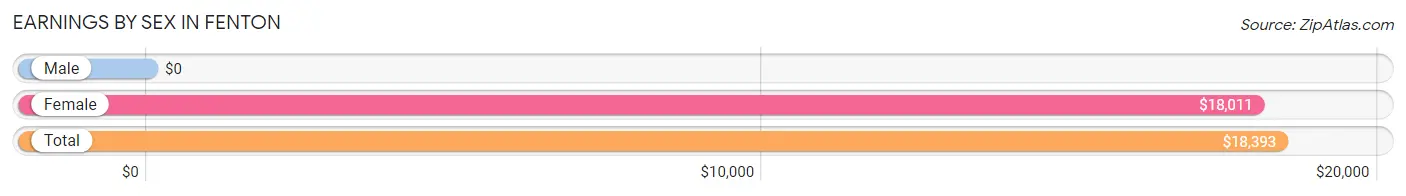
Earnings by Sex in Fenton
| Sex | Number | Average Earnings |
| Male | 51 (42.5%) | $0 |
| Female | 69 (57.5%) | $18,011 |
| Total | 120 (100.0%) | $18,393 |
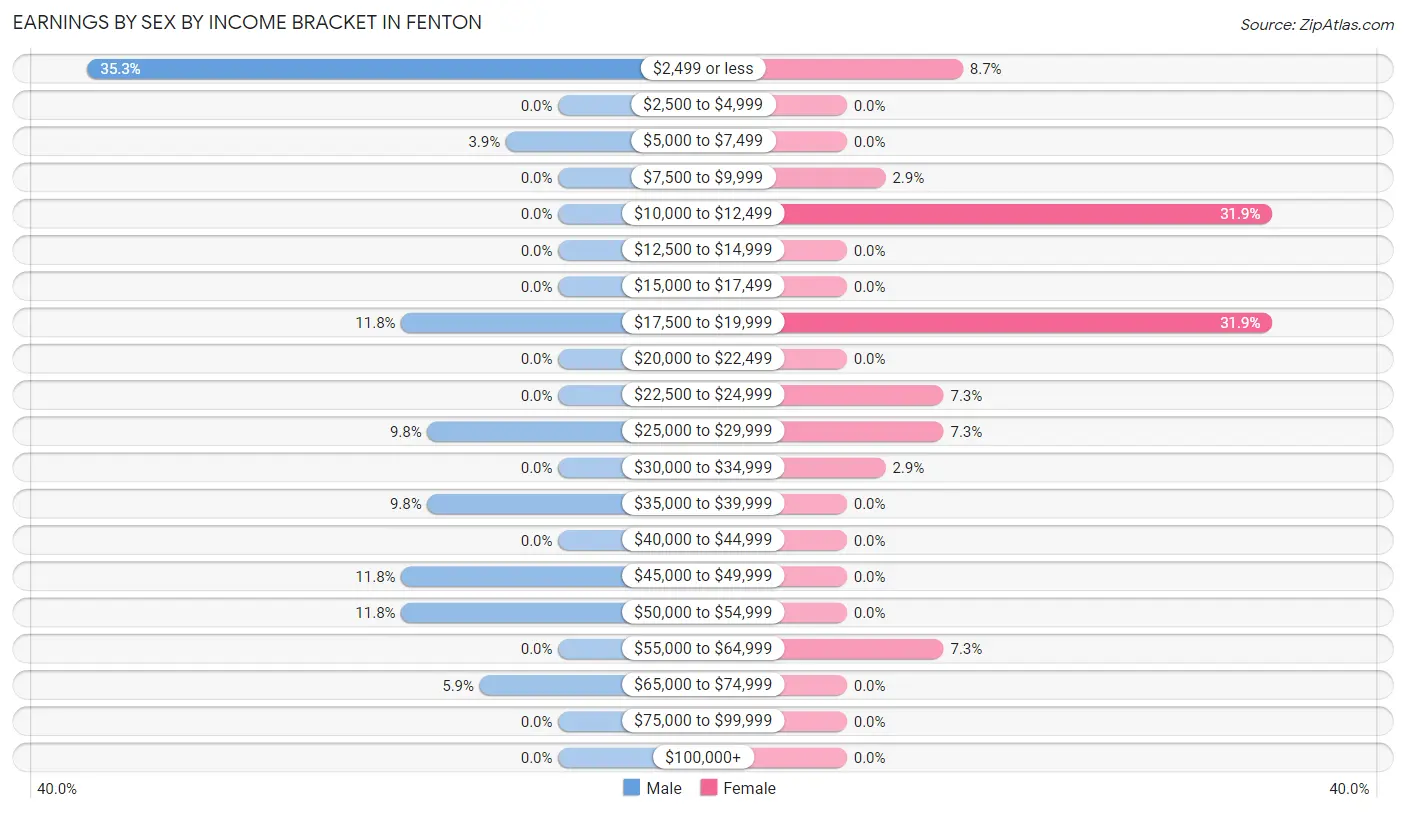
Earnings by Sex by Income Bracket in Fenton
The most common earnings brackets in Fenton are $2,499 or less for men (18 | 35.3%) and $10,000 to $12,499 for women (22 | 31.9%).
| Income | Male | Female |
| $2,499 or less | 18 (35.3%) | 6 (8.7%) |
| $2,500 to $4,999 | 0 (0.0%) | 0 (0.0%) |
| $5,000 to $7,499 | 2 (3.9%) | 0 (0.0%) |
| $7,500 to $9,999 | 0 (0.0%) | 2 (2.9%) |
| $10,000 to $12,499 | 0 (0.0%) | 22 (31.9%) |
| $12,500 to $14,999 | 0 (0.0%) | 0 (0.0%) |
| $15,000 to $17,499 | 0 (0.0%) | 0 (0.0%) |
| $17,500 to $19,999 | 6 (11.8%) | 22 (31.9%) |
| $20,000 to $22,499 | 0 (0.0%) | 0 (0.0%) |
| $22,500 to $24,999 | 0 (0.0%) | 5 (7.2%) |
| $25,000 to $29,999 | 5 (9.8%) | 5 (7.2%) |
| $30,000 to $34,999 | 0 (0.0%) | 2 (2.9%) |
| $35,000 to $39,999 | 5 (9.8%) | 0 (0.0%) |
| $40,000 to $44,999 | 0 (0.0%) | 0 (0.0%) |
| $45,000 to $49,999 | 6 (11.8%) | 0 (0.0%) |
| $50,000 to $54,999 | 6 (11.8%) | 0 (0.0%) |
| $55,000 to $64,999 | 0 (0.0%) | 5 (7.2%) |
| $65,000 to $74,999 | 3 (5.9%) | 0 (0.0%) |
| $75,000 to $99,999 | 0 (0.0%) | 0 (0.0%) |
| $100,000+ | 0 (0.0%) | 0 (0.0%) |
| Total | 51 (100.0%) | 69 (100.0%) |
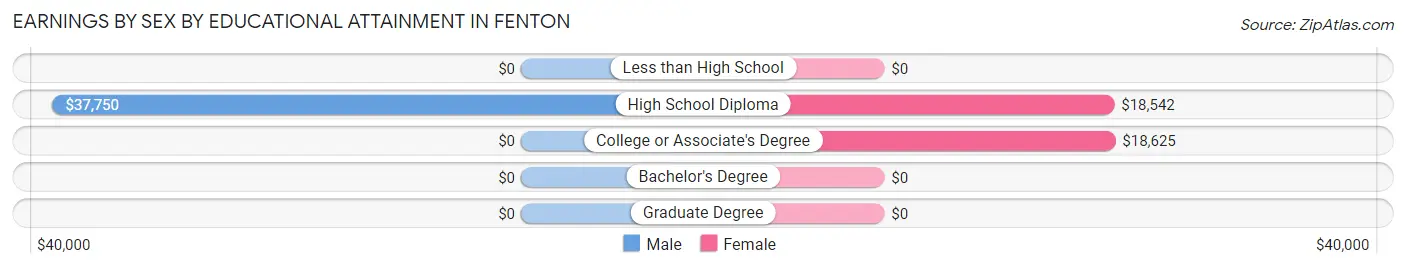
Earnings by Sex by Educational Attainment in Fenton
| Educational Attainment | Male Income | Female Income |
| Less than High School | - | - |
| High School Diploma | $37,750 | $18,542 |
| College or Associate's Degree | - | - |
| Bachelor's Degree | - | - |
| Graduate Degree | - | - |
| Total | - | - |
Family Income in Fenton
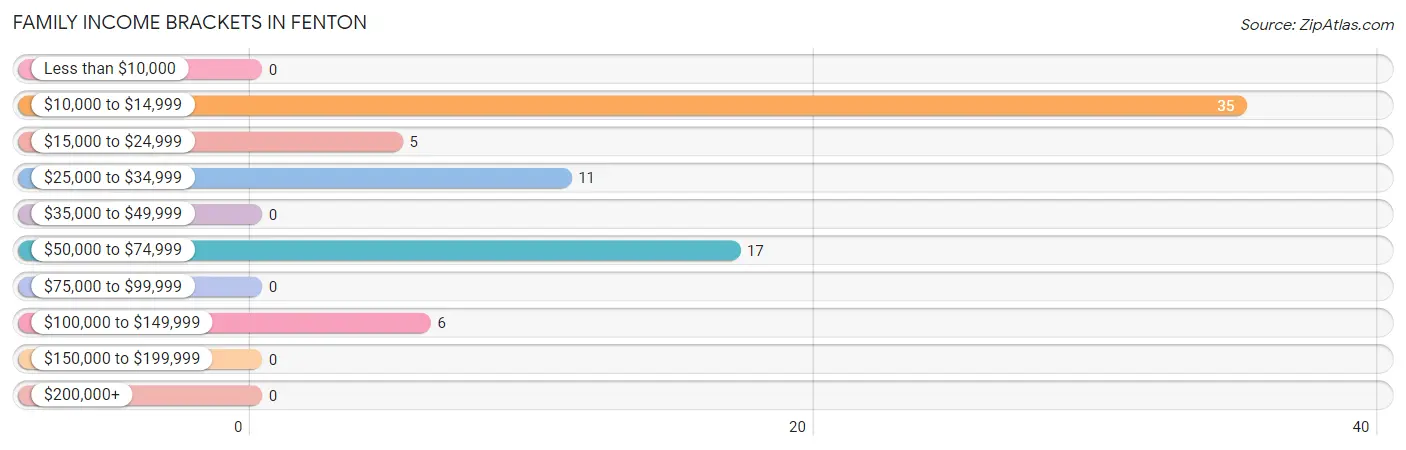
Family Income Brackets in Fenton
According to the Fenton family income data, there are 35 families falling into the $10,000 to $14,999 income range, which is the most common income bracket and makes up 47.3% of all families.
| Income Bracket | # Families | % Families |
| Less than $10,000 | 0 | 0.0% |
| $10,000 to $14,999 | 35 | 47.3% |
| $15,000 to $24,999 | 5 | 6.8% |
| $25,000 to $34,999 | 11 | 14.9% |
| $35,000 to $49,999 | 0 | 0.0% |
| $50,000 to $74,999 | 17 | 23.0% |
| $75,000 to $99,999 | 0 | 0.0% |
| $100,000 to $149,999 | 6 | 8.1% |
| $150,000 to $199,999 | 0 | 0.0% |
| $200,000+ | 0 | 0.0% |
Family Income by Famaliy Size in Fenton
| Income Bracket | # Families | Median Income |
| 2-Person Families | 56 (75.7%) | $0 |
| 3-Person Families | 18 (24.3%) | $0 |
| 4-Person Families | 0 (0.0%) | $0 |
| 5-Person Families | 0 (0.0%) | $0 |
| 6-Person Families | 0 (0.0%) | $0 |
| 7+ Person Families | 0 (0.0%) | $0 |
| Total | 74 (100.0%) | $0 |
Family Income by Number of Earners in Fenton
| Number of Earners | # Families | Median Income |
| No Earners | 0 (0.0%) | $0 |
| 1 Earner | 53 (71.6%) | $0 |
| 2 Earners | 16 (21.6%) | $0 |
| 3+ Earners | 5 (6.8%) | $0 |
| Total | 74 (100.0%) | $0 |
Household Income in Fenton
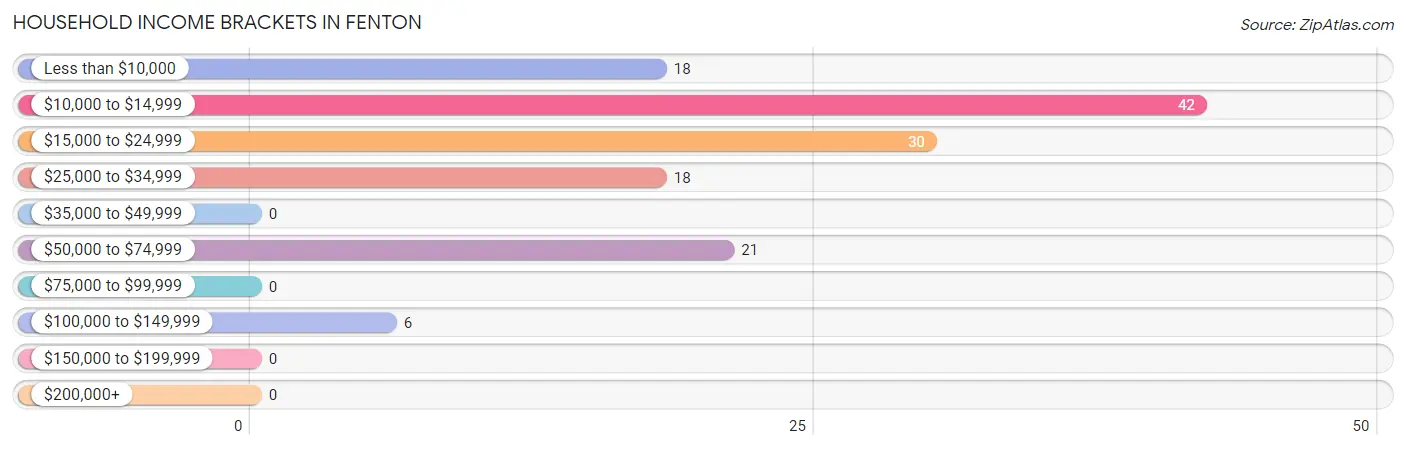
Household Income Brackets in Fenton
With 42 households falling in the category, the $10,000 to $14,999 income range is the most frequent in Fenton, accounting for 31.1% of all households.
| Income Bracket | # Households | % Households |
| Less than $10,000 | 18 | 13.3% |
| $10,000 to $14,999 | 42 | 31.1% |
| $15,000 to $24,999 | 30 | 22.2% |
| $25,000 to $34,999 | 18 | 13.3% |
| $35,000 to $49,999 | 0 | 0.0% |
| $50,000 to $74,999 | 21 | 15.6% |
| $75,000 to $99,999 | 0 | 0.0% |
| $100,000 to $149,999 | 6 | 4.4% |
| $150,000 to $199,999 | 0 | 0.0% |
| $200,000+ | 0 | 0.0% |
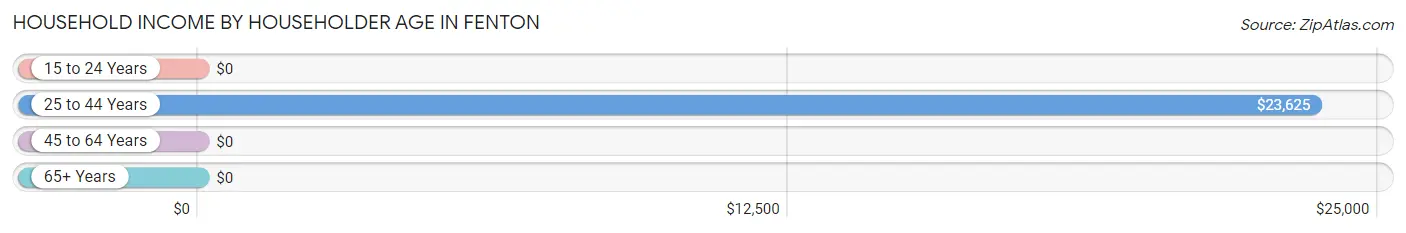
Household Income by Householder Age in Fenton
The median household income in Fenton is $19,063, with the highest median household income of $23,625 found in the 25 to 44 years age bracket for the primary householder. A total of 25 households (18.5%) fall into this category.
| Income Bracket | # Households | Median Income |
| 15 to 24 Years | 0 (0.0%) | $0 |
| 25 to 44 Years | 25 (18.5%) | $23,625 |
| 45 to 64 Years | 79 (58.5%) | $0 |
| 65+ Years | 31 (23.0%) | $0 |
| Total | 135 (100.0%) | $19,063 |
Poverty in Fenton
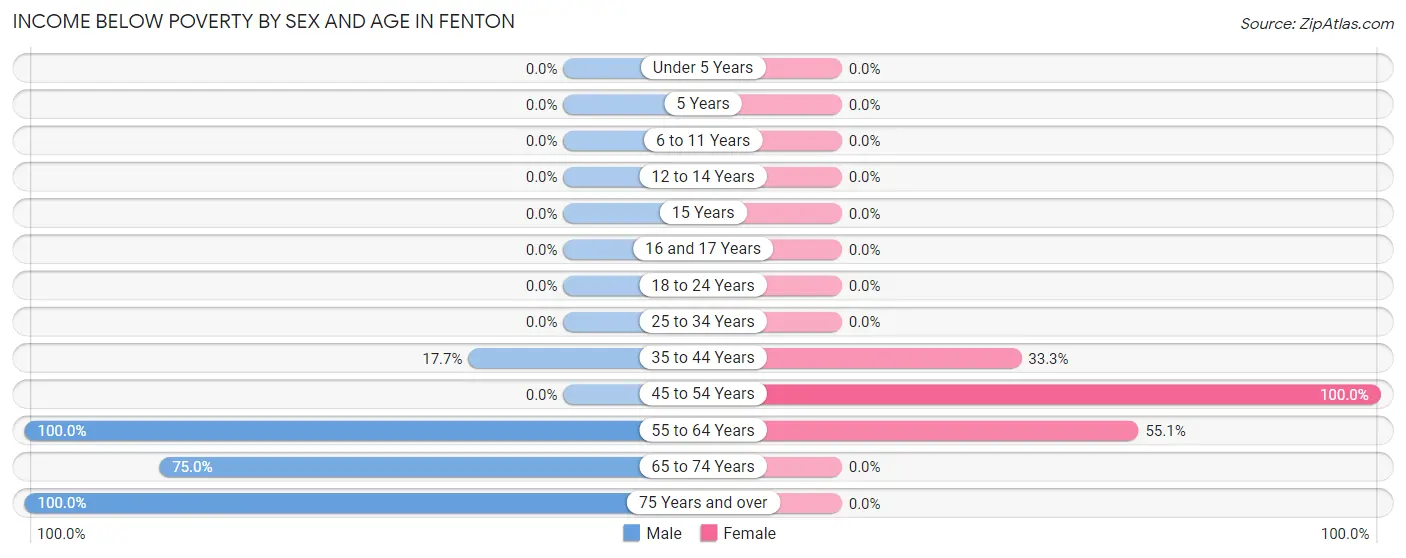
Income Below Poverty by Sex and Age in Fenton
With 39.0% poverty level for males and 36.6% for females among the residents of Fenton, 55 to 64 year old males and 45 to 54 year old females are the most vulnerable to poverty, with 5 males (100.0%) and 4 females (100.0%) in their respective age groups living below the poverty level.
| Age Bracket | Male | Female |
| Under 5 Years | 0 (0.0%) | 0 (0.0%) |
| 5 Years | 0 (0.0%) | 0 (0.0%) |
| 6 to 11 Years | 0 (0.0%) | 0 (0.0%) |
| 12 to 14 Years | 0 (0.0%) | 0 (0.0%) |
| 15 Years | 0 (0.0%) | 0 (0.0%) |
| 16 and 17 Years | 0 (0.0%) | 0 (0.0%) |
| 18 to 24 Years | 0 (0.0%) | 0 (0.0%) |
| 25 to 34 Years | 0 (0.0%) | 0 (0.0%) |
| 35 to 44 Years | 3 (17.6%) | 6 (33.3%) |
| 45 to 54 Years | 0 (0.0%) | 4 (100.0%) |
| 55 to 64 Years | 5 (100.0%) | 38 (55.1%) |
| 65 to 74 Years | 18 (75.0%) | 0 (0.0%) |
| 75 Years and over | 6 (100.0%) | 0 (0.0%) |
| Total | 32 (39.0%) | 48 (36.6%) |
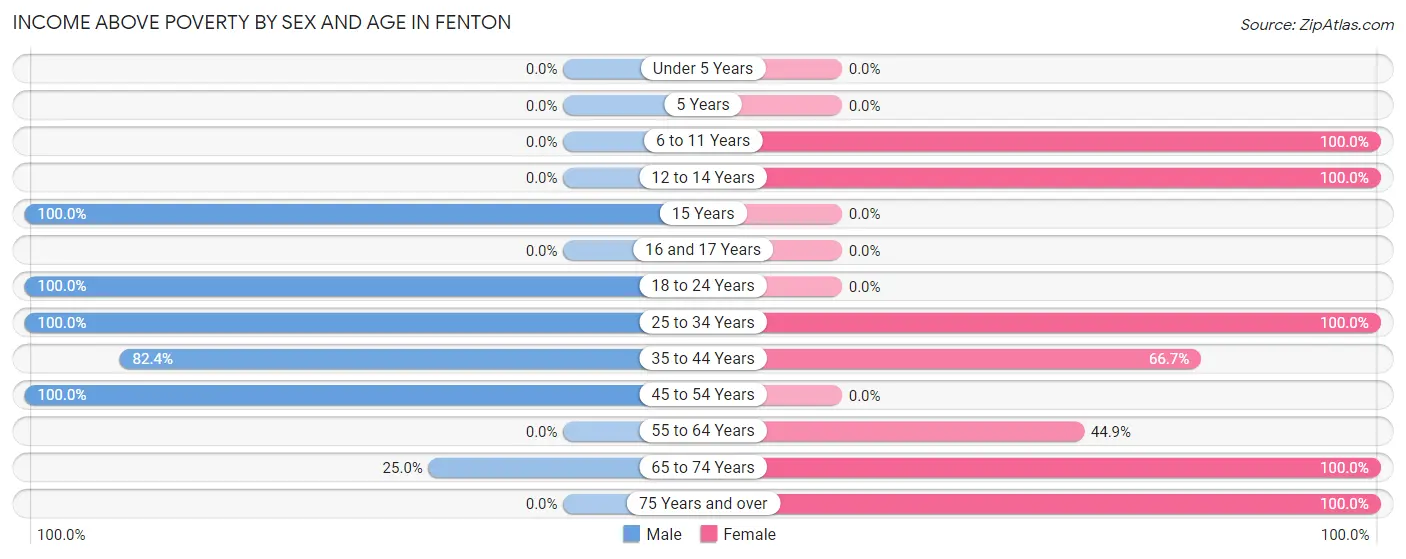
Income Above Poverty by Sex and Age in Fenton
According to the poverty statistics in Fenton, males aged 15 years and females aged 6 to 11 years are the age groups that are most secure financially, with 100.0% of males and 100.0% of females in these age groups living above the poverty line.
| Age Bracket | Male | Female |
| Under 5 Years | 0 (0.0%) | 0 (0.0%) |
| 5 Years | 0 (0.0%) | 0 (0.0%) |
| 6 to 11 Years | 0 (0.0%) | 10 (100.0%) |
| 12 to 14 Years | 0 (0.0%) | 3 (100.0%) |
| 15 Years | 7 (100.0%) | 0 (0.0%) |
| 16 and 17 Years | 0 (0.0%) | 0 (0.0%) |
| 18 to 24 Years | 12 (100.0%) | 0 (0.0%) |
| 25 to 34 Years | 5 (100.0%) | 5 (100.0%) |
| 35 to 44 Years | 14 (82.4%) | 12 (66.7%) |
| 45 to 54 Years | 6 (100.0%) | 0 (0.0%) |
| 55 to 64 Years | 0 (0.0%) | 31 (44.9%) |
| 65 to 74 Years | 6 (25.0%) | 6 (100.0%) |
| 75 Years and over | 0 (0.0%) | 16 (100.0%) |
| Total | 50 (61.0%) | 83 (63.4%) |
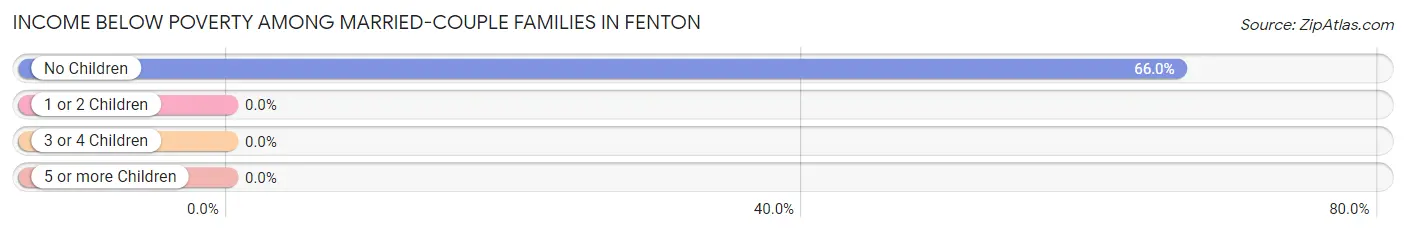
Income Below Poverty Among Married-Couple Families in Fenton
The poverty statistics for married-couple families in Fenton show that 58.3% or 35 of the total 60 families live below the poverty line. Families with no children have the highest poverty rate of 66.0%, comprising of 35 families. On the other hand, families with 1 or 2 children have the lowest poverty rate of 0.0%, which includes 0 families.
| Children | Above Poverty | Below Poverty |
| No Children | 18 (34.0%) | 35 (66.0%) |
| 1 or 2 Children | 7 (100.0%) | 0 (0.0%) |
| 3 or 4 Children | 0 (0.0%) | 0 (0.0%) |
| 5 or more Children | 0 (0.0%) | 0 (0.0%) |
| Total | 25 (41.7%) | 35 (58.3%) |
Income Below Poverty Among Single-Parent Households in Fenton
| Children | Single Father | Single Mother |
| No Children | 0 (0.0%) | 0 (0.0%) |
| 1 or 2 Children | 0 (0.0%) | 0 (0.0%) |
| 3 or 4 Children | 0 (0.0%) | 0 (0.0%) |
| 5 or more Children | 0 (0.0%) | 0 (0.0%) |
| Total | 0 (0.0%) | 0 (0.0%) |
Income Below Poverty Among Married-Couple vs Single-Parent Households in Fenton
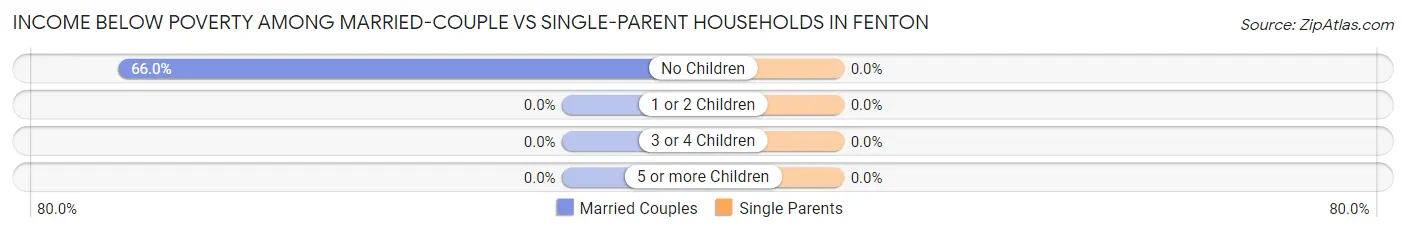
| Children | Married-Couple Families | Single-Parent Households |
| No Children | 35 (66.0%) | 0 (0.0%) |
| 1 or 2 Children | 0 (0.0%) | 0 (0.0%) |
| 3 or 4 Children | 0 (0.0%) | 0 (0.0%) |
| 5 or more Children | 0 (0.0%) | 0 (0.0%) |
| Total | 35 (58.3%) | 0 (0.0%) |
Race in Fenton
The most populous races in Fenton are White / Caucasian (103 | 48.4%), Black / African American (101 | 47.4%), and Two or more Races (7 | 3.3%).
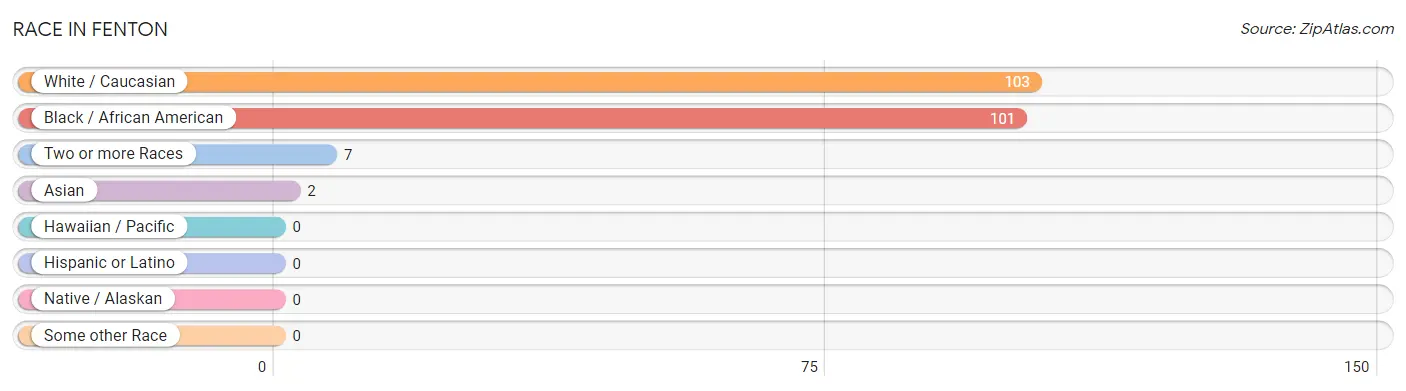
| Race | # Population | % Population |
| Asian | 2 | 0.9% |
| Black / African American | 101 | 47.4% |
| Hawaiian / Pacific | 0 | 0.0% |
| Hispanic or Latino | 0 | 0.0% |
| Native / Alaskan | 0 | 0.0% |
| White / Caucasian | 103 | 48.4% |
| Two or more Races | 7 | 3.3% |
| Some other Race | 0 | 0.0% |
| Total | 213 | 100.0% |
Ancestry in Fenton
The most populous ancestries reported in Fenton are American (66 | 31.0%), English (12 | 5.6%), French (8 | 3.8%), French Canadian (6 | 2.8%), and African (5 | 2.4%), together accounting for 45.6% of all Fenton residents.
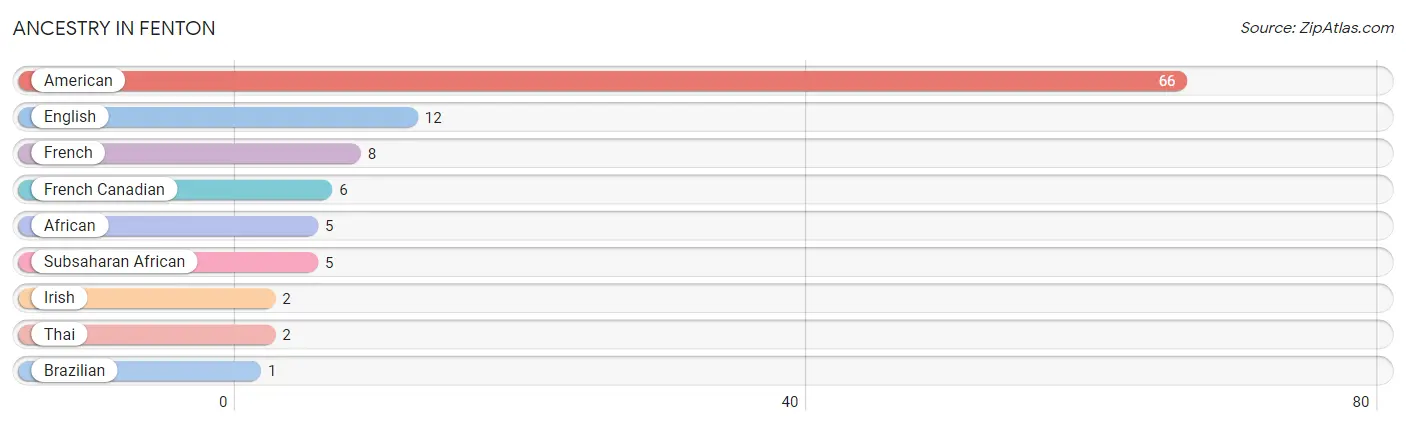
| Ancestry | # Population | % Population |
| African | 5 | 2.4% |
| American | 66 | 31.0% |
| Brazilian | 1 | 0.5% |
| English | 12 | 5.6% |
| French | 8 | 3.8% |
| French Canadian | 6 | 2.8% |
| Irish | 2 | 0.9% |
| Subsaharan African | 5 | 2.4% |
| Thai | 2 | 0.9% | View All 9 Rows |
Immigrants in Fenton
The most numerous immigrant groups reported in Fenton came from Asia (2 | 0.9%), India (2 | 0.9%), South Central Asia (2 | 0.9%), Brazil (1 | 0.5%), and Latin America (1 | 0.5%), together accounting for 3.8% of all Fenton residents.
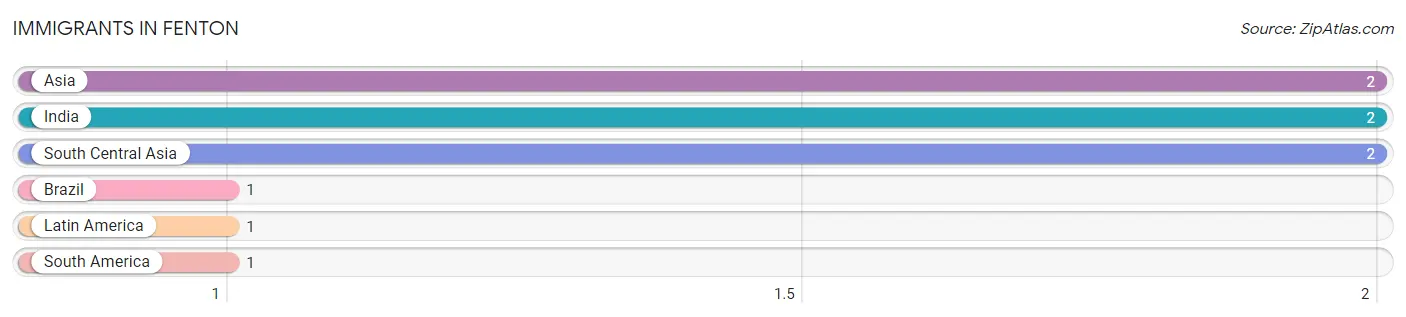
| Immigration Origin | # Population | % Population |
| Asia | 2 | 0.9% |
| Brazil | 1 | 0.5% |
| India | 2 | 0.9% |
| Latin America | 1 | 0.5% |
| South America | 1 | 0.5% |
| South Central Asia | 2 | 0.9% | View All 6 Rows |
Sex and Age in Fenton
Sex and Age in Fenton
The most populous age groups in Fenton are 65 to 69 Years (18 | 22.0%) for men and 60 to 64 Years (48 | 36.6%) for women.
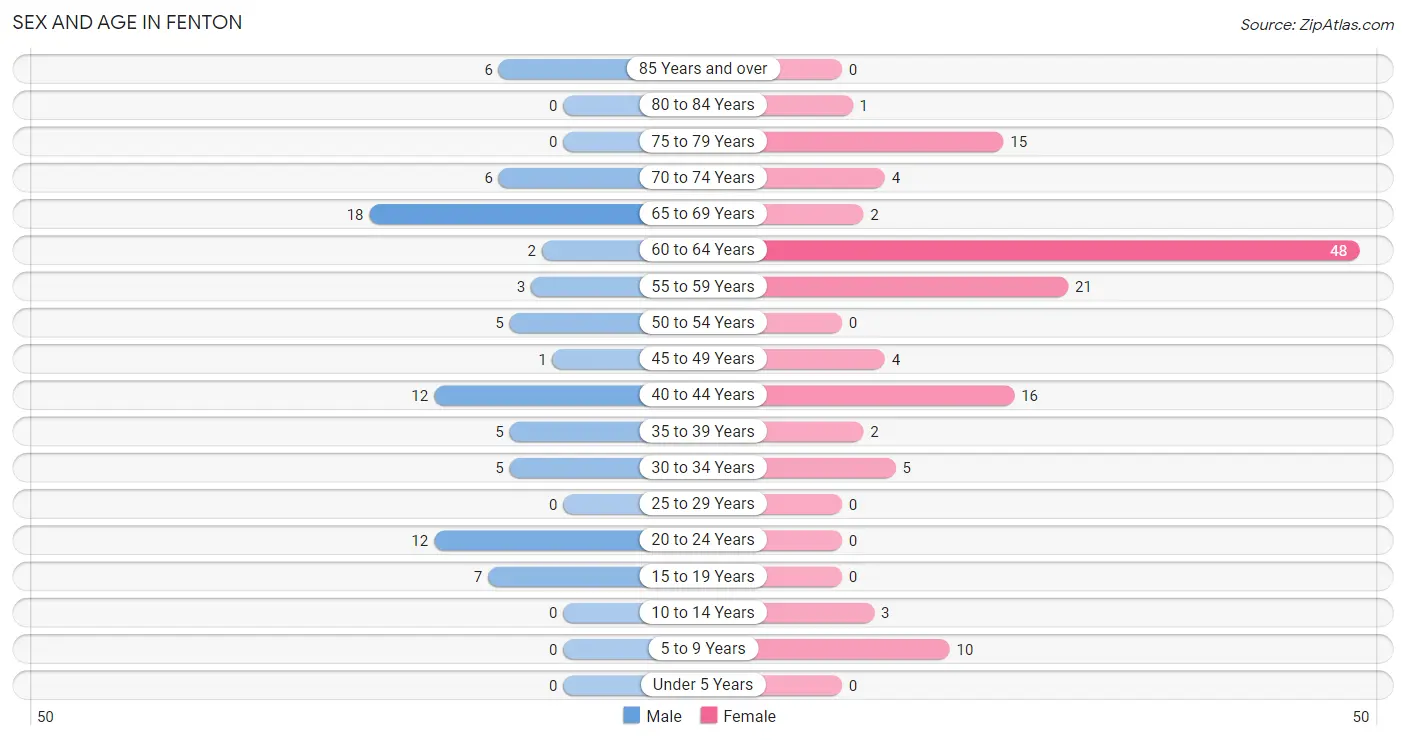
| Age Bracket | Male | Female |
| Under 5 Years | 0 (0.0%) | 0 (0.0%) |
| 5 to 9 Years | 0 (0.0%) | 10 (7.6%) |
| 10 to 14 Years | 0 (0.0%) | 3 (2.3%) |
| 15 to 19 Years | 7 (8.5%) | 0 (0.0%) |
| 20 to 24 Years | 12 (14.6%) | 0 (0.0%) |
| 25 to 29 Years | 0 (0.0%) | 0 (0.0%) |
| 30 to 34 Years | 5 (6.1%) | 5 (3.8%) |
| 35 to 39 Years | 5 (6.1%) | 2 (1.5%) |
| 40 to 44 Years | 12 (14.6%) | 16 (12.2%) |
| 45 to 49 Years | 1 (1.2%) | 4 (3.0%) |
| 50 to 54 Years | 5 (6.1%) | 0 (0.0%) |
| 55 to 59 Years | 3 (3.7%) | 21 (16.0%) |
| 60 to 64 Years | 2 (2.4%) | 48 (36.6%) |
| 65 to 69 Years | 18 (22.0%) | 2 (1.5%) |
| 70 to 74 Years | 6 (7.3%) | 4 (3.0%) |
| 75 to 79 Years | 0 (0.0%) | 15 (11.5%) |
| 80 to 84 Years | 0 (0.0%) | 1 (0.8%) |
| 85 Years and over | 6 (7.3%) | 0 (0.0%) |
| Total | 82 (100.0%) | 131 (100.0%) |
Families and Households in Fenton
Median Family Size in Fenton
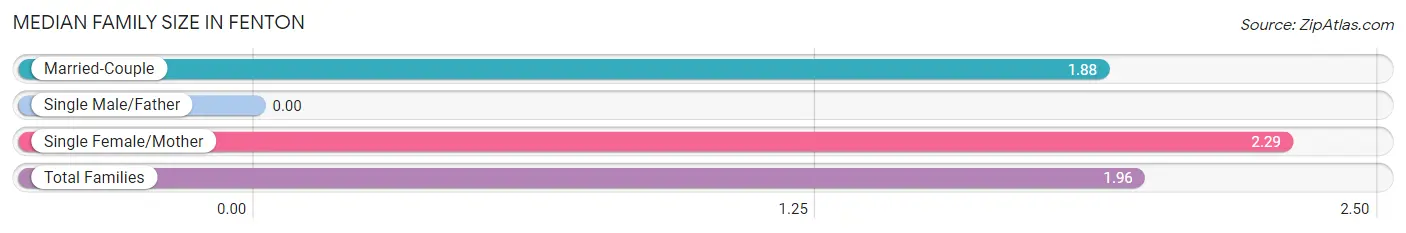
| Family Type | # Families | Family Size |
| Married-Couple | 60 (81.1%) | 1.88 |
| Single Male/Father | 0 (0.0%) | - |
| Single Female/Mother | 14 (18.9%) | 2.29 |
| Total Families | 74 (100.0%) | 1.96 |
Median Household Size in Fenton
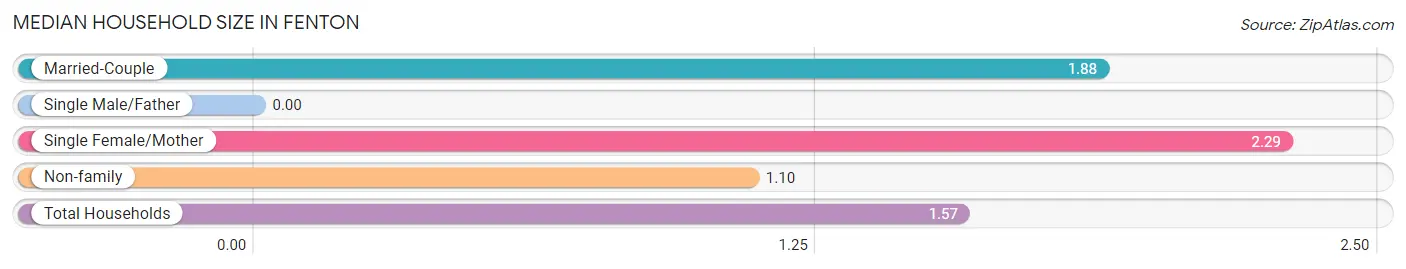
| Household Type | # Households | Household Size |
| Married-Couple | 60 (44.4%) | 1.88 |
| Single Male/Father | 0 (0.0%) | - |
| Single Female/Mother | 14 (10.4%) | 2.29 |
| Non-family | 61 (45.2%) | 1.10 |
| Total Households | 135 (100.0%) | 1.57 |
Household Size by Marriage Status in Fenton
Out of a total of 135 households in Fenton, 74 (54.8%) are family households, while 61 (45.2%) are nonfamily households. The most numerous type of family households are 2-person households, comprising 56, and the most common type of nonfamily households are 1-person households, comprising 57.
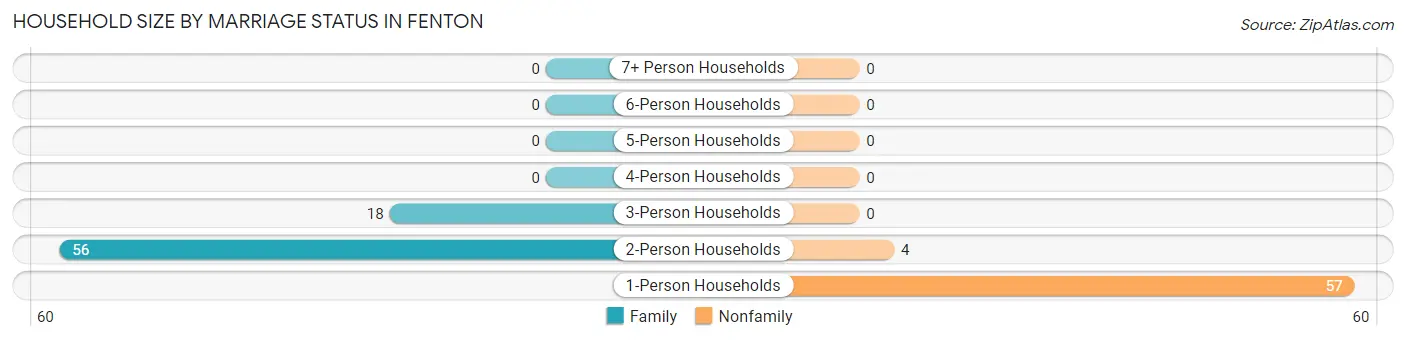
| Household Size | Family Households | Nonfamily Households |
| 1-Person Households | - | 57 (42.2%) |
| 2-Person Households | 56 (41.5%) | 4 (3.0%) |
| 3-Person Households | 18 (13.3%) | 0 (0.0%) |
| 4-Person Households | 0 (0.0%) | 0 (0.0%) |
| 5-Person Households | 0 (0.0%) | 0 (0.0%) |
| 6-Person Households | 0 (0.0%) | 0 (0.0%) |
| 7+ Person Households | 0 (0.0%) | 0 (0.0%) |
| Total | 74 (54.8%) | 61 (45.2%) |
Female Fertility in Fenton
Fertility by Age in Fenton
| Age Bracket | Women with Births | Births / 1,000 Women |
| 15 to 19 years | 0 (0.0%) | 0.0 |
| 20 to 34 years | 0 (0.0%) | 0.0 |
| 35 to 50 years | 0 (0.0%) | 0.0 |
| Total | 0 (0.0%) | 0.0 |
Fertility by Age by Marriage Status in Fenton
| Age Bracket | Married | Unmarried |
| 15 to 19 years | 0 (0.0%) | 0 (0.0%) |
| 20 to 34 years | 0 (0.0%) | 0 (0.0%) |
| 35 to 50 years | 0 (0.0%) | 0 (0.0%) |
| Total | 0 (0.0%) | 0 (0.0%) |
Fertility by Education in Fenton
| Educational Attainment | Women with Births | Births / 1,000 Women |
| Less than High School | 0 (0.0%) | 0.0 |
| High School Diploma | 0 (0.0%) | 0.0 |
| College or Associate's Degree | 0 (0.0%) | 0.0 |
| Bachelor's Degree | 0 (0.0%) | 0.0 |
| Graduate Degree | 0 (0.0%) | 0.0 |
| Total | 0 (0.0%) | 0.0 |
Fertility by Education by Marriage Status in Fenton
| Educational Attainment | Married | Unmarried |
| Less than High School | 0 (0.0%) | 0 (0.0%) |
| High School Diploma | 0 (0.0%) | 0 (0.0%) |
| College or Associate's Degree | 0 (0.0%) | 0 (0.0%) |
| Bachelor's Degree | 0 (0.0%) | 0 (0.0%) |
| Graduate Degree | 0 (0.0%) | 0 (0.0%) |
| Total | 0 (0.0%) | 0 (0.0%) |
Employment Characteristics in Fenton
Employment by Class of Employer in Fenton
Among the 108 employed individuals in Fenton, private company employees (85 | 78.7%), local government employees (9 | 8.3%), and self-employed (not incorporated) (8 | 7.4%) make up the most common classes of employment.
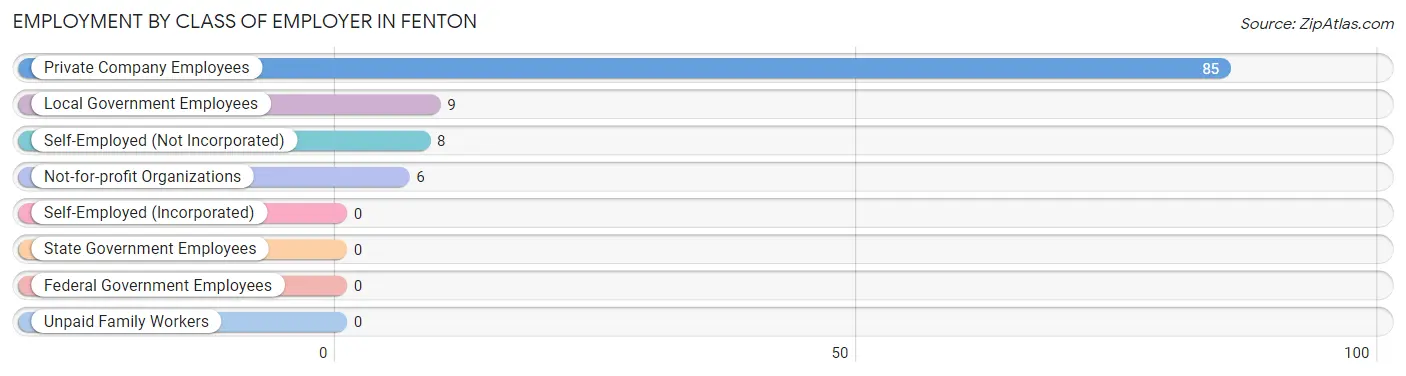
| Employer Class | # Employees | % Employees |
| Private Company Employees | 85 | 78.7% |
| Self-Employed (Incorporated) | 0 | 0.0% |
| Self-Employed (Not Incorporated) | 8 | 7.4% |
| Not-for-profit Organizations | 6 | 5.6% |
| Local Government Employees | 9 | 8.3% |
| State Government Employees | 0 | 0.0% |
| Federal Government Employees | 0 | 0.0% |
| Unpaid Family Workers | 0 | 0.0% |
| Total | 108 | 100.0% |
Employment Status by Age in Fenton
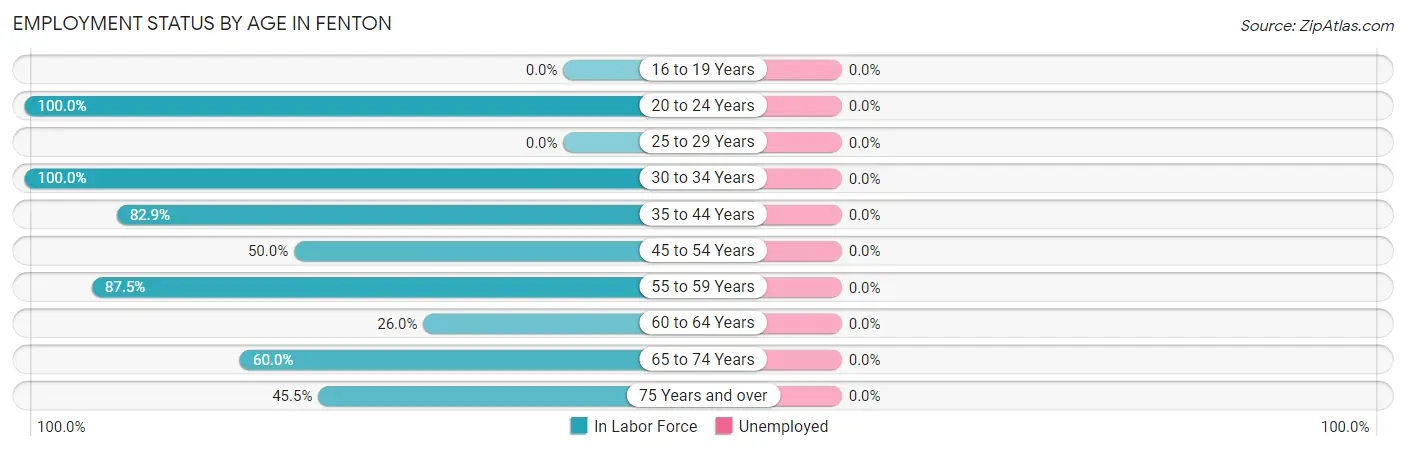
| Age Bracket | In Labor Force | Unemployed |
| 16 to 19 Years | 0 (0.0%) | 0 (0.0%) |
| 20 to 24 Years | 12 (100.0%) | 0 (0.0%) |
| 25 to 29 Years | 0 (0.0%) | 0 (0.0%) |
| 30 to 34 Years | 10 (100.0%) | 0 (0.0%) |
| 35 to 44 Years | 29 (82.9%) | 0 (0.0%) |
| 45 to 54 Years | 5 (50.0%) | 0 (0.0%) |
| 55 to 59 Years | 21 (87.5%) | 0 (0.0%) |
| 60 to 64 Years | 13 (26.0%) | 0 (0.0%) |
| 65 to 74 Years | 18 (60.0%) | 0 (0.0%) |
| 75 Years and over | 10 (45.5%) | 0 (0.0%) |
| Total | 118 (61.1%) | 0 (0.0%) |
Employment Status by Educational Attainment in Fenton
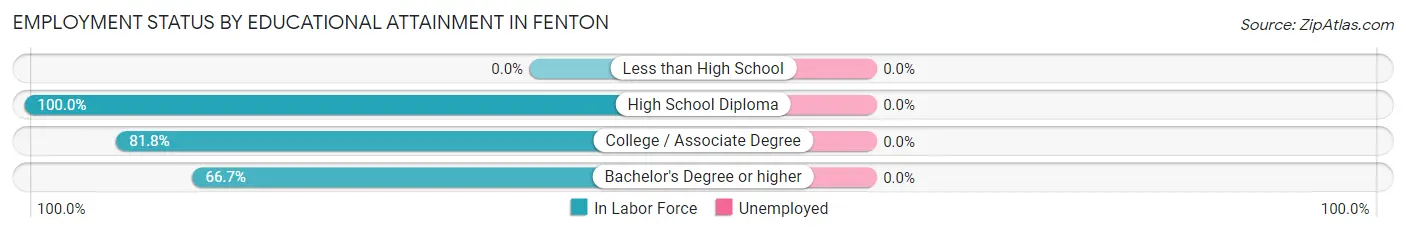
| Educational Attainment | In Labor Force | Unemployed |
| Less than High School | 0 (0.0%) | 0 (0.0%) |
| High School Diploma | 49 (100.0%) | 0 (0.0%) |
| College / Associate Degree | 27 (81.8%) | 0 (0.0%) |
| Bachelor's Degree or higher | 2 (66.7%) | 0 (0.0%) |
| Total | 78 (60.5%) | 0 (0.0%) |
Employment Occupations by Sex in Fenton
Management, Business, Science and Arts Occupations
The most common Management, Business, Science and Arts occupations in Fenton are Community & Social Service (10 | 8.5%), Education Instruction & Library (10 | 8.5%), and Health Diagnosing & Treating (2 | 1.7%).
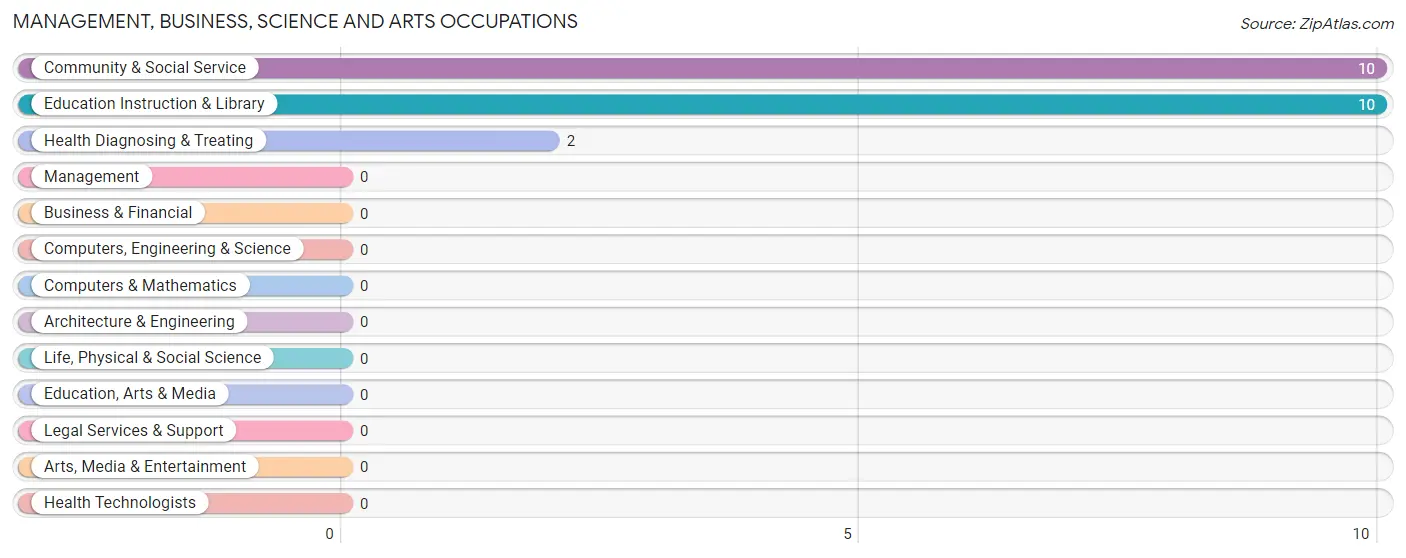
Management, Business, Science and Arts Occupations by Sex
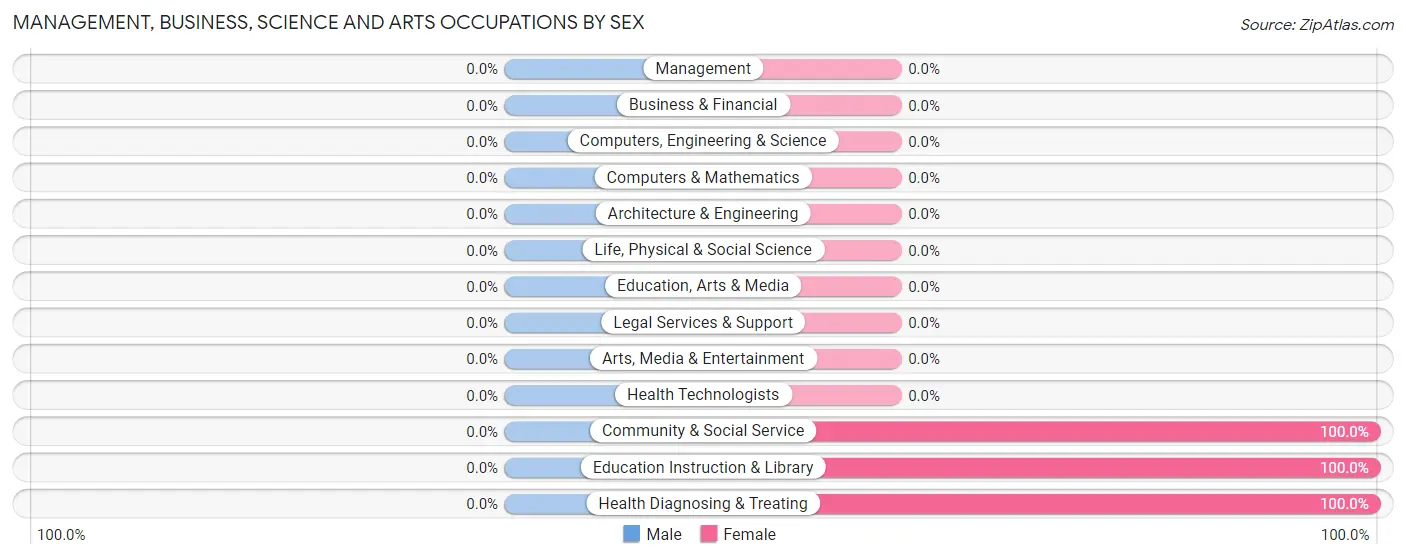
| Occupation | Male | Female |
| Management | 0 (0.0%) | 0 (0.0%) |
| Business & Financial | 0 (0.0%) | 0 (0.0%) |
| Computers, Engineering & Science | 0 (0.0%) | 0 (0.0%) |
| Computers & Mathematics | 0 (0.0%) | 0 (0.0%) |
| Architecture & Engineering | 0 (0.0%) | 0 (0.0%) |
| Life, Physical & Social Science | 0 (0.0%) | 0 (0.0%) |
| Community & Social Service | 0 (0.0%) | 10 (100.0%) |
| Education, Arts & Media | 0 (0.0%) | 0 (0.0%) |
| Legal Services & Support | 0 (0.0%) | 0 (0.0%) |
| Education Instruction & Library | 0 (0.0%) | 10 (100.0%) |
| Arts, Media & Entertainment | 0 (0.0%) | 0 (0.0%) |
| Health Diagnosing & Treating | 0 (0.0%) | 2 (100.0%) |
| Health Technologists | 0 (0.0%) | 0 (0.0%) |
| Total (Category) | 0 (0.0%) | 12 (100.0%) |
| Total (Overall) | 49 (41.5%) | 69 (58.5%) |
Services Occupations
The most common Services occupations in Fenton are Security & Protection (12 | 10.2%), Firefighting & Prevention (12 | 10.2%), Cleaning & Maintenance (12 | 10.2%), Healthcare Support (6 | 5.1%), and Food Preparation & Serving (4 | 3.4%).
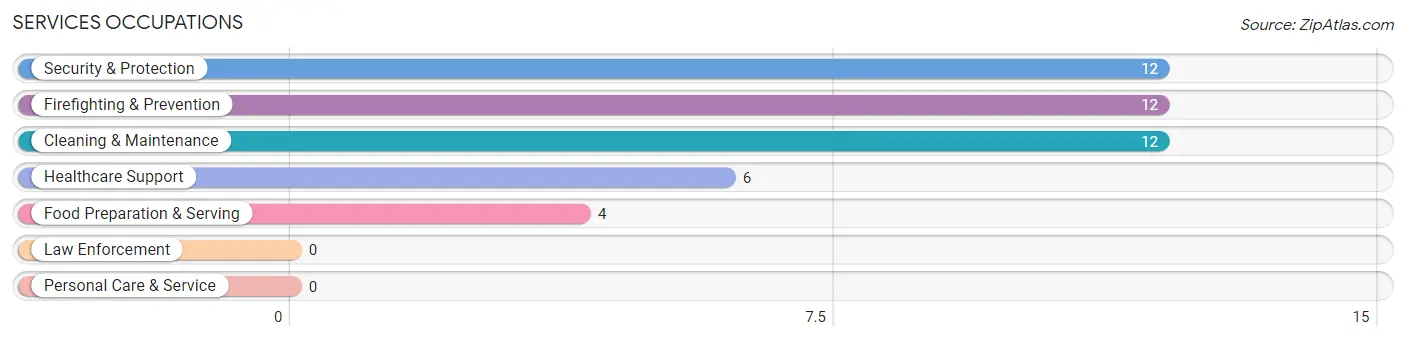
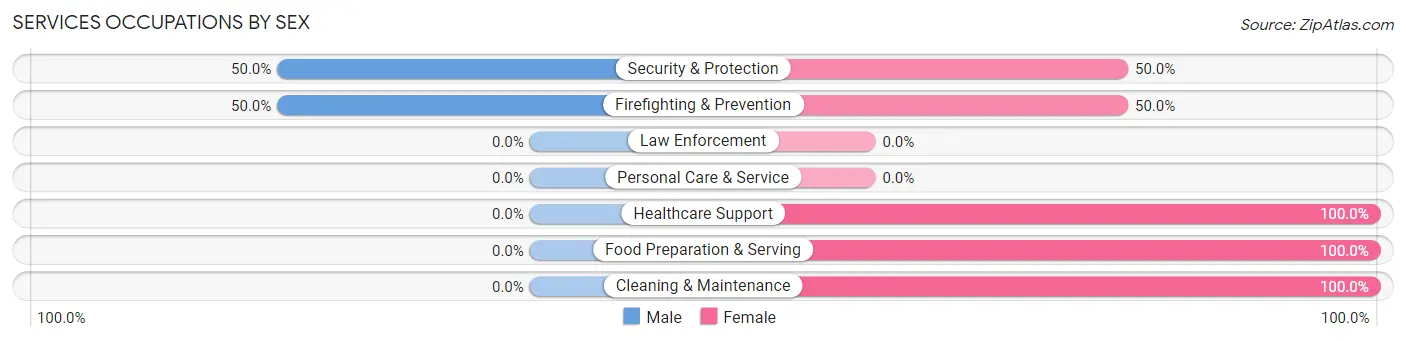
Services Occupations by Sex
Within the Services occupations in Fenton, the most male-oriented occupations are Security & Protection (50.0%), and Firefighting & Prevention (50.0%), while the most female-oriented occupations are Healthcare Support (100.0%), Food Preparation & Serving (100.0%), and Cleaning & Maintenance (100.0%).
| Occupation | Male | Female |
| Healthcare Support | 0 (0.0%) | 6 (100.0%) |
| Security & Protection | 6 (50.0%) | 6 (50.0%) |
| Firefighting & Prevention | 6 (50.0%) | 6 (50.0%) |
| Law Enforcement | 0 (0.0%) | 0 (0.0%) |
| Food Preparation & Serving | 0 (0.0%) | 4 (100.0%) |
| Cleaning & Maintenance | 0 (0.0%) | 12 (100.0%) |
| Personal Care & Service | 0 (0.0%) | 0 (0.0%) |
| Total (Category) | 6 (17.6%) | 28 (82.4%) |
| Total (Overall) | 49 (41.5%) | 69 (58.5%) |
Sales and Office Occupations
The most common Sales and Office occupations in Fenton are Office & Administration (12 | 10.2%), and Sales & Related (2 | 1.7%).
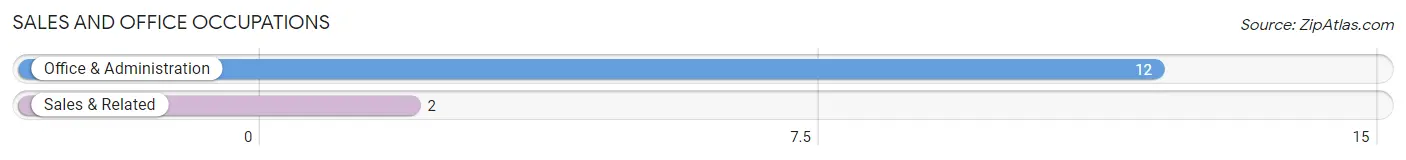
Sales and Office Occupations by Sex
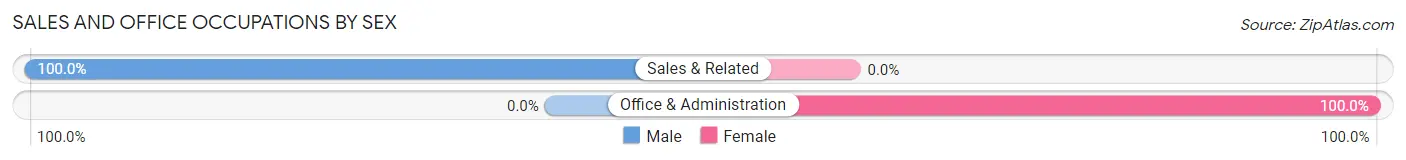
| Occupation | Male | Female |
| Sales & Related | 2 (100.0%) | 0 (0.0%) |
| Office & Administration | 0 (0.0%) | 12 (100.0%) |
| Total (Category) | 2 (14.3%) | 12 (85.7%) |
| Total (Overall) | 49 (41.5%) | 69 (58.5%) |
Natural Resources, Construction and Maintenance Occupations
The most common Natural Resources, Construction and Maintenance occupations in Fenton are Farming, Fishing & Forestry (22 | 18.6%), Installation, Maintenance & Repair (5 | 4.2%), and Construction & Extraction (3 | 2.5%).
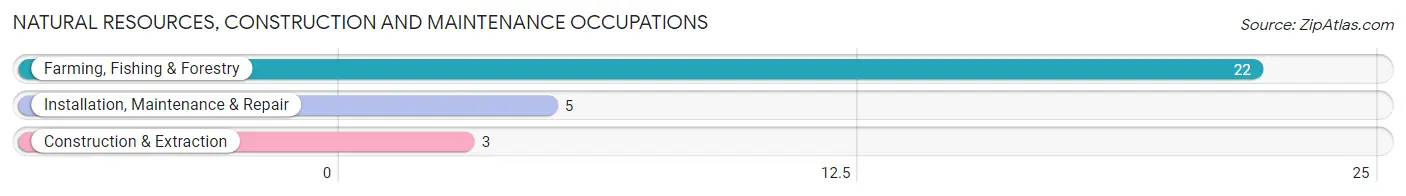
Natural Resources, Construction and Maintenance Occupations by Sex
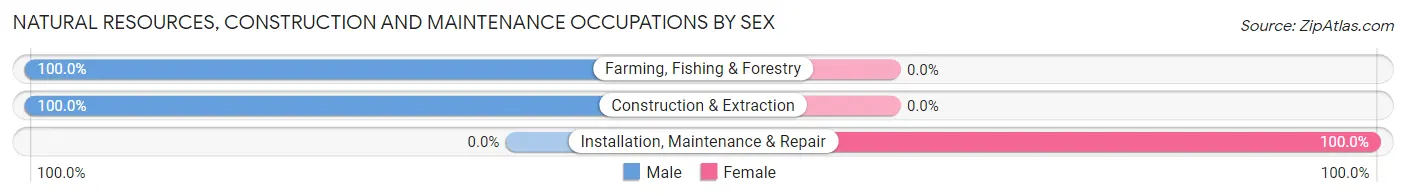
| Occupation | Male | Female |
| Farming, Fishing & Forestry | 22 (100.0%) | 0 (0.0%) |
| Construction & Extraction | 3 (100.0%) | 0 (0.0%) |
| Installation, Maintenance & Repair | 0 (0.0%) | 5 (100.0%) |
| Total (Category) | 25 (83.3%) | 5 (16.7%) |
| Total (Overall) | 49 (41.5%) | 69 (58.5%) |
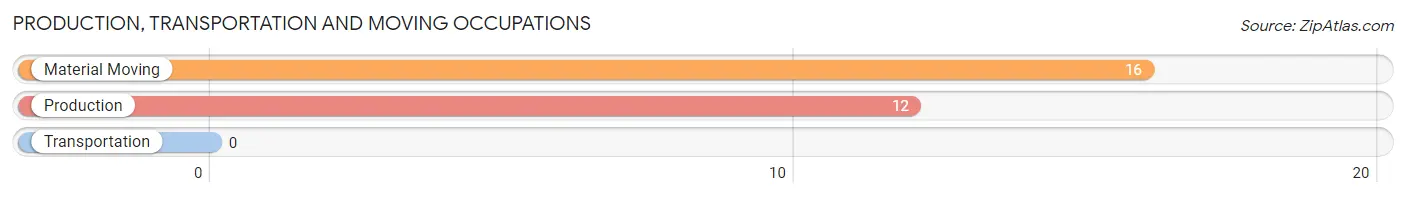
Production, Transportation and Moving Occupations
The most common Production, Transportation and Moving occupations in Fenton are Material Moving (16 | 13.6%), and Production (12 | 10.2%).
Production, Transportation and Moving Occupations by Sex
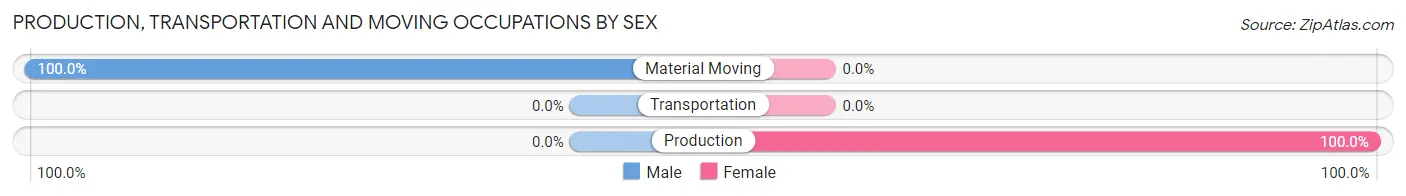
| Occupation | Male | Female |
| Production | 0 (0.0%) | 12 (100.0%) |
| Transportation | 0 (0.0%) | 0 (0.0%) |
| Material Moving | 16 (100.0%) | 0 (0.0%) |
| Total (Category) | 16 (57.1%) | 12 (42.9%) |
| Total (Overall) | 49 (41.5%) | 69 (58.5%) |
Employment Industries by Sex in Fenton
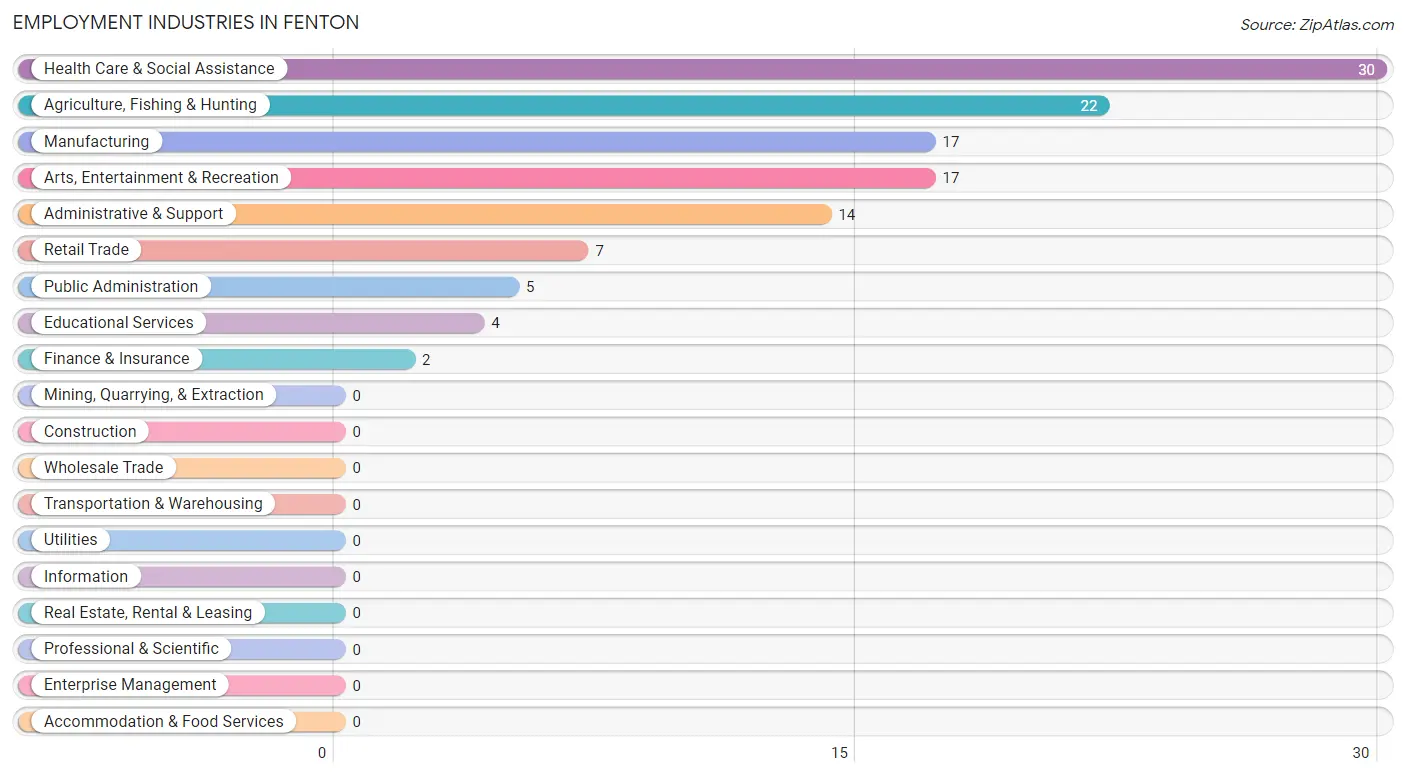
Employment Industries in Fenton
The major employment industries in Fenton include Health Care & Social Assistance (30 | 25.4%), Agriculture, Fishing & Hunting (22 | 18.6%), Manufacturing (17 | 14.4%), Arts, Entertainment & Recreation (17 | 14.4%), and Administrative & Support (14 | 11.9%).
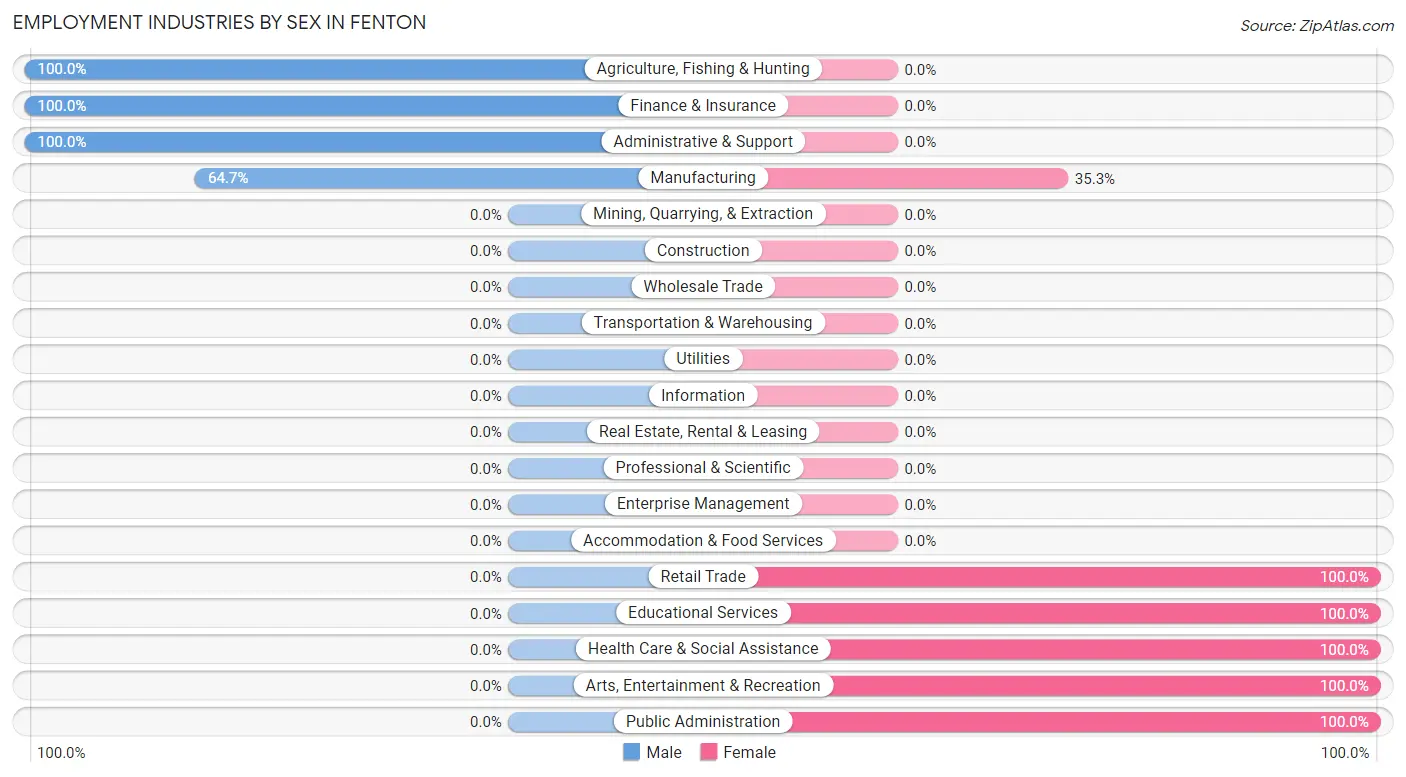
Employment Industries by Sex in Fenton
The Fenton industries that see more men than women are Agriculture, Fishing & Hunting (100.0%), Finance & Insurance (100.0%), and Administrative & Support (100.0%), whereas the industries that tend to have a higher number of women are Retail Trade (100.0%), Educational Services (100.0%), and Health Care & Social Assistance (100.0%).
| Industry | Male | Female |
| Agriculture, Fishing & Hunting | 22 (100.0%) | 0 (0.0%) |
| Mining, Quarrying, & Extraction | 0 (0.0%) | 0 (0.0%) |
| Construction | 0 (0.0%) | 0 (0.0%) |
| Manufacturing | 11 (64.7%) | 6 (35.3%) |
| Wholesale Trade | 0 (0.0%) | 0 (0.0%) |
| Retail Trade | 0 (0.0%) | 7 (100.0%) |
| Transportation & Warehousing | 0 (0.0%) | 0 (0.0%) |
| Utilities | 0 (0.0%) | 0 (0.0%) |
| Information | 0 (0.0%) | 0 (0.0%) |
| Finance & Insurance | 2 (100.0%) | 0 (0.0%) |
| Real Estate, Rental & Leasing | 0 (0.0%) | 0 (0.0%) |
| Professional & Scientific | 0 (0.0%) | 0 (0.0%) |
| Enterprise Management | 0 (0.0%) | 0 (0.0%) |
| Administrative & Support | 14 (100.0%) | 0 (0.0%) |
| Educational Services | 0 (0.0%) | 4 (100.0%) |
| Health Care & Social Assistance | 0 (0.0%) | 30 (100.0%) |
| Arts, Entertainment & Recreation | 0 (0.0%) | 17 (100.0%) |
| Accommodation & Food Services | 0 (0.0%) | 0 (0.0%) |
| Public Administration | 0 (0.0%) | 5 (100.0%) |
| Total | 49 (41.5%) | 69 (58.5%) |
Education in Fenton
School Enrollment in Fenton
The most common levels of schooling among the 24 students in Fenton are elementary school (10 | 41.7%), high school (7 | 29.2%), and college / undergraduate (4 | 16.7%).
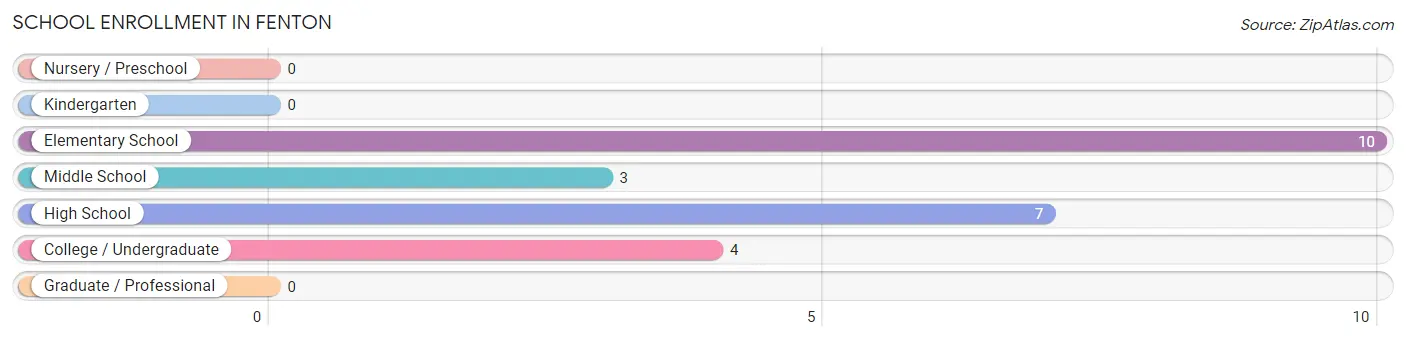
| School Level | # Students | % Students |
| Nursery / Preschool | 0 | 0.0% |
| Kindergarten | 0 | 0.0% |
| Elementary School | 10 | 41.7% |
| Middle School | 3 | 12.5% |
| High School | 7 | 29.2% |
| College / Undergraduate | 4 | 16.7% |
| Graduate / Professional | 0 | 0.0% |
| Total | 24 | 100.0% |
School Enrollment by Age by Funding Source in Fenton
Out of a total of 24 students who are enrolled in schools in Fenton, 4 (16.7%) attend a private institution, while the remaining 20 (83.3%) are enrolled in public schools. The age group of 35 years and over has the highest likelihood of being enrolled in private schools, with 4 (100.0% in the age bracket) enrolled. Conversely, the age group of 5 to 9 year old has the lowest likelihood of being enrolled in a private school, with 10 (100.0% in the age bracket) attending a public institution.
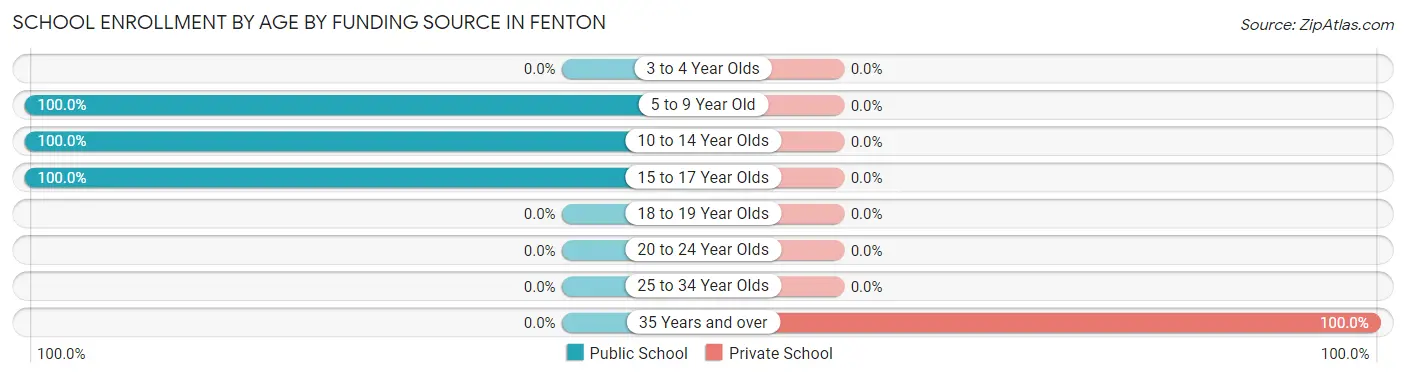
| Age Bracket | Public School | Private School |
| 3 to 4 Year Olds | 0 (0.0%) | 0 (0.0%) |
| 5 to 9 Year Old | 10 (100.0%) | 0 (0.0%) |
| 10 to 14 Year Olds | 3 (100.0%) | 0 (0.0%) |
| 15 to 17 Year Olds | 7 (100.0%) | 0 (0.0%) |
| 18 to 19 Year Olds | 0 (0.0%) | 0 (0.0%) |
| 20 to 24 Year Olds | 0 (0.0%) | 0 (0.0%) |
| 25 to 34 Year Olds | 0 (0.0%) | 0 (0.0%) |
| 35 Years and over | 0 (0.0%) | 4 (100.0%) |
| Total | 20 (83.3%) | 4 (16.7%) |
Educational Attainment by Field of Study in Fenton
Social sciences (12 | 80.0%), engineering (2 | 13.3%), and science & technology (1 | 6.7%) are the most common fields of study among 15 individuals in Fenton who have obtained a bachelor's degree or higher.
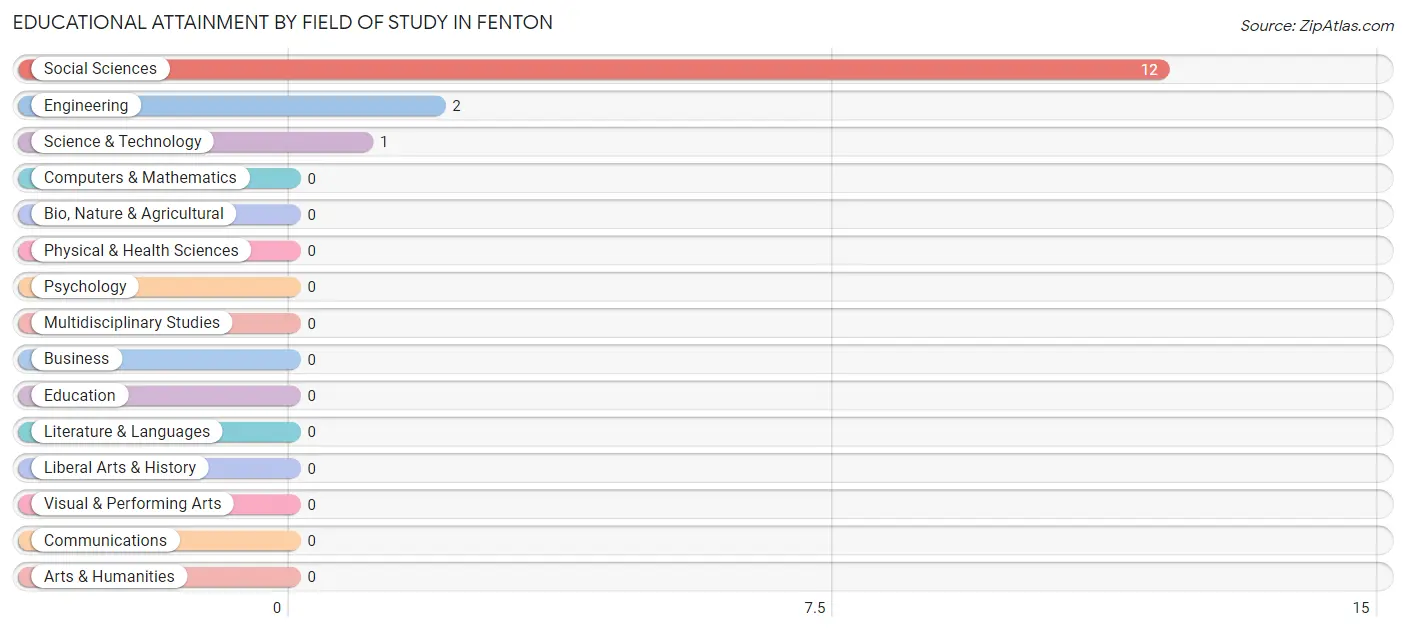
| Field of Study | # Graduates | % Graduates |
| Computers & Mathematics | 0 | 0.0% |
| Bio, Nature & Agricultural | 0 | 0.0% |
| Physical & Health Sciences | 0 | 0.0% |
| Psychology | 0 | 0.0% |
| Social Sciences | 12 | 80.0% |
| Engineering | 2 | 13.3% |
| Multidisciplinary Studies | 0 | 0.0% |
| Science & Technology | 1 | 6.7% |
| Business | 0 | 0.0% |
| Education | 0 | 0.0% |
| Literature & Languages | 0 | 0.0% |
| Liberal Arts & History | 0 | 0.0% |
| Visual & Performing Arts | 0 | 0.0% |
| Communications | 0 | 0.0% |
| Arts & Humanities | 0 | 0.0% |
| Total | 15 | 100.0% |
Transportation & Commute in Fenton
Vehicle Availability by Sex in Fenton
The most prevalent vehicle ownership categories in Fenton are males with 2 vehicles (47, accounting for 95.9%) and females with 2 vehicles (25, making up 79.7%).
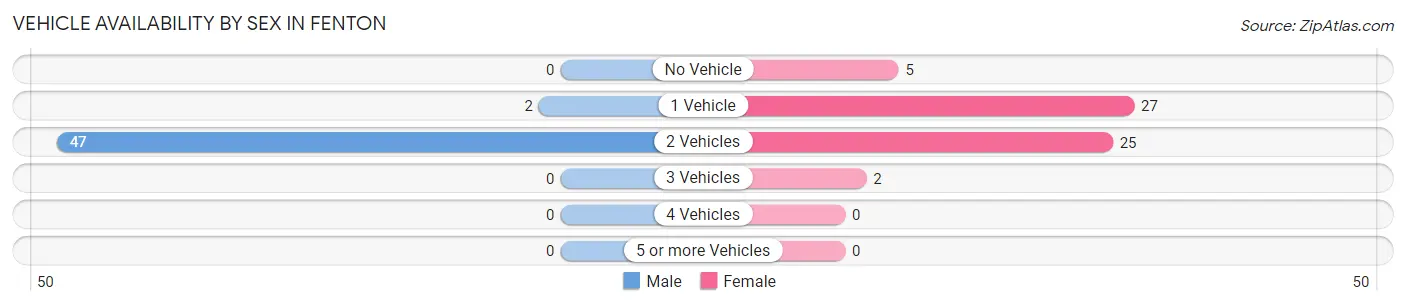
| Vehicles Available | Male | Female |
| No Vehicle | 0 (0.0%) | 5 (8.5%) |
| 1 Vehicle | 2 (4.1%) | 27 (45.8%) |
| 2 Vehicles | 47 (95.9%) | 25 (42.4%) |
| 3 Vehicles | 0 (0.0%) | 2 (3.4%) |
| 4 Vehicles | 0 (0.0%) | 0 (0.0%) |
| 5 or more Vehicles | 0 (0.0%) | 0 (0.0%) |
| Total | 49 (100.0%) | 59 (100.0%) |
Commute Time in Fenton
The most frequently occuring commute durations in Fenton are 15 to 19 minutes (27 commuters, 25.0%), 30 to 34 minutes (26 commuters, 24.1%), and 5 to 9 minutes (22 commuters, 20.4%).
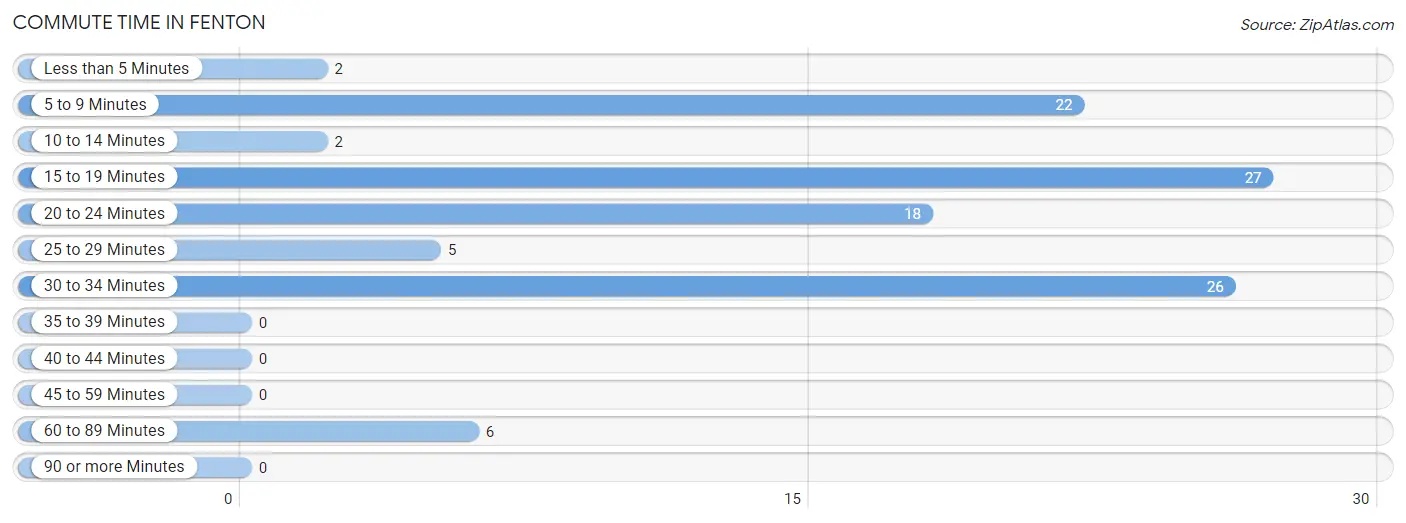
| Commute Time | # Commuters | % Commuters |
| Less than 5 Minutes | 2 | 1.8% |
| 5 to 9 Minutes | 22 | 20.4% |
| 10 to 14 Minutes | 2 | 1.8% |
| 15 to 19 Minutes | 27 | 25.0% |
| 20 to 24 Minutes | 18 | 16.7% |
| 25 to 29 Minutes | 5 | 4.6% |
| 30 to 34 Minutes | 26 | 24.1% |
| 35 to 39 Minutes | 0 | 0.0% |
| 40 to 44 Minutes | 0 | 0.0% |
| 45 to 59 Minutes | 0 | 0.0% |
| 60 to 89 Minutes | 6 | 5.6% |
| 90 or more Minutes | 0 | 0.0% |
Commute Time by Sex in Fenton
The most common commute times in Fenton are 5 to 9 minutes (22 commuters, 44.9%) for males and 30 to 34 minutes (20 commuters, 33.9%) for females.
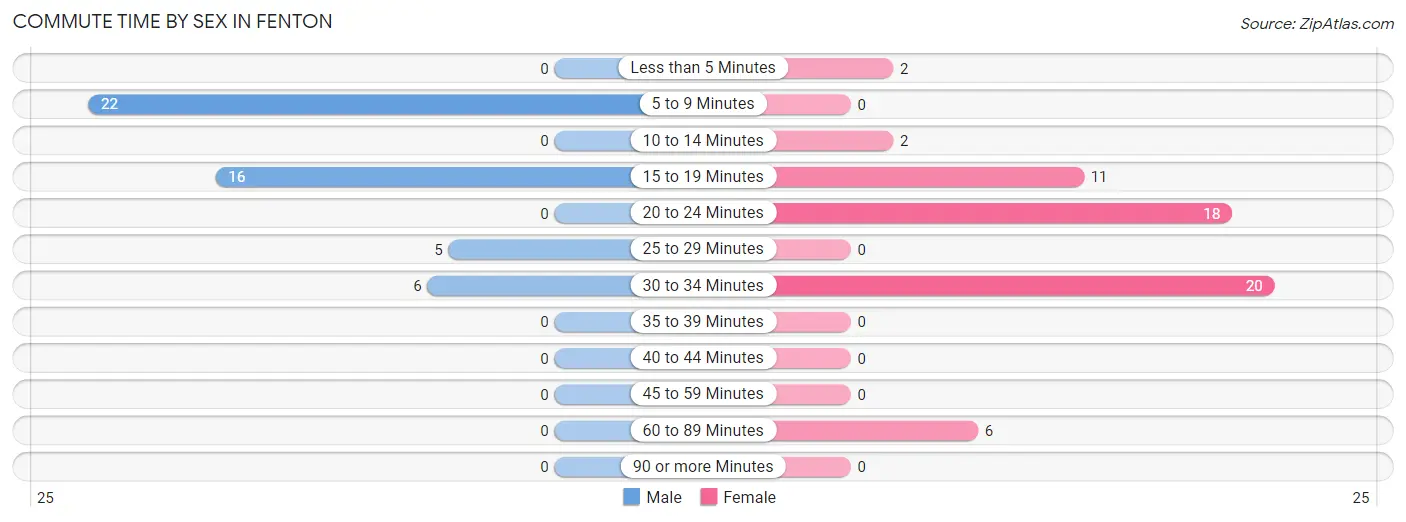
| Commute Time | Male | Female |
| Less than 5 Minutes | 0 (0.0%) | 2 (3.4%) |
| 5 to 9 Minutes | 22 (44.9%) | 0 (0.0%) |
| 10 to 14 Minutes | 0 (0.0%) | 2 (3.4%) |
| 15 to 19 Minutes | 16 (32.7%) | 11 (18.6%) |
| 20 to 24 Minutes | 0 (0.0%) | 18 (30.5%) |
| 25 to 29 Minutes | 5 (10.2%) | 0 (0.0%) |
| 30 to 34 Minutes | 6 (12.2%) | 20 (33.9%) |
| 35 to 39 Minutes | 0 (0.0%) | 0 (0.0%) |
| 40 to 44 Minutes | 0 (0.0%) | 0 (0.0%) |
| 45 to 59 Minutes | 0 (0.0%) | 0 (0.0%) |
| 60 to 89 Minutes | 0 (0.0%) | 6 (10.2%) |
| 90 or more Minutes | 0 (0.0%) | 0 (0.0%) |
Time of Departure to Work by Sex in Fenton
The most frequent times of departure to work in Fenton are 7:00 AM to 7:29 AM (18, 36.7%) for males and 9:00 AM to 9:59 AM (12, 20.3%) for females.
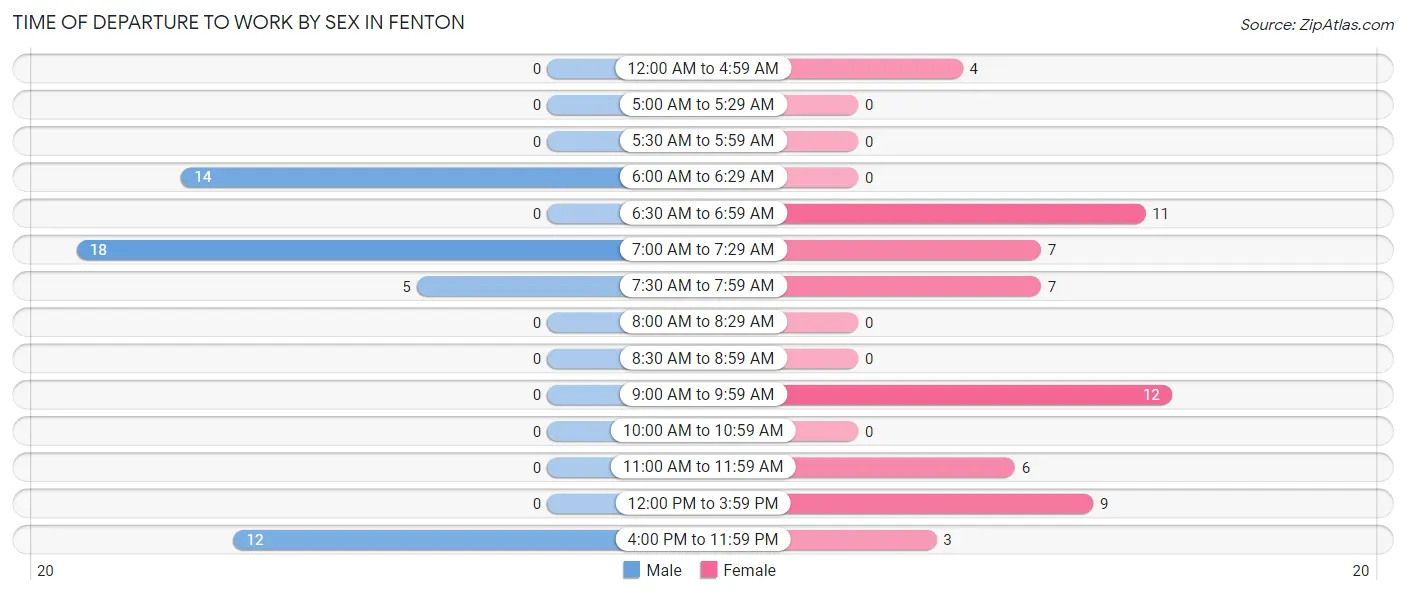
| Time of Departure | Male | Female |
| 12:00 AM to 4:59 AM | 0 (0.0%) | 4 (6.8%) |
| 5:00 AM to 5:29 AM | 0 (0.0%) | 0 (0.0%) |
| 5:30 AM to 5:59 AM | 0 (0.0%) | 0 (0.0%) |
| 6:00 AM to 6:29 AM | 14 (28.6%) | 0 (0.0%) |
| 6:30 AM to 6:59 AM | 0 (0.0%) | 11 (18.6%) |
| 7:00 AM to 7:29 AM | 18 (36.7%) | 7 (11.9%) |
| 7:30 AM to 7:59 AM | 5 (10.2%) | 7 (11.9%) |
| 8:00 AM to 8:29 AM | 0 (0.0%) | 0 (0.0%) |
| 8:30 AM to 8:59 AM | 0 (0.0%) | 0 (0.0%) |
| 9:00 AM to 9:59 AM | 0 (0.0%) | 12 (20.3%) |
| 10:00 AM to 10:59 AM | 0 (0.0%) | 0 (0.0%) |
| 11:00 AM to 11:59 AM | 0 (0.0%) | 6 (10.2%) |
| 12:00 PM to 3:59 PM | 0 (0.0%) | 9 (15.2%) |
| 4:00 PM to 11:59 PM | 12 (24.5%) | 3 (5.1%) |
| Total | 49 (100.0%) | 59 (100.0%) |
Housing Occupancy in Fenton
Occupancy by Ownership in Fenton
Of the total 135 dwellings in Fenton, owner-occupied units account for 100 (74.1%), while renter-occupied units make up 35 (25.9%).
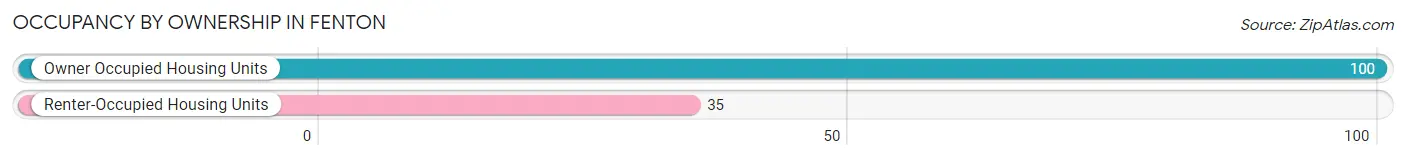
| Occupancy | # Housing Units | % Housing Units |
| Owner Occupied Housing Units | 100 | 74.1% |
| Renter-Occupied Housing Units | 35 | 25.9% |
| Total Occupied Housing Units | 135 | 100.0% |
Occupancy by Household Size in Fenton
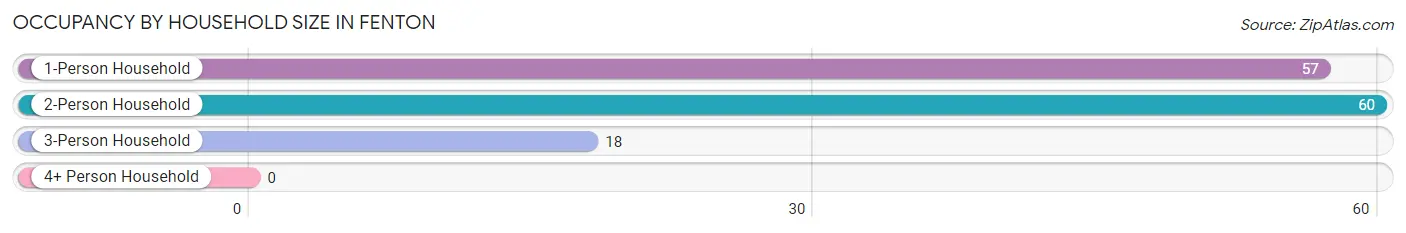
| Household Size | # Housing Units | % Housing Units |
| 1-Person Household | 57 | 42.2% |
| 2-Person Household | 60 | 44.4% |
| 3-Person Household | 18 | 13.3% |
| 4+ Person Household | 0 | 0.0% |
| Total Housing Units | 135 | 100.0% |
Occupancy by Ownership by Household Size in Fenton
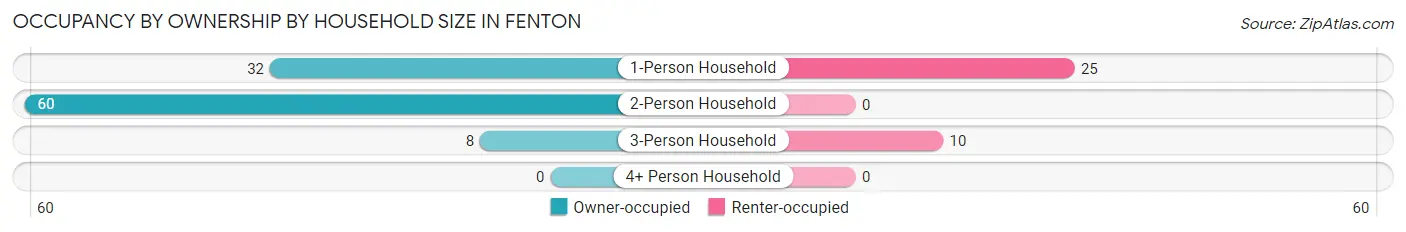
| Household Size | Owner-occupied | Renter-occupied |
| 1-Person Household | 32 (56.1%) | 25 (43.9%) |
| 2-Person Household | 60 (100.0%) | 0 (0.0%) |
| 3-Person Household | 8 (44.4%) | 10 (55.6%) |
| 4+ Person Household | 0 (0.0%) | 0 (0.0%) |
| Total Housing Units | 100 (74.1%) | 35 (25.9%) |
Occupancy by Educational Attainment in Fenton
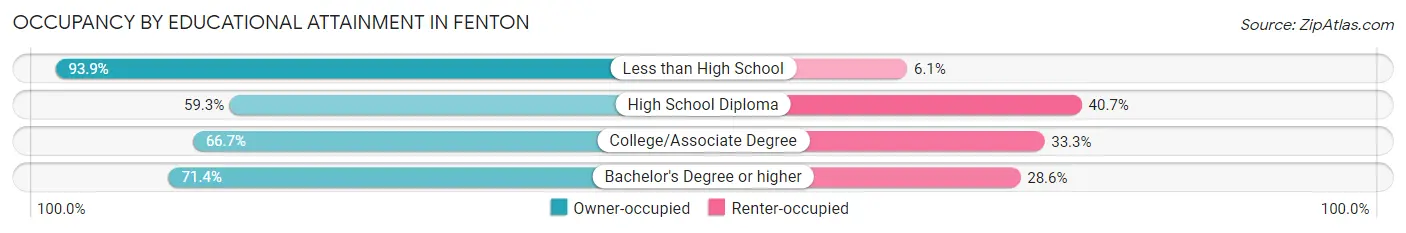
| Household Size | Owner-occupied | Renter-occupied |
| Less than High School | 46 (93.9%) | 3 (6.1%) |
| High School Diploma | 32 (59.3%) | 22 (40.7%) |
| College/Associate Degree | 12 (66.7%) | 6 (33.3%) |
| Bachelor's Degree or higher | 10 (71.4%) | 4 (28.6%) |
Occupancy by Age of Householder in Fenton
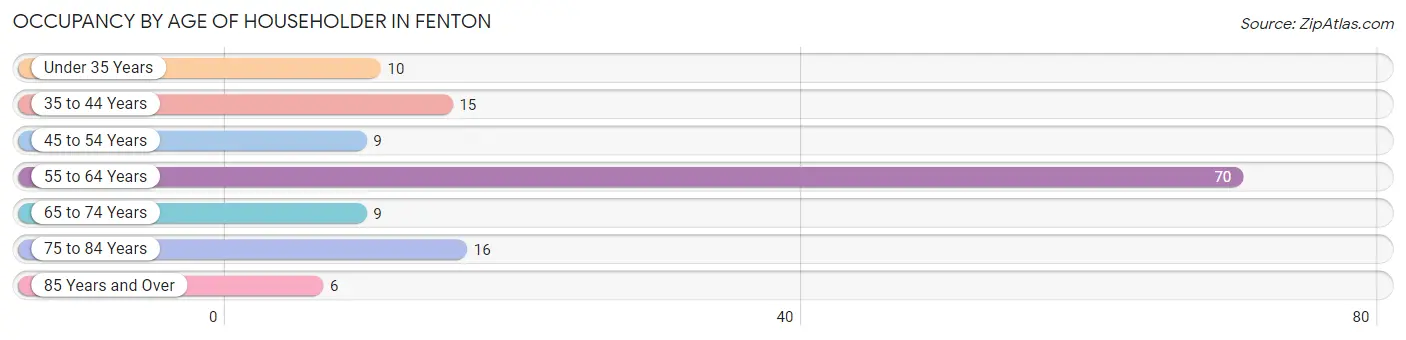
| Age Bracket | # Households | % Households |
| Under 35 Years | 10 | 7.4% |
| 35 to 44 Years | 15 | 11.1% |
| 45 to 54 Years | 9 | 6.7% |
| 55 to 64 Years | 70 | 51.8% |
| 65 to 74 Years | 9 | 6.7% |
| 75 to 84 Years | 16 | 11.8% |
| 85 Years and Over | 6 | 4.4% |
| Total | 135 | 100.0% |
Housing Finances in Fenton
Median Income by Occupancy in Fenton
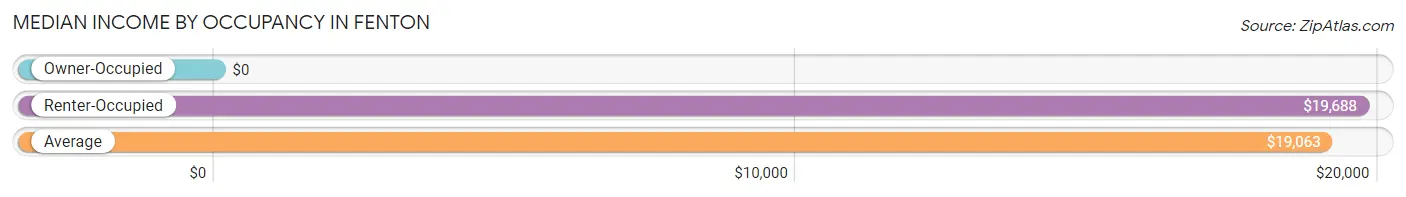
| Occupancy Type | # Households | Median Income |
| Owner-Occupied | 100 (74.1%) | $0 |
| Renter-Occupied | 35 (25.9%) | $19,688 |
| Average | 135 (100.0%) | $19,063 |
Occupancy by Householder Income Bracket in Fenton
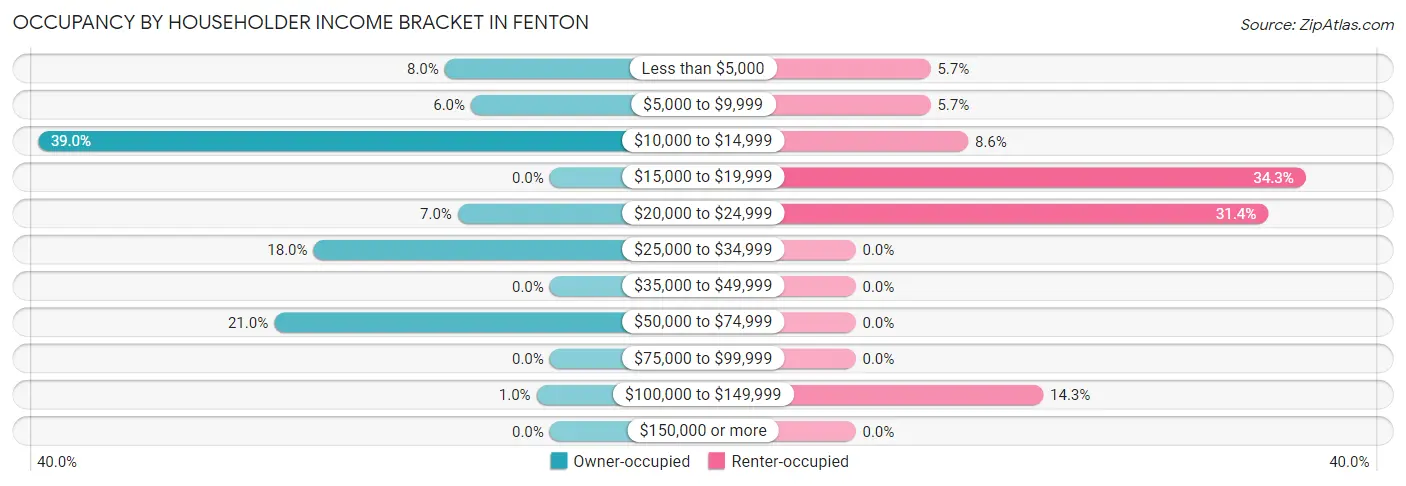
| Income Bracket | Owner-occupied | Renter-occupied |
| Less than $5,000 | 8 (8.0%) | 2 (5.7%) |
| $5,000 to $9,999 | 6 (6.0%) | 2 (5.7%) |
| $10,000 to $14,999 | 39 (39.0%) | 3 (8.6%) |
| $15,000 to $19,999 | 0 (0.0%) | 12 (34.3%) |
| $20,000 to $24,999 | 7 (7.0%) | 11 (31.4%) |
| $25,000 to $34,999 | 18 (18.0%) | 0 (0.0%) |
| $35,000 to $49,999 | 0 (0.0%) | 0 (0.0%) |
| $50,000 to $74,999 | 21 (21.0%) | 0 (0.0%) |
| $75,000 to $99,999 | 0 (0.0%) | 0 (0.0%) |
| $100,000 to $149,999 | 1 (1.0%) | 5 (14.3%) |
| $150,000 or more | 0 (0.0%) | 0 (0.0%) |
| Total | 100 (100.0%) | 35 (100.0%) |
Monthly Housing Cost Tiers in Fenton
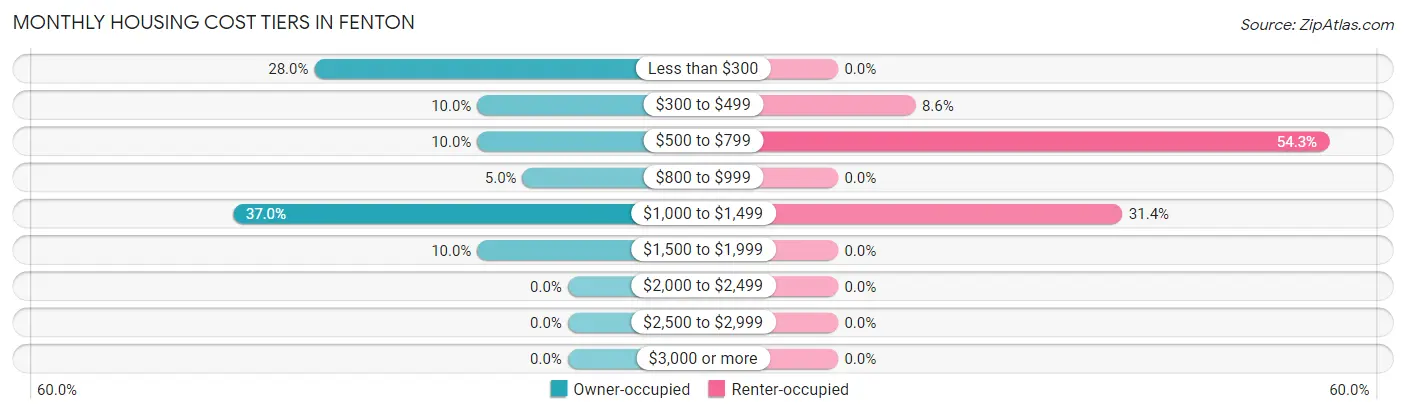
| Monthly Cost | Owner-occupied | Renter-occupied |
| Less than $300 | 28 (28.0%) | 0 (0.0%) |
| $300 to $499 | 10 (10.0%) | 3 (8.6%) |
| $500 to $799 | 10 (10.0%) | 19 (54.3%) |
| $800 to $999 | 5 (5.0%) | 0 (0.0%) |
| $1,000 to $1,499 | 37 (37.0%) | 11 (31.4%) |
| $1,500 to $1,999 | 10 (10.0%) | 0 (0.0%) |
| $2,000 to $2,499 | 0 (0.0%) | 0 (0.0%) |
| $2,500 to $2,999 | 0 (0.0%) | 0 (0.0%) |
| $3,000 or more | 0 (0.0%) | 0 (0.0%) |
| Total | 100 (100.0%) | 35 (100.0%) |
Physical Housing Characteristics in Fenton
Housing Structures in Fenton
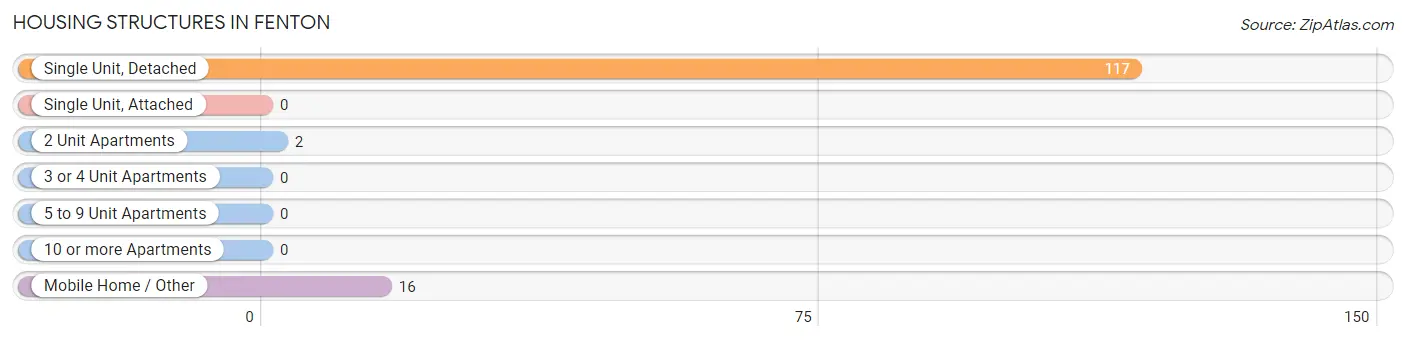
| Structure Type | # Housing Units | % Housing Units |
| Single Unit, Detached | 117 | 86.7% |
| Single Unit, Attached | 0 | 0.0% |
| 2 Unit Apartments | 2 | 1.5% |
| 3 or 4 Unit Apartments | 0 | 0.0% |
| 5 to 9 Unit Apartments | 0 | 0.0% |
| 10 or more Apartments | 0 | 0.0% |
| Mobile Home / Other | 16 | 11.8% |
| Total | 135 | 100.0% |
Housing Structures by Occupancy in Fenton
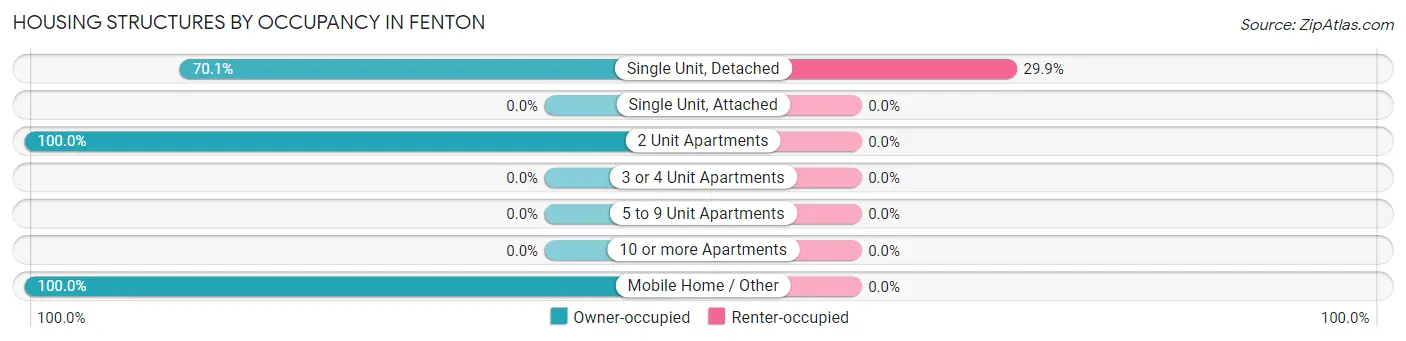
| Structure Type | Owner-occupied | Renter-occupied |
| Single Unit, Detached | 82 (70.1%) | 35 (29.9%) |
| Single Unit, Attached | 0 (0.0%) | 0 (0.0%) |
| 2 Unit Apartments | 2 (100.0%) | 0 (0.0%) |
| 3 or 4 Unit Apartments | 0 (0.0%) | 0 (0.0%) |
| 5 to 9 Unit Apartments | 0 (0.0%) | 0 (0.0%) |
| 10 or more Apartments | 0 (0.0%) | 0 (0.0%) |
| Mobile Home / Other | 16 (100.0%) | 0 (0.0%) |
| Total | 100 (74.1%) | 35 (25.9%) |
Housing Structures by Number of Rooms in Fenton
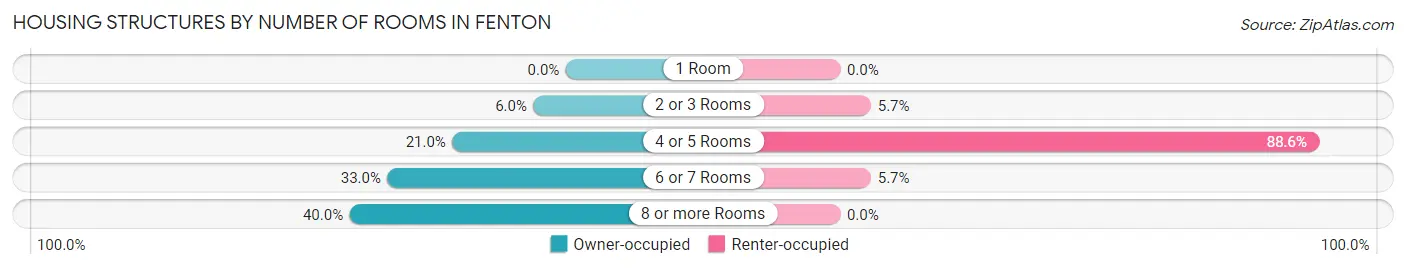
| Number of Rooms | Owner-occupied | Renter-occupied |
| 1 Room | 0 (0.0%) | 0 (0.0%) |
| 2 or 3 Rooms | 6 (6.0%) | 2 (5.7%) |
| 4 or 5 Rooms | 21 (21.0%) | 31 (88.6%) |
| 6 or 7 Rooms | 33 (33.0%) | 2 (5.7%) |
| 8 or more Rooms | 40 (40.0%) | 0 (0.0%) |
| Total | 100 (100.0%) | 35 (100.0%) |
Housing Structure by Heating Type in Fenton
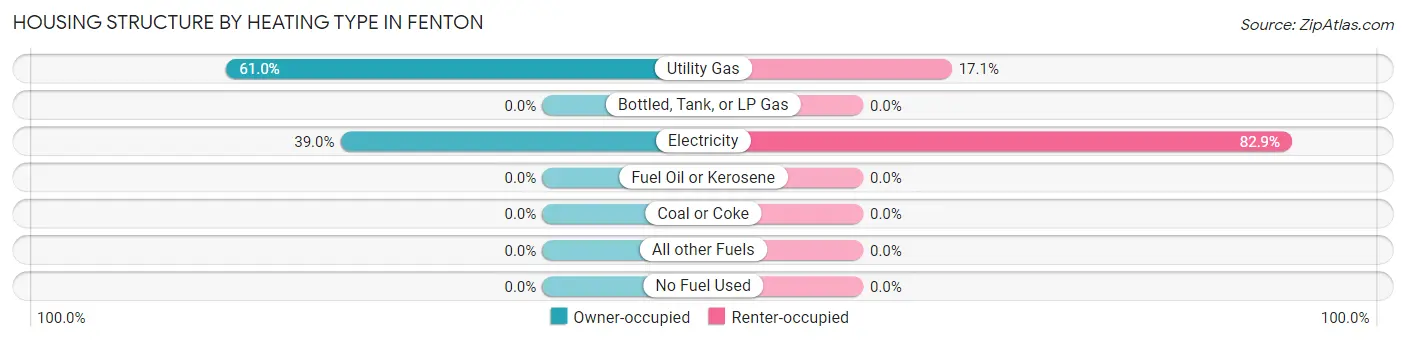
| Heating Type | Owner-occupied | Renter-occupied |
| Utility Gas | 61 (61.0%) | 6 (17.1%) |
| Bottled, Tank, or LP Gas | 0 (0.0%) | 0 (0.0%) |
| Electricity | 39 (39.0%) | 29 (82.9%) |
| Fuel Oil or Kerosene | 0 (0.0%) | 0 (0.0%) |
| Coal or Coke | 0 (0.0%) | 0 (0.0%) |
| All other Fuels | 0 (0.0%) | 0 (0.0%) |
| No Fuel Used | 0 (0.0%) | 0 (0.0%) |
| Total | 100 (100.0%) | 35 (100.0%) |
Household Vehicle Usage in Fenton
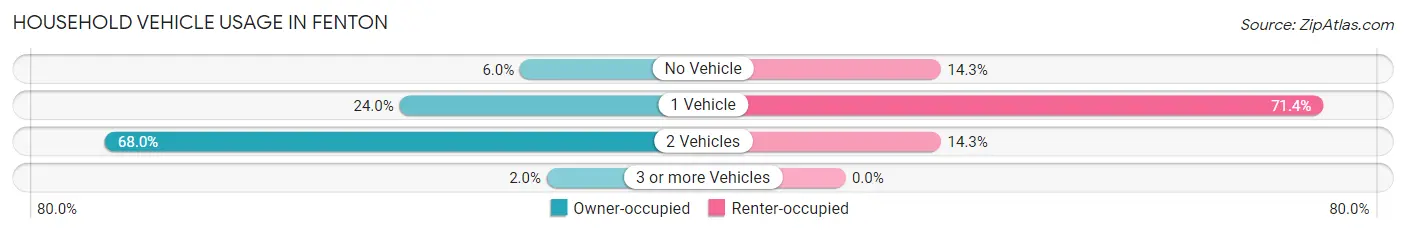
| Vehicles per Household | Owner-occupied | Renter-occupied |
| No Vehicle | 6 (6.0%) | 5 (14.3%) |
| 1 Vehicle | 24 (24.0%) | 25 (71.4%) |
| 2 Vehicles | 68 (68.0%) | 5 (14.3%) |
| 3 or more Vehicles | 2 (2.0%) | 0 (0.0%) |
| Total | 100 (100.0%) | 35 (100.0%) |
Real Estate & Mortgages in Fenton
Real Estate and Mortgage Overview in Fenton
| Characteristic | Without Mortgage | With Mortgage |
| Housing Units | 40 | 60 |
| Median Property Value | $78,600 | $97,700 |
| Median Household Income | $27,969 | $0 |
| Monthly Housing Costs | $264 | $0 |
| Real Estate Taxes | $199 | $42 |
Property Value by Mortgage Status in Fenton
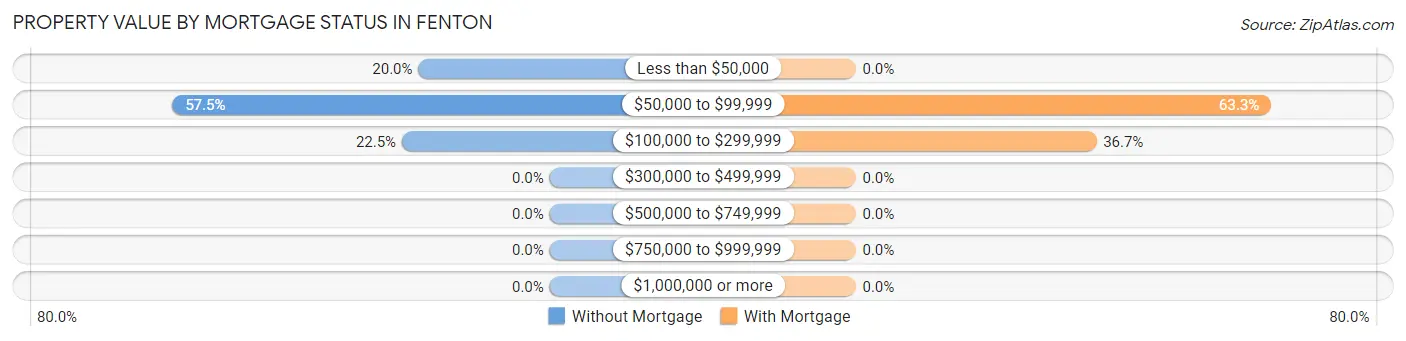
| Property Value | Without Mortgage | With Mortgage |
| Less than $50,000 | 8 (20.0%) | 0 (0.0%) |
| $50,000 to $99,999 | 23 (57.5%) | 38 (63.3%) |
| $100,000 to $299,999 | 9 (22.5%) | 22 (36.7%) |
| $300,000 to $499,999 | 0 (0.0%) | 0 (0.0%) |
| $500,000 to $749,999 | 0 (0.0%) | 0 (0.0%) |
| $750,000 to $999,999 | 0 (0.0%) | 0 (0.0%) |
| $1,000,000 or more | 0 (0.0%) | 0 (0.0%) |
| Total | 40 (100.0%) | 60 (100.0%) |
Household Income by Mortgage Status in Fenton
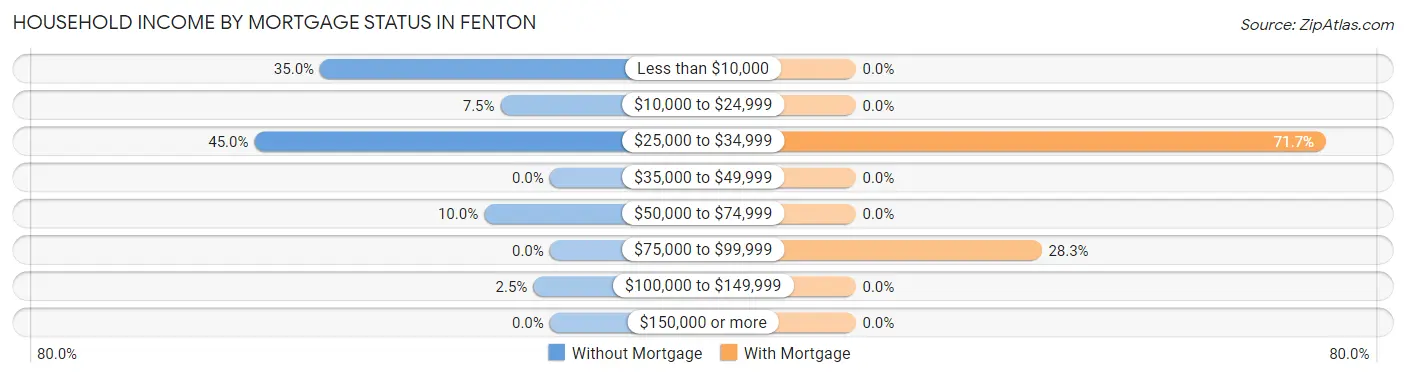
| Household Income | Without Mortgage | With Mortgage |
| Less than $10,000 | 14 (35.0%) | 0 (0.0%) |
| $10,000 to $24,999 | 3 (7.5%) | 0 (0.0%) |
| $25,000 to $34,999 | 18 (45.0%) | 43 (71.7%) |
| $35,000 to $49,999 | 0 (0.0%) | 0 (0.0%) |
| $50,000 to $74,999 | 4 (10.0%) | 0 (0.0%) |
| $75,000 to $99,999 | 0 (0.0%) | 17 (28.3%) |
| $100,000 to $149,999 | 1 (2.5%) | 0 (0.0%) |
| $150,000 or more | 0 (0.0%) | 0 (0.0%) |
| Total | 40 (100.0%) | 60 (100.0%) |
Property Value to Household Income Ratio in Fenton
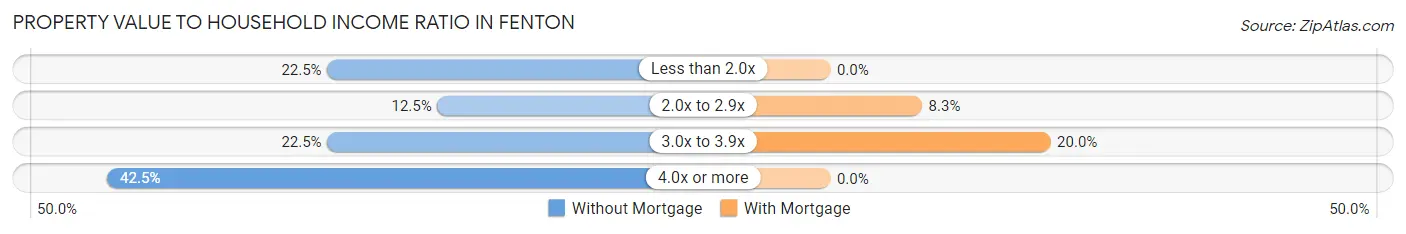
| Value-to-Income Ratio | Without Mortgage | With Mortgage |
| Less than 2.0x | 9 (22.5%) | 0 (0.0%) |
| 2.0x to 2.9x | 5 (12.5%) | 5 (8.3%) |
| 3.0x to 3.9x | 9 (22.5%) | 12 (20.0%) |
| 4.0x or more | 17 (42.5%) | 0 (0.0%) |
| Total | 40 (100.0%) | 60 (100.0%) |
Real Estate Taxes by Mortgage Status in Fenton
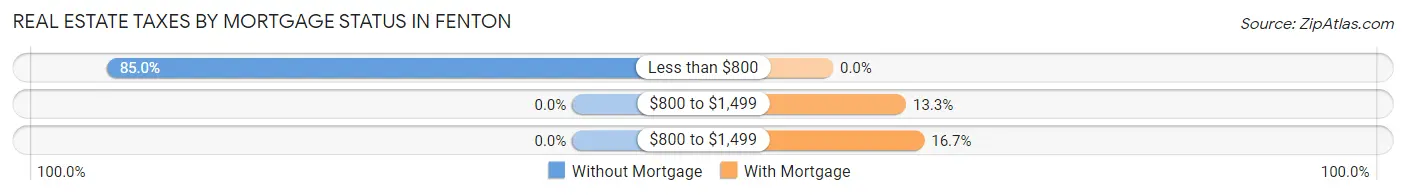
| Property Taxes | Without Mortgage | With Mortgage |
| Less than $800 | 34 (85.0%) | 0 (0.0%) |
| $800 to $1,499 | 0 (0.0%) | 8 (13.3%) |
| $800 to $1,499 | 0 (0.0%) | 10 (16.7%) |
| Total | 40 (100.0%) | 60 (100.0%) |
Health & Disability in Fenton
Health Insurance Coverage by Age in Fenton
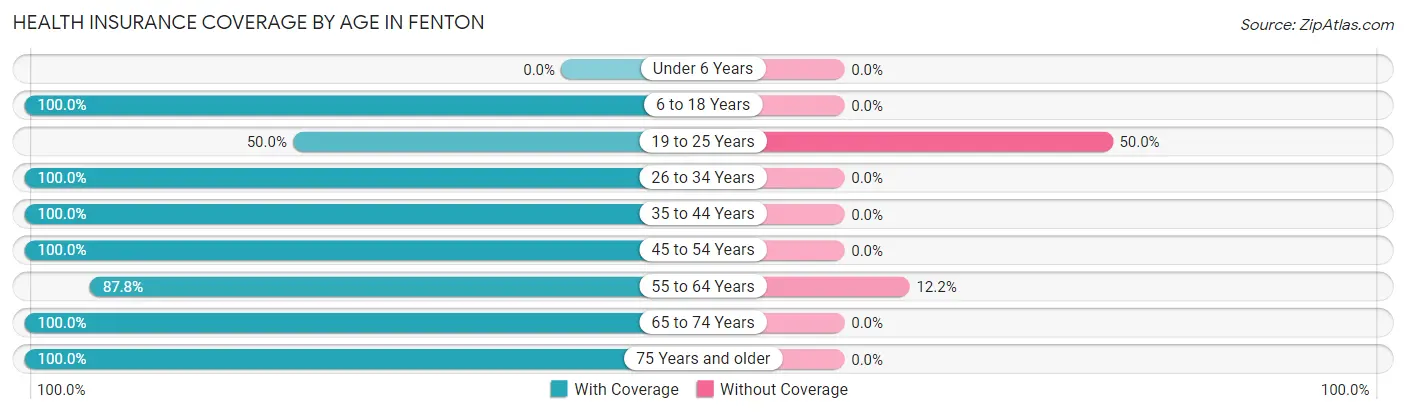
| Age Bracket | With Coverage | Without Coverage |
| Under 6 Years | 0 (0.0%) | 0 (0.0%) |
| 6 to 18 Years | 20 (100.0%) | 0 (0.0%) |
| 19 to 25 Years | 6 (50.0%) | 6 (50.0%) |
| 26 to 34 Years | 10 (100.0%) | 0 (0.0%) |
| 35 to 44 Years | 35 (100.0%) | 0 (0.0%) |
| 45 to 54 Years | 10 (100.0%) | 0 (0.0%) |
| 55 to 64 Years | 65 (87.8%) | 9 (12.2%) |
| 65 to 74 Years | 30 (100.0%) | 0 (0.0%) |
| 75 Years and older | 22 (100.0%) | 0 (0.0%) |
| Total | 198 (93.0%) | 15 (7.0%) |
Health Insurance Coverage by Citizenship Status in Fenton
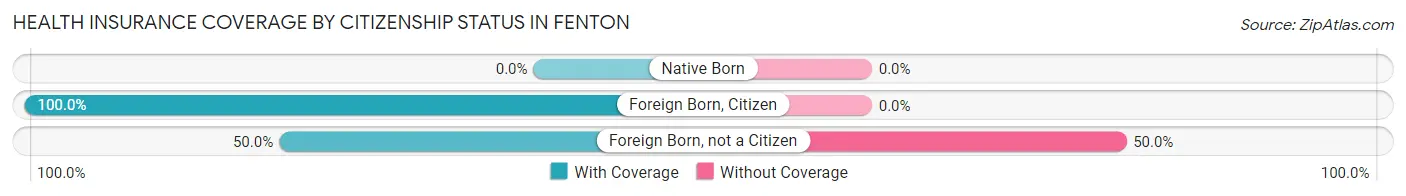
| Citizenship Status | With Coverage | Without Coverage |
| Native Born | 0 (0.0%) | 0 (0.0%) |
| Foreign Born, Citizen | 20 (100.0%) | 0 (0.0%) |
| Foreign Born, not a Citizen | 6 (50.0%) | 6 (50.0%) |
Health Insurance Coverage by Household Income in Fenton
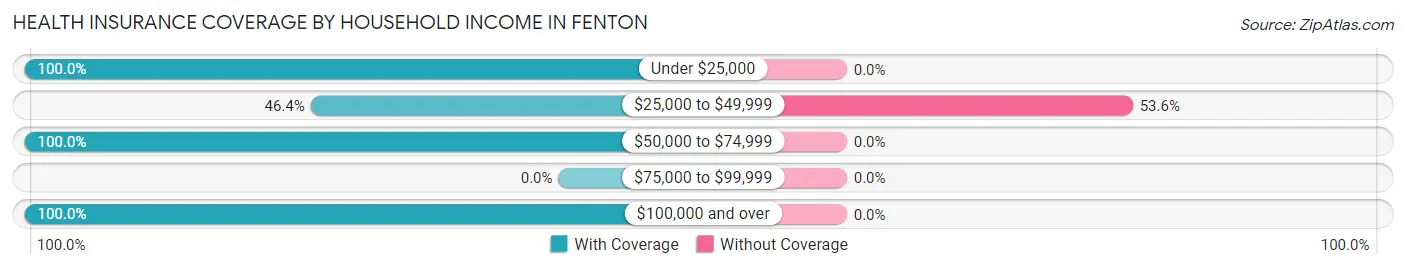
| Household Income | With Coverage | Without Coverage |
| Under $25,000 | 118 (100.0%) | 0 (0.0%) |
| $25,000 to $49,999 | 13 (46.4%) | 15 (53.6%) |
| $50,000 to $74,999 | 44 (100.0%) | 0 (0.0%) |
| $75,000 to $99,999 | 0 (0.0%) | 0 (0.0%) |
| $100,000 and over | 22 (100.0%) | 0 (0.0%) |
Public vs Private Health Insurance Coverage by Age in Fenton
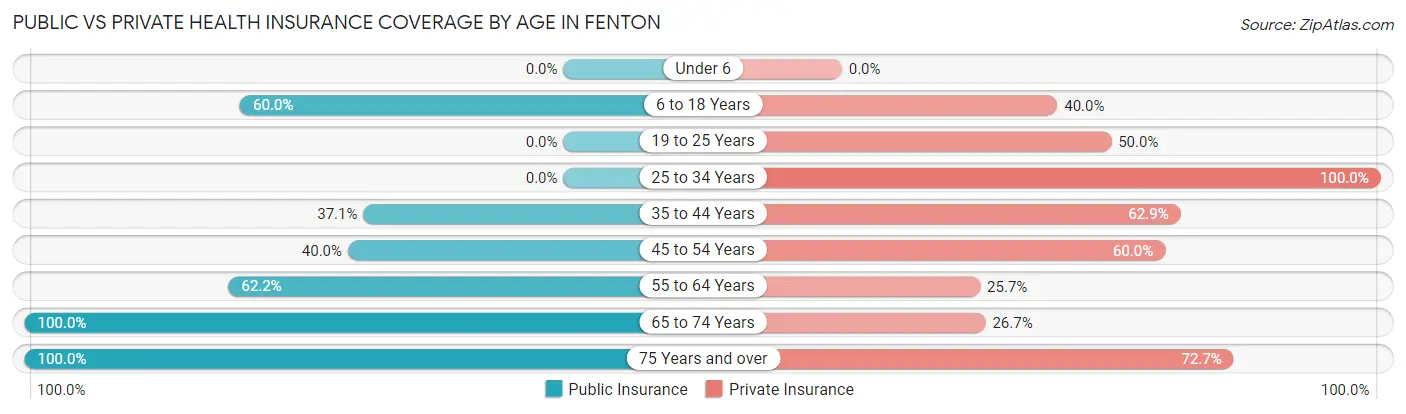
| Age Bracket | Public Insurance | Private Insurance |
| Under 6 | 0 (0.0%) | 0 (0.0%) |
| 6 to 18 Years | 12 (60.0%) | 8 (40.0%) |
| 19 to 25 Years | 0 (0.0%) | 6 (50.0%) |
| 25 to 34 Years | 0 (0.0%) | 10 (100.0%) |
| 35 to 44 Years | 13 (37.1%) | 22 (62.9%) |
| 45 to 54 Years | 4 (40.0%) | 6 (60.0%) |
| 55 to 64 Years | 46 (62.2%) | 19 (25.7%) |
| 65 to 74 Years | 30 (100.0%) | 8 (26.7%) |
| 75 Years and over | 22 (100.0%) | 16 (72.7%) |
| Total | 127 (59.6%) | 95 (44.6%) |
Disability Status by Sex by Age in Fenton
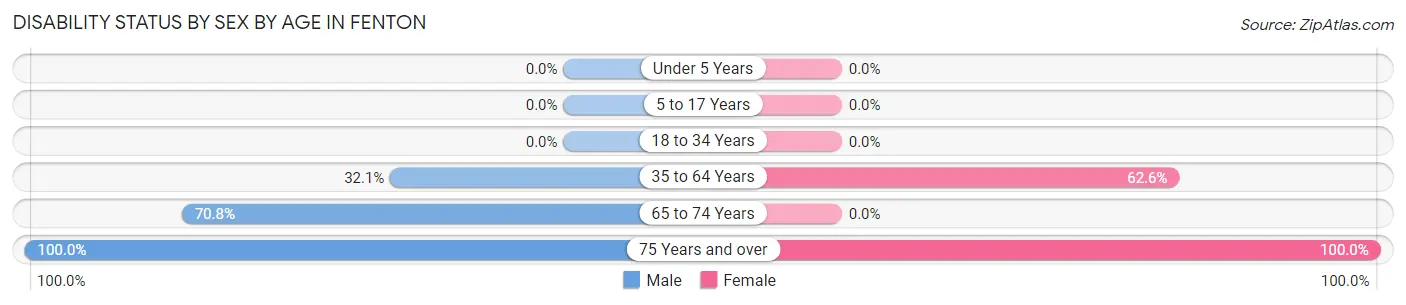
| Age Bracket | Male | Female |
| Under 5 Years | 0 (0.0%) | 0 (0.0%) |
| 5 to 17 Years | 0 (0.0%) | 0 (0.0%) |
| 18 to 34 Years | 0 (0.0%) | 0 (0.0%) |
| 35 to 64 Years | 9 (32.1%) | 57 (62.6%) |
| 65 to 74 Years | 17 (70.8%) | 0 (0.0%) |
| 75 Years and over | 6 (100.0%) | 16 (100.0%) |
Disability Class by Sex by Age in Fenton
Disability Class: Hearing Difficulty
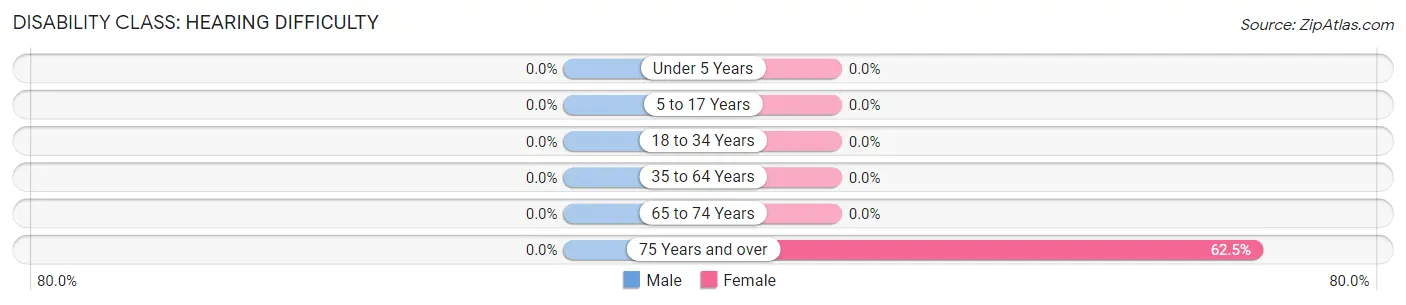
| Age Bracket | Male | Female |
| Under 5 Years | 0 (0.0%) | 0 (0.0%) |
| 5 to 17 Years | 0 (0.0%) | 0 (0.0%) |
| 18 to 34 Years | 0 (0.0%) | 0 (0.0%) |
| 35 to 64 Years | 0 (0.0%) | 0 (0.0%) |
| 65 to 74 Years | 0 (0.0%) | 0 (0.0%) |
| 75 Years and over | 0 (0.0%) | 10 (62.5%) |
Disability Class: Vision Difficulty
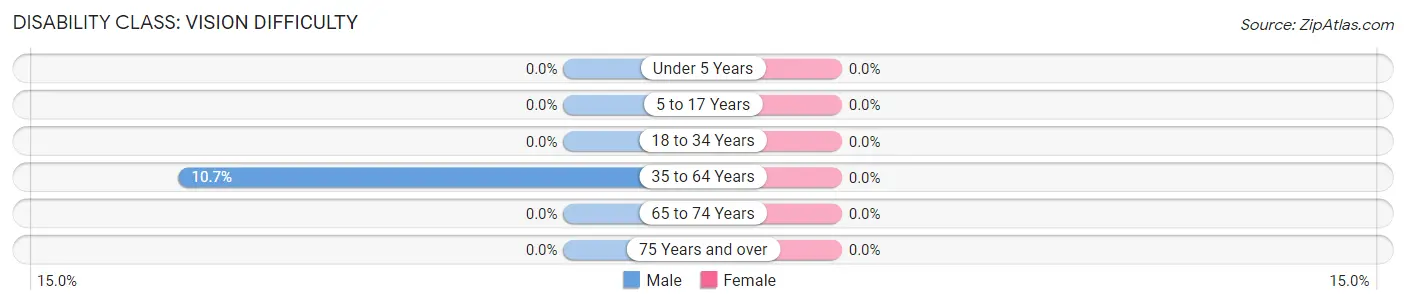
| Age Bracket | Male | Female |
| Under 5 Years | 0 (0.0%) | 0 (0.0%) |
| 5 to 17 Years | 0 (0.0%) | 0 (0.0%) |
| 18 to 34 Years | 0 (0.0%) | 0 (0.0%) |
| 35 to 64 Years | 3 (10.7%) | 0 (0.0%) |
| 65 to 74 Years | 0 (0.0%) | 0 (0.0%) |
| 75 Years and over | 0 (0.0%) | 0 (0.0%) |
Disability Class: Cognitive Difficulty
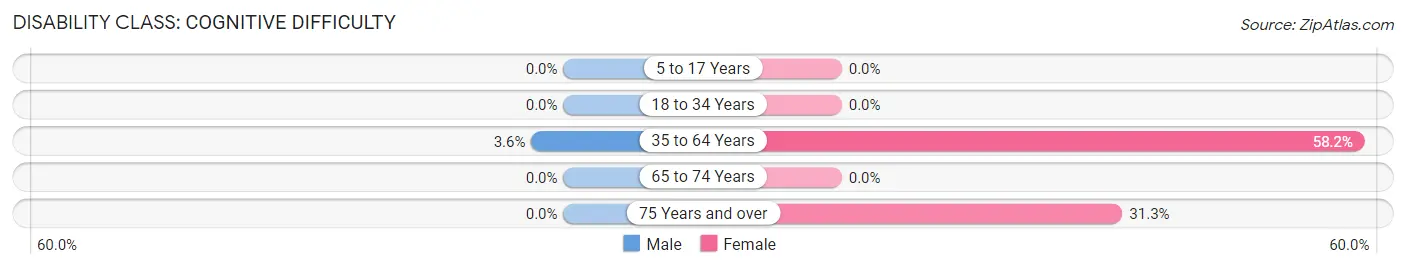
| Age Bracket | Male | Female |
| 5 to 17 Years | 0 (0.0%) | 0 (0.0%) |
| 18 to 34 Years | 0 (0.0%) | 0 (0.0%) |
| 35 to 64 Years | 1 (3.6%) | 53 (58.2%) |
| 65 to 74 Years | 0 (0.0%) | 0 (0.0%) |
| 75 Years and over | 0 (0.0%) | 5 (31.2%) |
Disability Class: Ambulatory Difficulty
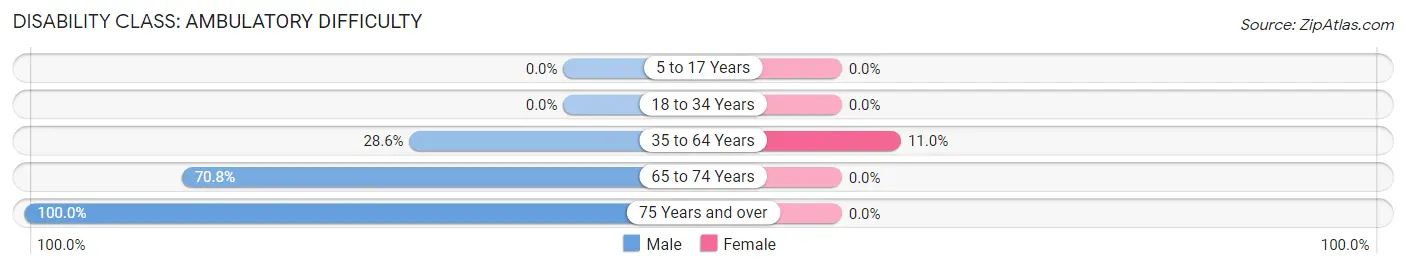
| Age Bracket | Male | Female |
| 5 to 17 Years | 0 (0.0%) | 0 (0.0%) |
| 18 to 34 Years | 0 (0.0%) | 0 (0.0%) |
| 35 to 64 Years | 8 (28.6%) | 10 (11.0%) |
| 65 to 74 Years | 17 (70.8%) | 0 (0.0%) |
| 75 Years and over | 6 (100.0%) | 0 (0.0%) |
Disability Class: Self-Care Difficulty
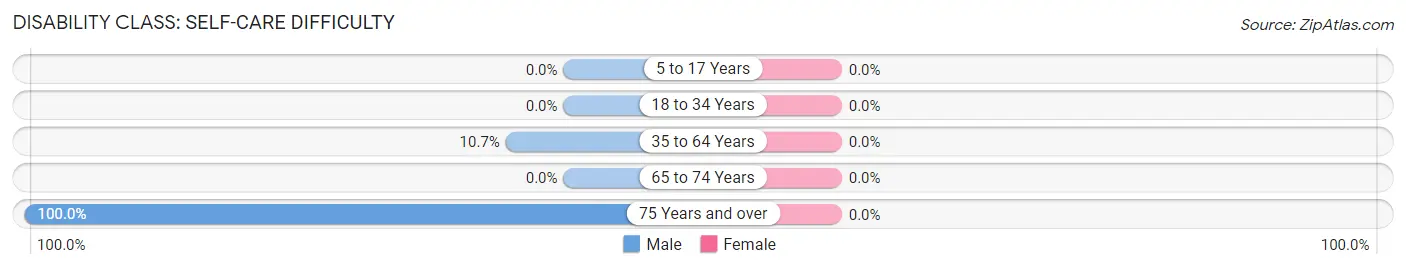
| Age Bracket | Male | Female |
| 5 to 17 Years | 0 (0.0%) | 0 (0.0%) |
| 18 to 34 Years | 0 (0.0%) | 0 (0.0%) |
| 35 to 64 Years | 3 (10.7%) | 0 (0.0%) |
| 65 to 74 Years | 0 (0.0%) | 0 (0.0%) |
| 75 Years and over | 6 (100.0%) | 0 (0.0%) |
Technology Access in Fenton
Computing Device Access in Fenton
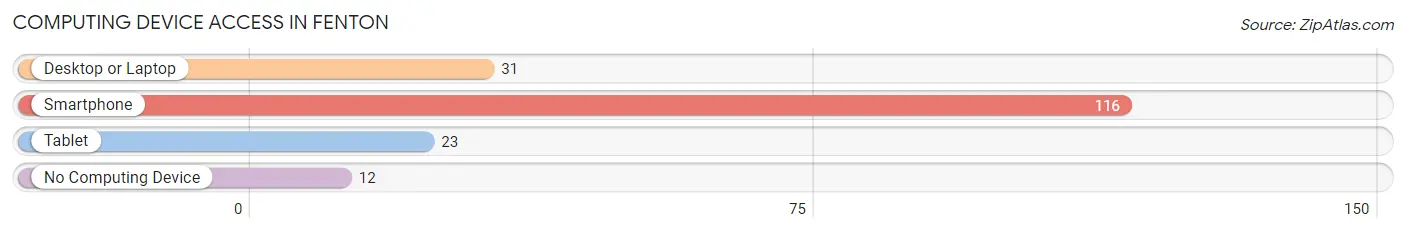
| Device Type | # Households | % Households |
| Desktop or Laptop | 31 | 23.0% |
| Smartphone | 116 | 85.9% |
| Tablet | 23 | 17.0% |
| No Computing Device | 12 | 8.9% |
| Total | 135 | 100.0% |
Internet Access in Fenton
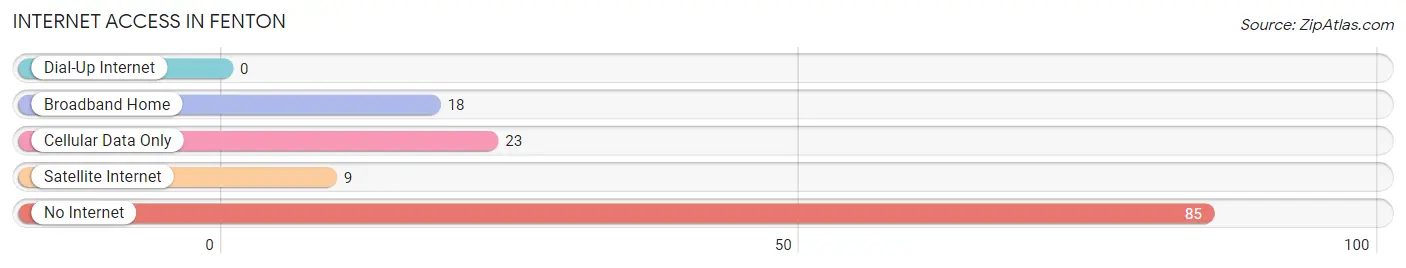
| Internet Type | # Households | % Households |
| Dial-Up Internet | 0 | 0.0% |
| Broadband Home | 18 | 13.3% |
| Cellular Data Only | 23 | 17.0% |
| Satellite Internet | 9 | 6.7% |
| No Internet | 85 | 63.0% |
| Total | 135 | 100.0% |
Fenton Summary
Fenton, Louisiana is a small town located in the southeastern corner of the state, in Jefferson Davis Parish. It is situated on the banks of the Calcasieu River, and is home to a population of just over 1,000 people. The town was founded in 1883, and has a rich history of industry, agriculture, and culture.
Geography
Fenton is located in the southeastern corner of Louisiana, in Jefferson Davis Parish. It is situated on the banks of the Calcasieu River, and is bordered by the towns of Welsh, Iowa, and Lake Arthur. The town is located approximately 30 miles from the Gulf of Mexico, and is part of the Lake Charles metropolitan area. The town is situated on a flat plain, and is surrounded by marshland and swamps. The climate is humid subtropical, with hot, humid summers and mild winters.
Economy
Fenton’s economy is largely based on agriculture and industry. The town is home to several large agricultural operations, including rice, soybeans, and cotton. The town is also home to several manufacturing plants, including a paper mill, a chemical plant, and a steel mill. The town is also home to several small businesses, including restaurants, retail stores, and service providers.
Demographics
As of the 2010 census, Fenton had a population of 1,072 people. The racial makeup of the town was 79.3% White, 17.2% African American, 0.7% Native American, 0.3% Asian, 0.1% Pacific Islander, and 2.4% from other races. The median household income was $30,938, and the median family income was $37,813. The per capita income was $17,845.
History
Fenton was founded in 1883 by a group of settlers from the nearby town of Welsh. The town was named after the Fenton family, who were among the first settlers. The town quickly grew, and by the early 1900s, it had become a thriving agricultural and industrial center. The town was home to several large rice mills, a paper mill, and a chemical plant. The town was also home to several small businesses, including restaurants, retail stores, and service providers.
In the late 20th century, Fenton began to decline as the local economy shifted away from agriculture and industry. The town’s population began to decline, and many of the businesses closed. In recent years, the town has seen a resurgence in population and economic activity. The town is now home to several small businesses, including restaurants, retail stores, and service providers.
Fenton is a small town with a rich history and a bright future. The town is home to a diverse population, and is a great place to live, work, and play. The town is home to several large agricultural operations, manufacturing plants, and small businesses. The town is also home to a vibrant culture, with a variety of festivals and events throughout the year. Fenton is a great place to call home.
Common Questions
What is Per Capita Income in Fenton?
Per Capita income in Fenton is $18,024.
What is the Median Household income in Fenton?
Median Household Income in Fenton is $19,063.
What is Inequality or Gini Index in Fenton?
Inequality or Gini Index in Fenton is 0.47.
What is the Total Population of Fenton?
Total Population of Fenton is 213.
What is the Total Male Population of Fenton?
Total Male Population of Fenton is 82.
What is the Total Female Population of Fenton?
Total Female Population of Fenton is 131.
What is the Ratio of Males per 100 Females in Fenton?
There are 62.60 Males per 100 Females in Fenton.
What is the Ratio of Females per 100 Males in Fenton?
There are 159.76 Females per 100 Males in Fenton.
What is the Median Population Age in Fenton?
Median Population Age in Fenton is 58.9 Years.
What is the Average Family Size in Fenton
Average Family Size in Fenton is 2.0 People.
What is the Average Household Size in Fenton
Average Household Size in Fenton is 1.6 People.
How Large is the Labor Force in Fenton?
There are 118 People in the Labor Forcein in Fenton.
What is the Percentage of People in the Labor Force in Fenton?
61.1% of People are in the Labor Force in Fenton.