Glendora, MS Map & Demographics
Glendora Map
Glendora Overview
$5,458
PER CAPITA INCOME
$17,857
AVG FAMILY INCOME
$10,875
AVG HOUSEHOLD INCOME
0.34
INEQUALITY / GINI INDEX
142
TOTAL POPULATION
47
MALE POPULATION
95
FEMALE POPULATION
49.47
MALES / 100 FEMALES
202.13
FEMALES / 100 MALES
29.5
MEDIAN AGE
3.7
AVG FAMILY SIZE
2.7
AVG HOUSEHOLD SIZE
77
LABOR FORCE [ PEOPLE ]
75.5%
PERCENT IN LABOR FORCE
70.1%
UNEMPLOYMENT RATE
Glendora Zip Codes
Glendora Area Codes
Income in Glendora
Income Overview in Glendora
Per Capita Income in Glendora is $5,458, while median incomes of families and households are $17,857 and $10,875 respectively.
| Characteristic | Number | Measure |
| Per Capita Income | 142 | $5,458 |
| Median Family Income | 32 | $17,857 |
| Mean Family Income | 32 | $17,406 |
| Median Household Income | 53 | $10,875 |
| Mean Household Income | 53 | $14,149 |
| Income Deficit | 32 | $0 |
| Wage / Income Gap (%) | 142 | 0.00% |
| Wage / Income Gap ($) | 142 | 100.00¢ per $1 |
| Gini / Inequality Index | 142 | 0.34 |
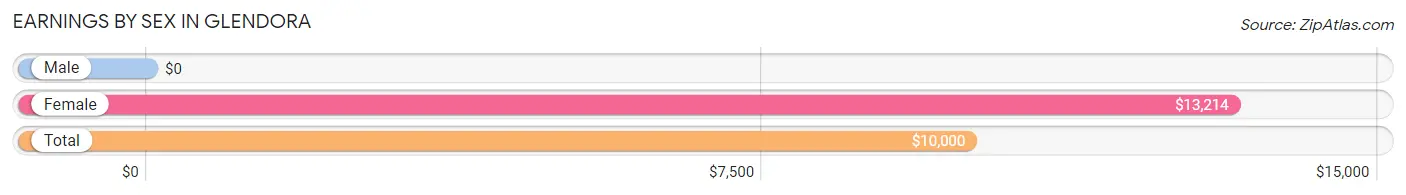
Earnings by Sex in Glendora
| Sex | Number | Average Earnings |
| Male | 12 (30.0%) | $0 |
| Female | 28 (70.0%) | $13,214 |
| Total | 40 (100.0%) | $10,000 |
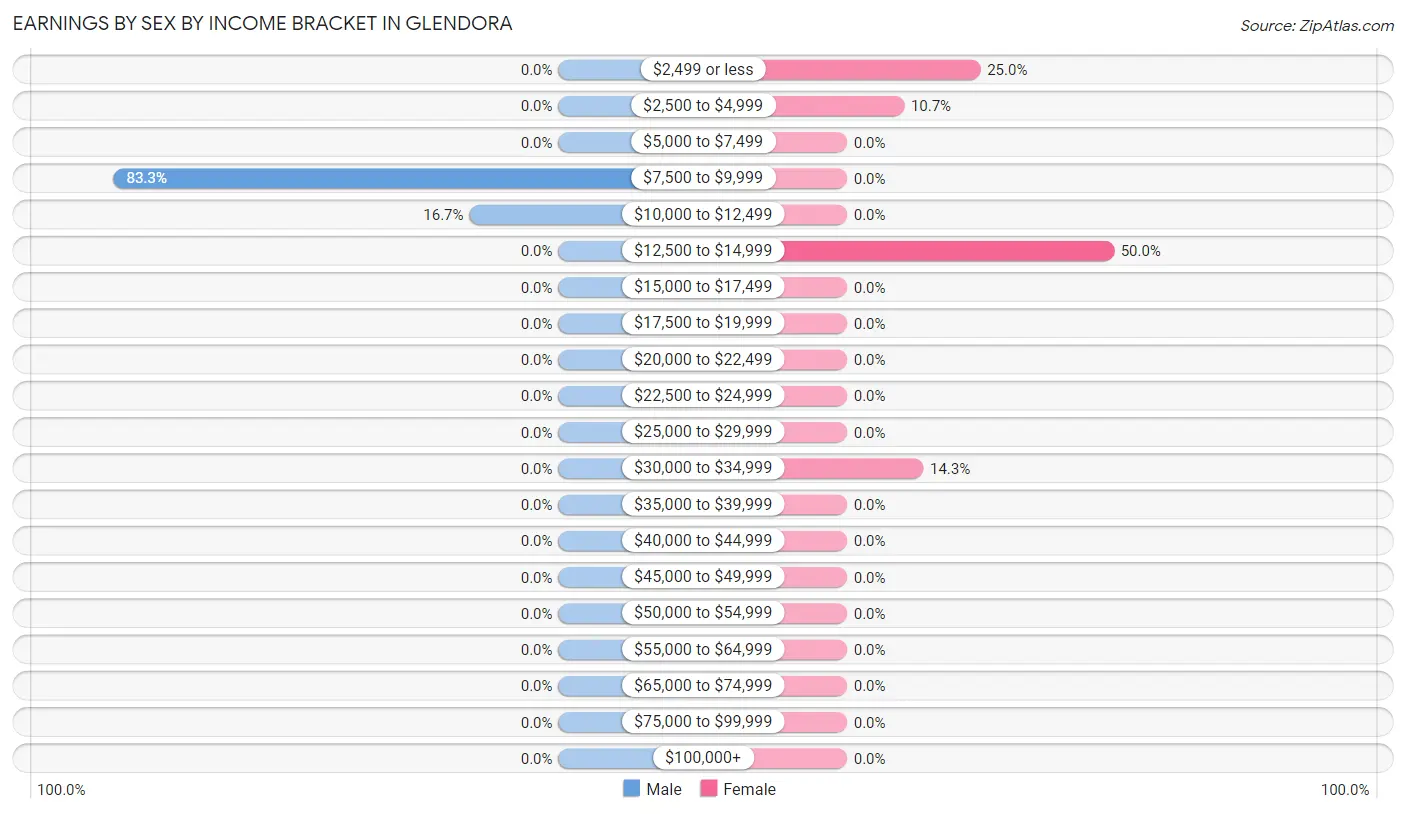
Earnings by Sex by Income Bracket in Glendora
The most common earnings brackets in Glendora are $7,500 to $9,999 for men (10 | 83.3%) and $12,500 to $14,999 for women (14 | 50.0%).
| Income | Male | Female |
| $2,499 or less | 0 (0.0%) | 7 (25.0%) |
| $2,500 to $4,999 | 0 (0.0%) | 3 (10.7%) |
| $5,000 to $7,499 | 0 (0.0%) | 0 (0.0%) |
| $7,500 to $9,999 | 10 (83.3%) | 0 (0.0%) |
| $10,000 to $12,499 | 2 (16.7%) | 0 (0.0%) |
| $12,500 to $14,999 | 0 (0.0%) | 14 (50.0%) |
| $15,000 to $17,499 | 0 (0.0%) | 0 (0.0%) |
| $17,500 to $19,999 | 0 (0.0%) | 0 (0.0%) |
| $20,000 to $22,499 | 0 (0.0%) | 0 (0.0%) |
| $22,500 to $24,999 | 0 (0.0%) | 0 (0.0%) |
| $25,000 to $29,999 | 0 (0.0%) | 0 (0.0%) |
| $30,000 to $34,999 | 0 (0.0%) | 4 (14.3%) |
| $35,000 to $39,999 | 0 (0.0%) | 0 (0.0%) |
| $40,000 to $44,999 | 0 (0.0%) | 0 (0.0%) |
| $45,000 to $49,999 | 0 (0.0%) | 0 (0.0%) |
| $50,000 to $54,999 | 0 (0.0%) | 0 (0.0%) |
| $55,000 to $64,999 | 0 (0.0%) | 0 (0.0%) |
| $65,000 to $74,999 | 0 (0.0%) | 0 (0.0%) |
| $75,000 to $99,999 | 0 (0.0%) | 0 (0.0%) |
| $100,000+ | 0 (0.0%) | 0 (0.0%) |
| Total | 12 (100.0%) | 28 (100.0%) |
Earnings by Sex by Educational Attainment in Glendora
| Educational Attainment | Male Income | Female Income |
| Less than High School | - | - |
| High School Diploma | - | - |
| College or Associate's Degree | - | - |
| Bachelor's Degree | - | - |
| Graduate Degree | - | - |
| Total | - | - |
Family Income in Glendora
Family Income Brackets in Glendora
According to the Glendora family income data, there are 14 families falling into the $15,000 to $24,999 income range, which is the most common income bracket and makes up 43.8% of all families.
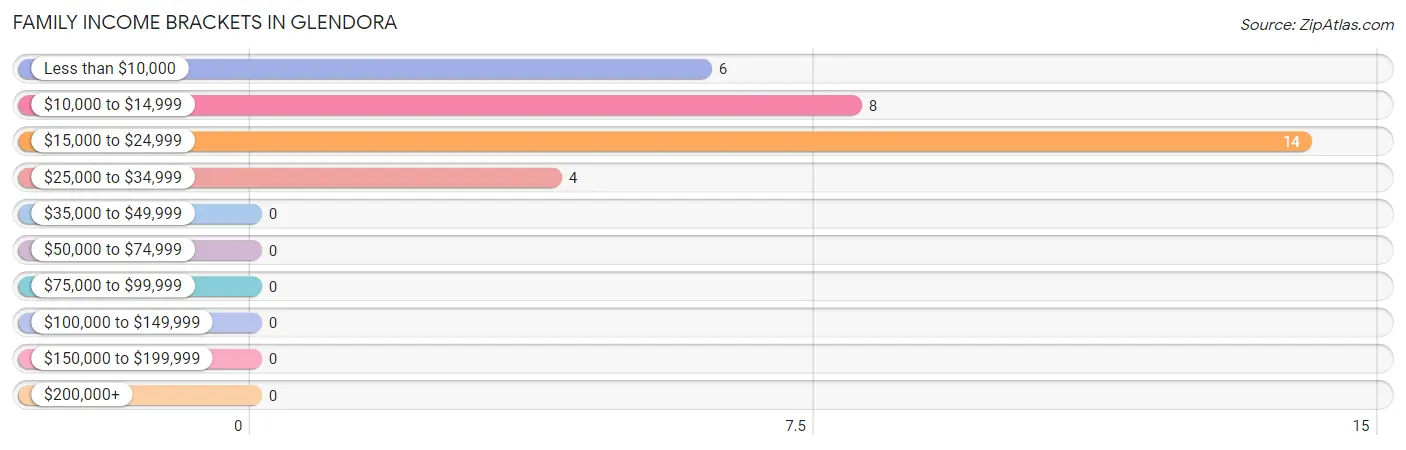
| Income Bracket | # Families | % Families |
| Less than $10,000 | 6 | 18.8% |
| $10,000 to $14,999 | 8 | 25.0% |
| $15,000 to $24,999 | 14 | 43.8% |
| $25,000 to $34,999 | 4 | 12.5% |
| $35,000 to $49,999 | 0 | 0.0% |
| $50,000 to $74,999 | 0 | 0.0% |
| $75,000 to $99,999 | 0 | 0.0% |
| $100,000 to $149,999 | 0 | 0.0% |
| $150,000 to $199,999 | 0 | 0.0% |
| $200,000+ | 0 | 0.0% |
Family Income by Famaliy Size in Glendora
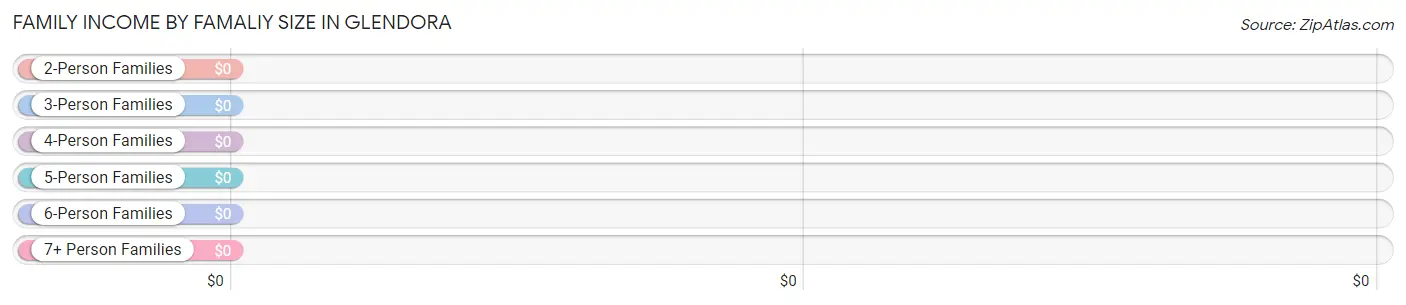
| Income Bracket | # Families | Median Income |
| 2-Person Families | 11 (34.4%) | $0 |
| 3-Person Families | 7 (21.9%) | $0 |
| 4-Person Families | 14 (43.8%) | $0 |
| 5-Person Families | 0 (0.0%) | $0 |
| 6-Person Families | 0 (0.0%) | $0 |
| 7+ Person Families | 0 (0.0%) | $0 |
| Total | 32 (100.0%) | $17,857 |
Family Income by Number of Earners in Glendora
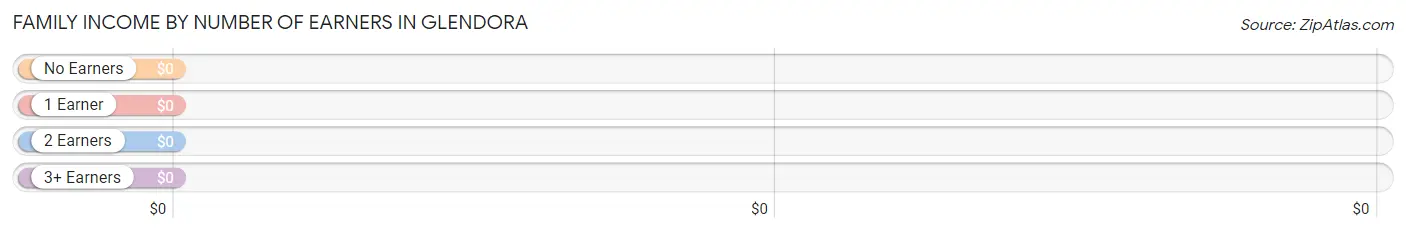
| Number of Earners | # Families | Median Income |
| No Earners | 11 (34.4%) | $0 |
| 1 Earner | 18 (56.2%) | $0 |
| 2 Earners | 3 (9.4%) | $0 |
| 3+ Earners | 0 (0.0%) | $0 |
| Total | 32 (100.0%) | $17,857 |
Household Income in Glendora
Household Income Brackets in Glendora
With 23 households falling in the category, the less than $10,000 income range is the most frequent in Glendora, accounting for 43.4% of all households.
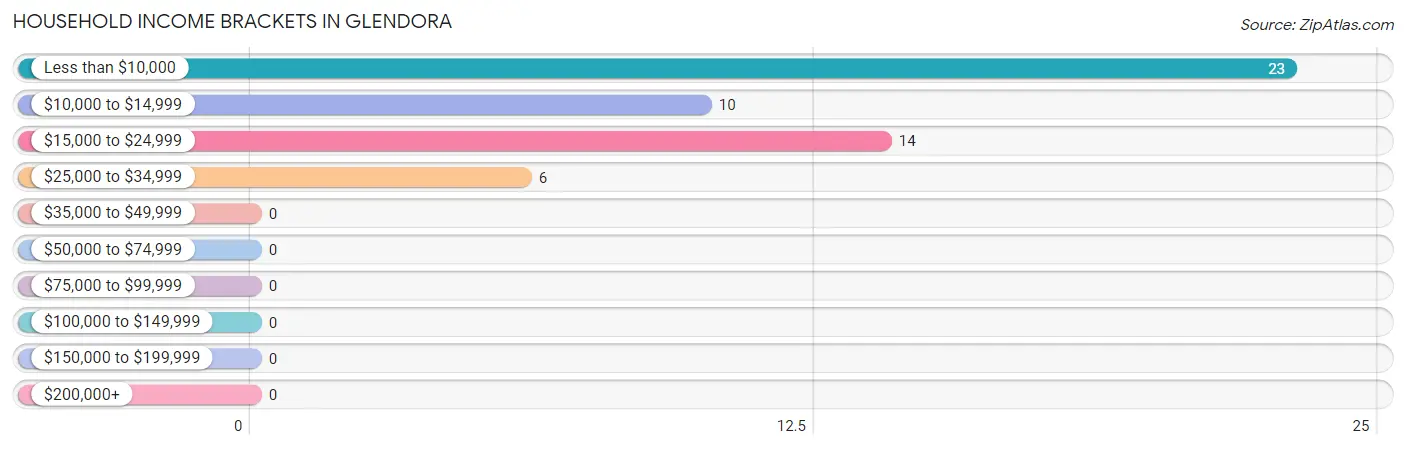
| Income Bracket | # Households | % Households |
| Less than $10,000 | 23 | 43.4% |
| $10,000 to $14,999 | 10 | 18.9% |
| $15,000 to $24,999 | 14 | 26.4% |
| $25,000 to $34,999 | 6 | 11.3% |
| $35,000 to $49,999 | 0 | 0.0% |
| $50,000 to $74,999 | 0 | 0.0% |
| $75,000 to $99,999 | 0 | 0.0% |
| $100,000 to $149,999 | 0 | 0.0% |
| $150,000 to $199,999 | 0 | 0.0% |
| $200,000+ | 0 | 0.0% |
Household Income by Householder Age in Glendora
The median household income in Glendora is $10,875, with the highest median household income of $11,375 found in the 45 to 64 years age bracket for the primary householder. A total of 37 households (69.8%) fall into this category.
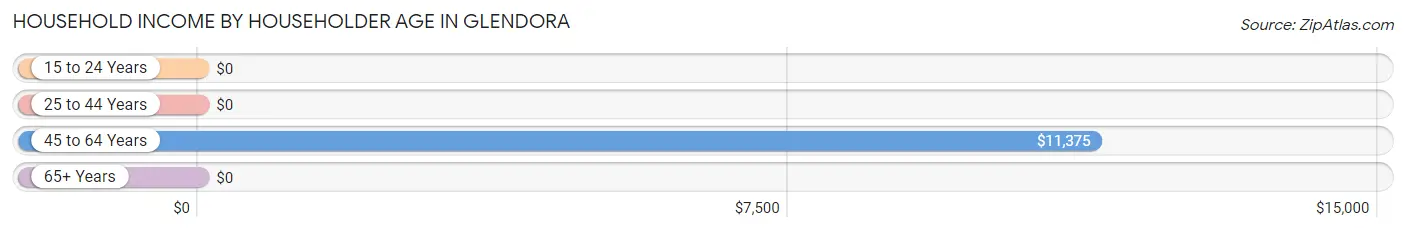
| Income Bracket | # Households | Median Income |
| 15 to 24 Years | 0 (0.0%) | $0 |
| 25 to 44 Years | 12 (22.6%) | $0 |
| 45 to 64 Years | 37 (69.8%) | $11,375 |
| 65+ Years | 4 (7.5%) | $0 |
| Total | 53 (100.0%) | $10,875 |
Poverty in Glendora
Income Below Poverty by Sex and Age in Glendora
With 91.5% poverty level for males and 90.5% for females among the residents of Glendora, 6 to 11 year old males and under 5 year old females are the most vulnerable to poverty, with 13 males (100.0%) and 22 females (100.0%) in their respective age groups living below the poverty level.
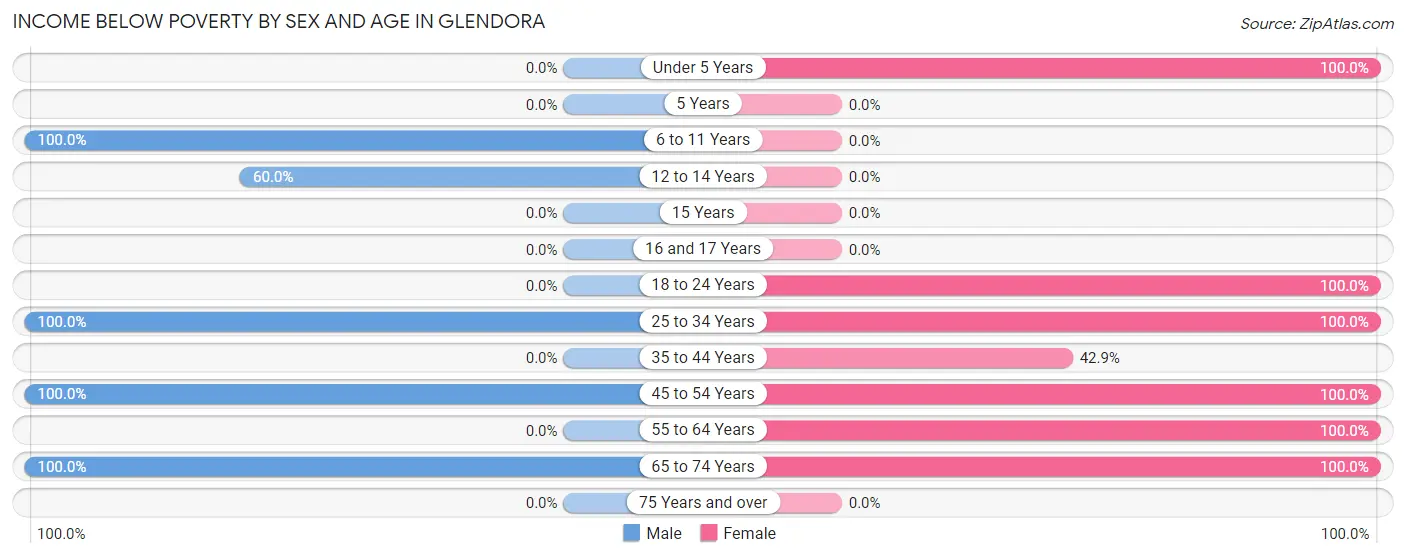
| Age Bracket | Male | Female |
| Under 5 Years | 0 (0.0%) | 22 (100.0%) |
| 5 Years | 0 (0.0%) | 0 (0.0%) |
| 6 to 11 Years | 13 (100.0%) | 0 (0.0%) |
| 12 to 14 Years | 3 (60.0%) | 0 (0.0%) |
| 15 Years | 0 (0.0%) | 0 (0.0%) |
| 16 and 17 Years | 0 (0.0%) | 0 (0.0%) |
| 18 to 24 Years | 0 (0.0%) | 5 (100.0%) |
| 25 to 34 Years | 7 (100.0%) | 35 (100.0%) |
| 35 to 44 Years | 0 (0.0%) | 3 (42.9%) |
| 45 to 54 Years | 18 (100.0%) | 2 (100.0%) |
| 55 to 64 Years | 0 (0.0%) | 17 (100.0%) |
| 65 to 74 Years | 2 (100.0%) | 2 (100.0%) |
| 75 Years and over | 0 (0.0%) | 0 (0.0%) |
| Total | 43 (91.5%) | 86 (90.5%) |
Income Above Poverty by Sex and Age in Glendora
According to the poverty statistics in Glendora, males aged 75 years and over and females aged 16 and 17 years are the age groups that are most secure financially, with 100.0% of males and 100.0% of females in these age groups living above the poverty line.
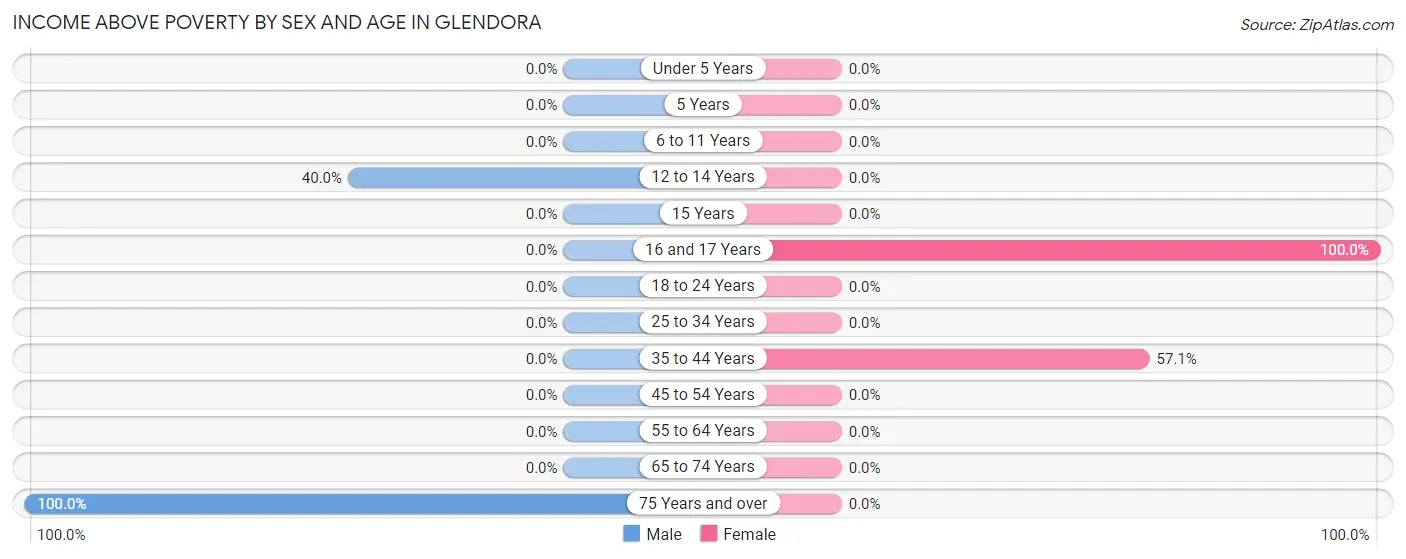
| Age Bracket | Male | Female |
| Under 5 Years | 0 (0.0%) | 0 (0.0%) |
| 5 Years | 0 (0.0%) | 0 (0.0%) |
| 6 to 11 Years | 0 (0.0%) | 0 (0.0%) |
| 12 to 14 Years | 2 (40.0%) | 0 (0.0%) |
| 15 Years | 0 (0.0%) | 0 (0.0%) |
| 16 and 17 Years | 0 (0.0%) | 5 (100.0%) |
| 18 to 24 Years | 0 (0.0%) | 0 (0.0%) |
| 25 to 34 Years | 0 (0.0%) | 0 (0.0%) |
| 35 to 44 Years | 0 (0.0%) | 4 (57.1%) |
| 45 to 54 Years | 0 (0.0%) | 0 (0.0%) |
| 55 to 64 Years | 0 (0.0%) | 0 (0.0%) |
| 65 to 74 Years | 0 (0.0%) | 0 (0.0%) |
| 75 Years and over | 2 (100.0%) | 0 (0.0%) |
| Total | 4 (8.5%) | 9 (9.5%) |
Income Below Poverty Among Married-Couple Families in Glendora
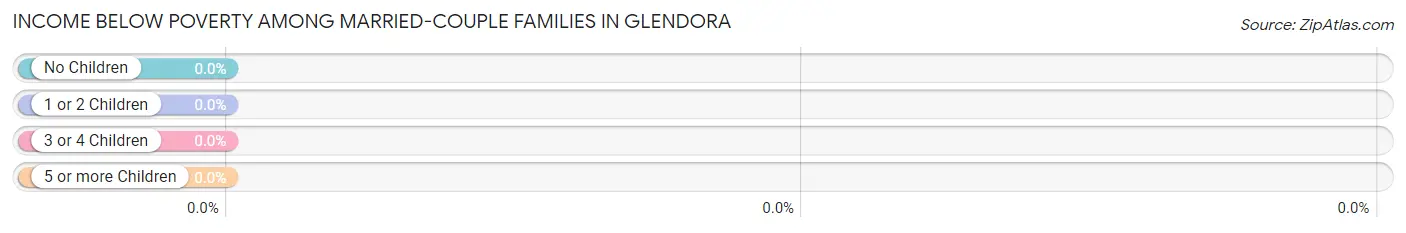
| Children | Above Poverty | Below Poverty |
| No Children | 0 (0.0%) | 0 (0.0%) |
| 1 or 2 Children | 0 (0.0%) | 0 (0.0%) |
| 3 or 4 Children | 0 (0.0%) | 0 (0.0%) |
| 5 or more Children | 0 (0.0%) | 0 (0.0%) |
| Total | 0 (0.0%) | 0 (0.0%) |
Income Below Poverty Among Single-Parent Households in Glendora
According to the poverty data in Glendora, 100.0% or 8 single-father households and 83.3% or 20 single-mother households are living below the poverty line. Among single-father households, those with 1 or 2 children have the highest poverty rate, with 8 households (100.0%) experiencing poverty. Likewise, among single-mother households, those with no children have the highest poverty rate, with 3 households (100.0%) falling below the poverty line.
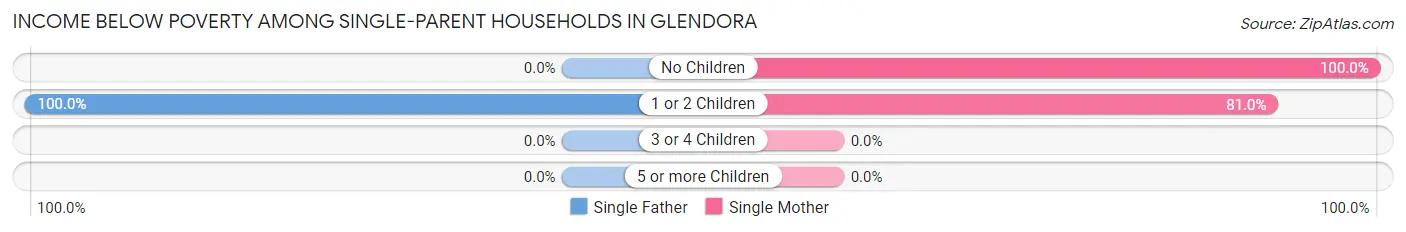
| Children | Single Father | Single Mother |
| No Children | 0 (0.0%) | 3 (100.0%) |
| 1 or 2 Children | 8 (100.0%) | 17 (80.9%) |
| 3 or 4 Children | 0 (0.0%) | 0 (0.0%) |
| 5 or more Children | 0 (0.0%) | 0 (0.0%) |
| Total | 8 (100.0%) | 20 (83.3%) |
Income Below Poverty Among Married-Couple vs Single-Parent Households in Glendora
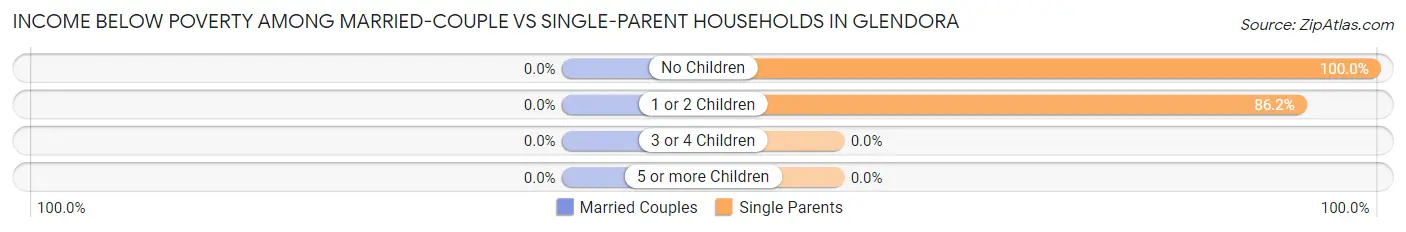
| Children | Married-Couple Families | Single-Parent Households |
| No Children | 0 (0.0%) | 3 (100.0%) |
| 1 or 2 Children | 0 (0.0%) | 25 (86.2%) |
| 3 or 4 Children | 0 (0.0%) | 0 (0.0%) |
| 5 or more Children | 0 (0.0%) | 0 (0.0%) |
| Total | 0 (0.0%) | 28 (87.5%) |
Race in Glendora
The most populous races in Glendora are , and Black / African American (142 | 100.0%).
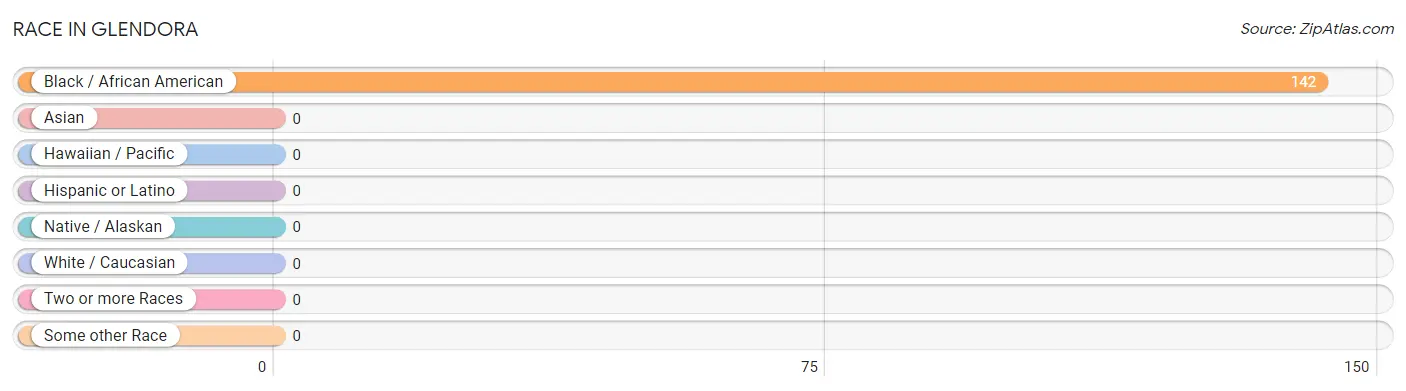
| Race | # Population | % Population |
| Asian | 0 | 0.0% |
| Black / African American | 142 | 100.0% |
| Hawaiian / Pacific | 0 | 0.0% |
| Hispanic or Latino | 0 | 0.0% |
| Native / Alaskan | 0 | 0.0% |
| White / Caucasian | 0 | 0.0% |
| Two or more Races | 0 | 0.0% |
| Some other Race | 0 | 0.0% |
| Total | 142 | 100.0% |
Ancestry in Glendora

| Ancestry | # Population | % Population | View All 0 Rows |
Immigrants in Glendora

| Immigration Origin | # Population | % Population | View All 0 Rows |
Sex and Age in Glendora
Sex and Age in Glendora
The most populous age groups in Glendora are 45 to 49 Years (18 | 38.3%) for men and 25 to 29 Years (35 | 36.8%) for women.
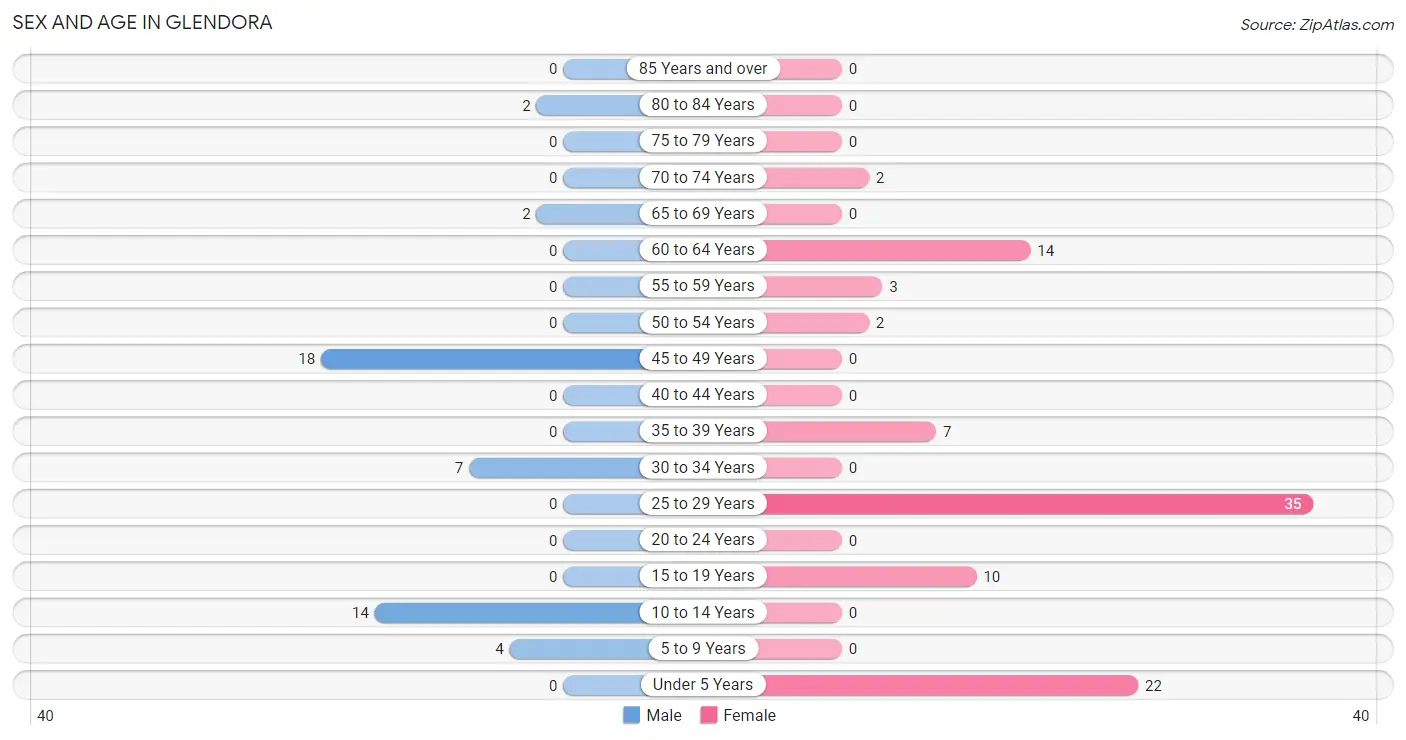
| Age Bracket | Male | Female |
| Under 5 Years | 0 (0.0%) | 22 (23.2%) |
| 5 to 9 Years | 4 (8.5%) | 0 (0.0%) |
| 10 to 14 Years | 14 (29.8%) | 0 (0.0%) |
| 15 to 19 Years | 0 (0.0%) | 10 (10.5%) |
| 20 to 24 Years | 0 (0.0%) | 0 (0.0%) |
| 25 to 29 Years | 0 (0.0%) | 35 (36.8%) |
| 30 to 34 Years | 7 (14.9%) | 0 (0.0%) |
| 35 to 39 Years | 0 (0.0%) | 7 (7.4%) |
| 40 to 44 Years | 0 (0.0%) | 0 (0.0%) |
| 45 to 49 Years | 18 (38.3%) | 0 (0.0%) |
| 50 to 54 Years | 0 (0.0%) | 2 (2.1%) |
| 55 to 59 Years | 0 (0.0%) | 3 (3.2%) |
| 60 to 64 Years | 0 (0.0%) | 14 (14.7%) |
| 65 to 69 Years | 2 (4.3%) | 0 (0.0%) |
| 70 to 74 Years | 0 (0.0%) | 2 (2.1%) |
| 75 to 79 Years | 0 (0.0%) | 0 (0.0%) |
| 80 to 84 Years | 2 (4.3%) | 0 (0.0%) |
| 85 Years and over | 0 (0.0%) | 0 (0.0%) |
| Total | 47 (100.0%) | 95 (100.0%) |
Families and Households in Glendora
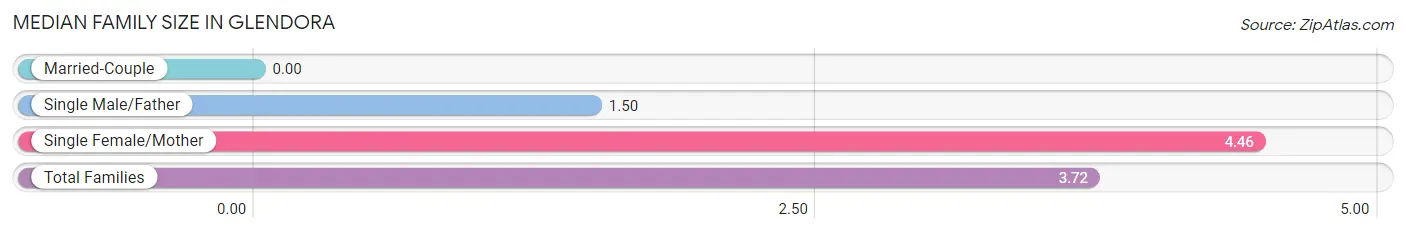
Median Family Size in Glendora
| Family Type | # Families | Family Size |
| Married-Couple | 0 (0.0%) | - |
| Single Male/Father | 8 (25.0%) | 1.50 |
| Single Female/Mother | 24 (75.0%) | 4.46 |
| Total Families | 32 (100.0%) | 3.72 |
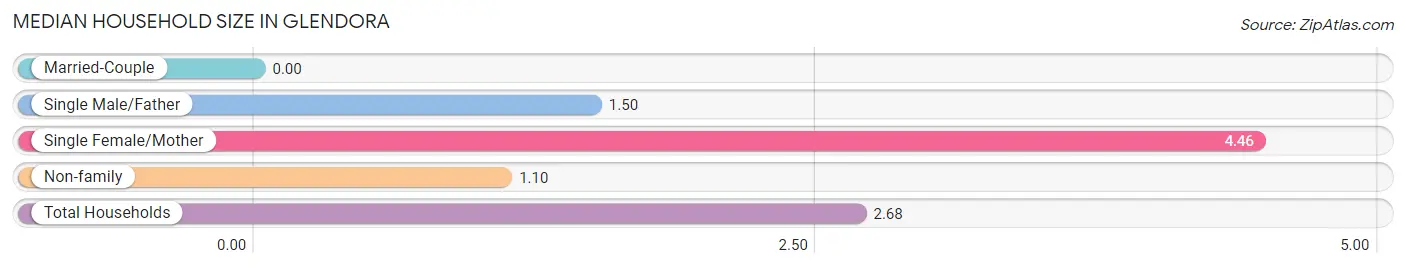
Median Household Size in Glendora
| Household Type | # Households | Household Size |
| Married-Couple | 0 (0.0%) | - |
| Single Male/Father | 8 (15.1%) | 1.50 |
| Single Female/Mother | 24 (45.3%) | 4.46 |
| Non-family | 21 (39.6%) | 1.10 |
| Total Households | 53 (100.0%) | 2.68 |
Household Size by Marriage Status in Glendora
Out of a total of 53 households in Glendora, 32 (60.4%) are family households, while 21 (39.6%) are nonfamily households. The most numerous type of family households are 4-person households, comprising 14, and the most common type of nonfamily households are 1-person households, comprising 19.
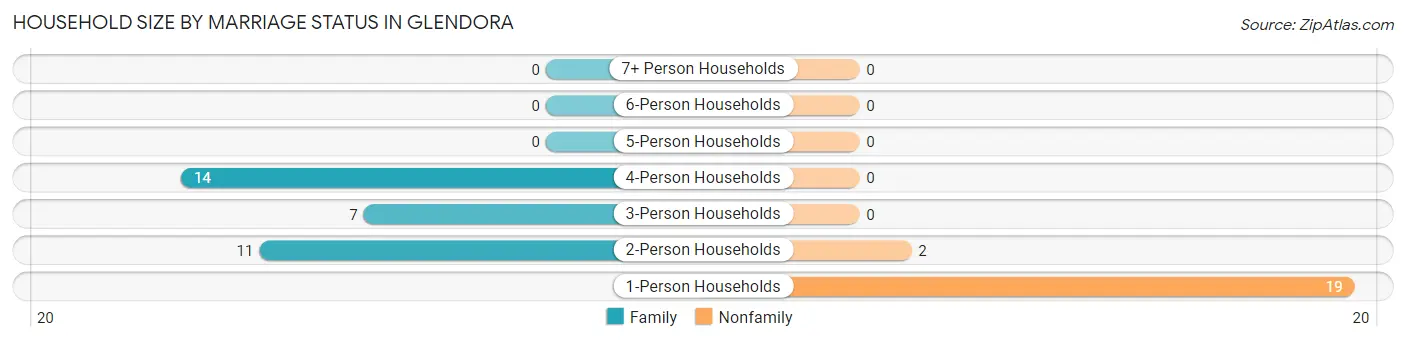
| Household Size | Family Households | Nonfamily Households |
| 1-Person Households | - | 19 (35.8%) |
| 2-Person Households | 11 (20.7%) | 2 (3.8%) |
| 3-Person Households | 7 (13.2%) | 0 (0.0%) |
| 4-Person Households | 14 (26.4%) | 0 (0.0%) |
| 5-Person Households | 0 (0.0%) | 0 (0.0%) |
| 6-Person Households | 0 (0.0%) | 0 (0.0%) |
| 7+ Person Households | 0 (0.0%) | 0 (0.0%) |
| Total | 32 (60.4%) | 21 (39.6%) |
Female Fertility in Glendora
Fertility by Age in Glendora
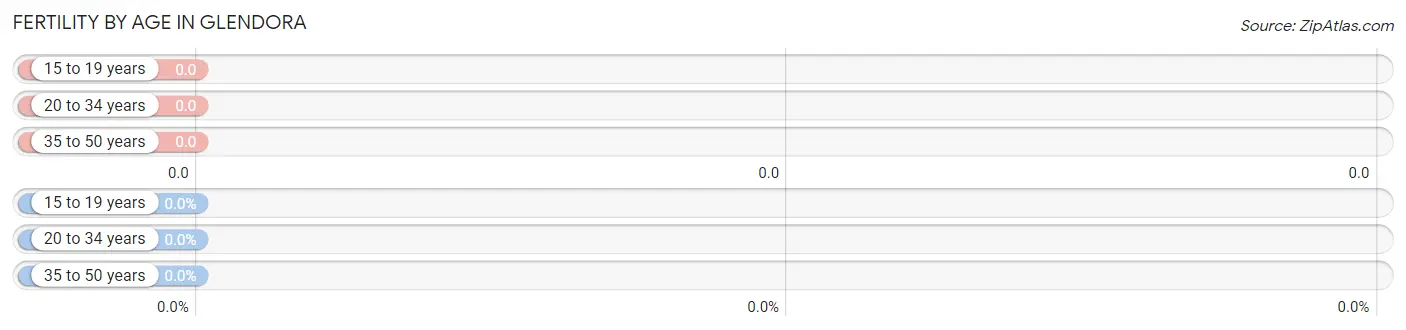
| Age Bracket | Women with Births | Births / 1,000 Women |
| 15 to 19 years | 0 (0.0%) | 0.0 |
| 20 to 34 years | 0 (0.0%) | 0.0 |
| 35 to 50 years | 0 (0.0%) | 0.0 |
| Total | 0 (0.0%) | 0.0 |
Fertility by Age by Marriage Status in Glendora
| Age Bracket | Married | Unmarried |
| 15 to 19 years | 0 (0.0%) | 0 (0.0%) |
| 20 to 34 years | 0 (0.0%) | 0 (0.0%) |
| 35 to 50 years | 0 (0.0%) | 0 (0.0%) |
| Total | 0 (0.0%) | 0 (0.0%) |
Fertility by Education in Glendora
| Educational Attainment | Women with Births | Births / 1,000 Women |
| Less than High School | 0 (0.0%) | 0.0 |
| High School Diploma | 0 (0.0%) | 0.0 |
| College or Associate's Degree | 0 (0.0%) | 0.0 |
| Bachelor's Degree | 0 (0.0%) | 0.0 |
| Graduate Degree | 0 (0.0%) | 0.0 |
| Total | 0 (0.0%) | 0.0 |
Fertility by Education by Marriage Status in Glendora
| Educational Attainment | Married | Unmarried |
| Less than High School | 0 (0.0%) | 0 (0.0%) |
| High School Diploma | 0 (0.0%) | 0 (0.0%) |
| College or Associate's Degree | 0 (0.0%) | 0 (0.0%) |
| Bachelor's Degree | 0 (0.0%) | 0 (0.0%) |
| Graduate Degree | 0 (0.0%) | 0 (0.0%) |
| Total | 0 (0.0%) | 0 (0.0%) |
Employment Characteristics in Glendora
Employment by Class of Employer in Glendora
Among the 23 employed individuals in Glendora, private company employees (19 | 82.6%), and self-employed (not incorporated) (4 | 17.4%) make up the most common classes of employment.
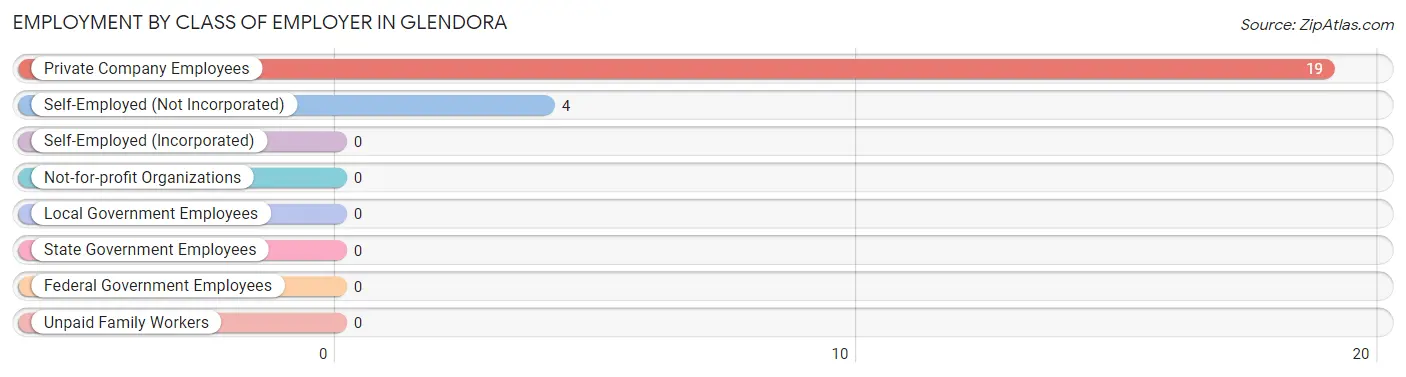
| Employer Class | # Employees | % Employees |
| Private Company Employees | 19 | 82.6% |
| Self-Employed (Incorporated) | 0 | 0.0% |
| Self-Employed (Not Incorporated) | 4 | 17.4% |
| Not-for-profit Organizations | 0 | 0.0% |
| Local Government Employees | 0 | 0.0% |
| State Government Employees | 0 | 0.0% |
| Federal Government Employees | 0 | 0.0% |
| Unpaid Family Workers | 0 | 0.0% |
| Total | 23 | 100.0% |
Employment Status by Age in Glendora
According to the labor force statistics for Glendora, out of the total population over 16 years of age (102), 75.5% or 77 individuals are in the labor force, with 70.1% or 54 of them unemployed. The age group with the highest labor force participation rate is 30 to 34 years, with 100.0% or 7 individuals in the labor force. Within the labor force, the 25 to 29 years age range has the highest percentage of unemployed individuals, with 100.0% or 30 of them being unemployed.
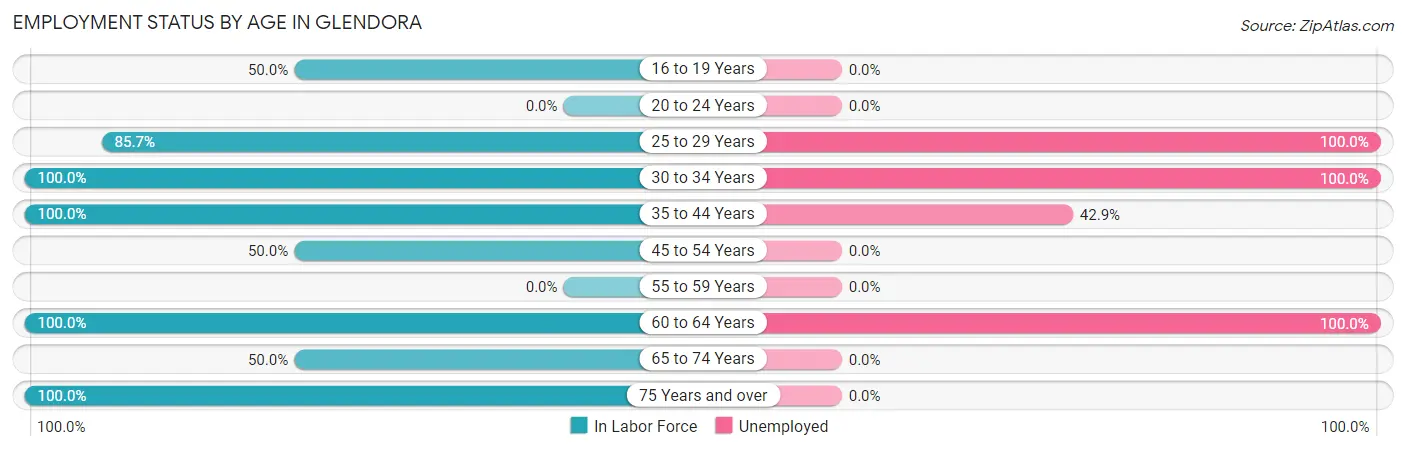
| Age Bracket | In Labor Force | Unemployed |
| 16 to 19 Years | 5 (50.0%) | 0 (0.0%) |
| 20 to 24 Years | 0 (0.0%) | 0 (0.0%) |
| 25 to 29 Years | 30 (85.7%) | 30 (100.0%) |
| 30 to 34 Years | 7 (100.0%) | 7 (100.0%) |
| 35 to 44 Years | 7 (100.0%) | 3 (42.9%) |
| 45 to 54 Years | 10 (50.0%) | 0 (0.0%) |
| 55 to 59 Years | 0 (0.0%) | 0 (0.0%) |
| 60 to 64 Years | 14 (100.0%) | 14 (100.0%) |
| 65 to 74 Years | 2 (50.0%) | 0 (0.0%) |
| 75 Years and over | 2 (100.0%) | 0 (0.0%) |
| Total | 77 (75.5%) | 54 (70.1%) |
Employment Status by Educational Attainment in Glendora
According to labor force statistics for Glendora, 79.1% of individuals (68) out of the total population between 25 and 64 years of age (86) are in the labor force, with 79.4% or 54 of them being unemployed. The group with the highest labor force participation rate are those with the educational attainment of college / associate degree, with 100.0% or 14 individuals in the labor force. Within the labor force, individuals with college / associate degree education have the highest percentage of unemployment, with 100.0% or 14 of them being unemployed.
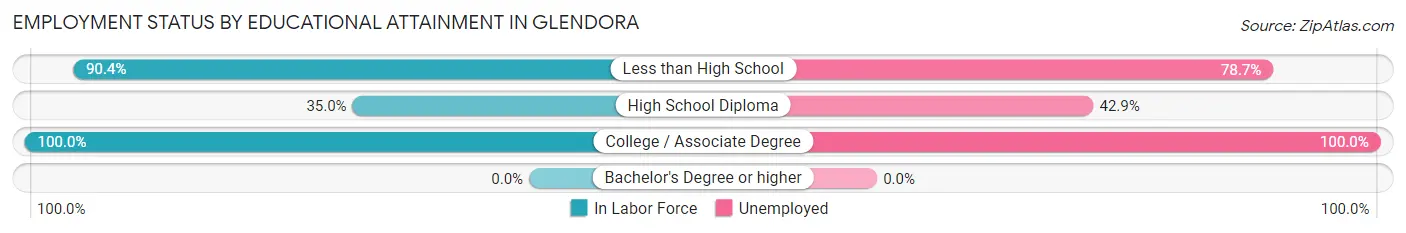
| Educational Attainment | In Labor Force | Unemployed |
| Less than High School | 47 (90.4%) | 41 (78.7%) |
| High School Diploma | 7 (35.0%) | 9 (42.9%) |
| College / Associate Degree | 14 (100.0%) | 14 (100.0%) |
| Bachelor's Degree or higher | 0 (0.0%) | 0 (0.0%) |
| Total | 68 (79.1%) | 68 (79.4%) |
Employment Occupations by Sex in Glendora
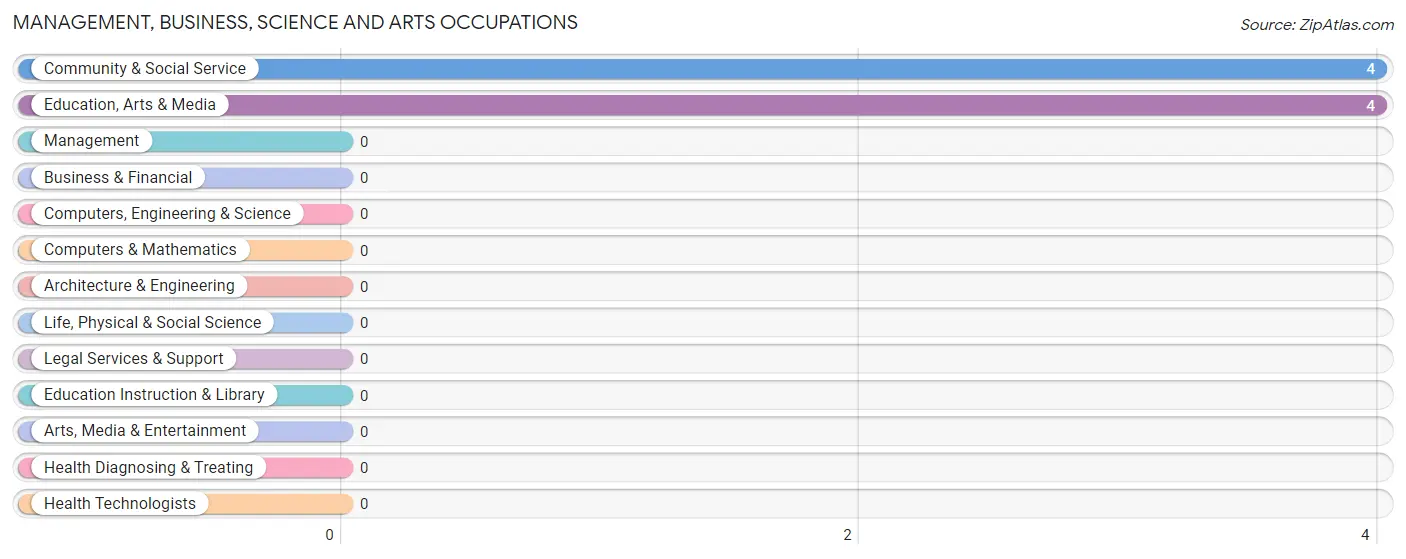
Management, Business, Science and Arts Occupations
The most common Management, Business, Science and Arts occupations in Glendora are Community & Social Service (4 | 17.4%), and Education, Arts & Media (4 | 17.4%).
Management, Business, Science and Arts Occupations by Sex
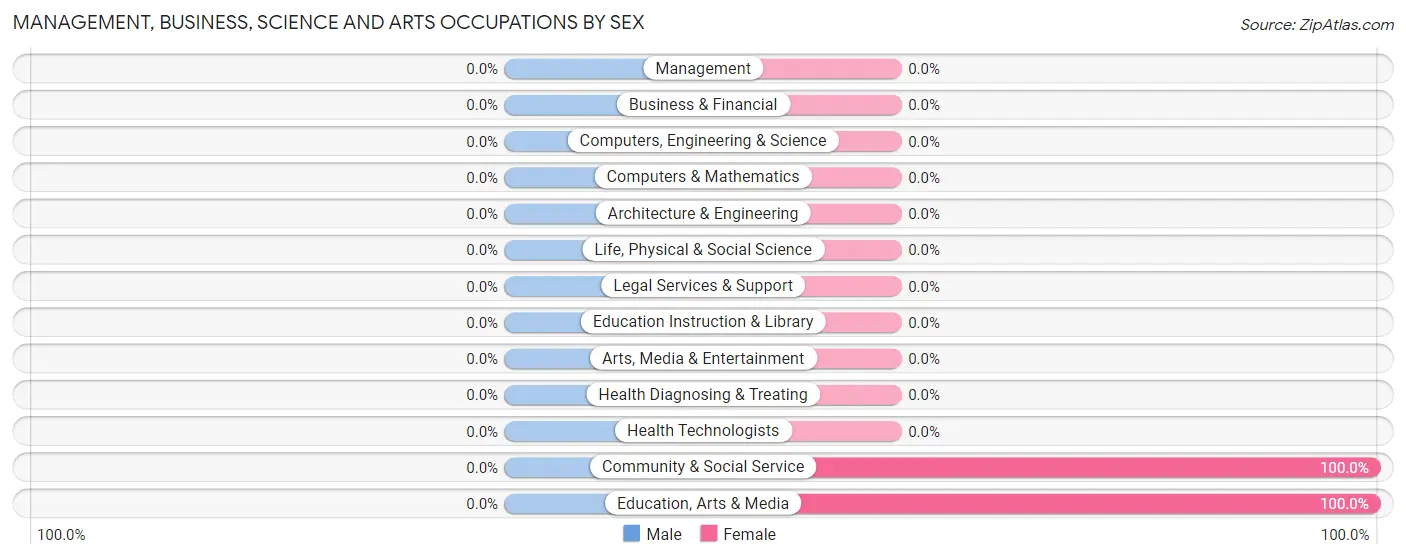
| Occupation | Male | Female |
| Management | 0 (0.0%) | 0 (0.0%) |
| Business & Financial | 0 (0.0%) | 0 (0.0%) |
| Computers, Engineering & Science | 0 (0.0%) | 0 (0.0%) |
| Computers & Mathematics | 0 (0.0%) | 0 (0.0%) |
| Architecture & Engineering | 0 (0.0%) | 0 (0.0%) |
| Life, Physical & Social Science | 0 (0.0%) | 0 (0.0%) |
| Community & Social Service | 0 (0.0%) | 4 (100.0%) |
| Education, Arts & Media | 0 (0.0%) | 4 (100.0%) |
| Legal Services & Support | 0 (0.0%) | 0 (0.0%) |
| Education Instruction & Library | 0 (0.0%) | 0 (0.0%) |
| Arts, Media & Entertainment | 0 (0.0%) | 0 (0.0%) |
| Health Diagnosing & Treating | 0 (0.0%) | 0 (0.0%) |
| Health Technologists | 0 (0.0%) | 0 (0.0%) |
| Total (Category) | 0 (0.0%) | 4 (100.0%) |
| Total (Overall) | 12 (52.2%) | 11 (47.8%) |
Services Occupations
The most common Services occupations in Glendora are , and Cleaning & Maintenance (10 | 43.5%).
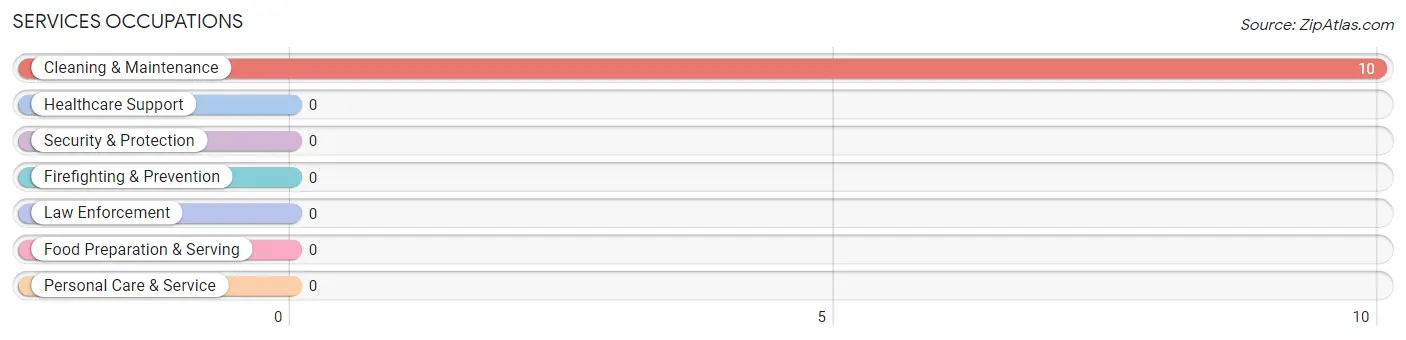
Services Occupations by Sex
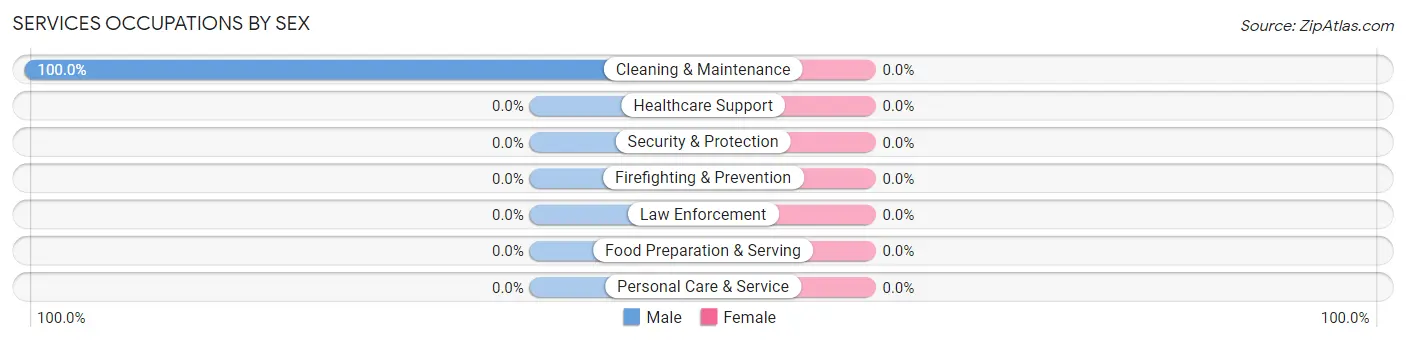
| Occupation | Male | Female |
| Healthcare Support | 0 (0.0%) | 0 (0.0%) |
| Security & Protection | 0 (0.0%) | 0 (0.0%) |
| Firefighting & Prevention | 0 (0.0%) | 0 (0.0%) |
| Law Enforcement | 0 (0.0%) | 0 (0.0%) |
| Food Preparation & Serving | 0 (0.0%) | 0 (0.0%) |
| Cleaning & Maintenance | 10 (100.0%) | 0 (0.0%) |
| Personal Care & Service | 0 (0.0%) | 0 (0.0%) |
| Total (Category) | 10 (100.0%) | 0 (0.0%) |
| Total (Overall) | 12 (52.2%) | 11 (47.8%) |
Sales and Office Occupations
The most common Sales and Office occupations in Glendora are , and Sales & Related (9 | 39.1%).
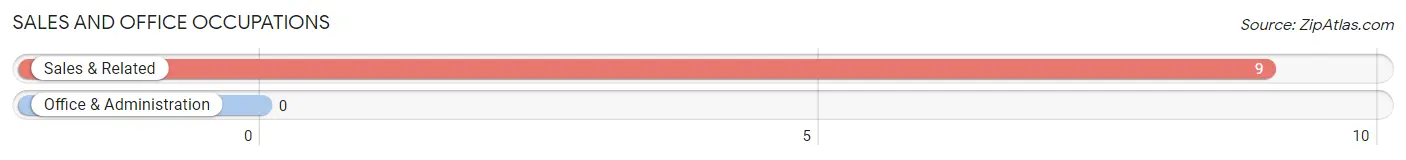
Sales and Office Occupations by Sex
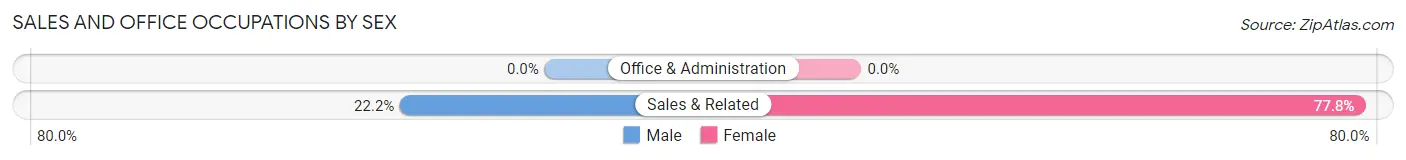
| Occupation | Male | Female |
| Sales & Related | 2 (22.2%) | 7 (77.8%) |
| Office & Administration | 0 (0.0%) | 0 (0.0%) |
| Total (Category) | 2 (22.2%) | 7 (77.8%) |
| Total (Overall) | 12 (52.2%) | 11 (47.8%) |
Natural Resources, Construction and Maintenance Occupations
Natural Resources, Construction and Maintenance Occupations by Sex
| Occupation | Male | Female |
| Farming, Fishing & Forestry | 0 (0.0%) | 0 (0.0%) |
| Construction & Extraction | 0 (0.0%) | 0 (0.0%) |
| Installation, Maintenance & Repair | 0 (0.0%) | 0 (0.0%) |
| Total (Category) | 0 (0.0%) | 0 (0.0%) |
| Total (Overall) | 12 (52.2%) | 11 (47.8%) |
Production, Transportation and Moving Occupations
Production, Transportation and Moving Occupations by Sex
| Occupation | Male | Female |
| Production | 0 (0.0%) | 0 (0.0%) |
| Transportation | 0 (0.0%) | 0 (0.0%) |
| Material Moving | 0 (0.0%) | 0 (0.0%) |
| Total (Category) | 0 (0.0%) | 0 (0.0%) |
| Total (Overall) | 12 (52.2%) | 11 (47.8%) |
Employment Industries by Sex in Glendora
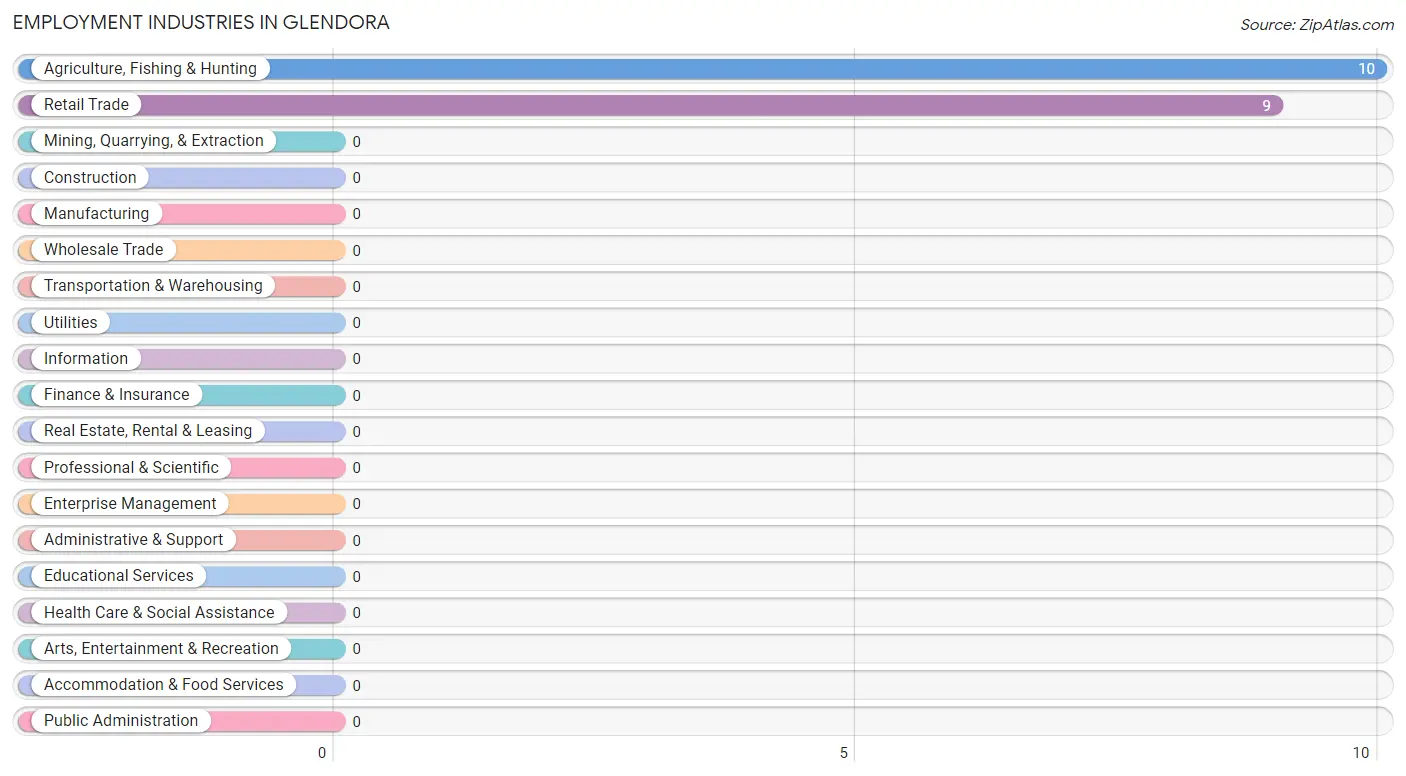
Employment Industries in Glendora
The major employment industries in Glendora include Agriculture, Fishing & Hunting (10 | 43.5%), and Retail Trade (9 | 39.1%).
Employment Industries by Sex in Glendora
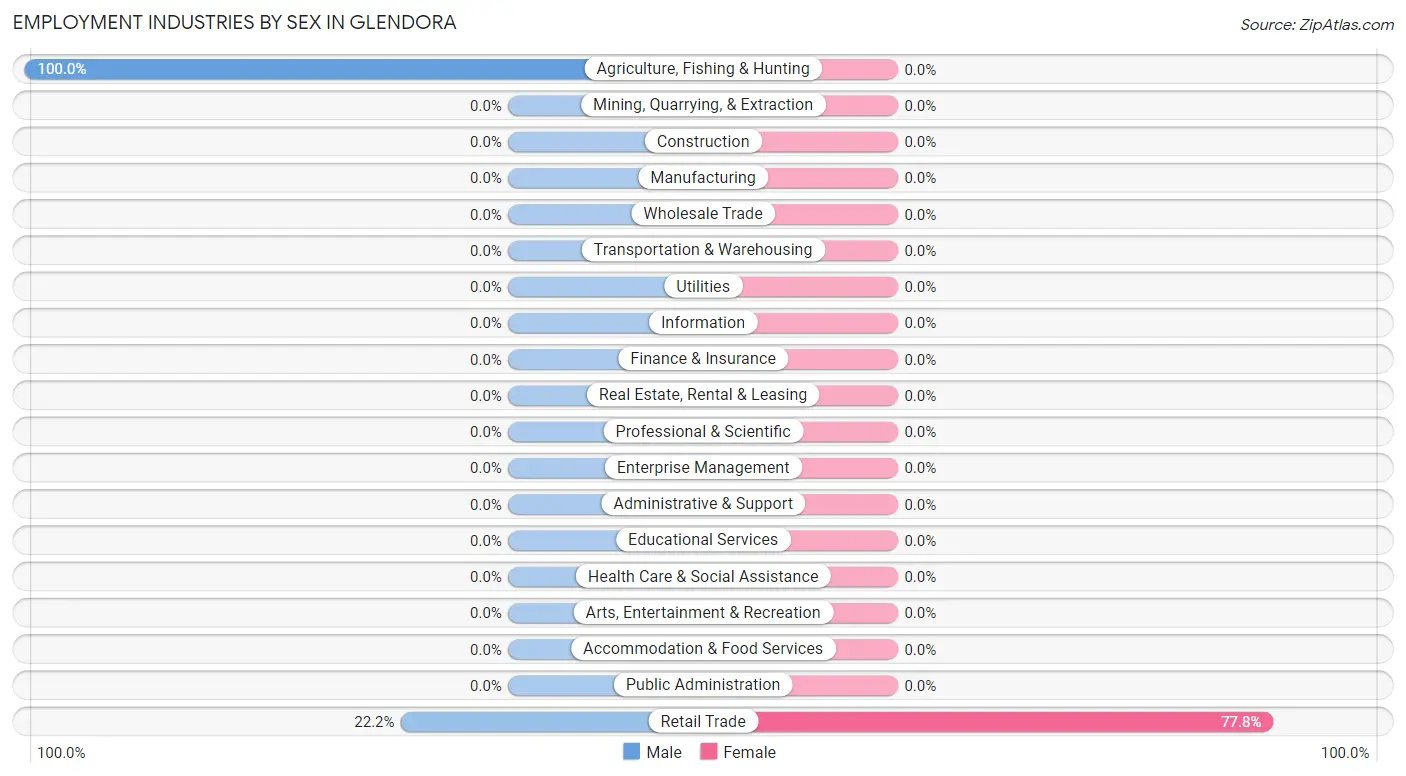
| Industry | Male | Female |
| Agriculture, Fishing & Hunting | 10 (100.0%) | 0 (0.0%) |
| Mining, Quarrying, & Extraction | 0 (0.0%) | 0 (0.0%) |
| Construction | 0 (0.0%) | 0 (0.0%) |
| Manufacturing | 0 (0.0%) | 0 (0.0%) |
| Wholesale Trade | 0 (0.0%) | 0 (0.0%) |
| Retail Trade | 2 (22.2%) | 7 (77.8%) |
| Transportation & Warehousing | 0 (0.0%) | 0 (0.0%) |
| Utilities | 0 (0.0%) | 0 (0.0%) |
| Information | 0 (0.0%) | 0 (0.0%) |
| Finance & Insurance | 0 (0.0%) | 0 (0.0%) |
| Real Estate, Rental & Leasing | 0 (0.0%) | 0 (0.0%) |
| Professional & Scientific | 0 (0.0%) | 0 (0.0%) |
| Enterprise Management | 0 (0.0%) | 0 (0.0%) |
| Administrative & Support | 0 (0.0%) | 0 (0.0%) |
| Educational Services | 0 (0.0%) | 0 (0.0%) |
| Health Care & Social Assistance | 0 (0.0%) | 0 (0.0%) |
| Arts, Entertainment & Recreation | 0 (0.0%) | 0 (0.0%) |
| Accommodation & Food Services | 0 (0.0%) | 0 (0.0%) |
| Public Administration | 0 (0.0%) | 0 (0.0%) |
| Total | 12 (52.2%) | 11 (47.8%) |
Education in Glendora
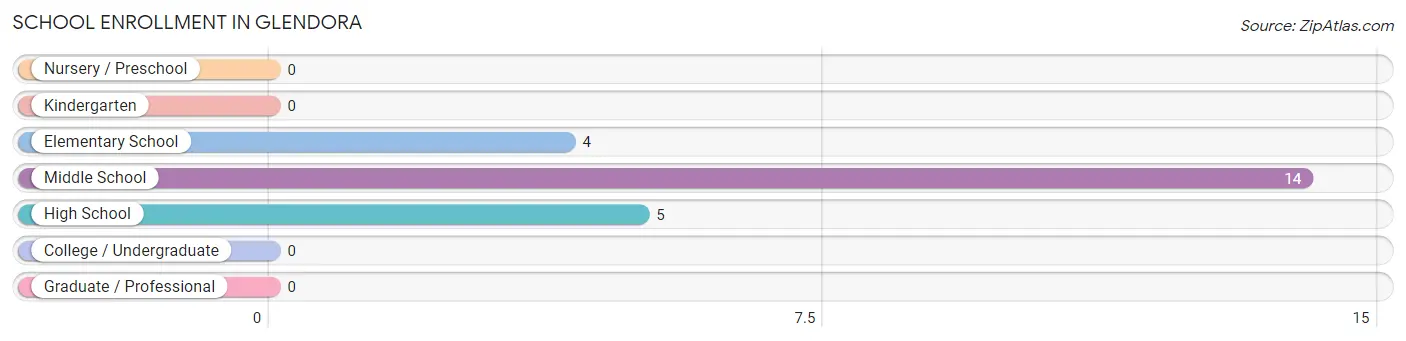
School Enrollment in Glendora
The most common levels of schooling among the 23 students in Glendora are middle school (14 | 60.9%), high school (5 | 21.7%), and elementary school (4 | 17.4%).
| School Level | # Students | % Students |
| Nursery / Preschool | 0 | 0.0% |
| Kindergarten | 0 | 0.0% |
| Elementary School | 4 | 17.4% |
| Middle School | 14 | 60.9% |
| High School | 5 | 21.7% |
| College / Undergraduate | 0 | 0.0% |
| Graduate / Professional | 0 | 0.0% |
| Total | 23 | 100.0% |
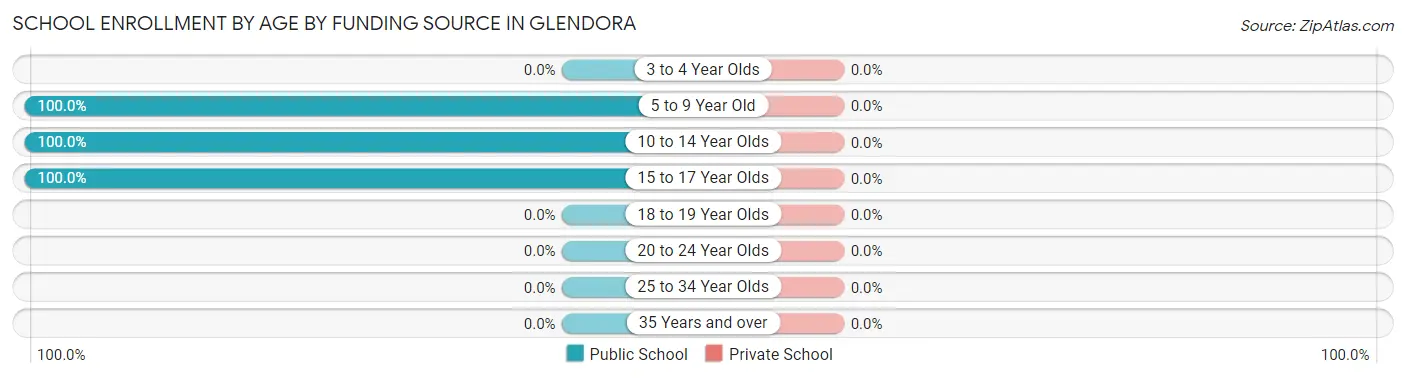
School Enrollment by Age by Funding Source in Glendora
| Age Bracket | Public School | Private School |
| 3 to 4 Year Olds | 0 (0.0%) | 0 (0.0%) |
| 5 to 9 Year Old | 4 (100.0%) | 0 (0.0%) |
| 10 to 14 Year Olds | 14 (100.0%) | 0 (0.0%) |
| 15 to 17 Year Olds | 5 (100.0%) | 0 (0.0%) |
| 18 to 19 Year Olds | 0 (0.0%) | 0 (0.0%) |
| 20 to 24 Year Olds | 0 (0.0%) | 0 (0.0%) |
| 25 to 34 Year Olds | 0 (0.0%) | 0 (0.0%) |
| 35 Years and over | 0 (0.0%) | 0 (0.0%) |
| Total | 23 (100.0%) | 0 (0.0%) |
Educational Attainment by Field of Study in Glendora
| Field of Study | # Graduates | % Graduates |
| Computers & Mathematics | 0 | 0.0% |
| Bio, Nature & Agricultural | 0 | 0.0% |
| Physical & Health Sciences | 0 | 0.0% |
| Psychology | 0 | 0.0% |
| Social Sciences | 0 | 0.0% |
| Engineering | 0 | 0.0% |
| Multidisciplinary Studies | 0 | 0.0% |
| Science & Technology | 0 | 0.0% |
| Business | 0 | 0.0% |
| Education | 0 | 0.0% |
| Literature & Languages | 0 | 0.0% |
| Liberal Arts & History | 0 | 0.0% |
| Visual & Performing Arts | 0 | 0.0% |
| Communications | 0 | 0.0% |
| Arts & Humanities | 0 | 0.0% |
| Total | 0 | 0.0% |
Transportation & Commute in Glendora
Vehicle Availability by Sex in Glendora
The most prevalent vehicle ownership categories in Glendora are males with no vehicle (10, accounting for 83.3%) and females with no vehicle (5, making up 90.9%).
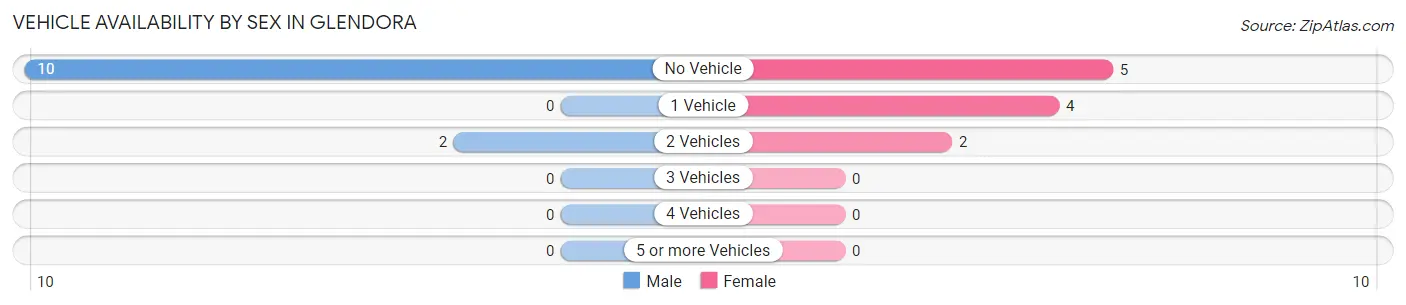
| Vehicles Available | Male | Female |
| No Vehicle | 10 (83.3%) | 5 (45.5%) |
| 1 Vehicle | 0 (0.0%) | 4 (36.4%) |
| 2 Vehicles | 2 (16.7%) | 2 (18.2%) |
| 3 Vehicles | 0 (0.0%) | 0 (0.0%) |
| 4 Vehicles | 0 (0.0%) | 0 (0.0%) |
| 5 or more Vehicles | 0 (0.0%) | 0 (0.0%) |
| Total | 12 (100.0%) | 11 (100.0%) |
Commute Time in Glendora
The most frequently occuring commute durations in Glendora are 15 to 19 minutes (14 commuters, 60.9%), 20 to 24 minutes (5 commuters, 21.7%), and less than 5 minutes (4 commuters, 17.4%).
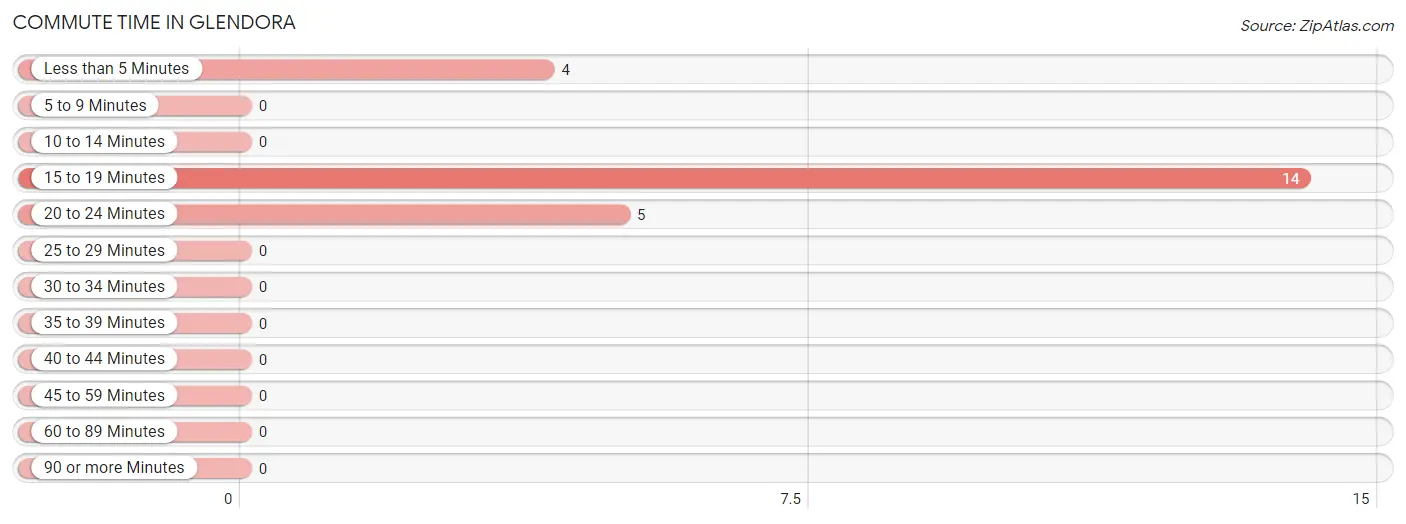
| Commute Time | # Commuters | % Commuters |
| Less than 5 Minutes | 4 | 17.4% |
| 5 to 9 Minutes | 0 | 0.0% |
| 10 to 14 Minutes | 0 | 0.0% |
| 15 to 19 Minutes | 14 | 60.9% |
| 20 to 24 Minutes | 5 | 21.7% |
| 25 to 29 Minutes | 0 | 0.0% |
| 30 to 34 Minutes | 0 | 0.0% |
| 35 to 39 Minutes | 0 | 0.0% |
| 40 to 44 Minutes | 0 | 0.0% |
| 45 to 59 Minutes | 0 | 0.0% |
| 60 to 89 Minutes | 0 | 0.0% |
| 90 or more Minutes | 0 | 0.0% |
Commute Time by Sex in Glendora
The most common commute times in Glendora are 15 to 19 minutes (10 commuters, 83.3%) for males and 20 to 24 minutes (5 commuters, 45.5%) for females.
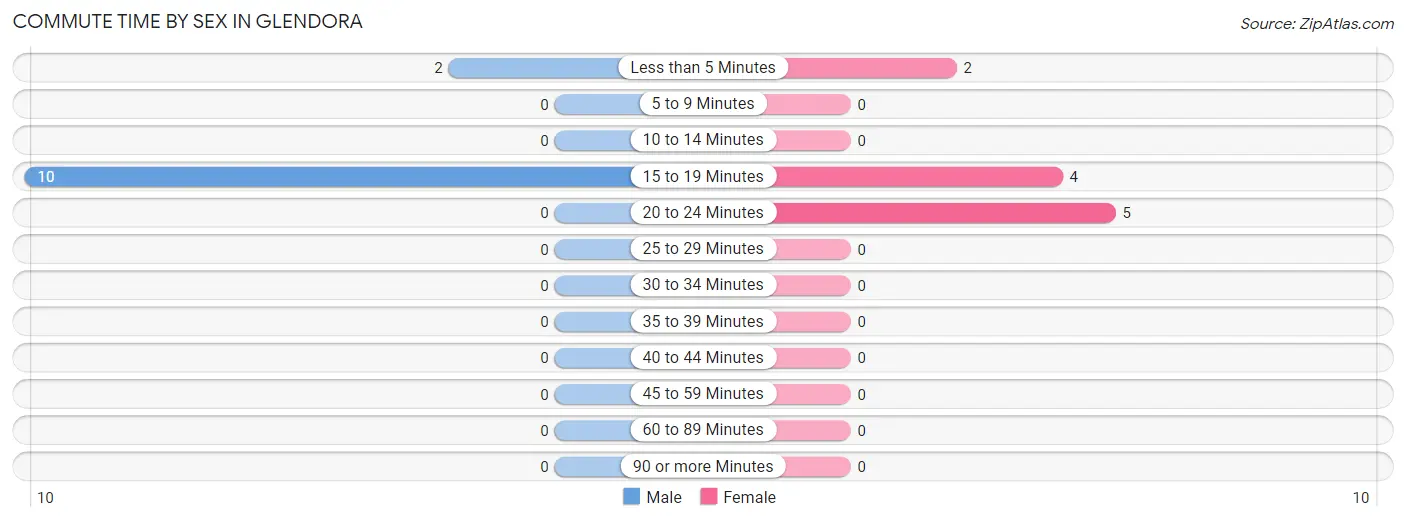
| Commute Time | Male | Female |
| Less than 5 Minutes | 2 (16.7%) | 2 (18.2%) |
| 5 to 9 Minutes | 0 (0.0%) | 0 (0.0%) |
| 10 to 14 Minutes | 0 (0.0%) | 0 (0.0%) |
| 15 to 19 Minutes | 10 (83.3%) | 4 (36.4%) |
| 20 to 24 Minutes | 0 (0.0%) | 5 (45.5%) |
| 25 to 29 Minutes | 0 (0.0%) | 0 (0.0%) |
| 30 to 34 Minutes | 0 (0.0%) | 0 (0.0%) |
| 35 to 39 Minutes | 0 (0.0%) | 0 (0.0%) |
| 40 to 44 Minutes | 0 (0.0%) | 0 (0.0%) |
| 45 to 59 Minutes | 0 (0.0%) | 0 (0.0%) |
| 60 to 89 Minutes | 0 (0.0%) | 0 (0.0%) |
| 90 or more Minutes | 0 (0.0%) | 0 (0.0%) |
Time of Departure to Work by Sex in Glendora
The most frequent times of departure to work in Glendora are 7:30 AM to 7:59 AM (10, 83.3%) for males and 11:00 AM to 11:59 AM (5, 45.5%) for females.
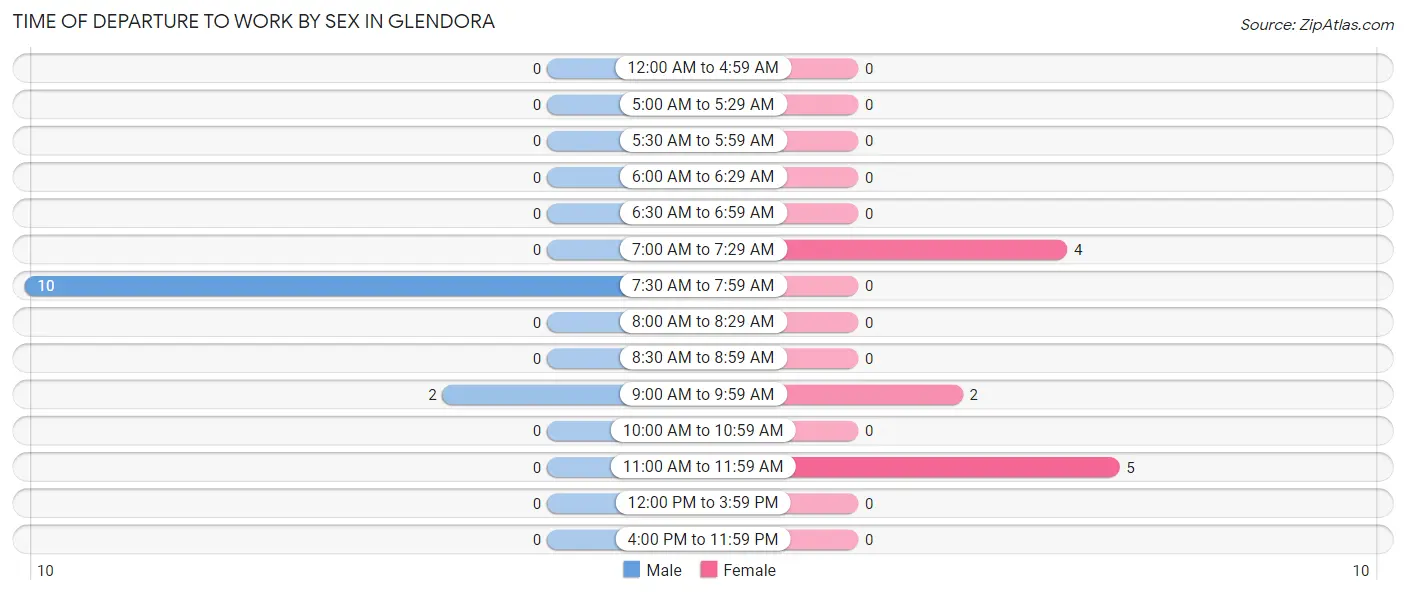
| Time of Departure | Male | Female |
| 12:00 AM to 4:59 AM | 0 (0.0%) | 0 (0.0%) |
| 5:00 AM to 5:29 AM | 0 (0.0%) | 0 (0.0%) |
| 5:30 AM to 5:59 AM | 0 (0.0%) | 0 (0.0%) |
| 6:00 AM to 6:29 AM | 0 (0.0%) | 0 (0.0%) |
| 6:30 AM to 6:59 AM | 0 (0.0%) | 0 (0.0%) |
| 7:00 AM to 7:29 AM | 0 (0.0%) | 4 (36.4%) |
| 7:30 AM to 7:59 AM | 10 (83.3%) | 0 (0.0%) |
| 8:00 AM to 8:29 AM | 0 (0.0%) | 0 (0.0%) |
| 8:30 AM to 8:59 AM | 0 (0.0%) | 0 (0.0%) |
| 9:00 AM to 9:59 AM | 2 (16.7%) | 2 (18.2%) |
| 10:00 AM to 10:59 AM | 0 (0.0%) | 0 (0.0%) |
| 11:00 AM to 11:59 AM | 0 (0.0%) | 5 (45.5%) |
| 12:00 PM to 3:59 PM | 0 (0.0%) | 0 (0.0%) |
| 4:00 PM to 11:59 PM | 0 (0.0%) | 0 (0.0%) |
| Total | 12 (100.0%) | 11 (100.0%) |
Housing Occupancy in Glendora
Occupancy by Ownership in Glendora
Of the total 53 dwellings in Glendora, owner-occupied units account for 5 (9.4%), while renter-occupied units make up 48 (90.6%).
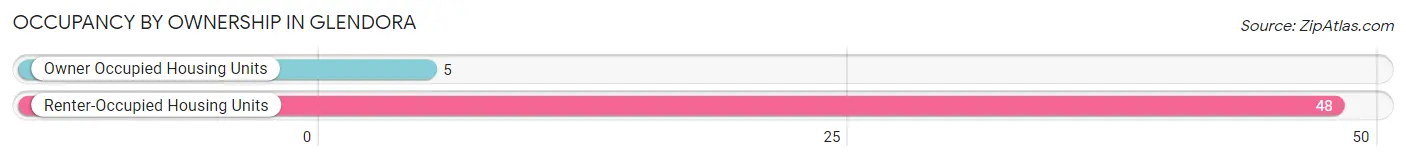
| Occupancy | # Housing Units | % Housing Units |
| Owner Occupied Housing Units | 5 | 9.4% |
| Renter-Occupied Housing Units | 48 | 90.6% |
| Total Occupied Housing Units | 53 | 100.0% |
Occupancy by Household Size in Glendora
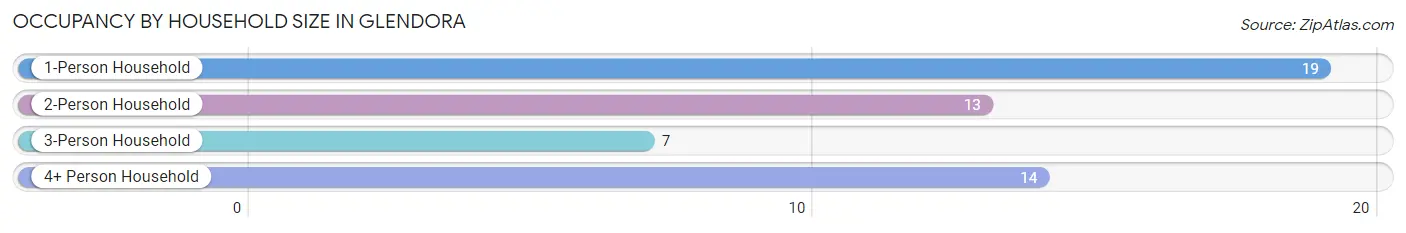
| Household Size | # Housing Units | % Housing Units |
| 1-Person Household | 19 | 35.8% |
| 2-Person Household | 13 | 24.5% |
| 3-Person Household | 7 | 13.2% |
| 4+ Person Household | 14 | 26.4% |
| Total Housing Units | 53 | 100.0% |
Occupancy by Ownership by Household Size in Glendora
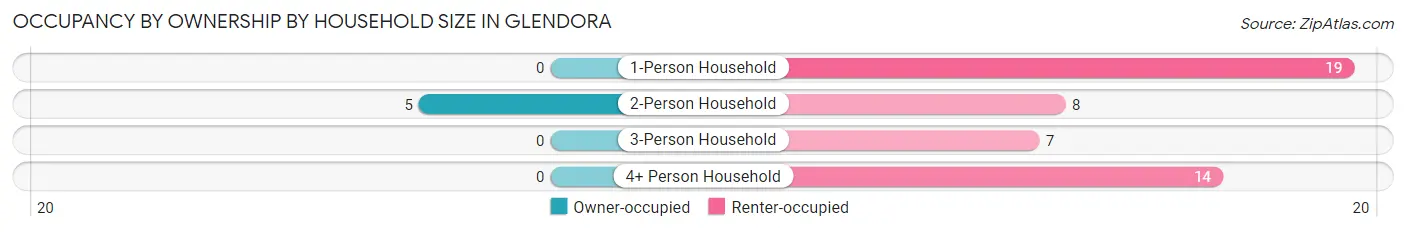
| Household Size | Owner-occupied | Renter-occupied |
| 1-Person Household | 0 (0.0%) | 19 (100.0%) |
| 2-Person Household | 5 (38.5%) | 8 (61.5%) |
| 3-Person Household | 0 (0.0%) | 7 (100.0%) |
| 4+ Person Household | 0 (0.0%) | 14 (100.0%) |
| Total Housing Units | 5 (9.4%) | 48 (90.6%) |
Occupancy by Educational Attainment in Glendora
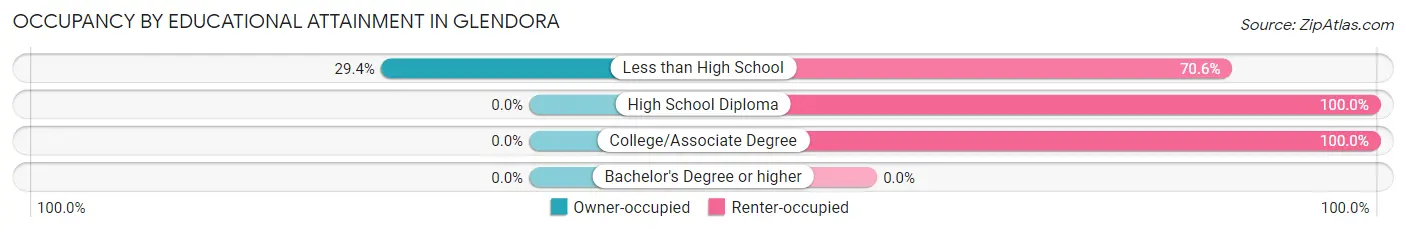
| Household Size | Owner-occupied | Renter-occupied |
| Less than High School | 5 (29.4%) | 12 (70.6%) |
| High School Diploma | 0 (0.0%) | 20 (100.0%) |
| College/Associate Degree | 0 (0.0%) | 16 (100.0%) |
| Bachelor's Degree or higher | 0 (0.0%) | 0 (0.0%) |
Occupancy by Age of Householder in Glendora
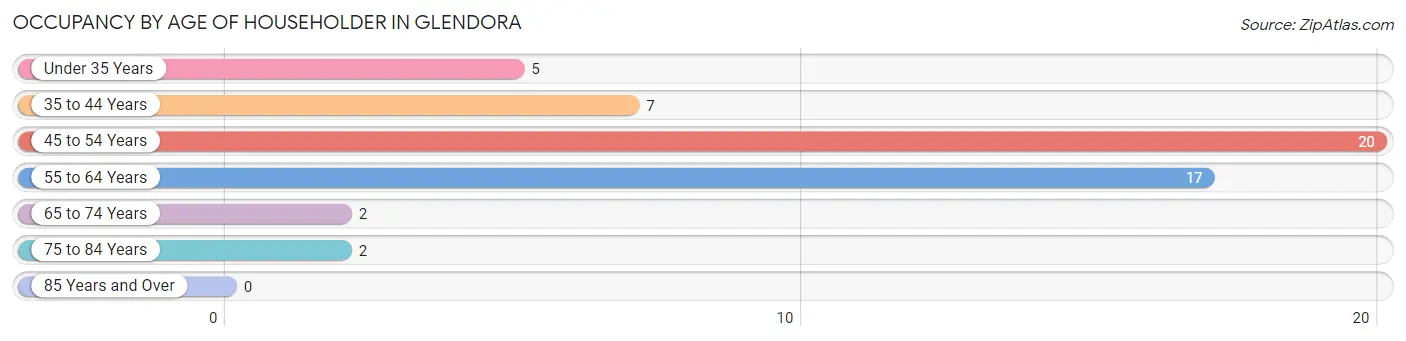
| Age Bracket | # Households | % Households |
| Under 35 Years | 5 | 9.4% |
| 35 to 44 Years | 7 | 13.2% |
| 45 to 54 Years | 20 | 37.7% |
| 55 to 64 Years | 17 | 32.1% |
| 65 to 74 Years | 2 | 3.8% |
| 75 to 84 Years | 2 | 3.8% |
| 85 Years and Over | 0 | 0.0% |
| Total | 53 | 100.0% |
Housing Finances in Glendora
Median Income by Occupancy in Glendora
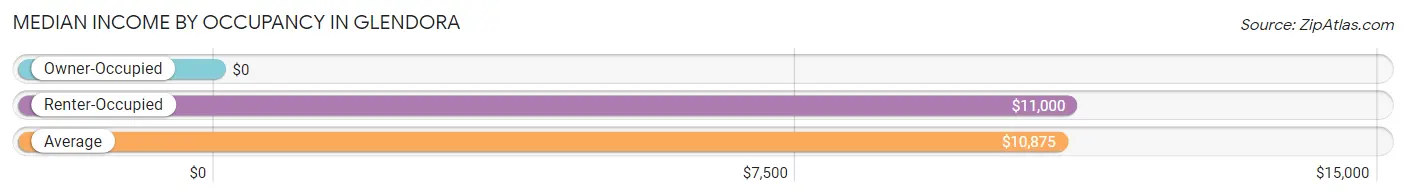
| Occupancy Type | # Households | Median Income |
| Owner-Occupied | 5 (9.4%) | $0 |
| Renter-Occupied | 48 (90.6%) | $11,000 |
| Average | 53 (100.0%) | $10,875 |
Occupancy by Householder Income Bracket in Glendora
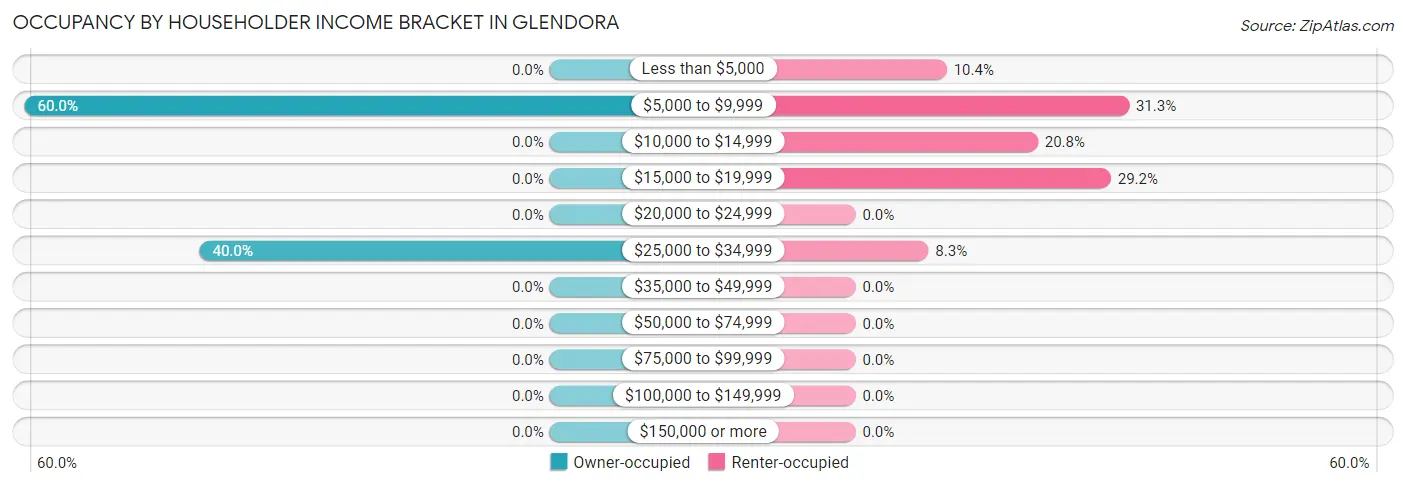
| Income Bracket | Owner-occupied | Renter-occupied |
| Less than $5,000 | 0 (0.0%) | 5 (10.4%) |
| $5,000 to $9,999 | 3 (60.0%) | 15 (31.2%) |
| $10,000 to $14,999 | 0 (0.0%) | 10 (20.8%) |
| $15,000 to $19,999 | 0 (0.0%) | 14 (29.2%) |
| $20,000 to $24,999 | 0 (0.0%) | 0 (0.0%) |
| $25,000 to $34,999 | 2 (40.0%) | 4 (8.3%) |
| $35,000 to $49,999 | 0 (0.0%) | 0 (0.0%) |
| $50,000 to $74,999 | 0 (0.0%) | 0 (0.0%) |
| $75,000 to $99,999 | 0 (0.0%) | 0 (0.0%) |
| $100,000 to $149,999 | 0 (0.0%) | 0 (0.0%) |
| $150,000 or more | 0 (0.0%) | 0 (0.0%) |
| Total | 5 (100.0%) | 48 (100.0%) |
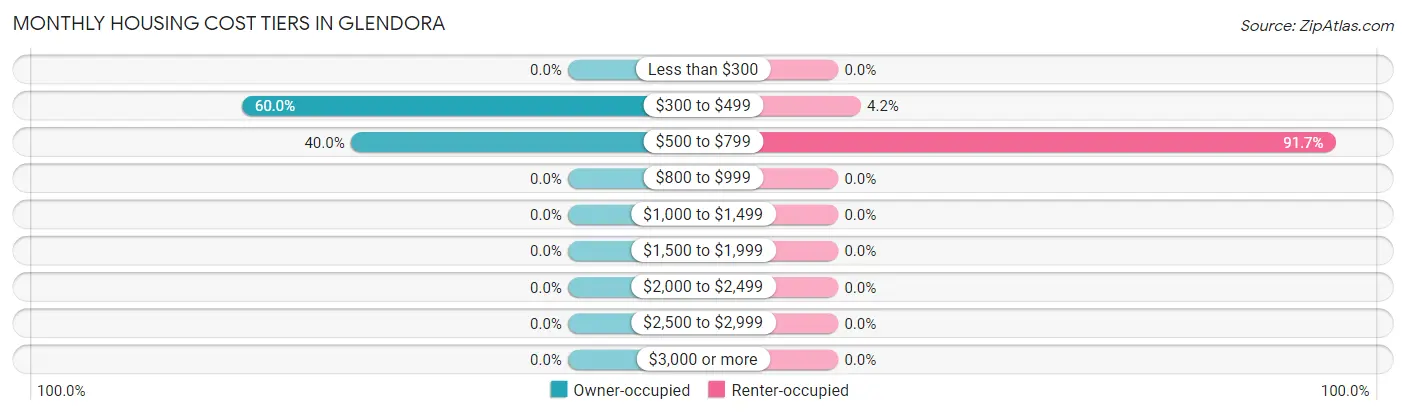
Monthly Housing Cost Tiers in Glendora
| Monthly Cost | Owner-occupied | Renter-occupied |
| Less than $300 | 0 (0.0%) | 0 (0.0%) |
| $300 to $499 | 3 (60.0%) | 2 (4.2%) |
| $500 to $799 | 2 (40.0%) | 44 (91.7%) |
| $800 to $999 | 0 (0.0%) | 0 (0.0%) |
| $1,000 to $1,499 | 0 (0.0%) | 0 (0.0%) |
| $1,500 to $1,999 | 0 (0.0%) | 0 (0.0%) |
| $2,000 to $2,499 | 0 (0.0%) | 0 (0.0%) |
| $2,500 to $2,999 | 0 (0.0%) | 0 (0.0%) |
| $3,000 or more | 0 (0.0%) | 0 (0.0%) |
| Total | 5 (100.0%) | 48 (100.0%) |
Physical Housing Characteristics in Glendora
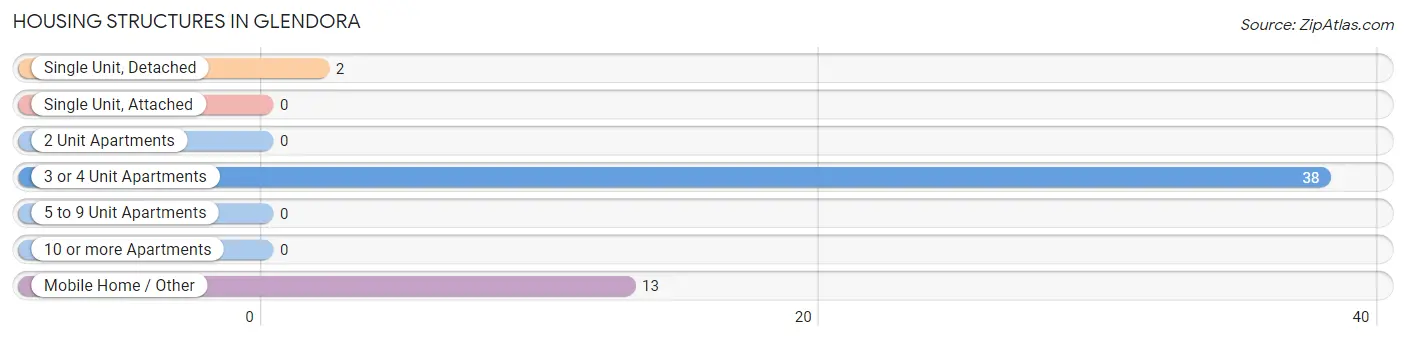
Housing Structures in Glendora
| Structure Type | # Housing Units | % Housing Units |
| Single Unit, Detached | 2 | 3.8% |
| Single Unit, Attached | 0 | 0.0% |
| 2 Unit Apartments | 0 | 0.0% |
| 3 or 4 Unit Apartments | 38 | 71.7% |
| 5 to 9 Unit Apartments | 0 | 0.0% |
| 10 or more Apartments | 0 | 0.0% |
| Mobile Home / Other | 13 | 24.5% |
| Total | 53 | 100.0% |
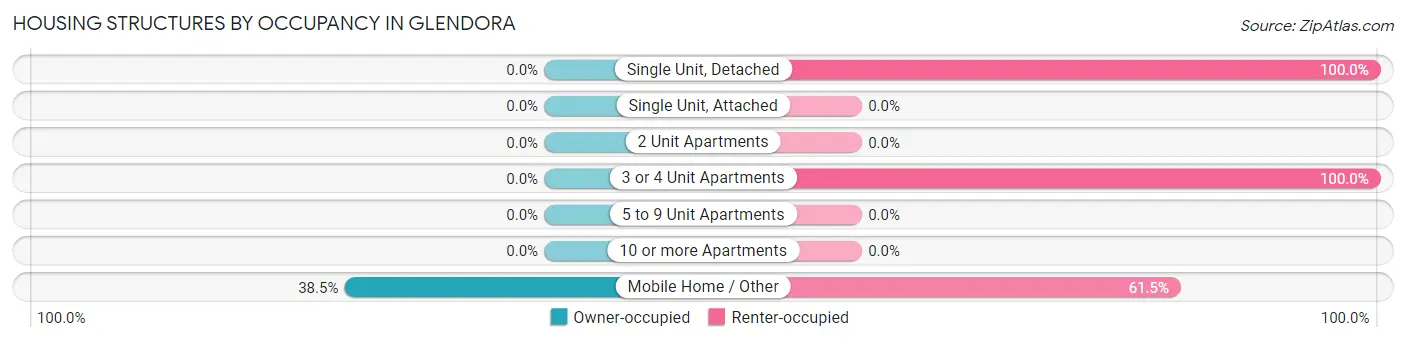
Housing Structures by Occupancy in Glendora
| Structure Type | Owner-occupied | Renter-occupied |
| Single Unit, Detached | 0 (0.0%) | 2 (100.0%) |
| Single Unit, Attached | 0 (0.0%) | 0 (0.0%) |
| 2 Unit Apartments | 0 (0.0%) | 0 (0.0%) |
| 3 or 4 Unit Apartments | 0 (0.0%) | 38 (100.0%) |
| 5 to 9 Unit Apartments | 0 (0.0%) | 0 (0.0%) |
| 10 or more Apartments | 0 (0.0%) | 0 (0.0%) |
| Mobile Home / Other | 5 (38.5%) | 8 (61.5%) |
| Total | 5 (9.4%) | 48 (90.6%) |
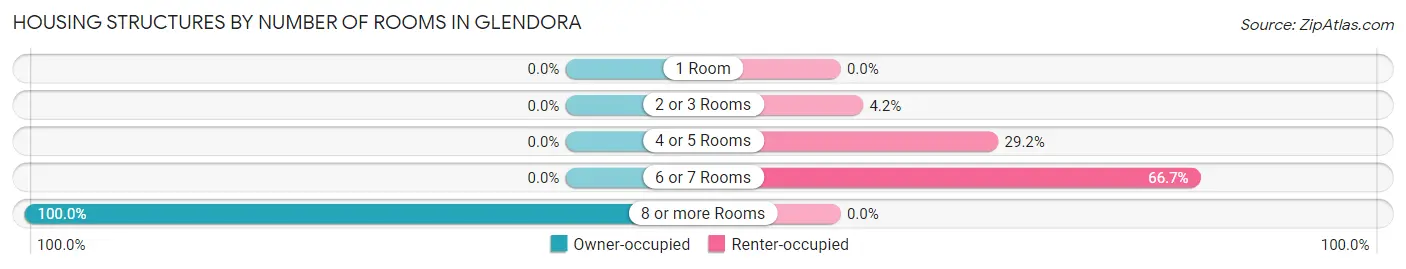
Housing Structures by Number of Rooms in Glendora
| Number of Rooms | Owner-occupied | Renter-occupied |
| 1 Room | 0 (0.0%) | 0 (0.0%) |
| 2 or 3 Rooms | 0 (0.0%) | 2 (4.2%) |
| 4 or 5 Rooms | 0 (0.0%) | 14 (29.2%) |
| 6 or 7 Rooms | 0 (0.0%) | 32 (66.7%) |
| 8 or more Rooms | 5 (100.0%) | 0 (0.0%) |
| Total | 5 (100.0%) | 48 (100.0%) |
Housing Structure by Heating Type in Glendora
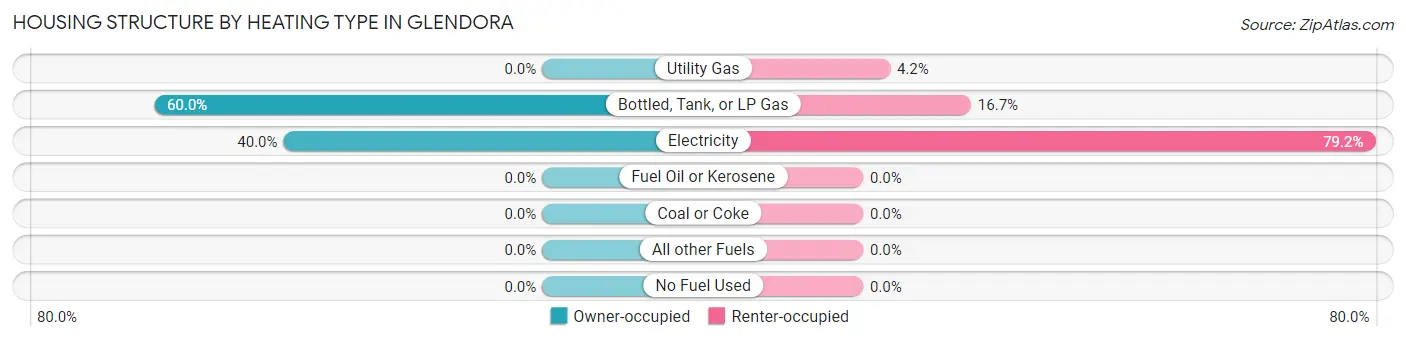
| Heating Type | Owner-occupied | Renter-occupied |
| Utility Gas | 0 (0.0%) | 2 (4.2%) |
| Bottled, Tank, or LP Gas | 3 (60.0%) | 8 (16.7%) |
| Electricity | 2 (40.0%) | 38 (79.2%) |
| Fuel Oil or Kerosene | 0 (0.0%) | 0 (0.0%) |
| Coal or Coke | 0 (0.0%) | 0 (0.0%) |
| All other Fuels | 0 (0.0%) | 0 (0.0%) |
| No Fuel Used | 0 (0.0%) | 0 (0.0%) |
| Total | 5 (100.0%) | 48 (100.0%) |
Household Vehicle Usage in Glendora
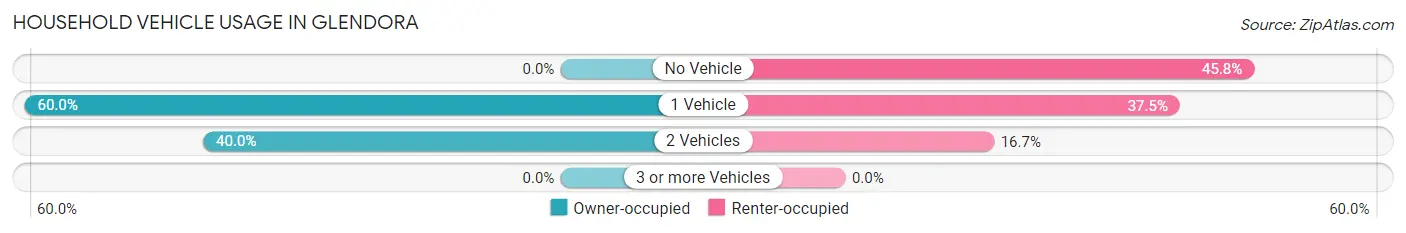
| Vehicles per Household | Owner-occupied | Renter-occupied |
| No Vehicle | 0 (0.0%) | 22 (45.8%) |
| 1 Vehicle | 3 (60.0%) | 18 (37.5%) |
| 2 Vehicles | 2 (40.0%) | 8 (16.7%) |
| 3 or more Vehicles | 0 (0.0%) | 0 (0.0%) |
| Total | 5 (100.0%) | 48 (100.0%) |
Real Estate & Mortgages in Glendora
Real Estate and Mortgage Overview in Glendora
| Characteristic | Without Mortgage | With Mortgage |
| Housing Units | 3 | 2 |
| Median Property Value | - | - |
| Median Household Income | - | - |
| Monthly Housing Costs | - | - |
| Real Estate Taxes | - | - |
Property Value by Mortgage Status in Glendora
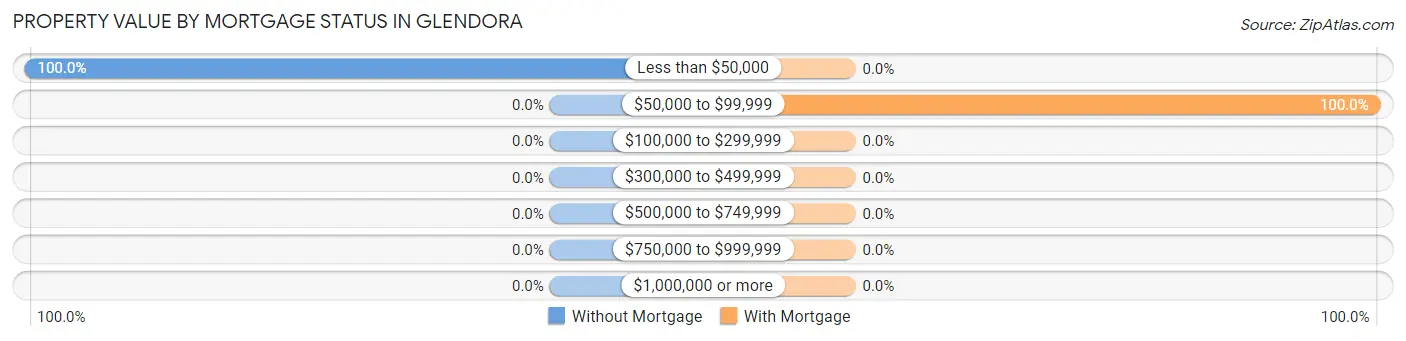
| Property Value | Without Mortgage | With Mortgage |
| Less than $50,000 | 3 (100.0%) | 0 (0.0%) |
| $50,000 to $99,999 | 0 (0.0%) | 2 (100.0%) |
| $100,000 to $299,999 | 0 (0.0%) | 0 (0.0%) |
| $300,000 to $499,999 | 0 (0.0%) | 0 (0.0%) |
| $500,000 to $749,999 | 0 (0.0%) | 0 (0.0%) |
| $750,000 to $999,999 | 0 (0.0%) | 0 (0.0%) |
| $1,000,000 or more | 0 (0.0%) | 0 (0.0%) |
| Total | 3 (100.0%) | 2 (100.0%) |
Household Income by Mortgage Status in Glendora
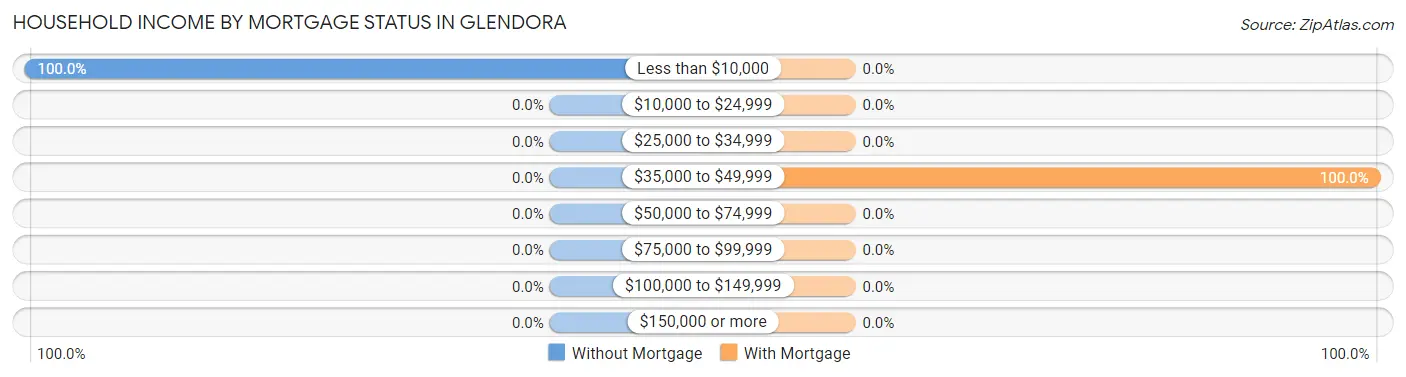
| Household Income | Without Mortgage | With Mortgage |
| Less than $10,000 | 3 (100.0%) | 0 (0.0%) |
| $10,000 to $24,999 | 0 (0.0%) | 0 (0.0%) |
| $25,000 to $34,999 | 0 (0.0%) | 0 (0.0%) |
| $35,000 to $49,999 | 0 (0.0%) | 2 (100.0%) |
| $50,000 to $74,999 | 0 (0.0%) | 0 (0.0%) |
| $75,000 to $99,999 | 0 (0.0%) | 0 (0.0%) |
| $100,000 to $149,999 | 0 (0.0%) | 0 (0.0%) |
| $150,000 or more | 0 (0.0%) | 0 (0.0%) |
| Total | 3 (100.0%) | 2 (100.0%) |
Property Value to Household Income Ratio in Glendora
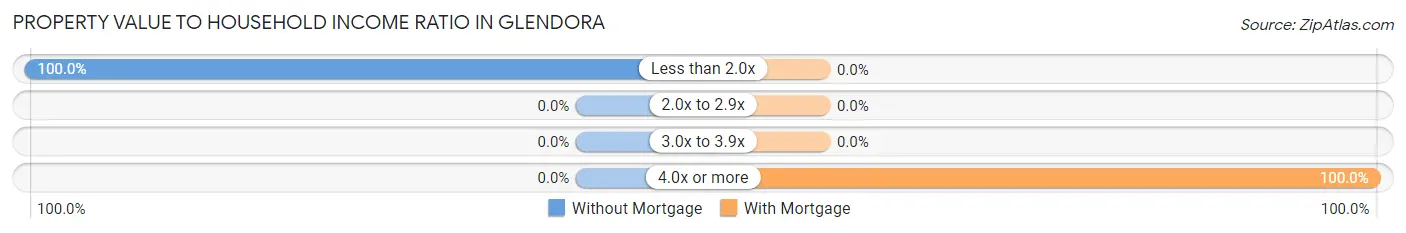
| Value-to-Income Ratio | Without Mortgage | With Mortgage |
| Less than 2.0x | 3 (100.0%) | 0 (0.0%) |
| 2.0x to 2.9x | 0 (0.0%) | 0 (0.0%) |
| 3.0x to 3.9x | 0 (0.0%) | 0 (0.0%) |
| 4.0x or more | 0 (0.0%) | 2 (100.0%) |
| Total | 3 (100.0%) | 2 (100.0%) |
Real Estate Taxes by Mortgage Status in Glendora
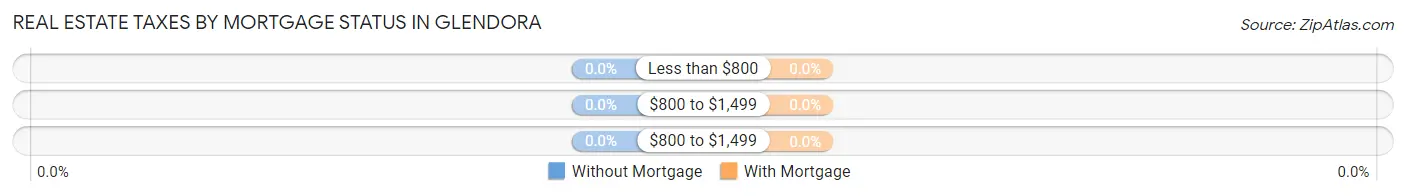
| Property Taxes | Without Mortgage | With Mortgage |
| Less than $800 | 0 (0.0%) | 0 (0.0%) |
| $800 to $1,499 | 0 (0.0%) | 0 (0.0%) |
| $800 to $1,499 | 0 (0.0%) | 0 (0.0%) |
| Total | 3 (100.0%) | 2 (100.0%) |
Health & Disability in Glendora
Health Insurance Coverage by Age in Glendora
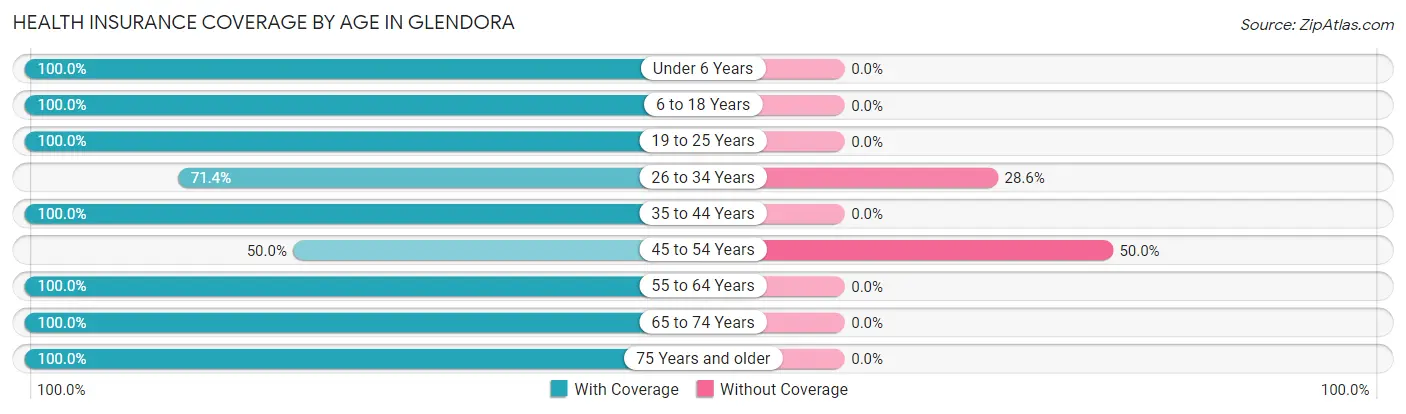
| Age Bracket | With Coverage | Without Coverage |
| Under 6 Years | 22 (100.0%) | 0 (0.0%) |
| 6 to 18 Years | 23 (100.0%) | 0 (0.0%) |
| 19 to 25 Years | 5 (100.0%) | 0 (0.0%) |
| 26 to 34 Years | 30 (71.4%) | 12 (28.6%) |
| 35 to 44 Years | 7 (100.0%) | 0 (0.0%) |
| 45 to 54 Years | 10 (50.0%) | 10 (50.0%) |
| 55 to 64 Years | 17 (100.0%) | 0 (0.0%) |
| 65 to 74 Years | 4 (100.0%) | 0 (0.0%) |
| 75 Years and older | 2 (100.0%) | 0 (0.0%) |
| Total | 120 (84.5%) | 22 (15.5%) |
Health Insurance Coverage by Citizenship Status in Glendora
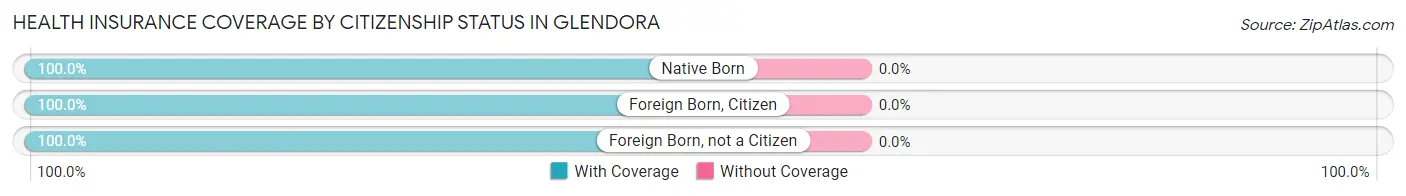
| Citizenship Status | With Coverage | Without Coverage |
| Native Born | 22 (100.0%) | 0 (0.0%) |
| Foreign Born, Citizen | 23 (100.0%) | 0 (0.0%) |
| Foreign Born, not a Citizen | 5 (100.0%) | 0 (0.0%) |
Health Insurance Coverage by Household Income in Glendora
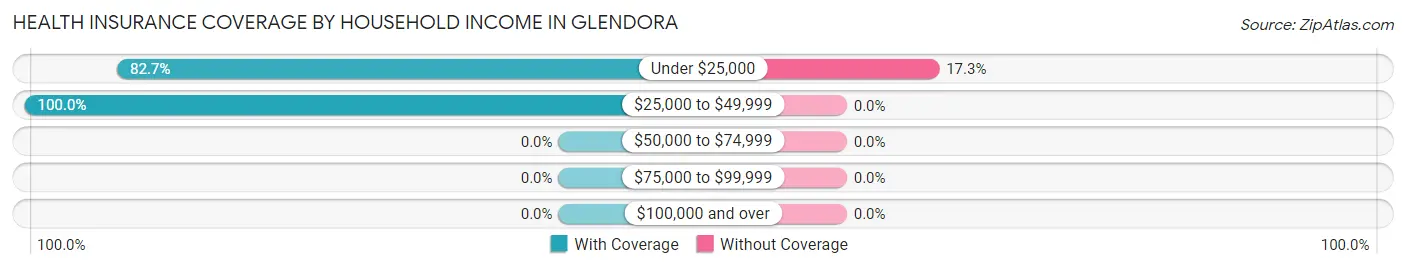
| Household Income | With Coverage | Without Coverage |
| Under $25,000 | 105 (82.7%) | 22 (17.3%) |
| $25,000 to $49,999 | 15 (100.0%) | 0 (0.0%) |
| $50,000 to $74,999 | 0 (0.0%) | 0 (0.0%) |
| $75,000 to $99,999 | 0 (0.0%) | 0 (0.0%) |
| $100,000 and over | 0 (0.0%) | 0 (0.0%) |
Public vs Private Health Insurance Coverage by Age in Glendora
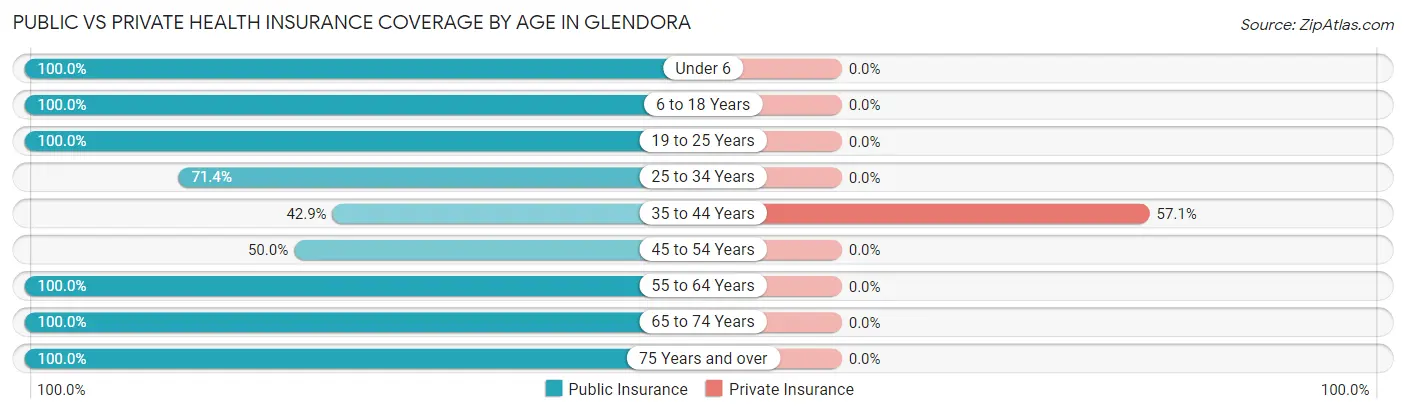
| Age Bracket | Public Insurance | Private Insurance |
| Under 6 | 22 (100.0%) | 0 (0.0%) |
| 6 to 18 Years | 23 (100.0%) | 0 (0.0%) |
| 19 to 25 Years | 5 (100.0%) | 0 (0.0%) |
| 25 to 34 Years | 30 (71.4%) | 0 (0.0%) |
| 35 to 44 Years | 3 (42.9%) | 4 (57.1%) |
| 45 to 54 Years | 10 (50.0%) | 0 (0.0%) |
| 55 to 64 Years | 17 (100.0%) | 0 (0.0%) |
| 65 to 74 Years | 4 (100.0%) | 0 (0.0%) |
| 75 Years and over | 2 (100.0%) | 0 (0.0%) |
| Total | 116 (81.7%) | 4 (2.8%) |
Disability Status by Sex by Age in Glendora
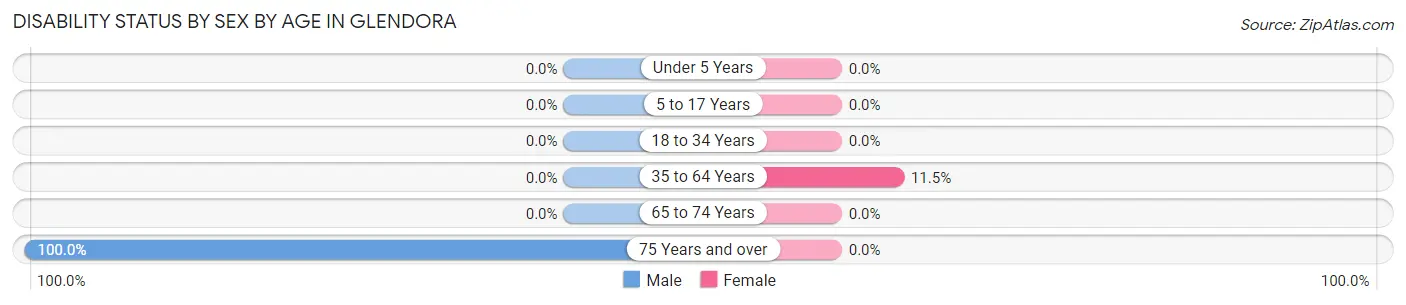
| Age Bracket | Male | Female |
| Under 5 Years | 0 (0.0%) | 0 (0.0%) |
| 5 to 17 Years | 0 (0.0%) | 0 (0.0%) |
| 18 to 34 Years | 0 (0.0%) | 0 (0.0%) |
| 35 to 64 Years | 0 (0.0%) | 3 (11.5%) |
| 65 to 74 Years | 0 (0.0%) | 0 (0.0%) |
| 75 Years and over | 2 (100.0%) | 0 (0.0%) |
Disability Class by Sex by Age in Glendora
Disability Class: Hearing Difficulty
| Age Bracket | Male | Female |
| Under 5 Years | 0 (0.0%) | 0 (0.0%) |
| 5 to 17 Years | 0 (0.0%) | 0 (0.0%) |
| 18 to 34 Years | 0 (0.0%) | 0 (0.0%) |
| 35 to 64 Years | 0 (0.0%) | 0 (0.0%) |
| 65 to 74 Years | 0 (0.0%) | 0 (0.0%) |
| 75 Years and over | 0 (0.0%) | 0 (0.0%) |
Disability Class: Vision Difficulty
| Age Bracket | Male | Female |
| Under 5 Years | 0 (0.0%) | 0 (0.0%) |
| 5 to 17 Years | 0 (0.0%) | 0 (0.0%) |
| 18 to 34 Years | 0 (0.0%) | 0 (0.0%) |
| 35 to 64 Years | 0 (0.0%) | 0 (0.0%) |
| 65 to 74 Years | 0 (0.0%) | 0 (0.0%) |
| 75 Years and over | 0 (0.0%) | 0 (0.0%) |
Disability Class: Cognitive Difficulty
| Age Bracket | Male | Female |
| 5 to 17 Years | 0 (0.0%) | 0 (0.0%) |
| 18 to 34 Years | 0 (0.0%) | 0 (0.0%) |
| 35 to 64 Years | 0 (0.0%) | 0 (0.0%) |
| 65 to 74 Years | 0 (0.0%) | 0 (0.0%) |
| 75 Years and over | 0 (0.0%) | 0 (0.0%) |
Disability Class: Ambulatory Difficulty
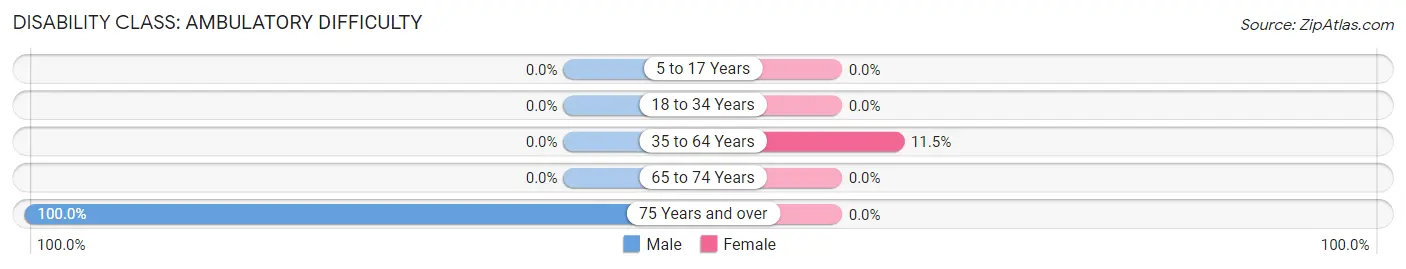
| Age Bracket | Male | Female |
| 5 to 17 Years | 0 (0.0%) | 0 (0.0%) |
| 18 to 34 Years | 0 (0.0%) | 0 (0.0%) |
| 35 to 64 Years | 0 (0.0%) | 3 (11.5%) |
| 65 to 74 Years | 0 (0.0%) | 0 (0.0%) |
| 75 Years and over | 2 (100.0%) | 0 (0.0%) |
Disability Class: Self-Care Difficulty
| Age Bracket | Male | Female |
| 5 to 17 Years | 0 (0.0%) | 0 (0.0%) |
| 18 to 34 Years | 0 (0.0%) | 0 (0.0%) |
| 35 to 64 Years | 0 (0.0%) | 0 (0.0%) |
| 65 to 74 Years | 0 (0.0%) | 0 (0.0%) |
| 75 Years and over | 0 (0.0%) | 0 (0.0%) |
Technology Access in Glendora
Computing Device Access in Glendora
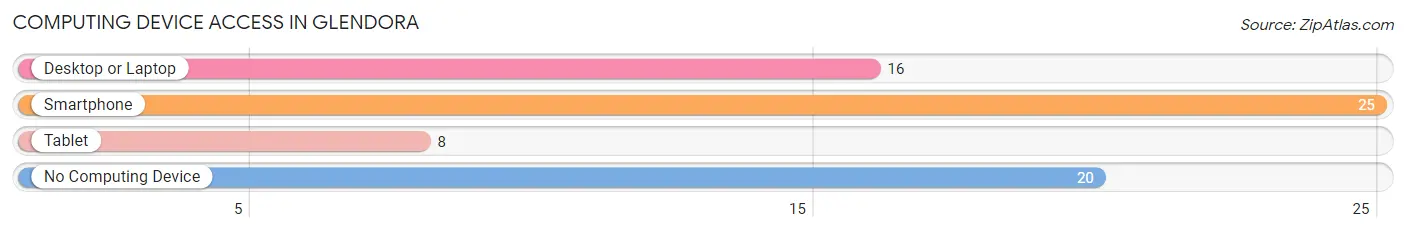
| Device Type | # Households | % Households |
| Desktop or Laptop | 16 | 30.2% |
| Smartphone | 25 | 47.2% |
| Tablet | 8 | 15.1% |
| No Computing Device | 20 | 37.7% |
| Total | 53 | 100.0% |
Internet Access in Glendora
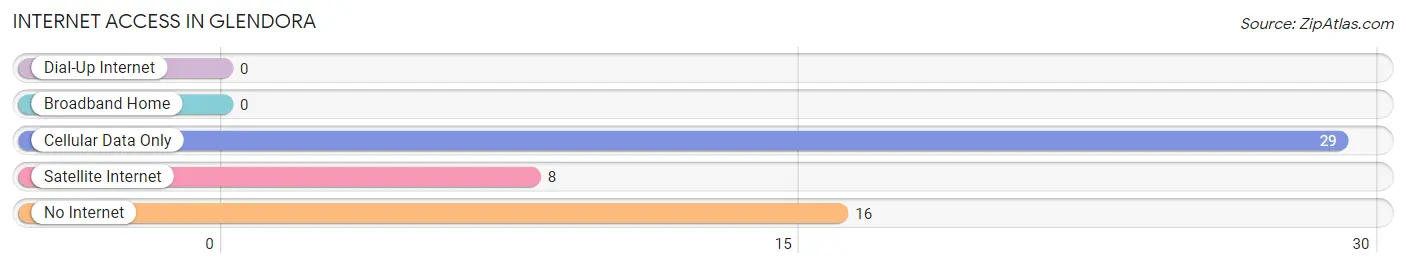
| Internet Type | # Households | % Households |
| Dial-Up Internet | 0 | 0.0% |
| Broadband Home | 0 | 0.0% |
| Cellular Data Only | 29 | 54.7% |
| Satellite Internet | 8 | 15.1% |
| No Internet | 16 | 30.2% |
| Total | 53 | 100.0% |
Glendora Summary
Glendora, Mississippi is a small town located in the heart of the Mississippi Delta. It is situated in the northern part of the state, about 25 miles south of the state capital, Jackson. The town has a population of just over 1,000 people, and is part of the larger Bolivar County. Glendora is a rural community, with a strong agricultural economy.
History
Glendora was founded in 1887 by a group of settlers from the nearby town of Glendale. The town was named after the nearby Glendale Plantation, which was owned by the prominent Glendora family. The town was originally a small farming community, and the Glendora family was one of the most influential families in the area. The Glendora family owned a large amount of land in the area, and their influence was felt throughout the town.
In the early 1900s, Glendora began to experience a period of growth and prosperity. The town was home to several businesses, including a cotton gin, a sawmill, and a general store. The town also had a post office, a bank, and a school. The town was also home to a number of churches, including the Glendora Methodist Church, which was founded in 1891.
Geography
Glendora is located in the northern part of the Mississippi Delta, about 25 miles south of the state capital, Jackson. The town is situated on the banks of the Yazoo River, and is surrounded by a number of small towns and villages. The town is located in a flat, low-lying area, and is surrounded by farmland and woodlands. The town is located in a humid subtropical climate, with hot, humid summers and mild winters.
Economy
Glendora’s economy is largely based on agriculture. The town is home to a number of farms, which produce a variety of crops, including cotton, soybeans, corn, and wheat. The town is also home to a number of small businesses, including a grocery store, a hardware store, and a few restaurants. The town is also home to a number of manufacturing companies, which produce a variety of products, including furniture, clothing, and electronics.
Demographics
As of the 2010 census, Glendora had a population of 1,072 people. The town is predominantly white, with a small African American population. The median household income in Glendora is $30,000, and the median home value is $90,000. The town has a high rate of poverty, with nearly 30% of the population living below the poverty line. The town also has a high rate of unemployment, with nearly 10% of the population unemployed.
Glendora is a small, rural town in the Mississippi Delta. The town has a long history, and is home to a number of small businesses and farms. The town has a predominantly white population, with a small African American population. The town has a high rate of poverty and unemployment, but is still a vibrant and thriving community.
Common Questions
What is Per Capita Income in Glendora?
Per Capita income in Glendora is $5,458.
What is the Median Family Income in Glendora?
Median Family Income in Glendora is $17,857.
What is the Median Household income in Glendora?
Median Household Income in Glendora is $10,875.
What is Inequality or Gini Index in Glendora?
Inequality or Gini Index in Glendora is 0.34.
What is the Total Population of Glendora?
Total Population of Glendora is 142.
What is the Total Male Population of Glendora?
Total Male Population of Glendora is 47.
What is the Total Female Population of Glendora?
Total Female Population of Glendora is 95.
What is the Ratio of Males per 100 Females in Glendora?
There are 49.47 Males per 100 Females in Glendora.
What is the Ratio of Females per 100 Males in Glendora?
There are 202.13 Females per 100 Males in Glendora.
What is the Median Population Age in Glendora?
Median Population Age in Glendora is 29.5 Years.
What is the Average Family Size in Glendora
Average Family Size in Glendora is 3.7 People.
What is the Average Household Size in Glendora
Average Household Size in Glendora is 2.7 People.
How Large is the Labor Force in Glendora?
There are 77 People in the Labor Forcein in Glendora.
What is the Percentage of People in the Labor Force in Glendora?
75.5% of People are in the Labor Force in Glendora.
What is the Unemployment Rate in Glendora?
Unemployment Rate in Glendora is 70.1%.