Tangipahoa, LA Map & Demographics
Tangipahoa Map
Tangipahoa Overview
$10,592
PER CAPITA INCOME
$19,375
AVG FAMILY INCOME
$18,269
AVG HOUSEHOLD INCOME
7.4%
WAGE / INCOME GAP [ % ]
92.6¢/ $1
WAGE / INCOME GAP [ $ ]
0.47
INEQUALITY / GINI INDEX
638
TOTAL POPULATION
306
MALE POPULATION
332
FEMALE POPULATION
92.17
MALES / 100 FEMALES
108.50
FEMALES / 100 MALES
23.9
MEDIAN AGE
4.0
AVG FAMILY SIZE
3.4
AVG HOUSEHOLD SIZE
205
LABOR FORCE [ PEOPLE ]
47.7%
PERCENT IN LABOR FORCE
27.3%
UNEMPLOYMENT RATE
Tangipahoa Zip Codes
Income in Tangipahoa
Income Overview in Tangipahoa
Per Capita Income in Tangipahoa is $10,592, while median incomes of families and households are $19,375 and $18,269 respectively.
| Characteristic | Number | Measure |
| Per Capita Income | 638 | $10,592 |
| Median Family Income | 132 | $19,375 |
| Mean Family Income | 132 | $32,388 |
| Median Household Income | 186 | $18,269 |
| Mean Household Income | 186 | $31,103 |
| Income Deficit | 132 | $0 |
| Wage / Income Gap (%) | 638 | 7.36% |
| Wage / Income Gap ($) | 638 | 92.64¢ per $1 |
| Gini / Inequality Index | 638 | 0.47 |
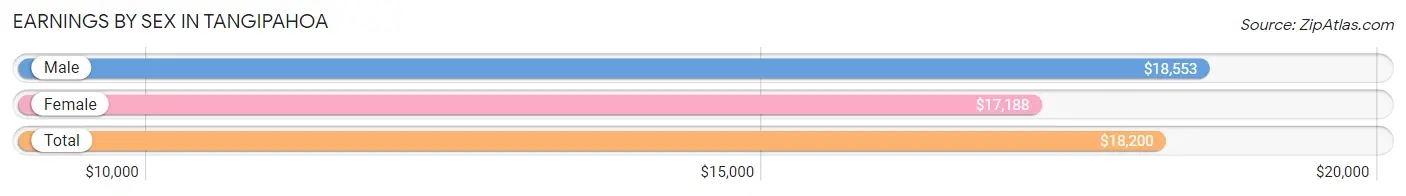
Earnings by Sex in Tangipahoa
Average Earnings in Tangipahoa are $18,200, $18,553 for men and $17,188 for women, a difference of 7.4%.
| Sex | Number | Average Earnings |
| Male | 106 (48.6%) | $18,553 |
| Female | 112 (51.4%) | $17,188 |
| Total | 218 (100.0%) | $18,200 |
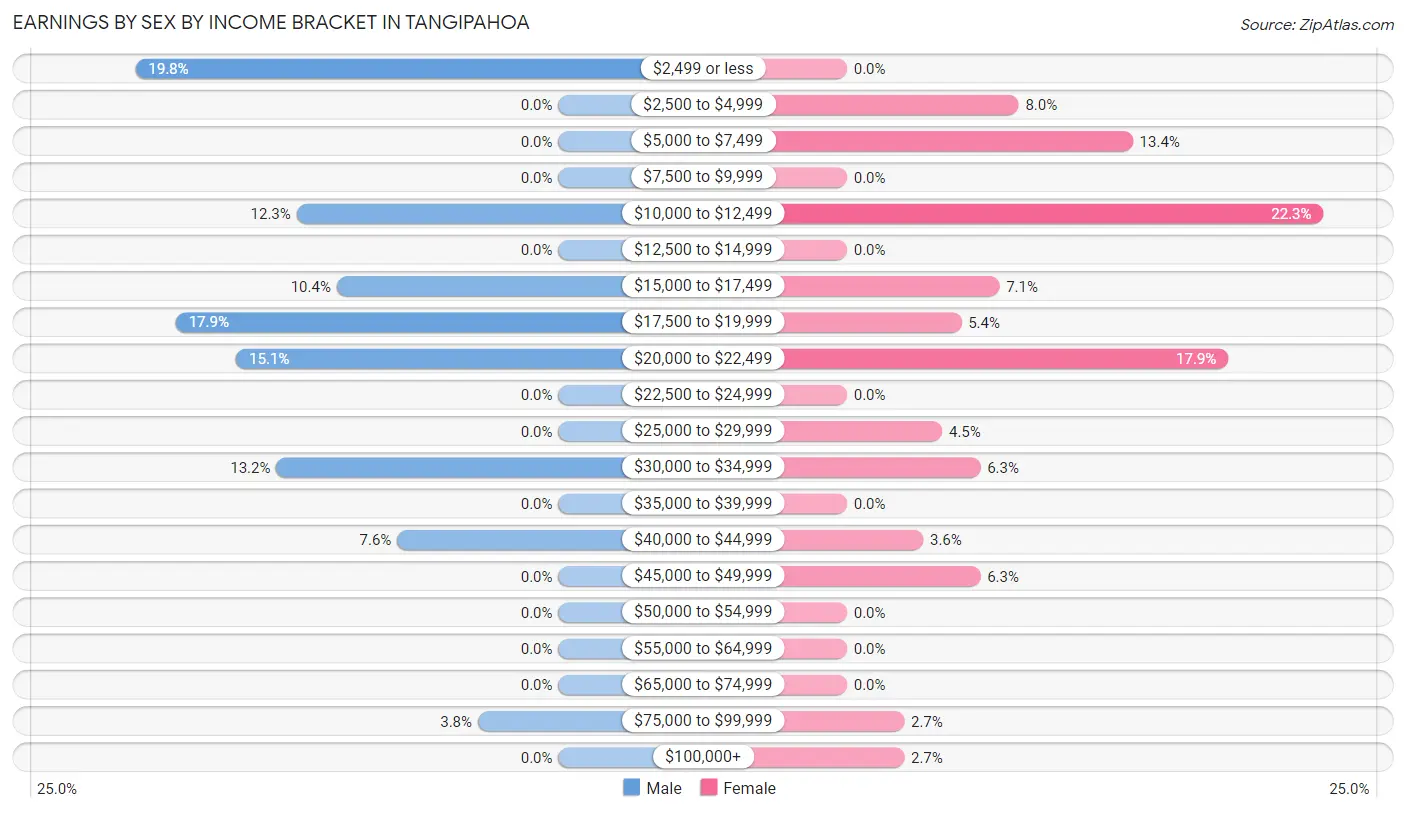
Earnings by Sex by Income Bracket in Tangipahoa
The most common earnings brackets in Tangipahoa are $2,499 or less for men (21 | 19.8%) and $10,000 to $12,499 for women (25 | 22.3%).
| Income | Male | Female |
| $2,499 or less | 21 (19.8%) | 0 (0.0%) |
| $2,500 to $4,999 | 0 (0.0%) | 9 (8.0%) |
| $5,000 to $7,499 | 0 (0.0%) | 15 (13.4%) |
| $7,500 to $9,999 | 0 (0.0%) | 0 (0.0%) |
| $10,000 to $12,499 | 13 (12.3%) | 25 (22.3%) |
| $12,500 to $14,999 | 0 (0.0%) | 0 (0.0%) |
| $15,000 to $17,499 | 11 (10.4%) | 8 (7.1%) |
| $17,500 to $19,999 | 19 (17.9%) | 6 (5.4%) |
| $20,000 to $22,499 | 16 (15.1%) | 20 (17.9%) |
| $22,500 to $24,999 | 0 (0.0%) | 0 (0.0%) |
| $25,000 to $29,999 | 0 (0.0%) | 5 (4.5%) |
| $30,000 to $34,999 | 14 (13.2%) | 7 (6.2%) |
| $35,000 to $39,999 | 0 (0.0%) | 0 (0.0%) |
| $40,000 to $44,999 | 8 (7.5%) | 4 (3.6%) |
| $45,000 to $49,999 | 0 (0.0%) | 7 (6.2%) |
| $50,000 to $54,999 | 0 (0.0%) | 0 (0.0%) |
| $55,000 to $64,999 | 0 (0.0%) | 0 (0.0%) |
| $65,000 to $74,999 | 0 (0.0%) | 0 (0.0%) |
| $75,000 to $99,999 | 4 (3.8%) | 3 (2.7%) |
| $100,000+ | 0 (0.0%) | 3 (2.7%) |
| Total | 106 (100.0%) | 112 (100.0%) |
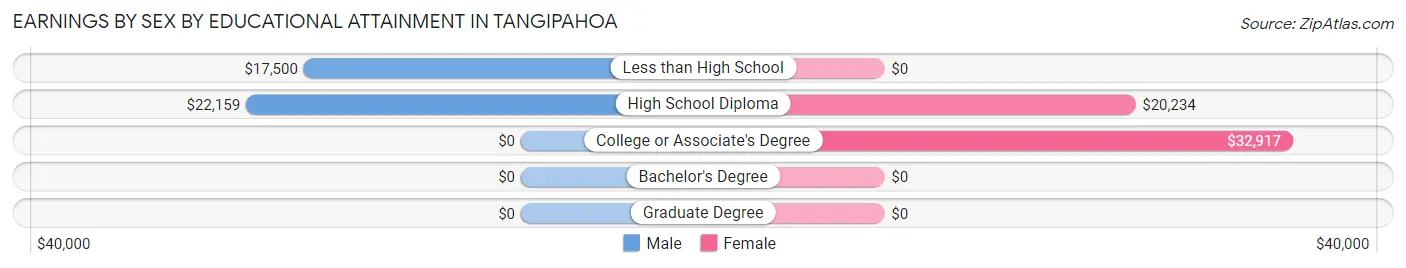
Earnings by Sex by Educational Attainment in Tangipahoa
Average earnings in Tangipahoa are $20,391 for men and $21,250 for women, a difference of 4.0%. Men with an educational attainment of high school diploma enjoy the highest average annual earnings of $22,159, while those with less than high school education earn the least with $17,500. Women with an educational attainment of college or associate's degree earn the most with the average annual earnings of $32,917, while those with high school diploma education have the smallest earnings of $20,234.
| Educational Attainment | Male Income | Female Income |
| Less than High School | $17,500 | $0 |
| High School Diploma | $22,159 | $20,234 |
| College or Associate's Degree | - | - |
| Bachelor's Degree | - | - |
| Graduate Degree | - | - |
| Total | $20,391 | $21,250 |
Family Income in Tangipahoa
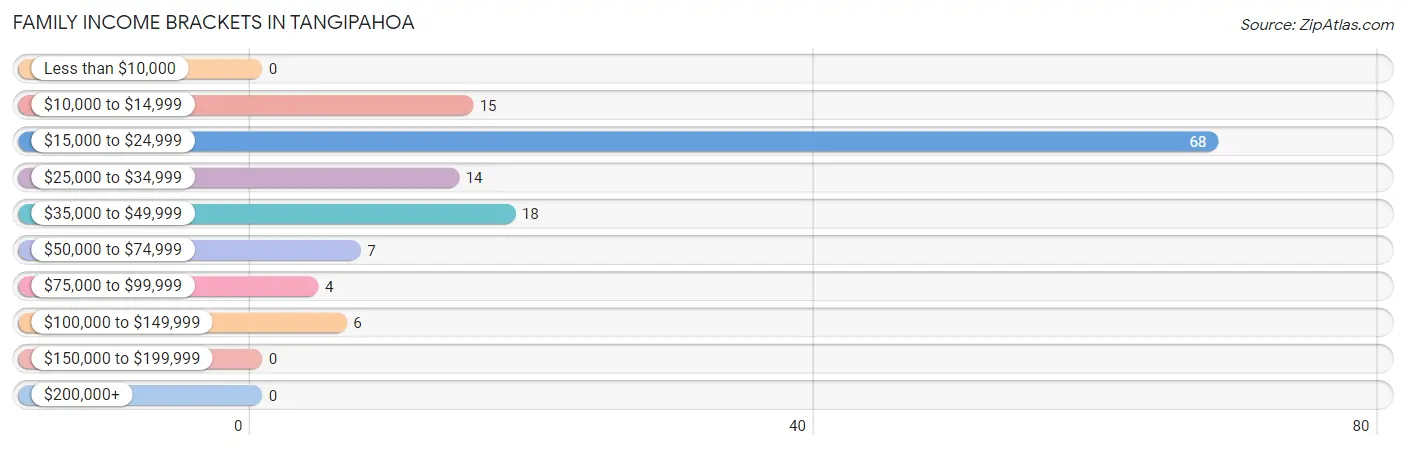
Family Income Brackets in Tangipahoa
According to the Tangipahoa family income data, there are 68 families falling into the $15,000 to $24,999 income range, which is the most common income bracket and makes up 51.5% of all families.
| Income Bracket | # Families | % Families |
| Less than $10,000 | 0 | 0.0% |
| $10,000 to $14,999 | 15 | 11.4% |
| $15,000 to $24,999 | 68 | 51.5% |
| $25,000 to $34,999 | 14 | 10.6% |
| $35,000 to $49,999 | 18 | 13.6% |
| $50,000 to $74,999 | 7 | 5.3% |
| $75,000 to $99,999 | 4 | 3.0% |
| $100,000 to $149,999 | 6 | 4.5% |
| $150,000 to $199,999 | 0 | 0.0% |
| $200,000+ | 0 | 0.0% |
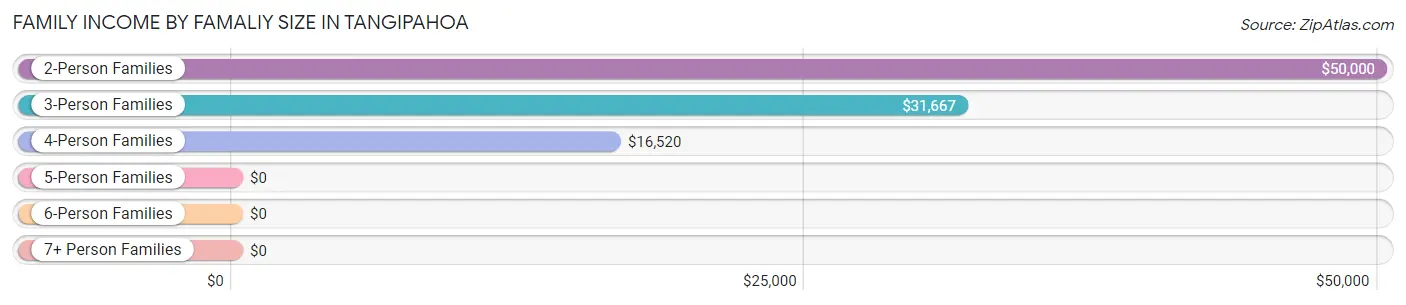
Family Income by Famaliy Size in Tangipahoa
2-person families (22 | 16.7%) account for the highest median family income in Tangipahoa with $50,000 per family, while 2-person families (22 | 16.7%) have the highest median income of $25,000 per family member.
| Income Bracket | # Families | Median Income |
| 2-Person Families | 22 (16.7%) | $50,000 |
| 3-Person Families | 22 (16.7%) | $31,667 |
| 4-Person Families | 69 (52.3%) | $16,520 |
| 5-Person Families | 7 (5.3%) | $0 |
| 6-Person Families | 7 (5.3%) | $0 |
| 7+ Person Families | 5 (3.8%) | $0 |
| Total | 132 (100.0%) | $19,375 |
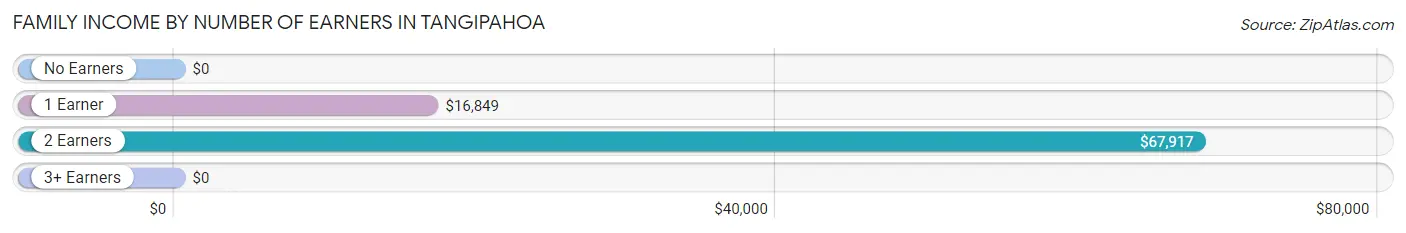
Family Income by Number of Earners in Tangipahoa
| Number of Earners | # Families | Median Income |
| No Earners | 5 (3.8%) | $0 |
| 1 Earner | 95 (72.0%) | $16,849 |
| 2 Earners | 19 (14.4%) | $67,917 |
| 3+ Earners | 13 (9.9%) | $0 |
| Total | 132 (100.0%) | $19,375 |
Household Income in Tangipahoa
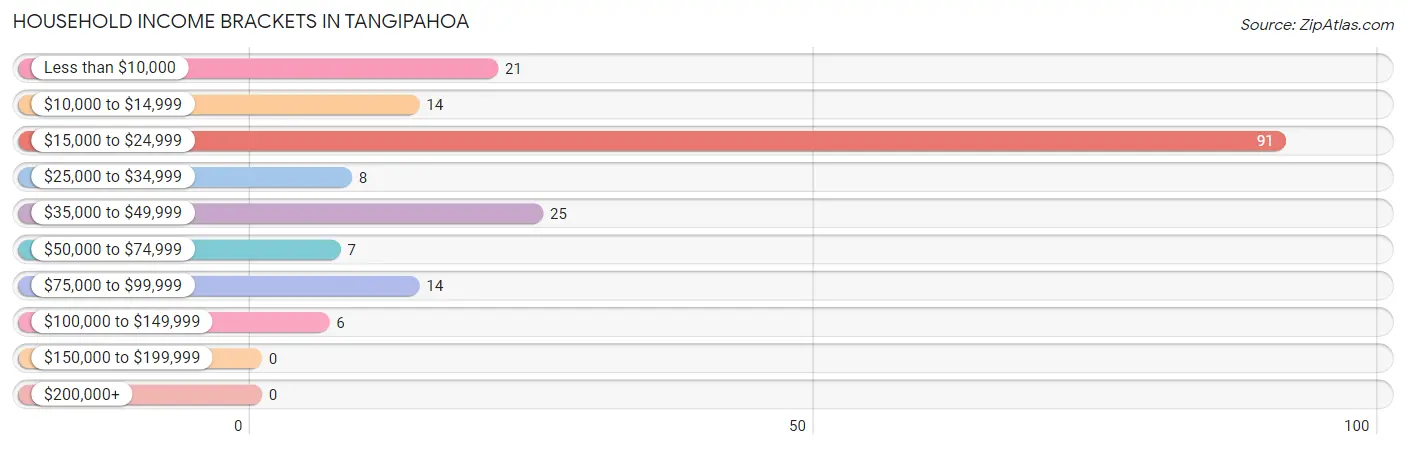
Household Income Brackets in Tangipahoa
With 91 households falling in the category, the $15,000 to $24,999 income range is the most frequent in Tangipahoa, accounting for 48.9% of all households.
| Income Bracket | # Households | % Households |
| Less than $10,000 | 21 | 11.3% |
| $10,000 to $14,999 | 14 | 7.5% |
| $15,000 to $24,999 | 91 | 48.9% |
| $25,000 to $34,999 | 8 | 4.3% |
| $35,000 to $49,999 | 25 | 13.4% |
| $50,000 to $74,999 | 7 | 3.8% |
| $75,000 to $99,999 | 14 | 7.5% |
| $100,000 to $149,999 | 6 | 3.2% |
| $150,000 to $199,999 | 0 | 0.0% |
| $200,000+ | 0 | 0.0% |
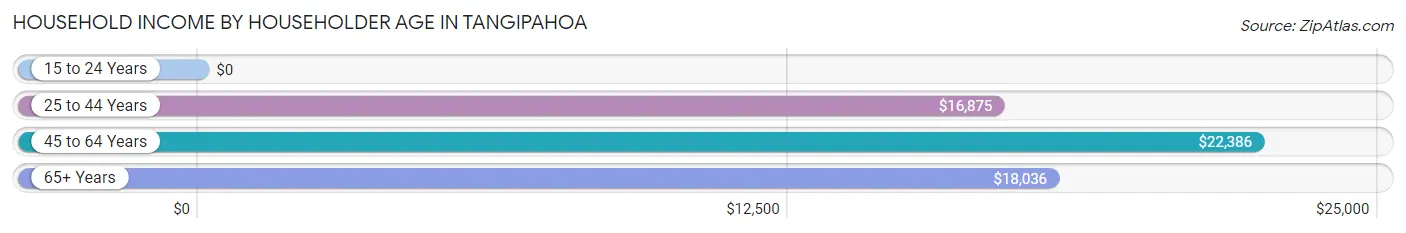
Household Income by Householder Age in Tangipahoa
The median household income in Tangipahoa is $18,269, with the highest median household income of $22,386 found in the 45 to 64 years age bracket for the primary householder. A total of 47 households (25.3%) fall into this category. Meanwhile, the 15 to 24 years age bracket for the primary householder has the lowest median household income of $0, with 6 households (3.2%) in this group.
| Income Bracket | # Households | Median Income |
| 15 to 24 Years | 6 (3.2%) | $0 |
| 25 to 44 Years | 100 (53.8%) | $16,875 |
| 45 to 64 Years | 47 (25.3%) | $22,386 |
| 65+ Years | 33 (17.7%) | $18,036 |
| Total | 186 (100.0%) | $18,269 |
Poverty in Tangipahoa
Income Below Poverty by Sex and Age in Tangipahoa
With 60.5% poverty level for males and 66.9% for females among the residents of Tangipahoa, 5 year old males and under 5 year old females are the most vulnerable to poverty, with 13 males (100.0%) and 20 females (100.0%) in their respective age groups living below the poverty level.
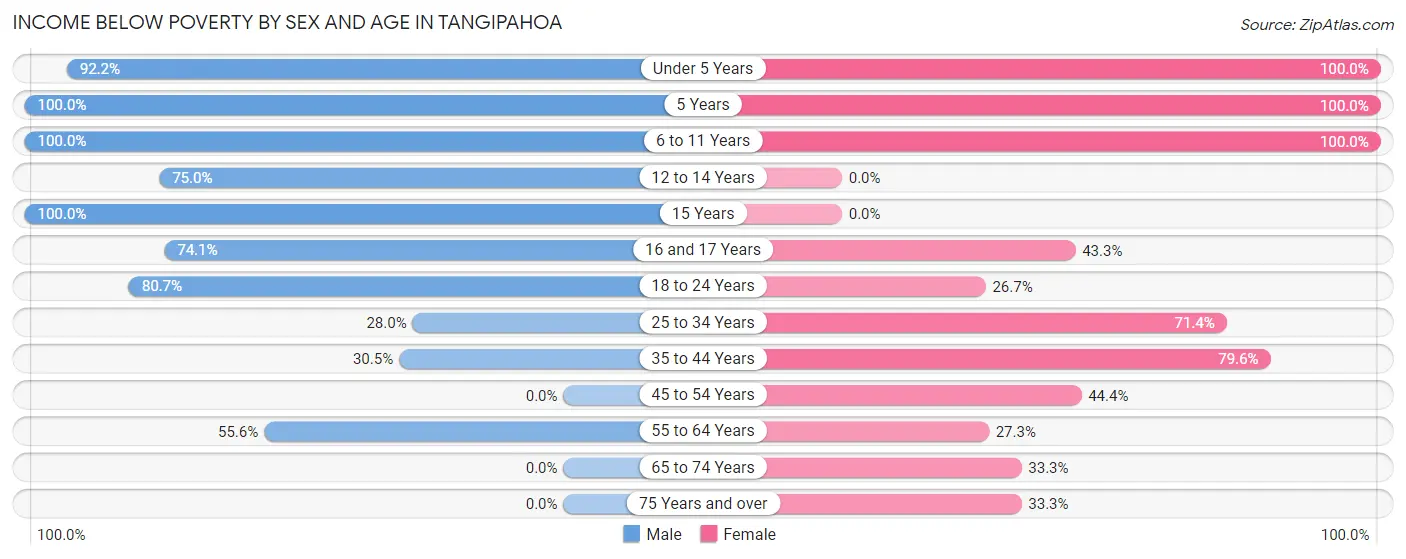
| Age Bracket | Male | Female |
| Under 5 Years | 47 (92.2%) | 20 (100.0%) |
| 5 Years | 13 (100.0%) | 5 (100.0%) |
| 6 to 11 Years | 21 (100.0%) | 68 (100.0%) |
| 12 to 14 Years | 18 (75.0%) | 0 (0.0%) |
| 15 Years | 6 (100.0%) | 0 (0.0%) |
| 16 and 17 Years | 20 (74.1%) | 13 (43.3%) |
| 18 to 24 Years | 25 (80.6%) | 12 (26.7%) |
| 25 to 34 Years | 7 (28.0%) | 10 (71.4%) |
| 35 to 44 Years | 18 (30.5%) | 70 (79.5%) |
| 45 to 54 Years | 0 (0.0%) | 16 (44.4%) |
| 55 to 64 Years | 10 (55.6%) | 3 (27.3%) |
| 65 to 74 Years | 0 (0.0%) | 2 (33.3%) |
| 75 Years and over | 0 (0.0%) | 3 (33.3%) |
| Total | 185 (60.5%) | 222 (66.9%) |
Income Above Poverty by Sex and Age in Tangipahoa
According to the poverty statistics in Tangipahoa, males aged 45 to 54 years and females aged 18 to 24 years are the age groups that are most secure financially, with 100.0% of males and 73.3% of females in these age groups living above the poverty line.
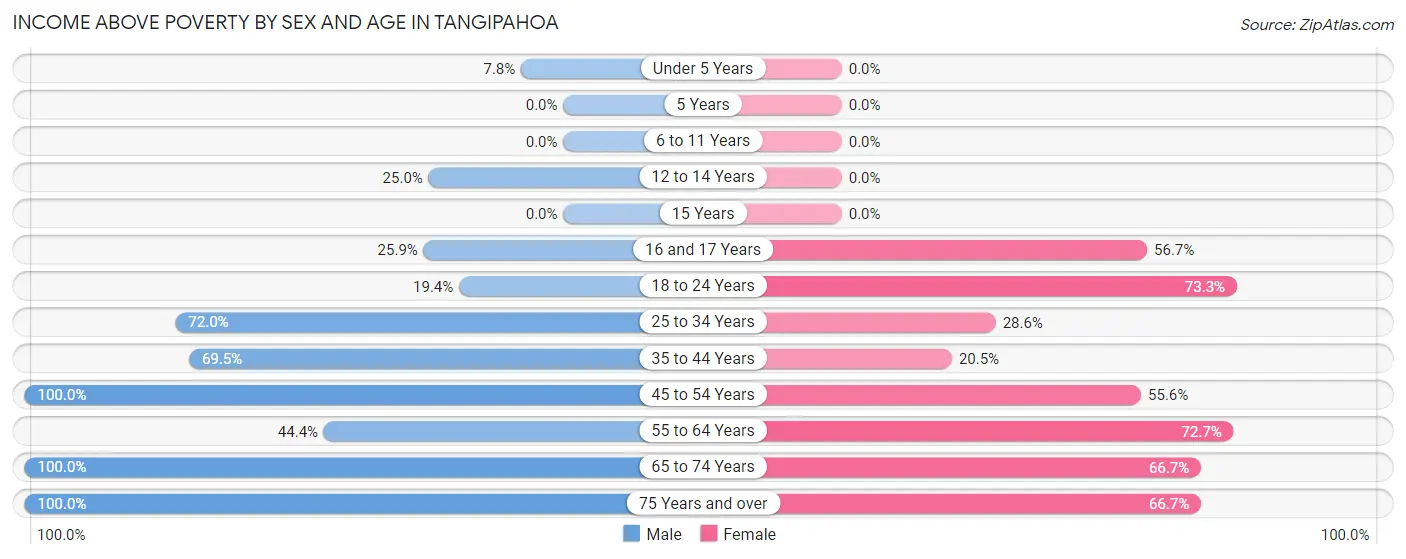
| Age Bracket | Male | Female |
| Under 5 Years | 4 (7.8%) | 0 (0.0%) |
| 5 Years | 0 (0.0%) | 0 (0.0%) |
| 6 to 11 Years | 0 (0.0%) | 0 (0.0%) |
| 12 to 14 Years | 6 (25.0%) | 0 (0.0%) |
| 15 Years | 0 (0.0%) | 0 (0.0%) |
| 16 and 17 Years | 7 (25.9%) | 17 (56.7%) |
| 18 to 24 Years | 6 (19.4%) | 33 (73.3%) |
| 25 to 34 Years | 18 (72.0%) | 4 (28.6%) |
| 35 to 44 Years | 41 (69.5%) | 18 (20.4%) |
| 45 to 54 Years | 10 (100.0%) | 20 (55.6%) |
| 55 to 64 Years | 8 (44.4%) | 8 (72.7%) |
| 65 to 74 Years | 16 (100.0%) | 4 (66.7%) |
| 75 Years and over | 5 (100.0%) | 6 (66.7%) |
| Total | 121 (39.5%) | 110 (33.1%) |
Income Below Poverty Among Married-Couple Families in Tangipahoa
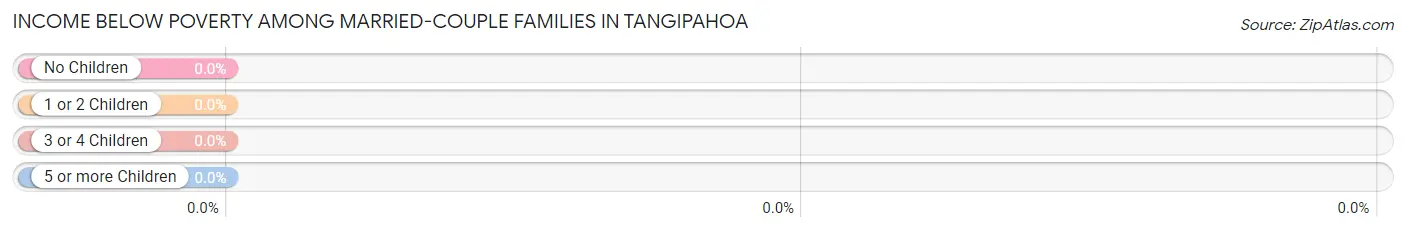
| Children | Above Poverty | Below Poverty |
| No Children | 8 (100.0%) | 0 (0.0%) |
| 1 or 2 Children | 3 (100.0%) | 0 (0.0%) |
| 3 or 4 Children | 0 (0.0%) | 0 (0.0%) |
| 5 or more Children | 0 (0.0%) | 0 (0.0%) |
| Total | 11 (100.0%) | 0 (0.0%) |
Income Below Poverty Among Single-Parent Households in Tangipahoa
According to the poverty data in Tangipahoa, 33.3% or 3 single-father households and 77.7% or 87 single-mother households are living below the poverty line. Among single-father households, those with no children have the highest poverty rate, with 3 households (33.3%) experiencing poverty. Likewise, among single-mother households, those with 3 or 4 children have the highest poverty rate, with 37 households (100.0%) falling below the poverty line.
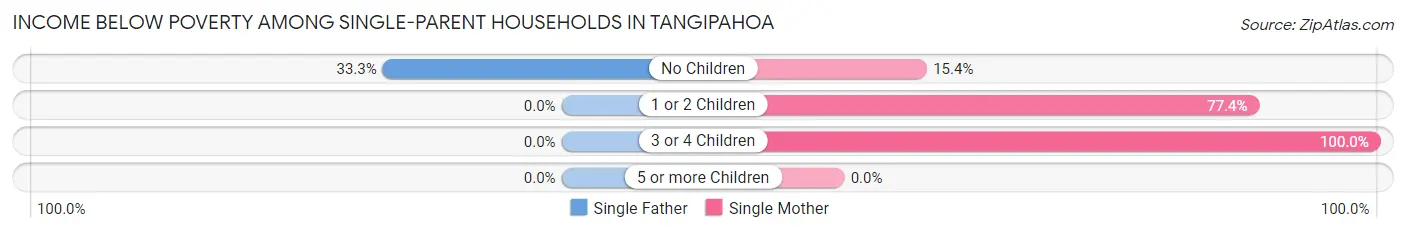
| Children | Single Father | Single Mother |
| No Children | 3 (33.3%) | 2 (15.4%) |
| 1 or 2 Children | 0 (0.0%) | 48 (77.4%) |
| 3 or 4 Children | 0 (0.0%) | 37 (100.0%) |
| 5 or more Children | 0 (0.0%) | 0 (0.0%) |
| Total | 3 (33.3%) | 87 (77.7%) |
Income Below Poverty Among Married-Couple vs Single-Parent Households in Tangipahoa
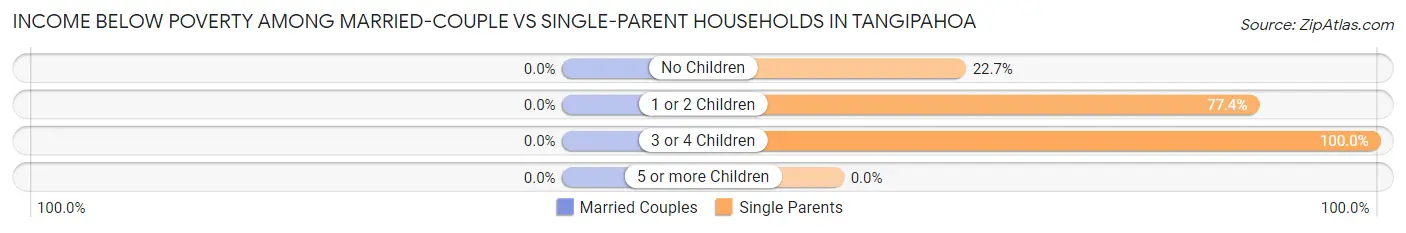
| Children | Married-Couple Families | Single-Parent Households |
| No Children | 0 (0.0%) | 5 (22.7%) |
| 1 or 2 Children | 0 (0.0%) | 48 (77.4%) |
| 3 or 4 Children | 0 (0.0%) | 37 (100.0%) |
| 5 or more Children | 0 (0.0%) | 0 (0.0%) |
| Total | 0 (0.0%) | 90 (74.4%) |
Race in Tangipahoa
The most populous races in Tangipahoa are Black / African American (600 | 94.0%), Two or more Races (22 | 3.5%), and White / Caucasian (16 | 2.5%).
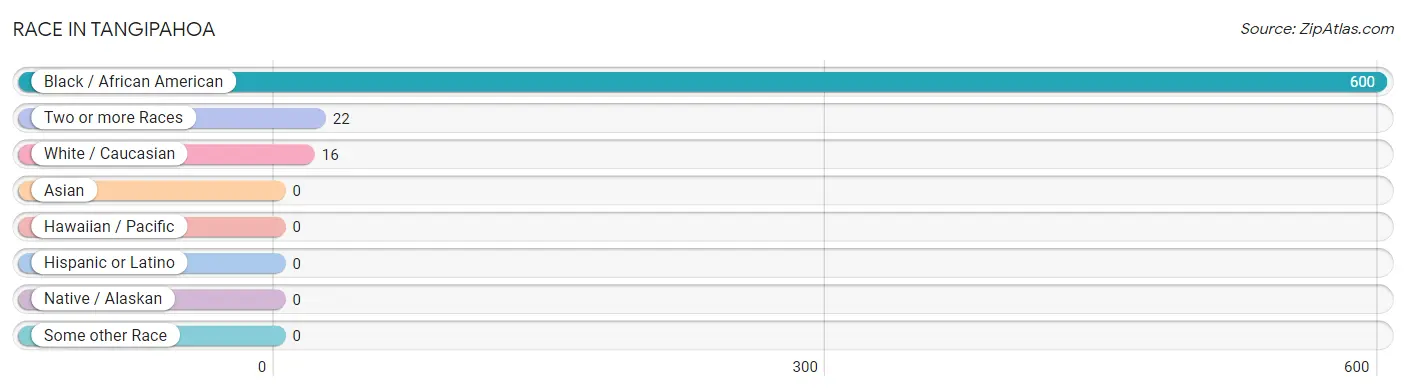
| Race | # Population | % Population |
| Asian | 0 | 0.0% |
| Black / African American | 600 | 94.0% |
| Hawaiian / Pacific | 0 | 0.0% |
| Hispanic or Latino | 0 | 0.0% |
| Native / Alaskan | 0 | 0.0% |
| White / Caucasian | 16 | 2.5% |
| Two or more Races | 22 | 3.5% |
| Some other Race | 0 | 0.0% |
| Total | 638 | 100.0% |
Ancestry in Tangipahoa
The most populous ancestries reported in Tangipahoa are Polish (8 | 1.3%), American (4 | 0.6%), German (4 | 0.6%), African (2 | 0.3%), and Subsaharan African (2 | 0.3%), together accounting for 3.1% of all Tangipahoa residents.
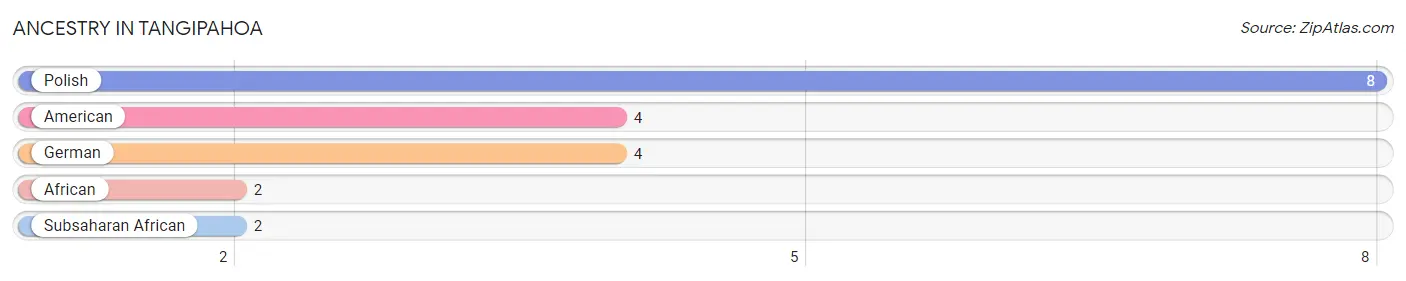
| Ancestry | # Population | % Population |
| African | 2 | 0.3% |
| American | 4 | 0.6% |
| German | 4 | 0.6% |
| Polish | 8 | 1.3% |
| Subsaharan African | 2 | 0.3% | View All 5 Rows |
Immigrants in Tangipahoa

| Immigration Origin | # Population | % Population | View All 0 Rows |
Sex and Age in Tangipahoa
Sex and Age in Tangipahoa
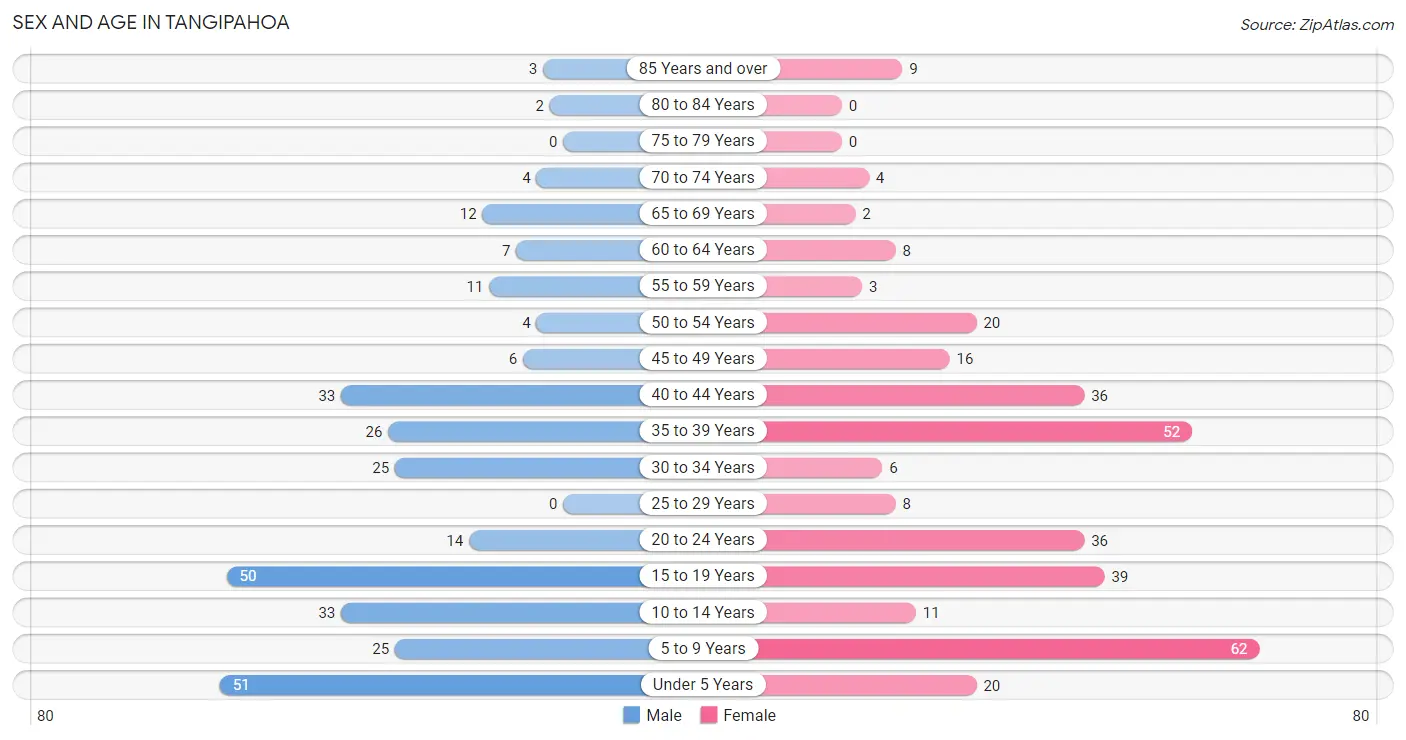
The most populous age groups in Tangipahoa are Under 5 Years (51 | 16.7%) for men and 5 to 9 Years (62 | 18.7%) for women.
| Age Bracket | Male | Female |
| Under 5 Years | 51 (16.7%) | 20 (6.0%) |
| 5 to 9 Years | 25 (8.2%) | 62 (18.7%) |
| 10 to 14 Years | 33 (10.8%) | 11 (3.3%) |
| 15 to 19 Years | 50 (16.3%) | 39 (11.7%) |
| 20 to 24 Years | 14 (4.6%) | 36 (10.8%) |
| 25 to 29 Years | 0 (0.0%) | 8 (2.4%) |
| 30 to 34 Years | 25 (8.2%) | 6 (1.8%) |
| 35 to 39 Years | 26 (8.5%) | 52 (15.7%) |
| 40 to 44 Years | 33 (10.8%) | 36 (10.8%) |
| 45 to 49 Years | 6 (2.0%) | 16 (4.8%) |
| 50 to 54 Years | 4 (1.3%) | 20 (6.0%) |
| 55 to 59 Years | 11 (3.6%) | 3 (0.9%) |
| 60 to 64 Years | 7 (2.3%) | 8 (2.4%) |
| 65 to 69 Years | 12 (3.9%) | 2 (0.6%) |
| 70 to 74 Years | 4 (1.3%) | 4 (1.2%) |
| 75 to 79 Years | 0 (0.0%) | 0 (0.0%) |
| 80 to 84 Years | 2 (0.6%) | 0 (0.0%) |
| 85 Years and over | 3 (1.0%) | 9 (2.7%) |
| Total | 306 (100.0%) | 332 (100.0%) |
Families and Households in Tangipahoa
Median Family Size in Tangipahoa
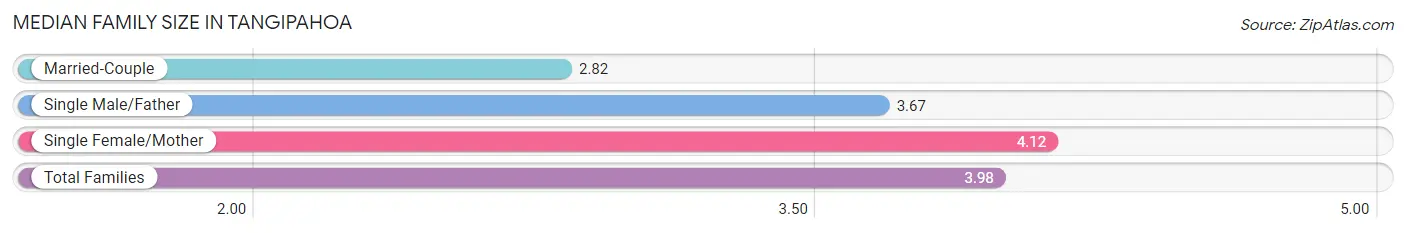
The median family size in Tangipahoa is 3.98 persons per family, with single female/mother families (112 | 84.9%) accounting for the largest median family size of 4.12 persons per family. On the other hand, married-couple families (11 | 8.3%) represent the smallest median family size with 2.82 persons per family.
| Family Type | # Families | Family Size |
| Married-Couple | 11 (8.3%) | 2.82 |
| Single Male/Father | 9 (6.8%) | 3.67 |
| Single Female/Mother | 112 (84.9%) | 4.12 |
| Total Families | 132 (100.0%) | 3.98 |
Median Household Size in Tangipahoa
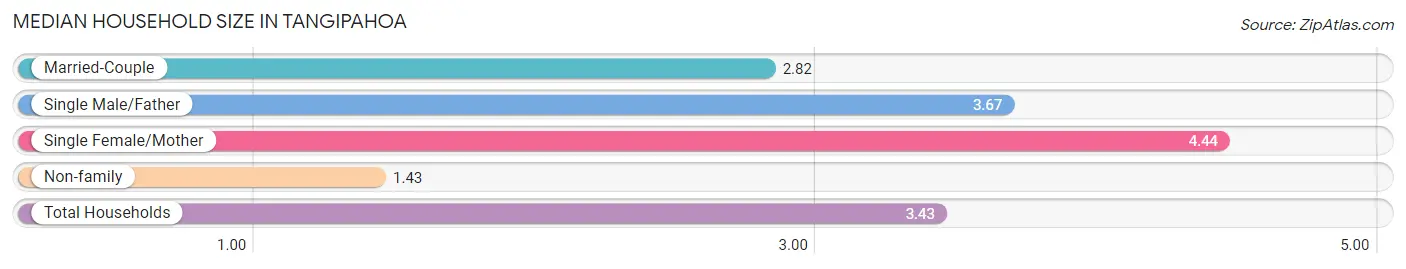
The median household size in Tangipahoa is 3.43 persons per household, with single female/mother households (112 | 60.2%) accounting for the largest median household size of 4.44 persons per household. non-family households (54 | 29.0%) represent the smallest median household size with 1.43 persons per household.
| Household Type | # Households | Household Size |
| Married-Couple | 11 (5.9%) | 2.82 |
| Single Male/Father | 9 (4.8%) | 3.67 |
| Single Female/Mother | 112 (60.2%) | 4.44 |
| Non-family | 54 (29.0%) | 1.43 |
| Total Households | 186 (100.0%) | 3.43 |
Household Size by Marriage Status in Tangipahoa
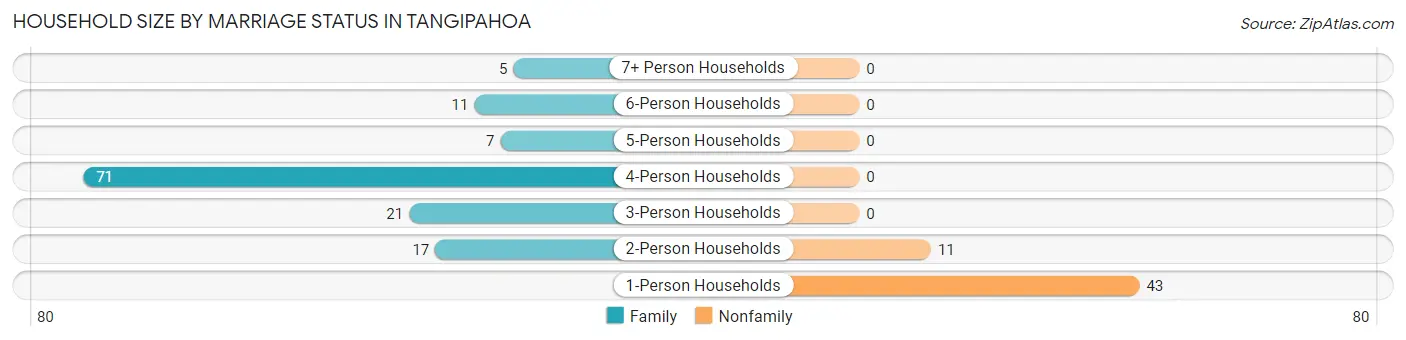
Out of a total of 186 households in Tangipahoa, 132 (71.0%) are family households, while 54 (29.0%) are nonfamily households. The most numerous type of family households are 4-person households, comprising 71, and the most common type of nonfamily households are 1-person households, comprising 43.
| Household Size | Family Households | Nonfamily Households |
| 1-Person Households | - | 43 (23.1%) |
| 2-Person Households | 17 (9.1%) | 11 (5.9%) |
| 3-Person Households | 21 (11.3%) | 0 (0.0%) |
| 4-Person Households | 71 (38.2%) | 0 (0.0%) |
| 5-Person Households | 7 (3.8%) | 0 (0.0%) |
| 6-Person Households | 11 (5.9%) | 0 (0.0%) |
| 7+ Person Households | 5 (2.7%) | 0 (0.0%) |
| Total | 132 (71.0%) | 54 (29.0%) |
Female Fertility in Tangipahoa
Fertility by Age in Tangipahoa
Average fertility rate in Tangipahoa is 192.0 births per 1,000 women. Women in the age bracket of 35 to 50 years have the highest fertility rate with 356.0 births per 1,000 women. Women in the age bracket of 35 to 50 years acount for 100.0% of all women with births.
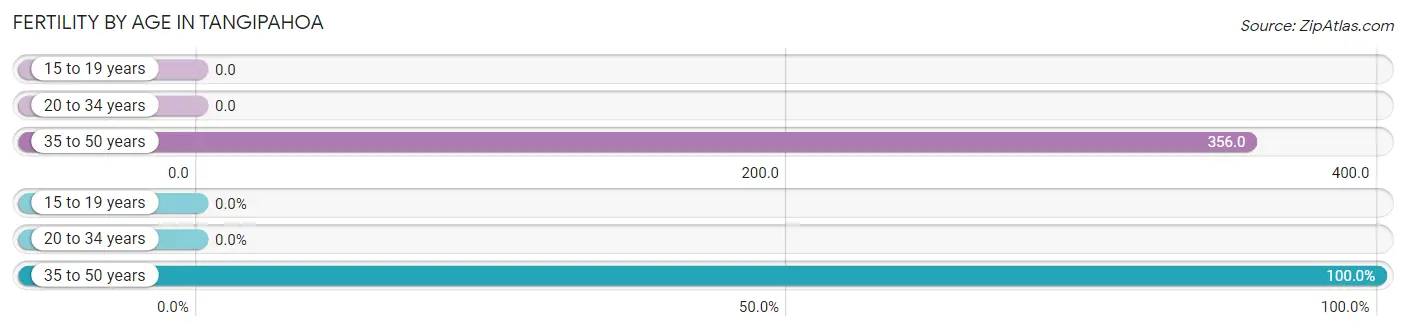
| Age Bracket | Women with Births | Births / 1,000 Women |
| 15 to 19 years | 0 (0.0%) | 0.0 |
| 20 to 34 years | 0 (0.0%) | 0.0 |
| 35 to 50 years | 37 (100.0%) | 356.0 |
| Total | 37 (100.0%) | 192.0 |
Fertility by Age by Marriage Status in Tangipahoa
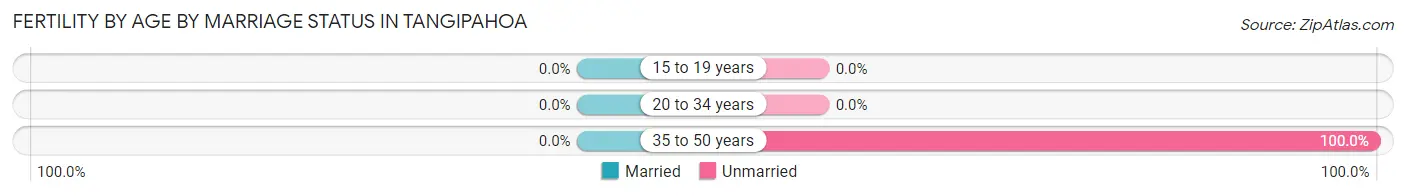
| Age Bracket | Married | Unmarried |
| 15 to 19 years | 0 (0.0%) | 0 (0.0%) |
| 20 to 34 years | 0 (0.0%) | 0 (0.0%) |
| 35 to 50 years | 0 (0.0%) | 37 (100.0%) |
| Total | 0 (0.0%) | 37 (100.0%) |
Fertility by Education in Tangipahoa
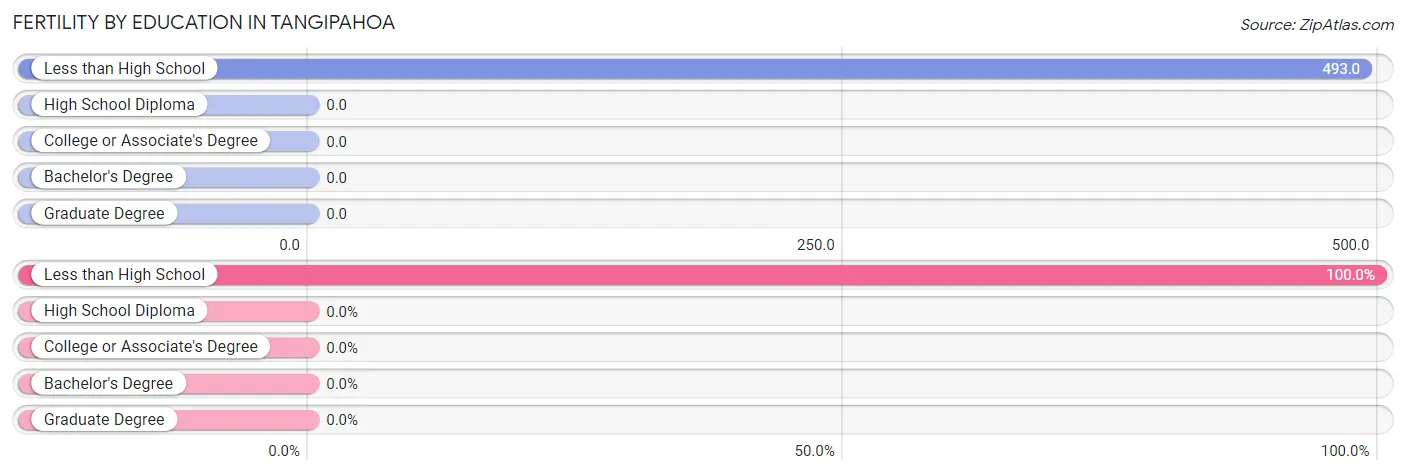
| Educational Attainment | Women with Births | Births / 1,000 Women |
| Less than High School | 37 (100.0%) | 493.0 |
| High School Diploma | 0 (0.0%) | 0.0 |
| College or Associate's Degree | 0 (0.0%) | 0.0 |
| Bachelor's Degree | 0 (0.0%) | 0.0 |
| Graduate Degree | 0 (0.0%) | 0.0 |
| Total | 37 (100.0%) | 192.0 |
Fertility by Education by Marriage Status in Tangipahoa
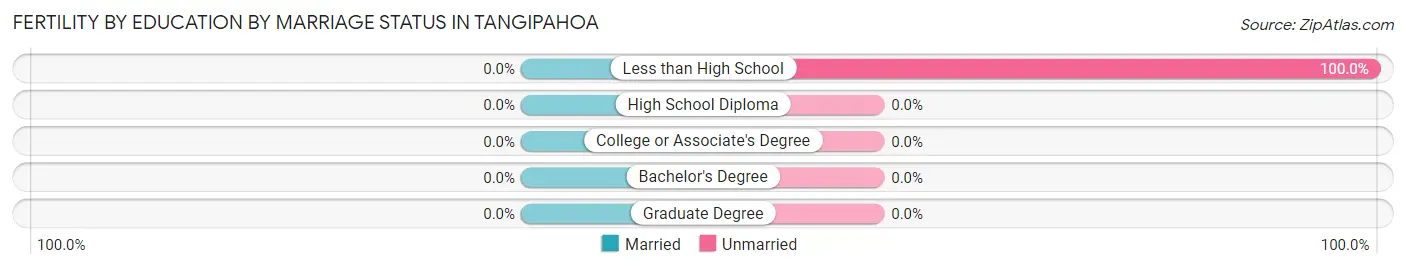
| Educational Attainment | Married | Unmarried |
| Less than High School | 0 (0.0%) | 37 (100.0%) |
| High School Diploma | 0 (0.0%) | 0 (0.0%) |
| College or Associate's Degree | 0 (0.0%) | 0 (0.0%) |
| Bachelor's Degree | 0 (0.0%) | 0 (0.0%) |
| Graduate Degree | 0 (0.0%) | 0 (0.0%) |
| Total | 0 (0.0%) | 37 (100.0%) |
Employment Characteristics in Tangipahoa
Employment by Class of Employer in Tangipahoa
Among the 140 employed individuals in Tangipahoa, private company employees (118 | 84.3%), not-for-profit organizations (10 | 7.1%), and local government employees (6 | 4.3%) make up the most common classes of employment.
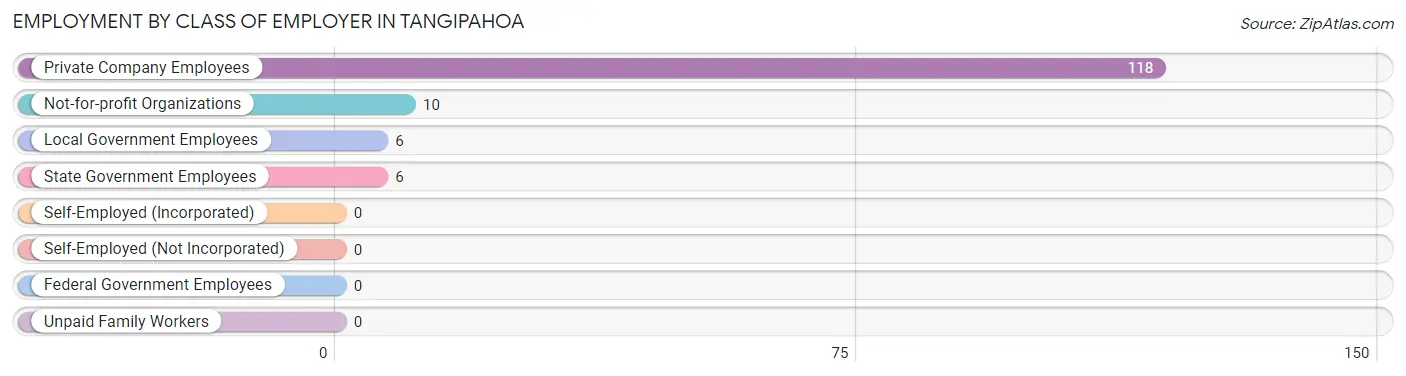
| Employer Class | # Employees | % Employees |
| Private Company Employees | 118 | 84.3% |
| Self-Employed (Incorporated) | 0 | 0.0% |
| Self-Employed (Not Incorporated) | 0 | 0.0% |
| Not-for-profit Organizations | 10 | 7.1% |
| Local Government Employees | 6 | 4.3% |
| State Government Employees | 6 | 4.3% |
| Federal Government Employees | 0 | 0.0% |
| Unpaid Family Workers | 0 | 0.0% |
| Total | 140 | 100.0% |
Employment Status by Age in Tangipahoa
According to the labor force statistics for Tangipahoa, out of the total population over 16 years of age (430), 47.7% or 205 individuals are in the labor force, with 27.3% or 56 of them unemployed. The age group with the highest labor force participation rate is 25 to 29 years, with 100.0% or 8 individuals in the labor force. Within the labor force, the 20 to 24 years age range has the highest percentage of unemployed individuals, with 74.4% or 32 of them being unemployed.
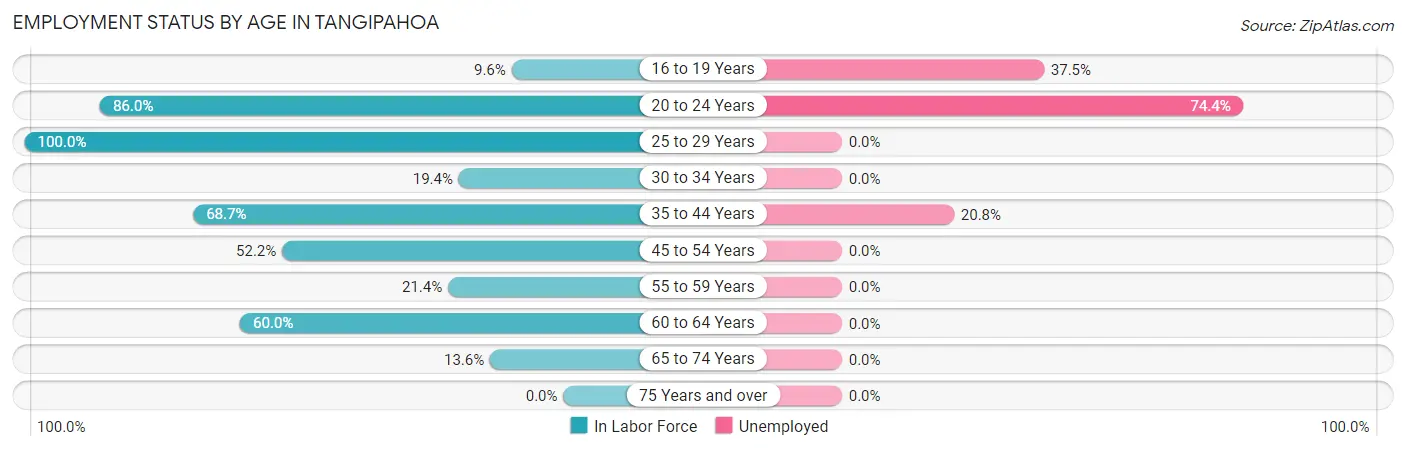
| Age Bracket | In Labor Force | Unemployed |
| 16 to 19 Years | 8 (9.6%) | 3 (37.5%) |
| 20 to 24 Years | 43 (86.0%) | 32 (74.4%) |
| 25 to 29 Years | 8 (100.0%) | 0 (0.0%) |
| 30 to 34 Years | 6 (19.4%) | 0 (0.0%) |
| 35 to 44 Years | 101 (68.7%) | 21 (20.8%) |
| 45 to 54 Years | 24 (52.2%) | 0 (0.0%) |
| 55 to 59 Years | 3 (21.4%) | 0 (0.0%) |
| 60 to 64 Years | 9 (60.0%) | 0 (0.0%) |
| 65 to 74 Years | 3 (13.6%) | 0 (0.0%) |
| 75 Years and over | 0 (0.0%) | 0 (0.0%) |
| Total | 205 (47.7%) | 56 (27.3%) |
Employment Status by Educational Attainment in Tangipahoa
According to labor force statistics for Tangipahoa, 57.9% of individuals (151) out of the total population between 25 and 64 years of age (261) are in the labor force, with 13.9% or 21 of them being unemployed. The group with the highest labor force participation rate are those with the educational attainment of bachelor's degree or higher, with 100.0% or 9 individuals in the labor force. Within the labor force, individuals with less than high school education have the highest percentage of unemployment, with 46.7% or 21 of them being unemployed.
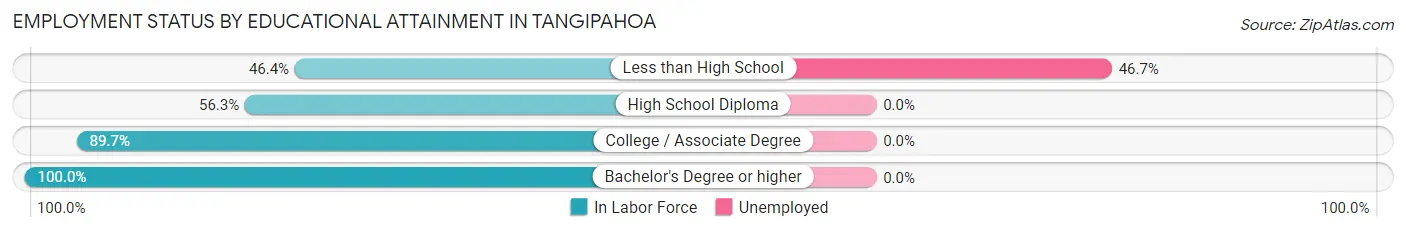
| Educational Attainment | In Labor Force | Unemployed |
| Less than High School | 45 (46.4%) | 45 (46.7%) |
| High School Diploma | 71 (56.3%) | 0 (0.0%) |
| College / Associate Degree | 26 (89.7%) | 0 (0.0%) |
| Bachelor's Degree or higher | 9 (100.0%) | 0 (0.0%) |
| Total | 151 (57.9%) | 36 (13.9%) |
Employment Occupations by Sex in Tangipahoa
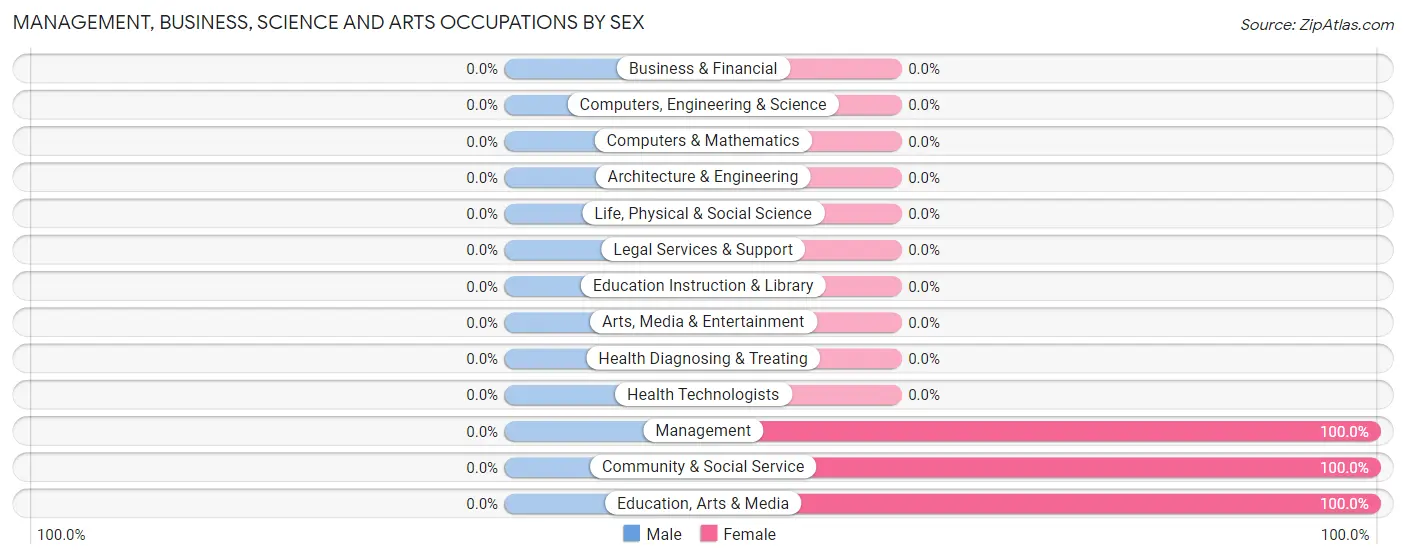
Management, Business, Science and Arts Occupations
The most common Management, Business, Science and Arts occupations in Tangipahoa are Management (17 | 11.4%), Community & Social Service (5 | 3.4%), and Education, Arts & Media (5 | 3.4%).
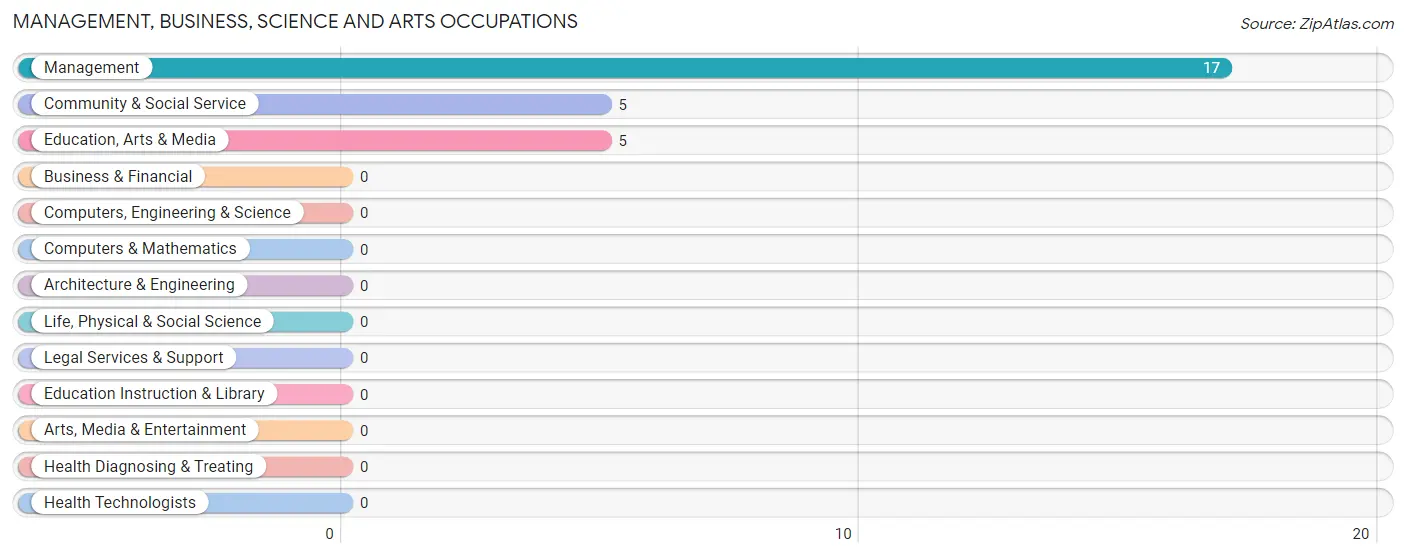
Management, Business, Science and Arts Occupations by Sex
| Occupation | Male | Female |
| Management | 0 (0.0%) | 17 (100.0%) |
| Business & Financial | 0 (0.0%) | 0 (0.0%) |
| Computers, Engineering & Science | 0 (0.0%) | 0 (0.0%) |
| Computers & Mathematics | 0 (0.0%) | 0 (0.0%) |
| Architecture & Engineering | 0 (0.0%) | 0 (0.0%) |
| Life, Physical & Social Science | 0 (0.0%) | 0 (0.0%) |
| Community & Social Service | 0 (0.0%) | 5 (100.0%) |
| Education, Arts & Media | 0 (0.0%) | 5 (100.0%) |
| Legal Services & Support | 0 (0.0%) | 0 (0.0%) |
| Education Instruction & Library | 0 (0.0%) | 0 (0.0%) |
| Arts, Media & Entertainment | 0 (0.0%) | 0 (0.0%) |
| Health Diagnosing & Treating | 0 (0.0%) | 0 (0.0%) |
| Health Technologists | 0 (0.0%) | 0 (0.0%) |
| Total (Category) | 0 (0.0%) | 22 (100.0%) |
| Total (Overall) | 55 (36.9%) | 94 (63.1%) |
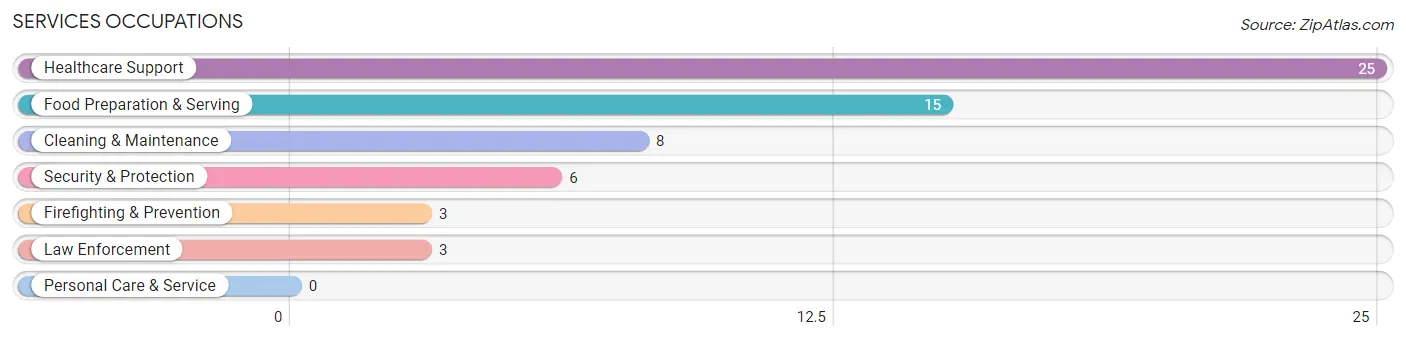
Services Occupations
The most common Services occupations in Tangipahoa are Healthcare Support (25 | 16.8%), Food Preparation & Serving (15 | 10.1%), Cleaning & Maintenance (8 | 5.4%), Security & Protection (6 | 4.0%), and Firefighting & Prevention (3 | 2.0%).
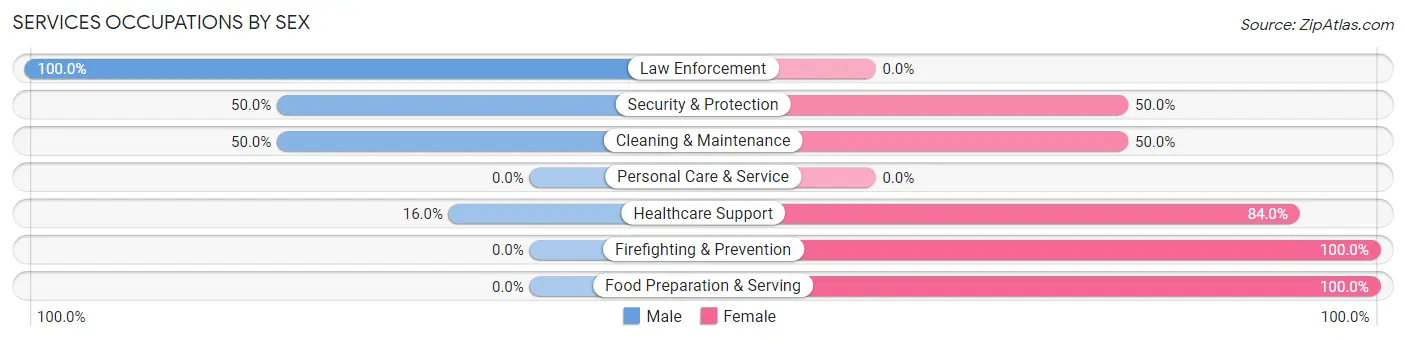
Services Occupations by Sex
Within the Services occupations in Tangipahoa, the most male-oriented occupations are Law Enforcement (100.0%), Security & Protection (50.0%), and Cleaning & Maintenance (50.0%), while the most female-oriented occupations are Firefighting & Prevention (100.0%), Food Preparation & Serving (100.0%), and Healthcare Support (84.0%).
| Occupation | Male | Female |
| Healthcare Support | 4 (16.0%) | 21 (84.0%) |
| Security & Protection | 3 (50.0%) | 3 (50.0%) |
| Firefighting & Prevention | 0 (0.0%) | 3 (100.0%) |
| Law Enforcement | 3 (100.0%) | 0 (0.0%) |
| Food Preparation & Serving | 0 (0.0%) | 15 (100.0%) |
| Cleaning & Maintenance | 4 (50.0%) | 4 (50.0%) |
| Personal Care & Service | 0 (0.0%) | 0 (0.0%) |
| Total (Category) | 11 (20.4%) | 43 (79.6%) |
| Total (Overall) | 55 (36.9%) | 94 (63.1%) |
Sales and Office Occupations
Sales and Office Occupations by Sex
| Occupation | Male | Female |
| Sales & Related | 0 (0.0%) | 0 (0.0%) |
| Office & Administration | 0 (0.0%) | 0 (0.0%) |
| Total (Category) | 0 (0.0%) | 0 (0.0%) |
| Total (Overall) | 55 (36.9%) | 94 (63.1%) |
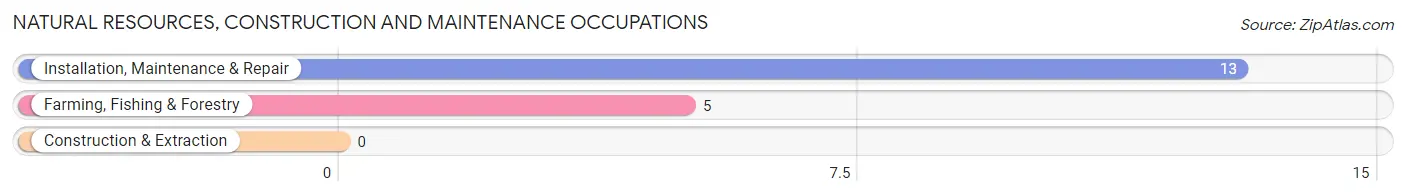
Natural Resources, Construction and Maintenance Occupations
The most common Natural Resources, Construction and Maintenance occupations in Tangipahoa are Installation, Maintenance & Repair (13 | 8.7%), and Farming, Fishing & Forestry (5 | 3.4%).
Natural Resources, Construction and Maintenance Occupations by Sex
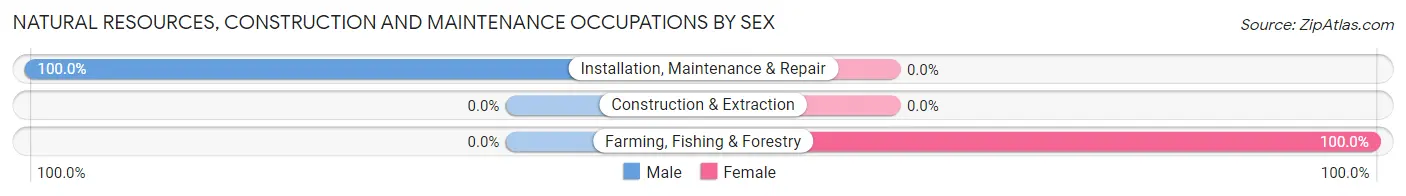
| Occupation | Male | Female |
| Farming, Fishing & Forestry | 0 (0.0%) | 5 (100.0%) |
| Construction & Extraction | 0 (0.0%) | 0 (0.0%) |
| Installation, Maintenance & Repair | 13 (100.0%) | 0 (0.0%) |
| Total (Category) | 13 (72.2%) | 5 (27.8%) |
| Total (Overall) | 55 (36.9%) | 94 (63.1%) |
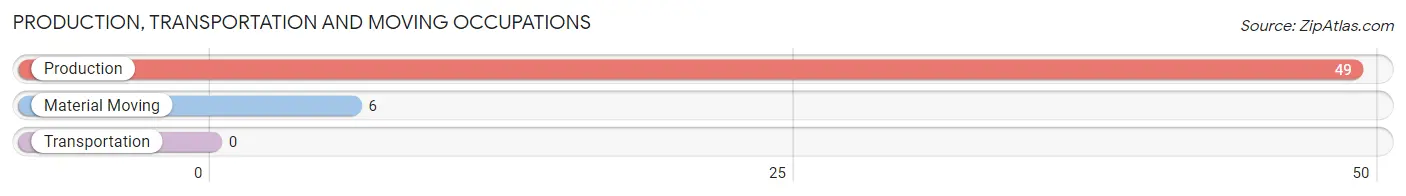
Production, Transportation and Moving Occupations
The most common Production, Transportation and Moving occupations in Tangipahoa are Production (49 | 32.9%), and Material Moving (6 | 4.0%).
Production, Transportation and Moving Occupations by Sex
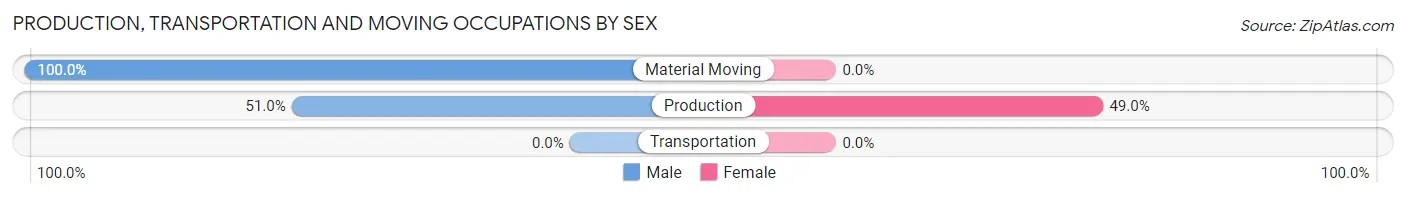
| Occupation | Male | Female |
| Production | 25 (51.0%) | 24 (49.0%) |
| Transportation | 0 (0.0%) | 0 (0.0%) |
| Material Moving | 6 (100.0%) | 0 (0.0%) |
| Total (Category) | 31 (56.4%) | 24 (43.6%) |
| Total (Overall) | 55 (36.9%) | 94 (63.1%) |
Employment Industries by Sex in Tangipahoa
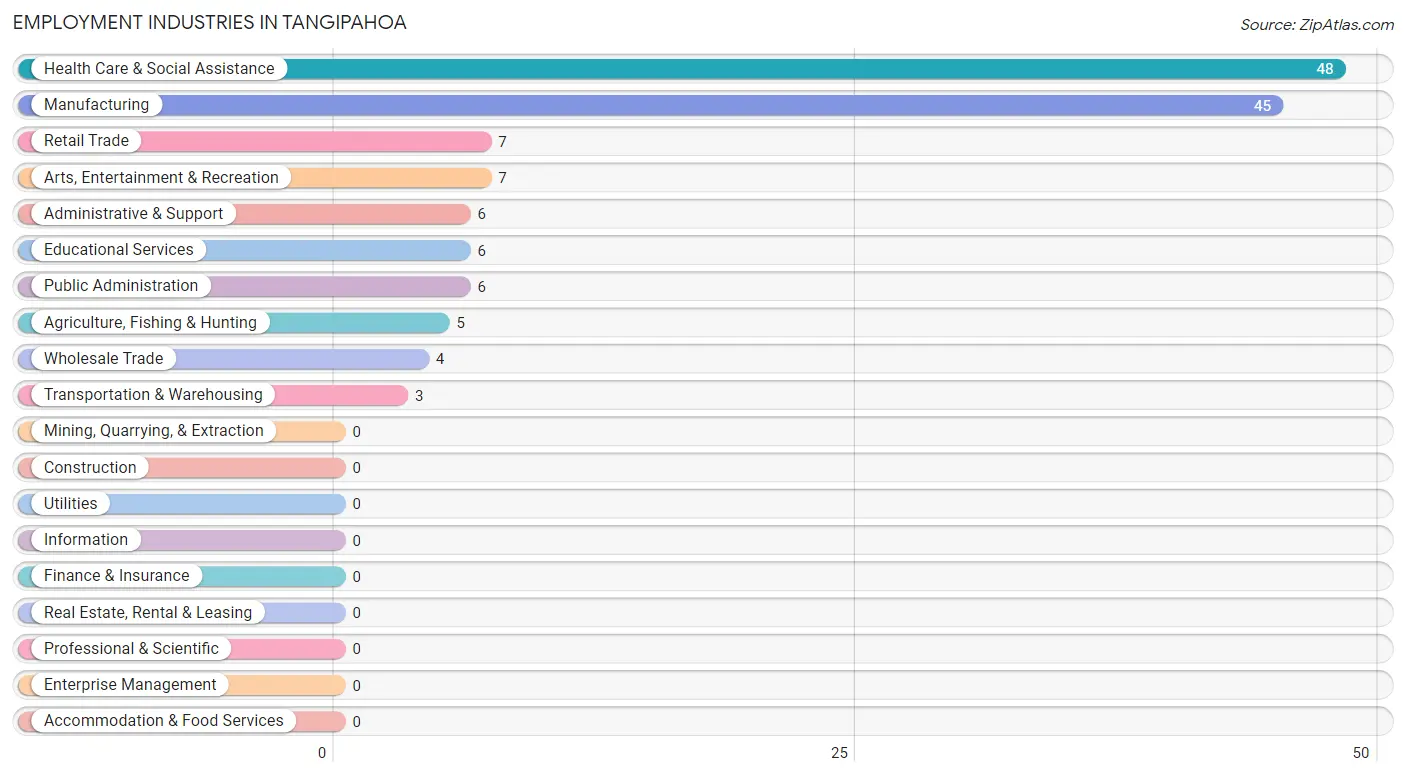
Employment Industries in Tangipahoa
The major employment industries in Tangipahoa include Health Care & Social Assistance (48 | 32.2%), Manufacturing (45 | 30.2%), Retail Trade (7 | 4.7%), Arts, Entertainment & Recreation (7 | 4.7%), and Administrative & Support (6 | 4.0%).
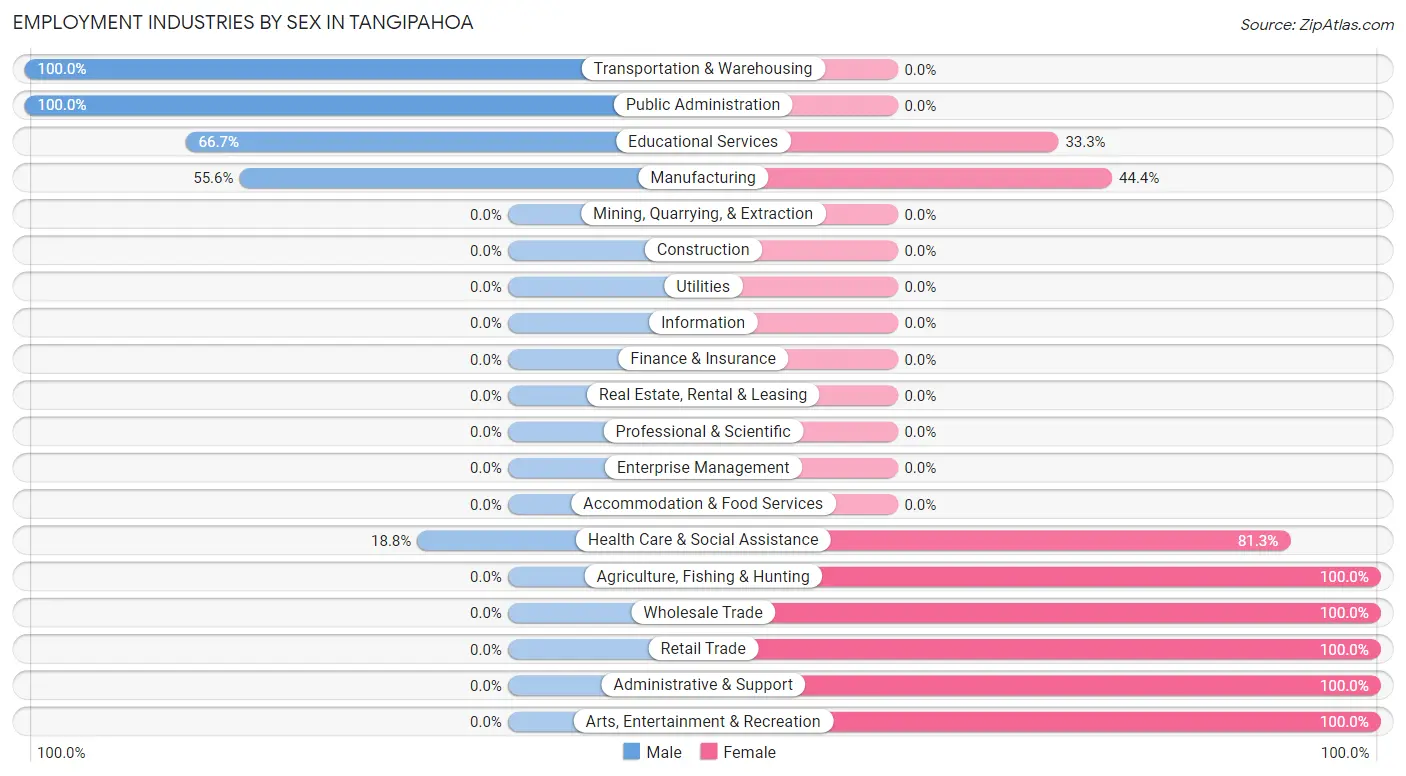
Employment Industries by Sex in Tangipahoa
The Tangipahoa industries that see more men than women are Transportation & Warehousing (100.0%), Public Administration (100.0%), and Educational Services (66.7%), whereas the industries that tend to have a higher number of women are Agriculture, Fishing & Hunting (100.0%), Wholesale Trade (100.0%), and Retail Trade (100.0%).
| Industry | Male | Female |
| Agriculture, Fishing & Hunting | 0 (0.0%) | 5 (100.0%) |
| Mining, Quarrying, & Extraction | 0 (0.0%) | 0 (0.0%) |
| Construction | 0 (0.0%) | 0 (0.0%) |
| Manufacturing | 25 (55.6%) | 20 (44.4%) |
| Wholesale Trade | 0 (0.0%) | 4 (100.0%) |
| Retail Trade | 0 (0.0%) | 7 (100.0%) |
| Transportation & Warehousing | 3 (100.0%) | 0 (0.0%) |
| Utilities | 0 (0.0%) | 0 (0.0%) |
| Information | 0 (0.0%) | 0 (0.0%) |
| Finance & Insurance | 0 (0.0%) | 0 (0.0%) |
| Real Estate, Rental & Leasing | 0 (0.0%) | 0 (0.0%) |
| Professional & Scientific | 0 (0.0%) | 0 (0.0%) |
| Enterprise Management | 0 (0.0%) | 0 (0.0%) |
| Administrative & Support | 0 (0.0%) | 6 (100.0%) |
| Educational Services | 4 (66.7%) | 2 (33.3%) |
| Health Care & Social Assistance | 9 (18.8%) | 39 (81.2%) |
| Arts, Entertainment & Recreation | 0 (0.0%) | 7 (100.0%) |
| Accommodation & Food Services | 0 (0.0%) | 0 (0.0%) |
| Public Administration | 6 (100.0%) | 0 (0.0%) |
| Total | 55 (36.9%) | 94 (63.1%) |
Education in Tangipahoa
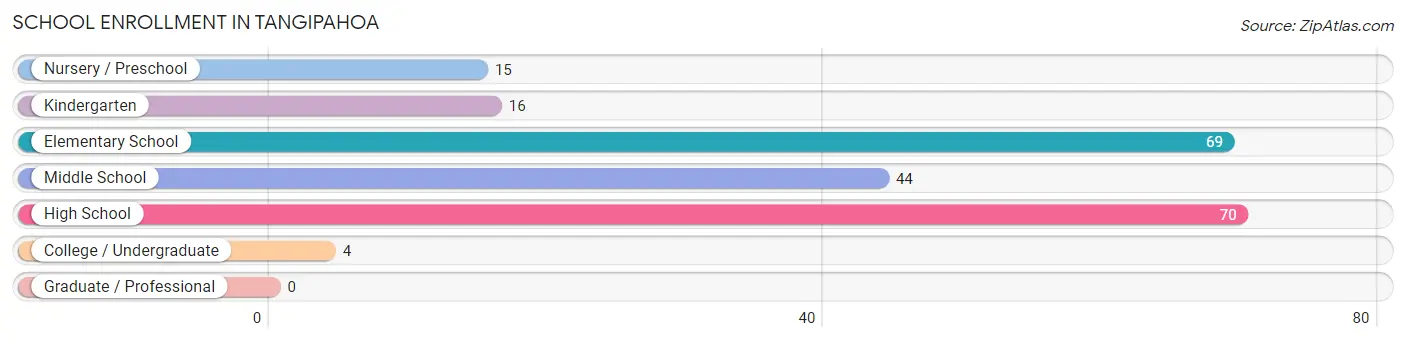
School Enrollment in Tangipahoa
The most common levels of schooling among the 218 students in Tangipahoa are high school (70 | 32.1%), elementary school (69 | 31.7%), and middle school (44 | 20.2%).
| School Level | # Students | % Students |
| Nursery / Preschool | 15 | 6.9% |
| Kindergarten | 16 | 7.3% |
| Elementary School | 69 | 31.7% |
| Middle School | 44 | 20.2% |
| High School | 70 | 32.1% |
| College / Undergraduate | 4 | 1.8% |
| Graduate / Professional | 0 | 0.0% |
| Total | 218 | 100.0% |
School Enrollment by Age by Funding Source in Tangipahoa
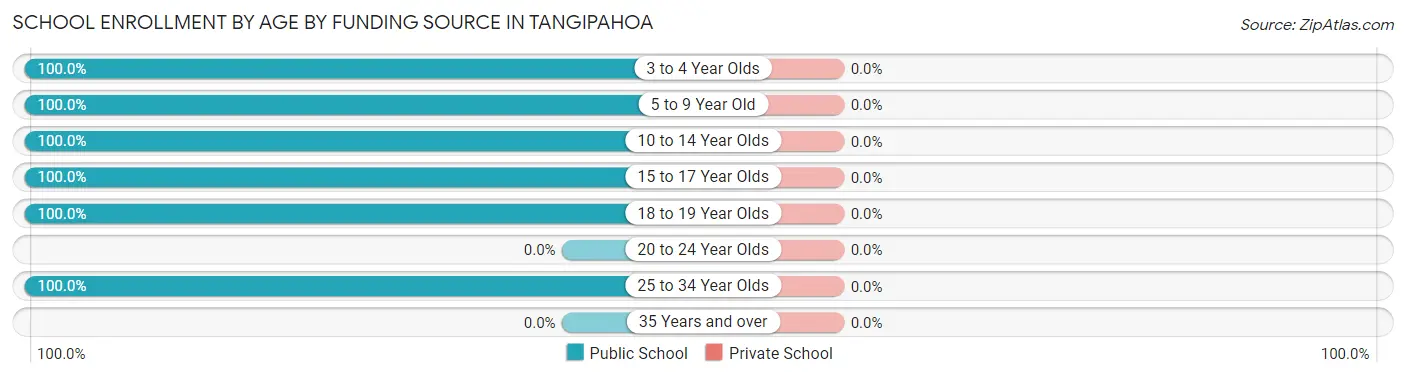
| Age Bracket | Public School | Private School |
| 3 to 4 Year Olds | 13 (100.0%) | 0 (0.0%) |
| 5 to 9 Year Old | 87 (100.0%) | 0 (0.0%) |
| 10 to 14 Year Olds | 44 (100.0%) | 0 (0.0%) |
| 15 to 17 Year Olds | 63 (100.0%) | 0 (0.0%) |
| 18 to 19 Year Olds | 7 (100.0%) | 0 (0.0%) |
| 20 to 24 Year Olds | 0 (0.0%) | 0 (0.0%) |
| 25 to 34 Year Olds | 4 (100.0%) | 0 (0.0%) |
| 35 Years and over | 0 (0.0%) | 0 (0.0%) |
| Total | 218 (100.0%) | 0 (0.0%) |
Educational Attainment by Field of Study in Tangipahoa
Computers & mathematics (5 | 35.7%), business (5 | 35.7%), and psychology (4 | 28.6%) are the most common fields of study among 14 individuals in Tangipahoa who have obtained a bachelor's degree or higher.
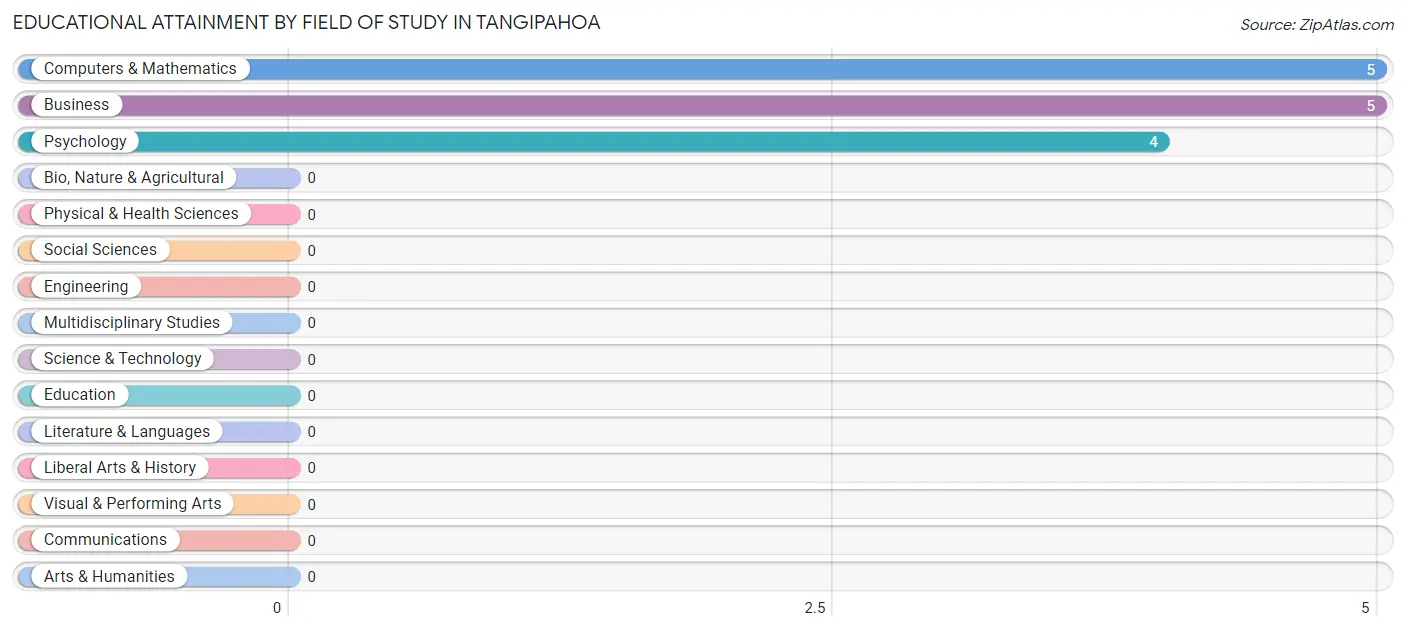
| Field of Study | # Graduates | % Graduates |
| Computers & Mathematics | 5 | 35.7% |
| Bio, Nature & Agricultural | 0 | 0.0% |
| Physical & Health Sciences | 0 | 0.0% |
| Psychology | 4 | 28.6% |
| Social Sciences | 0 | 0.0% |
| Engineering | 0 | 0.0% |
| Multidisciplinary Studies | 0 | 0.0% |
| Science & Technology | 0 | 0.0% |
| Business | 5 | 35.7% |
| Education | 0 | 0.0% |
| Literature & Languages | 0 | 0.0% |
| Liberal Arts & History | 0 | 0.0% |
| Visual & Performing Arts | 0 | 0.0% |
| Communications | 0 | 0.0% |
| Arts & Humanities | 0 | 0.0% |
| Total | 14 | 100.0% |
Transportation & Commute in Tangipahoa
Vehicle Availability by Sex in Tangipahoa
The most prevalent vehicle ownership categories in Tangipahoa are males with 2 vehicles (21, accounting for 38.2%) and females with 2 vehicles (21, making up 24.7%).
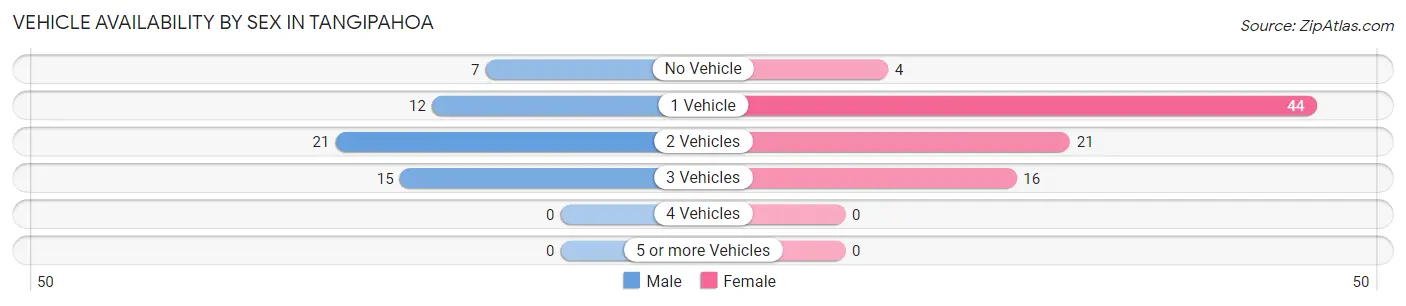
| Vehicles Available | Male | Female |
| No Vehicle | 7 (12.7%) | 4 (4.7%) |
| 1 Vehicle | 12 (21.8%) | 44 (51.8%) |
| 2 Vehicles | 21 (38.2%) | 21 (24.7%) |
| 3 Vehicles | 15 (27.3%) | 16 (18.8%) |
| 4 Vehicles | 0 (0.0%) | 0 (0.0%) |
| 5 or more Vehicles | 0 (0.0%) | 0 (0.0%) |
| Total | 55 (100.0%) | 85 (100.0%) |
Commute Time in Tangipahoa
The most frequently occuring commute durations in Tangipahoa are 45 to 59 minutes (39 commuters, 27.9%), 25 to 29 minutes (32 commuters, 22.9%), and 30 to 34 minutes (24 commuters, 17.1%).
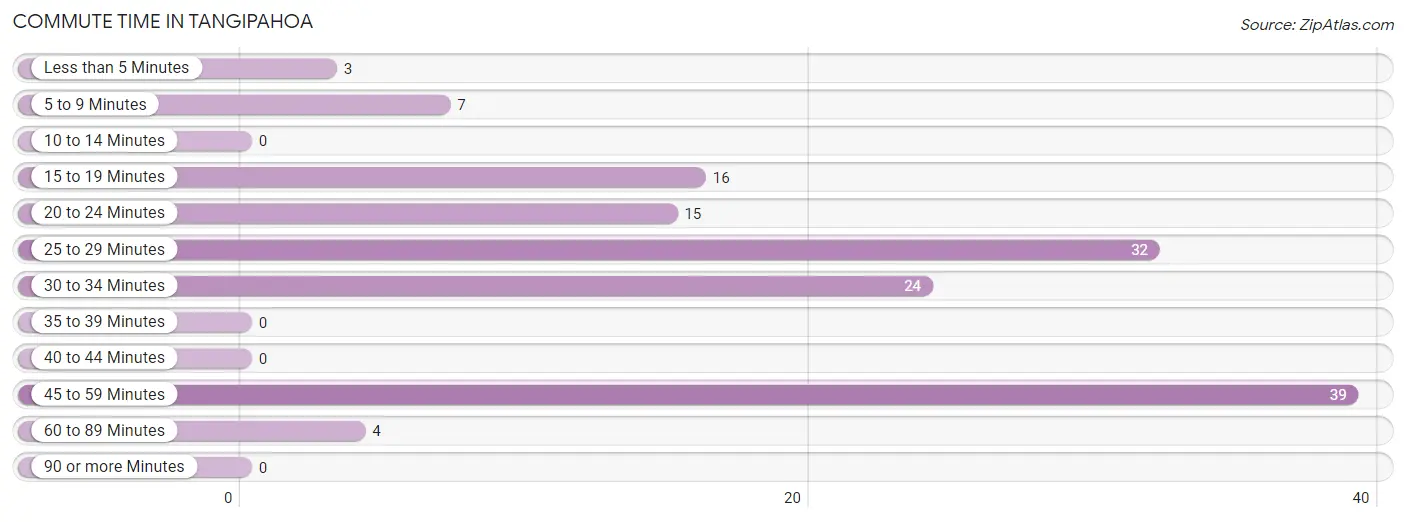
| Commute Time | # Commuters | % Commuters |
| Less than 5 Minutes | 3 | 2.1% |
| 5 to 9 Minutes | 7 | 5.0% |
| 10 to 14 Minutes | 0 | 0.0% |
| 15 to 19 Minutes | 16 | 11.4% |
| 20 to 24 Minutes | 15 | 10.7% |
| 25 to 29 Minutes | 32 | 22.9% |
| 30 to 34 Minutes | 24 | 17.1% |
| 35 to 39 Minutes | 0 | 0.0% |
| 40 to 44 Minutes | 0 | 0.0% |
| 45 to 59 Minutes | 39 | 27.9% |
| 60 to 89 Minutes | 4 | 2.9% |
| 90 or more Minutes | 0 | 0.0% |
Commute Time by Sex in Tangipahoa
The most common commute times in Tangipahoa are 25 to 29 minutes (21 commuters, 38.2%) for males and 45 to 59 minutes (28 commuters, 32.9%) for females.
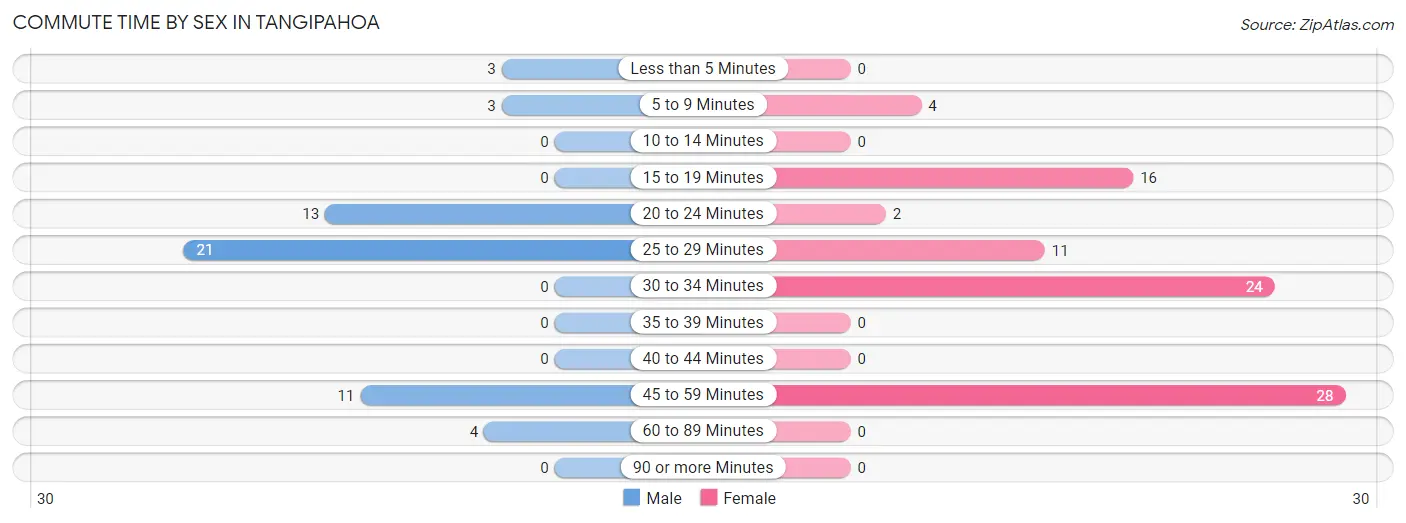
| Commute Time | Male | Female |
| Less than 5 Minutes | 3 (5.4%) | 0 (0.0%) |
| 5 to 9 Minutes | 3 (5.4%) | 4 (4.7%) |
| 10 to 14 Minutes | 0 (0.0%) | 0 (0.0%) |
| 15 to 19 Minutes | 0 (0.0%) | 16 (18.8%) |
| 20 to 24 Minutes | 13 (23.6%) | 2 (2.4%) |
| 25 to 29 Minutes | 21 (38.2%) | 11 (12.9%) |
| 30 to 34 Minutes | 0 (0.0%) | 24 (28.2%) |
| 35 to 39 Minutes | 0 (0.0%) | 0 (0.0%) |
| 40 to 44 Minutes | 0 (0.0%) | 0 (0.0%) |
| 45 to 59 Minutes | 11 (20.0%) | 28 (32.9%) |
| 60 to 89 Minutes | 4 (7.3%) | 0 (0.0%) |
| 90 or more Minutes | 0 (0.0%) | 0 (0.0%) |
Time of Departure to Work by Sex in Tangipahoa
The most frequent times of departure to work in Tangipahoa are 6:00 AM to 6:29 AM (25, 45.5%) for males and 12:00 PM to 3:59 PM (22, 25.9%) for females.
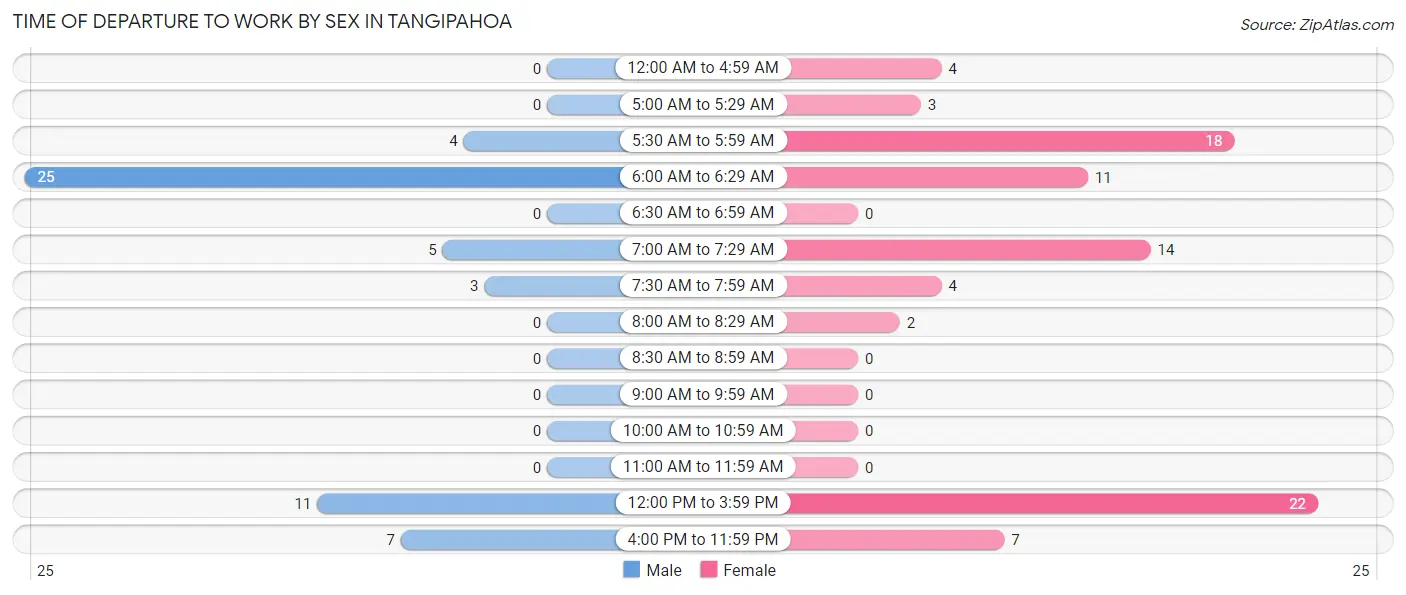
| Time of Departure | Male | Female |
| 12:00 AM to 4:59 AM | 0 (0.0%) | 4 (4.7%) |
| 5:00 AM to 5:29 AM | 0 (0.0%) | 3 (3.5%) |
| 5:30 AM to 5:59 AM | 4 (7.3%) | 18 (21.2%) |
| 6:00 AM to 6:29 AM | 25 (45.5%) | 11 (12.9%) |
| 6:30 AM to 6:59 AM | 0 (0.0%) | 0 (0.0%) |
| 7:00 AM to 7:29 AM | 5 (9.1%) | 14 (16.5%) |
| 7:30 AM to 7:59 AM | 3 (5.4%) | 4 (4.7%) |
| 8:00 AM to 8:29 AM | 0 (0.0%) | 2 (2.4%) |
| 8:30 AM to 8:59 AM | 0 (0.0%) | 0 (0.0%) |
| 9:00 AM to 9:59 AM | 0 (0.0%) | 0 (0.0%) |
| 10:00 AM to 10:59 AM | 0 (0.0%) | 0 (0.0%) |
| 11:00 AM to 11:59 AM | 0 (0.0%) | 0 (0.0%) |
| 12:00 PM to 3:59 PM | 11 (20.0%) | 22 (25.9%) |
| 4:00 PM to 11:59 PM | 7 (12.7%) | 7 (8.2%) |
| Total | 55 (100.0%) | 85 (100.0%) |
Housing Occupancy in Tangipahoa
Occupancy by Ownership in Tangipahoa
Of the total 186 dwellings in Tangipahoa, owner-occupied units account for 116 (62.4%), while renter-occupied units make up 70 (37.6%).
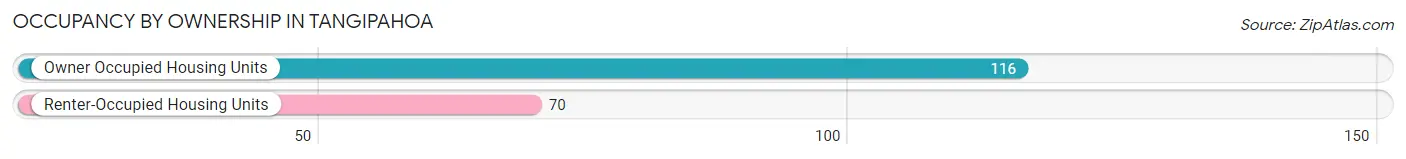
| Occupancy | # Housing Units | % Housing Units |
| Owner Occupied Housing Units | 116 | 62.4% |
| Renter-Occupied Housing Units | 70 | 37.6% |
| Total Occupied Housing Units | 186 | 100.0% |
Occupancy by Household Size in Tangipahoa
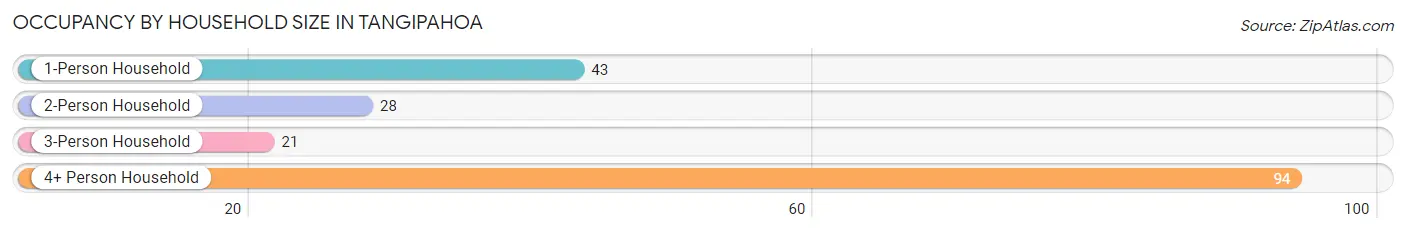
| Household Size | # Housing Units | % Housing Units |
| 1-Person Household | 43 | 23.1% |
| 2-Person Household | 28 | 15.0% |
| 3-Person Household | 21 | 11.3% |
| 4+ Person Household | 94 | 50.5% |
| Total Housing Units | 186 | 100.0% |
Occupancy by Ownership by Household Size in Tangipahoa
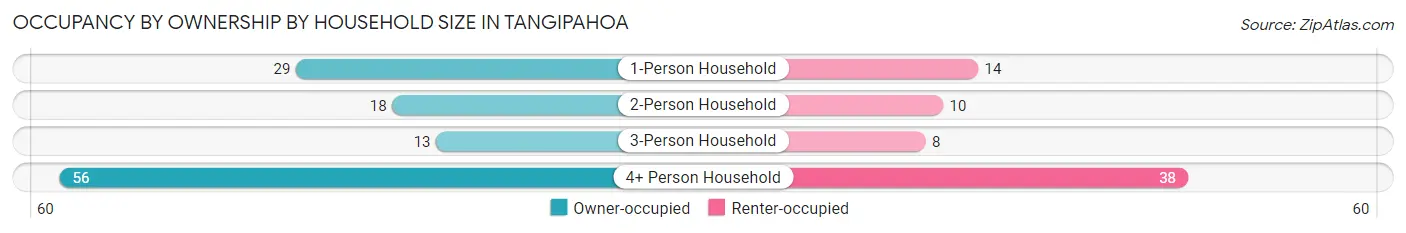
| Household Size | Owner-occupied | Renter-occupied |
| 1-Person Household | 29 (67.4%) | 14 (32.6%) |
| 2-Person Household | 18 (64.3%) | 10 (35.7%) |
| 3-Person Household | 13 (61.9%) | 8 (38.1%) |
| 4+ Person Household | 56 (59.6%) | 38 (40.4%) |
| Total Housing Units | 116 (62.4%) | 70 (37.6%) |
Occupancy by Educational Attainment in Tangipahoa
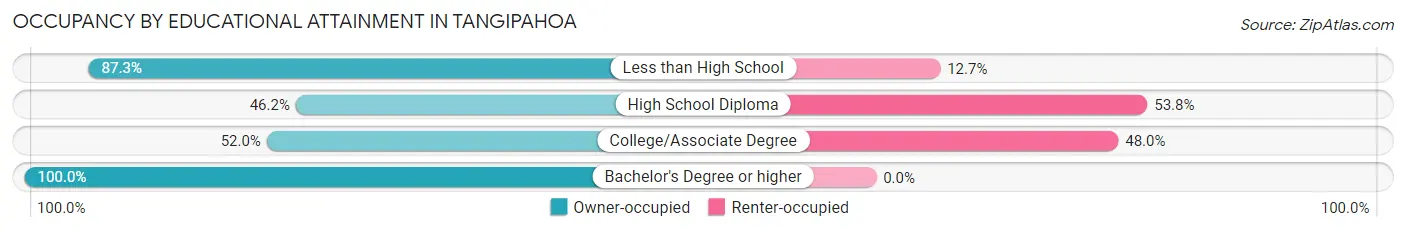
| Household Size | Owner-occupied | Renter-occupied |
| Less than High School | 55 (87.3%) | 8 (12.7%) |
| High School Diploma | 43 (46.2%) | 50 (53.8%) |
| College/Associate Degree | 13 (52.0%) | 12 (48.0%) |
| Bachelor's Degree or higher | 5 (100.0%) | 0 (0.0%) |
Occupancy by Age of Householder in Tangipahoa
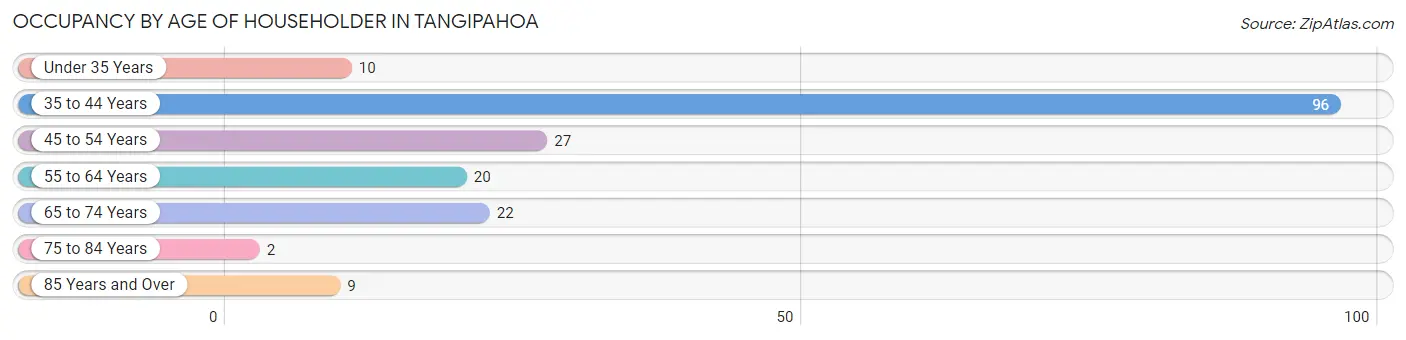
| Age Bracket | # Households | % Households |
| Under 35 Years | 10 | 5.4% |
| 35 to 44 Years | 96 | 51.6% |
| 45 to 54 Years | 27 | 14.5% |
| 55 to 64 Years | 20 | 10.7% |
| 65 to 74 Years | 22 | 11.8% |
| 75 to 84 Years | 2 | 1.1% |
| 85 Years and Over | 9 | 4.8% |
| Total | 186 | 100.0% |
Housing Finances in Tangipahoa
Median Income by Occupancy in Tangipahoa
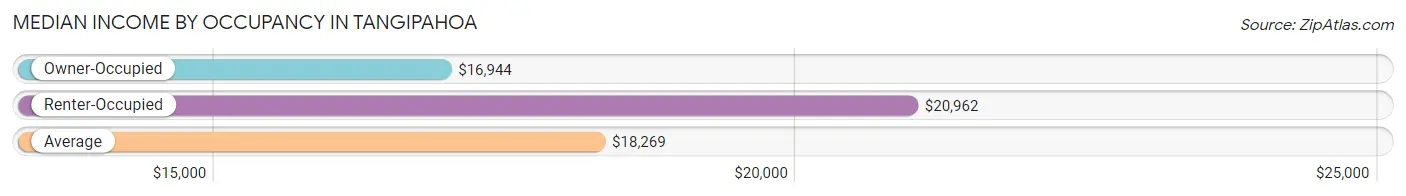
| Occupancy Type | # Households | Median Income |
| Owner-Occupied | 116 (62.4%) | $16,944 |
| Renter-Occupied | 70 (37.6%) | $20,962 |
| Average | 186 (100.0%) | $18,269 |
Occupancy by Householder Income Bracket in Tangipahoa
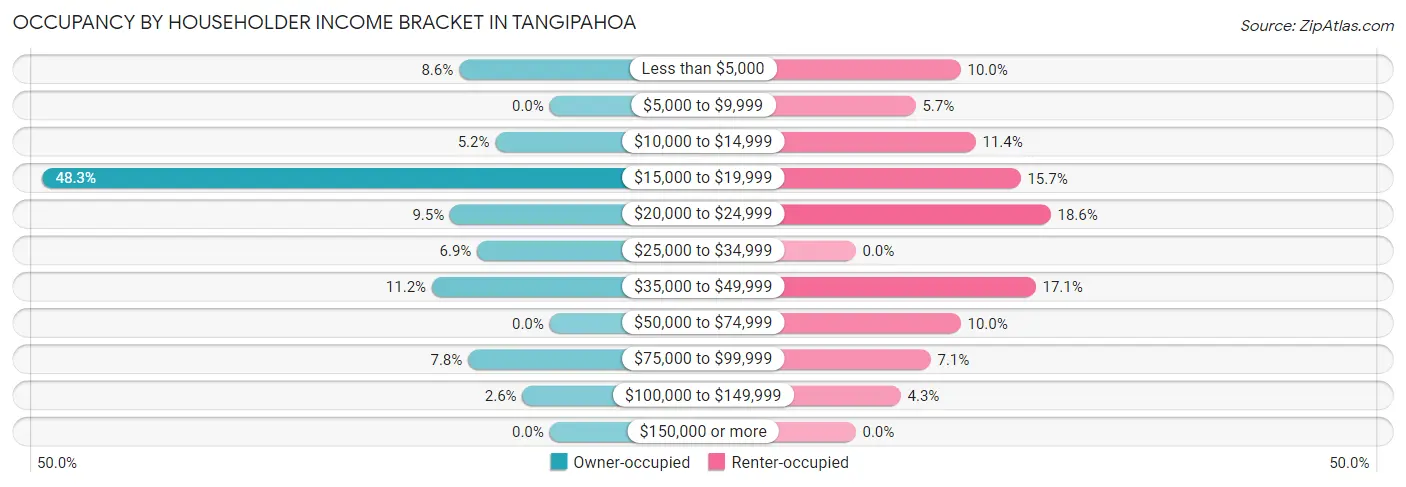
| Income Bracket | Owner-occupied | Renter-occupied |
| Less than $5,000 | 10 (8.6%) | 7 (10.0%) |
| $5,000 to $9,999 | 0 (0.0%) | 4 (5.7%) |
| $10,000 to $14,999 | 6 (5.2%) | 8 (11.4%) |
| $15,000 to $19,999 | 56 (48.3%) | 11 (15.7%) |
| $20,000 to $24,999 | 11 (9.5%) | 13 (18.6%) |
| $25,000 to $34,999 | 8 (6.9%) | 0 (0.0%) |
| $35,000 to $49,999 | 13 (11.2%) | 12 (17.1%) |
| $50,000 to $74,999 | 0 (0.0%) | 7 (10.0%) |
| $75,000 to $99,999 | 9 (7.8%) | 5 (7.1%) |
| $100,000 to $149,999 | 3 (2.6%) | 3 (4.3%) |
| $150,000 or more | 0 (0.0%) | 0 (0.0%) |
| Total | 116 (100.0%) | 70 (100.0%) |
Monthly Housing Cost Tiers in Tangipahoa
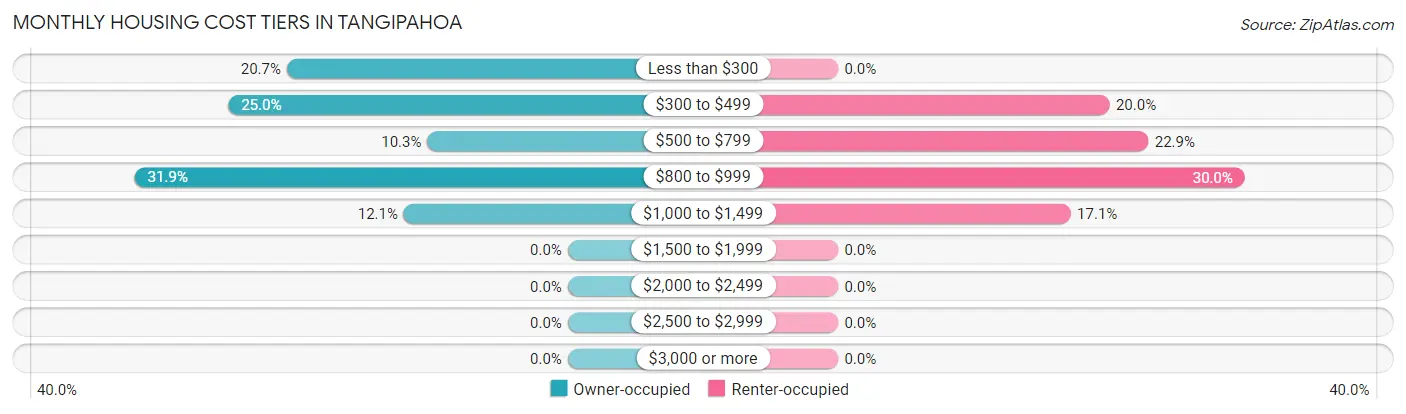
| Monthly Cost | Owner-occupied | Renter-occupied |
| Less than $300 | 24 (20.7%) | 0 (0.0%) |
| $300 to $499 | 29 (25.0%) | 14 (20.0%) |
| $500 to $799 | 12 (10.3%) | 16 (22.9%) |
| $800 to $999 | 37 (31.9%) | 21 (30.0%) |
| $1,000 to $1,499 | 14 (12.1%) | 12 (17.1%) |
| $1,500 to $1,999 | 0 (0.0%) | 0 (0.0%) |
| $2,000 to $2,499 | 0 (0.0%) | 0 (0.0%) |
| $2,500 to $2,999 | 0 (0.0%) | 0 (0.0%) |
| $3,000 or more | 0 (0.0%) | 0 (0.0%) |
| Total | 116 (100.0%) | 70 (100.0%) |
Physical Housing Characteristics in Tangipahoa
Housing Structures in Tangipahoa
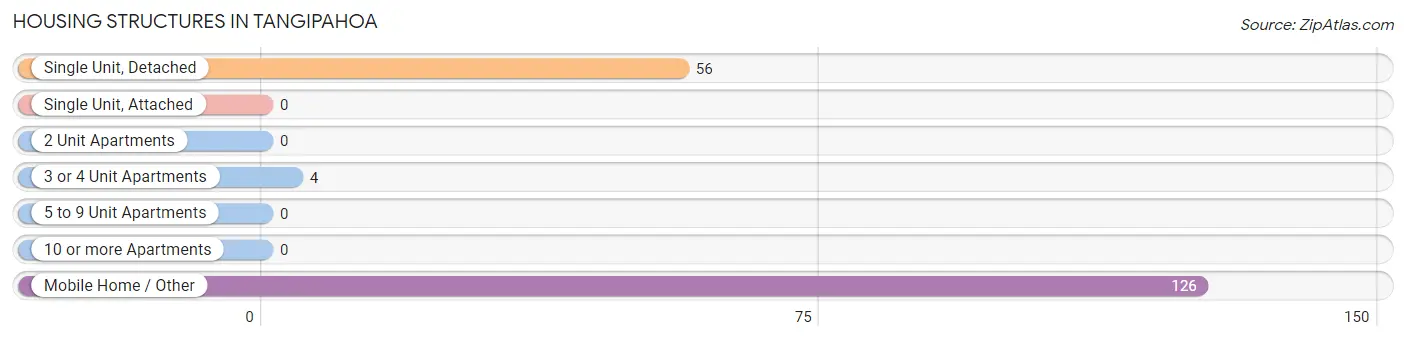
| Structure Type | # Housing Units | % Housing Units |
| Single Unit, Detached | 56 | 30.1% |
| Single Unit, Attached | 0 | 0.0% |
| 2 Unit Apartments | 0 | 0.0% |
| 3 or 4 Unit Apartments | 4 | 2.1% |
| 5 to 9 Unit Apartments | 0 | 0.0% |
| 10 or more Apartments | 0 | 0.0% |
| Mobile Home / Other | 126 | 67.7% |
| Total | 186 | 100.0% |
Housing Structures by Occupancy in Tangipahoa
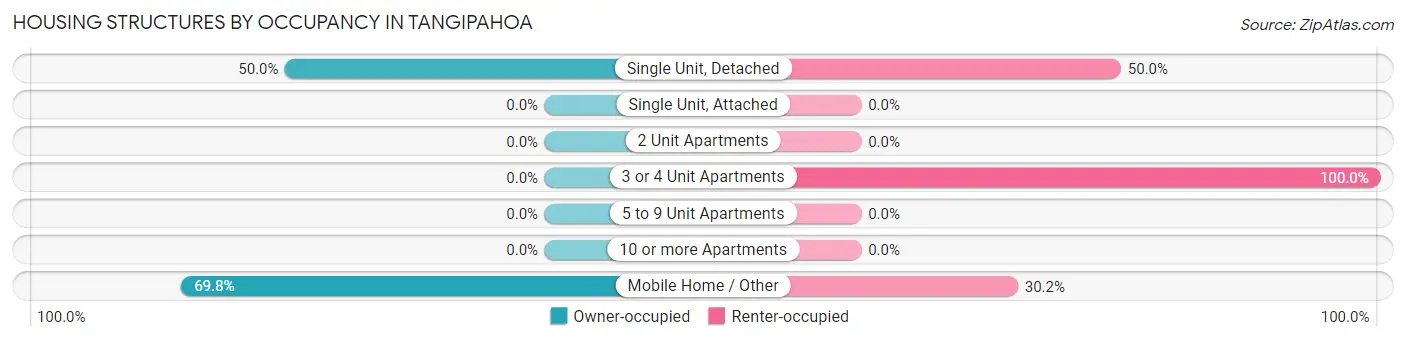
| Structure Type | Owner-occupied | Renter-occupied |
| Single Unit, Detached | 28 (50.0%) | 28 (50.0%) |
| Single Unit, Attached | 0 (0.0%) | 0 (0.0%) |
| 2 Unit Apartments | 0 (0.0%) | 0 (0.0%) |
| 3 or 4 Unit Apartments | 0 (0.0%) | 4 (100.0%) |
| 5 to 9 Unit Apartments | 0 (0.0%) | 0 (0.0%) |
| 10 or more Apartments | 0 (0.0%) | 0 (0.0%) |
| Mobile Home / Other | 88 (69.8%) | 38 (30.2%) |
| Total | 116 (62.4%) | 70 (37.6%) |
Housing Structures by Number of Rooms in Tangipahoa
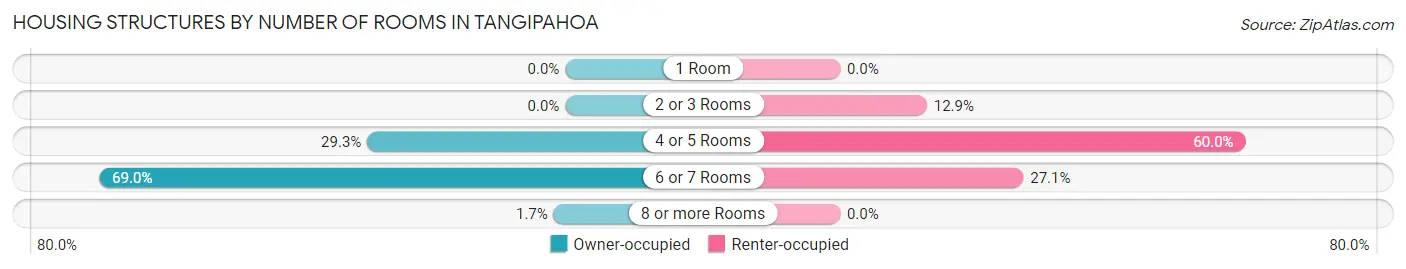
| Number of Rooms | Owner-occupied | Renter-occupied |
| 1 Room | 0 (0.0%) | 0 (0.0%) |
| 2 or 3 Rooms | 0 (0.0%) | 9 (12.9%) |
| 4 or 5 Rooms | 34 (29.3%) | 42 (60.0%) |
| 6 or 7 Rooms | 80 (69.0%) | 19 (27.1%) |
| 8 or more Rooms | 2 (1.7%) | 0 (0.0%) |
| Total | 116 (100.0%) | 70 (100.0%) |
Housing Structure by Heating Type in Tangipahoa
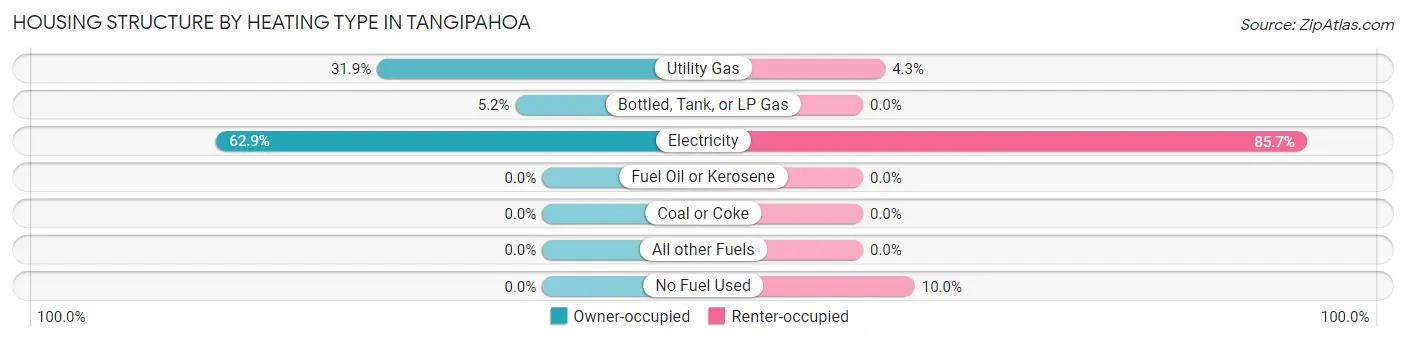
| Heating Type | Owner-occupied | Renter-occupied |
| Utility Gas | 37 (31.9%) | 3 (4.3%) |
| Bottled, Tank, or LP Gas | 6 (5.2%) | 0 (0.0%) |
| Electricity | 73 (62.9%) | 60 (85.7%) |
| Fuel Oil or Kerosene | 0 (0.0%) | 0 (0.0%) |
| Coal or Coke | 0 (0.0%) | 0 (0.0%) |
| All other Fuels | 0 (0.0%) | 0 (0.0%) |
| No Fuel Used | 0 (0.0%) | 7 (10.0%) |
| Total | 116 (100.0%) | 70 (100.0%) |
Household Vehicle Usage in Tangipahoa
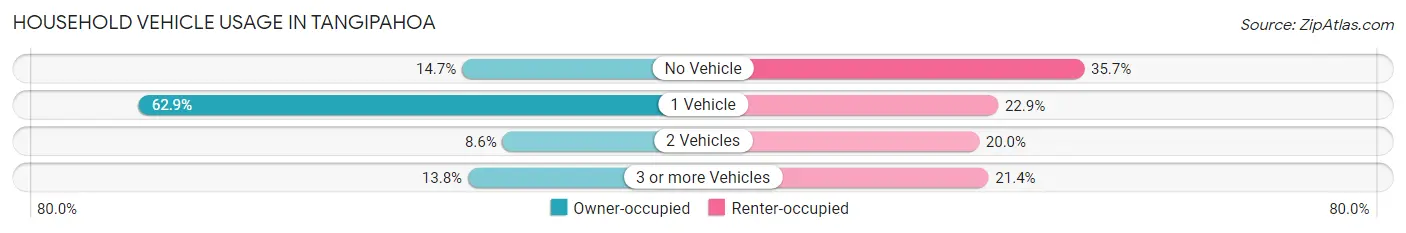
| Vehicles per Household | Owner-occupied | Renter-occupied |
| No Vehicle | 17 (14.7%) | 25 (35.7%) |
| 1 Vehicle | 73 (62.9%) | 16 (22.9%) |
| 2 Vehicles | 10 (8.6%) | 14 (20.0%) |
| 3 or more Vehicles | 16 (13.8%) | 15 (21.4%) |
| Total | 116 (100.0%) | 70 (100.0%) |
Real Estate & Mortgages in Tangipahoa
Real Estate and Mortgage Overview in Tangipahoa
| Characteristic | Without Mortgage | With Mortgage |
| Housing Units | 61 | 55 |
| Median Property Value | $46,800 | $23,400 |
| Median Household Income | $17,132 | $0 |
| Monthly Housing Costs | $366 | $0 |
| Real Estate Taxes | $199 | $41 |
Property Value by Mortgage Status in Tangipahoa
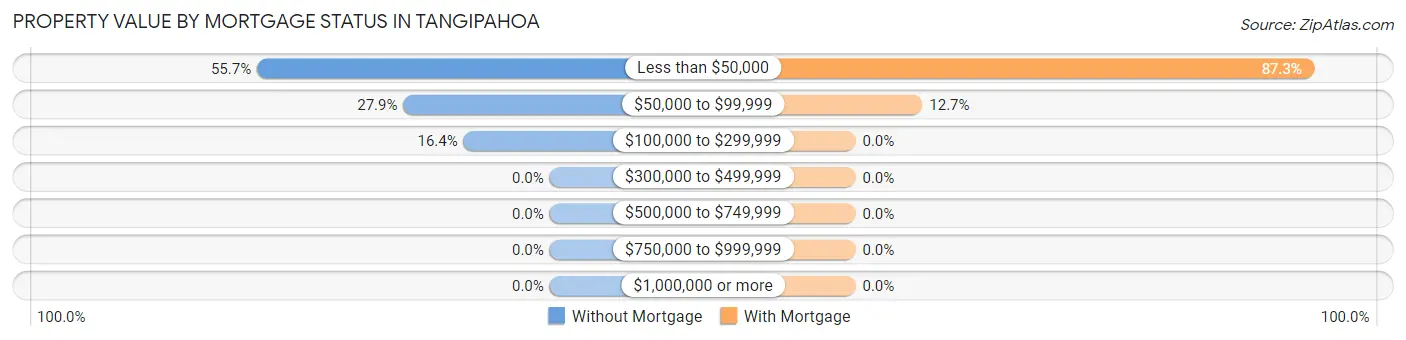
| Property Value | Without Mortgage | With Mortgage |
| Less than $50,000 | 34 (55.7%) | 48 (87.3%) |
| $50,000 to $99,999 | 17 (27.9%) | 7 (12.7%) |
| $100,000 to $299,999 | 10 (16.4%) | 0 (0.0%) |
| $300,000 to $499,999 | 0 (0.0%) | 0 (0.0%) |
| $500,000 to $749,999 | 0 (0.0%) | 0 (0.0%) |
| $750,000 to $999,999 | 0 (0.0%) | 0 (0.0%) |
| $1,000,000 or more | 0 (0.0%) | 0 (0.0%) |
| Total | 61 (100.0%) | 55 (100.0%) |
Household Income by Mortgage Status in Tangipahoa
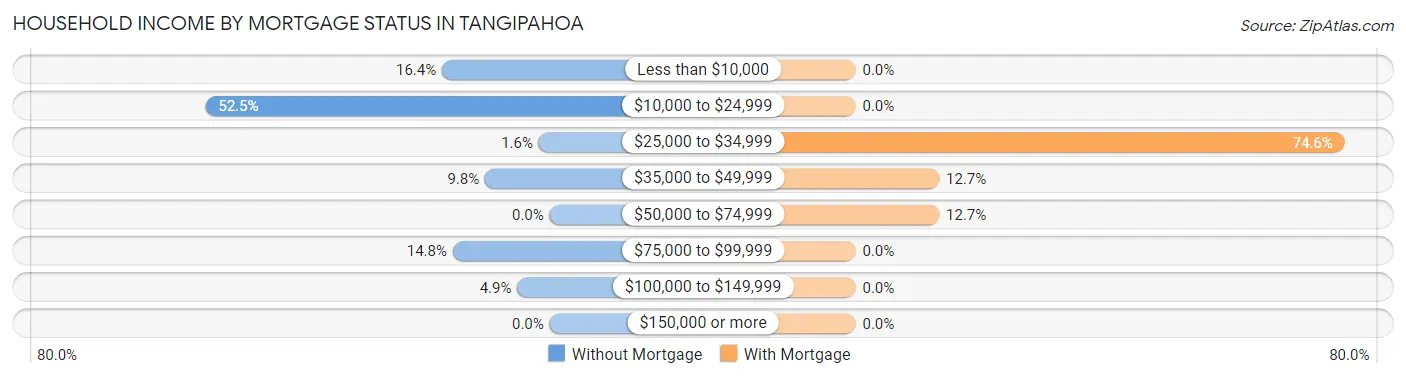
| Household Income | Without Mortgage | With Mortgage |
| Less than $10,000 | 10 (16.4%) | 0 (0.0%) |
| $10,000 to $24,999 | 32 (52.5%) | 0 (0.0%) |
| $25,000 to $34,999 | 1 (1.6%) | 41 (74.6%) |
| $35,000 to $49,999 | 6 (9.8%) | 7 (12.7%) |
| $50,000 to $74,999 | 0 (0.0%) | 7 (12.7%) |
| $75,000 to $99,999 | 9 (14.7%) | 0 (0.0%) |
| $100,000 to $149,999 | 3 (4.9%) | 0 (0.0%) |
| $150,000 or more | 0 (0.0%) | 0 (0.0%) |
| Total | 61 (100.0%) | 55 (100.0%) |
Property Value to Household Income Ratio in Tangipahoa
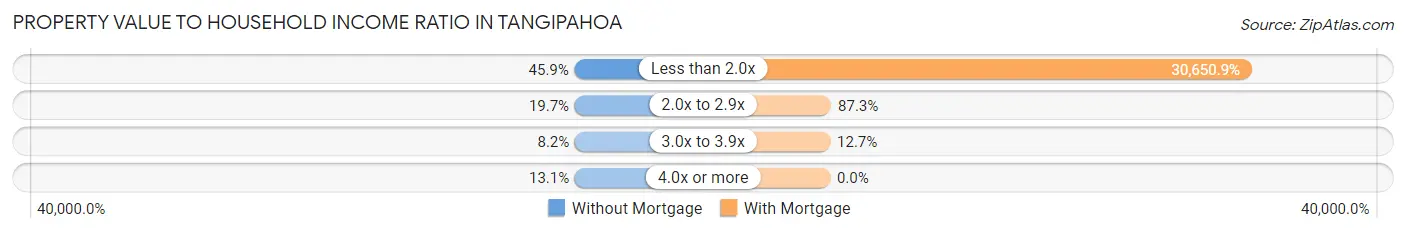
| Value-to-Income Ratio | Without Mortgage | With Mortgage |
| Less than 2.0x | 28 (45.9%) | 16,858 (30,650.9%) |
| 2.0x to 2.9x | 12 (19.7%) | 48 (87.3%) |
| 3.0x to 3.9x | 5 (8.2%) | 7 (12.7%) |
| 4.0x or more | 8 (13.1%) | 0 (0.0%) |
| Total | 61 (100.0%) | 55 (100.0%) |
Real Estate Taxes by Mortgage Status in Tangipahoa
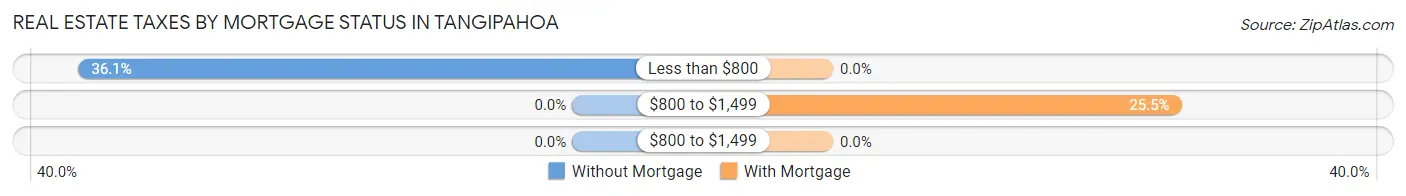
| Property Taxes | Without Mortgage | With Mortgage |
| Less than $800 | 22 (36.1%) | 0 (0.0%) |
| $800 to $1,499 | 0 (0.0%) | 14 (25.5%) |
| $800 to $1,499 | 0 (0.0%) | 0 (0.0%) |
| Total | 61 (100.0%) | 55 (100.0%) |
Health & Disability in Tangipahoa
Health Insurance Coverage by Age in Tangipahoa
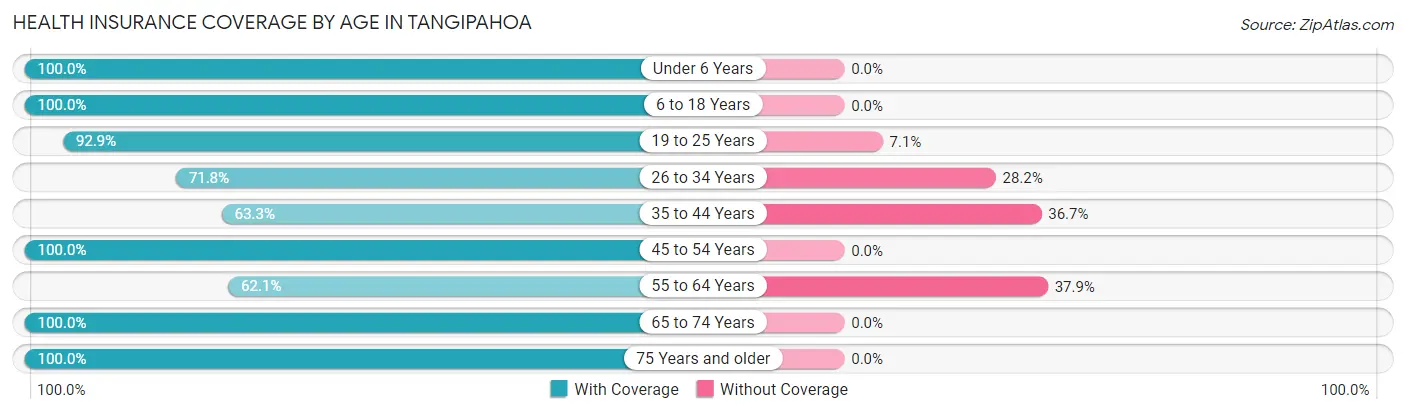
| Age Bracket | With Coverage | Without Coverage |
| Under 6 Years | 89 (100.0%) | 0 (0.0%) |
| 6 to 18 Years | 196 (100.0%) | 0 (0.0%) |
| 19 to 25 Years | 52 (92.9%) | 4 (7.1%) |
| 26 to 34 Years | 28 (71.8%) | 11 (28.2%) |
| 35 to 44 Years | 93 (63.3%) | 54 (36.7%) |
| 45 to 54 Years | 46 (100.0%) | 0 (0.0%) |
| 55 to 64 Years | 18 (62.1%) | 11 (37.9%) |
| 65 to 74 Years | 22 (100.0%) | 0 (0.0%) |
| 75 Years and older | 14 (100.0%) | 0 (0.0%) |
| Total | 558 (87.5%) | 80 (12.5%) |
Health Insurance Coverage by Citizenship Status in Tangipahoa
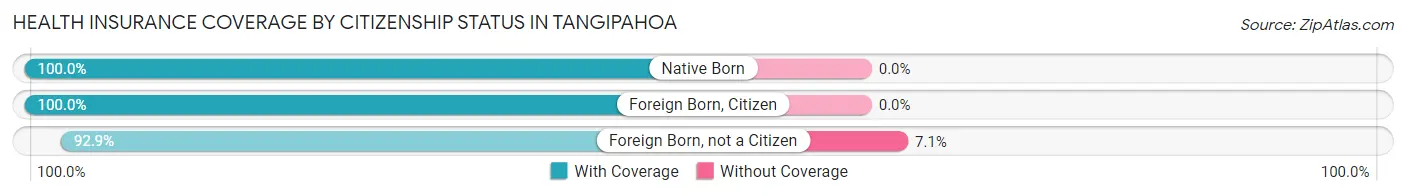
| Citizenship Status | With Coverage | Without Coverage |
| Native Born | 89 (100.0%) | 0 (0.0%) |
| Foreign Born, Citizen | 196 (100.0%) | 0 (0.0%) |
| Foreign Born, not a Citizen | 52 (92.9%) | 4 (7.1%) |
Health Insurance Coverage by Household Income in Tangipahoa
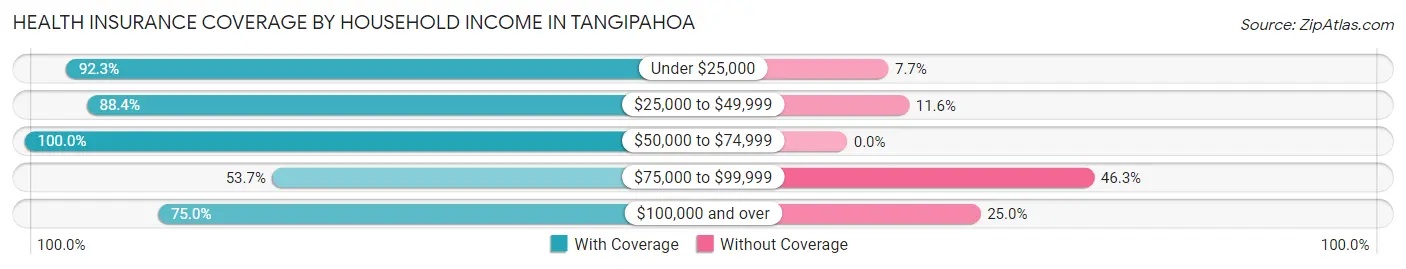
| Household Income | With Coverage | Without Coverage |
| Under $25,000 | 346 (92.3%) | 29 (7.7%) |
| $25,000 to $49,999 | 137 (88.4%) | 18 (11.6%) |
| $50,000 to $74,999 | 22 (100.0%) | 0 (0.0%) |
| $75,000 to $99,999 | 29 (53.7%) | 25 (46.3%) |
| $100,000 and over | 24 (75.0%) | 8 (25.0%) |
Public vs Private Health Insurance Coverage by Age in Tangipahoa
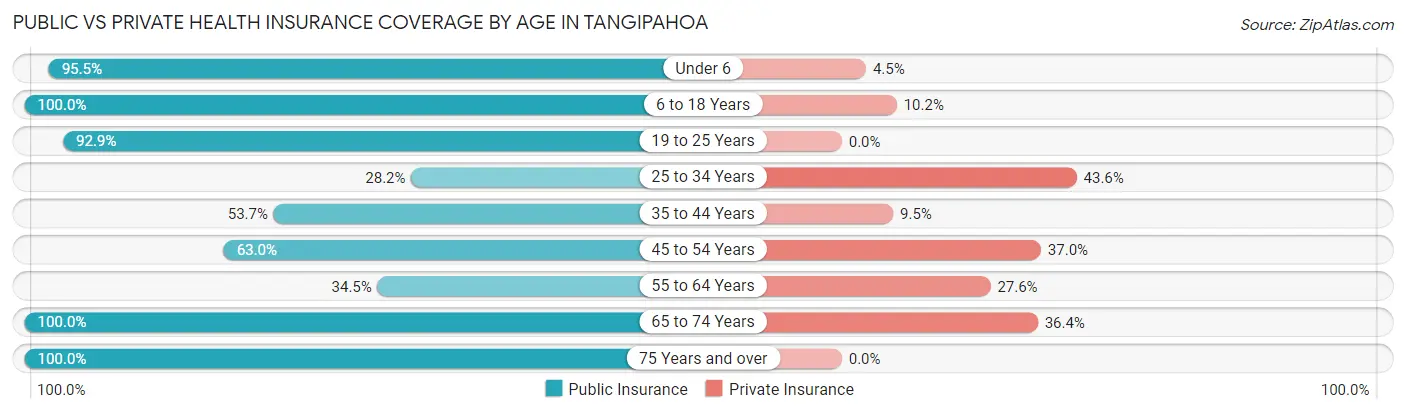
| Age Bracket | Public Insurance | Private Insurance |
| Under 6 | 85 (95.5%) | 4 (4.5%) |
| 6 to 18 Years | 196 (100.0%) | 20 (10.2%) |
| 19 to 25 Years | 52 (92.9%) | 0 (0.0%) |
| 25 to 34 Years | 11 (28.2%) | 17 (43.6%) |
| 35 to 44 Years | 79 (53.7%) | 14 (9.5%) |
| 45 to 54 Years | 29 (63.0%) | 17 (37.0%) |
| 55 to 64 Years | 10 (34.5%) | 8 (27.6%) |
| 65 to 74 Years | 22 (100.0%) | 8 (36.4%) |
| 75 Years and over | 14 (100.0%) | 0 (0.0%) |
| Total | 498 (78.1%) | 88 (13.8%) |
Disability Status by Sex by Age in Tangipahoa
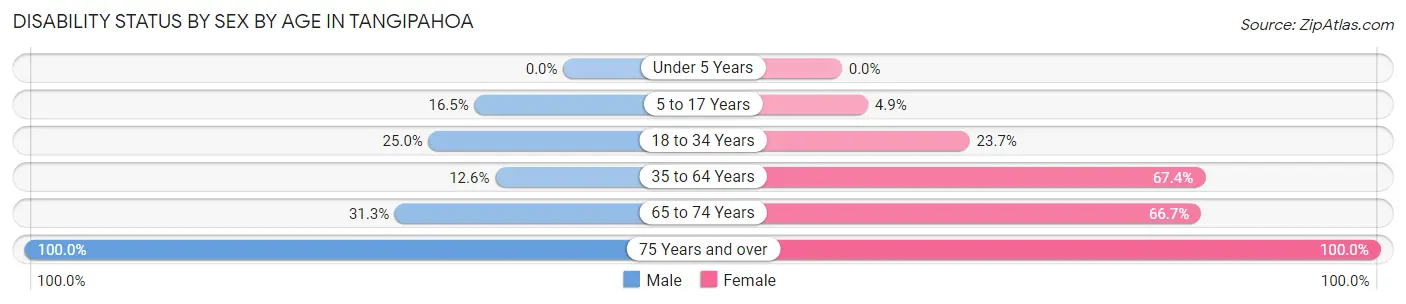
| Age Bracket | Male | Female |
| Under 5 Years | 0 (0.0%) | 0 (0.0%) |
| 5 to 17 Years | 15 (16.5%) | 5 (4.9%) |
| 18 to 34 Years | 14 (25.0%) | 14 (23.7%) |
| 35 to 64 Years | 11 (12.6%) | 91 (67.4%) |
| 65 to 74 Years | 5 (31.2%) | 4 (66.7%) |
| 75 Years and over | 5 (100.0%) | 9 (100.0%) |
Disability Class by Sex by Age in Tangipahoa
Disability Class: Hearing Difficulty
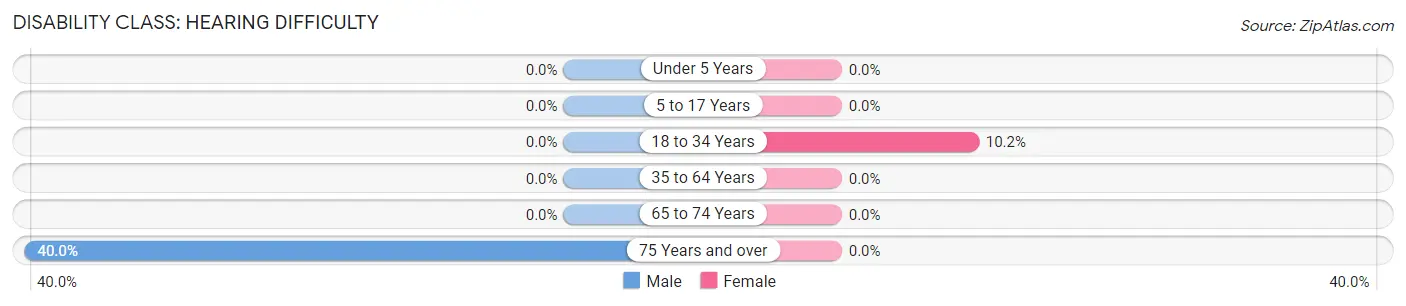
| Age Bracket | Male | Female |
| Under 5 Years | 0 (0.0%) | 0 (0.0%) |
| 5 to 17 Years | 0 (0.0%) | 0 (0.0%) |
| 18 to 34 Years | 0 (0.0%) | 6 (10.2%) |
| 35 to 64 Years | 0 (0.0%) | 0 (0.0%) |
| 65 to 74 Years | 0 (0.0%) | 0 (0.0%) |
| 75 Years and over | 2 (40.0%) | 0 (0.0%) |
Disability Class: Vision Difficulty
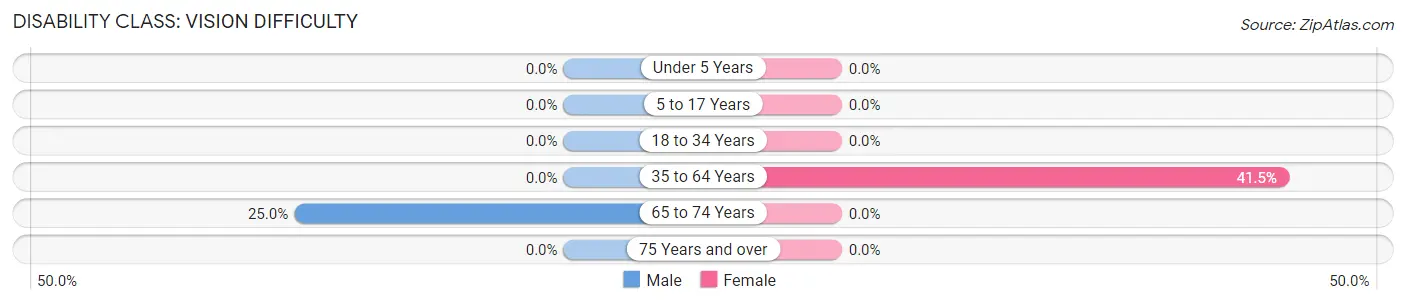
| Age Bracket | Male | Female |
| Under 5 Years | 0 (0.0%) | 0 (0.0%) |
| 5 to 17 Years | 0 (0.0%) | 0 (0.0%) |
| 18 to 34 Years | 0 (0.0%) | 0 (0.0%) |
| 35 to 64 Years | 0 (0.0%) | 56 (41.5%) |
| 65 to 74 Years | 4 (25.0%) | 0 (0.0%) |
| 75 Years and over | 0 (0.0%) | 0 (0.0%) |
Disability Class: Cognitive Difficulty
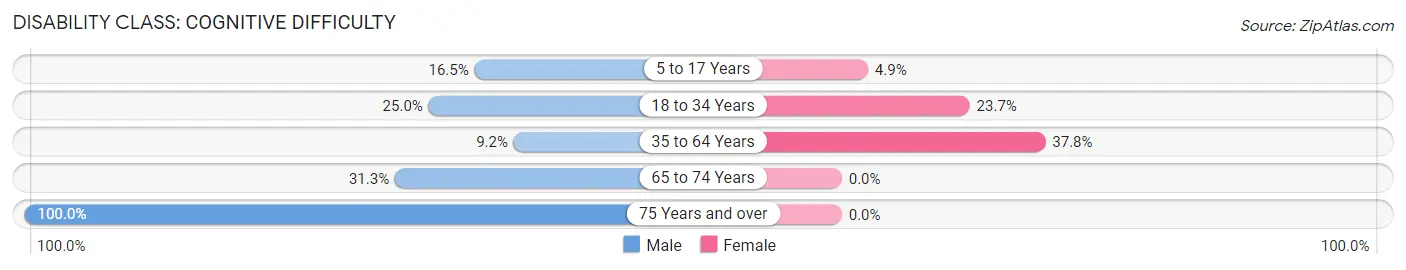
| Age Bracket | Male | Female |
| 5 to 17 Years | 15 (16.5%) | 5 (4.9%) |
| 18 to 34 Years | 14 (25.0%) | 14 (23.7%) |
| 35 to 64 Years | 8 (9.2%) | 51 (37.8%) |
| 65 to 74 Years | 5 (31.2%) | 0 (0.0%) |
| 75 Years and over | 5 (100.0%) | 0 (0.0%) |
Disability Class: Ambulatory Difficulty
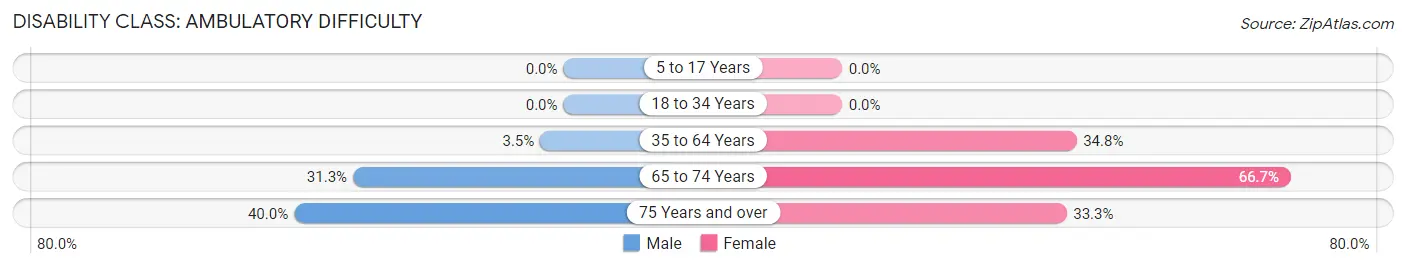
| Age Bracket | Male | Female |
| 5 to 17 Years | 0 (0.0%) | 0 (0.0%) |
| 18 to 34 Years | 0 (0.0%) | 0 (0.0%) |
| 35 to 64 Years | 3 (3.5%) | 47 (34.8%) |
| 65 to 74 Years | 5 (31.2%) | 4 (66.7%) |
| 75 Years and over | 2 (40.0%) | 3 (33.3%) |
Disability Class: Self-Care Difficulty
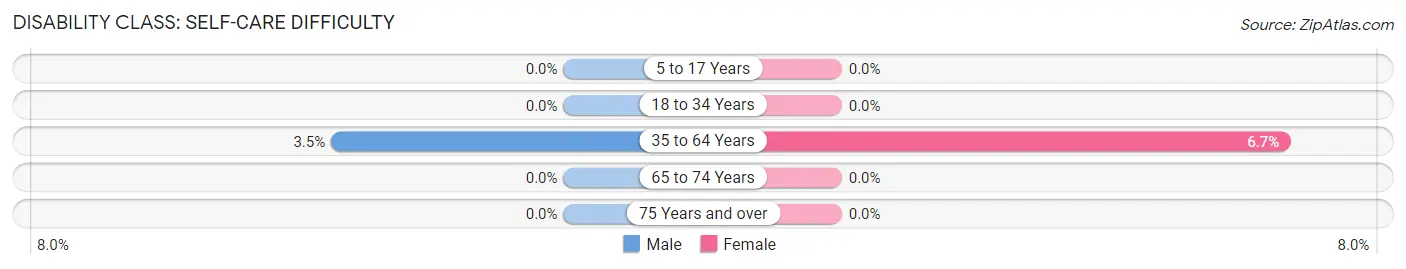
| Age Bracket | Male | Female |
| 5 to 17 Years | 0 (0.0%) | 0 (0.0%) |
| 18 to 34 Years | 0 (0.0%) | 0 (0.0%) |
| 35 to 64 Years | 3 (3.5%) | 9 (6.7%) |
| 65 to 74 Years | 0 (0.0%) | 0 (0.0%) |
| 75 Years and over | 0 (0.0%) | 0 (0.0%) |
Technology Access in Tangipahoa
Computing Device Access in Tangipahoa
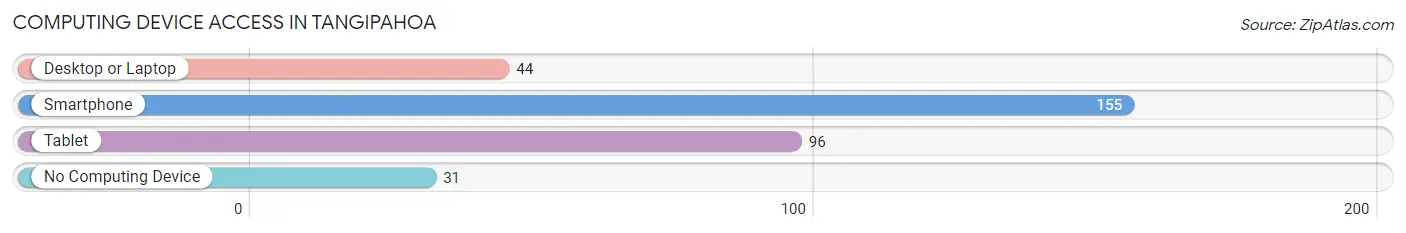
| Device Type | # Households | % Households |
| Desktop or Laptop | 44 | 23.7% |
| Smartphone | 155 | 83.3% |
| Tablet | 96 | 51.6% |
| No Computing Device | 31 | 16.7% |
| Total | 186 | 100.0% |
Internet Access in Tangipahoa
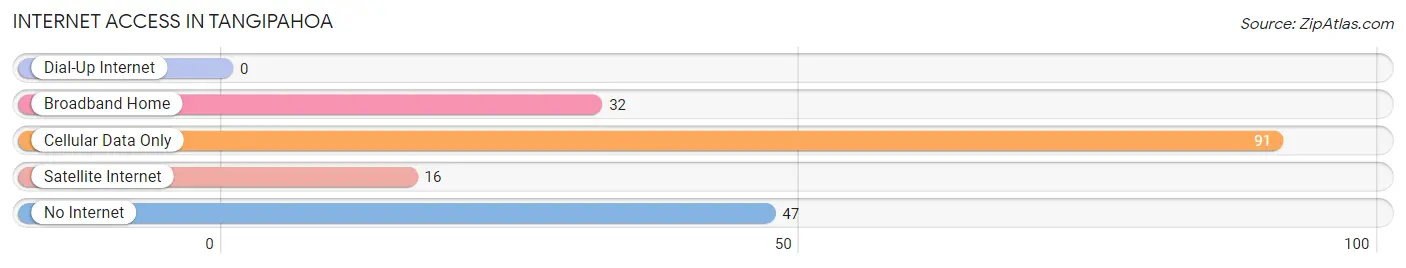
| Internet Type | # Households | % Households |
| Dial-Up Internet | 0 | 0.0% |
| Broadband Home | 32 | 17.2% |
| Cellular Data Only | 91 | 48.9% |
| Satellite Internet | 16 | 8.6% |
| No Internet | 47 | 25.3% |
| Total | 186 | 100.0% |
Tangipahoa Summary
History
The history of Tangipahoa Parish, Louisiana dates back to the early 1700s when French settlers first arrived in the area. The parish was officially established in 1869 and named after the Tangipahoa River, which was named after the Native American tribe that lived in the area. The parish is located in southeastern Louisiana and is part of the Greater New Orleans metropolitan area.
The first settlers in the area were French colonists who arrived in the early 1700s. They established a trading post and a small settlement near the Tangipahoa River. The area was part of the French colony of Louisiana until it was ceded to the United States in 1803 as part of the Louisiana Purchase.
In 1869, the Louisiana legislature created Tangipahoa Parish from parts of Livingston and St. Helena parishes. The parish was named after the Tangipahoa River, which was named after the Native American tribe that lived in the area.
The parish was largely rural until the early 1900s when the railroad arrived. This brought new economic opportunities to the area and spurred the growth of small towns such as Hammond, Amite, and Ponchatoula.
Geography
Tangipahoa Parish is located in southeastern Louisiana and is part of the Greater New Orleans metropolitan area. The parish is bordered by St. Tammany Parish to the north, Washington Parish to the east, St. Helena Parish to the south, and Livingston Parish to the west.
The parish has a total area of 576 square miles, of which 571 square miles is land and 5 square miles is water. The parish is located in the Gulf Coastal Plain and is mostly flat with some rolling hills. The Tangipahoa River runs through the parish and is the main waterway.
Economy
The economy of Tangipahoa Parish is largely based on agriculture and manufacturing. The parish is home to several large agricultural operations, including dairy farms, poultry farms, and sugarcane farms. The manufacturing sector is also important to the local economy and includes food processing, paper products, and chemical production.
The parish is also home to several large employers, including Southeastern Louisiana University, North Oaks Medical Center, and the Louisiana State Penitentiary. Tourism is also an important part of the local economy, with many visitors coming to the area to enjoy the natural beauty of the Tangipahoa River and the nearby lakes and bayous.
Demographics
As of the 2010 census, the population of Tangipahoa Parish was 121,097. The population is mostly white (77.3%) and African American (20.2%). Other racial groups make up the remaining 2.5% of the population.
The median household income in the parish is $45,945 and the median family income is $54,945. The per capita income is $22,945. The poverty rate is 17.3%.
The largest cities in the parish are Hammond (20,019), Ponchatoula (6,559), and Amite (3,734). The parish seat is Amite City.
Common Questions
What is Per Capita Income in Tangipahoa?
Per Capita income in Tangipahoa is $10,592.
What is the Median Family Income in Tangipahoa?
Median Family Income in Tangipahoa is $19,375.
What is the Median Household income in Tangipahoa?
Median Household Income in Tangipahoa is $18,269.
What is Income or Wage Gap in Tangipahoa?
Income or Wage Gap in Tangipahoa is 7.4%.
Women in Tangipahoa earn 92.6 cents for every dollar earned by a man.
What is Inequality or Gini Index in Tangipahoa?
Inequality or Gini Index in Tangipahoa is 0.47.
What is the Total Population of Tangipahoa?
Total Population of Tangipahoa is 638.
What is the Total Male Population of Tangipahoa?
Total Male Population of Tangipahoa is 306.
What is the Total Female Population of Tangipahoa?
Total Female Population of Tangipahoa is 332.
What is the Ratio of Males per 100 Females in Tangipahoa?
There are 92.17 Males per 100 Females in Tangipahoa.
What is the Ratio of Females per 100 Males in Tangipahoa?
There are 108.50 Females per 100 Males in Tangipahoa.
What is the Median Population Age in Tangipahoa?
Median Population Age in Tangipahoa is 23.9 Years.
What is the Average Family Size in Tangipahoa
Average Family Size in Tangipahoa is 4.0 People.
What is the Average Household Size in Tangipahoa
Average Household Size in Tangipahoa is 3.4 People.
How Large is the Labor Force in Tangipahoa?
There are 205 People in the Labor Forcein in Tangipahoa.
What is the Percentage of People in the Labor Force in Tangipahoa?
47.7% of People are in the Labor Force in Tangipahoa.
What is the Unemployment Rate in Tangipahoa?
Unemployment Rate in Tangipahoa is 27.3%.