Maury, NC Map & Demographics
Maury Map
Maury Overview
$8,093
PER CAPITA INCOME
$19,797
AVG HOUSEHOLD INCOME
0.47
INEQUALITY / GINI INDEX
1,055
TOTAL POPULATION
795
MALE POPULATION
260
FEMALE POPULATION
305.77
MALES / 100 FEMALES
32.70
FEMALES / 100 MALES
39.9
MEDIAN AGE
3.0
AVG FAMILY SIZE
2.0
AVG HOUSEHOLD SIZE
111
LABOR FORCE [ PEOPLE ]
12.4%
PERCENT IN LABOR FORCE
13.5%
UNEMPLOYMENT RATE
Maury Zip Codes
Maury Area Codes
Income in Maury
Income Overview in Maury
| Characteristic | Number | Measure |
| Per Capita Income | 1,055 | $8,093 |
| Median Family Income | 94 | $0 |
| Mean Family Income | 94 | $55,631 |
| Median Household Income | 186 | $19,797 |
| Mean Household Income | 186 | $39,920 |
| Income Deficit | 94 | $0 |
| Wage / Income Gap (%) | 1,055 | 0.00% |
| Wage / Income Gap ($) | 1,055 | 100.00¢ per $1 |
| Gini / Inequality Index | 1,055 | 0.47 |
Earnings by Sex in Maury
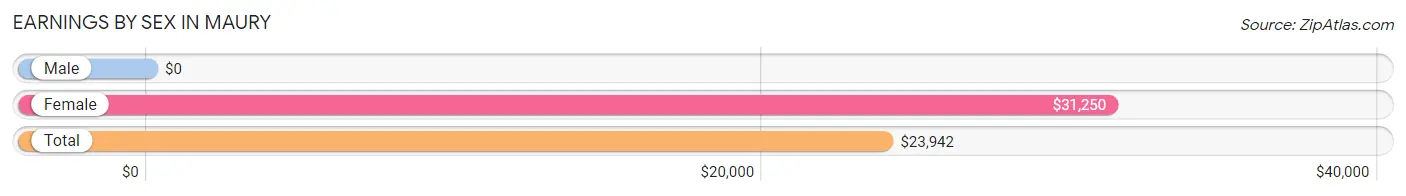
| Sex | Number | Average Earnings |
| Male | 64 (42.7%) | $0 |
| Female | 86 (57.3%) | $31,250 |
| Total | 150 (100.0%) | $23,942 |
Earnings by Sex by Income Bracket in Maury
The most common earnings brackets in Maury are $12,500 to $14,999 for men (13 | 20.3%) and $12,500 to $14,999 for women (22 | 25.6%).
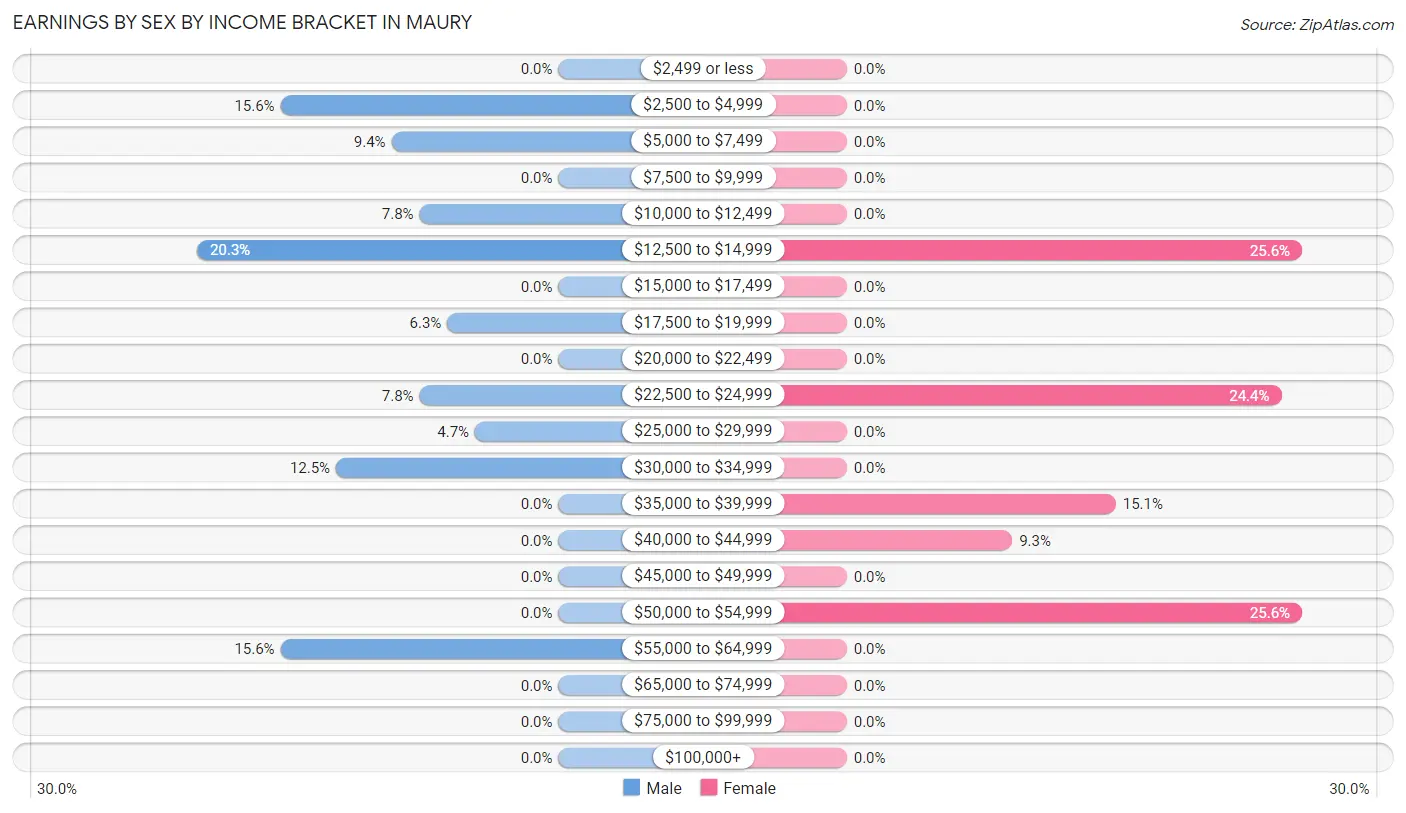
| Income | Male | Female |
| $2,499 or less | 0 (0.0%) | 0 (0.0%) |
| $2,500 to $4,999 | 10 (15.6%) | 0 (0.0%) |
| $5,000 to $7,499 | 6 (9.4%) | 0 (0.0%) |
| $7,500 to $9,999 | 0 (0.0%) | 0 (0.0%) |
| $10,000 to $12,499 | 5 (7.8%) | 0 (0.0%) |
| $12,500 to $14,999 | 13 (20.3%) | 22 (25.6%) |
| $15,000 to $17,499 | 0 (0.0%) | 0 (0.0%) |
| $17,500 to $19,999 | 4 (6.2%) | 0 (0.0%) |
| $20,000 to $22,499 | 0 (0.0%) | 0 (0.0%) |
| $22,500 to $24,999 | 5 (7.8%) | 21 (24.4%) |
| $25,000 to $29,999 | 3 (4.7%) | 0 (0.0%) |
| $30,000 to $34,999 | 8 (12.5%) | 0 (0.0%) |
| $35,000 to $39,999 | 0 (0.0%) | 13 (15.1%) |
| $40,000 to $44,999 | 0 (0.0%) | 8 (9.3%) |
| $45,000 to $49,999 | 0 (0.0%) | 0 (0.0%) |
| $50,000 to $54,999 | 0 (0.0%) | 22 (25.6%) |
| $55,000 to $64,999 | 10 (15.6%) | 0 (0.0%) |
| $65,000 to $74,999 | 0 (0.0%) | 0 (0.0%) |
| $75,000 to $99,999 | 0 (0.0%) | 0 (0.0%) |
| $100,000+ | 0 (0.0%) | 0 (0.0%) |
| Total | 64 (100.0%) | 86 (100.0%) |
Earnings by Sex by Educational Attainment in Maury
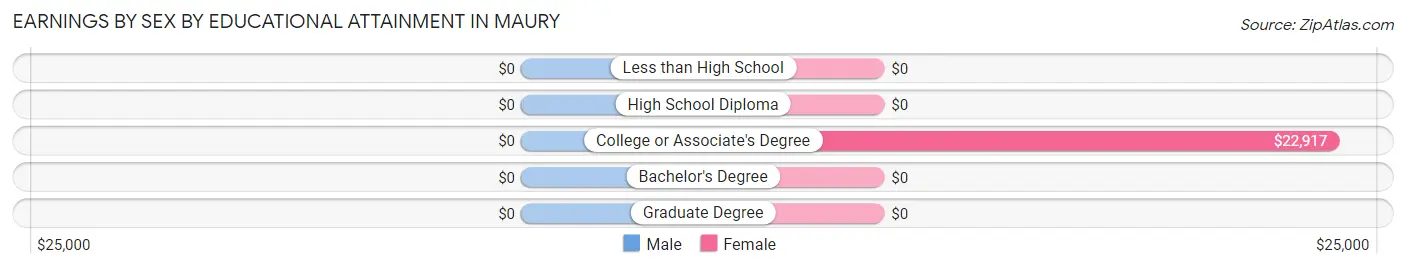
| Educational Attainment | Male Income | Female Income |
| Less than High School | - | - |
| High School Diploma | - | - |
| College or Associate's Degree | - | - |
| Bachelor's Degree | - | - |
| Graduate Degree | - | - |
| Total | $14,306 | $31,250 |
Family Income in Maury
Family Income Brackets in Maury
According to the Maury family income data, there are 25 families falling into the $15,000 to $24,999 income range, which is the most common income bracket and makes up 26.6% of all families.
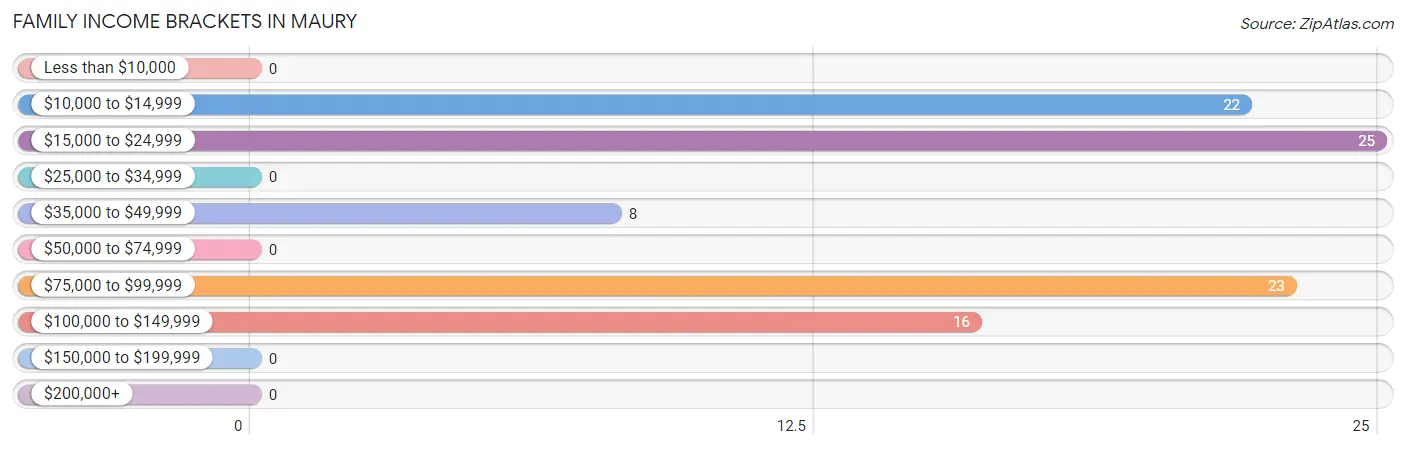
| Income Bracket | # Families | % Families |
| Less than $10,000 | 0 | 0.0% |
| $10,000 to $14,999 | 22 | 23.4% |
| $15,000 to $24,999 | 25 | 26.6% |
| $25,000 to $34,999 | 0 | 0.0% |
| $35,000 to $49,999 | 8 | 8.5% |
| $50,000 to $74,999 | 0 | 0.0% |
| $75,000 to $99,999 | 23 | 24.5% |
| $100,000 to $149,999 | 16 | 17.0% |
| $150,000 to $199,999 | 0 | 0.0% |
| $200,000+ | 0 | 0.0% |
Family Income by Famaliy Size in Maury
2-person families (39 | 41.5%) account for the highest median family income in Maury with $89,327 per family, while 2-person families (39 | 41.5%) have the highest median income of $44,664 per family member.
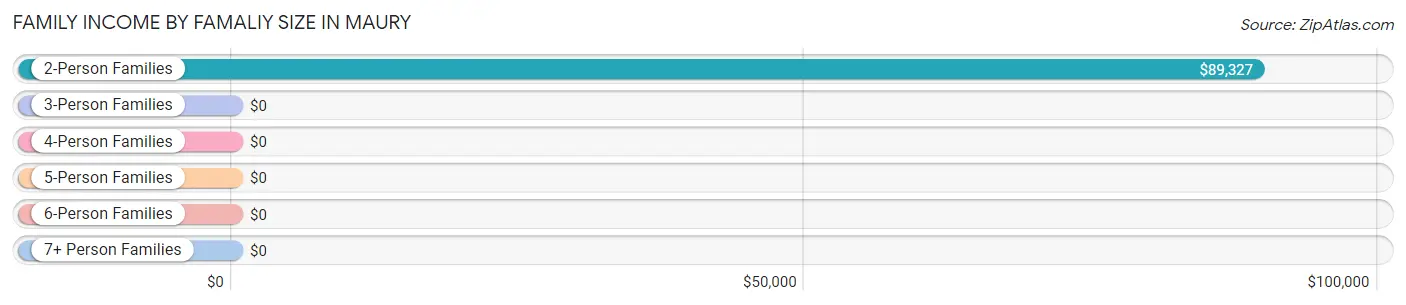
| Income Bracket | # Families | Median Income |
| 2-Person Families | 39 (41.5%) | $89,327 |
| 3-Person Families | 33 (35.1%) | $0 |
| 4-Person Families | 22 (23.4%) | $0 |
| 5-Person Families | 0 (0.0%) | $0 |
| 6-Person Families | 0 (0.0%) | $0 |
| 7+ Person Families | 0 (0.0%) | $0 |
| Total | 94 (100.0%) | $0 |
Family Income by Number of Earners in Maury
| Number of Earners | # Families | Median Income |
| No Earners | 41 (43.6%) | $0 |
| 1 Earner | 53 (56.4%) | $0 |
| 2 Earners | 0 (0.0%) | $0 |
| 3+ Earners | 0 (0.0%) | $0 |
| Total | 94 (100.0%) | $0 |
Household Income in Maury
Household Income Brackets in Maury
With 58 households falling in the category, the $15,000 to $24,999 income range is the most frequent in Maury, accounting for 31.2% of all households.
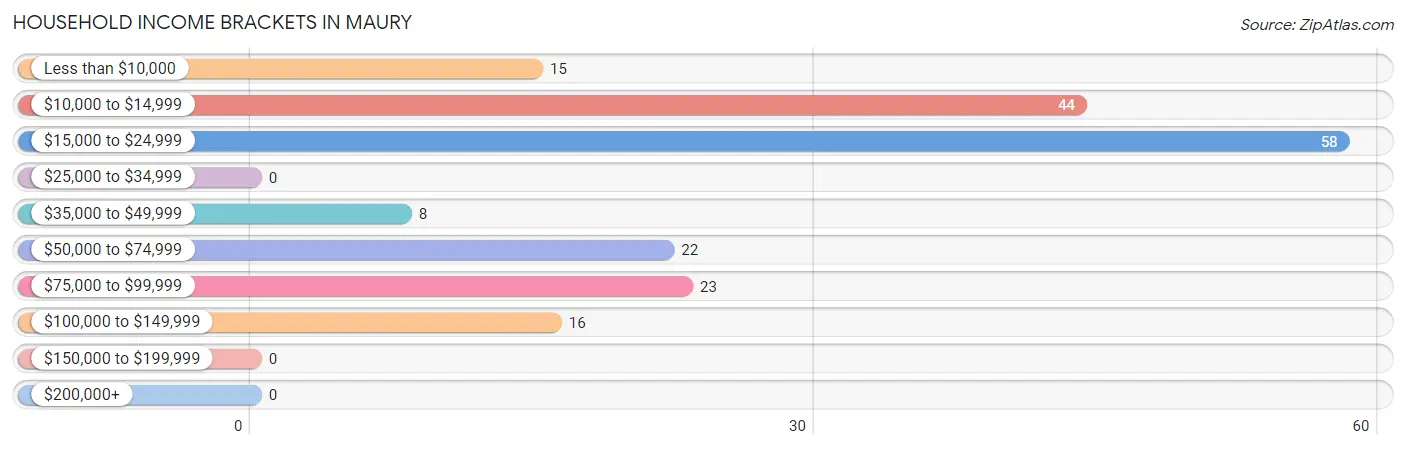
| Income Bracket | # Households | % Households |
| Less than $10,000 | 15 | 8.1% |
| $10,000 to $14,999 | 44 | 23.7% |
| $15,000 to $24,999 | 58 | 31.2% |
| $25,000 to $34,999 | 0 | 0.0% |
| $35,000 to $49,999 | 8 | 4.3% |
| $50,000 to $74,999 | 22 | 11.8% |
| $75,000 to $99,999 | 23 | 12.4% |
| $100,000 to $149,999 | 16 | 8.6% |
| $150,000 to $199,999 | 0 | 0.0% |
| $200,000+ | 0 | 0.0% |
Household Income by Householder Age in Maury
The median household income in Maury is $19,797, with the highest median household income of $19,797 found in the 45 to 64 years age bracket for the primary householder. A total of 112 households (60.2%) fall into this category.
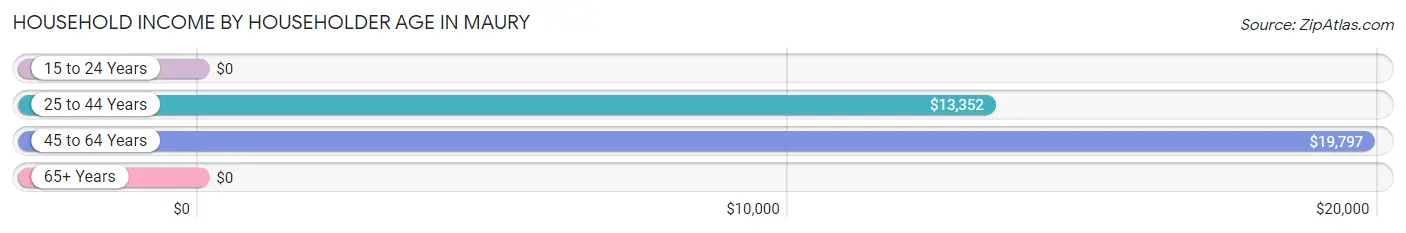
| Income Bracket | # Households | Median Income |
| 15 to 24 Years | 0 (0.0%) | $0 |
| 25 to 44 Years | 45 (24.2%) | $13,352 |
| 45 to 64 Years | 112 (60.2%) | $19,797 |
| 65+ Years | 29 (15.6%) | $0 |
| Total | 186 (100.0%) | $19,797 |
Poverty in Maury
Income Below Poverty by Sex and Age in Maury
With 46.2% poverty level for males and 58.5% for females among the residents of Maury, under 5 year old males and 5 year old females are the most vulnerable to poverty, with 27 males (100.0%) and 18 females (100.0%) in their respective age groups living below the poverty level.
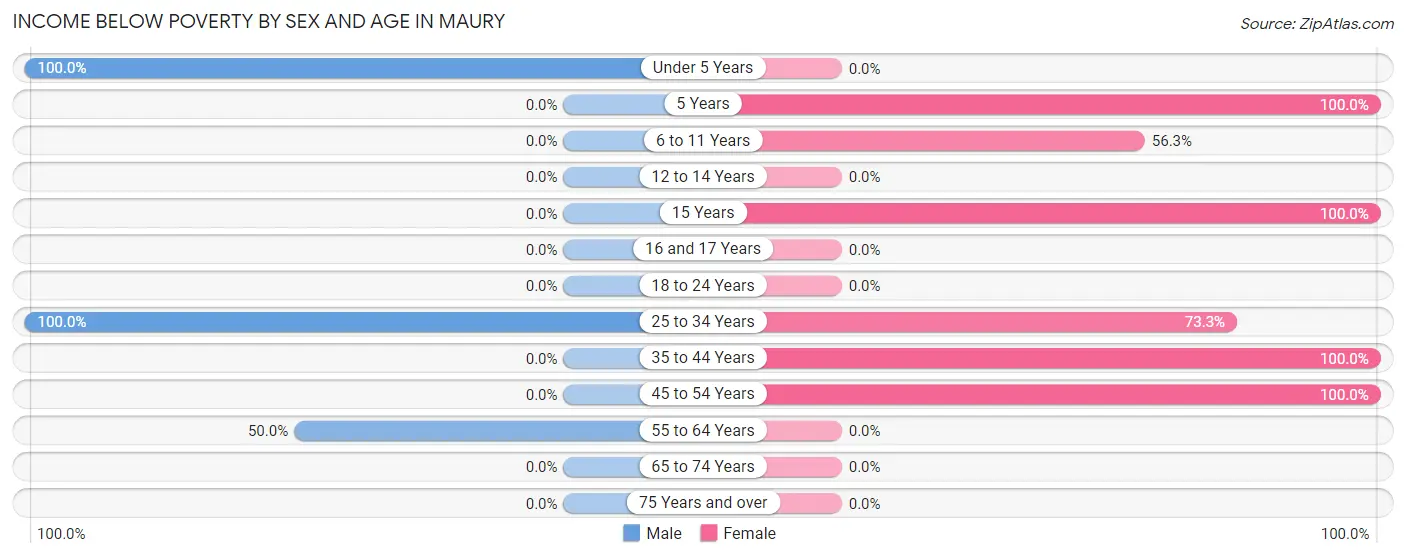
| Age Bracket | Male | Female |
| Under 5 Years | 27 (100.0%) | 0 (0.0%) |
| 5 Years | 0 (0.0%) | 18 (100.0%) |
| 6 to 11 Years | 0 (0.0%) | 18 (56.2%) |
| 12 to 14 Years | 0 (0.0%) | 0 (0.0%) |
| 15 Years | 0 (0.0%) | 54 (100.0%) |
| 16 and 17 Years | 0 (0.0%) | 0 (0.0%) |
| 18 to 24 Years | 0 (0.0%) | 0 (0.0%) |
| 25 to 34 Years | 5 (100.0%) | 22 (73.3%) |
| 35 to 44 Years | 0 (0.0%) | 15 (100.0%) |
| 45 to 54 Years | 0 (0.0%) | 25 (100.0%) |
| 55 to 64 Years | 22 (50.0%) | 0 (0.0%) |
| 65 to 74 Years | 0 (0.0%) | 0 (0.0%) |
| 75 Years and over | 0 (0.0%) | 0 (0.0%) |
| Total | 54 (46.2%) | 152 (58.5%) |
Income Above Poverty by Sex and Age in Maury
According to the poverty statistics in Maury, males aged 15 years and females aged under 5 years are the age groups that are most secure financially, with 100.0% of males and 100.0% of females in these age groups living above the poverty line.
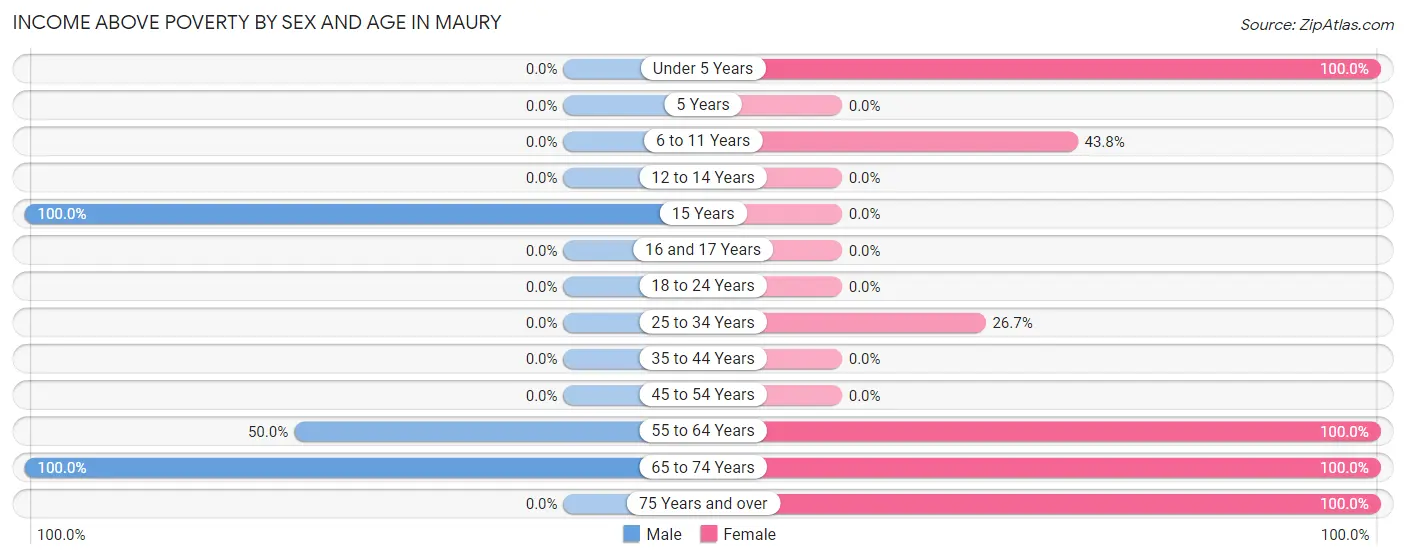
| Age Bracket | Male | Female |
| Under 5 Years | 0 (0.0%) | 14 (100.0%) |
| 5 Years | 0 (0.0%) | 0 (0.0%) |
| 6 to 11 Years | 0 (0.0%) | 14 (43.8%) |
| 12 to 14 Years | 0 (0.0%) | 0 (0.0%) |
| 15 Years | 13 (100.0%) | 0 (0.0%) |
| 16 and 17 Years | 0 (0.0%) | 0 (0.0%) |
| 18 to 24 Years | 0 (0.0%) | 0 (0.0%) |
| 25 to 34 Years | 0 (0.0%) | 8 (26.7%) |
| 35 to 44 Years | 0 (0.0%) | 0 (0.0%) |
| 45 to 54 Years | 0 (0.0%) | 0 (0.0%) |
| 55 to 64 Years | 22 (50.0%) | 43 (100.0%) |
| 65 to 74 Years | 28 (100.0%) | 16 (100.0%) |
| 75 Years and over | 0 (0.0%) | 13 (100.0%) |
| Total | 63 (53.8%) | 108 (41.5%) |
Income Below Poverty Among Married-Couple Families in Maury
| Children | Above Poverty | Below Poverty |
| No Children | 29 (100.0%) | 0 (0.0%) |
| 1 or 2 Children | 0 (0.0%) | 0 (0.0%) |
| 3 or 4 Children | 0 (0.0%) | 0 (0.0%) |
| 5 or more Children | 0 (0.0%) | 0 (0.0%) |
| Total | 29 (100.0%) | 0 (0.0%) |
Income Below Poverty Among Single-Parent Households in Maury
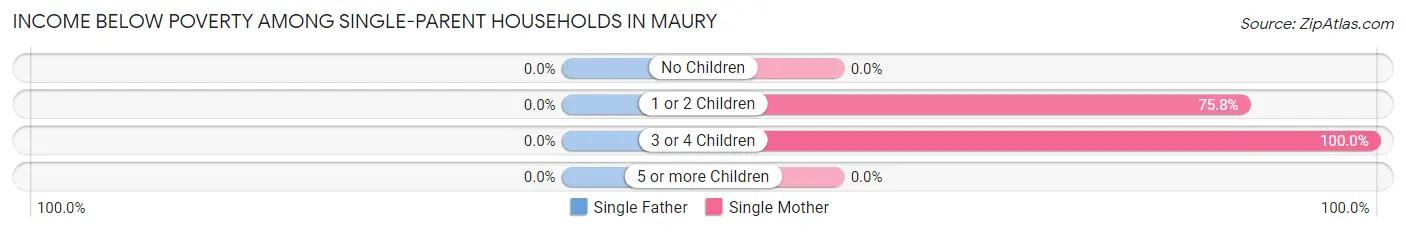
| Children | Single Father | Single Mother |
| No Children | 0 (0.0%) | 0 (0.0%) |
| 1 or 2 Children | 0 (0.0%) | 25 (75.8%) |
| 3 or 4 Children | 0 (0.0%) | 22 (100.0%) |
| 5 or more Children | 0 (0.0%) | 0 (0.0%) |
| Total | 0 (0.0%) | 47 (85.5%) |
Income Below Poverty Among Married-Couple vs Single-Parent Households in Maury
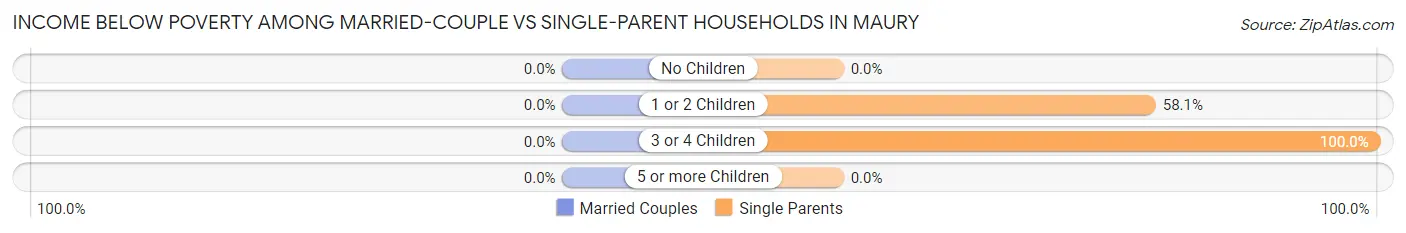
| Children | Married-Couple Families | Single-Parent Households |
| No Children | 0 (0.0%) | 0 (0.0%) |
| 1 or 2 Children | 0 (0.0%) | 25 (58.1%) |
| 3 or 4 Children | 0 (0.0%) | 22 (100.0%) |
| 5 or more Children | 0 (0.0%) | 0 (0.0%) |
| Total | 0 (0.0%) | 47 (72.3%) |
Race in Maury
The most populous races in Maury are Black / African American (542 | 51.4%), White / Caucasian (380 | 36.0%), and Two or more Races (72 | 6.8%).
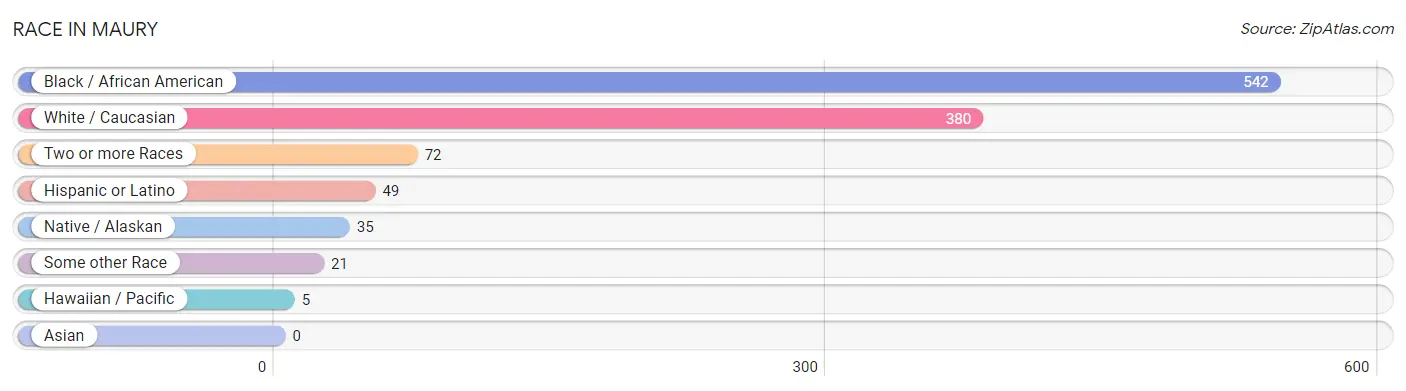
| Race | # Population | % Population |
| Asian | 0 | 0.0% |
| Black / African American | 542 | 51.4% |
| Hawaiian / Pacific | 5 | 0.5% |
| Hispanic or Latino | 49 | 4.6% |
| Native / Alaskan | 35 | 3.3% |
| White / Caucasian | 380 | 36.0% |
| Two or more Races | 72 | 6.8% |
| Some other Race | 21 | 2.0% |
| Total | 1,055 | 100.0% |
Ancestry in Maury
The most populous ancestries reported in Maury are American (219 | 20.8%), African (85 | 8.1%), Subsaharan African (85 | 8.1%), Irish (51 | 4.8%), and Mexican (35 | 3.3%), together accounting for 45.0% of all Maury residents.
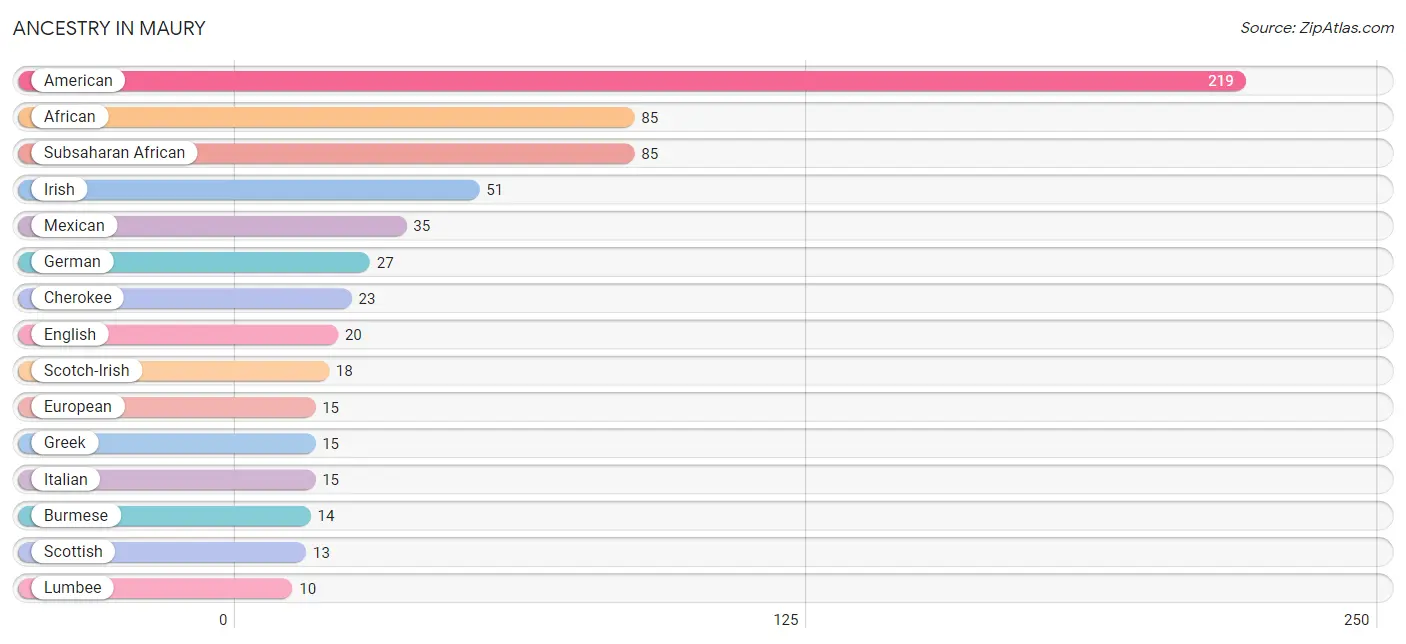
| Ancestry | # Population | % Population |
| African | 85 | 8.1% |
| American | 219 | 20.8% |
| Blackfeet | 3 | 0.3% |
| Burmese | 14 | 1.3% |
| Central American | 4 | 0.4% |
| Cherokee | 23 | 2.2% |
| Dutch | 6 | 0.6% |
| English | 20 | 1.9% |
| European | 15 | 1.4% |
| Fijian | 5 | 0.5% |
| German | 27 | 2.6% |
| Greek | 15 | 1.4% |
| Irish | 51 | 4.8% |
| Italian | 15 | 1.4% |
| Lumbee | 10 | 0.9% |
| Mexican | 35 | 3.3% |
| Norwegian | 4 | 0.4% |
| Portuguese | 6 | 0.6% |
| Puerto Rican | 10 | 0.9% |
| Salvadoran | 4 | 0.4% |
| Scotch-Irish | 18 | 1.7% |
| Scottish | 13 | 1.2% |
| Subsaharan African | 85 | 8.1% |
| West Indian | 6 | 0.6% | View All 24 Rows |
Immigrants in Maury
The most numerous immigrant groups reported in Maury came from Central America (9 | 0.9%), Latin America (9 | 0.9%), Mexico (5 | 0.5%), and El Salvador (4 | 0.4%), together accounting for 2.6% of all Maury residents.
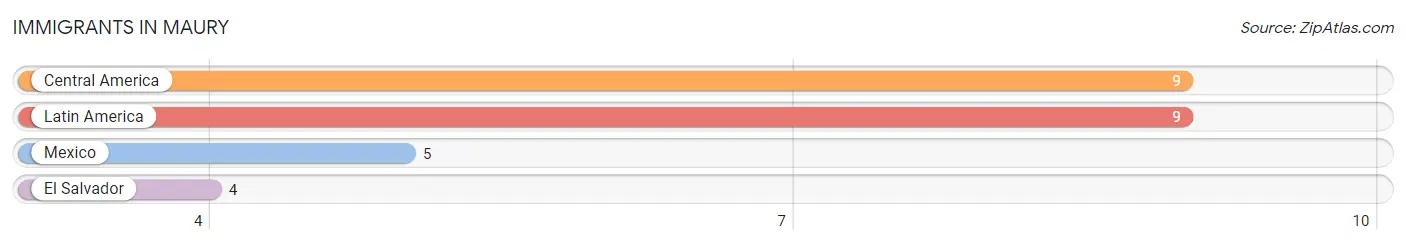
| Immigration Origin | # Population | % Population |
| Central America | 9 | 0.9% |
| El Salvador | 4 | 0.4% |
| Latin America | 9 | 0.9% |
| Mexico | 5 | 0.5% | View All 4 Rows |
Sex and Age in Maury
Sex and Age in Maury
The most populous age groups in Maury are 35 to 39 Years (129 | 16.2%) for men and 15 to 19 Years (54 | 20.8%) for women.
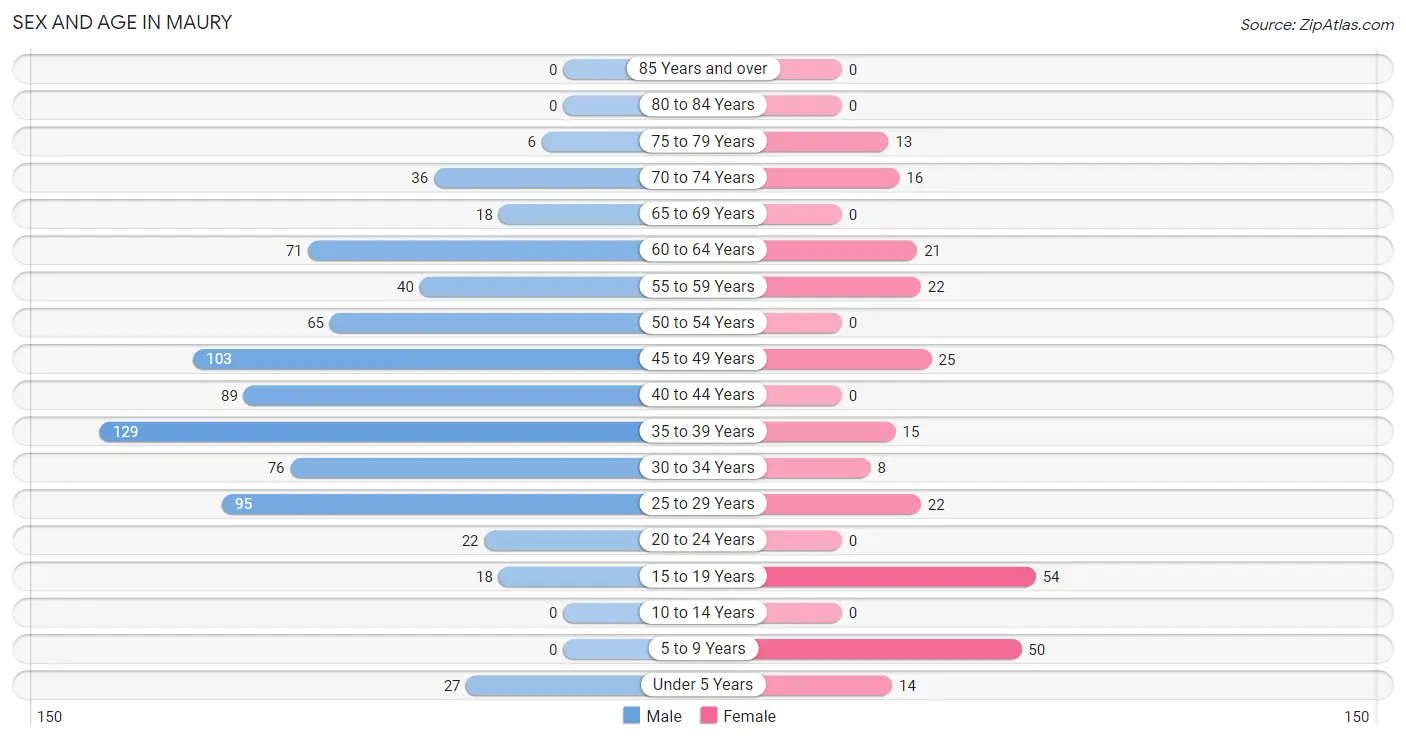
| Age Bracket | Male | Female |
| Under 5 Years | 27 (3.4%) | 14 (5.4%) |
| 5 to 9 Years | 0 (0.0%) | 50 (19.2%) |
| 10 to 14 Years | 0 (0.0%) | 0 (0.0%) |
| 15 to 19 Years | 18 (2.3%) | 54 (20.8%) |
| 20 to 24 Years | 22 (2.8%) | 0 (0.0%) |
| 25 to 29 Years | 95 (11.9%) | 22 (8.5%) |
| 30 to 34 Years | 76 (9.6%) | 8 (3.1%) |
| 35 to 39 Years | 129 (16.2%) | 15 (5.8%) |
| 40 to 44 Years | 89 (11.2%) | 0 (0.0%) |
| 45 to 49 Years | 103 (13.0%) | 25 (9.6%) |
| 50 to 54 Years | 65 (8.2%) | 0 (0.0%) |
| 55 to 59 Years | 40 (5.0%) | 22 (8.5%) |
| 60 to 64 Years | 71 (8.9%) | 21 (8.1%) |
| 65 to 69 Years | 18 (2.3%) | 0 (0.0%) |
| 70 to 74 Years | 36 (4.5%) | 16 (6.1%) |
| 75 to 79 Years | 6 (0.7%) | 13 (5.0%) |
| 80 to 84 Years | 0 (0.0%) | 0 (0.0%) |
| 85 Years and over | 0 (0.0%) | 0 (0.0%) |
| Total | 795 (100.0%) | 260 (100.0%) |
Families and Households in Maury
Median Family Size in Maury
The median family size in Maury is 2.98 persons per family, with single female/mother families (55 | 58.5%) accounting for the largest median family size of 3.64 persons per family. On the other hand, married-couple families (29 | 30.8%) represent the smallest median family size with 1.97 persons per family.
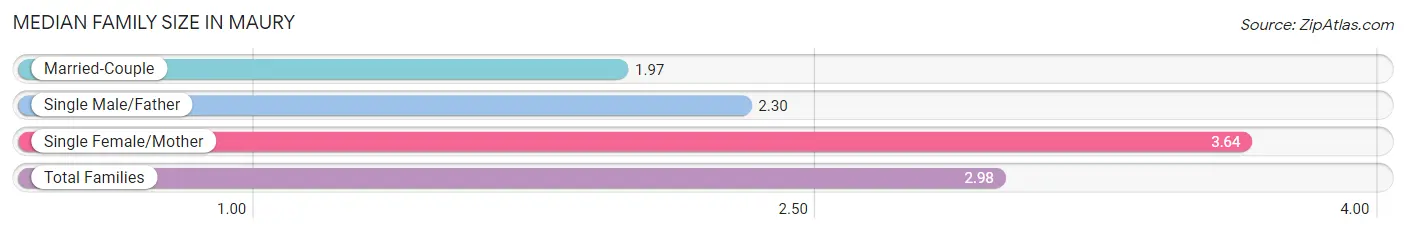
| Family Type | # Families | Family Size |
| Married-Couple | 29 (30.8%) | 1.97 |
| Single Male/Father | 10 (10.6%) | 2.30 |
| Single Female/Mother | 55 (58.5%) | 3.64 |
| Total Families | 94 (100.0%) | 2.98 |
Median Household Size in Maury
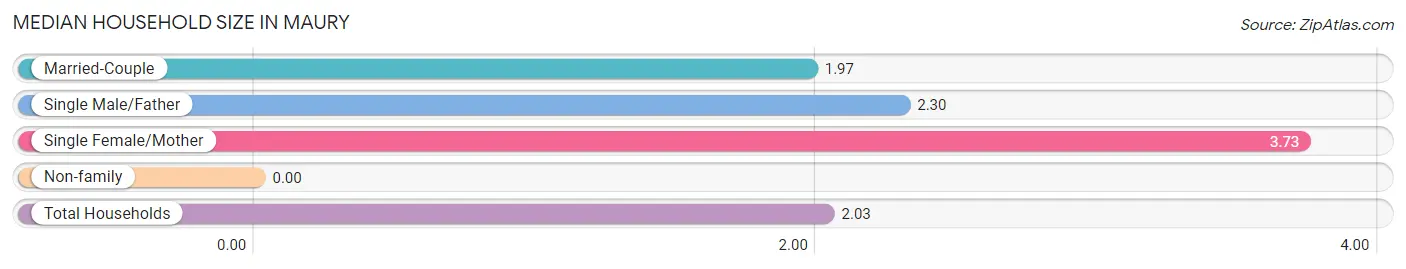
| Household Type | # Households | Household Size |
| Married-Couple | 29 (15.6%) | 1.97 |
| Single Male/Father | 10 (5.4%) | 2.30 |
| Single Female/Mother | 55 (29.6%) | 3.73 |
| Non-family | 92 (49.5%) | - |
| Total Households | 186 (100.0%) | 2.03 |
Household Size by Marriage Status in Maury
Out of a total of 186 households in Maury, 94 (50.5%) are family households, while 92 (49.5%) are nonfamily households. The most numerous type of family households are 2-person households, comprising 39, and the most common type of nonfamily households are 1-person households, comprising 92.
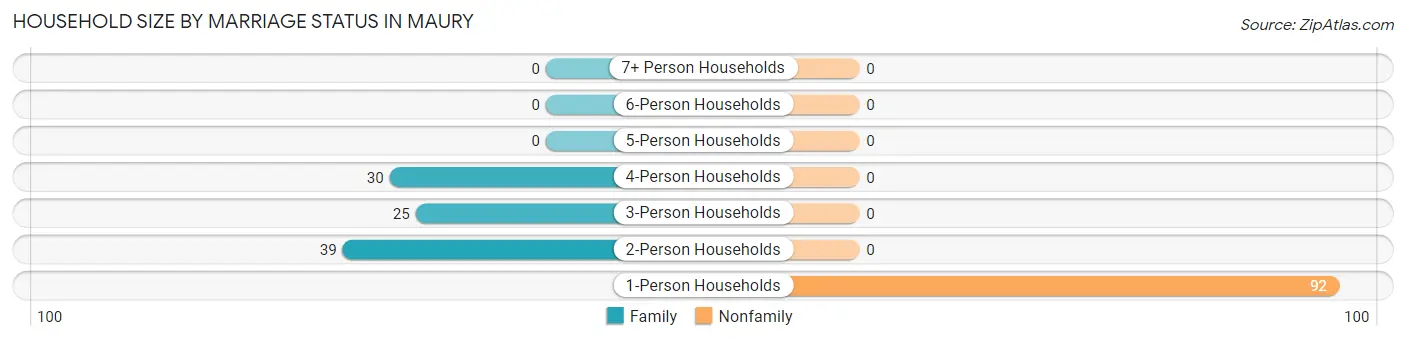
| Household Size | Family Households | Nonfamily Households |
| 1-Person Households | - | 92 (49.5%) |
| 2-Person Households | 39 (21.0%) | 0 (0.0%) |
| 3-Person Households | 25 (13.4%) | 0 (0.0%) |
| 4-Person Households | 30 (16.1%) | 0 (0.0%) |
| 5-Person Households | 0 (0.0%) | 0 (0.0%) |
| 6-Person Households | 0 (0.0%) | 0 (0.0%) |
| 7+ Person Households | 0 (0.0%) | 0 (0.0%) |
| Total | 94 (50.5%) | 92 (49.5%) |
Female Fertility in Maury
Fertility by Age in Maury
Average fertility rate in Maury is 177.0 births per 1,000 women. Women in the age bracket of 20 to 34 years have the highest fertility rate with 733.0 births per 1,000 women. Women in the age bracket of 20 to 34 years acount for 100.0% of all women with births.
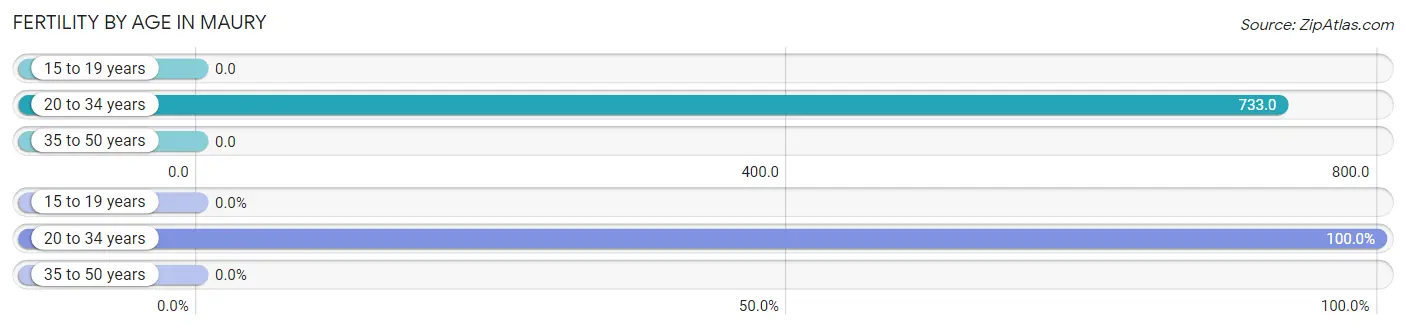
| Age Bracket | Women with Births | Births / 1,000 Women |
| 15 to 19 years | 0 (0.0%) | 0.0 |
| 20 to 34 years | 22 (100.0%) | 733.0 |
| 35 to 50 years | 0 (0.0%) | 0.0 |
| Total | 22 (100.0%) | 177.0 |
Fertility by Age by Marriage Status in Maury
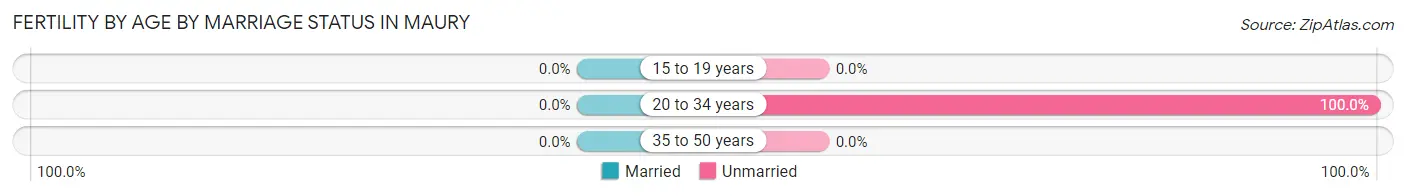
| Age Bracket | Married | Unmarried |
| 15 to 19 years | 0 (0.0%) | 0 (0.0%) |
| 20 to 34 years | 0 (0.0%) | 22 (100.0%) |
| 35 to 50 years | 0 (0.0%) | 0 (0.0%) |
| Total | 0 (0.0%) | 22 (100.0%) |
Fertility by Education in Maury
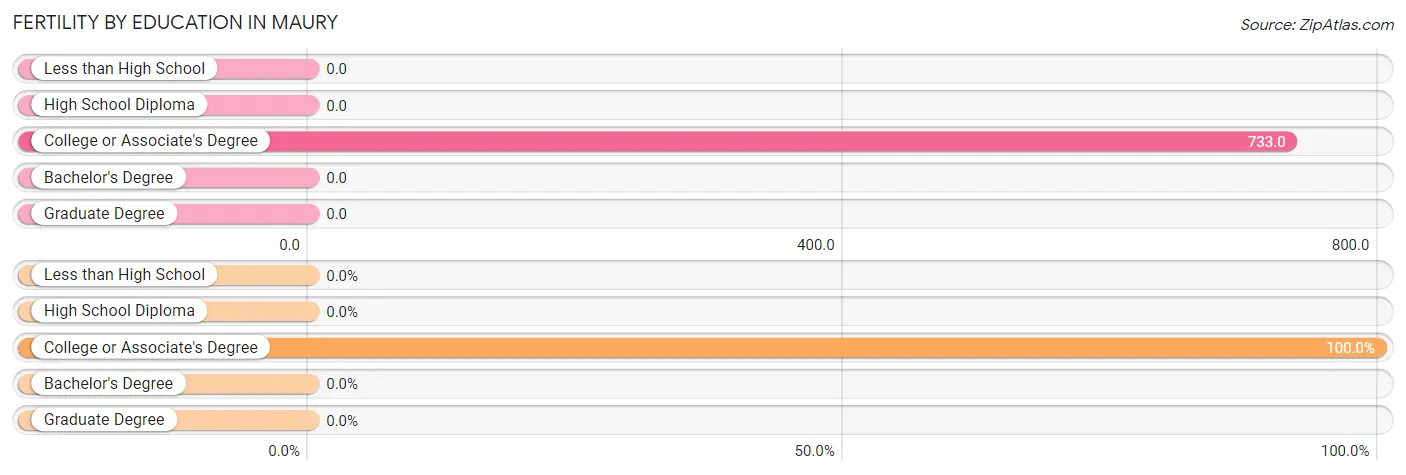
| Educational Attainment | Women with Births | Births / 1,000 Women |
| Less than High School | 0 (0.0%) | 0.0 |
| High School Diploma | 0 (0.0%) | 0.0 |
| College or Associate's Degree | 22 (100.0%) | 733.0 |
| Bachelor's Degree | 0 (0.0%) | 0.0 |
| Graduate Degree | 0 (0.0%) | 0.0 |
| Total | 22 (100.0%) | 177.0 |
Fertility by Education by Marriage Status in Maury
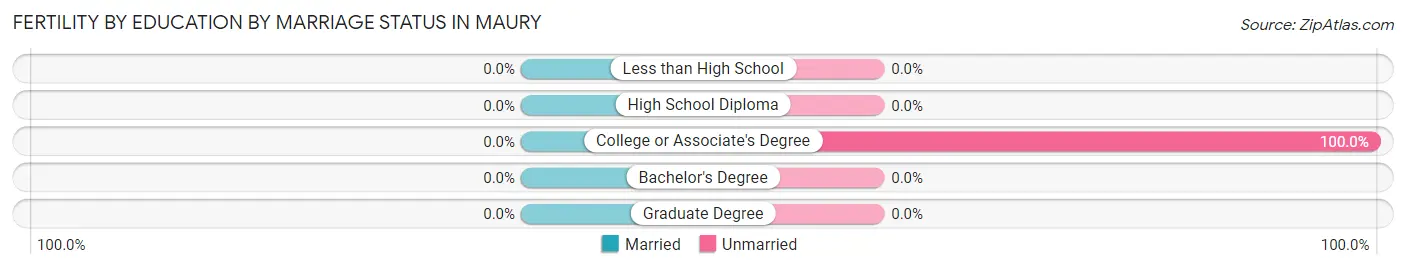
| Educational Attainment | Married | Unmarried |
| Less than High School | 0 (0.0%) | 0 (0.0%) |
| High School Diploma | 0 (0.0%) | 0 (0.0%) |
| College or Associate's Degree | 0 (0.0%) | 22 (100.0%) |
| Bachelor's Degree | 0 (0.0%) | 0 (0.0%) |
| Graduate Degree | 0 (0.0%) | 0 (0.0%) |
| Total | 0 (0.0%) | 22 (100.0%) |
Employment Characteristics in Maury
Employment by Class of Employer in Maury
Among the 96 employed individuals in Maury, state government employees (53 | 55.2%), and private company employees (43 | 44.8%) make up the most common classes of employment.
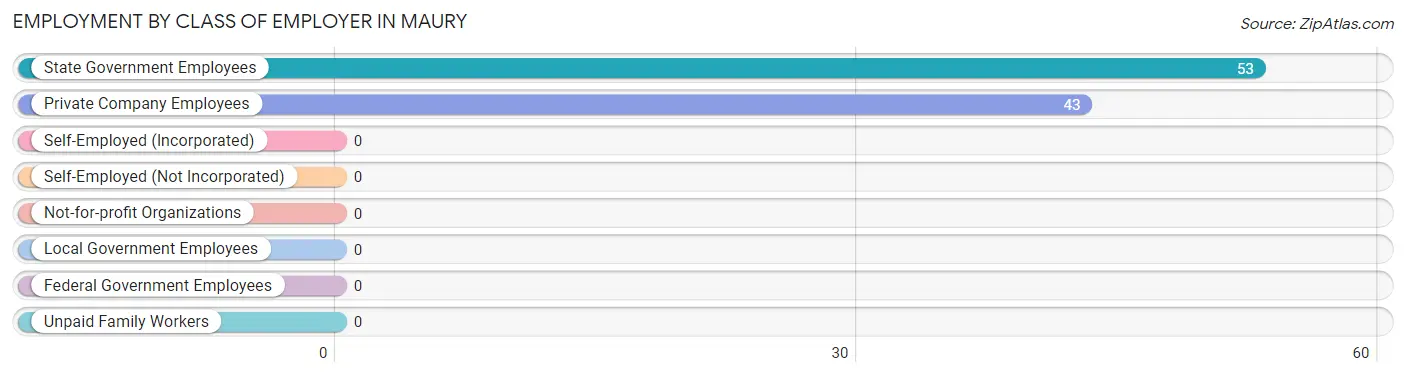
| Employer Class | # Employees | % Employees |
| Private Company Employees | 43 | 44.8% |
| Self-Employed (Incorporated) | 0 | 0.0% |
| Self-Employed (Not Incorporated) | 0 | 0.0% |
| Not-for-profit Organizations | 0 | 0.0% |
| Local Government Employees | 0 | 0.0% |
| State Government Employees | 53 | 55.2% |
| Federal Government Employees | 0 | 0.0% |
| Unpaid Family Workers | 0 | 0.0% |
| Total | 96 | 100.0% |
Employment Status by Age in Maury
According to the labor force statistics for Maury, out of the total population over 16 years of age (897), 12.4% or 111 individuals are in the labor force, with 13.5% or 15 of them unemployed. The age group with the highest labor force participation rate is 75 years and over, with 68.4% or 13 individuals in the labor force. Within the labor force, the 35 to 44 years age range has the highest percentage of unemployed individuals, with 100.0% or 15 of them being unemployed.
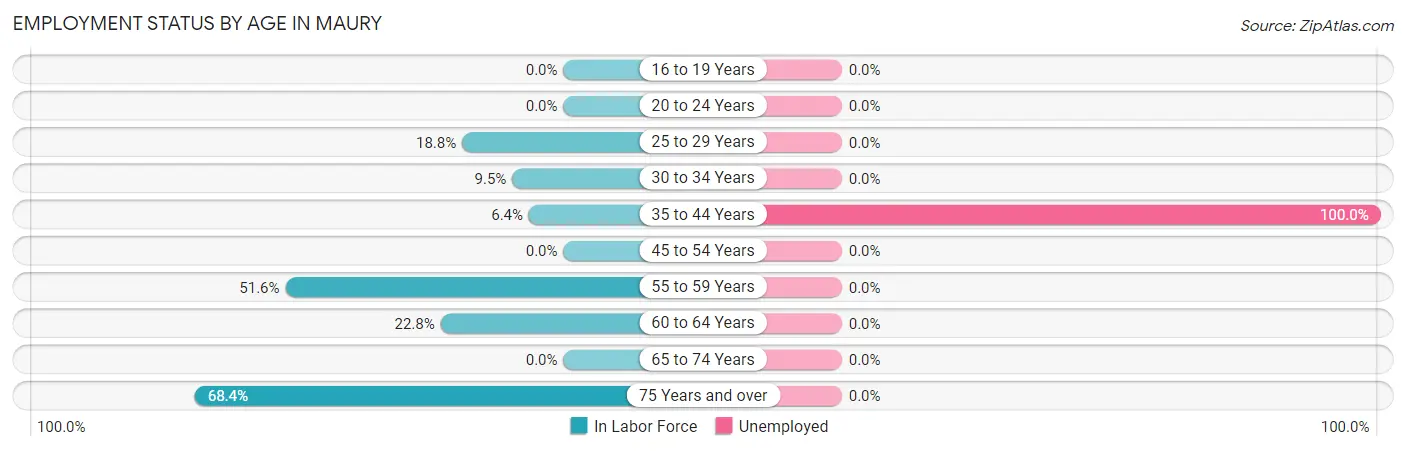
| Age Bracket | In Labor Force | Unemployed |
| 16 to 19 Years | 0 (0.0%) | 0 (0.0%) |
| 20 to 24 Years | 0 (0.0%) | 0 (0.0%) |
| 25 to 29 Years | 22 (18.8%) | 0 (0.0%) |
| 30 to 34 Years | 8 (9.5%) | 0 (0.0%) |
| 35 to 44 Years | 15 (6.4%) | 15 (100.0%) |
| 45 to 54 Years | 0 (0.0%) | 0 (0.0%) |
| 55 to 59 Years | 32 (51.6%) | 0 (0.0%) |
| 60 to 64 Years | 21 (22.8%) | 0 (0.0%) |
| 65 to 74 Years | 0 (0.0%) | 0 (0.0%) |
| 75 Years and over | 13 (68.4%) | 0 (0.0%) |
| Total | 111 (12.4%) | 15 (13.5%) |
Employment Status by Educational Attainment in Maury
According to labor force statistics for Maury, 12.5% of individuals (98) out of the total population between 25 and 64 years of age (781) are in the labor force, with 15.3% or 15 of them being unemployed. The group with the highest labor force participation rate are those with the educational attainment of bachelor's degree or higher, with 100.0% or 22 individuals in the labor force. Within the labor force, individuals with less than high school education have the highest percentage of unemployment, with 100.0% or 15 of them being unemployed.
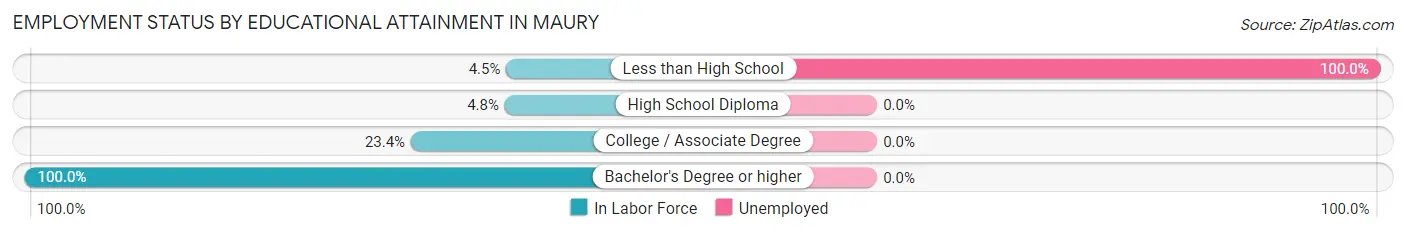
| Educational Attainment | In Labor Force | Unemployed |
| Less than High School | 15 (4.5%) | 332 (100.0%) |
| High School Diploma | 10 (4.8%) | 0 (0.0%) |
| College / Associate Degree | 51 (23.4%) | 0 (0.0%) |
| Bachelor's Degree or higher | 22 (100.0%) | 0 (0.0%) |
| Total | 98 (12.5%) | 119 (15.3%) |
Employment Occupations by Sex in Maury
Management, Business, Science and Arts Occupations
The most common Management, Business, Science and Arts occupations in Maury are Community & Social Service (56 | 58.3%), Arts, Media & Entertainment (22 | 22.9%), Health Diagnosing & Treating (22 | 22.9%), Education Instruction & Library (21 | 21.9%), and Legal Services & Support (13 | 13.5%).
Management, Business, Science and Arts Occupations by Sex
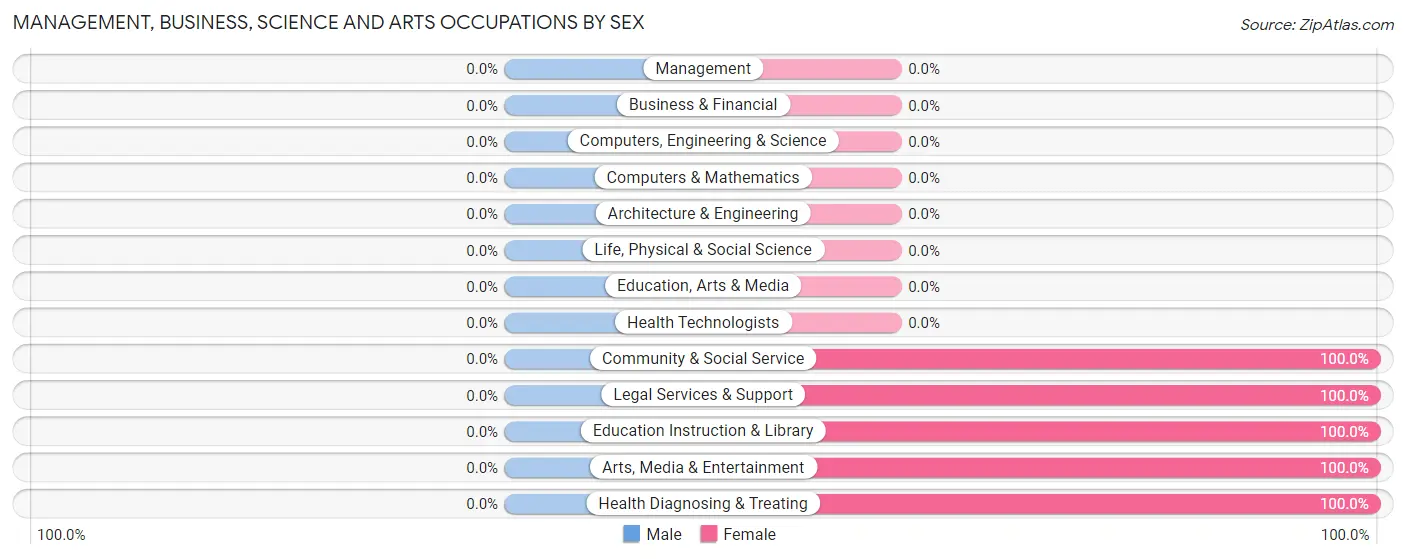
| Occupation | Male | Female |
| Management | 0 (0.0%) | 0 (0.0%) |
| Business & Financial | 0 (0.0%) | 0 (0.0%) |
| Computers, Engineering & Science | 0 (0.0%) | 0 (0.0%) |
| Computers & Mathematics | 0 (0.0%) | 0 (0.0%) |
| Architecture & Engineering | 0 (0.0%) | 0 (0.0%) |
| Life, Physical & Social Science | 0 (0.0%) | 0 (0.0%) |
| Community & Social Service | 0 (0.0%) | 56 (100.0%) |
| Education, Arts & Media | 0 (0.0%) | 0 (0.0%) |
| Legal Services & Support | 0 (0.0%) | 13 (100.0%) |
| Education Instruction & Library | 0 (0.0%) | 21 (100.0%) |
| Arts, Media & Entertainment | 0 (0.0%) | 22 (100.0%) |
| Health Diagnosing & Treating | 0 (0.0%) | 22 (100.0%) |
| Health Technologists | 0 (0.0%) | 0 (0.0%) |
| Total (Category) | 0 (0.0%) | 78 (100.0%) |
| Total (Overall) | 10 (10.4%) | 86 (89.6%) |
Services Occupations
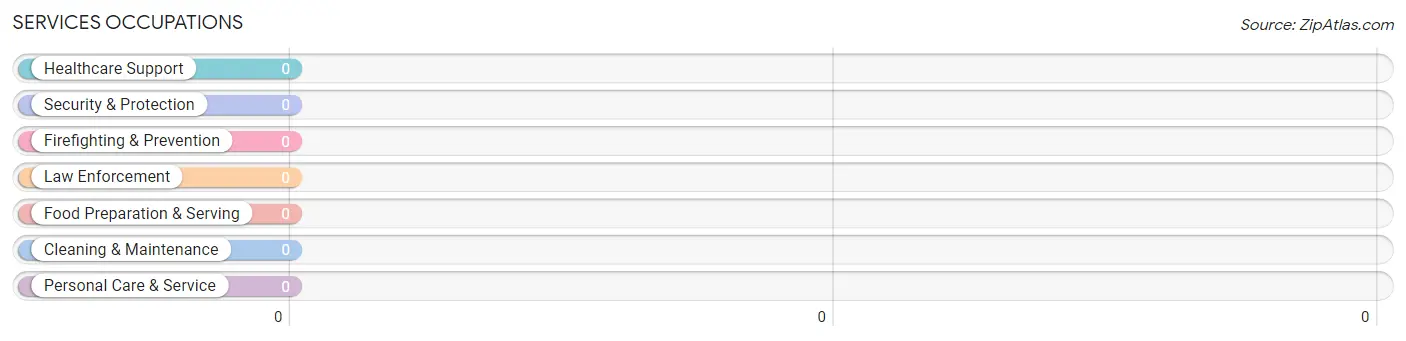
Services Occupations by Sex
| Occupation | Male | Female |
| Healthcare Support | 0 (0.0%) | 0 (0.0%) |
| Security & Protection | 0 (0.0%) | 0 (0.0%) |
| Firefighting & Prevention | 0 (0.0%) | 0 (0.0%) |
| Law Enforcement | 0 (0.0%) | 0 (0.0%) |
| Food Preparation & Serving | 0 (0.0%) | 0 (0.0%) |
| Cleaning & Maintenance | 0 (0.0%) | 0 (0.0%) |
| Personal Care & Service | 0 (0.0%) | 0 (0.0%) |
| Total (Category) | 0 (0.0%) | 0 (0.0%) |
| Total (Overall) | 10 (10.4%) | 86 (89.6%) |
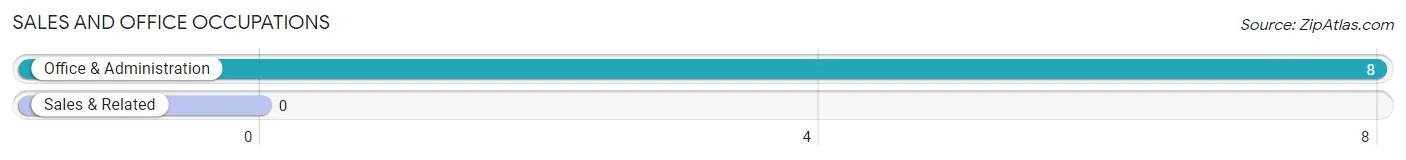
Sales and Office Occupations
The most common Sales and Office occupations in Maury are , and Office & Administration (8 | 8.3%).
Sales and Office Occupations by Sex
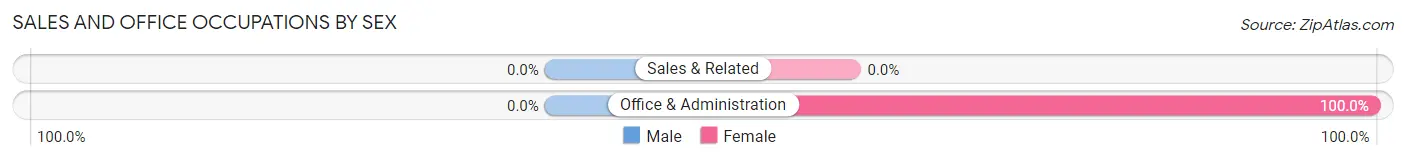
| Occupation | Male | Female |
| Sales & Related | 0 (0.0%) | 0 (0.0%) |
| Office & Administration | 0 (0.0%) | 8 (100.0%) |
| Total (Category) | 0 (0.0%) | 8 (100.0%) |
| Total (Overall) | 10 (10.4%) | 86 (89.6%) |
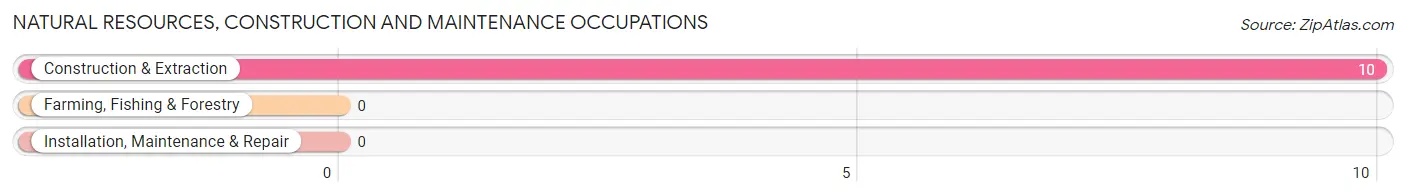
Natural Resources, Construction and Maintenance Occupations
The most common Natural Resources, Construction and Maintenance occupations in Maury are , and Construction & Extraction (10 | 10.4%).
Natural Resources, Construction and Maintenance Occupations by Sex
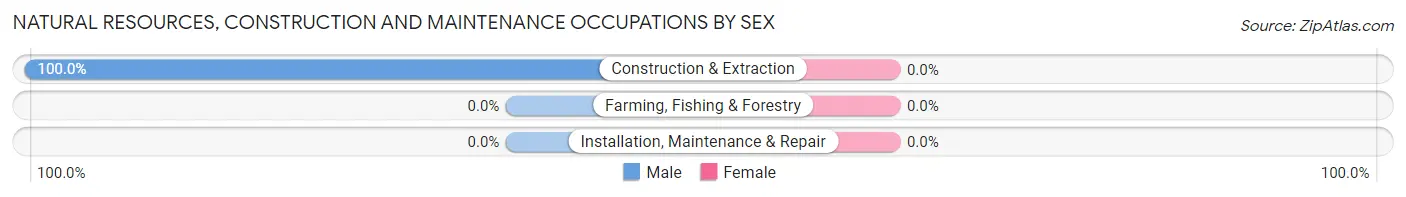
| Occupation | Male | Female |
| Farming, Fishing & Forestry | 0 (0.0%) | 0 (0.0%) |
| Construction & Extraction | 10 (100.0%) | 0 (0.0%) |
| Installation, Maintenance & Repair | 0 (0.0%) | 0 (0.0%) |
| Total (Category) | 10 (100.0%) | 0 (0.0%) |
| Total (Overall) | 10 (10.4%) | 86 (89.6%) |
Production, Transportation and Moving Occupations
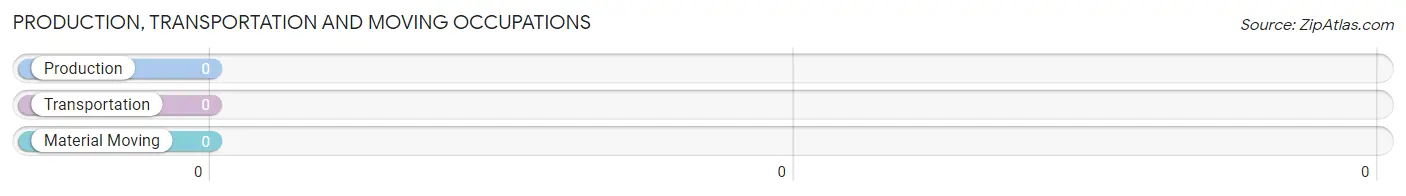
Production, Transportation and Moving Occupations by Sex
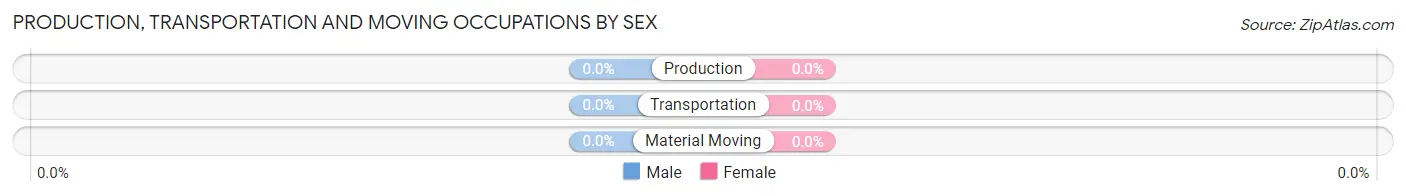
| Occupation | Male | Female |
| Production | 0 (0.0%) | 0 (0.0%) |
| Transportation | 0 (0.0%) | 0 (0.0%) |
| Material Moving | 0 (0.0%) | 0 (0.0%) |
| Total (Category) | 0 (0.0%) | 0 (0.0%) |
| Total (Overall) | 10 (10.4%) | 86 (89.6%) |
Employment Industries by Sex in Maury
Employment Industries in Maury
The major employment industries in Maury include Health Care & Social Assistance (30 | 31.2%), Public Administration (22 | 22.9%), Educational Services (21 | 21.9%), Professional & Scientific (13 | 13.5%), and Construction (10 | 10.4%).
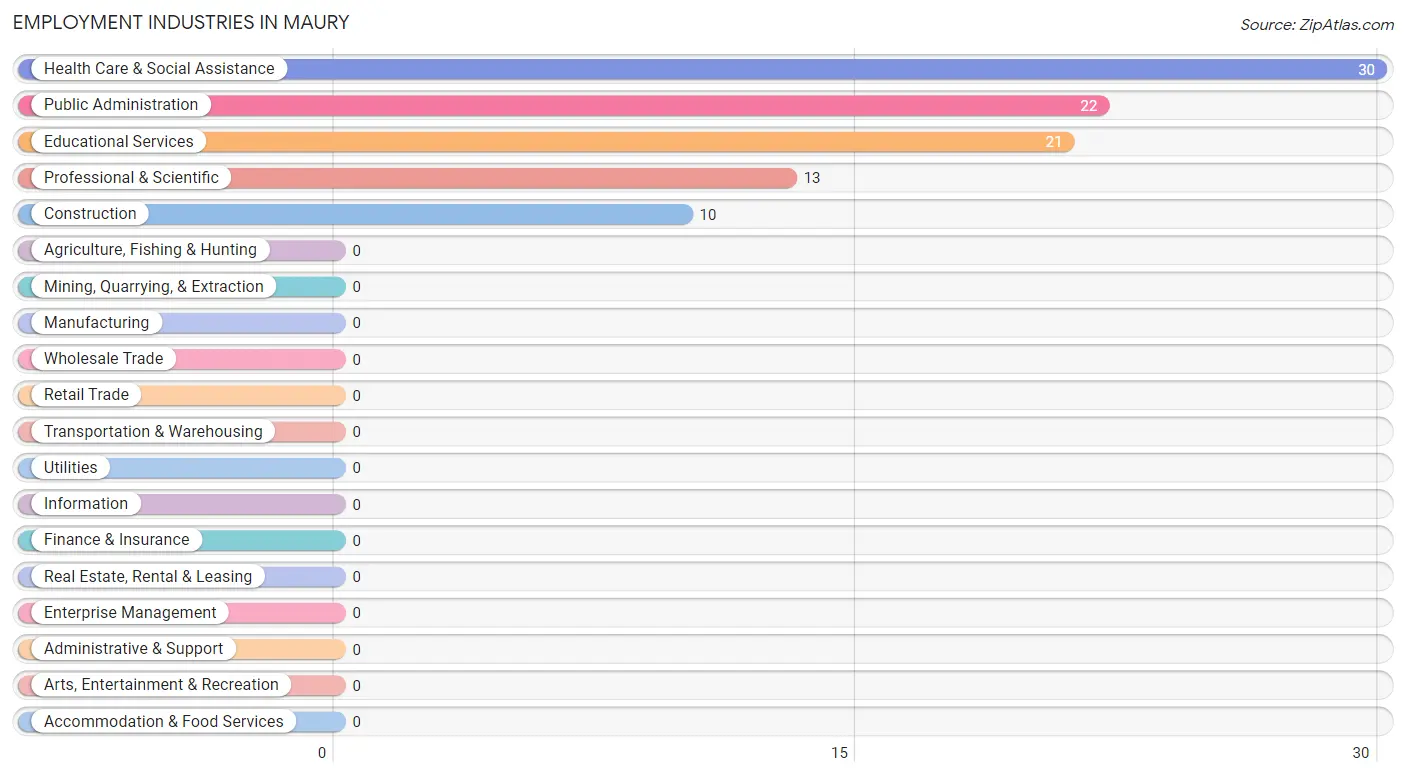
Employment Industries by Sex in Maury
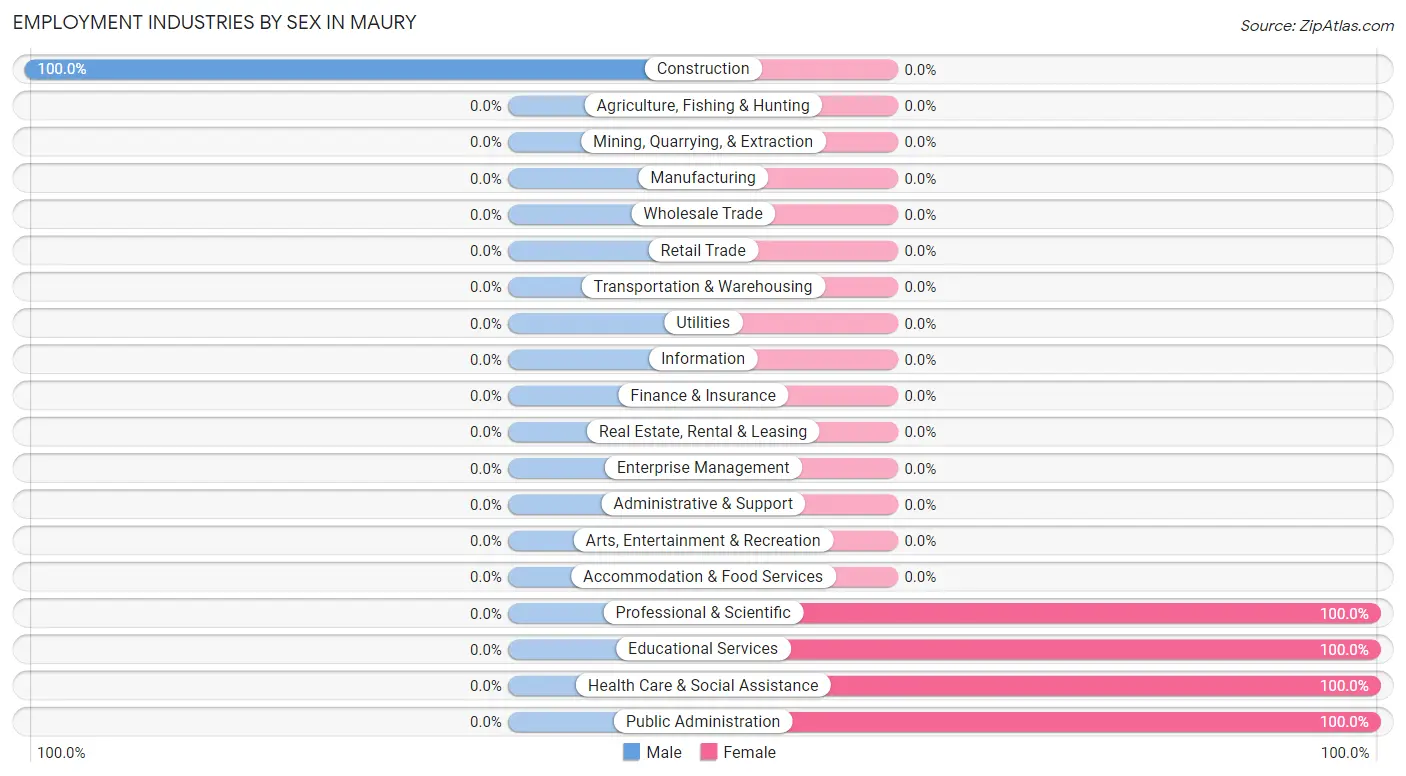
| Industry | Male | Female |
| Agriculture, Fishing & Hunting | 0 (0.0%) | 0 (0.0%) |
| Mining, Quarrying, & Extraction | 0 (0.0%) | 0 (0.0%) |
| Construction | 10 (100.0%) | 0 (0.0%) |
| Manufacturing | 0 (0.0%) | 0 (0.0%) |
| Wholesale Trade | 0 (0.0%) | 0 (0.0%) |
| Retail Trade | 0 (0.0%) | 0 (0.0%) |
| Transportation & Warehousing | 0 (0.0%) | 0 (0.0%) |
| Utilities | 0 (0.0%) | 0 (0.0%) |
| Information | 0 (0.0%) | 0 (0.0%) |
| Finance & Insurance | 0 (0.0%) | 0 (0.0%) |
| Real Estate, Rental & Leasing | 0 (0.0%) | 0 (0.0%) |
| Professional & Scientific | 0 (0.0%) | 13 (100.0%) |
| Enterprise Management | 0 (0.0%) | 0 (0.0%) |
| Administrative & Support | 0 (0.0%) | 0 (0.0%) |
| Educational Services | 0 (0.0%) | 21 (100.0%) |
| Health Care & Social Assistance | 0 (0.0%) | 30 (100.0%) |
| Arts, Entertainment & Recreation | 0 (0.0%) | 0 (0.0%) |
| Accommodation & Food Services | 0 (0.0%) | 0 (0.0%) |
| Public Administration | 0 (0.0%) | 22 (100.0%) |
| Total | 10 (10.4%) | 86 (89.6%) |
Education in Maury
School Enrollment in Maury
The most common levels of schooling among the 163 students in Maury are high school (97 | 59.5%), elementary school (32 | 19.6%), and kindergarten (18 | 11.0%).
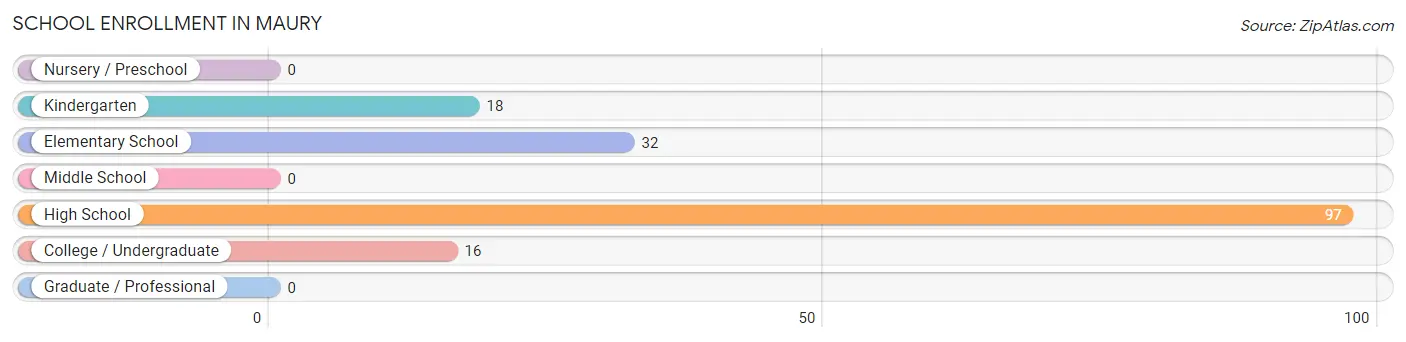
| School Level | # Students | % Students |
| Nursery / Preschool | 0 | 0.0% |
| Kindergarten | 18 | 11.0% |
| Elementary School | 32 | 19.6% |
| Middle School | 0 | 0.0% |
| High School | 97 | 59.5% |
| College / Undergraduate | 16 | 9.8% |
| Graduate / Professional | 0 | 0.0% |
| Total | 163 | 100.0% |
School Enrollment by Age by Funding Source in Maury
Out of a total of 163 students who are enrolled in schools in Maury, 13 (8.0%) attend a private institution, while the remaining 150 (92.0%) are enrolled in public schools. The age group of 15 to 17 year olds has the highest likelihood of being enrolled in private schools, with 13 (19.4% in the age bracket) enrolled. Conversely, the age group of 5 to 9 year old has the lowest likelihood of being enrolled in a private school, with 50 (100.0% in the age bracket) attending a public institution.
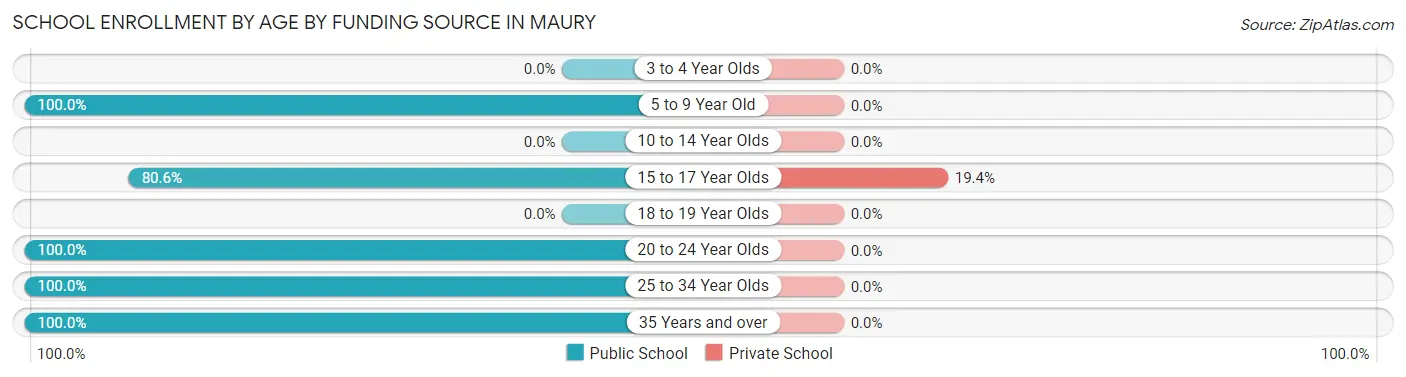
| Age Bracket | Public School | Private School |
| 3 to 4 Year Olds | 0 (0.0%) | 0 (0.0%) |
| 5 to 9 Year Old | 50 (100.0%) | 0 (0.0%) |
| 10 to 14 Year Olds | 0 (0.0%) | 0 (0.0%) |
| 15 to 17 Year Olds | 54 (80.6%) | 13 (19.4%) |
| 18 to 19 Year Olds | 0 (0.0%) | 0 (0.0%) |
| 20 to 24 Year Olds | 4 (100.0%) | 0 (0.0%) |
| 25 to 34 Year Olds | 34 (100.0%) | 0 (0.0%) |
| 35 Years and over | 8 (100.0%) | 0 (0.0%) |
| Total | 150 (92.0%) | 13 (8.0%) |
Educational Attainment by Field of Study in Maury
Arts & humanities (22 | 40.7%), bio, nature & agricultural (16 | 29.6%), and education (16 | 29.6%) are the most common fields of study among 54 individuals in Maury who have obtained a bachelor's degree or higher.
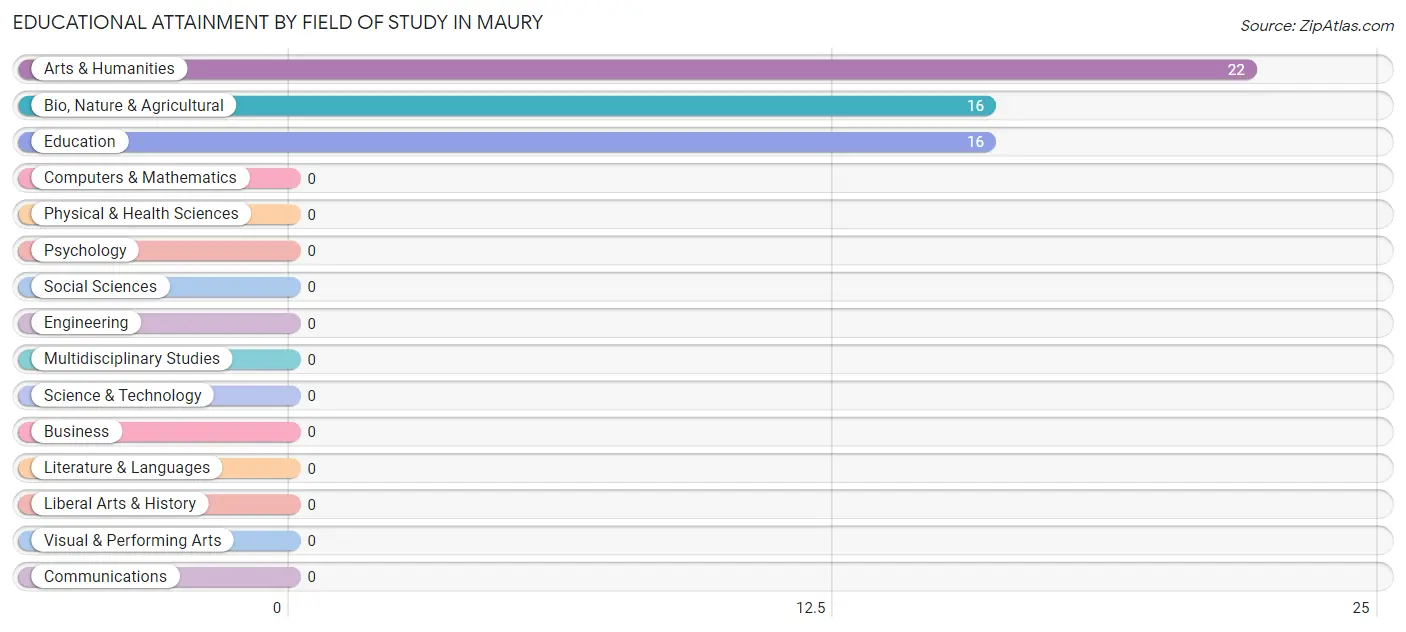
| Field of Study | # Graduates | % Graduates |
| Computers & Mathematics | 0 | 0.0% |
| Bio, Nature & Agricultural | 16 | 29.6% |
| Physical & Health Sciences | 0 | 0.0% |
| Psychology | 0 | 0.0% |
| Social Sciences | 0 | 0.0% |
| Engineering | 0 | 0.0% |
| Multidisciplinary Studies | 0 | 0.0% |
| Science & Technology | 0 | 0.0% |
| Business | 0 | 0.0% |
| Education | 16 | 29.6% |
| Literature & Languages | 0 | 0.0% |
| Liberal Arts & History | 0 | 0.0% |
| Visual & Performing Arts | 0 | 0.0% |
| Communications | 0 | 0.0% |
| Arts & Humanities | 22 | 40.7% |
| Total | 54 | 100.0% |
Transportation & Commute in Maury
Vehicle Availability by Sex in Maury
The most prevalent vehicle ownership categories in Maury are males with 2 vehicles (10, accounting for 100.0%) and females with 2 vehicles (29, making up 11.6%).
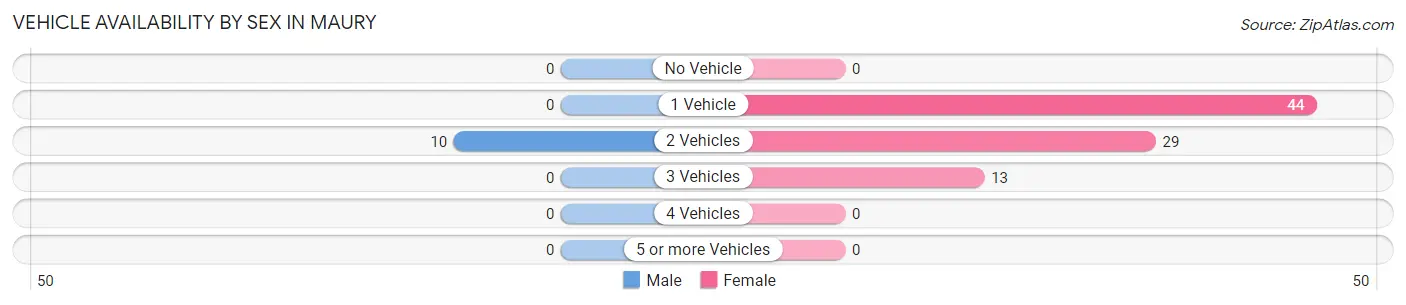
| Vehicles Available | Male | Female |
| No Vehicle | 0 (0.0%) | 0 (0.0%) |
| 1 Vehicle | 0 (0.0%) | 44 (51.2%) |
| 2 Vehicles | 10 (100.0%) | 29 (33.7%) |
| 3 Vehicles | 0 (0.0%) | 13 (15.1%) |
| 4 Vehicles | 0 (0.0%) | 0 (0.0%) |
| 5 or more Vehicles | 0 (0.0%) | 0 (0.0%) |
| Total | 10 (100.0%) | 86 (100.0%) |
Commute Time in Maury
The most frequently occuring commute durations in Maury are 15 to 19 minutes (29 commuters, 30.2%), less than 5 minutes (22 commuters, 22.9%), and 35 to 39 minutes (22 commuters, 22.9%).
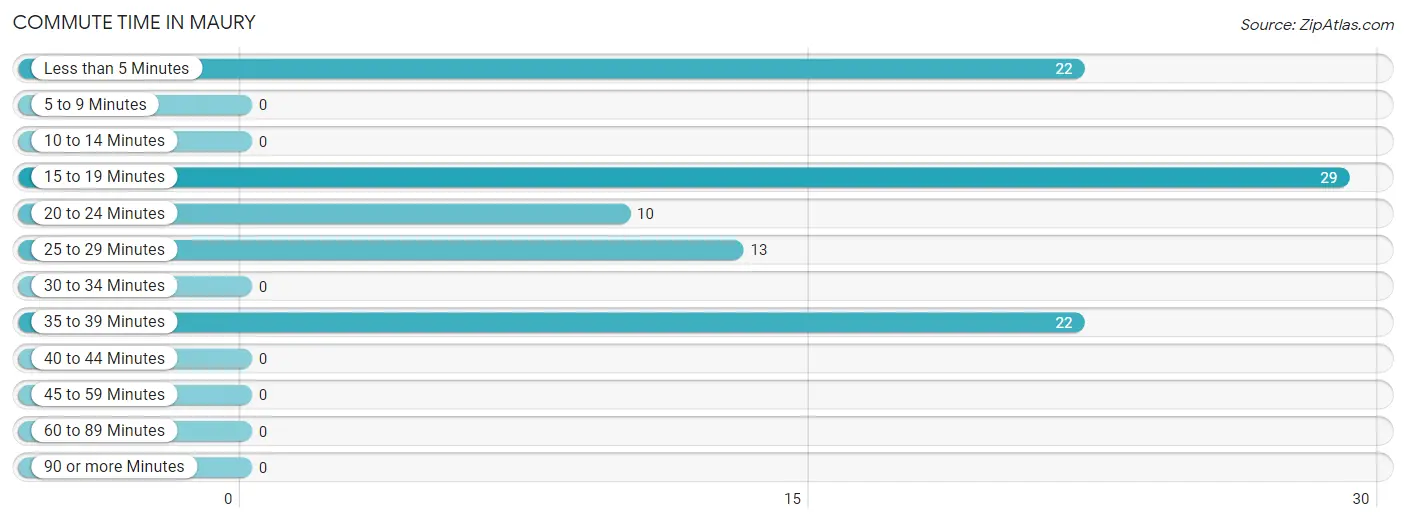
| Commute Time | # Commuters | % Commuters |
| Less than 5 Minutes | 22 | 22.9% |
| 5 to 9 Minutes | 0 | 0.0% |
| 10 to 14 Minutes | 0 | 0.0% |
| 15 to 19 Minutes | 29 | 30.2% |
| 20 to 24 Minutes | 10 | 10.4% |
| 25 to 29 Minutes | 13 | 13.5% |
| 30 to 34 Minutes | 0 | 0.0% |
| 35 to 39 Minutes | 22 | 22.9% |
| 40 to 44 Minutes | 0 | 0.0% |
| 45 to 59 Minutes | 0 | 0.0% |
| 60 to 89 Minutes | 0 | 0.0% |
| 90 or more Minutes | 0 | 0.0% |
Commute Time by Sex in Maury
The most common commute times in Maury are 20 to 24 minutes (10 commuters, 100.0%) for males and 15 to 19 minutes (29 commuters, 33.7%) for females.
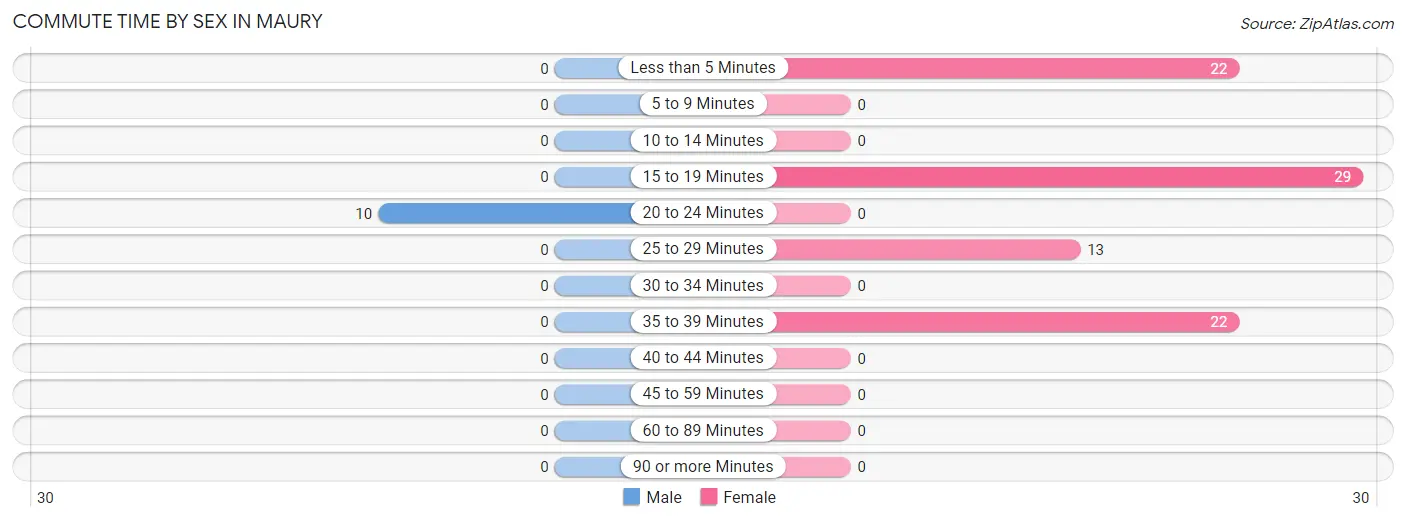
| Commute Time | Male | Female |
| Less than 5 Minutes | 0 (0.0%) | 22 (25.6%) |
| 5 to 9 Minutes | 0 (0.0%) | 0 (0.0%) |
| 10 to 14 Minutes | 0 (0.0%) | 0 (0.0%) |
| 15 to 19 Minutes | 0 (0.0%) | 29 (33.7%) |
| 20 to 24 Minutes | 10 (100.0%) | 0 (0.0%) |
| 25 to 29 Minutes | 0 (0.0%) | 13 (15.1%) |
| 30 to 34 Minutes | 0 (0.0%) | 0 (0.0%) |
| 35 to 39 Minutes | 0 (0.0%) | 22 (25.6%) |
| 40 to 44 Minutes | 0 (0.0%) | 0 (0.0%) |
| 45 to 59 Minutes | 0 (0.0%) | 0 (0.0%) |
| 60 to 89 Minutes | 0 (0.0%) | 0 (0.0%) |
| 90 or more Minutes | 0 (0.0%) | 0 (0.0%) |
Time of Departure to Work by Sex in Maury
The most frequent times of departure to work in Maury are 7:00 AM to 7:29 AM (10, 100.0%) for males and 6:30 AM to 6:59 AM (43, 50.0%) for females.
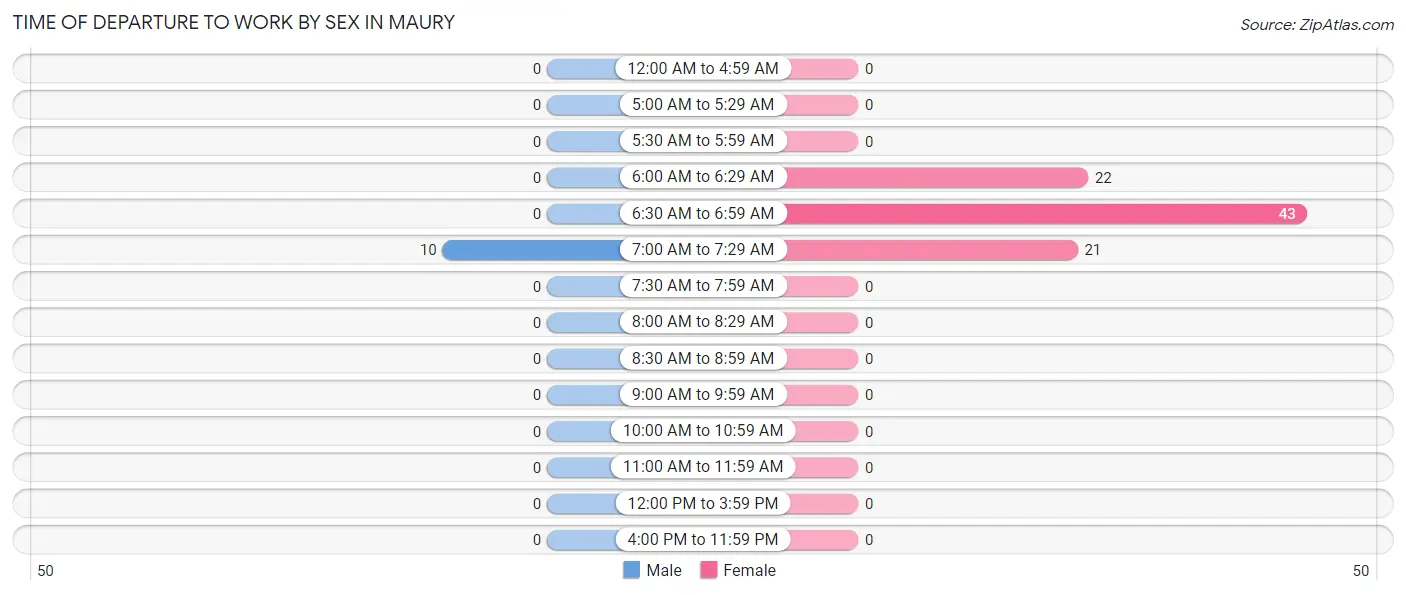
| Time of Departure | Male | Female |
| 12:00 AM to 4:59 AM | 0 (0.0%) | 0 (0.0%) |
| 5:00 AM to 5:29 AM | 0 (0.0%) | 0 (0.0%) |
| 5:30 AM to 5:59 AM | 0 (0.0%) | 0 (0.0%) |
| 6:00 AM to 6:29 AM | 0 (0.0%) | 22 (25.6%) |
| 6:30 AM to 6:59 AM | 0 (0.0%) | 43 (50.0%) |
| 7:00 AM to 7:29 AM | 10 (100.0%) | 21 (24.4%) |
| 7:30 AM to 7:59 AM | 0 (0.0%) | 0 (0.0%) |
| 8:00 AM to 8:29 AM | 0 (0.0%) | 0 (0.0%) |
| 8:30 AM to 8:59 AM | 0 (0.0%) | 0 (0.0%) |
| 9:00 AM to 9:59 AM | 0 (0.0%) | 0 (0.0%) |
| 10:00 AM to 10:59 AM | 0 (0.0%) | 0 (0.0%) |
| 11:00 AM to 11:59 AM | 0 (0.0%) | 0 (0.0%) |
| 12:00 PM to 3:59 PM | 0 (0.0%) | 0 (0.0%) |
| 4:00 PM to 11:59 PM | 0 (0.0%) | 0 (0.0%) |
| Total | 10 (100.0%) | 86 (100.0%) |
Housing Occupancy in Maury
Occupancy by Ownership in Maury
Of the total 186 dwellings in Maury, owner-occupied units account for 90 (48.4%), while renter-occupied units make up 96 (51.6%).
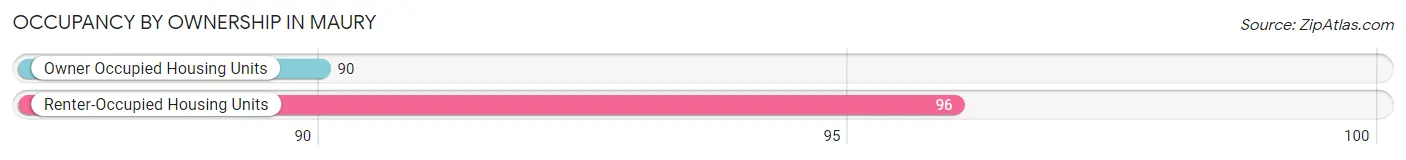
| Occupancy | # Housing Units | % Housing Units |
| Owner Occupied Housing Units | 90 | 48.4% |
| Renter-Occupied Housing Units | 96 | 51.6% |
| Total Occupied Housing Units | 186 | 100.0% |
Occupancy by Household Size in Maury
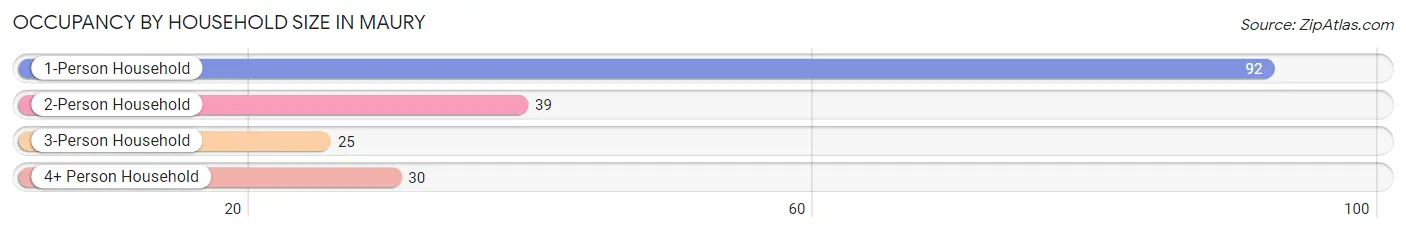
| Household Size | # Housing Units | % Housing Units |
| 1-Person Household | 92 | 49.5% |
| 2-Person Household | 39 | 21.0% |
| 3-Person Household | 25 | 13.4% |
| 4+ Person Household | 30 | 16.1% |
| Total Housing Units | 186 | 100.0% |
Occupancy by Ownership by Household Size in Maury
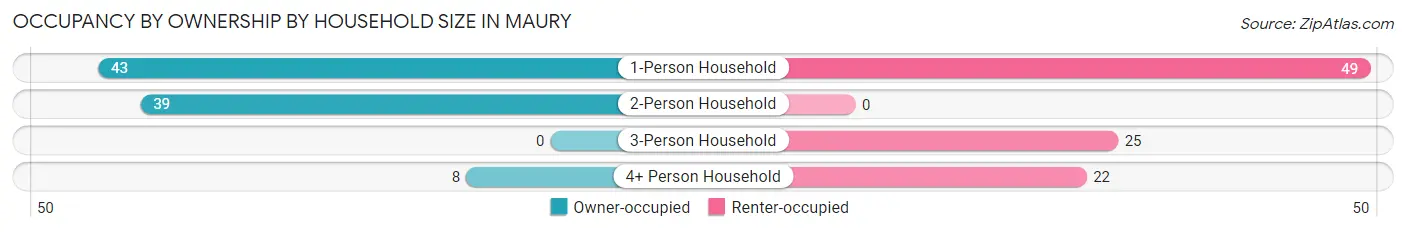
| Household Size | Owner-occupied | Renter-occupied |
| 1-Person Household | 43 (46.7%) | 49 (53.3%) |
| 2-Person Household | 39 (100.0%) | 0 (0.0%) |
| 3-Person Household | 0 (0.0%) | 25 (100.0%) |
| 4+ Person Household | 8 (26.7%) | 22 (73.3%) |
| Total Housing Units | 90 (48.4%) | 96 (51.6%) |
Occupancy by Educational Attainment in Maury
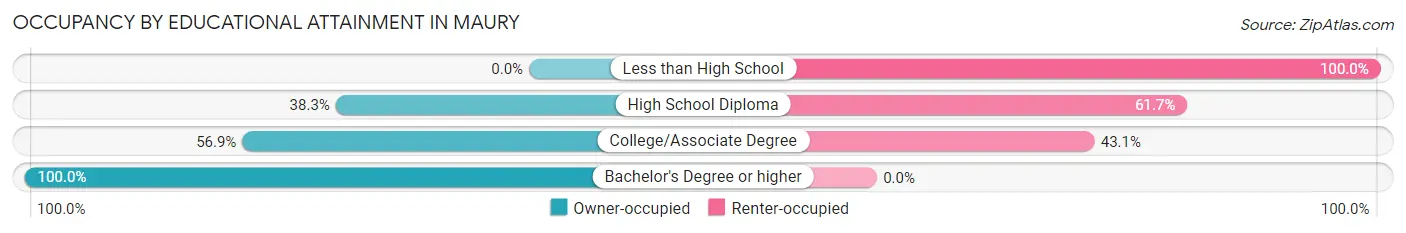
| Household Size | Owner-occupied | Renter-occupied |
| Less than High School | 0 (0.0%) | 37 (100.0%) |
| High School Diploma | 23 (38.3%) | 37 (61.7%) |
| College/Associate Degree | 29 (56.9%) | 22 (43.1%) |
| Bachelor's Degree or higher | 38 (100.0%) | 0 (0.0%) |
Occupancy by Age of Householder in Maury
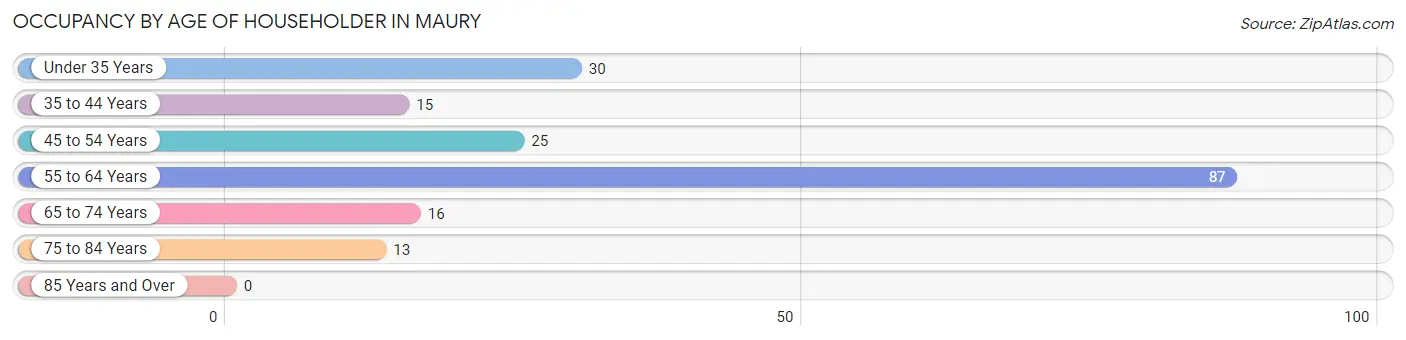
| Age Bracket | # Households | % Households |
| Under 35 Years | 30 | 16.1% |
| 35 to 44 Years | 15 | 8.1% |
| 45 to 54 Years | 25 | 13.4% |
| 55 to 64 Years | 87 | 46.8% |
| 65 to 74 Years | 16 | 8.6% |
| 75 to 84 Years | 13 | 7.0% |
| 85 Years and Over | 0 | 0.0% |
| Total | 186 | 100.0% |
Housing Finances in Maury
Median Income by Occupancy in Maury
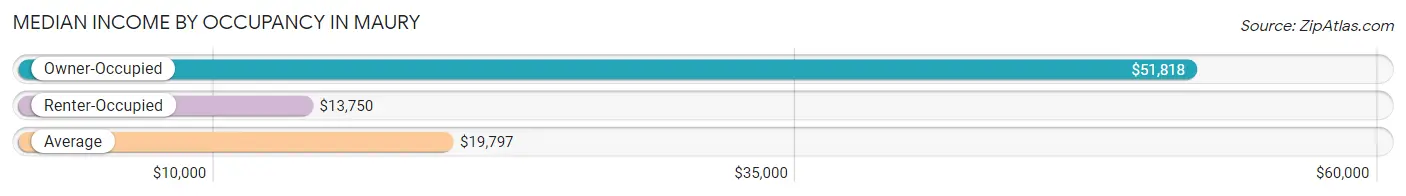
| Occupancy Type | # Households | Median Income |
| Owner-Occupied | 90 (48.4%) | $51,818 |
| Renter-Occupied | 96 (51.6%) | $13,750 |
| Average | 186 (100.0%) | $19,797 |
Occupancy by Householder Income Bracket in Maury
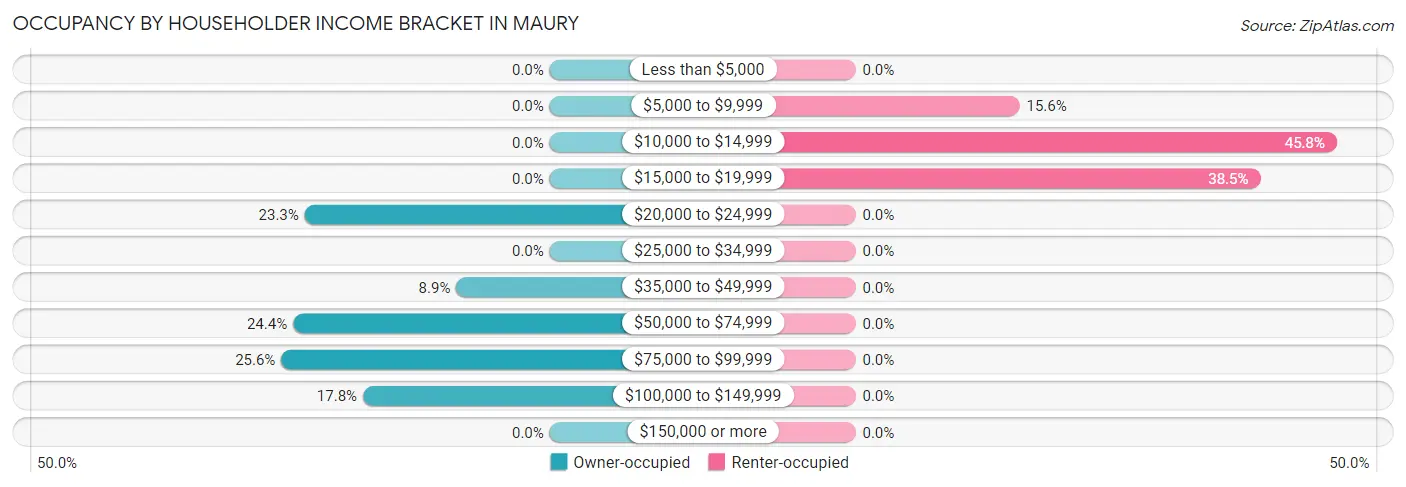
| Income Bracket | Owner-occupied | Renter-occupied |
| Less than $5,000 | 0 (0.0%) | 0 (0.0%) |
| $5,000 to $9,999 | 0 (0.0%) | 15 (15.6%) |
| $10,000 to $14,999 | 0 (0.0%) | 44 (45.8%) |
| $15,000 to $19,999 | 0 (0.0%) | 37 (38.5%) |
| $20,000 to $24,999 | 21 (23.3%) | 0 (0.0%) |
| $25,000 to $34,999 | 0 (0.0%) | 0 (0.0%) |
| $35,000 to $49,999 | 8 (8.9%) | 0 (0.0%) |
| $50,000 to $74,999 | 22 (24.4%) | 0 (0.0%) |
| $75,000 to $99,999 | 23 (25.6%) | 0 (0.0%) |
| $100,000 to $149,999 | 16 (17.8%) | 0 (0.0%) |
| $150,000 or more | 0 (0.0%) | 0 (0.0%) |
| Total | 90 (100.0%) | 96 (100.0%) |
Monthly Housing Cost Tiers in Maury
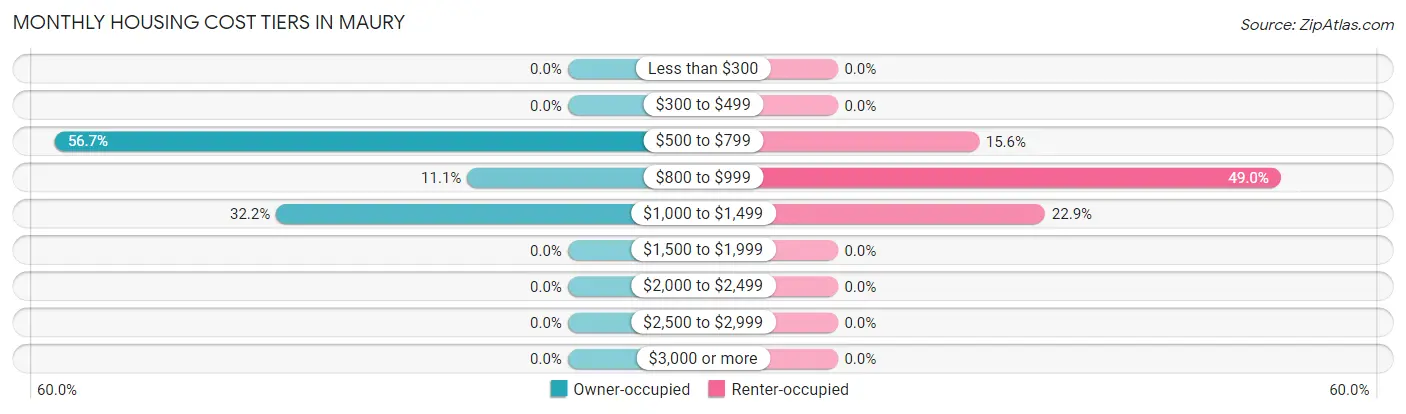
| Monthly Cost | Owner-occupied | Renter-occupied |
| Less than $300 | 0 (0.0%) | 0 (0.0%) |
| $300 to $499 | 0 (0.0%) | 0 (0.0%) |
| $500 to $799 | 51 (56.7%) | 15 (15.6%) |
| $800 to $999 | 10 (11.1%) | 47 (49.0%) |
| $1,000 to $1,499 | 29 (32.2%) | 22 (22.9%) |
| $1,500 to $1,999 | 0 (0.0%) | 0 (0.0%) |
| $2,000 to $2,499 | 0 (0.0%) | 0 (0.0%) |
| $2,500 to $2,999 | 0 (0.0%) | 0 (0.0%) |
| $3,000 or more | 0 (0.0%) | 0 (0.0%) |
| Total | 90 (100.0%) | 96 (100.0%) |
Physical Housing Characteristics in Maury
Housing Structures in Maury
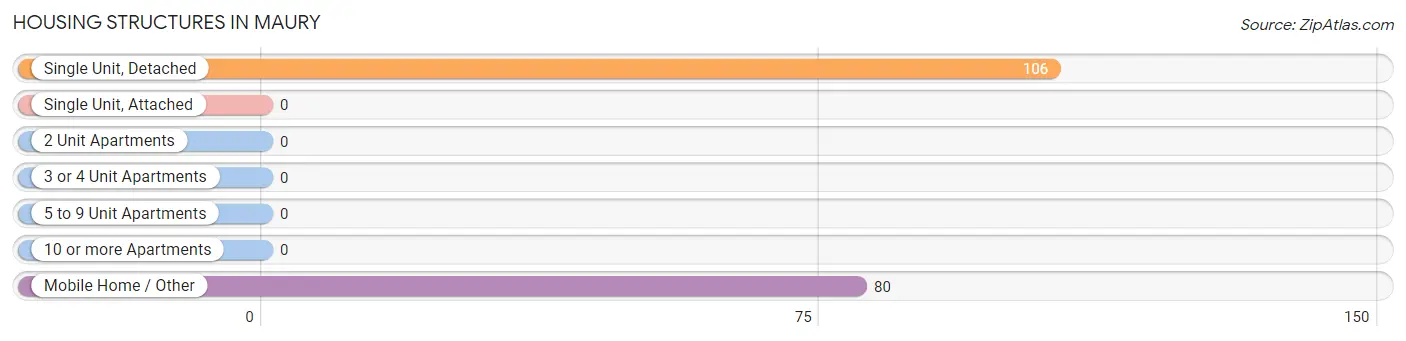
| Structure Type | # Housing Units | % Housing Units |
| Single Unit, Detached | 106 | 57.0% |
| Single Unit, Attached | 0 | 0.0% |
| 2 Unit Apartments | 0 | 0.0% |
| 3 or 4 Unit Apartments | 0 | 0.0% |
| 5 to 9 Unit Apartments | 0 | 0.0% |
| 10 or more Apartments | 0 | 0.0% |
| Mobile Home / Other | 80 | 43.0% |
| Total | 186 | 100.0% |
Housing Structures by Occupancy in Maury
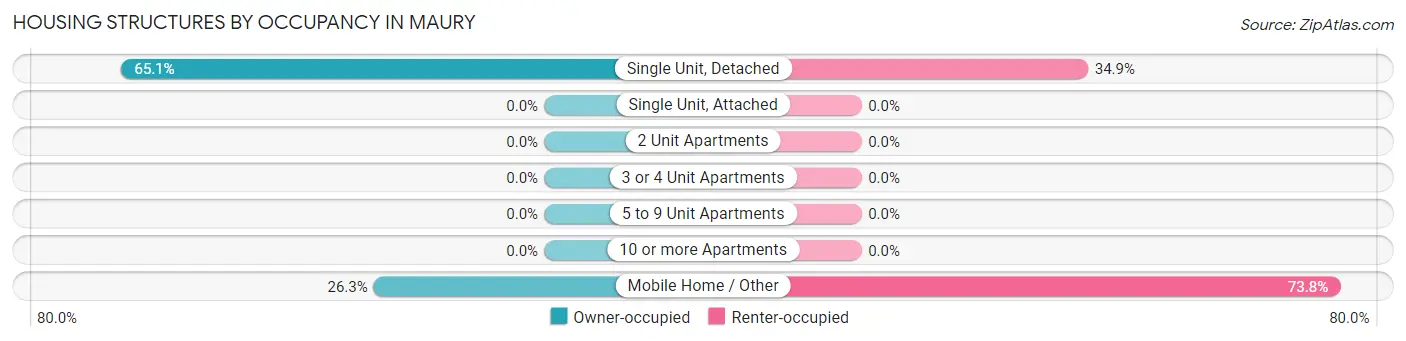
| Structure Type | Owner-occupied | Renter-occupied |
| Single Unit, Detached | 69 (65.1%) | 37 (34.9%) |
| Single Unit, Attached | 0 (0.0%) | 0 (0.0%) |
| 2 Unit Apartments | 0 (0.0%) | 0 (0.0%) |
| 3 or 4 Unit Apartments | 0 (0.0%) | 0 (0.0%) |
| 5 to 9 Unit Apartments | 0 (0.0%) | 0 (0.0%) |
| 10 or more Apartments | 0 (0.0%) | 0 (0.0%) |
| Mobile Home / Other | 21 (26.3%) | 59 (73.8%) |
| Total | 90 (48.4%) | 96 (51.6%) |
Housing Structures by Number of Rooms in Maury
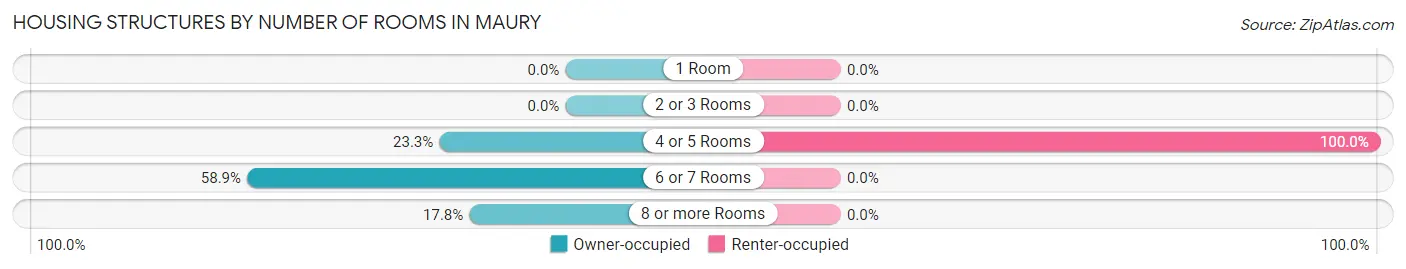
| Number of Rooms | Owner-occupied | Renter-occupied |
| 1 Room | 0 (0.0%) | 0 (0.0%) |
| 2 or 3 Rooms | 0 (0.0%) | 0 (0.0%) |
| 4 or 5 Rooms | 21 (23.3%) | 96 (100.0%) |
| 6 or 7 Rooms | 53 (58.9%) | 0 (0.0%) |
| 8 or more Rooms | 16 (17.8%) | 0 (0.0%) |
| Total | 90 (100.0%) | 96 (100.0%) |
Housing Structure by Heating Type in Maury
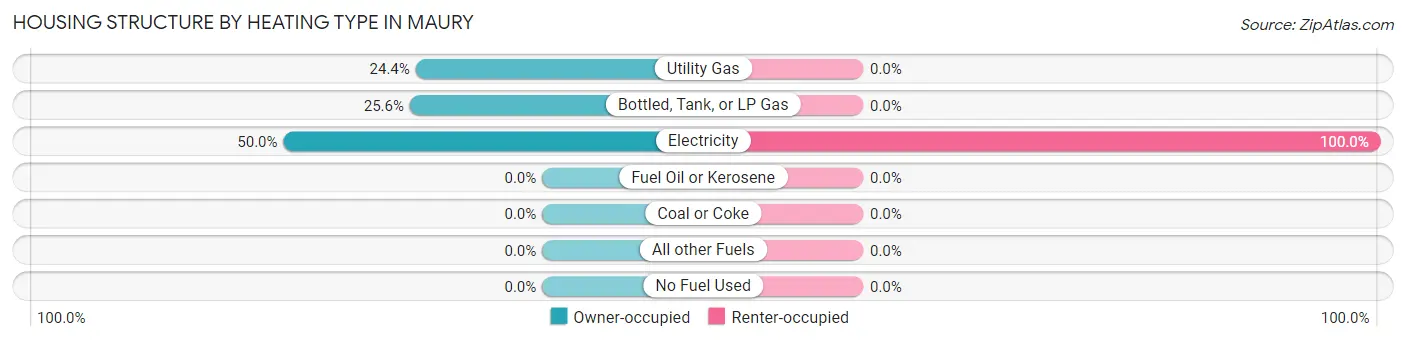
| Heating Type | Owner-occupied | Renter-occupied |
| Utility Gas | 22 (24.4%) | 0 (0.0%) |
| Bottled, Tank, or LP Gas | 23 (25.6%) | 0 (0.0%) |
| Electricity | 45 (50.0%) | 96 (100.0%) |
| Fuel Oil or Kerosene | 0 (0.0%) | 0 (0.0%) |
| Coal or Coke | 0 (0.0%) | 0 (0.0%) |
| All other Fuels | 0 (0.0%) | 0 (0.0%) |
| No Fuel Used | 0 (0.0%) | 0 (0.0%) |
| Total | 90 (100.0%) | 96 (100.0%) |
Household Vehicle Usage in Maury
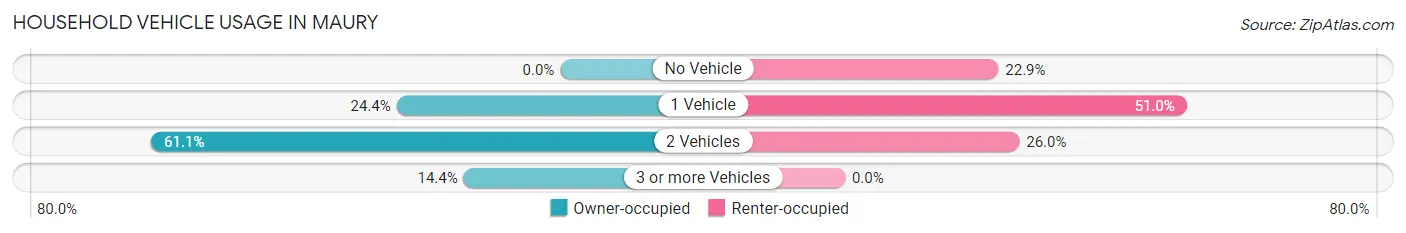
| Vehicles per Household | Owner-occupied | Renter-occupied |
| No Vehicle | 0 (0.0%) | 22 (22.9%) |
| 1 Vehicle | 22 (24.4%) | 49 (51.0%) |
| 2 Vehicles | 55 (61.1%) | 25 (26.0%) |
| 3 or more Vehicles | 13 (14.4%) | 0 (0.0%) |
| Total | 90 (100.0%) | 96 (100.0%) |
Real Estate & Mortgages in Maury
Real Estate and Mortgage Overview in Maury
| Characteristic | Without Mortgage | With Mortgage |
| Housing Units | 39 | 51 |
| Median Property Value | $220,300 | $81,700 |
| Median Household Income | $89,327 | $0 |
| Monthly Housing Costs | $667 | $0 |
| Real Estate Taxes | $2,250 | $22 |
Property Value by Mortgage Status in Maury
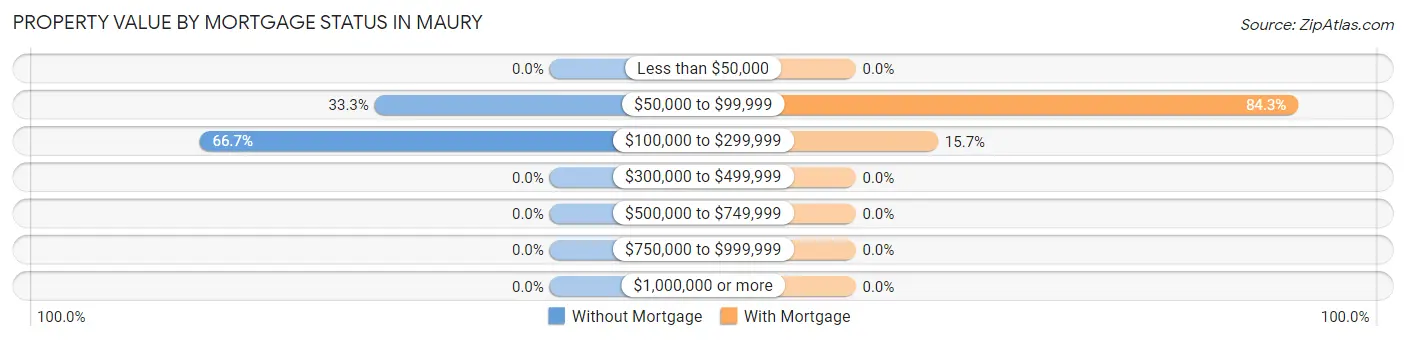
| Property Value | Without Mortgage | With Mortgage |
| Less than $50,000 | 0 (0.0%) | 0 (0.0%) |
| $50,000 to $99,999 | 13 (33.3%) | 43 (84.3%) |
| $100,000 to $299,999 | 26 (66.7%) | 8 (15.7%) |
| $300,000 to $499,999 | 0 (0.0%) | 0 (0.0%) |
| $500,000 to $749,999 | 0 (0.0%) | 0 (0.0%) |
| $750,000 to $999,999 | 0 (0.0%) | 0 (0.0%) |
| $1,000,000 or more | 0 (0.0%) | 0 (0.0%) |
| Total | 39 (100.0%) | 51 (100.0%) |
Household Income by Mortgage Status in Maury
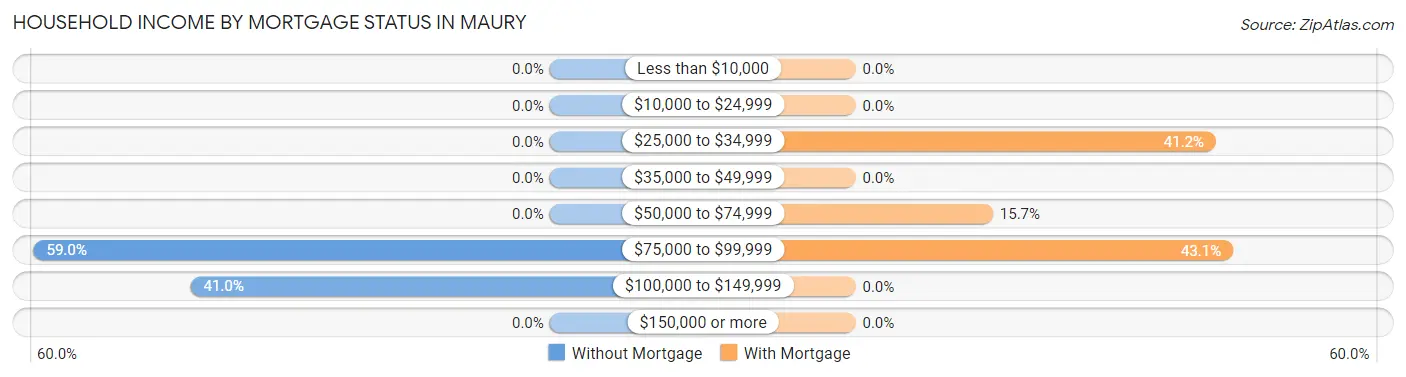
| Household Income | Without Mortgage | With Mortgage |
| Less than $10,000 | 0 (0.0%) | 0 (0.0%) |
| $10,000 to $24,999 | 0 (0.0%) | 0 (0.0%) |
| $25,000 to $34,999 | 0 (0.0%) | 21 (41.2%) |
| $35,000 to $49,999 | 0 (0.0%) | 0 (0.0%) |
| $50,000 to $74,999 | 0 (0.0%) | 8 (15.7%) |
| $75,000 to $99,999 | 23 (59.0%) | 22 (43.1%) |
| $100,000 to $149,999 | 16 (41.0%) | 0 (0.0%) |
| $150,000 or more | 0 (0.0%) | 0 (0.0%) |
| Total | 39 (100.0%) | 51 (100.0%) |
Property Value to Household Income Ratio in Maury
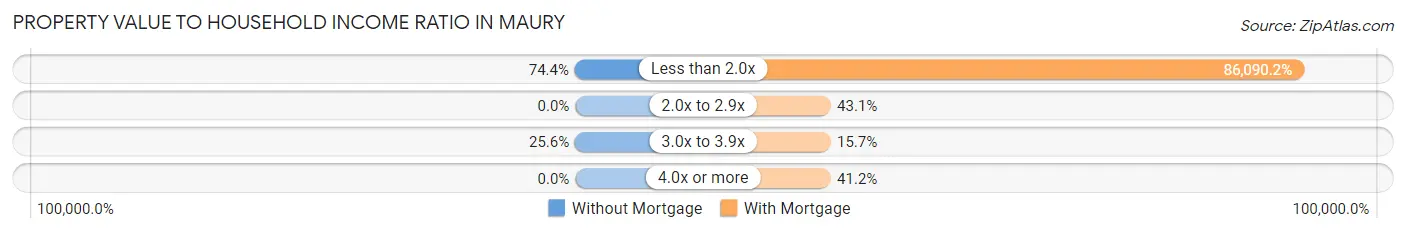
| Value-to-Income Ratio | Without Mortgage | With Mortgage |
| Less than 2.0x | 29 (74.4%) | 43,906 (86,090.2%) |
| 2.0x to 2.9x | 0 (0.0%) | 22 (43.1%) |
| 3.0x to 3.9x | 10 (25.6%) | 8 (15.7%) |
| 4.0x or more | 0 (0.0%) | 21 (41.2%) |
| Total | 39 (100.0%) | 51 (100.0%) |
Real Estate Taxes by Mortgage Status in Maury
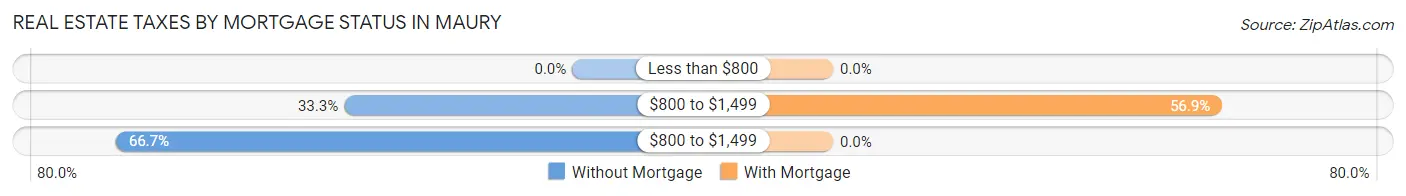
| Property Taxes | Without Mortgage | With Mortgage |
| Less than $800 | 0 (0.0%) | 0 (0.0%) |
| $800 to $1,499 | 13 (33.3%) | 29 (56.9%) |
| $800 to $1,499 | 26 (66.7%) | 0 (0.0%) |
| Total | 39 (100.0%) | 51 (100.0%) |
Health & Disability in Maury
Health Insurance Coverage by Age in Maury
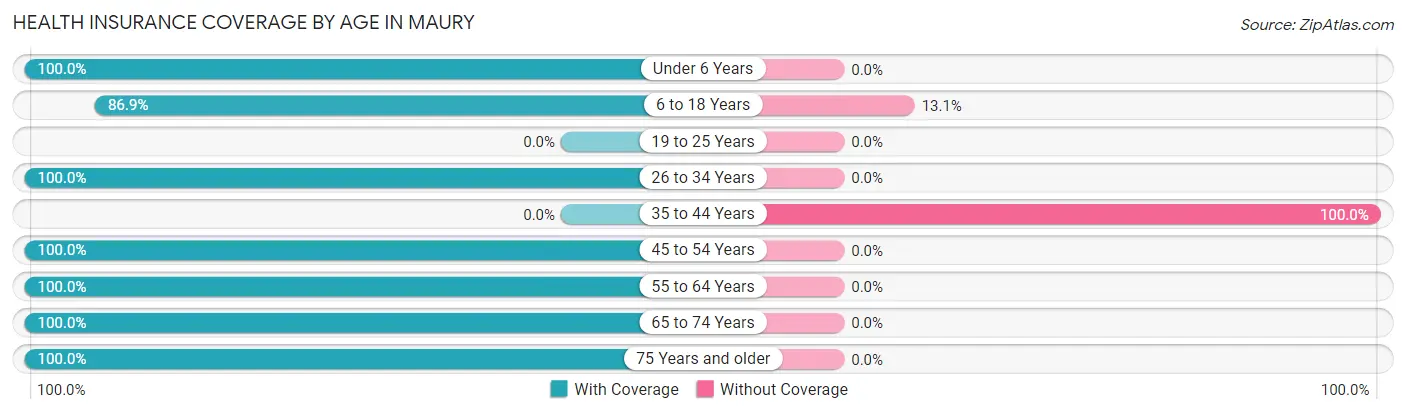
| Age Bracket | With Coverage | Without Coverage |
| Under 6 Years | 59 (100.0%) | 0 (0.0%) |
| 6 to 18 Years | 86 (86.9%) | 13 (13.1%) |
| 19 to 25 Years | 0 (0.0%) | 0 (0.0%) |
| 26 to 34 Years | 35 (100.0%) | 0 (0.0%) |
| 35 to 44 Years | 0 (0.0%) | 15 (100.0%) |
| 45 to 54 Years | 25 (100.0%) | 0 (0.0%) |
| 55 to 64 Years | 87 (100.0%) | 0 (0.0%) |
| 65 to 74 Years | 44 (100.0%) | 0 (0.0%) |
| 75 Years and older | 13 (100.0%) | 0 (0.0%) |
| Total | 349 (92.6%) | 28 (7.4%) |
Health Insurance Coverage by Citizenship Status in Maury
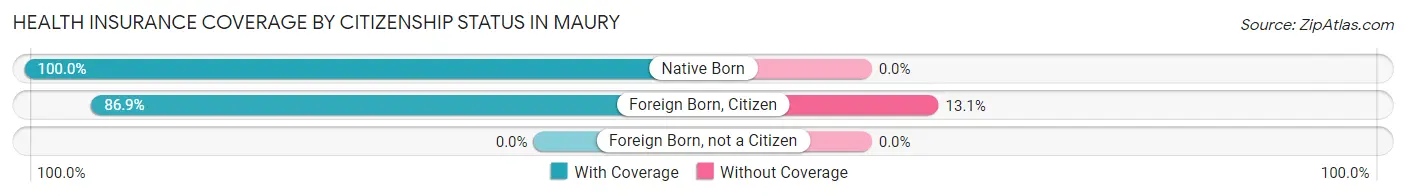
| Citizenship Status | With Coverage | Without Coverage |
| Native Born | 59 (100.0%) | 0 (0.0%) |
| Foreign Born, Citizen | 86 (86.9%) | 13 (13.1%) |
| Foreign Born, not a Citizen | 0 (0.0%) | 0 (0.0%) |
Health Insurance Coverage by Household Income in Maury
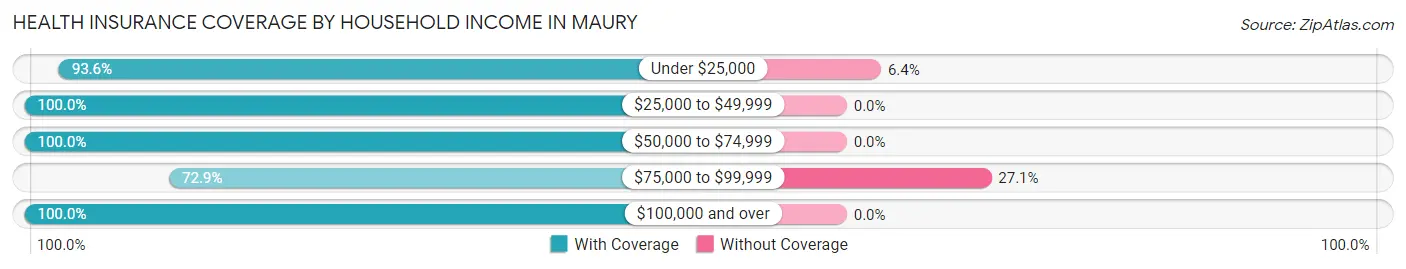
| Household Income | With Coverage | Without Coverage |
| Under $25,000 | 219 (93.6%) | 15 (6.4%) |
| $25,000 to $49,999 | 41 (100.0%) | 0 (0.0%) |
| $50,000 to $74,999 | 22 (100.0%) | 0 (0.0%) |
| $75,000 to $99,999 | 35 (72.9%) | 13 (27.1%) |
| $100,000 and over | 32 (100.0%) | 0 (0.0%) |
Public vs Private Health Insurance Coverage by Age in Maury
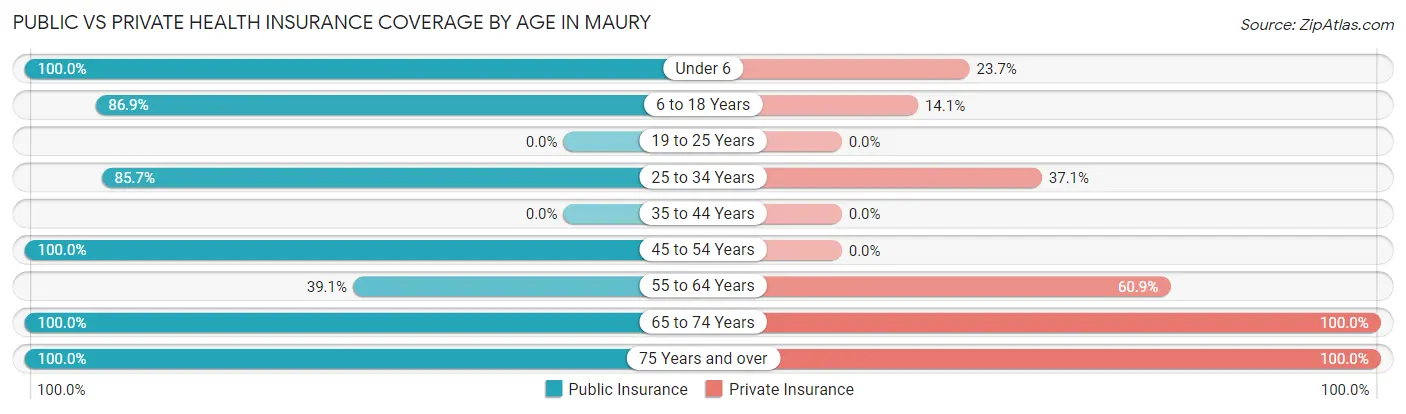
| Age Bracket | Public Insurance | Private Insurance |
| Under 6 | 59 (100.0%) | 14 (23.7%) |
| 6 to 18 Years | 86 (86.9%) | 14 (14.1%) |
| 19 to 25 Years | 0 (0.0%) | 0 (0.0%) |
| 25 to 34 Years | 30 (85.7%) | 13 (37.1%) |
| 35 to 44 Years | 0 (0.0%) | 0 (0.0%) |
| 45 to 54 Years | 25 (100.0%) | 0 (0.0%) |
| 55 to 64 Years | 34 (39.1%) | 53 (60.9%) |
| 65 to 74 Years | 44 (100.0%) | 44 (100.0%) |
| 75 Years and over | 13 (100.0%) | 13 (100.0%) |
| Total | 291 (77.2%) | 151 (40.1%) |
Disability Status by Sex by Age in Maury
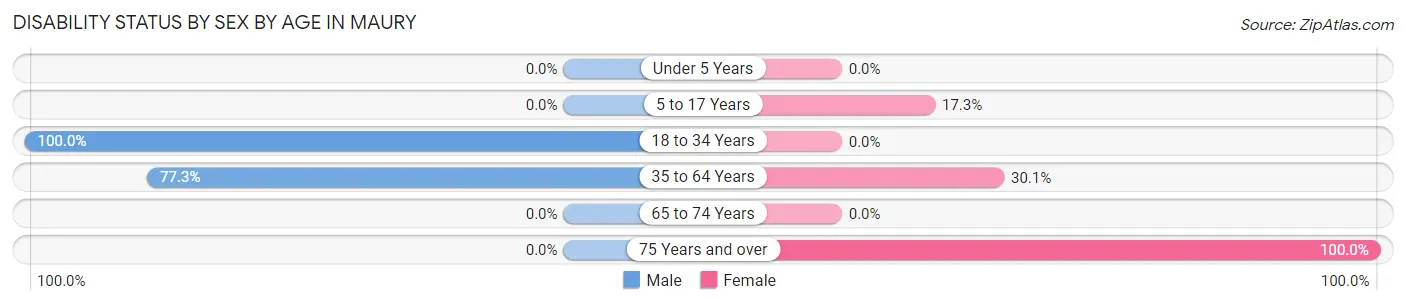
| Age Bracket | Male | Female |
| Under 5 Years | 0 (0.0%) | 0 (0.0%) |
| 5 to 17 Years | 0 (0.0%) | 18 (17.3%) |
| 18 to 34 Years | 5 (100.0%) | 0 (0.0%) |
| 35 to 64 Years | 34 (77.3%) | 25 (30.1%) |
| 65 to 74 Years | 0 (0.0%) | 0 (0.0%) |
| 75 Years and over | 0 (0.0%) | 13 (100.0%) |
Disability Class by Sex by Age in Maury
Disability Class: Hearing Difficulty
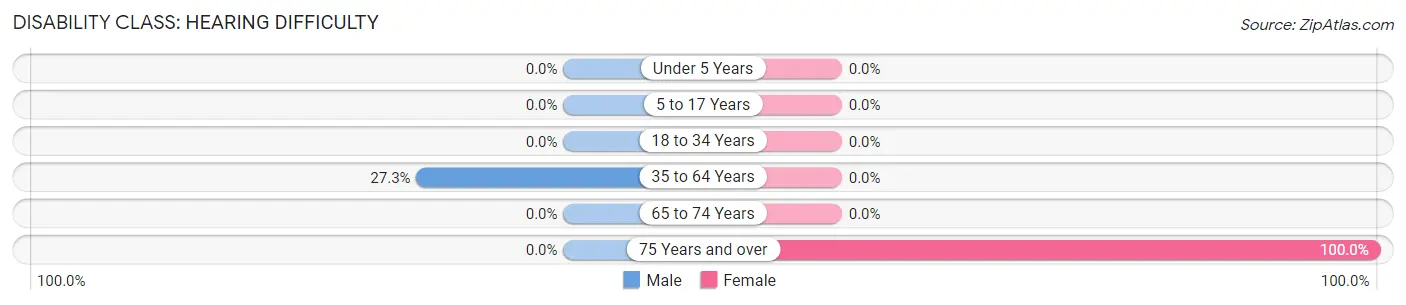
| Age Bracket | Male | Female |
| Under 5 Years | 0 (0.0%) | 0 (0.0%) |
| 5 to 17 Years | 0 (0.0%) | 0 (0.0%) |
| 18 to 34 Years | 0 (0.0%) | 0 (0.0%) |
| 35 to 64 Years | 12 (27.3%) | 0 (0.0%) |
| 65 to 74 Years | 0 (0.0%) | 0 (0.0%) |
| 75 Years and over | 0 (0.0%) | 13 (100.0%) |
Disability Class: Vision Difficulty
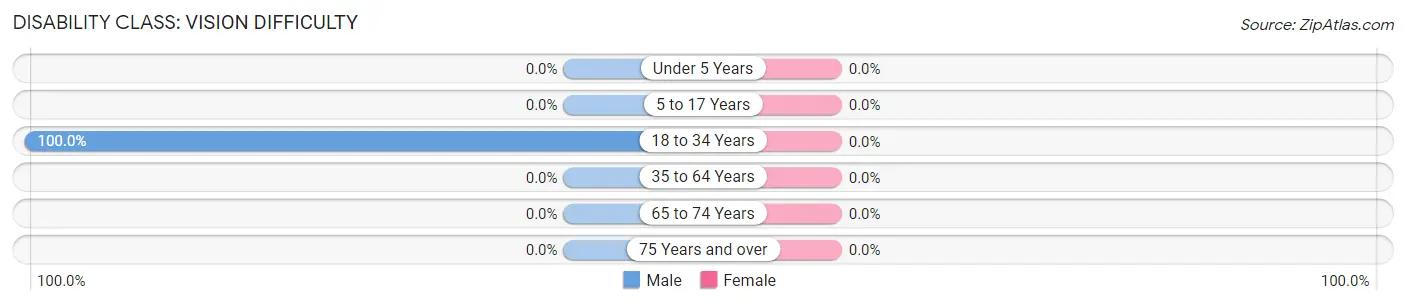
| Age Bracket | Male | Female |
| Under 5 Years | 0 (0.0%) | 0 (0.0%) |
| 5 to 17 Years | 0 (0.0%) | 0 (0.0%) |
| 18 to 34 Years | 5 (100.0%) | 0 (0.0%) |
| 35 to 64 Years | 0 (0.0%) | 0 (0.0%) |
| 65 to 74 Years | 0 (0.0%) | 0 (0.0%) |
| 75 Years and over | 0 (0.0%) | 0 (0.0%) |
Disability Class: Cognitive Difficulty
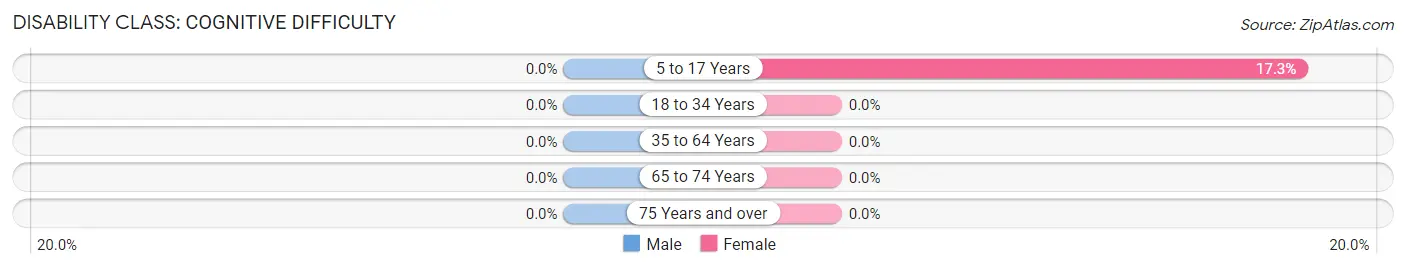
| Age Bracket | Male | Female |
| 5 to 17 Years | 0 (0.0%) | 18 (17.3%) |
| 18 to 34 Years | 0 (0.0%) | 0 (0.0%) |
| 35 to 64 Years | 0 (0.0%) | 0 (0.0%) |
| 65 to 74 Years | 0 (0.0%) | 0 (0.0%) |
| 75 Years and over | 0 (0.0%) | 0 (0.0%) |
Disability Class: Ambulatory Difficulty
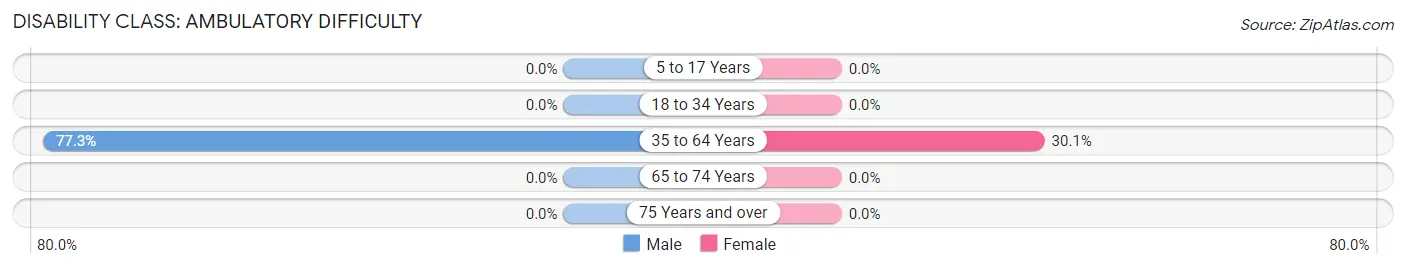
| Age Bracket | Male | Female |
| 5 to 17 Years | 0 (0.0%) | 0 (0.0%) |
| 18 to 34 Years | 0 (0.0%) | 0 (0.0%) |
| 35 to 64 Years | 34 (77.3%) | 25 (30.1%) |
| 65 to 74 Years | 0 (0.0%) | 0 (0.0%) |
| 75 Years and over | 0 (0.0%) | 0 (0.0%) |
Disability Class: Self-Care Difficulty
| Age Bracket | Male | Female |
| 5 to 17 Years | 0 (0.0%) | 0 (0.0%) |
| 18 to 34 Years | 0 (0.0%) | 0 (0.0%) |
| 35 to 64 Years | 0 (0.0%) | 0 (0.0%) |
| 65 to 74 Years | 0 (0.0%) | 0 (0.0%) |
| 75 Years and over | 0 (0.0%) | 0 (0.0%) |
Technology Access in Maury
Computing Device Access in Maury
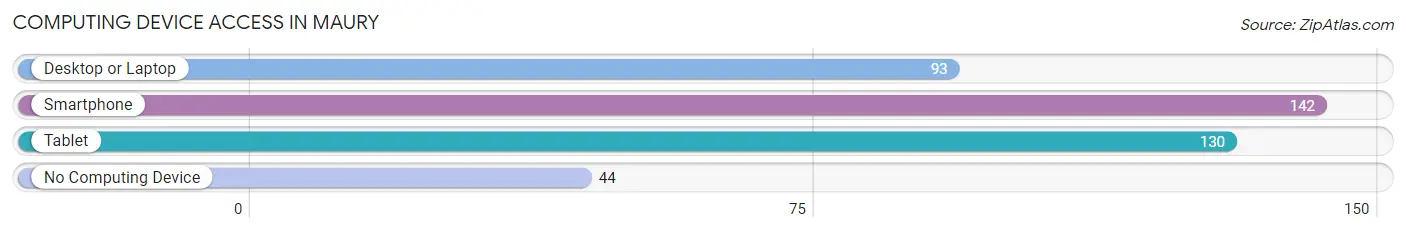
| Device Type | # Households | % Households |
| Desktop or Laptop | 93 | 50.0% |
| Smartphone | 142 | 76.3% |
| Tablet | 130 | 69.9% |
| No Computing Device | 44 | 23.7% |
| Total | 186 | 100.0% |
Internet Access in Maury
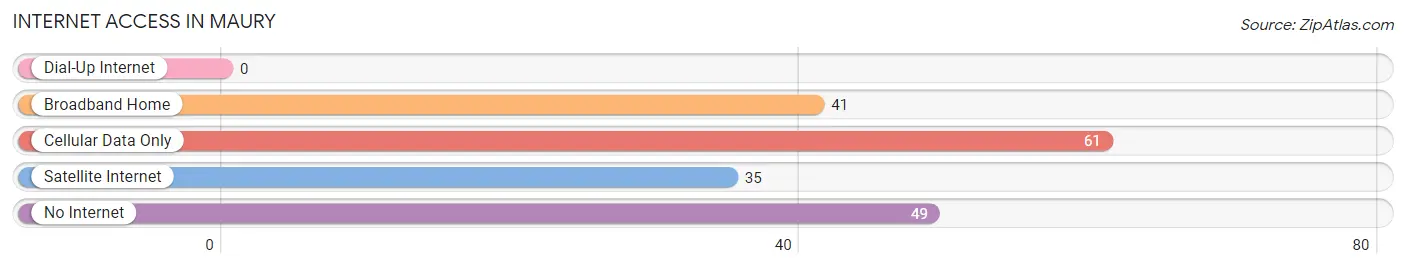
| Internet Type | # Households | % Households |
| Dial-Up Internet | 0 | 0.0% |
| Broadband Home | 41 | 22.0% |
| Cellular Data Only | 61 | 32.8% |
| Satellite Internet | 35 | 18.8% |
| No Internet | 49 | 26.3% |
| Total | 186 | 100.0% |
Maury Summary
Maury, North Carolina is a small town located in the northeastern part of the state, in Nash County. It is situated on the banks of the Tar River, and is part of the Rocky Mount metropolitan area. The town has a population of approximately 1,000 people, and is known for its rural charm and friendly atmosphere.
History
Maury was first settled in the late 1700s by a group of settlers from Virginia. The town was named after Major John Maury, a Revolutionary War hero who fought in the Battle of Guilford Courthouse. The town was officially incorporated in 1887, and the first post office was established in 1891.
In the early 1900s, Maury was a thriving agricultural community, with cotton, tobacco, and corn being the main crops. The town also had a thriving lumber industry, and several sawmills were located in the area.
Geography
Maury is located in the northeastern part of North Carolina, in Nash County. It is situated on the banks of the Tar River, and is part of the Rocky Mount metropolitan area. The town has a total area of 1.2 square miles, all of which is land.
The town is located in a rural area, and is surrounded by farmland and forests. The nearest major city is Rocky Mount, which is located about 20 miles to the south.
Economy
Maury’s economy is largely based on agriculture. The town is home to several farms, which produce a variety of crops, including cotton, tobacco, corn, and soybeans. The town also has a thriving lumber industry, and several sawmills are located in the area.
In addition to agriculture, Maury also has a small manufacturing sector. The town is home to several small businesses, including a furniture factory, a printing company, and a machine shop.
Demographics
As of the 2010 census, Maury had a population of 1,000 people. The racial makeup of the town was 79.2% White, 17.2% African American, 0.7% Native American, 0.3% Asian, and 2.6% from other races.
The median household income in Maury was $31,250, and the median family income was $37,500. The per capita income was $17,857. About 17.2% of the population was below the poverty line.
Maury is a small town with a friendly atmosphere and a strong sense of community. The town is known for its rural charm and its commitment to preserving its agricultural heritage. The town is also home to several small businesses, which provide employment opportunities for its residents.
Common Questions
What is Per Capita Income in Maury?
Per Capita income in Maury is $8,093.
What is the Median Household income in Maury?
Median Household Income in Maury is $19,797.
What is Inequality or Gini Index in Maury?
Inequality or Gini Index in Maury is 0.47.
What is the Total Population of Maury?
Total Population of Maury is 1,055.
What is the Total Male Population of Maury?
Total Male Population of Maury is 795.
What is the Total Female Population of Maury?
Total Female Population of Maury is 260.
What is the Ratio of Males per 100 Females in Maury?
There are 305.77 Males per 100 Females in Maury.
What is the Ratio of Females per 100 Males in Maury?
There are 32.70 Females per 100 Males in Maury.
What is the Median Population Age in Maury?
Median Population Age in Maury is 39.9 Years.
What is the Average Family Size in Maury
Average Family Size in Maury is 3.0 People.
What is the Average Household Size in Maury
Average Household Size in Maury is 2.0 People.
How Large is the Labor Force in Maury?
There are 111 People in the Labor Forcein in Maury.
What is the Percentage of People in the Labor Force in Maury?
12.4% of People are in the Labor Force in Maury.
What is the Unemployment Rate in Maury?
Unemployment Rate in Maury is 13.5%.