Halltown, MO Map & Demographics
Halltown Map
Halltown Overview
$6,772
PER CAPITA INCOME
$12,708
AVG HOUSEHOLD INCOME
0.46
INEQUALITY / GINI INDEX
46
TOTAL POPULATION
22
MALE POPULATION
24
FEMALE POPULATION
91.67
MALES / 100 FEMALES
109.09
FEMALES / 100 MALES
42.7
MEDIAN AGE
2.4
AVG FAMILY SIZE
2.4
AVG HOUSEHOLD SIZE
12
LABOR FORCE [ PEOPLE ]
27.9%
PERCENT IN LABOR FORCE
33.3%
UNEMPLOYMENT RATE
Halltown Zip Codes
Halltown Area Codes
Income in Halltown
Income Overview in Halltown
| Characteristic | Number | Measure |
| Per Capita Income | 46 | $6,772 |
| Median Family Income | 18 | $0 |
| Mean Family Income | 18 | $9,122 |
| Median Household Income | 19 | $12,708 |
| Mean Household Income | 19 | $11,258 |
| Income Deficit | 18 | $0 |
| Wage / Income Gap (%) | 46 | 0.00% |
| Wage / Income Gap ($) | 46 | 100.00¢ per $1 |
| Gini / Inequality Index | 46 | 0.46 |
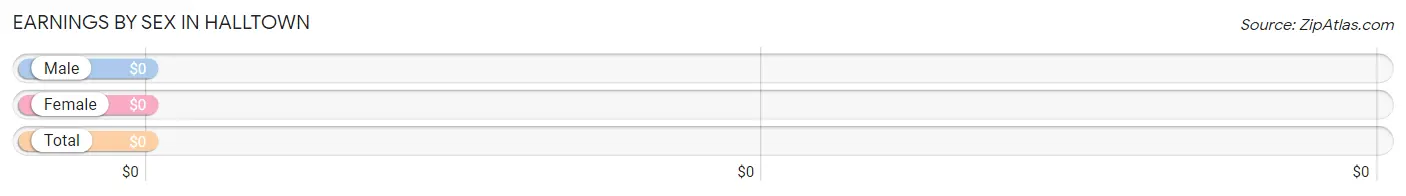
Earnings by Sex in Halltown
| Sex | Number | Average Earnings |
| Male | 0 (0.0%) | $0 |
| Female | 8 (100.0%) | $0 |
| Total | 8 (100.0%) | $0 |
Earnings by Sex by Income Bracket in Halltown
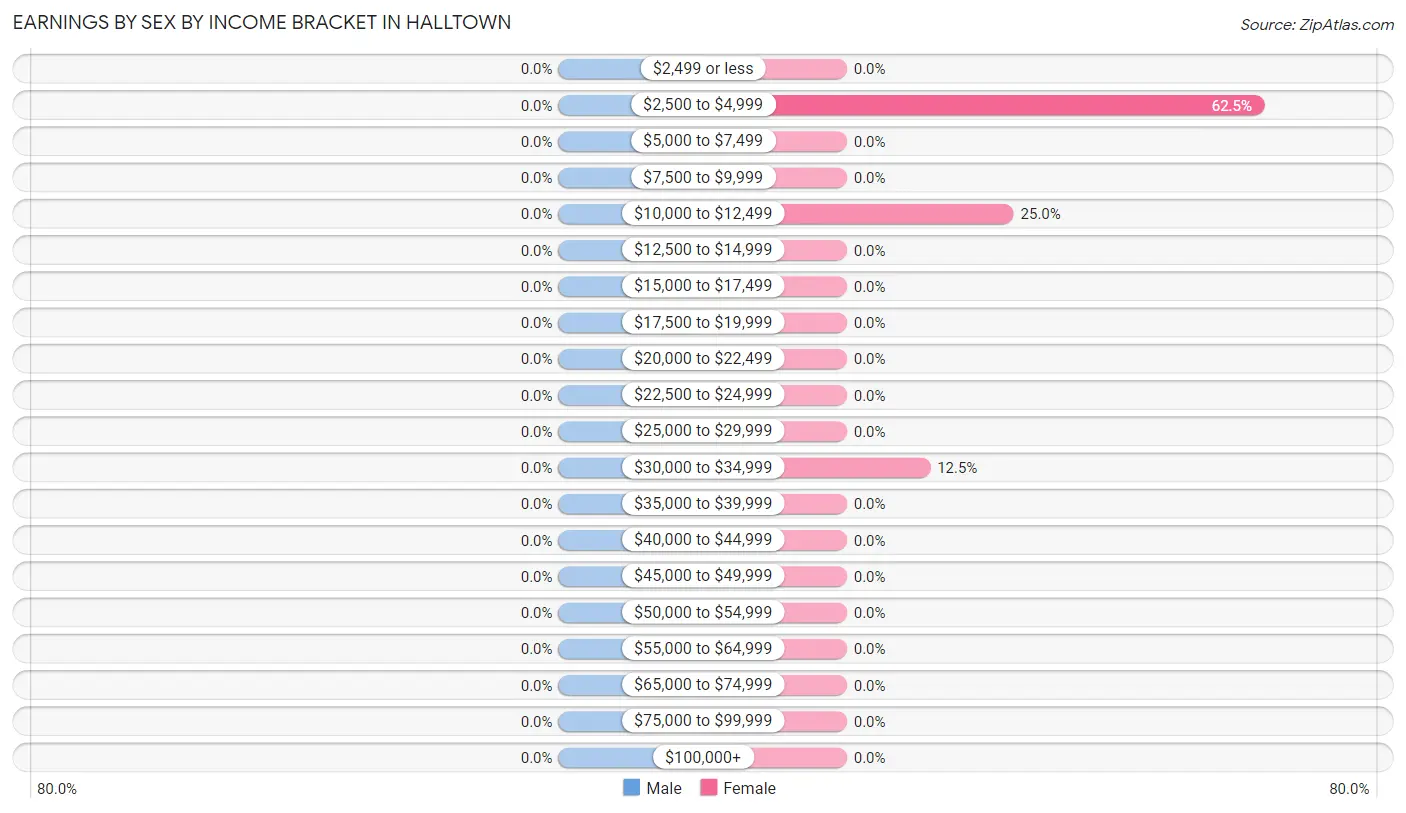
| Income | Male | Female |
| $2,499 or less | 0 (0.0%) | 0 (0.0%) |
| $2,500 to $4,999 | 0 (0.0%) | 5 (62.5%) |
| $5,000 to $7,499 | 0 (0.0%) | 0 (0.0%) |
| $7,500 to $9,999 | 0 (0.0%) | 0 (0.0%) |
| $10,000 to $12,499 | 0 (0.0%) | 2 (25.0%) |
| $12,500 to $14,999 | 0 (0.0%) | 0 (0.0%) |
| $15,000 to $17,499 | 0 (0.0%) | 0 (0.0%) |
| $17,500 to $19,999 | 0 (0.0%) | 0 (0.0%) |
| $20,000 to $22,499 | 0 (0.0%) | 0 (0.0%) |
| $22,500 to $24,999 | 0 (0.0%) | 0 (0.0%) |
| $25,000 to $29,999 | 0 (0.0%) | 0 (0.0%) |
| $30,000 to $34,999 | 0 (0.0%) | 1 (12.5%) |
| $35,000 to $39,999 | 0 (0.0%) | 0 (0.0%) |
| $40,000 to $44,999 | 0 (0.0%) | 0 (0.0%) |
| $45,000 to $49,999 | 0 (0.0%) | 0 (0.0%) |
| $50,000 to $54,999 | 0 (0.0%) | 0 (0.0%) |
| $55,000 to $64,999 | 0 (0.0%) | 0 (0.0%) |
| $65,000 to $74,999 | 0 (0.0%) | 0 (0.0%) |
| $75,000 to $99,999 | 0 (0.0%) | 0 (0.0%) |
| $100,000+ | 0 (0.0%) | 0 (0.0%) |
| Total | 0 (0.0%) | 8 (100.0%) |
Earnings by Sex by Educational Attainment in Halltown
| Educational Attainment | Male Income | Female Income |
| Less than High School | - | - |
| High School Diploma | - | - |
| College or Associate's Degree | - | - |
| Bachelor's Degree | - | - |
| Graduate Degree | - | - |
| Total | - | - |
Family Income in Halltown
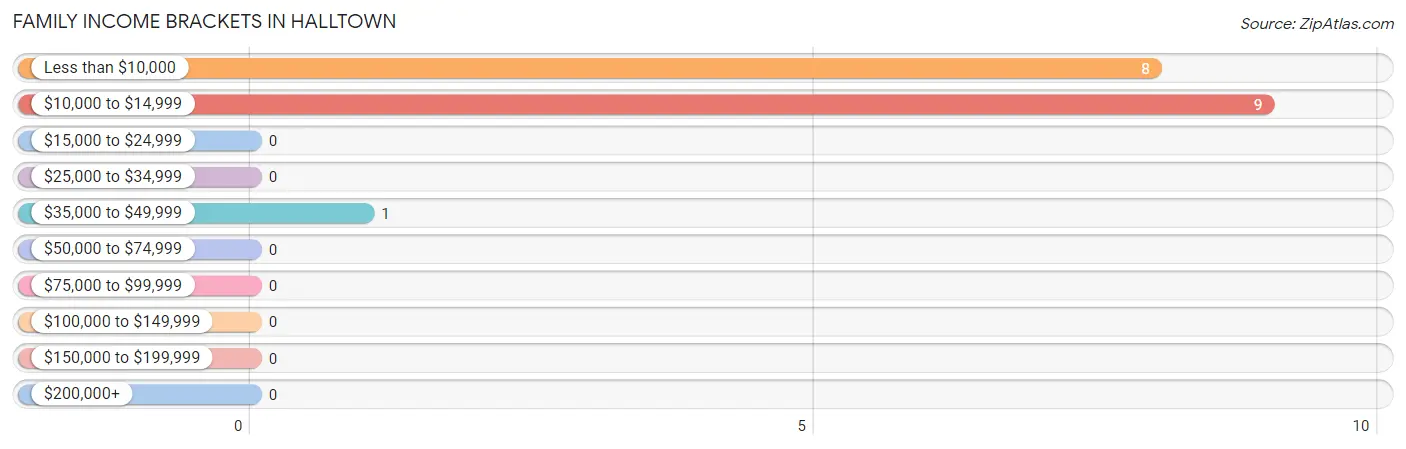
Family Income Brackets in Halltown
According to the Halltown family income data, there are 9 families falling into the $10,000 to $14,999 income range, which is the most common income bracket and makes up 50.0% of all families.
| Income Bracket | # Families | % Families |
| Less than $10,000 | 8 | 44.4% |
| $10,000 to $14,999 | 9 | 50.0% |
| $15,000 to $24,999 | 0 | 0.0% |
| $25,000 to $34,999 | 0 | 0.0% |
| $35,000 to $49,999 | 1 | 5.6% |
| $50,000 to $74,999 | 0 | 0.0% |
| $75,000 to $99,999 | 0 | 0.0% |
| $100,000 to $149,999 | 0 | 0.0% |
| $150,000 to $199,999 | 0 | 0.0% |
| $200,000+ | 0 | 0.0% |
Family Income by Famaliy Size in Halltown
| Income Bracket | # Families | Median Income |
| 2-Person Families | 15 (83.3%) | $0 |
| 3-Person Families | 3 (16.7%) | $0 |
| 4-Person Families | 0 (0.0%) | $0 |
| 5-Person Families | 0 (0.0%) | $0 |
| 6-Person Families | 0 (0.0%) | $0 |
| 7+ Person Families | 0 (0.0%) | $0 |
| Total | 18 (100.0%) | $0 |
Family Income by Number of Earners in Halltown
| Number of Earners | # Families | Median Income |
| No Earners | 12 (66.7%) | $0 |
| 1 Earner | 6 (33.3%) | $0 |
| 2 Earners | 0 (0.0%) | $0 |
| 3+ Earners | 0 (0.0%) | $0 |
| Total | 18 (100.0%) | $0 |
Household Income in Halltown
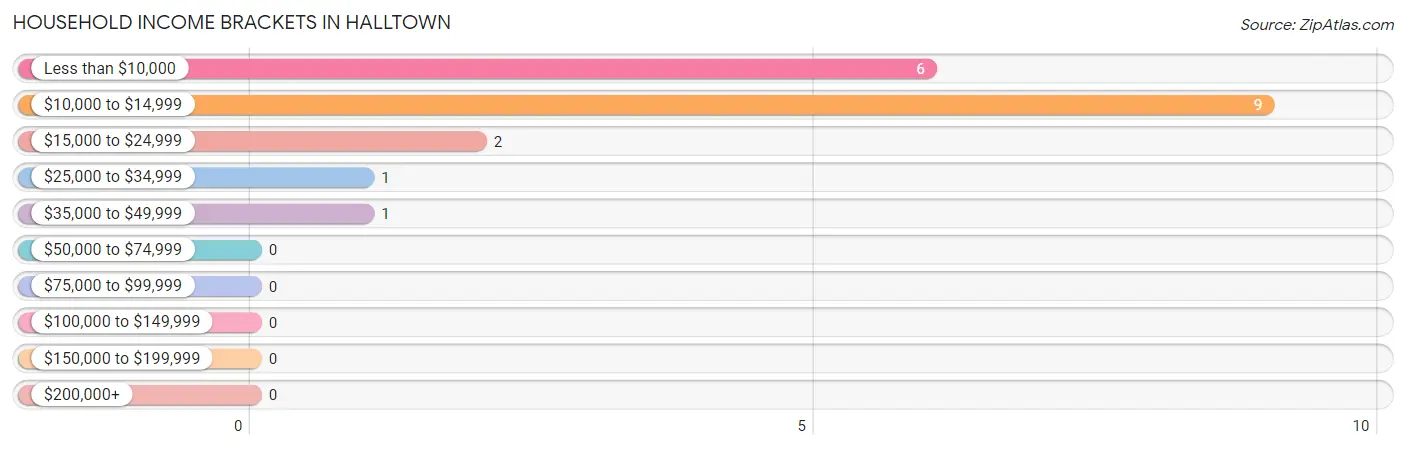
Household Income Brackets in Halltown
With 9 households falling in the category, the $10,000 to $14,999 income range is the most frequent in Halltown, accounting for 47.4% of all households.
| Income Bracket | # Households | % Households |
| Less than $10,000 | 6 | 31.6% |
| $10,000 to $14,999 | 9 | 47.4% |
| $15,000 to $24,999 | 2 | 10.5% |
| $25,000 to $34,999 | 1 | 5.3% |
| $35,000 to $49,999 | 1 | 5.3% |
| $50,000 to $74,999 | 0 | 0.0% |
| $75,000 to $99,999 | 0 | 0.0% |
| $100,000 to $149,999 | 0 | 0.0% |
| $150,000 to $199,999 | 0 | 0.0% |
| $200,000+ | 0 | 0.0% |
Household Income by Householder Age in Halltown
The median household income in Halltown is $12,708, with the highest median household income of $13,750 found in the 45 to 64 years age bracket for the primary householder. A total of 12 households (63.2%) fall into this category.
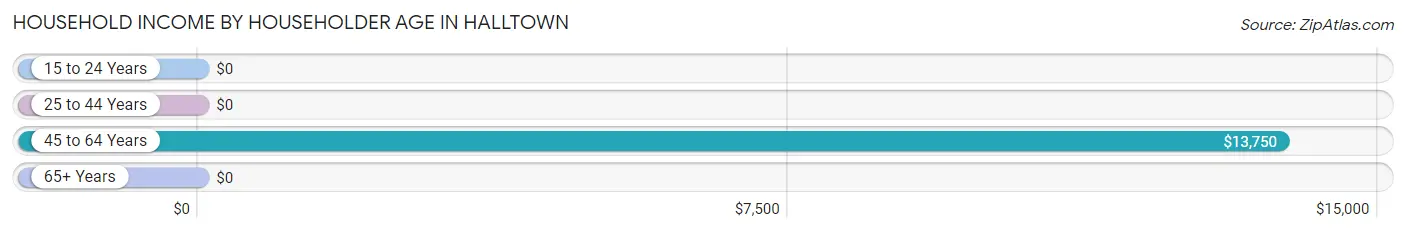
| Income Bracket | # Households | Median Income |
| 15 to 24 Years | 0 (0.0%) | $0 |
| 25 to 44 Years | 6 (31.6%) | $0 |
| 45 to 64 Years | 12 (63.2%) | $13,750 |
| 65+ Years | 1 (5.3%) | $0 |
| Total | 19 (100.0%) | $12,708 |
Poverty in Halltown
Income Below Poverty by Sex and Age in Halltown
With 77.3% poverty level for males and 91.7% for females among the residents of Halltown, 15 year old males and 16 and 17 year old females are the most vulnerable to poverty, with 3 males (100.0%) and 5 females (100.0%) in their respective age groups living below the poverty level.
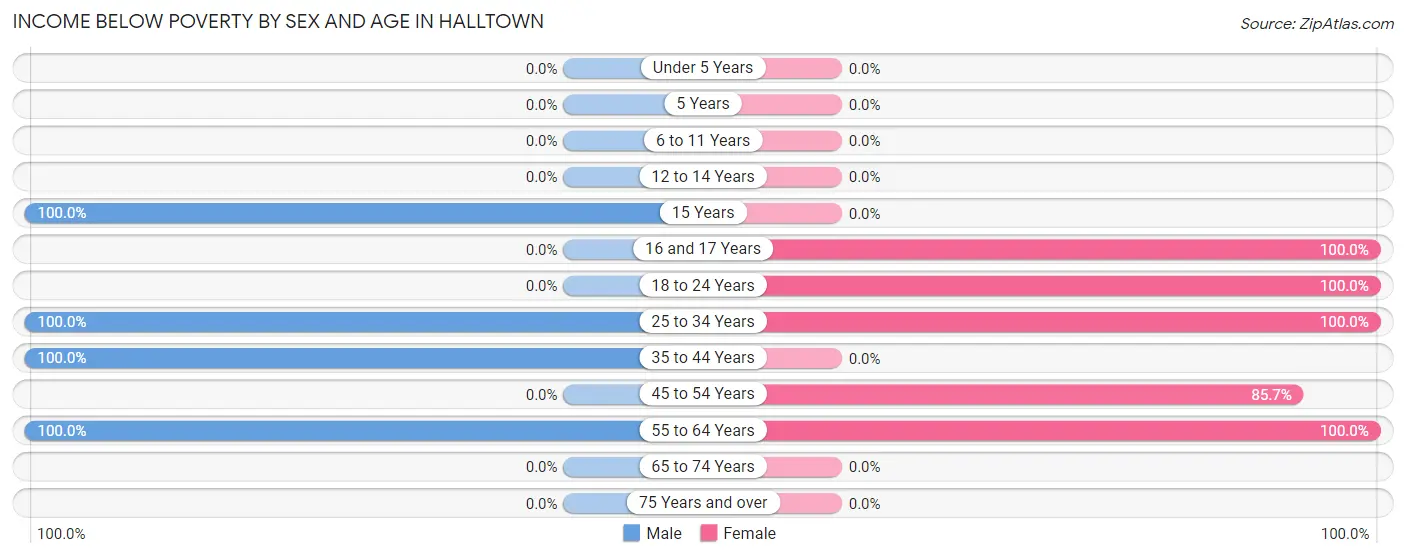
| Age Bracket | Male | Female |
| Under 5 Years | 0 (0.0%) | 0 (0.0%) |
| 5 Years | 0 (0.0%) | 0 (0.0%) |
| 6 to 11 Years | 0 (0.0%) | 0 (0.0%) |
| 12 to 14 Years | 0 (0.0%) | 0 (0.0%) |
| 15 Years | 3 (100.0%) | 0 (0.0%) |
| 16 and 17 Years | 0 (0.0%) | 5 (100.0%) |
| 18 to 24 Years | 0 (0.0%) | 4 (100.0%) |
| 25 to 34 Years | 2 (100.0%) | 5 (100.0%) |
| 35 to 44 Years | 6 (100.0%) | 0 (0.0%) |
| 45 to 54 Years | 0 (0.0%) | 6 (85.7%) |
| 55 to 64 Years | 6 (100.0%) | 2 (100.0%) |
| 65 to 74 Years | 0 (0.0%) | 0 (0.0%) |
| 75 Years and over | 0 (0.0%) | 0 (0.0%) |
| Total | 17 (77.3%) | 22 (91.7%) |
Income Above Poverty by Sex and Age in Halltown
According to the poverty statistics in Halltown, males aged 75 years and over and females aged 75 years and over are the age groups that are most secure financially, with 100.0% of males and 100.0% of females in these age groups living above the poverty line.
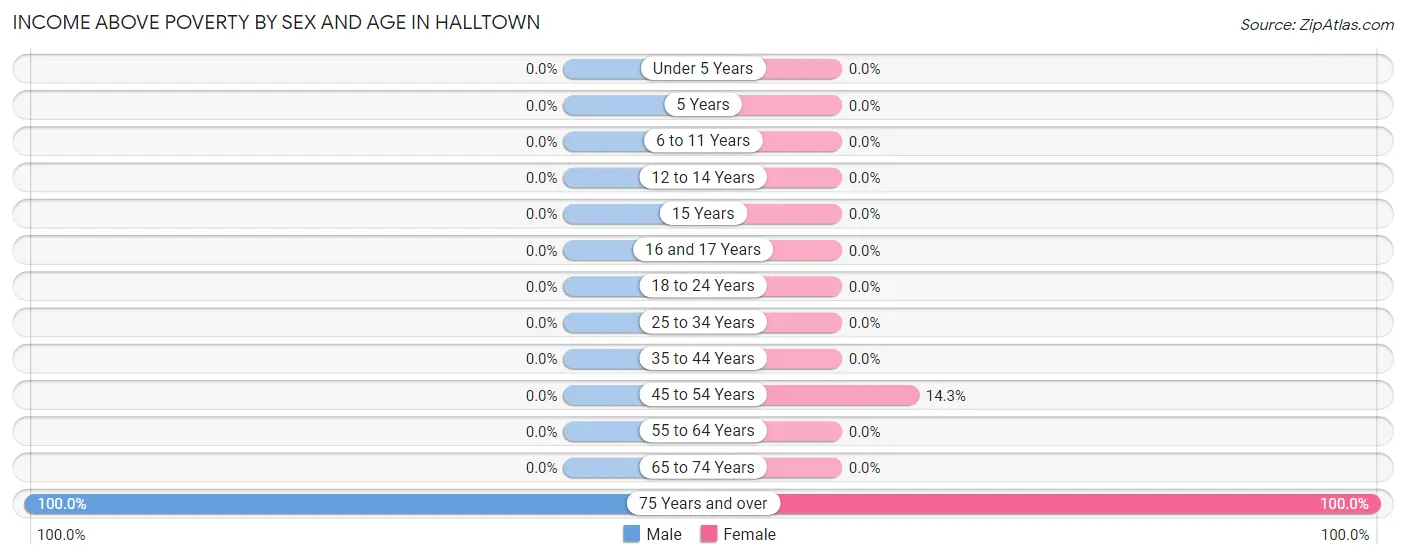
| Age Bracket | Male | Female |
| Under 5 Years | 0 (0.0%) | 0 (0.0%) |
| 5 Years | 0 (0.0%) | 0 (0.0%) |
| 6 to 11 Years | 0 (0.0%) | 0 (0.0%) |
| 12 to 14 Years | 0 (0.0%) | 0 (0.0%) |
| 15 Years | 0 (0.0%) | 0 (0.0%) |
| 16 and 17 Years | 0 (0.0%) | 0 (0.0%) |
| 18 to 24 Years | 0 (0.0%) | 0 (0.0%) |
| 25 to 34 Years | 0 (0.0%) | 0 (0.0%) |
| 35 to 44 Years | 0 (0.0%) | 0 (0.0%) |
| 45 to 54 Years | 0 (0.0%) | 1 (14.3%) |
| 55 to 64 Years | 0 (0.0%) | 0 (0.0%) |
| 65 to 74 Years | 0 (0.0%) | 0 (0.0%) |
| 75 Years and over | 5 (100.0%) | 1 (100.0%) |
| Total | 5 (22.7%) | 2 (8.3%) |
Income Below Poverty Among Married-Couple Families in Halltown
The poverty statistics for married-couple families in Halltown show that 66.7% or 2 of the total 3 families live below the poverty line. Families with no children have the highest poverty rate of 66.7%, comprising of 2 families. On the other hand, families with no children have the lowest poverty rate of 66.7%, which includes 2 families.
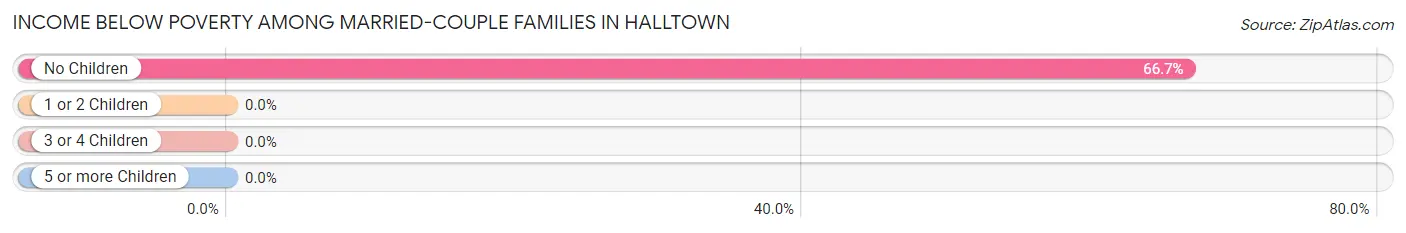
| Children | Above Poverty | Below Poverty |
| No Children | 1 (33.3%) | 2 (66.7%) |
| 1 or 2 Children | 0 (0.0%) | 0 (0.0%) |
| 3 or 4 Children | 0 (0.0%) | 0 (0.0%) |
| 5 or more Children | 0 (0.0%) | 0 (0.0%) |
| Total | 1 (33.3%) | 2 (66.7%) |
Income Below Poverty Among Single-Parent Households in Halltown
According to the poverty data in Halltown, 100.0% or 9 single-father households and 100.0% or 6 single-mother households are living below the poverty line. Among single-father households, those with 1 or 2 children have the highest poverty rate, with 9 households (100.0%) experiencing poverty. Likewise, among single-mother households, those with no children have the highest poverty rate, with 6 households (100.0%) falling below the poverty line.
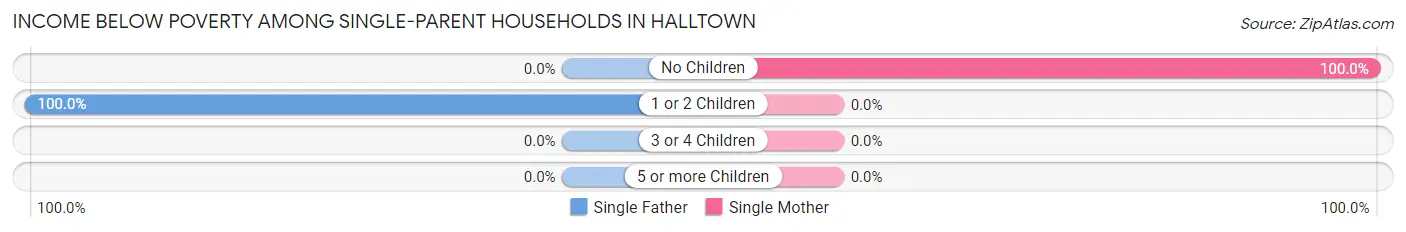
| Children | Single Father | Single Mother |
| No Children | 0 (0.0%) | 6 (100.0%) |
| 1 or 2 Children | 9 (100.0%) | 0 (0.0%) |
| 3 or 4 Children | 0 (0.0%) | 0 (0.0%) |
| 5 or more Children | 0 (0.0%) | 0 (0.0%) |
| Total | 9 (100.0%) | 6 (100.0%) |
Income Below Poverty Among Married-Couple vs Single-Parent Households in Halltown
The poverty data for Halltown shows that 2 of the married-couple family households (66.7%) and 15 of the single-parent households (100.0%) are living below the poverty level. Within the married-couple family households, those with no children have the highest poverty rate, with 2 households (66.7%) falling below the poverty line. Among the single-parent households, those with no children have the highest poverty rate, with 6 household (100.0%) living below poverty.
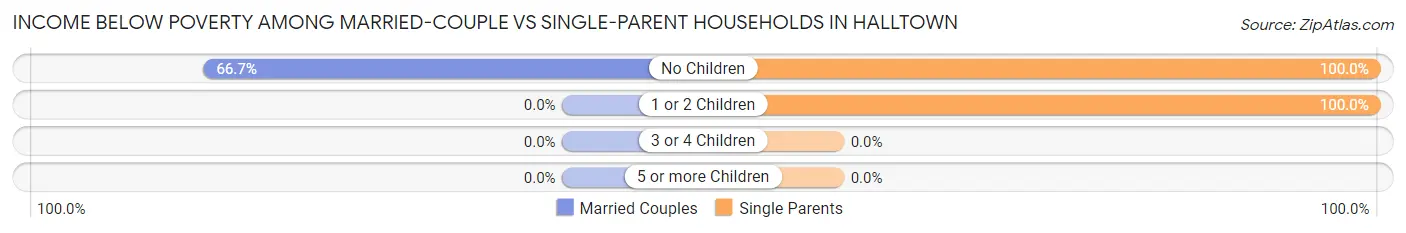
| Children | Married-Couple Families | Single-Parent Households |
| No Children | 2 (66.7%) | 6 (100.0%) |
| 1 or 2 Children | 0 (0.0%) | 9 (100.0%) |
| 3 or 4 Children | 0 (0.0%) | 0 (0.0%) |
| 5 or more Children | 0 (0.0%) | 0 (0.0%) |
| Total | 2 (66.7%) | 15 (100.0%) |
Race in Halltown
The most populous races in Halltown are White / Caucasian (38 | 82.6%), and Two or more Races (8 | 17.4%).
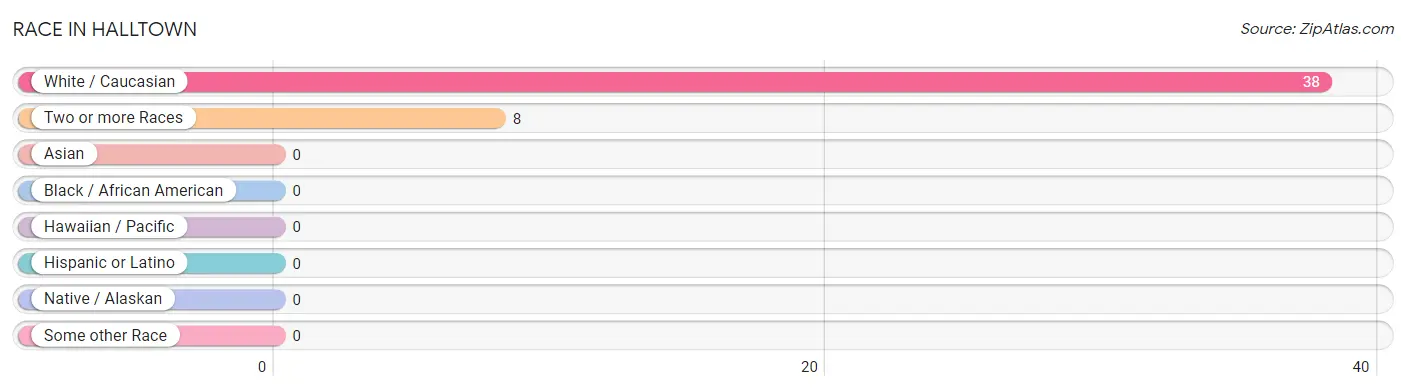
| Race | # Population | % Population |
| Asian | 0 | 0.0% |
| Black / African American | 0 | 0.0% |
| Hawaiian / Pacific | 0 | 0.0% |
| Hispanic or Latino | 0 | 0.0% |
| Native / Alaskan | 0 | 0.0% |
| White / Caucasian | 38 | 82.6% |
| Two or more Races | 8 | 17.4% |
| Some other Race | 0 | 0.0% |
| Total | 46 | 100.0% |
Ancestry in Halltown
The most populous ancestries reported in Halltown are Irish (17 | 37.0%), European (10 | 21.7%), Swedish (9 | 19.6%), Cherokee (7 | 15.2%), and Cheyenne (4 | 8.7%), together accounting for 102.2% of all Halltown residents.
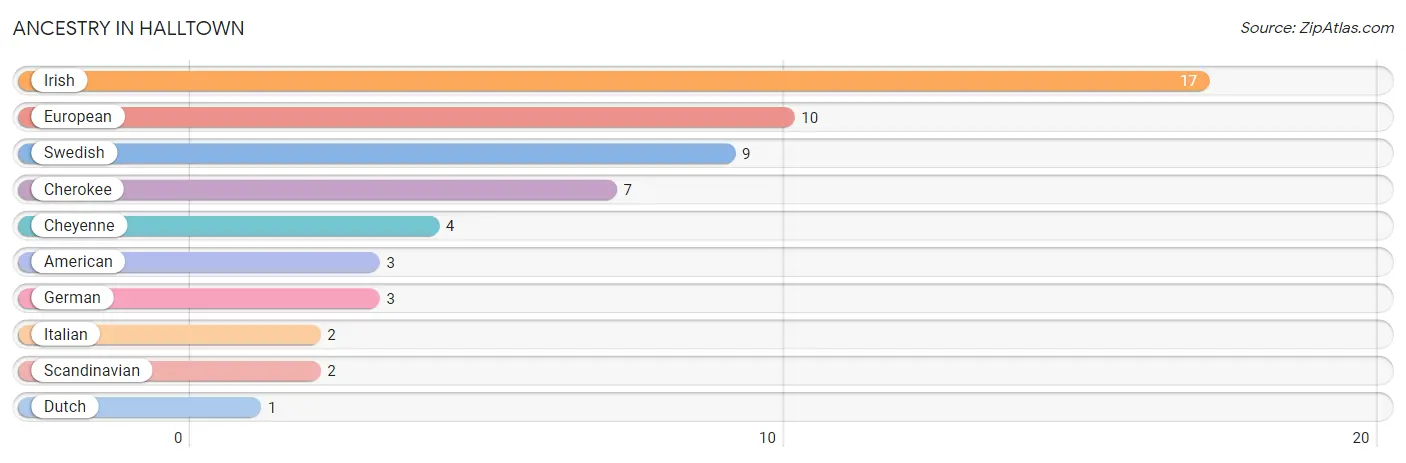
| Ancestry | # Population | % Population |
| American | 3 | 6.5% |
| Cherokee | 7 | 15.2% |
| Cheyenne | 4 | 8.7% |
| Dutch | 1 | 2.2% |
| European | 10 | 21.7% |
| German | 3 | 6.5% |
| Irish | 17 | 37.0% |
| Italian | 2 | 4.3% |
| Scandinavian | 2 | 4.3% |
| Swedish | 9 | 19.6% | View All 10 Rows |
Immigrants in Halltown

| Immigration Origin | # Population | % Population | View All 0 Rows |
Sex and Age in Halltown
Sex and Age in Halltown
The most populous age groups in Halltown are 40 to 44 Years (6 | 27.3%) for men and 15 to 19 Years (5 | 20.8%) for women.
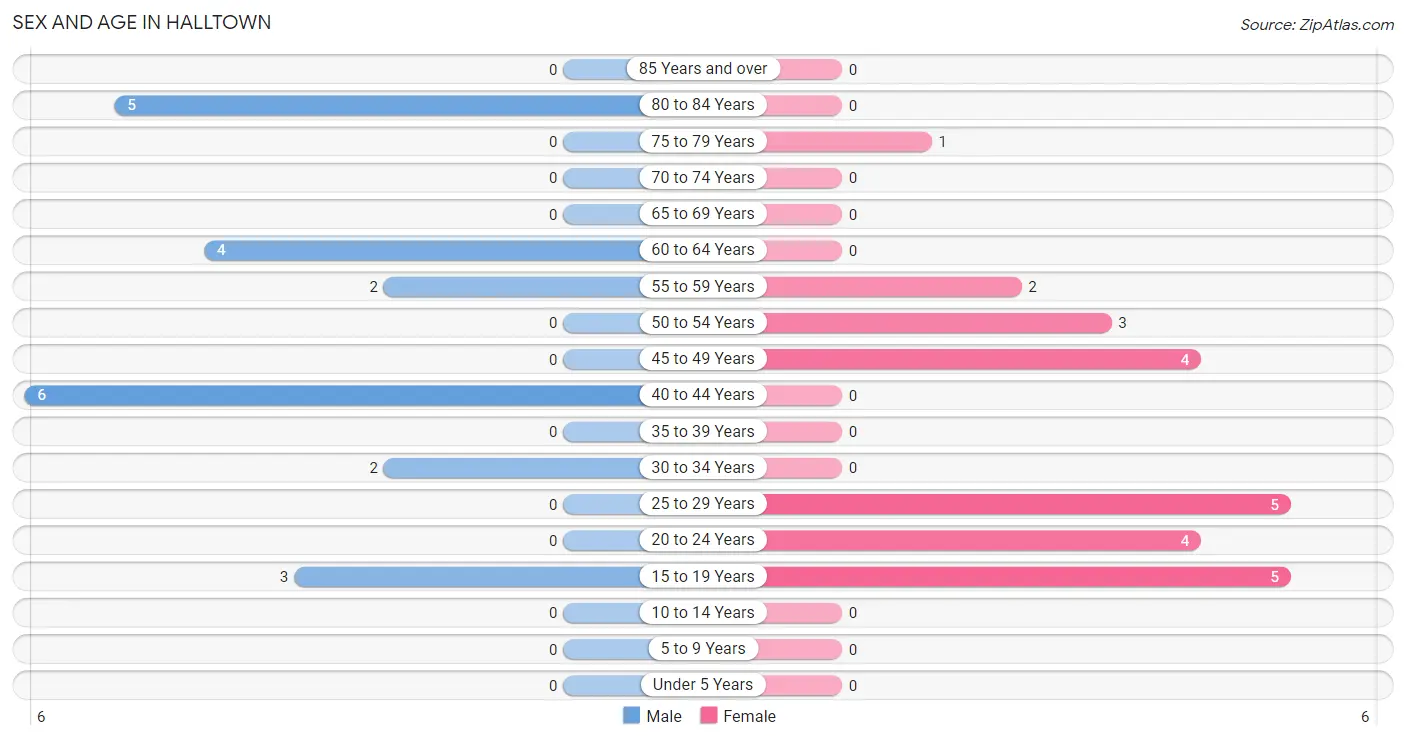
| Age Bracket | Male | Female |
| Under 5 Years | 0 (0.0%) | 0 (0.0%) |
| 5 to 9 Years | 0 (0.0%) | 0 (0.0%) |
| 10 to 14 Years | 0 (0.0%) | 0 (0.0%) |
| 15 to 19 Years | 3 (13.6%) | 5 (20.8%) |
| 20 to 24 Years | 0 (0.0%) | 4 (16.7%) |
| 25 to 29 Years | 0 (0.0%) | 5 (20.8%) |
| 30 to 34 Years | 2 (9.1%) | 0 (0.0%) |
| 35 to 39 Years | 0 (0.0%) | 0 (0.0%) |
| 40 to 44 Years | 6 (27.3%) | 0 (0.0%) |
| 45 to 49 Years | 0 (0.0%) | 4 (16.7%) |
| 50 to 54 Years | 0 (0.0%) | 3 (12.5%) |
| 55 to 59 Years | 2 (9.1%) | 2 (8.3%) |
| 60 to 64 Years | 4 (18.2%) | 0 (0.0%) |
| 65 to 69 Years | 0 (0.0%) | 0 (0.0%) |
| 70 to 74 Years | 0 (0.0%) | 0 (0.0%) |
| 75 to 79 Years | 0 (0.0%) | 1 (4.2%) |
| 80 to 84 Years | 5 (22.7%) | 0 (0.0%) |
| 85 Years and over | 0 (0.0%) | 0 (0.0%) |
| Total | 22 (100.0%) | 24 (100.0%) |
Families and Households in Halltown
Median Family Size in Halltown
The median family size in Halltown is 2.39 persons per family, with married-couple families (3 | 16.7%) accounting for the largest median family size of 3 persons per family. On the other hand, single female/mother families (6 | 33.3%) represent the smallest median family size with 2.17 persons per family.
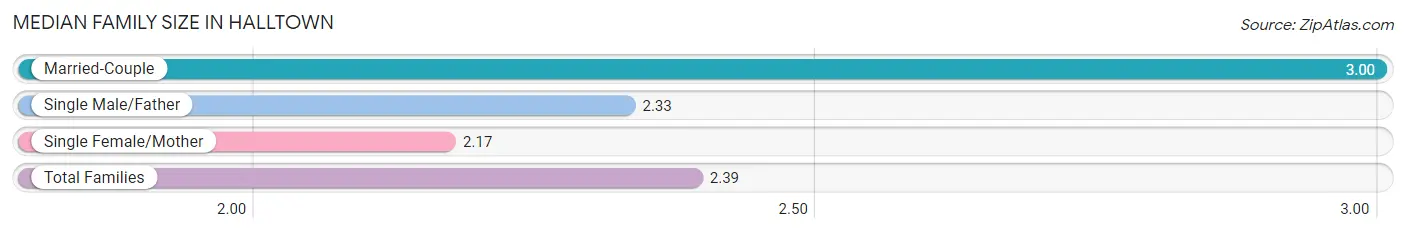
| Family Type | # Families | Family Size |
| Married-Couple | 3 (16.7%) | 3.00 |
| Single Male/Father | 9 (50.0%) | 2.33 |
| Single Female/Mother | 6 (33.3%) | 2.17 |
| Total Families | 18 (100.0%) | 2.39 |
Median Household Size in Halltown
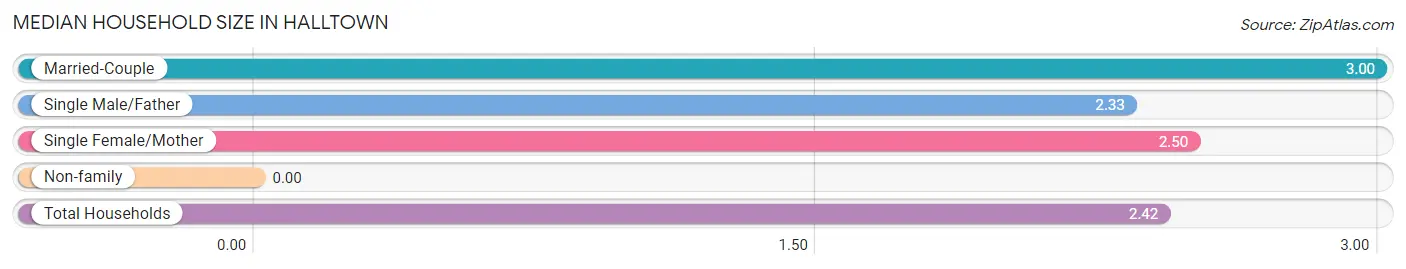
| Household Type | # Households | Household Size |
| Married-Couple | 3 (15.8%) | 3.00 |
| Single Male/Father | 9 (47.4%) | 2.33 |
| Single Female/Mother | 6 (31.6%) | 2.50 |
| Non-family | 1 (5.3%) | - |
| Total Households | 19 (100.0%) | 2.42 |
Household Size by Marriage Status in Halltown
Out of a total of 19 households in Halltown, 18 (94.7%) are family households, while 1 (5.3%) are nonfamily households. The most numerous type of family households are 2-person households, comprising 13, and the most common type of nonfamily households are 1-person households, comprising 1.
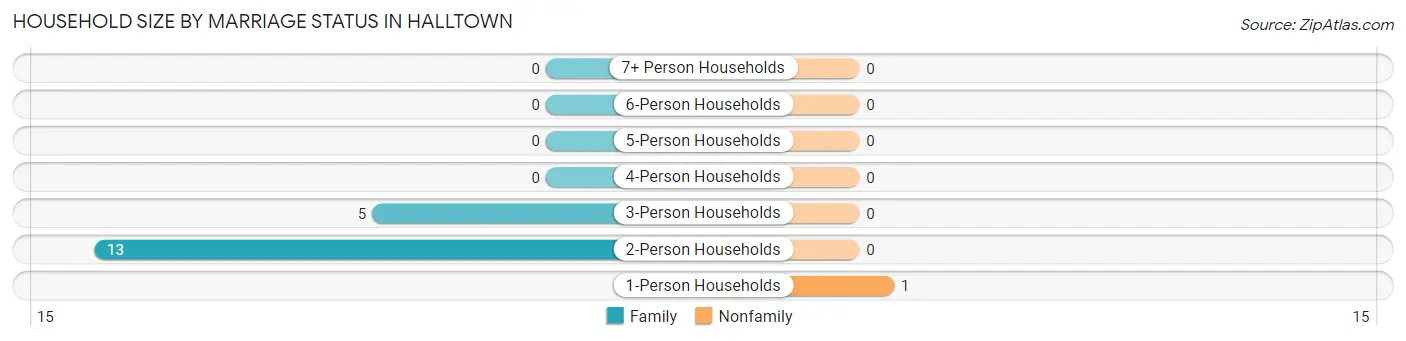
| Household Size | Family Households | Nonfamily Households |
| 1-Person Households | - | 1 (5.3%) |
| 2-Person Households | 13 (68.4%) | 0 (0.0%) |
| 3-Person Households | 5 (26.3%) | 0 (0.0%) |
| 4-Person Households | 0 (0.0%) | 0 (0.0%) |
| 5-Person Households | 0 (0.0%) | 0 (0.0%) |
| 6-Person Households | 0 (0.0%) | 0 (0.0%) |
| 7+ Person Households | 0 (0.0%) | 0 (0.0%) |
| Total | 18 (94.7%) | 1 (5.3%) |
Female Fertility in Halltown
Fertility by Age in Halltown
| Age Bracket | Women with Births | Births / 1,000 Women |
| 15 to 19 years | 0 (0.0%) | 0.0 |
| 20 to 34 years | 0 (0.0%) | 0.0 |
| 35 to 50 years | 0 (0.0%) | 0.0 |
| Total | 0 (0.0%) | 0.0 |
Fertility by Age by Marriage Status in Halltown
| Age Bracket | Married | Unmarried |
| 15 to 19 years | 0 (0.0%) | 0 (0.0%) |
| 20 to 34 years | 0 (0.0%) | 0 (0.0%) |
| 35 to 50 years | 0 (0.0%) | 0 (0.0%) |
| Total | 0 (0.0%) | 0 (0.0%) |
Fertility by Education in Halltown
| Educational Attainment | Women with Births | Births / 1,000 Women |
| Less than High School | 0 (0.0%) | 0.0 |
| High School Diploma | 0 (0.0%) | 0.0 |
| College or Associate's Degree | 0 (0.0%) | 0.0 |
| Bachelor's Degree | 0 (0.0%) | 0.0 |
| Graduate Degree | 0 (0.0%) | 0.0 |
| Total | 0 (0.0%) | 0.0 |
Fertility by Education by Marriage Status in Halltown
| Educational Attainment | Married | Unmarried |
| Less than High School | 0 (0.0%) | 0 (0.0%) |
| High School Diploma | 0 (0.0%) | 0 (0.0%) |
| College or Associate's Degree | 0 (0.0%) | 0 (0.0%) |
| Bachelor's Degree | 0 (0.0%) | 0 (0.0%) |
| Graduate Degree | 0 (0.0%) | 0 (0.0%) |
| Total | 0 (0.0%) | 0 (0.0%) |
Employment Characteristics in Halltown
Employment by Class of Employer in Halltown
Among the 8 employed individuals in Halltown, private company employees (6 | 75.0%), and not-for-profit organizations (2 | 25.0%) make up the most common classes of employment.
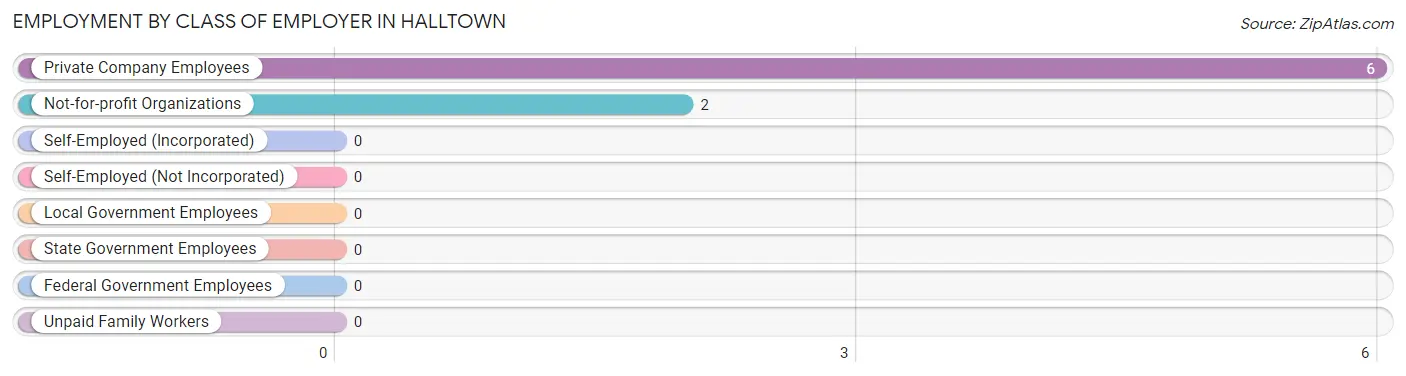
| Employer Class | # Employees | % Employees |
| Private Company Employees | 6 | 75.0% |
| Self-Employed (Incorporated) | 0 | 0.0% |
| Self-Employed (Not Incorporated) | 0 | 0.0% |
| Not-for-profit Organizations | 2 | 25.0% |
| Local Government Employees | 0 | 0.0% |
| State Government Employees | 0 | 0.0% |
| Federal Government Employees | 0 | 0.0% |
| Unpaid Family Workers | 0 | 0.0% |
| Total | 8 | 100.0% |
Employment Status by Age in Halltown
According to the labor force statistics for Halltown, out of the total population over 16 years of age (43), 27.9% or 12 individuals are in the labor force, with 33.3% or 4 of them unemployed. The age group with the highest labor force participation rate is 20 to 24 years, with 100.0% or 4 individuals in the labor force. Within the labor force, the 20 to 24 years age range has the highest percentage of unemployed individuals, with 100.0% or 4 of them being unemployed.
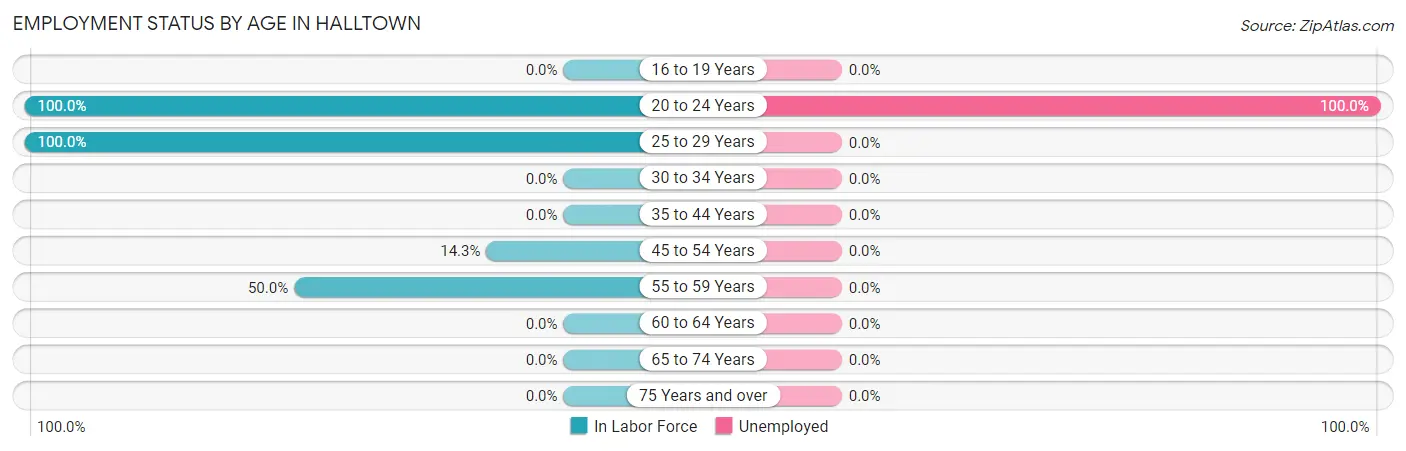
| Age Bracket | In Labor Force | Unemployed |
| 16 to 19 Years | 0 (0.0%) | 0 (0.0%) |
| 20 to 24 Years | 4 (100.0%) | 4 (100.0%) |
| 25 to 29 Years | 5 (100.0%) | 0 (0.0%) |
| 30 to 34 Years | 0 (0.0%) | 0 (0.0%) |
| 35 to 44 Years | 0 (0.0%) | 0 (0.0%) |
| 45 to 54 Years | 1 (14.3%) | 0 (0.0%) |
| 55 to 59 Years | 2 (50.0%) | 0 (0.0%) |
| 60 to 64 Years | 0 (0.0%) | 0 (0.0%) |
| 65 to 74 Years | 0 (0.0%) | 0 (0.0%) |
| 75 Years and over | 0 (0.0%) | 0 (0.0%) |
| Total | 12 (27.9%) | 4 (33.3%) |
Employment Status by Educational Attainment in Halltown
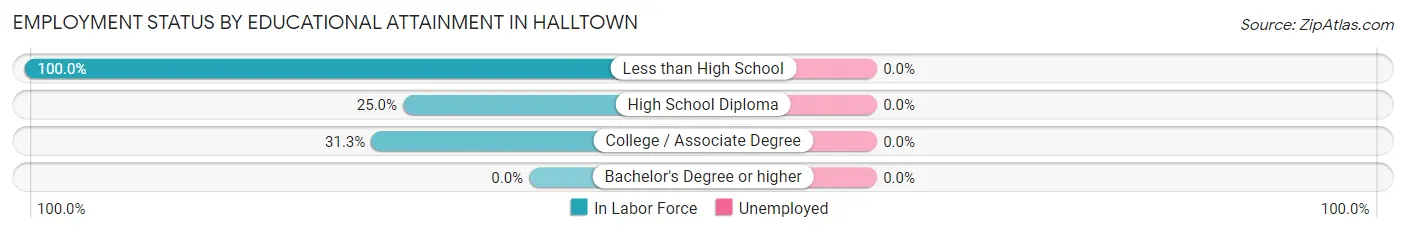
| Educational Attainment | In Labor Force | Unemployed |
| Less than High School | 1 (100.0%) | 0 (0.0%) |
| High School Diploma | 2 (25.0%) | 0 (0.0%) |
| College / Associate Degree | 5 (31.3%) | 0 (0.0%) |
| Bachelor's Degree or higher | 0 (0.0%) | 0 (0.0%) |
| Total | 8 (28.6%) | 0 (0.0%) |
Employment Occupations by Sex in Halltown
Management, Business, Science and Arts Occupations
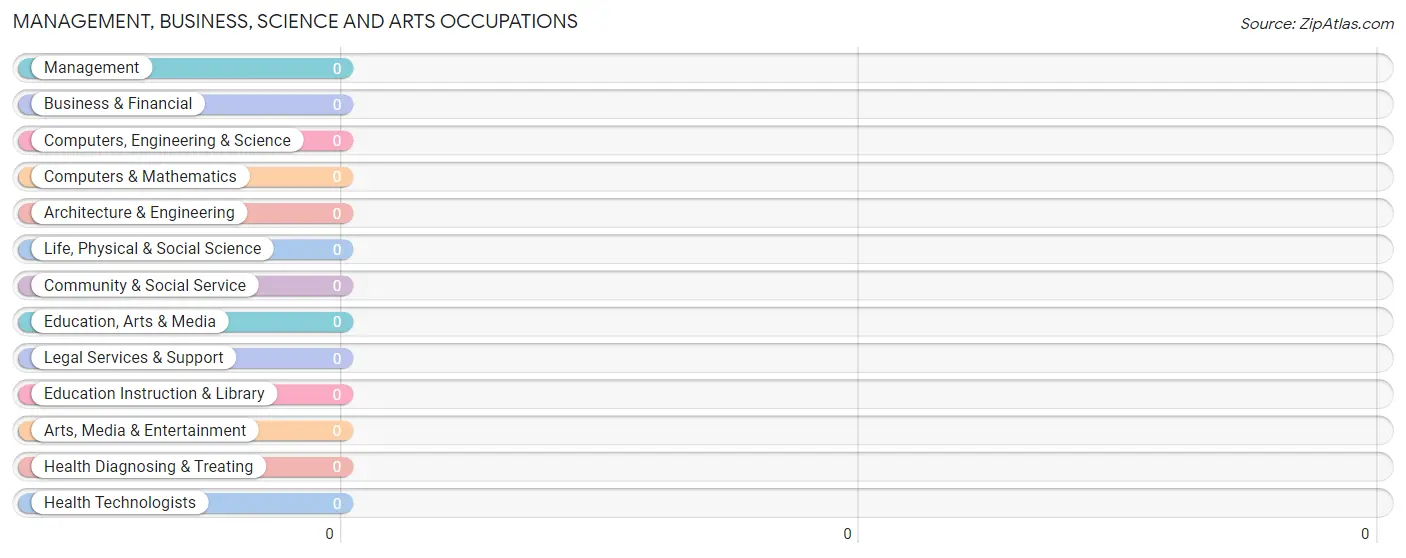
Management, Business, Science and Arts Occupations by Sex
| Occupation | Male | Female |
| Management | 0 (0.0%) | 0 (0.0%) |
| Business & Financial | 0 (0.0%) | 0 (0.0%) |
| Computers, Engineering & Science | 0 (0.0%) | 0 (0.0%) |
| Computers & Mathematics | 0 (0.0%) | 0 (0.0%) |
| Architecture & Engineering | 0 (0.0%) | 0 (0.0%) |
| Life, Physical & Social Science | 0 (0.0%) | 0 (0.0%) |
| Community & Social Service | 0 (0.0%) | 0 (0.0%) |
| Education, Arts & Media | 0 (0.0%) | 0 (0.0%) |
| Legal Services & Support | 0 (0.0%) | 0 (0.0%) |
| Education Instruction & Library | 0 (0.0%) | 0 (0.0%) |
| Arts, Media & Entertainment | 0 (0.0%) | 0 (0.0%) |
| Health Diagnosing & Treating | 0 (0.0%) | 0 (0.0%) |
| Health Technologists | 0 (0.0%) | 0 (0.0%) |
| Total (Category) | 0 (0.0%) | 0 (0.0%) |
| Total (Overall) | 0 (0.0%) | 8 (100.0%) |
Services Occupations
The most common Services occupations in Halltown are , and Food Preparation & Serving (5 | 62.5%).
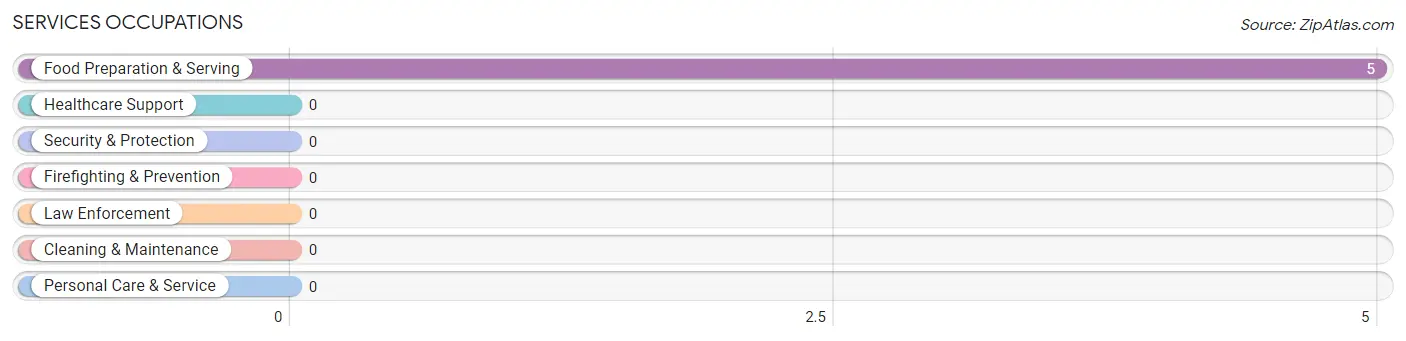
Services Occupations by Sex
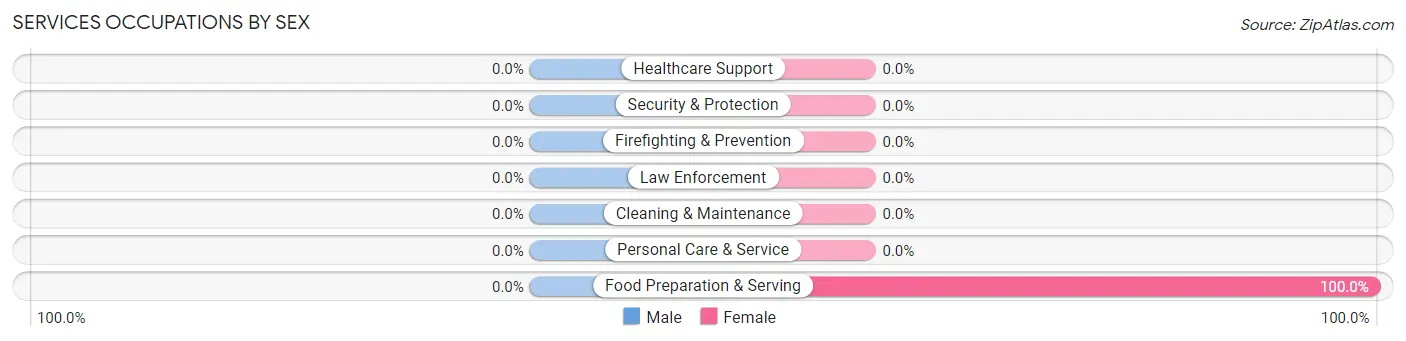
| Occupation | Male | Female |
| Healthcare Support | 0 (0.0%) | 0 (0.0%) |
| Security & Protection | 0 (0.0%) | 0 (0.0%) |
| Firefighting & Prevention | 0 (0.0%) | 0 (0.0%) |
| Law Enforcement | 0 (0.0%) | 0 (0.0%) |
| Food Preparation & Serving | 0 (0.0%) | 5 (100.0%) |
| Cleaning & Maintenance | 0 (0.0%) | 0 (0.0%) |
| Personal Care & Service | 0 (0.0%) | 0 (0.0%) |
| Total (Category) | 0 (0.0%) | 5 (100.0%) |
| Total (Overall) | 0 (0.0%) | 8 (100.0%) |
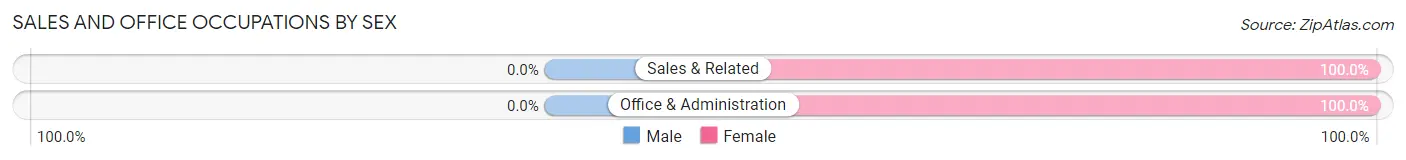
Sales and Office Occupations
The most common Sales and Office occupations in Halltown are Sales & Related (2 | 25.0%), and Office & Administration (1 | 12.5%).
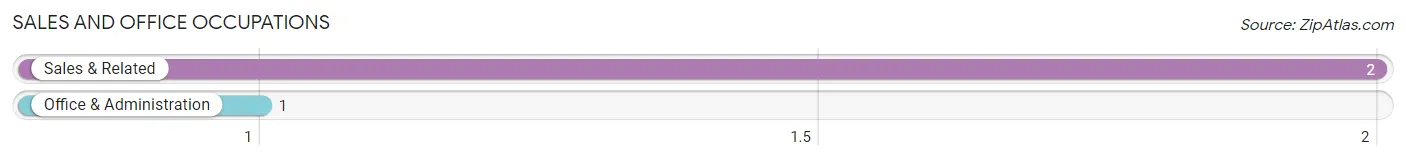
Sales and Office Occupations by Sex
| Occupation | Male | Female |
| Sales & Related | 0 (0.0%) | 2 (100.0%) |
| Office & Administration | 0 (0.0%) | 1 (100.0%) |
| Total (Category) | 0 (0.0%) | 3 (100.0%) |
| Total (Overall) | 0 (0.0%) | 8 (100.0%) |
Natural Resources, Construction and Maintenance Occupations
Natural Resources, Construction and Maintenance Occupations by Sex
| Occupation | Male | Female |
| Farming, Fishing & Forestry | 0 (0.0%) | 0 (0.0%) |
| Construction & Extraction | 0 (0.0%) | 0 (0.0%) |
| Installation, Maintenance & Repair | 0 (0.0%) | 0 (0.0%) |
| Total (Category) | 0 (0.0%) | 0 (0.0%) |
| Total (Overall) | 0 (0.0%) | 8 (100.0%) |
Production, Transportation and Moving Occupations
Production, Transportation and Moving Occupations by Sex
| Occupation | Male | Female |
| Production | 0 (0.0%) | 0 (0.0%) |
| Transportation | 0 (0.0%) | 0 (0.0%) |
| Material Moving | 0 (0.0%) | 0 (0.0%) |
| Total (Category) | 0 (0.0%) | 0 (0.0%) |
| Total (Overall) | 0 (0.0%) | 8 (100.0%) |
Employment Industries by Sex in Halltown
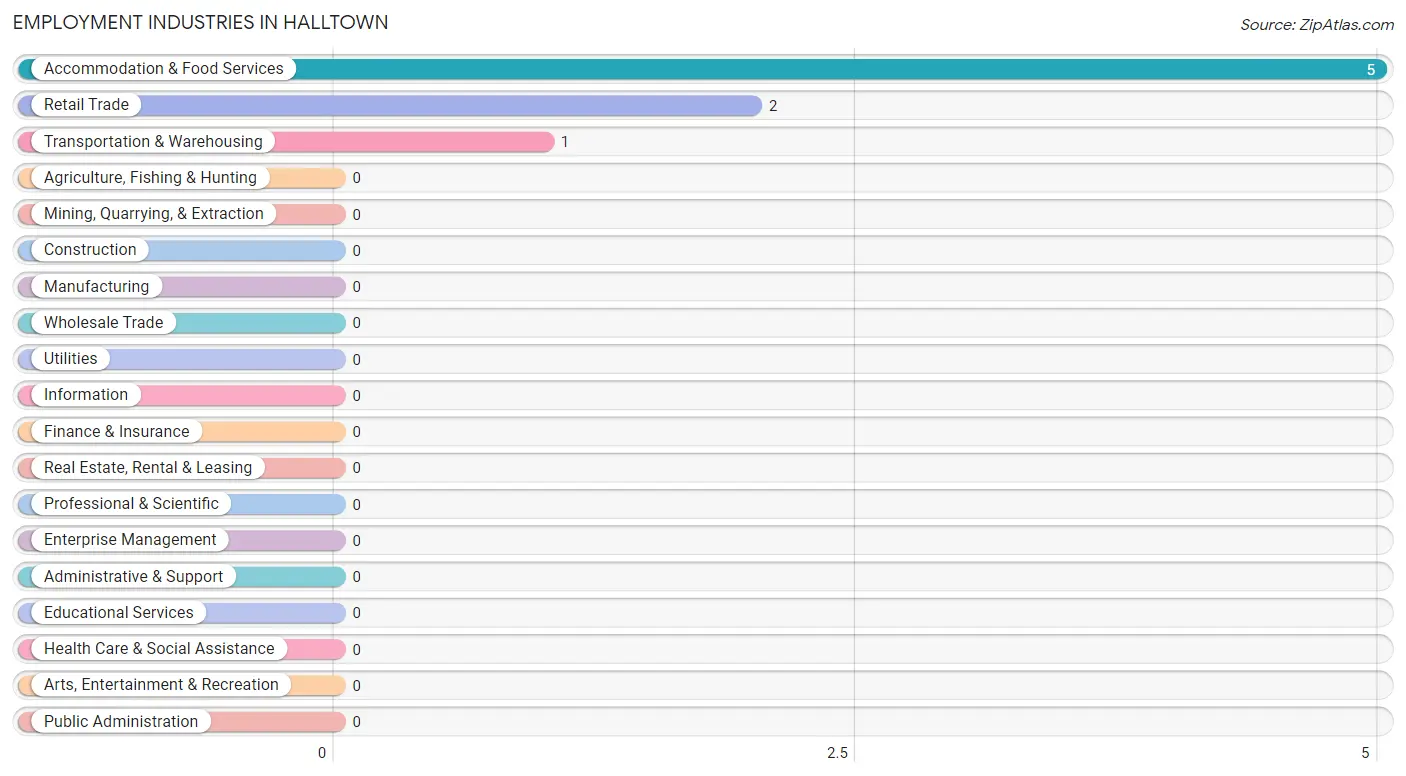
Employment Industries in Halltown
The major employment industries in Halltown include Accommodation & Food Services (5 | 62.5%), Retail Trade (2 | 25.0%), and Transportation & Warehousing (1 | 12.5%).
Employment Industries by Sex in Halltown
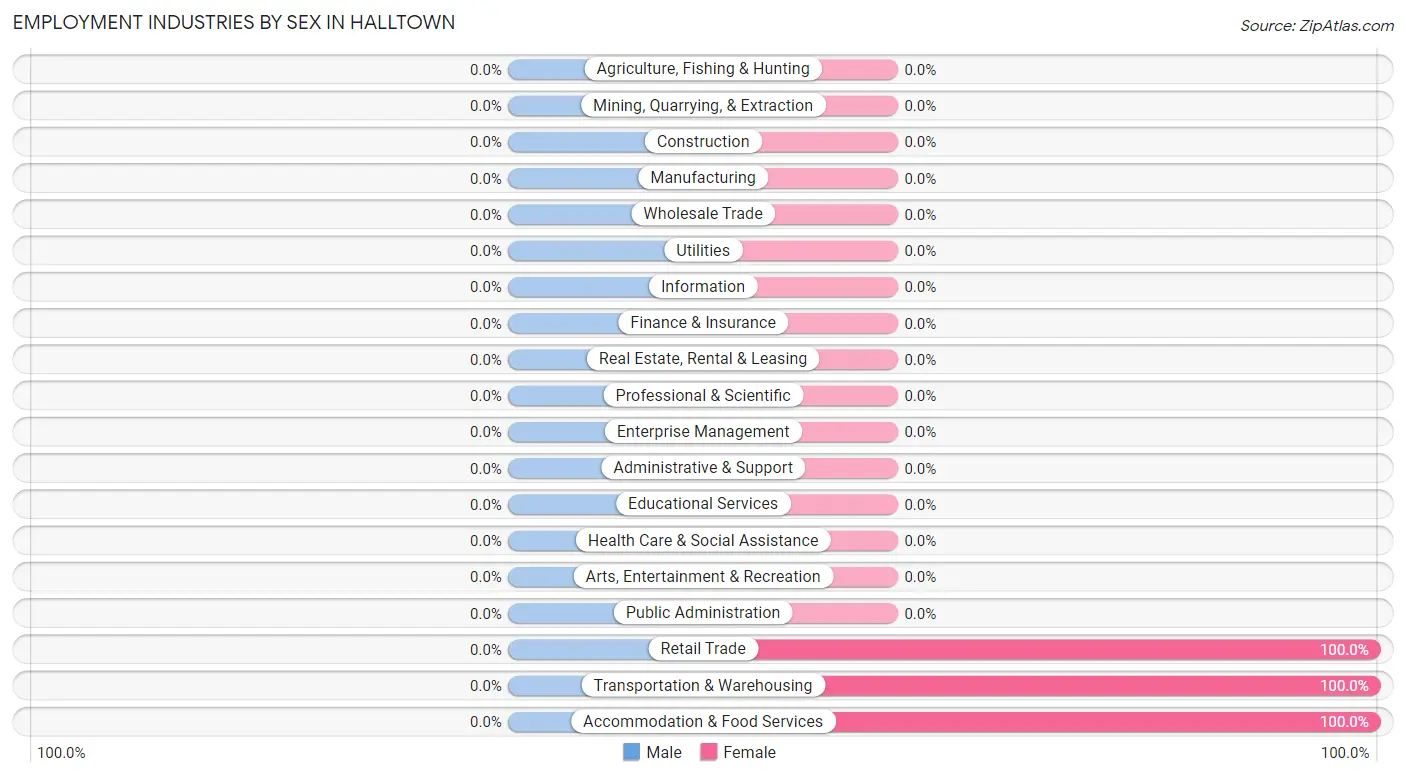
| Industry | Male | Female |
| Agriculture, Fishing & Hunting | 0 (0.0%) | 0 (0.0%) |
| Mining, Quarrying, & Extraction | 0 (0.0%) | 0 (0.0%) |
| Construction | 0 (0.0%) | 0 (0.0%) |
| Manufacturing | 0 (0.0%) | 0 (0.0%) |
| Wholesale Trade | 0 (0.0%) | 0 (0.0%) |
| Retail Trade | 0 (0.0%) | 2 (100.0%) |
| Transportation & Warehousing | 0 (0.0%) | 1 (100.0%) |
| Utilities | 0 (0.0%) | 0 (0.0%) |
| Information | 0 (0.0%) | 0 (0.0%) |
| Finance & Insurance | 0 (0.0%) | 0 (0.0%) |
| Real Estate, Rental & Leasing | 0 (0.0%) | 0 (0.0%) |
| Professional & Scientific | 0 (0.0%) | 0 (0.0%) |
| Enterprise Management | 0 (0.0%) | 0 (0.0%) |
| Administrative & Support | 0 (0.0%) | 0 (0.0%) |
| Educational Services | 0 (0.0%) | 0 (0.0%) |
| Health Care & Social Assistance | 0 (0.0%) | 0 (0.0%) |
| Arts, Entertainment & Recreation | 0 (0.0%) | 0 (0.0%) |
| Accommodation & Food Services | 0 (0.0%) | 5 (100.0%) |
| Public Administration | 0 (0.0%) | 0 (0.0%) |
| Total | 0 (0.0%) | 8 (100.0%) |
Education in Halltown
School Enrollment in Halltown
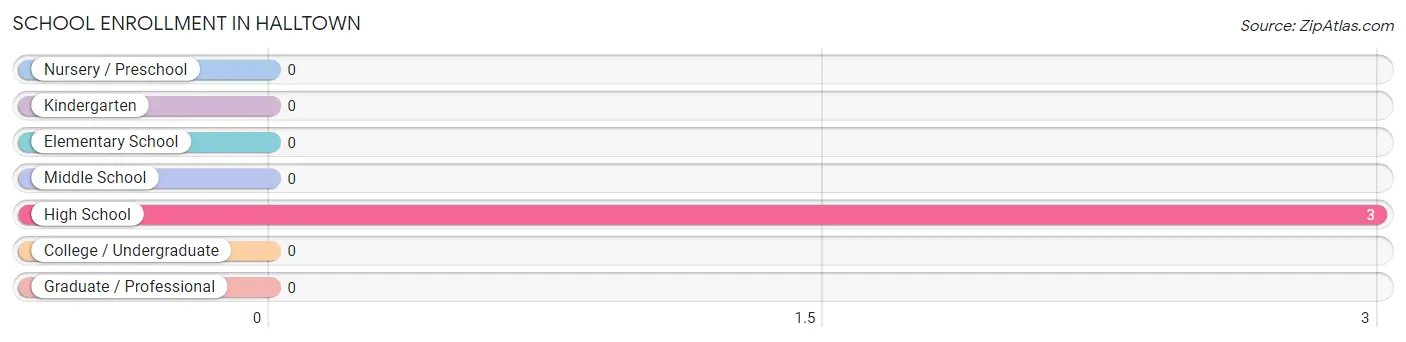
| School Level | # Students | % Students |
| Nursery / Preschool | 0 | 0.0% |
| Kindergarten | 0 | 0.0% |
| Elementary School | 0 | 0.0% |
| Middle School | 0 | 0.0% |
| High School | 3 | 100.0% |
| College / Undergraduate | 0 | 0.0% |
| Graduate / Professional | 0 | 0.0% |
| Total | 3 | 100.0% |
School Enrollment by Age by Funding Source in Halltown
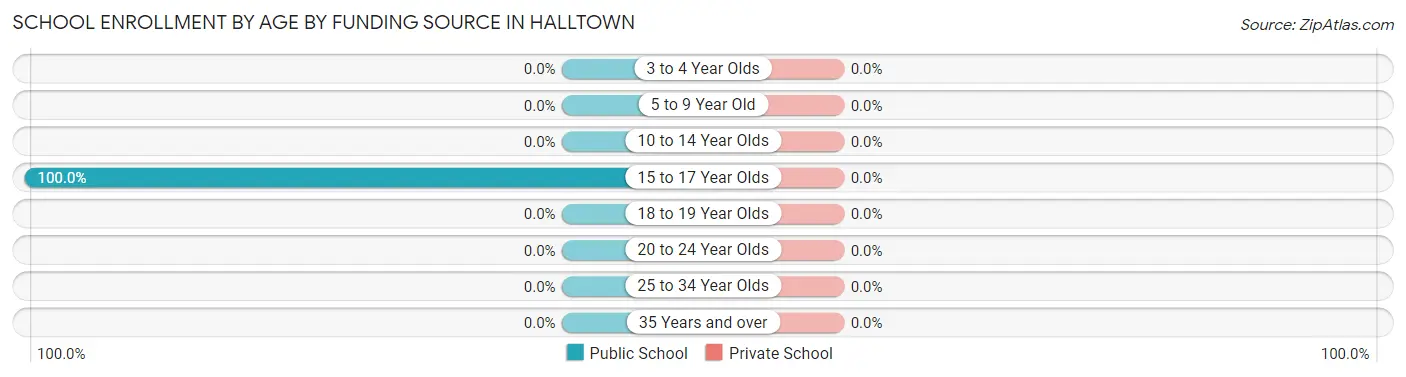
| Age Bracket | Public School | Private School |
| 3 to 4 Year Olds | 0 (0.0%) | 0 (0.0%) |
| 5 to 9 Year Old | 0 (0.0%) | 0 (0.0%) |
| 10 to 14 Year Olds | 0 (0.0%) | 0 (0.0%) |
| 15 to 17 Year Olds | 3 (100.0%) | 0 (0.0%) |
| 18 to 19 Year Olds | 0 (0.0%) | 0 (0.0%) |
| 20 to 24 Year Olds | 0 (0.0%) | 0 (0.0%) |
| 25 to 34 Year Olds | 0 (0.0%) | 0 (0.0%) |
| 35 Years and over | 0 (0.0%) | 0 (0.0%) |
| Total | 3 (100.0%) | 0 (0.0%) |
Educational Attainment by Field of Study in Halltown
, and education (3 | 100.0%) are the most common fields of study among 3 individuals in Halltown who have obtained a bachelor's degree or higher.
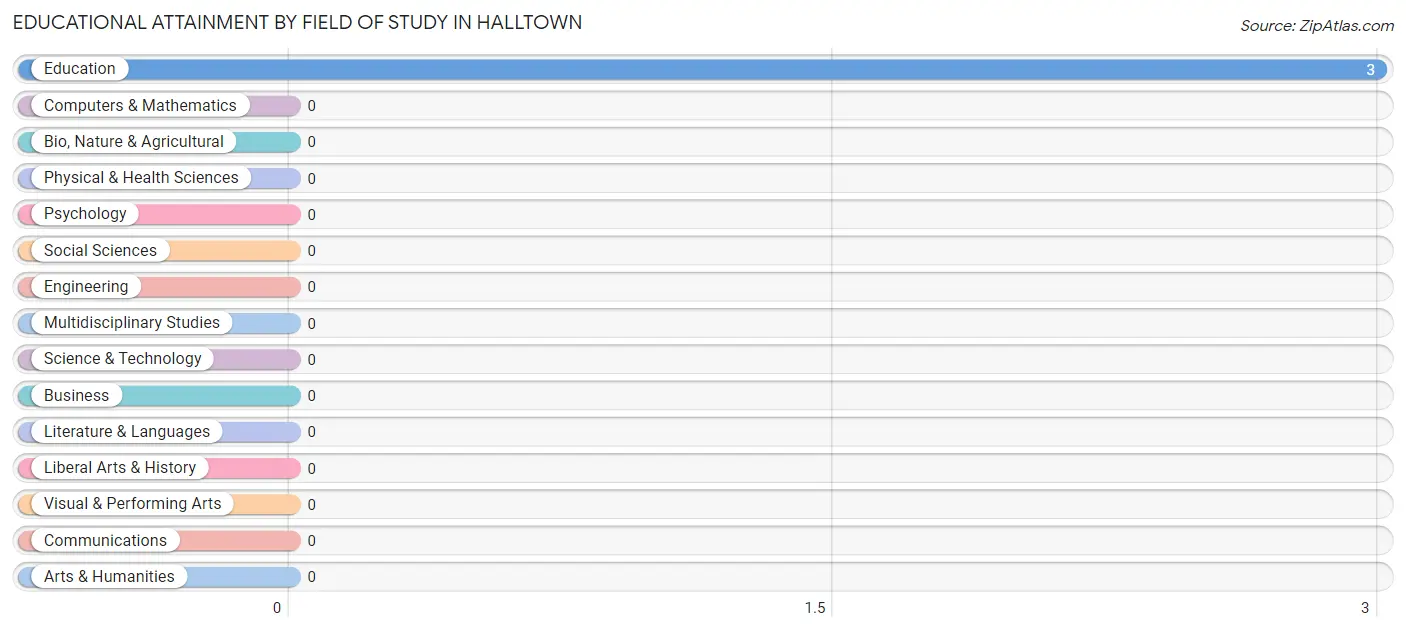
| Field of Study | # Graduates | % Graduates |
| Computers & Mathematics | 0 | 0.0% |
| Bio, Nature & Agricultural | 0 | 0.0% |
| Physical & Health Sciences | 0 | 0.0% |
| Psychology | 0 | 0.0% |
| Social Sciences | 0 | 0.0% |
| Engineering | 0 | 0.0% |
| Multidisciplinary Studies | 0 | 0.0% |
| Science & Technology | 0 | 0.0% |
| Business | 0 | 0.0% |
| Education | 3 | 100.0% |
| Literature & Languages | 0 | 0.0% |
| Liberal Arts & History | 0 | 0.0% |
| Visual & Performing Arts | 0 | 0.0% |
| Communications | 0 | 0.0% |
| Arts & Humanities | 0 | 0.0% |
| Total | 3 | 100.0% |
Transportation & Commute in Halltown
Vehicle Availability by Sex in Halltown
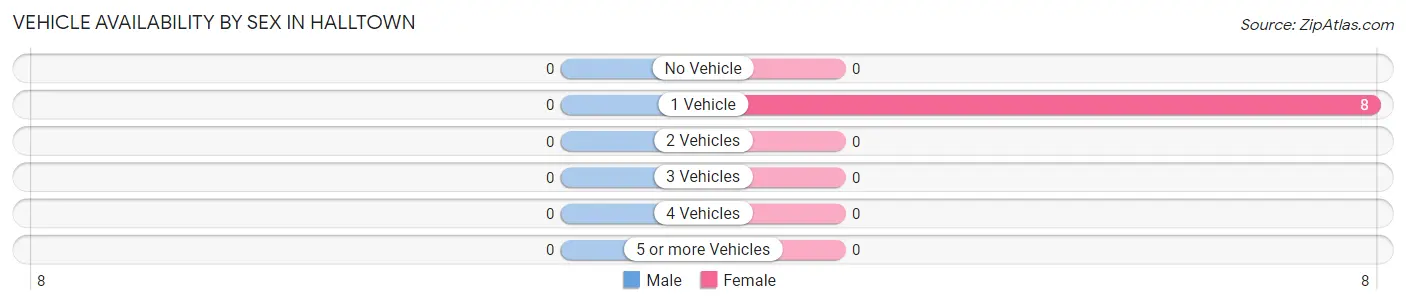
| Vehicles Available | Male | Female |
| No Vehicle | 0 (0.0%) | 0 (0.0%) |
| 1 Vehicle | 0 (0.0%) | 8 (100.0%) |
| 2 Vehicles | 0 (0.0%) | 0 (0.0%) |
| 3 Vehicles | 0 (0.0%) | 0 (0.0%) |
| 4 Vehicles | 0 (0.0%) | 0 (0.0%) |
| 5 or more Vehicles | 0 (0.0%) | 0 (0.0%) |
| Total | 0 (0.0%) | 8 (100.0%) |
Commute Time in Halltown
The most frequently occuring commute durations in Halltown are 15 to 19 minutes (5 commuters, 62.5%), 25 to 29 minutes (2 commuters, 25.0%), and less than 5 minutes (1 commuters, 12.5%).
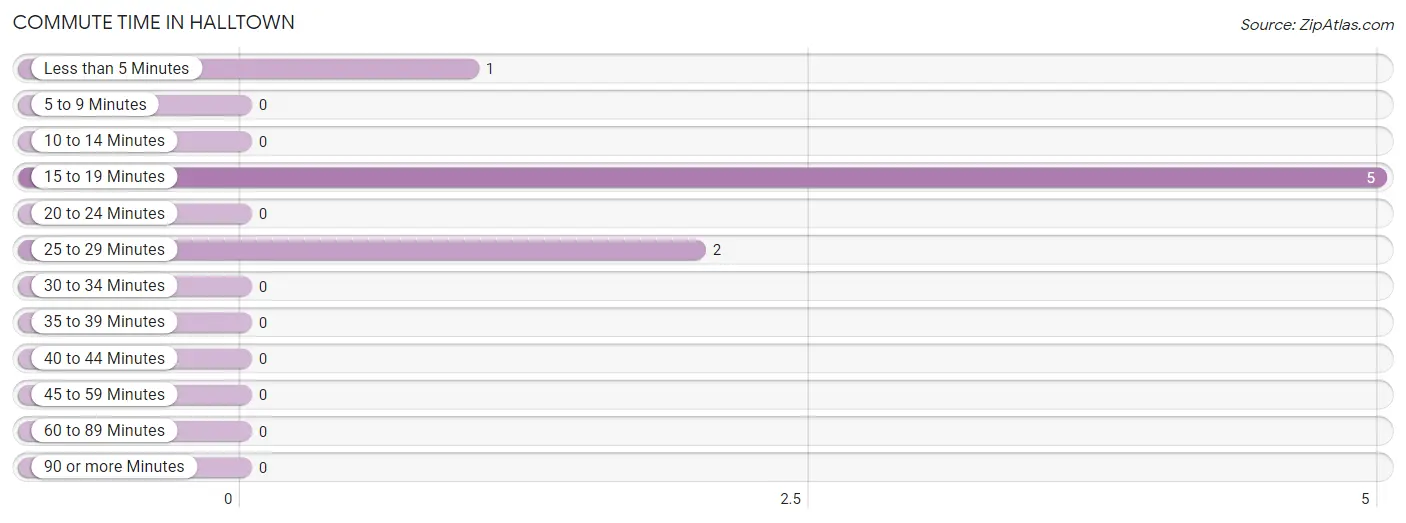
| Commute Time | # Commuters | % Commuters |
| Less than 5 Minutes | 1 | 12.5% |
| 5 to 9 Minutes | 0 | 0.0% |
| 10 to 14 Minutes | 0 | 0.0% |
| 15 to 19 Minutes | 5 | 62.5% |
| 20 to 24 Minutes | 0 | 0.0% |
| 25 to 29 Minutes | 2 | 25.0% |
| 30 to 34 Minutes | 0 | 0.0% |
| 35 to 39 Minutes | 0 | 0.0% |
| 40 to 44 Minutes | 0 | 0.0% |
| 45 to 59 Minutes | 0 | 0.0% |
| 60 to 89 Minutes | 0 | 0.0% |
| 90 or more Minutes | 0 | 0.0% |
Commute Time by Sex in Halltown
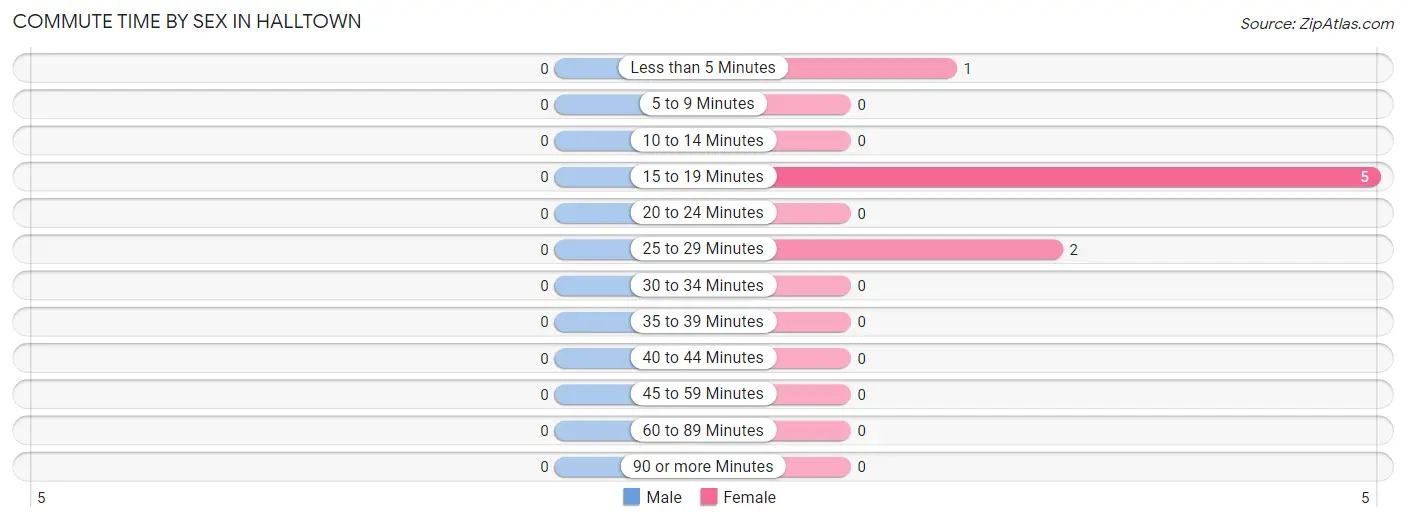
| Commute Time | Male | Female |
| Less than 5 Minutes | 0 (0.0%) | 1 (12.5%) |
| 5 to 9 Minutes | 0 (0.0%) | 0 (0.0%) |
| 10 to 14 Minutes | 0 (0.0%) | 0 (0.0%) |
| 15 to 19 Minutes | 0 (0.0%) | 5 (62.5%) |
| 20 to 24 Minutes | 0 (0.0%) | 0 (0.0%) |
| 25 to 29 Minutes | 0 (0.0%) | 2 (25.0%) |
| 30 to 34 Minutes | 0 (0.0%) | 0 (0.0%) |
| 35 to 39 Minutes | 0 (0.0%) | 0 (0.0%) |
| 40 to 44 Minutes | 0 (0.0%) | 0 (0.0%) |
| 45 to 59 Minutes | 0 (0.0%) | 0 (0.0%) |
| 60 to 89 Minutes | 0 (0.0%) | 0 (0.0%) |
| 90 or more Minutes | 0 (0.0%) | 0 (0.0%) |
Time of Departure to Work by Sex in Halltown
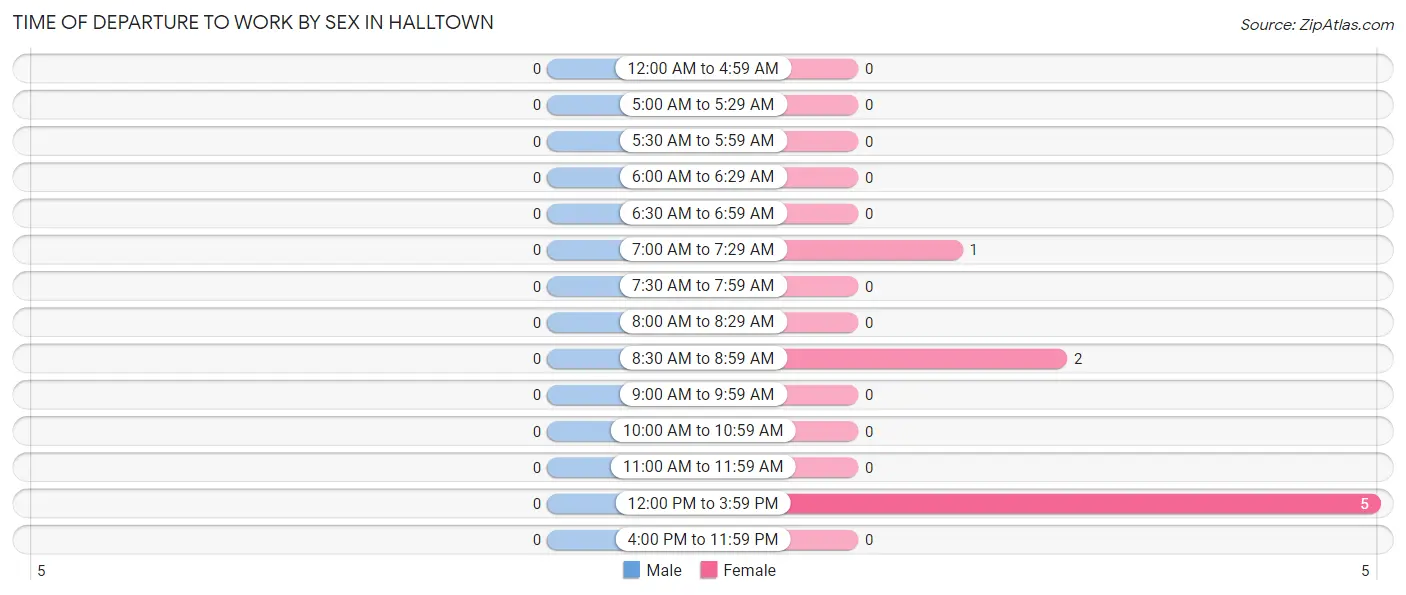
| Time of Departure | Male | Female |
| 12:00 AM to 4:59 AM | 0 (0.0%) | 0 (0.0%) |
| 5:00 AM to 5:29 AM | 0 (0.0%) | 0 (0.0%) |
| 5:30 AM to 5:59 AM | 0 (0.0%) | 0 (0.0%) |
| 6:00 AM to 6:29 AM | 0 (0.0%) | 0 (0.0%) |
| 6:30 AM to 6:59 AM | 0 (0.0%) | 0 (0.0%) |
| 7:00 AM to 7:29 AM | 0 (0.0%) | 1 (12.5%) |
| 7:30 AM to 7:59 AM | 0 (0.0%) | 0 (0.0%) |
| 8:00 AM to 8:29 AM | 0 (0.0%) | 0 (0.0%) |
| 8:30 AM to 8:59 AM | 0 (0.0%) | 2 (25.0%) |
| 9:00 AM to 9:59 AM | 0 (0.0%) | 0 (0.0%) |
| 10:00 AM to 10:59 AM | 0 (0.0%) | 0 (0.0%) |
| 11:00 AM to 11:59 AM | 0 (0.0%) | 0 (0.0%) |
| 12:00 PM to 3:59 PM | 0 (0.0%) | 5 (62.5%) |
| 4:00 PM to 11:59 PM | 0 (0.0%) | 0 (0.0%) |
| Total | 0 (0.0%) | 8 (100.0%) |
Housing Occupancy in Halltown
Occupancy by Ownership in Halltown
Of the total 19 dwellings in Halltown, owner-occupied units account for 3 (15.8%), while renter-occupied units make up 16 (84.2%).
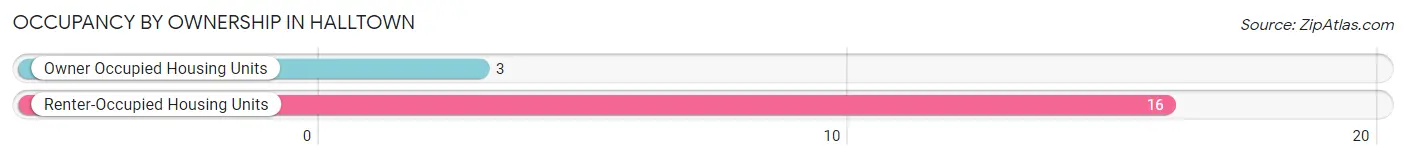
| Occupancy | # Housing Units | % Housing Units |
| Owner Occupied Housing Units | 3 | 15.8% |
| Renter-Occupied Housing Units | 16 | 84.2% |
| Total Occupied Housing Units | 19 | 100.0% |
Occupancy by Household Size in Halltown
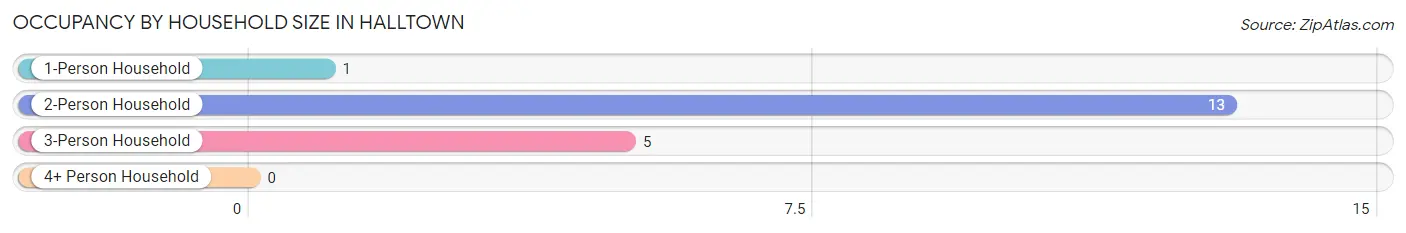
| Household Size | # Housing Units | % Housing Units |
| 1-Person Household | 1 | 5.3% |
| 2-Person Household | 13 | 68.4% |
| 3-Person Household | 5 | 26.3% |
| 4+ Person Household | 0 | 0.0% |
| Total Housing Units | 19 | 100.0% |
Occupancy by Ownership by Household Size in Halltown
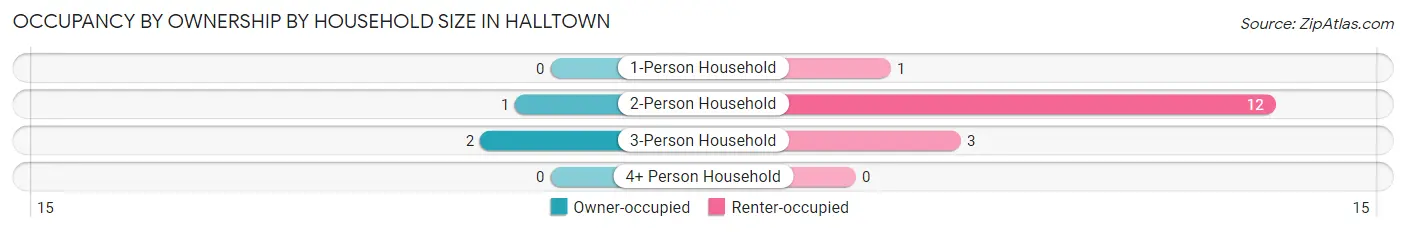
| Household Size | Owner-occupied | Renter-occupied |
| 1-Person Household | 0 (0.0%) | 1 (100.0%) |
| 2-Person Household | 1 (7.7%) | 12 (92.3%) |
| 3-Person Household | 2 (40.0%) | 3 (60.0%) |
| 4+ Person Household | 0 (0.0%) | 0 (0.0%) |
| Total Housing Units | 3 (15.8%) | 16 (84.2%) |
Occupancy by Educational Attainment in Halltown
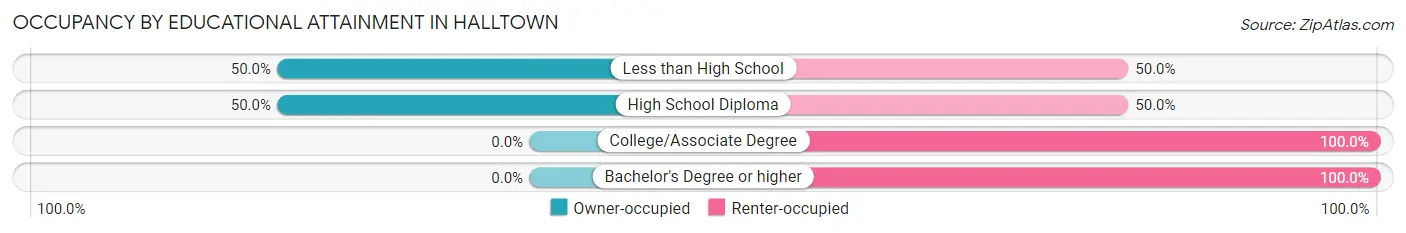
| Household Size | Owner-occupied | Renter-occupied |
| Less than High School | 1 (50.0%) | 1 (50.0%) |
| High School Diploma | 2 (50.0%) | 2 (50.0%) |
| College/Associate Degree | 0 (0.0%) | 10 (100.0%) |
| Bachelor's Degree or higher | 0 (0.0%) | 3 (100.0%) |
Occupancy by Age of Householder in Halltown
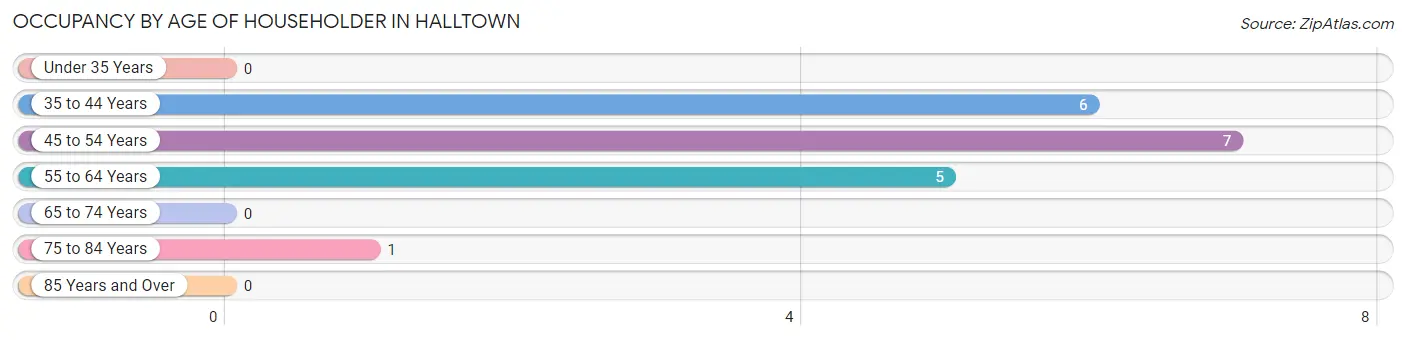
| Age Bracket | # Households | % Households |
| Under 35 Years | 0 | 0.0% |
| 35 to 44 Years | 6 | 31.6% |
| 45 to 54 Years | 7 | 36.8% |
| 55 to 64 Years | 5 | 26.3% |
| 65 to 74 Years | 0 | 0.0% |
| 75 to 84 Years | 1 | 5.3% |
| 85 Years and Over | 0 | 0.0% |
| Total | 19 | 100.0% |
Housing Finances in Halltown
Median Income by Occupancy in Halltown
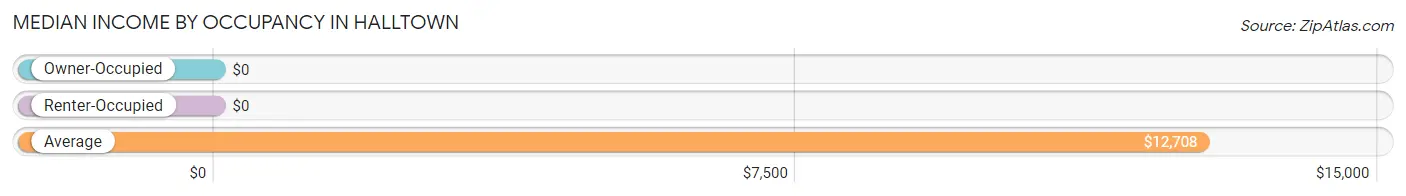
| Occupancy Type | # Households | Median Income |
| Owner-Occupied | 3 (15.8%) | $0 |
| Renter-Occupied | 16 (84.2%) | $0 |
| Average | 19 (100.0%) | $12,708 |
Occupancy by Householder Income Bracket in Halltown
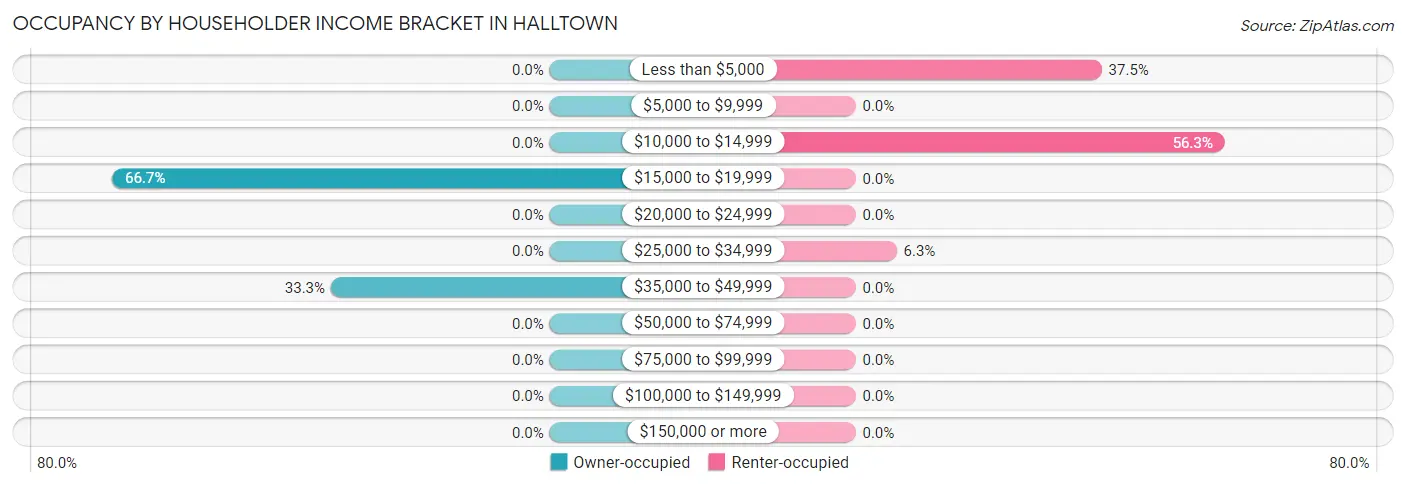
| Income Bracket | Owner-occupied | Renter-occupied |
| Less than $5,000 | 0 (0.0%) | 6 (37.5%) |
| $5,000 to $9,999 | 0 (0.0%) | 0 (0.0%) |
| $10,000 to $14,999 | 0 (0.0%) | 9 (56.2%) |
| $15,000 to $19,999 | 2 (66.7%) | 0 (0.0%) |
| $20,000 to $24,999 | 0 (0.0%) | 0 (0.0%) |
| $25,000 to $34,999 | 0 (0.0%) | 1 (6.2%) |
| $35,000 to $49,999 | 1 (33.3%) | 0 (0.0%) |
| $50,000 to $74,999 | 0 (0.0%) | 0 (0.0%) |
| $75,000 to $99,999 | 0 (0.0%) | 0 (0.0%) |
| $100,000 to $149,999 | 0 (0.0%) | 0 (0.0%) |
| $150,000 or more | 0 (0.0%) | 0 (0.0%) |
| Total | 3 (100.0%) | 16 (100.0%) |
Monthly Housing Cost Tiers in Halltown
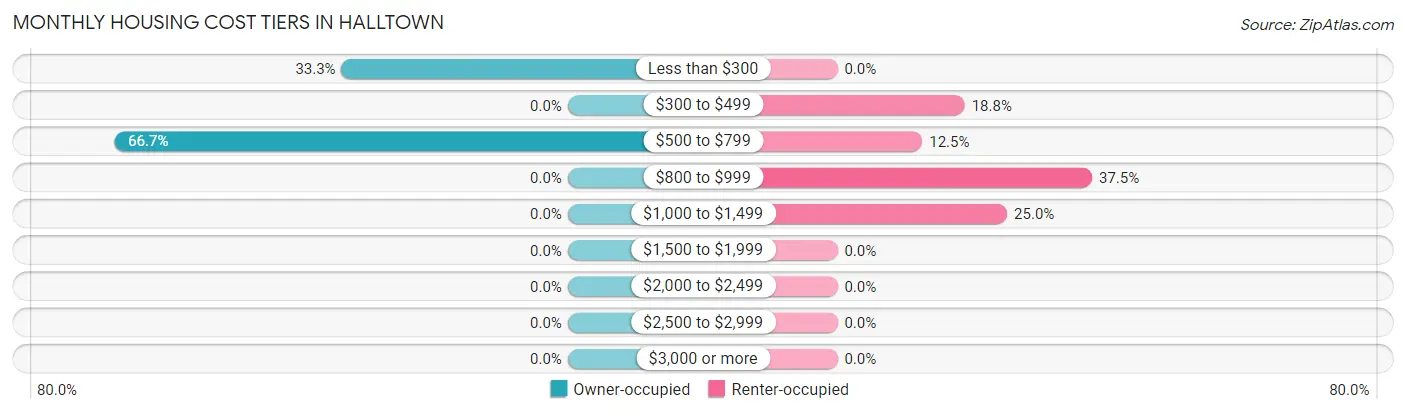
| Monthly Cost | Owner-occupied | Renter-occupied |
| Less than $300 | 1 (33.3%) | 0 (0.0%) |
| $300 to $499 | 0 (0.0%) | 3 (18.8%) |
| $500 to $799 | 2 (66.7%) | 2 (12.5%) |
| $800 to $999 | 0 (0.0%) | 6 (37.5%) |
| $1,000 to $1,499 | 0 (0.0%) | 4 (25.0%) |
| $1,500 to $1,999 | 0 (0.0%) | 0 (0.0%) |
| $2,000 to $2,499 | 0 (0.0%) | 0 (0.0%) |
| $2,500 to $2,999 | 0 (0.0%) | 0 (0.0%) |
| $3,000 or more | 0 (0.0%) | 0 (0.0%) |
| Total | 3 (100.0%) | 16 (100.0%) |
Physical Housing Characteristics in Halltown
Housing Structures in Halltown
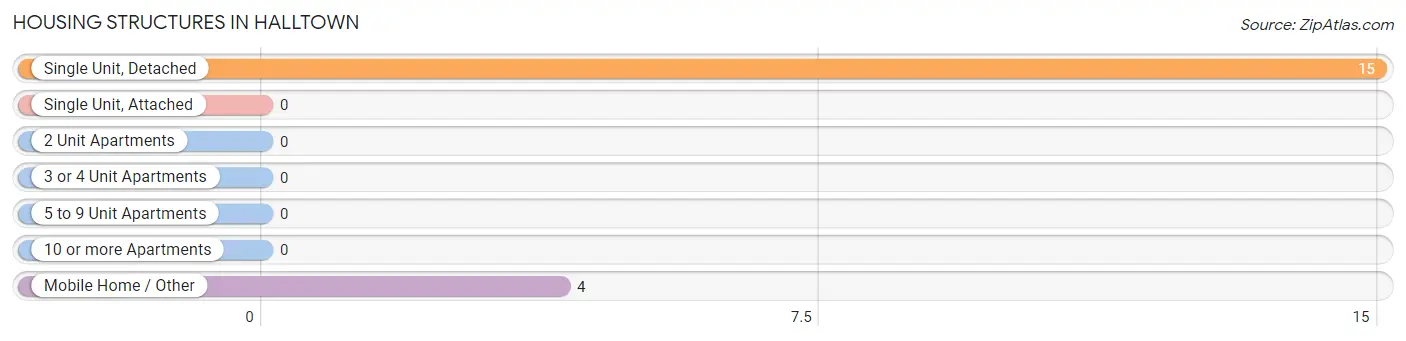
| Structure Type | # Housing Units | % Housing Units |
| Single Unit, Detached | 15 | 78.9% |
| Single Unit, Attached | 0 | 0.0% |
| 2 Unit Apartments | 0 | 0.0% |
| 3 or 4 Unit Apartments | 0 | 0.0% |
| 5 to 9 Unit Apartments | 0 | 0.0% |
| 10 or more Apartments | 0 | 0.0% |
| Mobile Home / Other | 4 | 21.0% |
| Total | 19 | 100.0% |
Housing Structures by Occupancy in Halltown
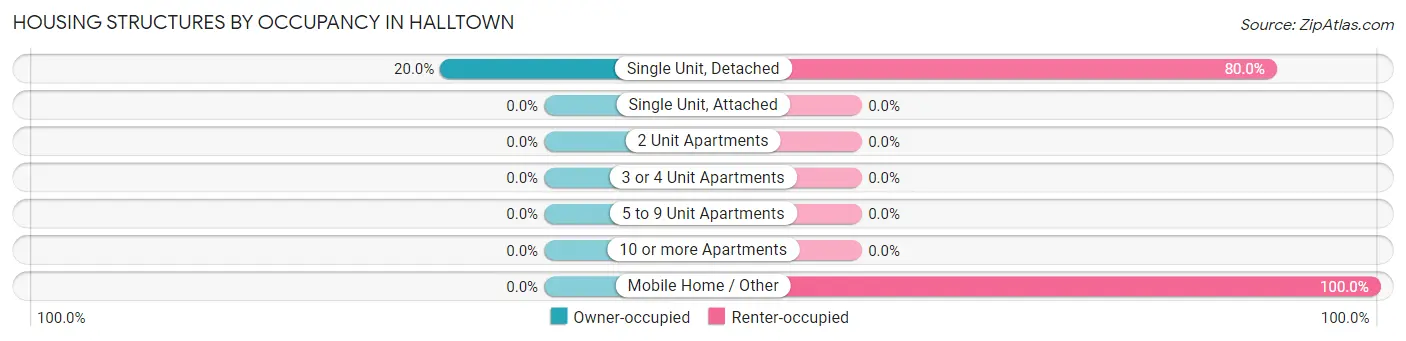
| Structure Type | Owner-occupied | Renter-occupied |
| Single Unit, Detached | 3 (20.0%) | 12 (80.0%) |
| Single Unit, Attached | 0 (0.0%) | 0 (0.0%) |
| 2 Unit Apartments | 0 (0.0%) | 0 (0.0%) |
| 3 or 4 Unit Apartments | 0 (0.0%) | 0 (0.0%) |
| 5 to 9 Unit Apartments | 0 (0.0%) | 0 (0.0%) |
| 10 or more Apartments | 0 (0.0%) | 0 (0.0%) |
| Mobile Home / Other | 0 (0.0%) | 4 (100.0%) |
| Total | 3 (15.8%) | 16 (84.2%) |
Housing Structures by Number of Rooms in Halltown
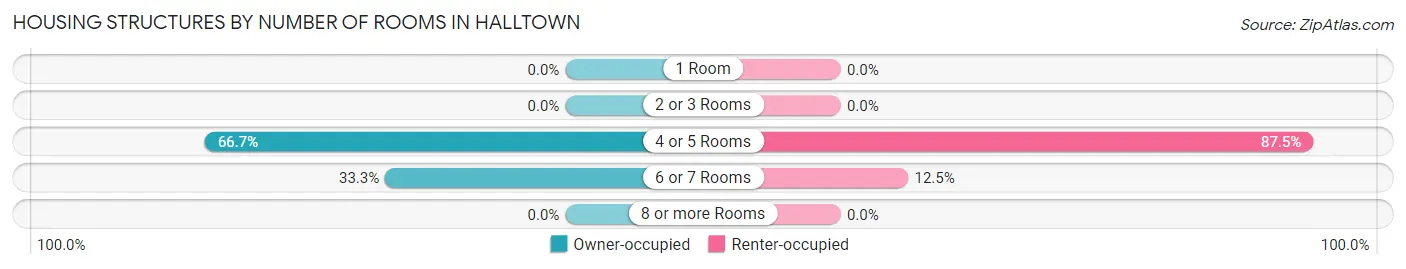
| Number of Rooms | Owner-occupied | Renter-occupied |
| 1 Room | 0 (0.0%) | 0 (0.0%) |
| 2 or 3 Rooms | 0 (0.0%) | 0 (0.0%) |
| 4 or 5 Rooms | 2 (66.7%) | 14 (87.5%) |
| 6 or 7 Rooms | 1 (33.3%) | 2 (12.5%) |
| 8 or more Rooms | 0 (0.0%) | 0 (0.0%) |
| Total | 3 (100.0%) | 16 (100.0%) |
Housing Structure by Heating Type in Halltown
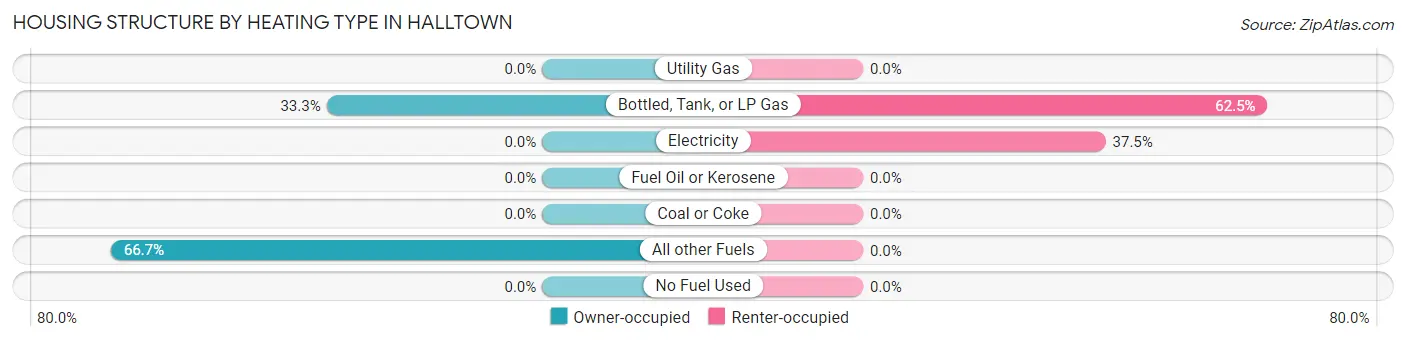
| Heating Type | Owner-occupied | Renter-occupied |
| Utility Gas | 0 (0.0%) | 0 (0.0%) |
| Bottled, Tank, or LP Gas | 1 (33.3%) | 10 (62.5%) |
| Electricity | 0 (0.0%) | 6 (37.5%) |
| Fuel Oil or Kerosene | 0 (0.0%) | 0 (0.0%) |
| Coal or Coke | 0 (0.0%) | 0 (0.0%) |
| All other Fuels | 2 (66.7%) | 0 (0.0%) |
| No Fuel Used | 0 (0.0%) | 0 (0.0%) |
| Total | 3 (100.0%) | 16 (100.0%) |
Household Vehicle Usage in Halltown
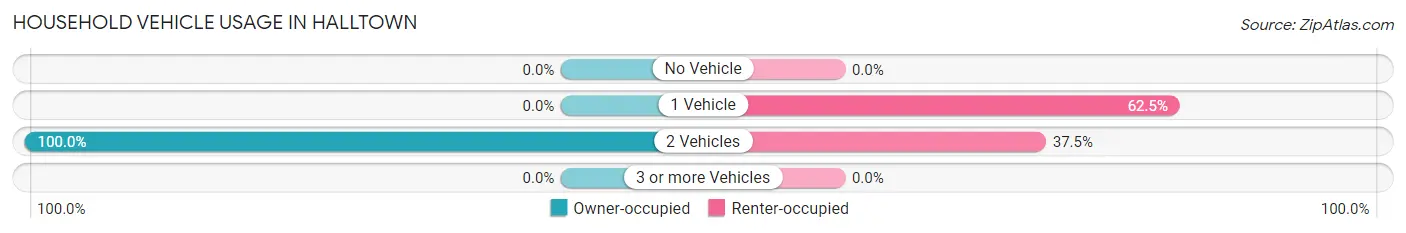
| Vehicles per Household | Owner-occupied | Renter-occupied |
| No Vehicle | 0 (0.0%) | 0 (0.0%) |
| 1 Vehicle | 0 (0.0%) | 10 (62.5%) |
| 2 Vehicles | 3 (100.0%) | 6 (37.5%) |
| 3 or more Vehicles | 0 (0.0%) | 0 (0.0%) |
| Total | 3 (100.0%) | 16 (100.0%) |
Real Estate & Mortgages in Halltown
Real Estate and Mortgage Overview in Halltown
| Characteristic | Without Mortgage | With Mortgage |
| Housing Units | 1 | 2 |
| Median Property Value | - | - |
| Median Household Income | - | - |
| Monthly Housing Costs | - | - |
| Real Estate Taxes | - | - |
Property Value by Mortgage Status in Halltown
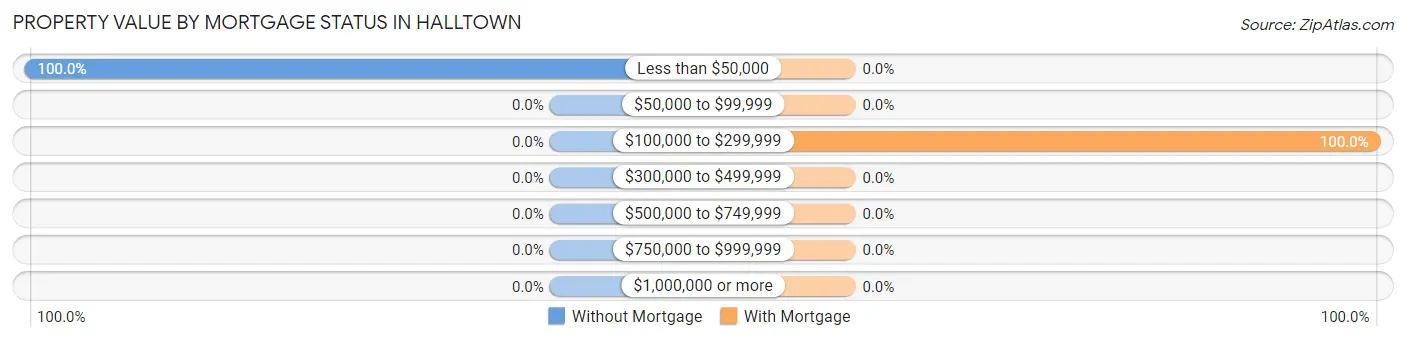
| Property Value | Without Mortgage | With Mortgage |
| Less than $50,000 | 1 (100.0%) | 0 (0.0%) |
| $50,000 to $99,999 | 0 (0.0%) | 0 (0.0%) |
| $100,000 to $299,999 | 0 (0.0%) | 2 (100.0%) |
| $300,000 to $499,999 | 0 (0.0%) | 0 (0.0%) |
| $500,000 to $749,999 | 0 (0.0%) | 0 (0.0%) |
| $750,000 to $999,999 | 0 (0.0%) | 0 (0.0%) |
| $1,000,000 or more | 0 (0.0%) | 0 (0.0%) |
| Total | 1 (100.0%) | 2 (100.0%) |
Household Income by Mortgage Status in Halltown
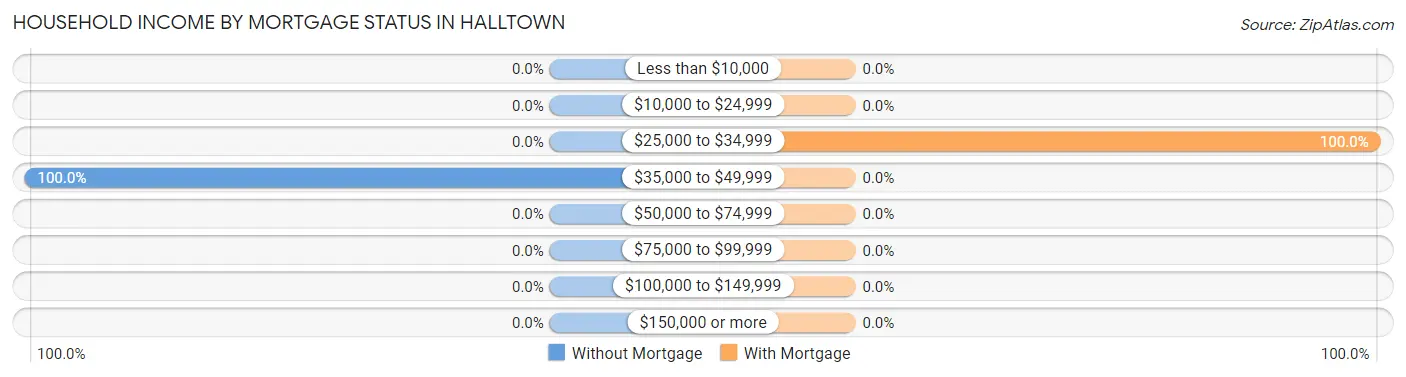
| Household Income | Without Mortgage | With Mortgage |
| Less than $10,000 | 0 (0.0%) | 0 (0.0%) |
| $10,000 to $24,999 | 0 (0.0%) | 0 (0.0%) |
| $25,000 to $34,999 | 0 (0.0%) | 2 (100.0%) |
| $35,000 to $49,999 | 1 (100.0%) | 0 (0.0%) |
| $50,000 to $74,999 | 0 (0.0%) | 0 (0.0%) |
| $75,000 to $99,999 | 0 (0.0%) | 0 (0.0%) |
| $100,000 to $149,999 | 0 (0.0%) | 0 (0.0%) |
| $150,000 or more | 0 (0.0%) | 0 (0.0%) |
| Total | 1 (100.0%) | 2 (100.0%) |
Property Value to Household Income Ratio in Halltown
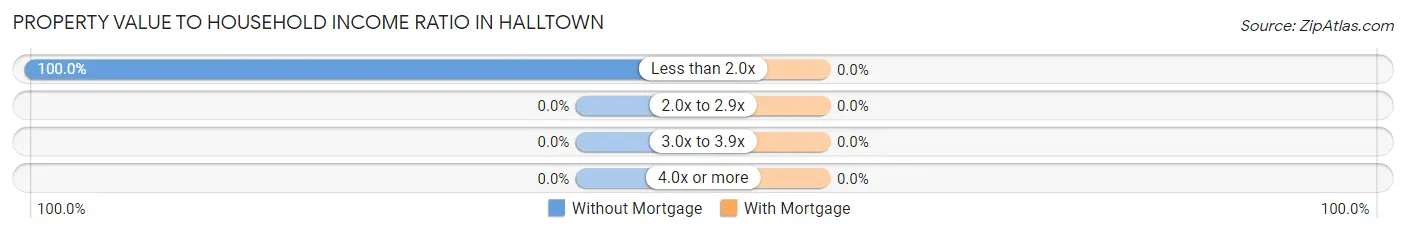
| Value-to-Income Ratio | Without Mortgage | With Mortgage |
| Less than 2.0x | 1 (100.0%) | 0 (0.0%) |
| 2.0x to 2.9x | 0 (0.0%) | 0 (0.0%) |
| 3.0x to 3.9x | 0 (0.0%) | 0 (0.0%) |
| 4.0x or more | 0 (0.0%) | 0 (0.0%) |
| Total | 1 (100.0%) | 2 (100.0%) |
Real Estate Taxes by Mortgage Status in Halltown
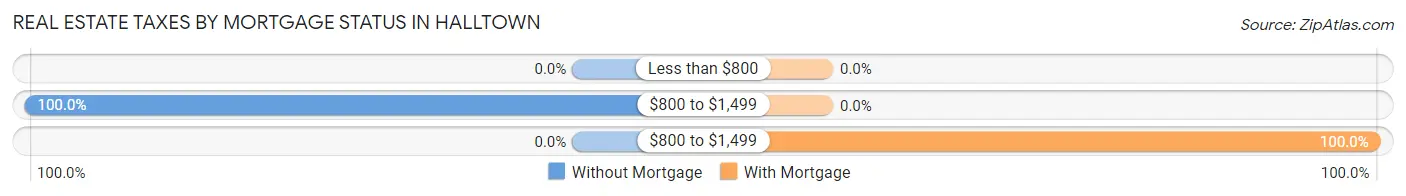
| Property Taxes | Without Mortgage | With Mortgage |
| Less than $800 | 0 (0.0%) | 0 (0.0%) |
| $800 to $1,499 | 1 (100.0%) | 0 (0.0%) |
| $800 to $1,499 | 0 (0.0%) | 2 (100.0%) |
| Total | 1 (100.0%) | 2 (100.0%) |
Health & Disability in Halltown
Health Insurance Coverage by Age in Halltown
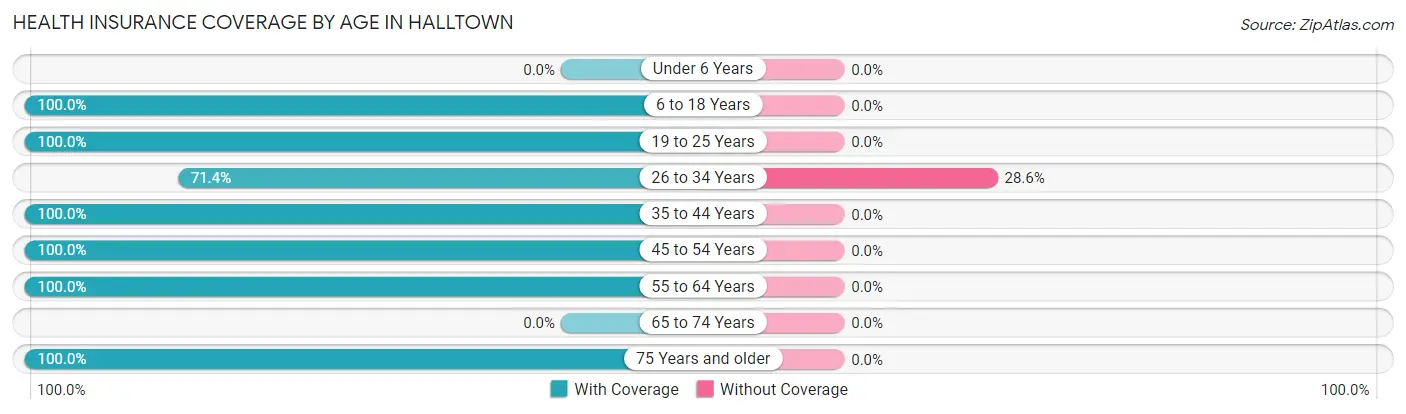
| Age Bracket | With Coverage | Without Coverage |
| Under 6 Years | 0 (0.0%) | 0 (0.0%) |
| 6 to 18 Years | 8 (100.0%) | 0 (0.0%) |
| 19 to 25 Years | 4 (100.0%) | 0 (0.0%) |
| 26 to 34 Years | 5 (71.4%) | 2 (28.6%) |
| 35 to 44 Years | 6 (100.0%) | 0 (0.0%) |
| 45 to 54 Years | 7 (100.0%) | 0 (0.0%) |
| 55 to 64 Years | 8 (100.0%) | 0 (0.0%) |
| 65 to 74 Years | 0 (0.0%) | 0 (0.0%) |
| 75 Years and older | 6 (100.0%) | 0 (0.0%) |
| Total | 44 (95.7%) | 2 (4.3%) |
Health Insurance Coverage by Citizenship Status in Halltown
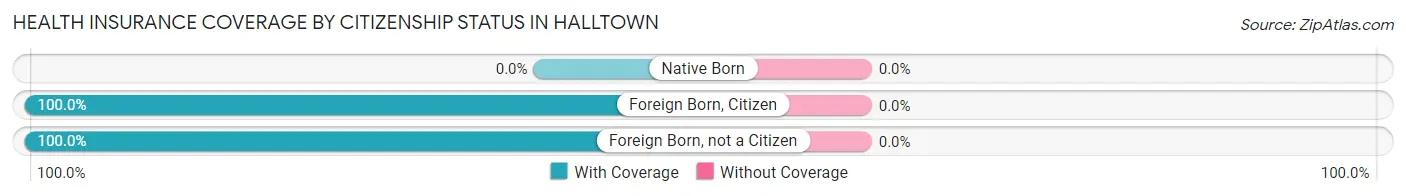
| Citizenship Status | With Coverage | Without Coverage |
| Native Born | 0 (0.0%) | 0 (0.0%) |
| Foreign Born, Citizen | 8 (100.0%) | 0 (0.0%) |
| Foreign Born, not a Citizen | 4 (100.0%) | 0 (0.0%) |
Health Insurance Coverage by Household Income in Halltown
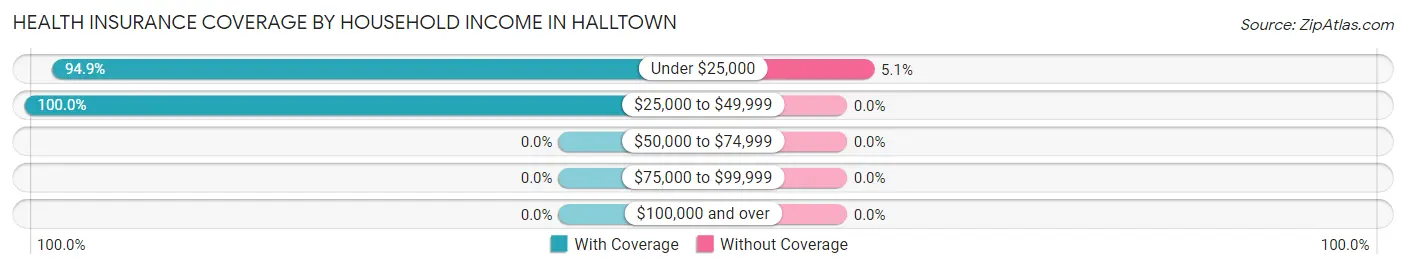
| Household Income | With Coverage | Without Coverage |
| Under $25,000 | 37 (94.9%) | 2 (5.1%) |
| $25,000 to $49,999 | 7 (100.0%) | 0 (0.0%) |
| $50,000 to $74,999 | 0 (0.0%) | 0 (0.0%) |
| $75,000 to $99,999 | 0 (0.0%) | 0 (0.0%) |
| $100,000 and over | 0 (0.0%) | 0 (0.0%) |
Public vs Private Health Insurance Coverage by Age in Halltown
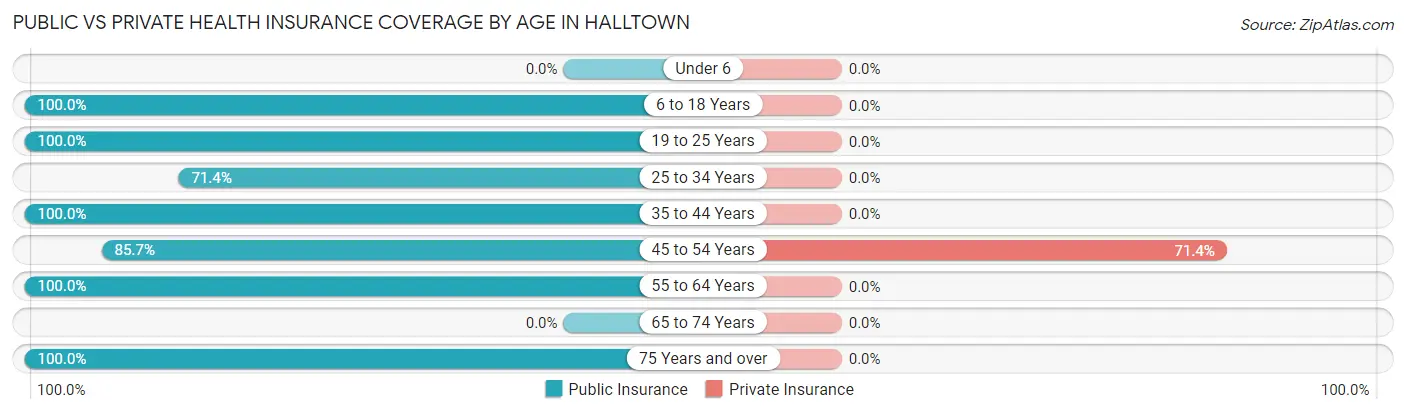
| Age Bracket | Public Insurance | Private Insurance |
| Under 6 | 0 (0.0%) | 0 (0.0%) |
| 6 to 18 Years | 8 (100.0%) | 0 (0.0%) |
| 19 to 25 Years | 4 (100.0%) | 0 (0.0%) |
| 25 to 34 Years | 5 (71.4%) | 0 (0.0%) |
| 35 to 44 Years | 6 (100.0%) | 0 (0.0%) |
| 45 to 54 Years | 6 (85.7%) | 5 (71.4%) |
| 55 to 64 Years | 8 (100.0%) | 0 (0.0%) |
| 65 to 74 Years | 0 (0.0%) | 0 (0.0%) |
| 75 Years and over | 6 (100.0%) | 0 (0.0%) |
| Total | 43 (93.5%) | 5 (10.9%) |
Disability Status by Sex by Age in Halltown
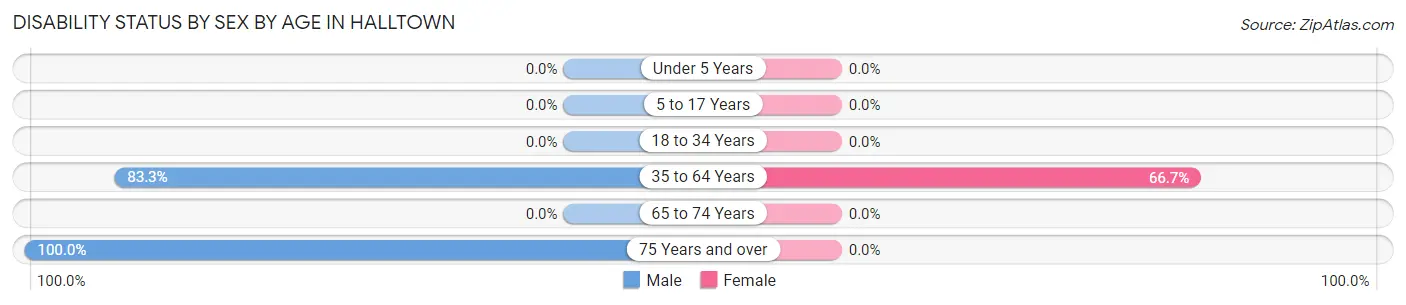
| Age Bracket | Male | Female |
| Under 5 Years | 0 (0.0%) | 0 (0.0%) |
| 5 to 17 Years | 0 (0.0%) | 0 (0.0%) |
| 18 to 34 Years | 0 (0.0%) | 0 (0.0%) |
| 35 to 64 Years | 10 (83.3%) | 6 (66.7%) |
| 65 to 74 Years | 0 (0.0%) | 0 (0.0%) |
| 75 Years and over | 5 (100.0%) | 0 (0.0%) |
Disability Class by Sex by Age in Halltown
Disability Class: Hearing Difficulty
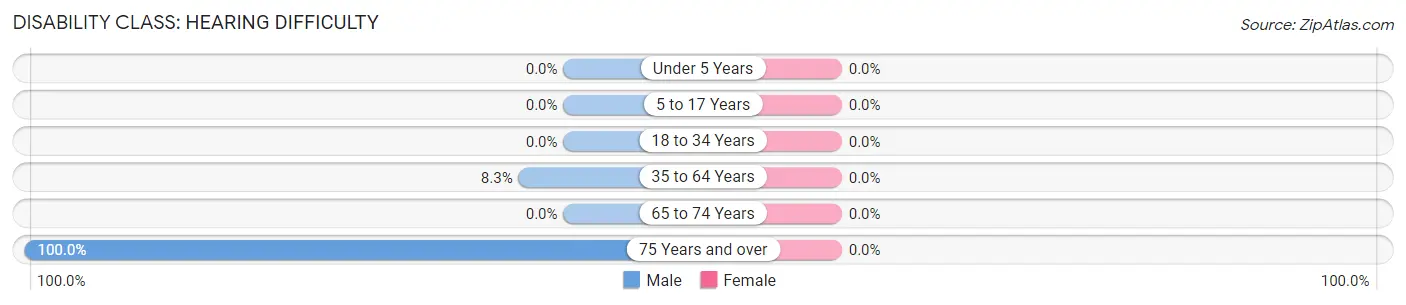
| Age Bracket | Male | Female |
| Under 5 Years | 0 (0.0%) | 0 (0.0%) |
| 5 to 17 Years | 0 (0.0%) | 0 (0.0%) |
| 18 to 34 Years | 0 (0.0%) | 0 (0.0%) |
| 35 to 64 Years | 1 (8.3%) | 0 (0.0%) |
| 65 to 74 Years | 0 (0.0%) | 0 (0.0%) |
| 75 Years and over | 5 (100.0%) | 0 (0.0%) |
Disability Class: Vision Difficulty
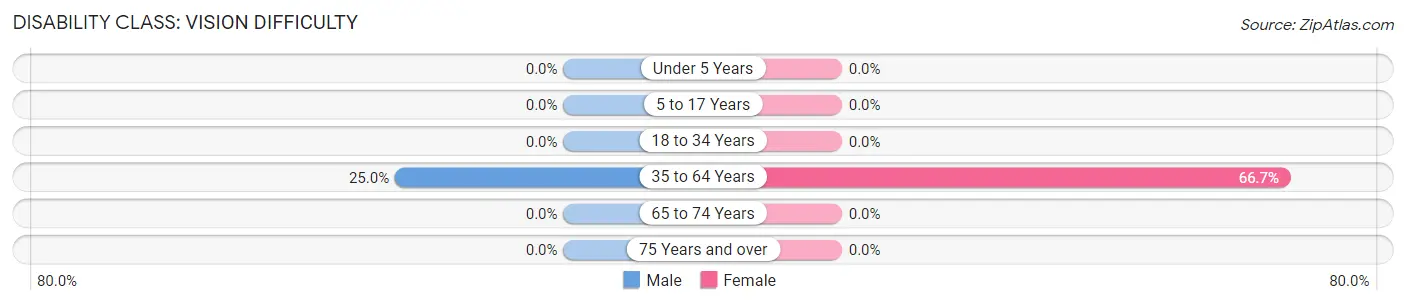
| Age Bracket | Male | Female |
| Under 5 Years | 0 (0.0%) | 0 (0.0%) |
| 5 to 17 Years | 0 (0.0%) | 0 (0.0%) |
| 18 to 34 Years | 0 (0.0%) | 0 (0.0%) |
| 35 to 64 Years | 3 (25.0%) | 6 (66.7%) |
| 65 to 74 Years | 0 (0.0%) | 0 (0.0%) |
| 75 Years and over | 0 (0.0%) | 0 (0.0%) |
Disability Class: Cognitive Difficulty
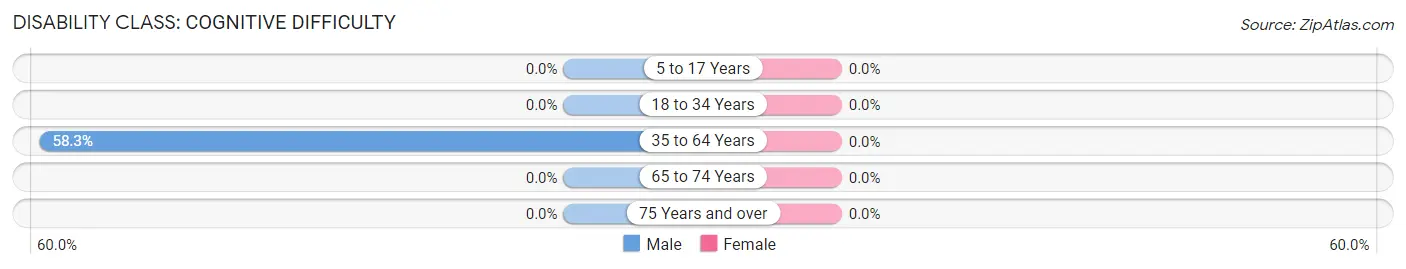
| Age Bracket | Male | Female |
| 5 to 17 Years | 0 (0.0%) | 0 (0.0%) |
| 18 to 34 Years | 0 (0.0%) | 0 (0.0%) |
| 35 to 64 Years | 7 (58.3%) | 0 (0.0%) |
| 65 to 74 Years | 0 (0.0%) | 0 (0.0%) |
| 75 Years and over | 0 (0.0%) | 0 (0.0%) |
Disability Class: Ambulatory Difficulty
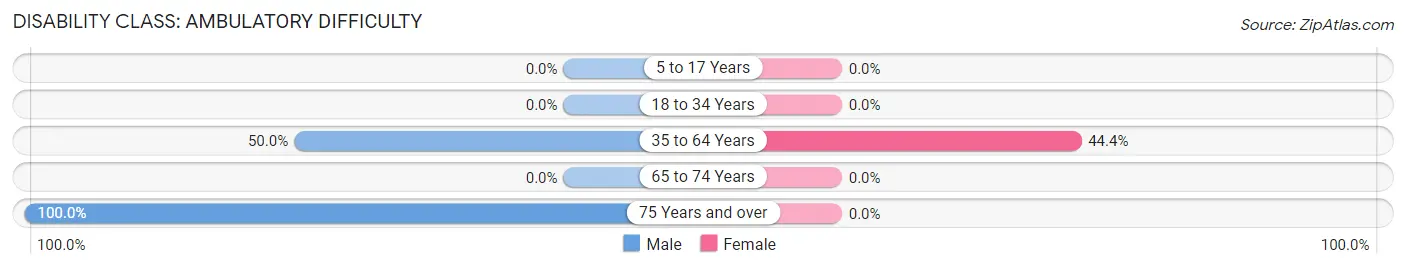
| Age Bracket | Male | Female |
| 5 to 17 Years | 0 (0.0%) | 0 (0.0%) |
| 18 to 34 Years | 0 (0.0%) | 0 (0.0%) |
| 35 to 64 Years | 6 (50.0%) | 4 (44.4%) |
| 65 to 74 Years | 0 (0.0%) | 0 (0.0%) |
| 75 Years and over | 5 (100.0%) | 0 (0.0%) |
Disability Class: Self-Care Difficulty
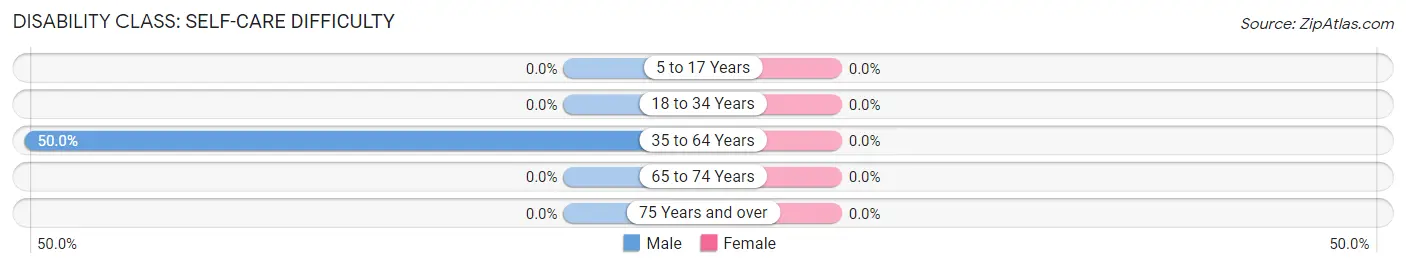
| Age Bracket | Male | Female |
| 5 to 17 Years | 0 (0.0%) | 0 (0.0%) |
| 18 to 34 Years | 0 (0.0%) | 0 (0.0%) |
| 35 to 64 Years | 6 (50.0%) | 0 (0.0%) |
| 65 to 74 Years | 0 (0.0%) | 0 (0.0%) |
| 75 Years and over | 0 (0.0%) | 0 (0.0%) |
Technology Access in Halltown
Computing Device Access in Halltown
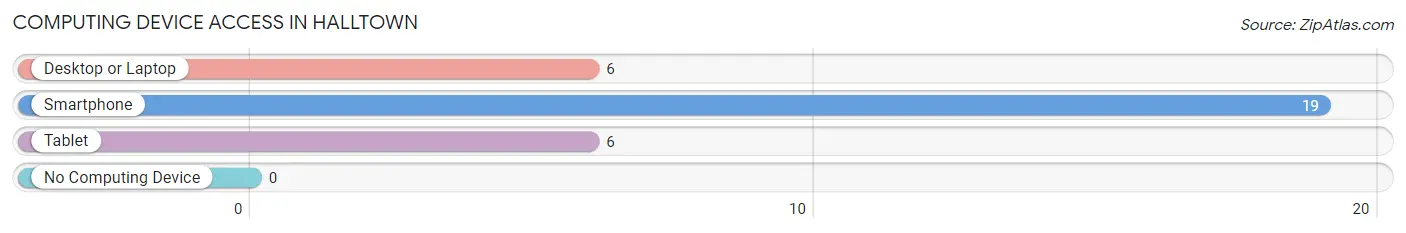
| Device Type | # Households | % Households |
| Desktop or Laptop | 6 | 31.6% |
| Smartphone | 19 | 100.0% |
| Tablet | 6 | 31.6% |
| No Computing Device | 0 | 0.0% |
| Total | 19 | 100.0% |
Internet Access in Halltown
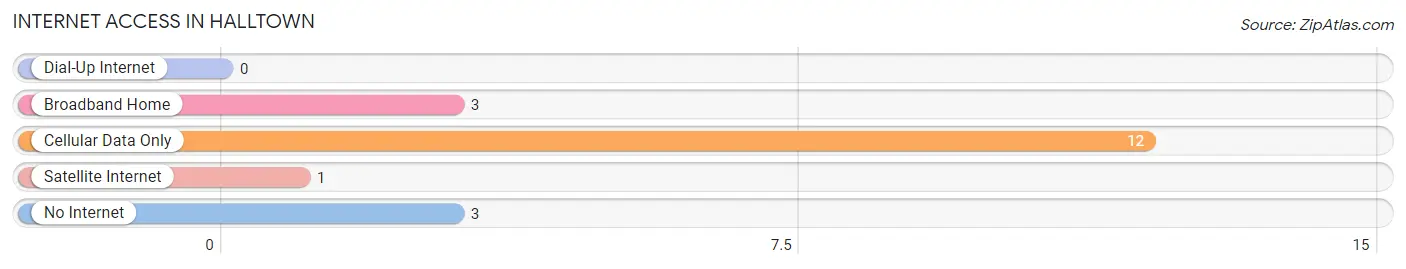
| Internet Type | # Households | % Households |
| Dial-Up Internet | 0 | 0.0% |
| Broadband Home | 3 | 15.8% |
| Cellular Data Only | 12 | 63.2% |
| Satellite Internet | 1 | 5.3% |
| No Internet | 3 | 15.8% |
| Total | 19 | 100.0% |
Halltown Summary
Halltown is a small unincorporated community located in Lawrence County, Missouri. It is situated on the banks of the James River, approximately 10 miles south of the city of Springfield. The population of Halltown was estimated to be around 200 people in 2020.
History
Halltown was founded in 1883 by William Hall, a former Confederate soldier. Hall had served in the Civil War and had been wounded in the Battle of Shiloh. After the war, he moved to Missouri and purchased land along the James River. He built a sawmill and a gristmill, and the town of Halltown was born.
The town grew slowly but steadily, and by the early 1900s, it had become a thriving community. It had a post office, a general store, a blacksmith shop, a school, and several churches. The town also had a hotel, a bank, and a newspaper.
In the 1920s, Halltown was a popular destination for tourists. The town had a number of attractions, including a swimming pool, a dance hall, and a movie theater. The town also had a number of businesses, including a grocery store, a hardware store, and a barber shop.
Geography
Halltown is located in the Ozark Mountains of southwest Missouri. The town is situated on the banks of the James River, which flows through the area. The town is surrounded by rolling hills and forests, and is located approximately 10 miles south of the city of Springfield.
The climate in Halltown is humid subtropical, with hot, humid summers and mild winters. The average annual temperature is around 60 degrees Fahrenheit, and the average annual precipitation is around 40 inches.
Economy
The economy of Halltown is largely based on agriculture. The town is home to several farms, which produce a variety of crops, including corn, soybeans, wheat, and hay. The town also has a number of small businesses, including a grocery store, a hardware store, and a barber shop.
Demographics
As of the 2010 census, the population of Halltown was estimated to be around 200 people. The racial makeup of the town was 97.5% White, 0.5% African American, 0.5% Native American, and 1.5% from other races. The median household income was estimated to be around $30,000.
Conclusion
Halltown is a small unincorporated community located in Lawrence County, Missouri. It is situated on the banks of the James River, approximately 10 miles south of the city of Springfield. The town has a long history, and has been a popular destination for tourists since the 1920s. The economy of Halltown is largely based on agriculture, and the town has a population of around 200 people.
Common Questions
What is Per Capita Income in Halltown?
Per Capita income in Halltown is $6,772.
What is the Median Household income in Halltown?
Median Household Income in Halltown is $12,708.
What is Inequality or Gini Index in Halltown?
Inequality or Gini Index in Halltown is 0.46.
What is the Total Population of Halltown?
Total Population of Halltown is 46.
What is the Total Male Population of Halltown?
Total Male Population of Halltown is 22.
What is the Total Female Population of Halltown?
Total Female Population of Halltown is 24.
What is the Ratio of Males per 100 Females in Halltown?
There are 91.67 Males per 100 Females in Halltown.
What is the Ratio of Females per 100 Males in Halltown?
There are 109.09 Females per 100 Males in Halltown.
What is the Median Population Age in Halltown?
Median Population Age in Halltown is 42.7 Years.
What is the Average Family Size in Halltown
Average Family Size in Halltown is 2.4 People.
What is the Average Household Size in Halltown
Average Household Size in Halltown is 2.4 People.
How Large is the Labor Force in Halltown?
There are 12 People in the Labor Forcein in Halltown.
What is the Percentage of People in the Labor Force in Halltown?
27.9% of People are in the Labor Force in Halltown.
What is the Unemployment Rate in Halltown?
Unemployment Rate in Halltown is 33.3%.