Terra Bella, CA Map & Demographics
Terra Bella Map
Terra Bella Overview
$16,013
PER CAPITA INCOME
$29,091
AVG FAMILY INCOME
$25,370
AVG HOUSEHOLD INCOME
33.1%
WAGE / INCOME GAP [ % ]
66.9¢/ $1
WAGE / INCOME GAP [ $ ]
0.55
INEQUALITY / GINI INDEX
1,806
TOTAL POPULATION
940
MALE POPULATION
866
FEMALE POPULATION
108.55
MALES / 100 FEMALES
92.13
FEMALES / 100 MALES
26.7
MEDIAN AGE
3.8
AVG FAMILY SIZE
3.2
AVG HOUSEHOLD SIZE
576
LABOR FORCE [ PEOPLE ]
47.0%
PERCENT IN LABOR FORCE
38.9%
UNEMPLOYMENT RATE
Terra Bella Zip Codes
Terra Bella Area Codes
Income in Terra Bella
Income Overview in Terra Bella
Per Capita Income in Terra Bella is $16,013, while median incomes of families and households are $29,091 and $25,370 respectively.
| Characteristic | Number | Measure |
| Per Capita Income | 1,806 | $16,013 |
| Median Family Income | 428 | $29,091 |
| Mean Family Income | 428 | $55,969 |
| Median Household Income | 560 | $25,370 |
| Mean Household Income | 560 | $50,751 |
| Income Deficit | 428 | $0 |
| Wage / Income Gap (%) | 1,806 | 33.10% |
| Wage / Income Gap ($) | 1,806 | 66.90¢ per $1 |
| Gini / Inequality Index | 1,806 | 0.55 |
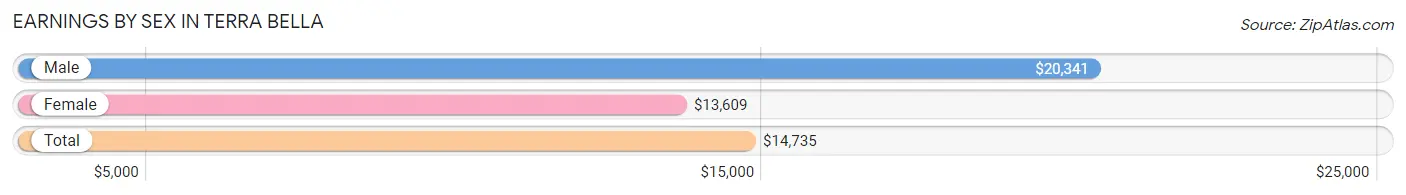
Earnings by Sex in Terra Bella
Average Earnings in Terra Bella are $14,735, $20,341 for men and $13,609 for women, a difference of 33.1%.
| Sex | Number | Average Earnings |
| Male | 445 (72.7%) | $20,341 |
| Female | 167 (27.3%) | $13,609 |
| Total | 612 (100.0%) | $14,735 |
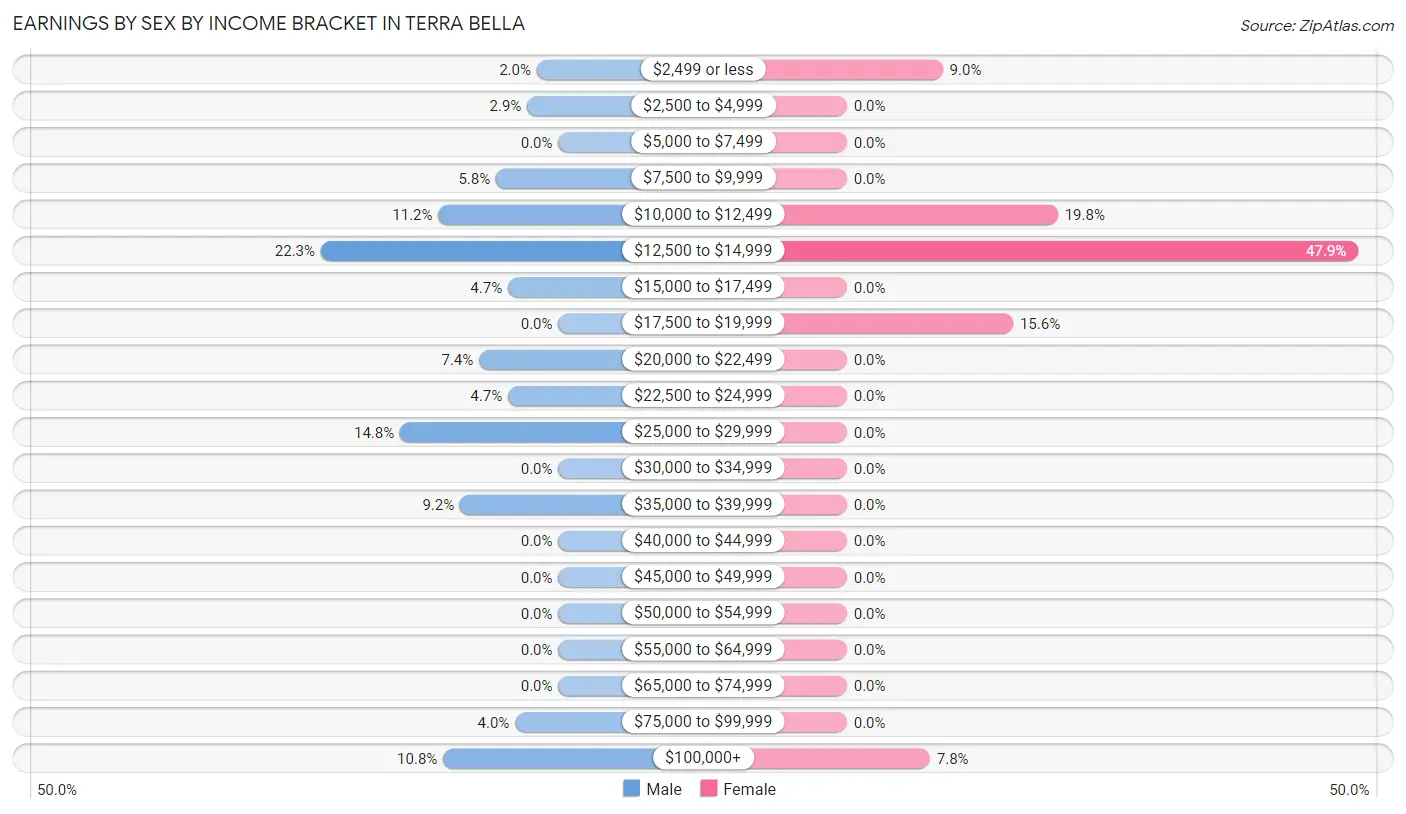
Earnings by Sex by Income Bracket in Terra Bella
The most common earnings brackets in Terra Bella are $12,500 to $14,999 for men (99 | 22.3%) and $12,500 to $14,999 for women (80 | 47.9%).
| Income | Male | Female |
| $2,499 or less | 9 (2.0%) | 15 (9.0%) |
| $2,500 to $4,999 | 13 (2.9%) | 0 (0.0%) |
| $5,000 to $7,499 | 0 (0.0%) | 0 (0.0%) |
| $7,500 to $9,999 | 26 (5.8%) | 0 (0.0%) |
| $10,000 to $12,499 | 50 (11.2%) | 33 (19.8%) |
| $12,500 to $14,999 | 99 (22.3%) | 80 (47.9%) |
| $15,000 to $17,499 | 21 (4.7%) | 0 (0.0%) |
| $17,500 to $19,999 | 0 (0.0%) | 26 (15.6%) |
| $20,000 to $22,499 | 33 (7.4%) | 0 (0.0%) |
| $22,500 to $24,999 | 21 (4.7%) | 0 (0.0%) |
| $25,000 to $29,999 | 66 (14.8%) | 0 (0.0%) |
| $30,000 to $34,999 | 0 (0.0%) | 0 (0.0%) |
| $35,000 to $39,999 | 41 (9.2%) | 0 (0.0%) |
| $40,000 to $44,999 | 0 (0.0%) | 0 (0.0%) |
| $45,000 to $49,999 | 0 (0.0%) | 0 (0.0%) |
| $50,000 to $54,999 | 0 (0.0%) | 0 (0.0%) |
| $55,000 to $64,999 | 0 (0.0%) | 0 (0.0%) |
| $65,000 to $74,999 | 0 (0.0%) | 0 (0.0%) |
| $75,000 to $99,999 | 18 (4.0%) | 0 (0.0%) |
| $100,000+ | 48 (10.8%) | 13 (7.8%) |
| Total | 445 (100.0%) | 167 (100.0%) |
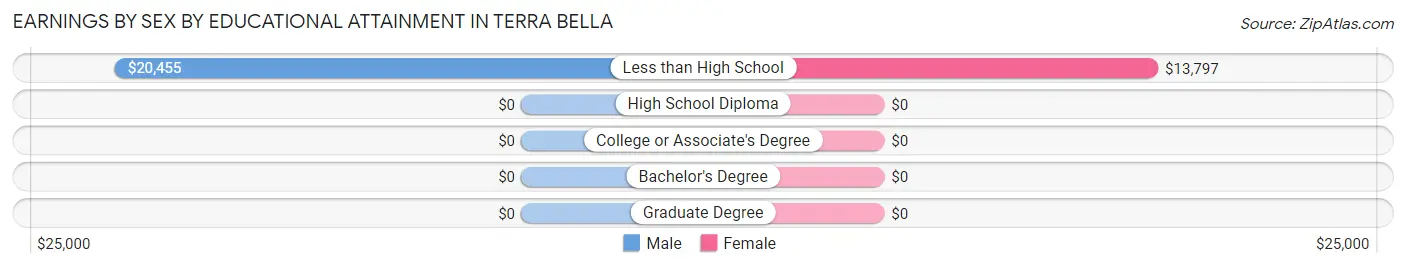
Earnings by Sex by Educational Attainment in Terra Bella
Average earnings in Terra Bella are $21,136 for men and $13,750 for women, a difference of 34.9%. Men with an educational attainment of less than high school enjoy the highest average annual earnings of $20,455, while those with less than high school education earn the least with $20,455. Women with an educational attainment of less than high school earn the most with the average annual earnings of $13,797, while those with less than high school education have the smallest earnings of $13,797.
| Educational Attainment | Male Income | Female Income |
| Less than High School | $20,455 | $13,797 |
| High School Diploma | - | - |
| College or Associate's Degree | - | - |
| Bachelor's Degree | - | - |
| Graduate Degree | - | - |
| Total | $21,136 | $13,750 |
Family Income in Terra Bella
Family Income Brackets in Terra Bella
According to the Terra Bella family income data, there are 78 families falling into the $10,000 to $14,999 income range, which is the most common income bracket and makes up 18.2% of all families.
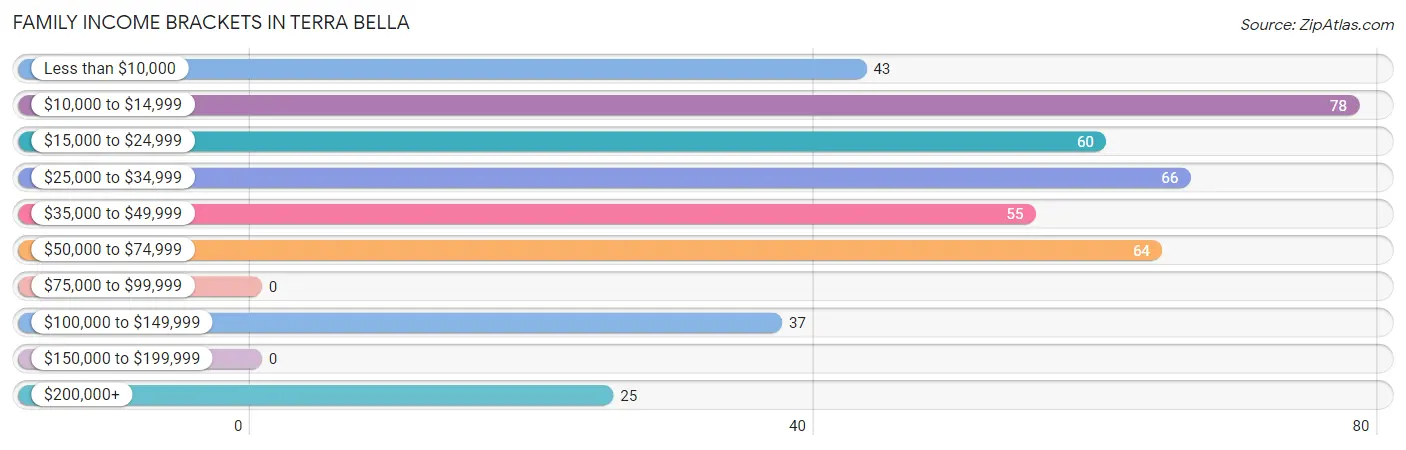
| Income Bracket | # Families | % Families |
| Less than $10,000 | 43 | 10.0% |
| $10,000 to $14,999 | 78 | 18.2% |
| $15,000 to $24,999 | 60 | 14.0% |
| $25,000 to $34,999 | 66 | 15.4% |
| $35,000 to $49,999 | 55 | 12.9% |
| $50,000 to $74,999 | 64 | 15.0% |
| $75,000 to $99,999 | 0 | 0.0% |
| $100,000 to $149,999 | 37 | 8.6% |
| $150,000 to $199,999 | 0 | 0.0% |
| $200,000+ | 25 | 5.8% |
Family Income by Famaliy Size in Terra Bella
4-person families (162 | 37.9%) account for the highest median family income in Terra Bella with $23,690 per family, while 2-person families (125 | 29.2%) have the highest median income of $11,724 per family member.
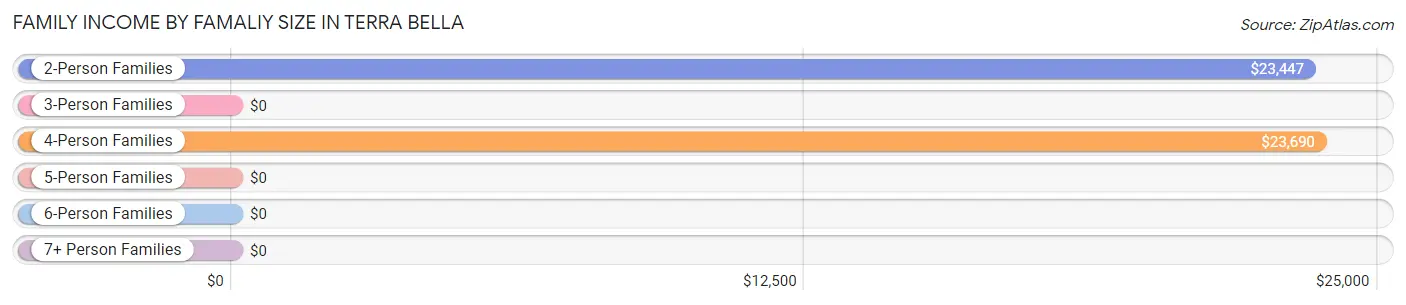
| Income Bracket | # Families | Median Income |
| 2-Person Families | 125 (29.2%) | $23,447 |
| 3-Person Families | 53 (12.4%) | $0 |
| 4-Person Families | 162 (37.9%) | $23,690 |
| 5-Person Families | 58 (13.6%) | $0 |
| 6-Person Families | 24 (5.6%) | $0 |
| 7+ Person Families | 6 (1.4%) | $0 |
| Total | 428 (100.0%) | $29,091 |
Family Income by Number of Earners in Terra Bella
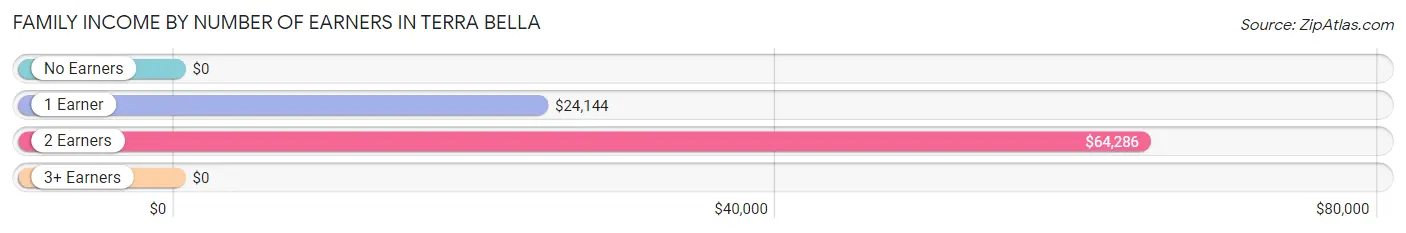
| Number of Earners | # Families | Median Income |
| No Earners | 81 (18.9%) | $0 |
| 1 Earner | 209 (48.8%) | $24,144 |
| 2 Earners | 138 (32.2%) | $64,286 |
| 3+ Earners | 0 (0.0%) | $0 |
| Total | 428 (100.0%) | $29,091 |
Household Income in Terra Bella
Household Income Brackets in Terra Bella
With 135 households falling in the category, the $10,000 to $14,999 income range is the most frequent in Terra Bella, accounting for 24.1% of all households.
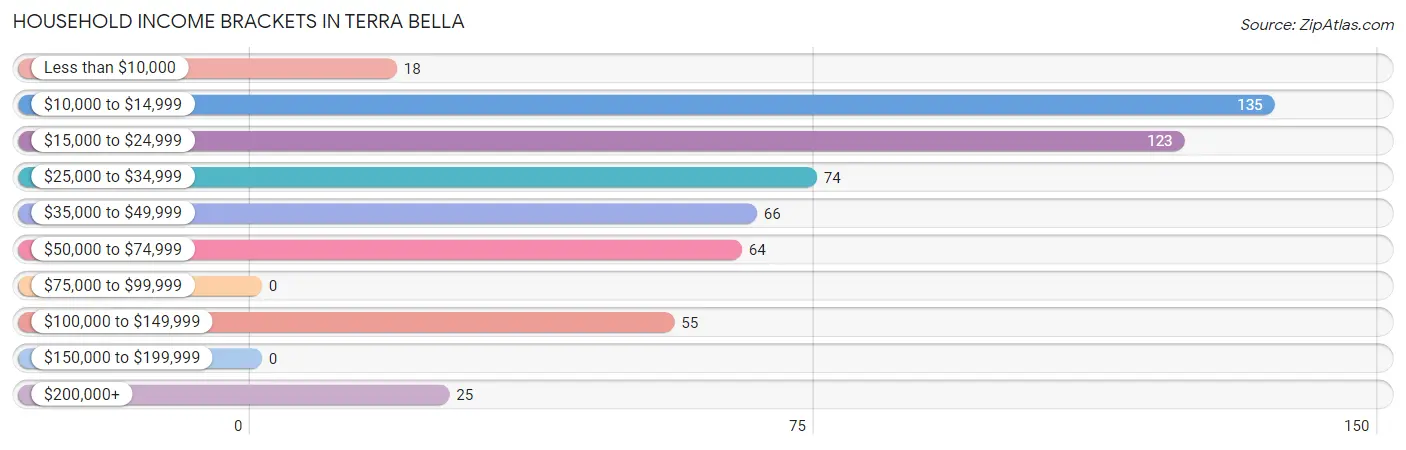
| Income Bracket | # Households | % Households |
| Less than $10,000 | 18 | 3.2% |
| $10,000 to $14,999 | 135 | 24.1% |
| $15,000 to $24,999 | 123 | 22.0% |
| $25,000 to $34,999 | 74 | 13.2% |
| $35,000 to $49,999 | 66 | 11.8% |
| $50,000 to $74,999 | 64 | 11.4% |
| $75,000 to $99,999 | 0 | 0.0% |
| $100,000 to $149,999 | 55 | 9.8% |
| $150,000 to $199,999 | 0 | 0.0% |
| $200,000+ | 25 | 4.5% |
Household Income by Householder Age in Terra Bella
The median household income in Terra Bella is $25,370, with the highest median household income of $22,803 found in the 25 to 44 years age bracket for the primary householder. A total of 360 households (64.3%) fall into this category. Meanwhile, the 15 to 24 years age bracket for the primary householder has the lowest median household income of $0, with 21 households (3.7%) in this group.
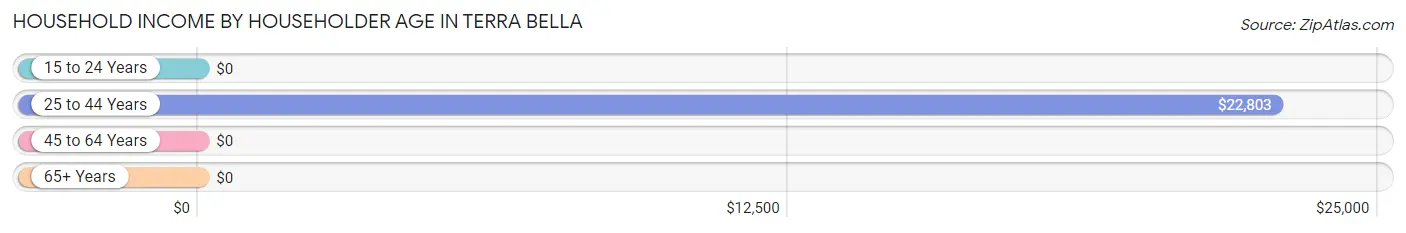
| Income Bracket | # Households | Median Income |
| 15 to 24 Years | 21 (3.7%) | $0 |
| 25 to 44 Years | 360 (64.3%) | $22,803 |
| 45 to 64 Years | 95 (17.0%) | $0 |
| 65+ Years | 84 (15.0%) | $0 |
| Total | 560 (100.0%) | $25,370 |
Poverty in Terra Bella
Income Below Poverty by Sex and Age in Terra Bella
With 44.6% poverty level for males and 42.1% for females among the residents of Terra Bella, under 5 year old males and 45 to 54 year old females are the most vulnerable to poverty, with 40 males (100.0%) and 33 females (100.0%) in their respective age groups living below the poverty level.
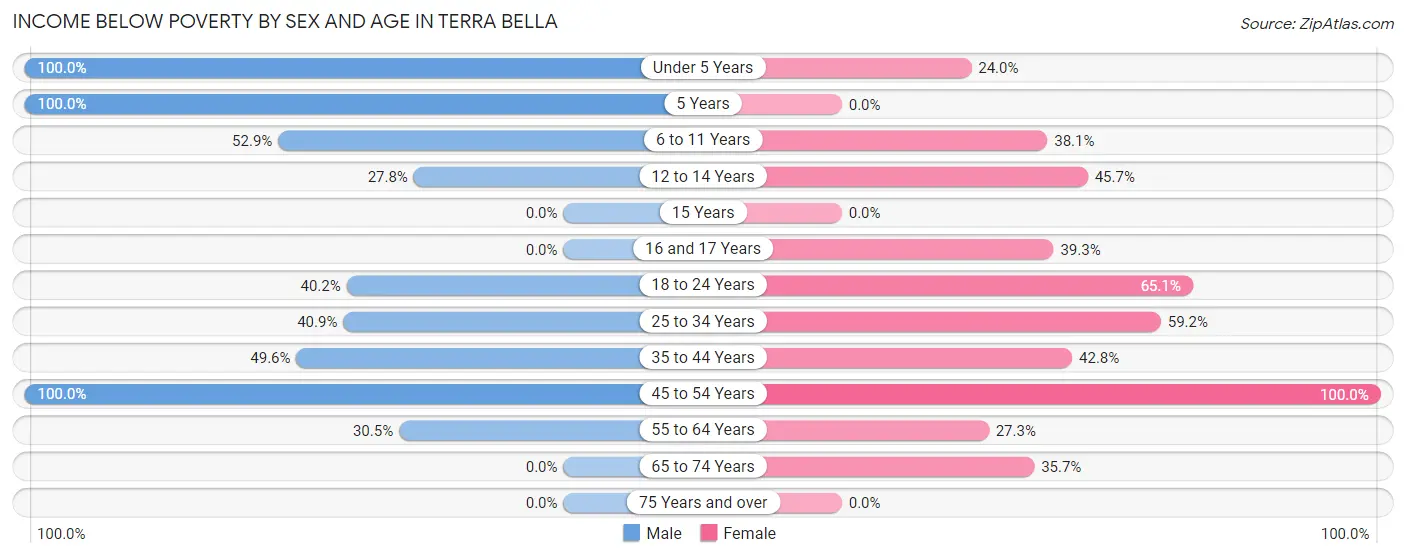
| Age Bracket | Male | Female |
| Under 5 Years | 40 (100.0%) | 25 (24.0%) |
| 5 Years | 6 (100.0%) | 0 (0.0%) |
| 6 to 11 Years | 90 (52.9%) | 45 (38.1%) |
| 12 to 14 Years | 10 (27.8%) | 21 (45.7%) |
| 15 Years | 0 (0.0%) | 0 (0.0%) |
| 16 and 17 Years | 0 (0.0%) | 11 (39.3%) |
| 18 to 24 Years | 33 (40.2%) | 99 (65.1%) |
| 25 to 34 Years | 76 (40.9%) | 45 (59.2%) |
| 35 to 44 Years | 112 (49.6%) | 56 (42.7%) |
| 45 to 54 Years | 34 (100.0%) | 33 (100.0%) |
| 55 to 64 Years | 18 (30.5%) | 15 (27.3%) |
| 65 to 74 Years | 0 (0.0%) | 15 (35.7%) |
| 75 Years and over | 0 (0.0%) | 0 (0.0%) |
| Total | 419 (44.6%) | 365 (42.1%) |
Income Above Poverty by Sex and Age in Terra Bella
According to the poverty statistics in Terra Bella, males aged 15 years and females aged 15 years are the age groups that are most secure financially, with 100.0% of males and 100.0% of females in these age groups living above the poverty line.
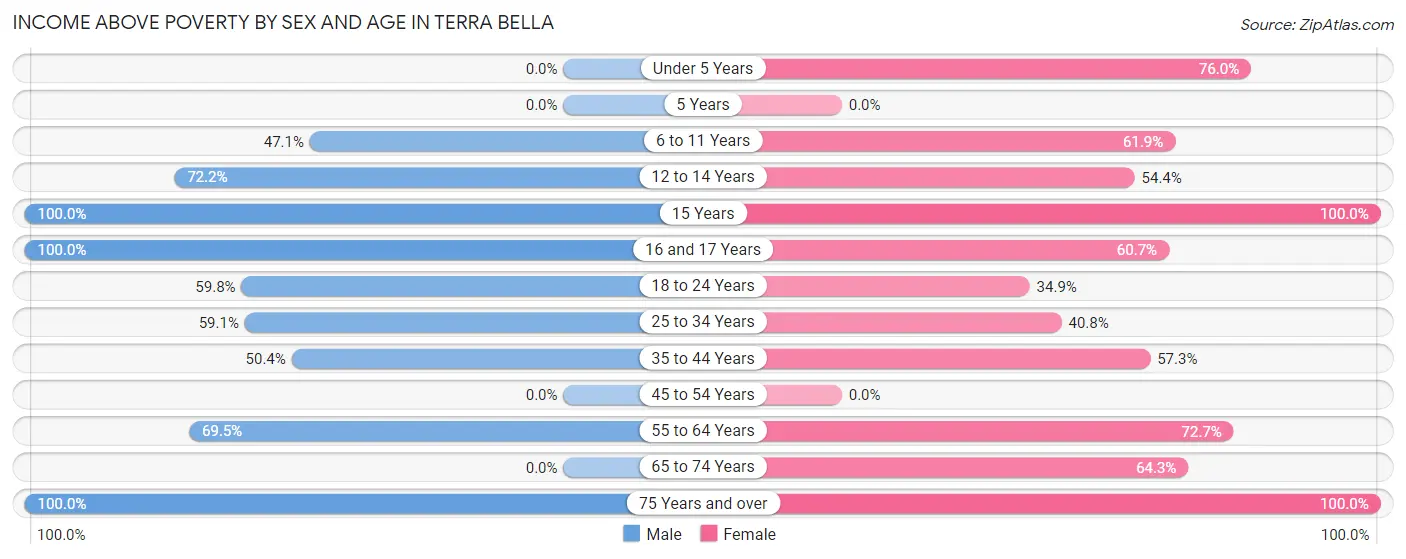
| Age Bracket | Male | Female |
| Under 5 Years | 0 (0.0%) | 79 (76.0%) |
| 5 Years | 0 (0.0%) | 0 (0.0%) |
| 6 to 11 Years | 80 (47.1%) | 73 (61.9%) |
| 12 to 14 Years | 26 (72.2%) | 25 (54.3%) |
| 15 Years | 27 (100.0%) | 33 (100.0%) |
| 16 and 17 Years | 26 (100.0%) | 17 (60.7%) |
| 18 to 24 Years | 49 (59.8%) | 53 (34.9%) |
| 25 to 34 Years | 110 (59.1%) | 31 (40.8%) |
| 35 to 44 Years | 114 (50.4%) | 75 (57.3%) |
| 45 to 54 Years | 0 (0.0%) | 0 (0.0%) |
| 55 to 64 Years | 41 (69.5%) | 40 (72.7%) |
| 65 to 74 Years | 0 (0.0%) | 27 (64.3%) |
| 75 Years and over | 48 (100.0%) | 48 (100.0%) |
| Total | 521 (55.4%) | 501 (57.9%) |
Income Below Poverty Among Married-Couple Families in Terra Bella
The poverty statistics for married-couple families in Terra Bella show that 48.9% or 139 of the total 284 families live below the poverty line. Families with no children have the highest poverty rate of 66.7%, comprising of 50 families. On the other hand, families with 3 or 4 children have the lowest poverty rate of 0.0%, which includes 0 families.
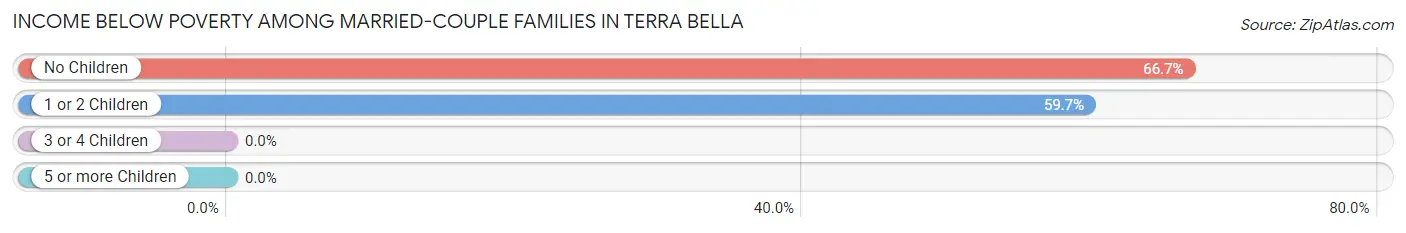
| Children | Above Poverty | Below Poverty |
| No Children | 25 (33.3%) | 50 (66.7%) |
| 1 or 2 Children | 60 (40.3%) | 89 (59.7%) |
| 3 or 4 Children | 60 (100.0%) | 0 (0.0%) |
| 5 or more Children | 0 (0.0%) | 0 (0.0%) |
| Total | 145 (51.1%) | 139 (48.9%) |
Income Below Poverty Among Single-Parent Households in Terra Bella
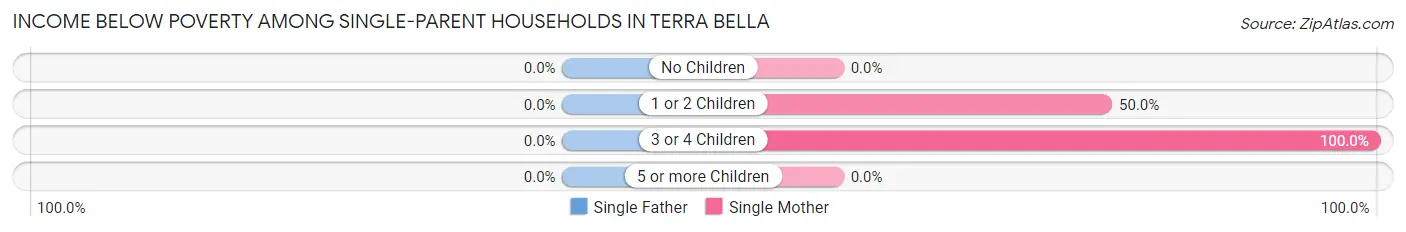
| Children | Single Father | Single Mother |
| No Children | 0 (0.0%) | 0 (0.0%) |
| 1 or 2 Children | 0 (0.0%) | 25 (50.0%) |
| 3 or 4 Children | 0 (0.0%) | 6 (100.0%) |
| 5 or more Children | 0 (0.0%) | 0 (0.0%) |
| Total | 0 (0.0%) | 31 (33.0%) |
Income Below Poverty Among Married-Couple vs Single-Parent Households in Terra Bella
The poverty data for Terra Bella shows that 139 of the married-couple family households (48.9%) and 31 of the single-parent households (21.5%) are living below the poverty level. Within the married-couple family households, those with no children have the highest poverty rate, with 50 households (66.7%) falling below the poverty line. Among the single-parent households, those with 3 or 4 children have the highest poverty rate, with 6 household (100.0%) living below poverty.
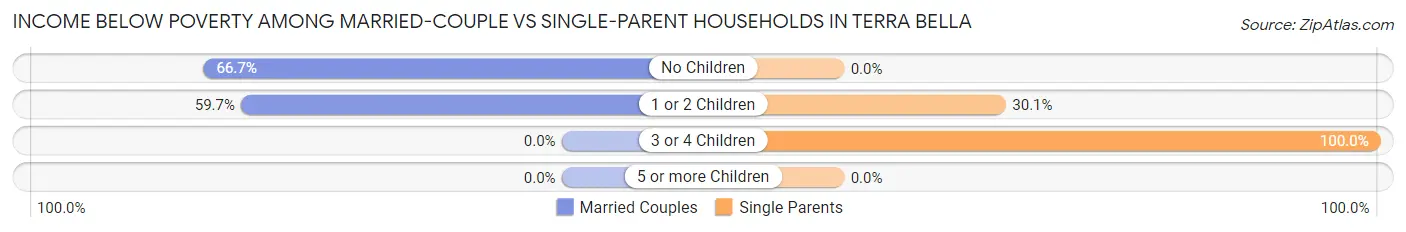
| Children | Married-Couple Families | Single-Parent Households |
| No Children | 50 (66.7%) | 0 (0.0%) |
| 1 or 2 Children | 89 (59.7%) | 25 (30.1%) |
| 3 or 4 Children | 0 (0.0%) | 6 (100.0%) |
| 5 or more Children | 0 (0.0%) | 0 (0.0%) |
| Total | 139 (48.9%) | 31 (21.5%) |
Race in Terra Bella
The most populous races in Terra Bella are Hispanic or Latino (1,482 | 82.1%), White / Caucasian (1,155 | 63.9%), and Some other Race (530 | 29.3%).
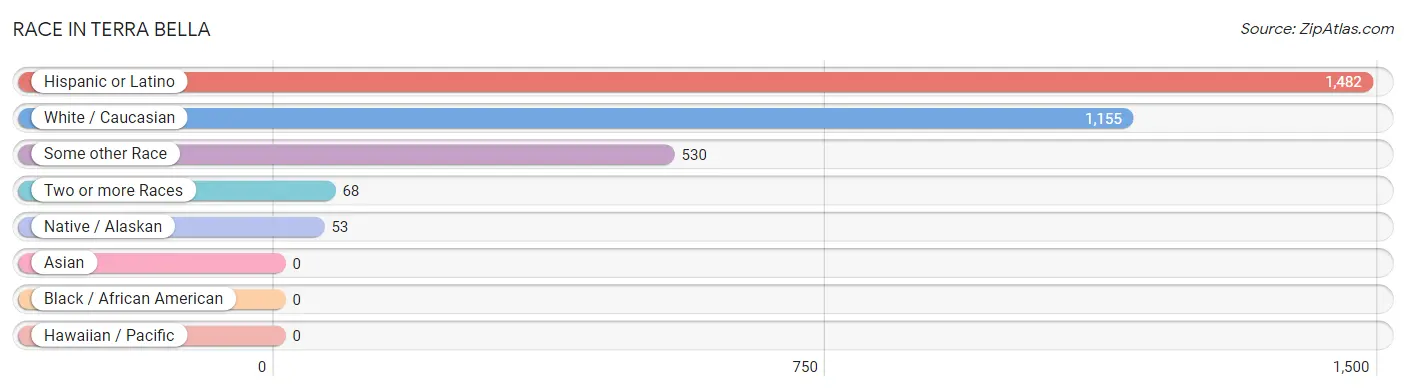
| Race | # Population | % Population |
| Asian | 0 | 0.0% |
| Black / African American | 0 | 0.0% |
| Hawaiian / Pacific | 0 | 0.0% |
| Hispanic or Latino | 1,482 | 82.1% |
| Native / Alaskan | 53 | 2.9% |
| White / Caucasian | 1,155 | 63.9% |
| Two or more Races | 68 | 3.8% |
| Some other Race | 530 | 29.3% |
| Total | 1,806 | 100.0% |
Ancestry in Terra Bella
The most populous ancestries reported in Terra Bella are Mexican (1,464 | 81.1%), English (168 | 9.3%), Irish (70 | 3.9%), German (13 | 0.7%), and Scotch-Irish (13 | 0.7%), together accounting for 95.7% of all Terra Bella residents.
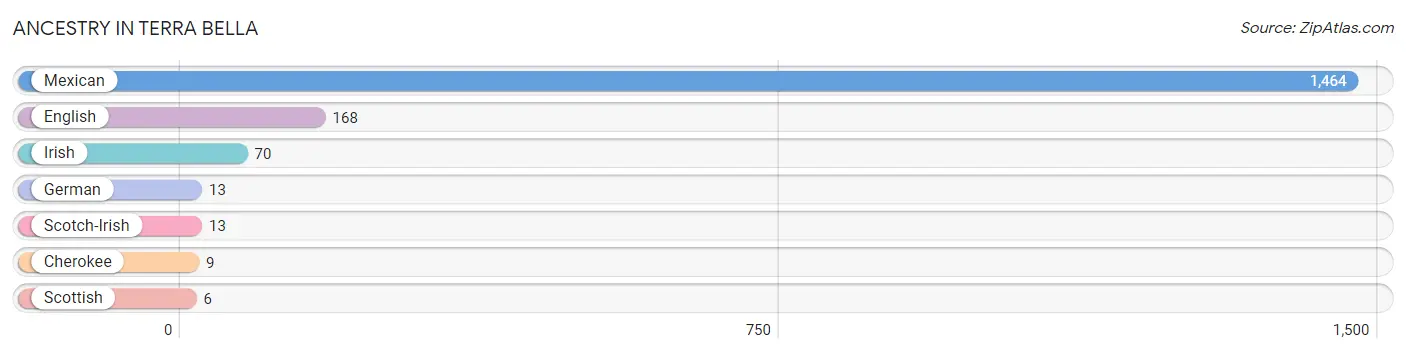
| Ancestry | # Population | % Population |
| Cherokee | 9 | 0.5% |
| English | 168 | 9.3% |
| German | 13 | 0.7% |
| Irish | 70 | 3.9% |
| Mexican | 1,464 | 81.1% |
| Scotch-Irish | 13 | 0.7% |
| Scottish | 6 | 0.3% | View All 7 Rows |
Immigrants in Terra Bella
The most numerous immigrant groups reported in Terra Bella came from Central America (705 | 39.0%), Latin America (705 | 39.0%), and Mexico (705 | 39.0%), together accounting for 117.1% of all Terra Bella residents.
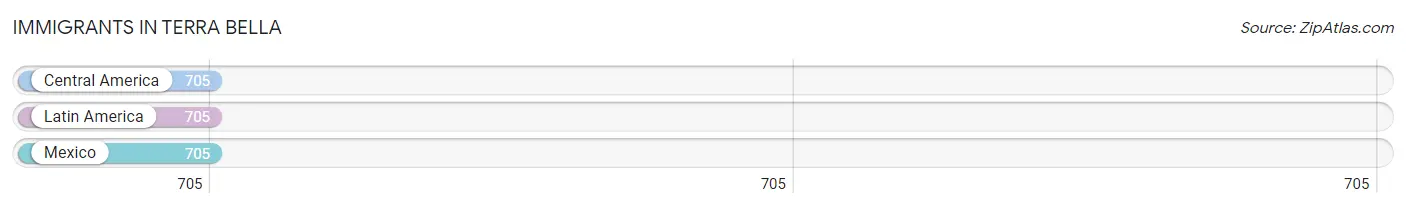
| Immigration Origin | # Population | % Population |
| Central America | 705 | 39.0% |
| Latin America | 705 | 39.0% |
| Mexico | 705 | 39.0% | View All 3 Rows |
Sex and Age in Terra Bella
Sex and Age in Terra Bella
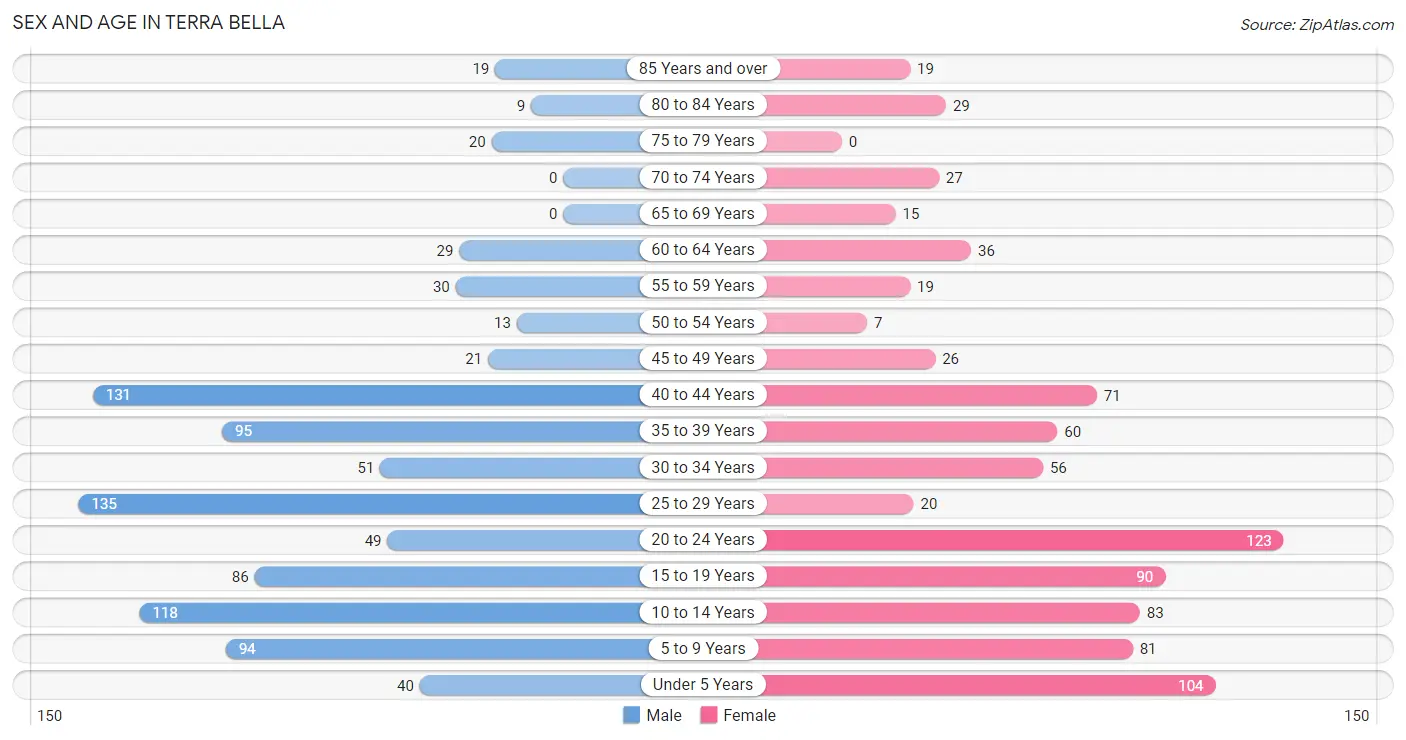
The most populous age groups in Terra Bella are 25 to 29 Years (135 | 14.4%) for men and 20 to 24 Years (123 | 14.2%) for women.
| Age Bracket | Male | Female |
| Under 5 Years | 40 (4.3%) | 104 (12.0%) |
| 5 to 9 Years | 94 (10.0%) | 81 (9.3%) |
| 10 to 14 Years | 118 (12.6%) | 83 (9.6%) |
| 15 to 19 Years | 86 (9.1%) | 90 (10.4%) |
| 20 to 24 Years | 49 (5.2%) | 123 (14.2%) |
| 25 to 29 Years | 135 (14.4%) | 20 (2.3%) |
| 30 to 34 Years | 51 (5.4%) | 56 (6.5%) |
| 35 to 39 Years | 95 (10.1%) | 60 (6.9%) |
| 40 to 44 Years | 131 (13.9%) | 71 (8.2%) |
| 45 to 49 Years | 21 (2.2%) | 26 (3.0%) |
| 50 to 54 Years | 13 (1.4%) | 7 (0.8%) |
| 55 to 59 Years | 30 (3.2%) | 19 (2.2%) |
| 60 to 64 Years | 29 (3.1%) | 36 (4.2%) |
| 65 to 69 Years | 0 (0.0%) | 15 (1.7%) |
| 70 to 74 Years | 0 (0.0%) | 27 (3.1%) |
| 75 to 79 Years | 20 (2.1%) | 0 (0.0%) |
| 80 to 84 Years | 9 (1.0%) | 29 (3.4%) |
| 85 Years and over | 19 (2.0%) | 19 (2.2%) |
| Total | 940 (100.0%) | 866 (100.0%) |
Families and Households in Terra Bella
Median Family Size in Terra Bella
The median family size in Terra Bella is 3.77 persons per family, with single female/mother families (94 | 22.0%) accounting for the largest median family size of 4.32 persons per family. On the other hand, single male/father families (50 | 11.7%) represent the smallest median family size with 2.12 persons per family.
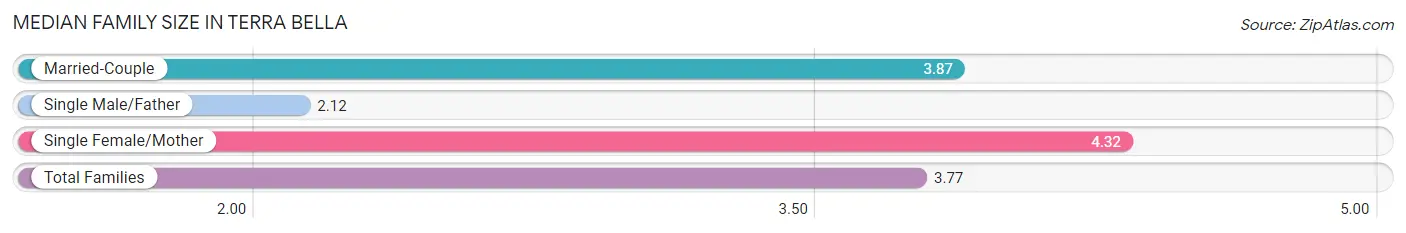
| Family Type | # Families | Family Size |
| Married-Couple | 284 (66.4%) | 3.87 |
| Single Male/Father | 50 (11.7%) | 2.12 |
| Single Female/Mother | 94 (22.0%) | 4.32 |
| Total Families | 428 (100.0%) | 3.77 |
Median Household Size in Terra Bella
The median household size in Terra Bella is 3.18 persons per household, with single female/mother households (94 | 16.8%) accounting for the largest median household size of 4.66 persons per household. non-family households (132 | 23.6%) represent the smallest median household size with 1.05 persons per household.
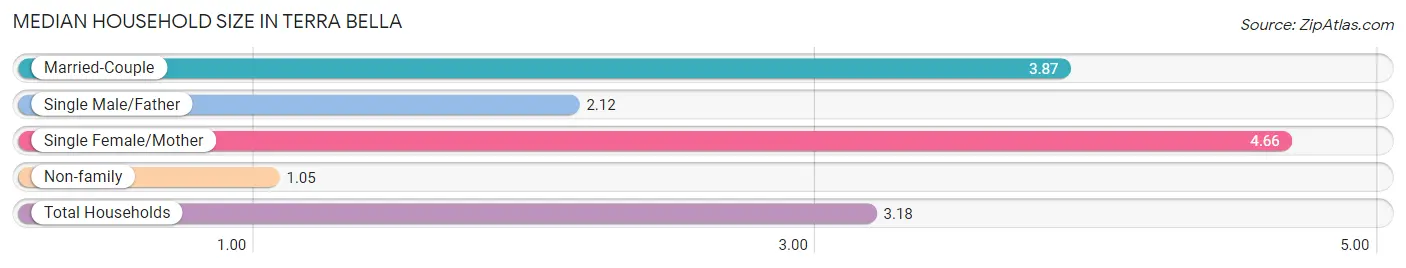
| Household Type | # Households | Household Size |
| Married-Couple | 284 (50.7%) | 3.87 |
| Single Male/Father | 50 (8.9%) | 2.12 |
| Single Female/Mother | 94 (16.8%) | 4.66 |
| Non-family | 132 (23.6%) | 1.05 |
| Total Households | 560 (100.0%) | 3.18 |
Household Size by Marriage Status in Terra Bella
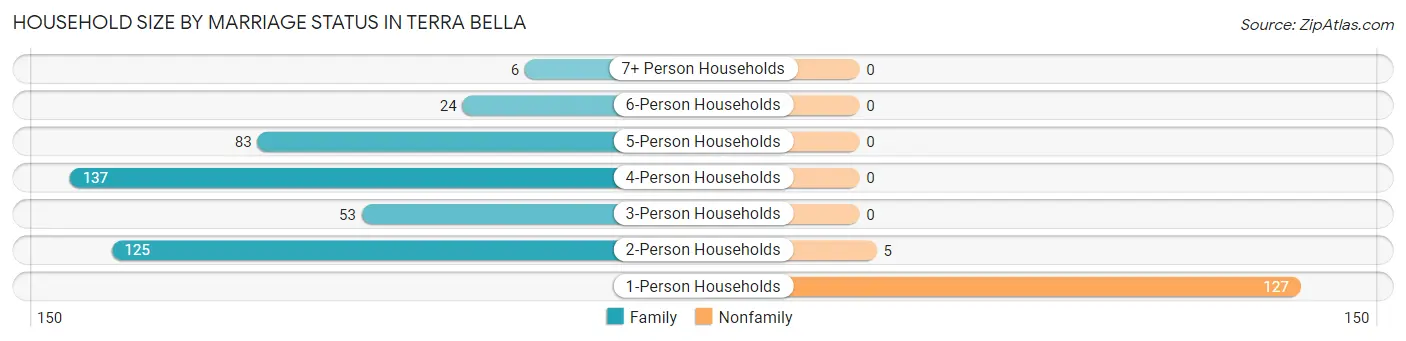
Out of a total of 560 households in Terra Bella, 428 (76.4%) are family households, while 132 (23.6%) are nonfamily households. The most numerous type of family households are 4-person households, comprising 137, and the most common type of nonfamily households are 1-person households, comprising 127.
| Household Size | Family Households | Nonfamily Households |
| 1-Person Households | - | 127 (22.7%) |
| 2-Person Households | 125 (22.3%) | 5 (0.9%) |
| 3-Person Households | 53 (9.5%) | 0 (0.0%) |
| 4-Person Households | 137 (24.5%) | 0 (0.0%) |
| 5-Person Households | 83 (14.8%) | 0 (0.0%) |
| 6-Person Households | 24 (4.3%) | 0 (0.0%) |
| 7+ Person Households | 6 (1.1%) | 0 (0.0%) |
| Total | 428 (76.4%) | 132 (23.6%) |
Female Fertility in Terra Bella
Fertility by Age in Terra Bella
| Age Bracket | Women with Births | Births / 1,000 Women |
| 15 to 19 years | 0 (0.0%) | 0.0 |
| 20 to 34 years | 0 (0.0%) | 0.0 |
| 35 to 50 years | 0 (0.0%) | 0.0 |
| Total | 0 (0.0%) | 0.0 |
Fertility by Age by Marriage Status in Terra Bella
| Age Bracket | Married | Unmarried |
| 15 to 19 years | 0 (0.0%) | 0 (0.0%) |
| 20 to 34 years | 0 (0.0%) | 0 (0.0%) |
| 35 to 50 years | 0 (0.0%) | 0 (0.0%) |
| Total | 0 (0.0%) | 0 (0.0%) |
Fertility by Education in Terra Bella
| Educational Attainment | Women with Births | Births / 1,000 Women |
| Less than High School | 0 (0.0%) | 0.0 |
| High School Diploma | 0 (0.0%) | 0.0 |
| College or Associate's Degree | 0 (0.0%) | 0.0 |
| Bachelor's Degree | 0 (0.0%) | 0.0 |
| Graduate Degree | 0 (0.0%) | 0.0 |
| Total | 0 (0.0%) | 0.0 |
Fertility by Education by Marriage Status in Terra Bella
| Educational Attainment | Married | Unmarried |
| Less than High School | 0 (0.0%) | 0 (0.0%) |
| High School Diploma | 0 (0.0%) | 0 (0.0%) |
| College or Associate's Degree | 0 (0.0%) | 0 (0.0%) |
| Bachelor's Degree | 0 (0.0%) | 0 (0.0%) |
| Graduate Degree | 0 (0.0%) | 0 (0.0%) |
| Total | 0 (0.0%) | 0 (0.0%) |
Employment Characteristics in Terra Bella
Employment by Class of Employer in Terra Bella
Among the 352 employed individuals in Terra Bella, private company employees (177 | 50.3%), self-employed (not incorporated) (107 | 30.4%), and not-for-profit organizations (31 | 8.8%) make up the most common classes of employment.
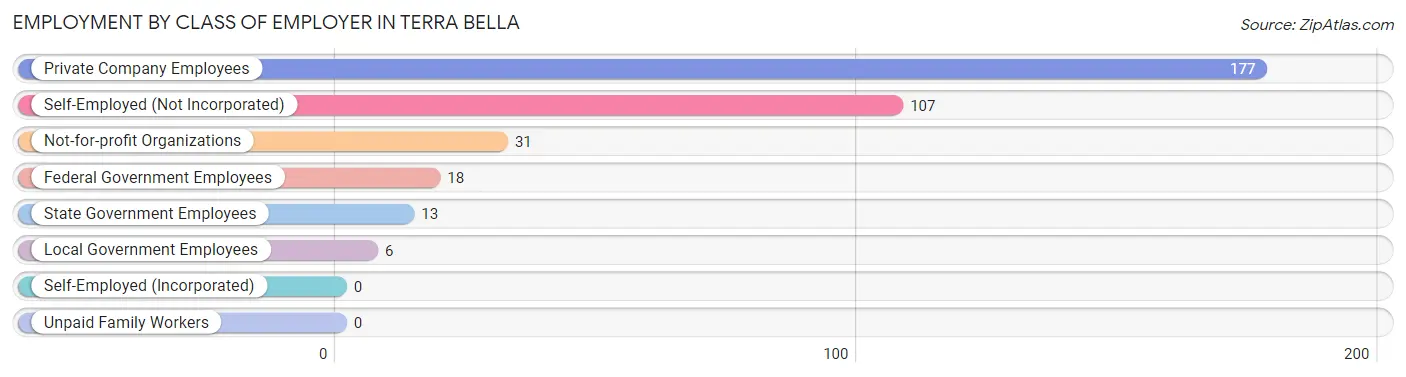
| Employer Class | # Employees | % Employees |
| Private Company Employees | 177 | 50.3% |
| Self-Employed (Incorporated) | 0 | 0.0% |
| Self-Employed (Not Incorporated) | 107 | 30.4% |
| Not-for-profit Organizations | 31 | 8.8% |
| Local Government Employees | 6 | 1.7% |
| State Government Employees | 13 | 3.7% |
| Federal Government Employees | 18 | 5.1% |
| Unpaid Family Workers | 0 | 0.0% |
| Total | 352 | 100.0% |
Employment Status by Age in Terra Bella
According to the labor force statistics for Terra Bella, out of the total population over 16 years of age (1,226), 47.0% or 576 individuals are in the labor force, with 38.9% or 224 of them unemployed. The age group with the highest labor force participation rate is 55 to 59 years, with 100.0% or 49 individuals in the labor force. Within the labor force, the 30 to 34 years age range has the highest percentage of unemployed individuals, with 74.3% or 52 of them being unemployed.
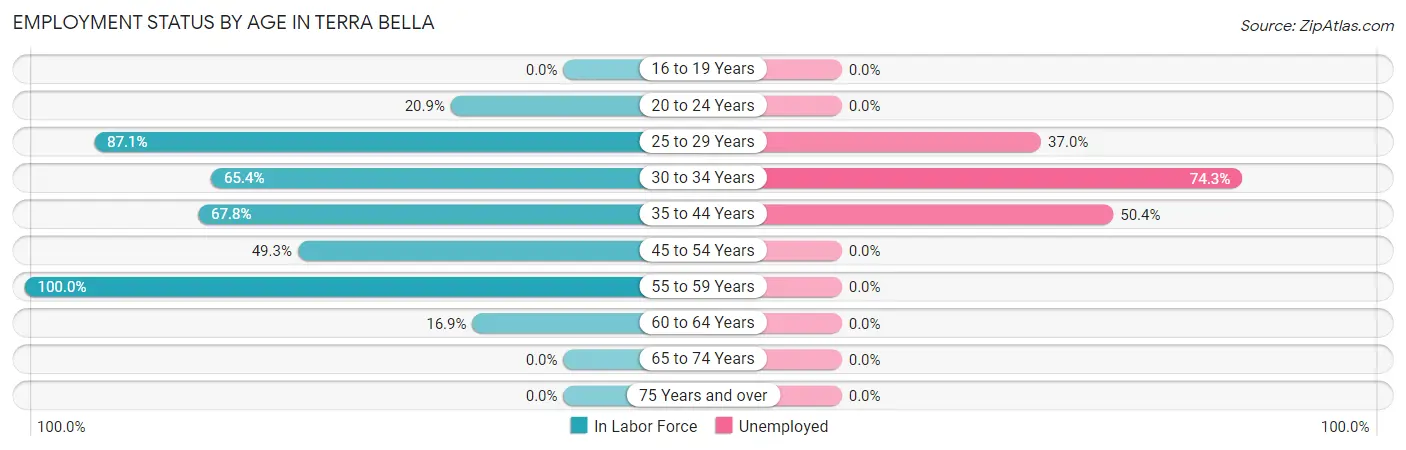
| Age Bracket | In Labor Force | Unemployed |
| 16 to 19 Years | 0 (0.0%) | 0 (0.0%) |
| 20 to 24 Years | 36 (20.9%) | 0 (0.0%) |
| 25 to 29 Years | 135 (87.1%) | 50 (37.0%) |
| 30 to 34 Years | 70 (65.4%) | 52 (74.3%) |
| 35 to 44 Years | 242 (67.8%) | 122 (50.4%) |
| 45 to 54 Years | 33 (49.3%) | 0 (0.0%) |
| 55 to 59 Years | 49 (100.0%) | 0 (0.0%) |
| 60 to 64 Years | 11 (16.9%) | 0 (0.0%) |
| 65 to 74 Years | 0 (0.0%) | 0 (0.0%) |
| 75 Years and over | 0 (0.0%) | 0 (0.0%) |
| Total | 576 (47.0%) | 224 (38.9%) |
Employment Status by Educational Attainment in Terra Bella
According to labor force statistics for Terra Bella, 67.5% of individuals (540) out of the total population between 25 and 64 years of age (800) are in the labor force, with 41.5% or 224 of them being unemployed. The group with the highest labor force participation rate are those with the educational attainment of bachelor's degree or higher, with 100.0% or 13 individuals in the labor force. Within the labor force, individuals with less than high school education have the highest percentage of unemployment, with 48.5% or 174 of them being unemployed.
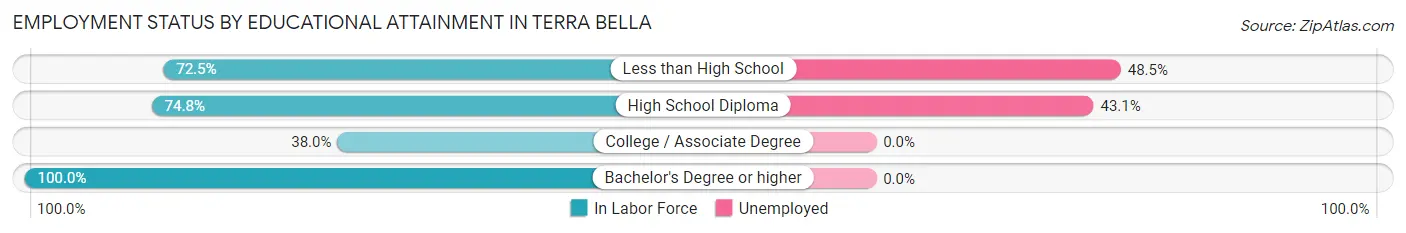
| Educational Attainment | In Labor Force | Unemployed |
| Less than High School | 359 (72.5%) | 240 (48.5%) |
| High School Diploma | 116 (74.8%) | 67 (43.1%) |
| College / Associate Degree | 52 (38.0%) | 0 (0.0%) |
| Bachelor's Degree or higher | 13 (100.0%) | 0 (0.0%) |
| Total | 540 (67.5%) | 332 (41.5%) |
Employment Occupations by Sex in Terra Bella
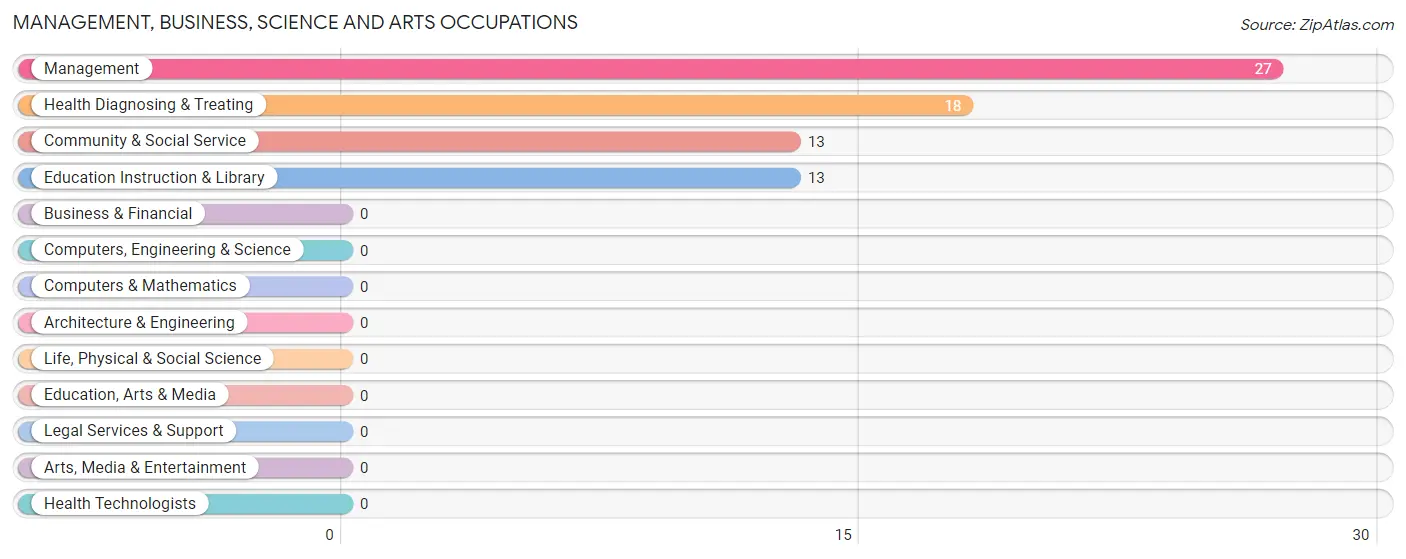
Management, Business, Science and Arts Occupations
The most common Management, Business, Science and Arts occupations in Terra Bella are Management (27 | 7.7%), Health Diagnosing & Treating (18 | 5.1%), Community & Social Service (13 | 3.7%), and Education Instruction & Library (13 | 3.7%).
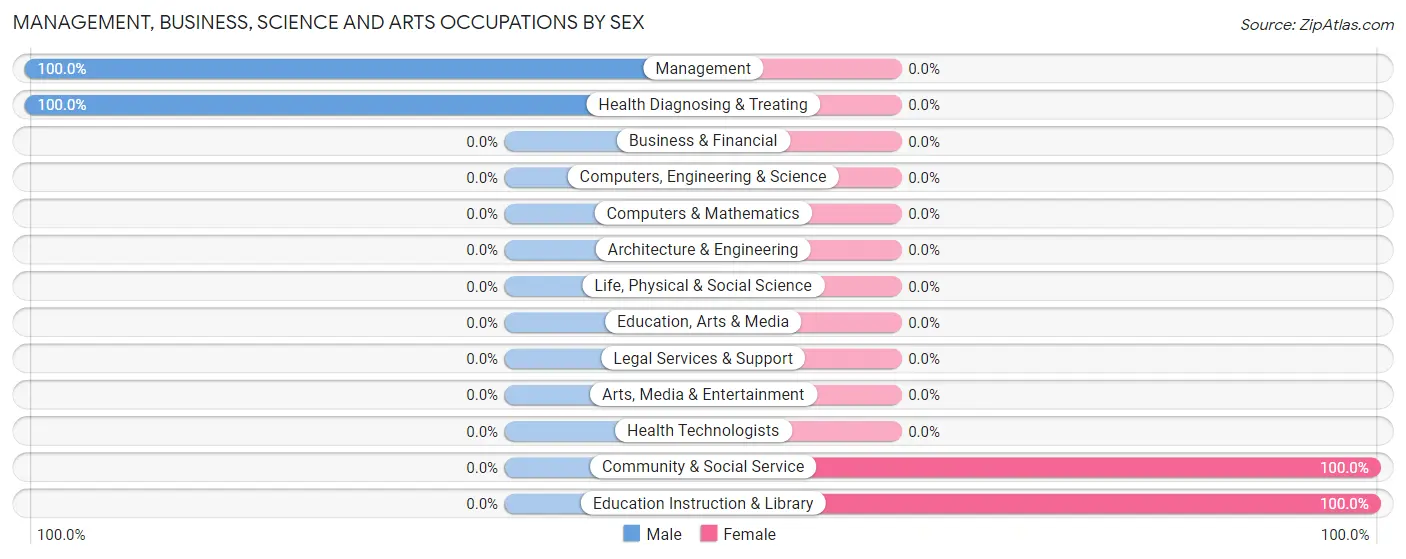
Management, Business, Science and Arts Occupations by Sex
Within the Management, Business, Science and Arts occupations in Terra Bella, the most male-oriented occupations are Management (100.0%), and Health Diagnosing & Treating (100.0%), while the most female-oriented occupations are Community & Social Service (100.0%), and Education Instruction & Library (100.0%).
| Occupation | Male | Female |
| Management | 27 (100.0%) | 0 (0.0%) |
| Business & Financial | 0 (0.0%) | 0 (0.0%) |
| Computers, Engineering & Science | 0 (0.0%) | 0 (0.0%) |
| Computers & Mathematics | 0 (0.0%) | 0 (0.0%) |
| Architecture & Engineering | 0 (0.0%) | 0 (0.0%) |
| Life, Physical & Social Science | 0 (0.0%) | 0 (0.0%) |
| Community & Social Service | 0 (0.0%) | 13 (100.0%) |
| Education, Arts & Media | 0 (0.0%) | 0 (0.0%) |
| Legal Services & Support | 0 (0.0%) | 0 (0.0%) |
| Education Instruction & Library | 0 (0.0%) | 13 (100.0%) |
| Arts, Media & Entertainment | 0 (0.0%) | 0 (0.0%) |
| Health Diagnosing & Treating | 18 (100.0%) | 0 (0.0%) |
| Health Technologists | 0 (0.0%) | 0 (0.0%) |
| Total (Category) | 45 (77.6%) | 13 (22.4%) |
| Total (Overall) | 243 (69.0%) | 109 (31.0%) |
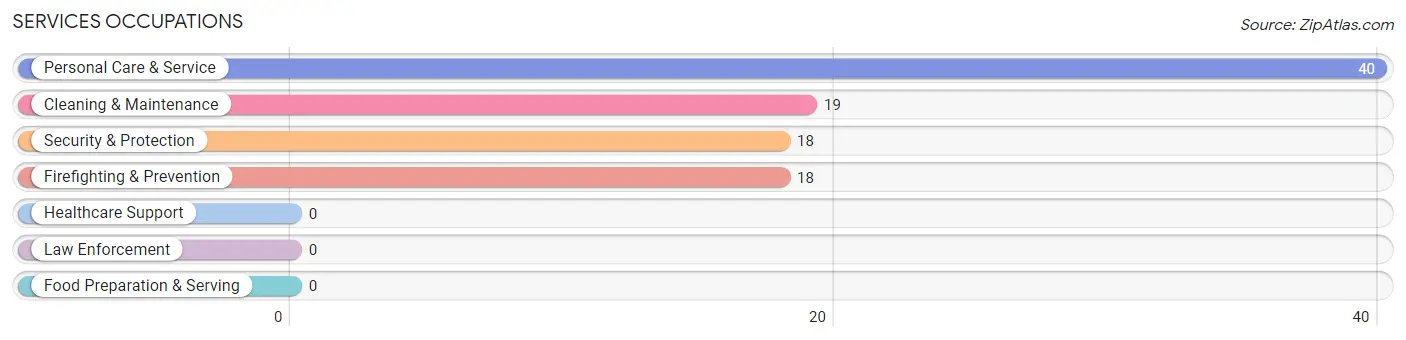
Services Occupations
The most common Services occupations in Terra Bella are Personal Care & Service (40 | 11.4%), Cleaning & Maintenance (19 | 5.4%), Security & Protection (18 | 5.1%), and Firefighting & Prevention (18 | 5.1%).
Services Occupations by Sex
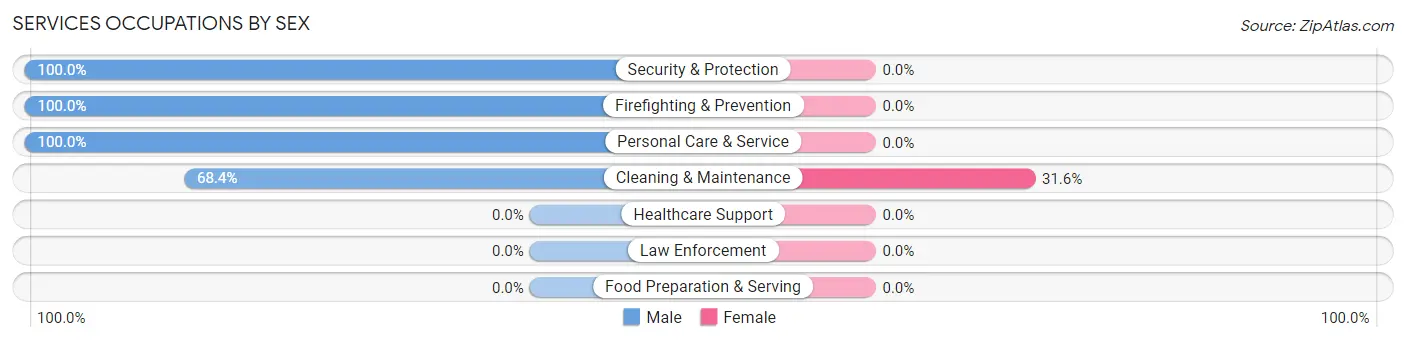
| Occupation | Male | Female |
| Healthcare Support | 0 (0.0%) | 0 (0.0%) |
| Security & Protection | 18 (100.0%) | 0 (0.0%) |
| Firefighting & Prevention | 18 (100.0%) | 0 (0.0%) |
| Law Enforcement | 0 (0.0%) | 0 (0.0%) |
| Food Preparation & Serving | 0 (0.0%) | 0 (0.0%) |
| Cleaning & Maintenance | 13 (68.4%) | 6 (31.6%) |
| Personal Care & Service | 40 (100.0%) | 0 (0.0%) |
| Total (Category) | 71 (92.2%) | 6 (7.8%) |
| Total (Overall) | 243 (69.0%) | 109 (31.0%) |
Sales and Office Occupations
The most common Sales and Office occupations in Terra Bella are , and Sales & Related (5 | 1.4%).

Sales and Office Occupations by Sex

| Occupation | Male | Female |
| Sales & Related | 5 (100.0%) | 0 (0.0%) |
| Office & Administration | 0 (0.0%) | 0 (0.0%) |
| Total (Category) | 5 (100.0%) | 0 (0.0%) |
| Total (Overall) | 243 (69.0%) | 109 (31.0%) |
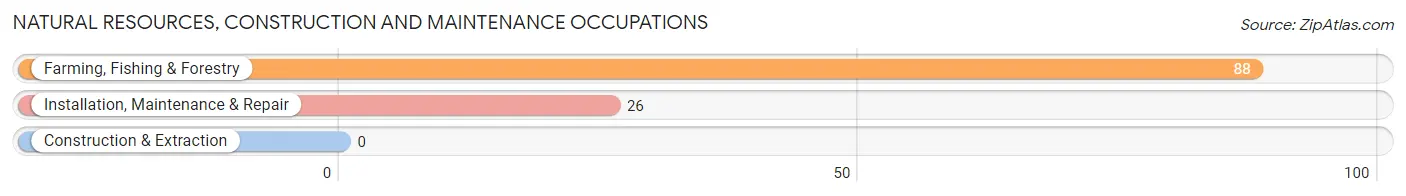
Natural Resources, Construction and Maintenance Occupations
The most common Natural Resources, Construction and Maintenance occupations in Terra Bella are Farming, Fishing & Forestry (88 | 25.0%), and Installation, Maintenance & Repair (26 | 7.4%).
Natural Resources, Construction and Maintenance Occupations by Sex
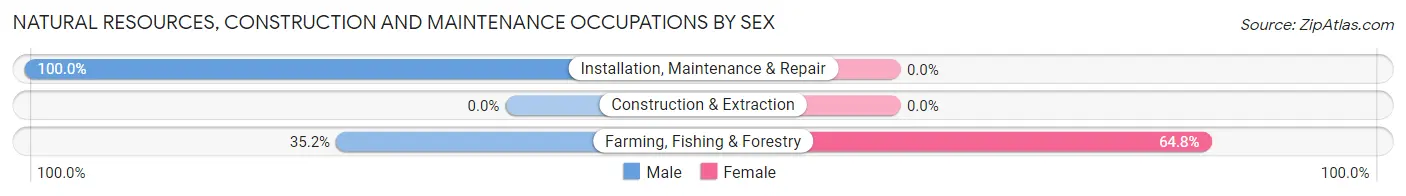
| Occupation | Male | Female |
| Farming, Fishing & Forestry | 31 (35.2%) | 57 (64.8%) |
| Construction & Extraction | 0 (0.0%) | 0 (0.0%) |
| Installation, Maintenance & Repair | 26 (100.0%) | 0 (0.0%) |
| Total (Category) | 57 (50.0%) | 57 (50.0%) |
| Total (Overall) | 243 (69.0%) | 109 (31.0%) |
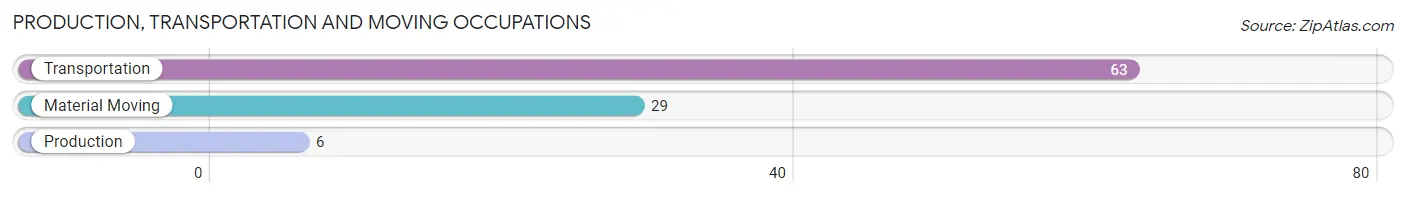
Production, Transportation and Moving Occupations
The most common Production, Transportation and Moving occupations in Terra Bella are Transportation (63 | 17.9%), Material Moving (29 | 8.2%), and Production (6 | 1.7%).
Production, Transportation and Moving Occupations by Sex
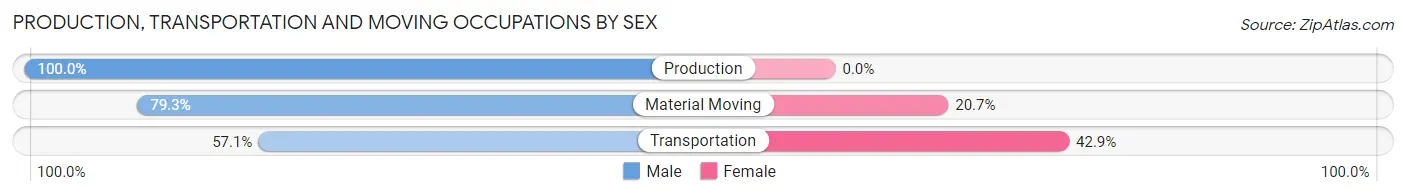
| Occupation | Male | Female |
| Production | 6 (100.0%) | 0 (0.0%) |
| Transportation | 36 (57.1%) | 27 (42.9%) |
| Material Moving | 23 (79.3%) | 6 (20.7%) |
| Total (Category) | 65 (66.3%) | 33 (33.7%) |
| Total (Overall) | 243 (69.0%) | 109 (31.0%) |
Employment Industries by Sex in Terra Bella
Employment Industries in Terra Bella
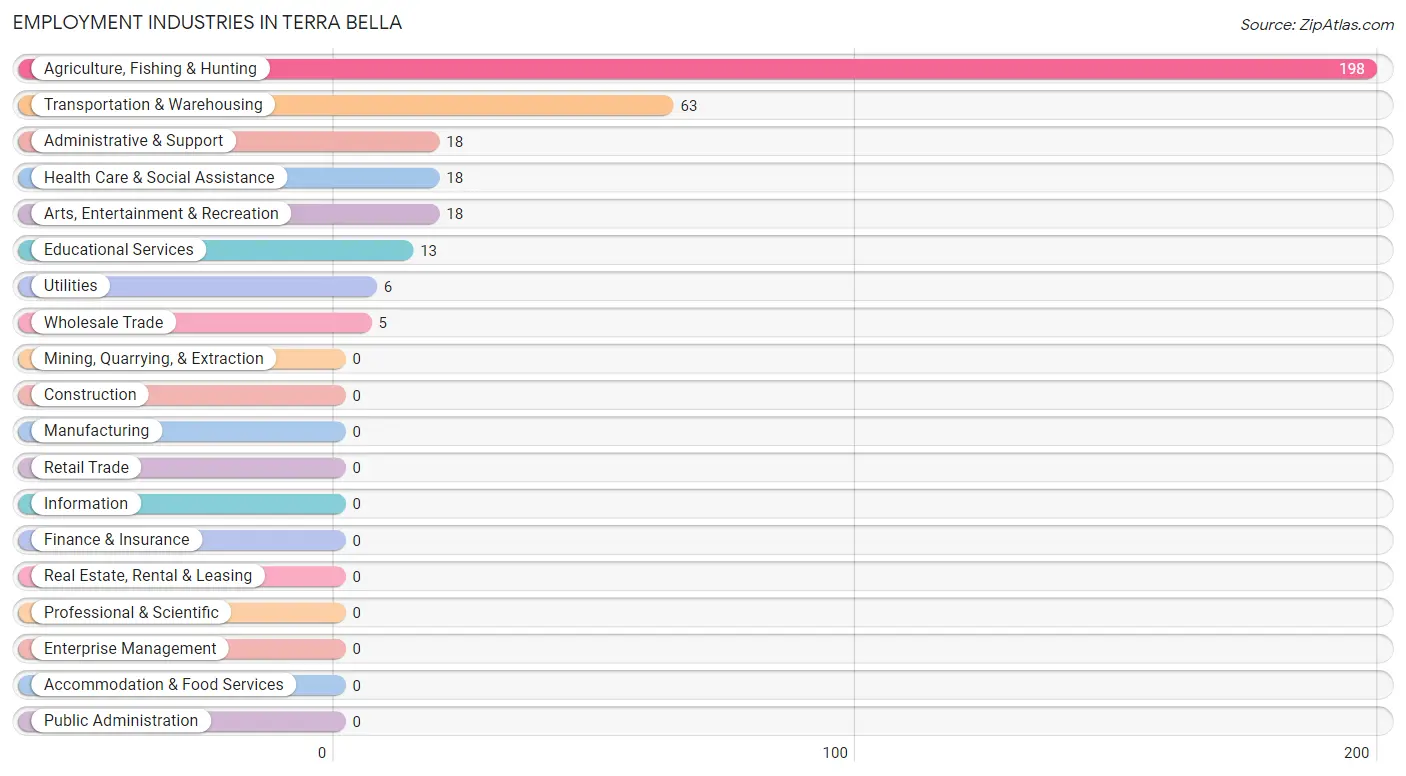
The major employment industries in Terra Bella include Agriculture, Fishing & Hunting (198 | 56.2%), Transportation & Warehousing (63 | 17.9%), Administrative & Support (18 | 5.1%), Health Care & Social Assistance (18 | 5.1%), and Arts, Entertainment & Recreation (18 | 5.1%).
Employment Industries by Sex in Terra Bella
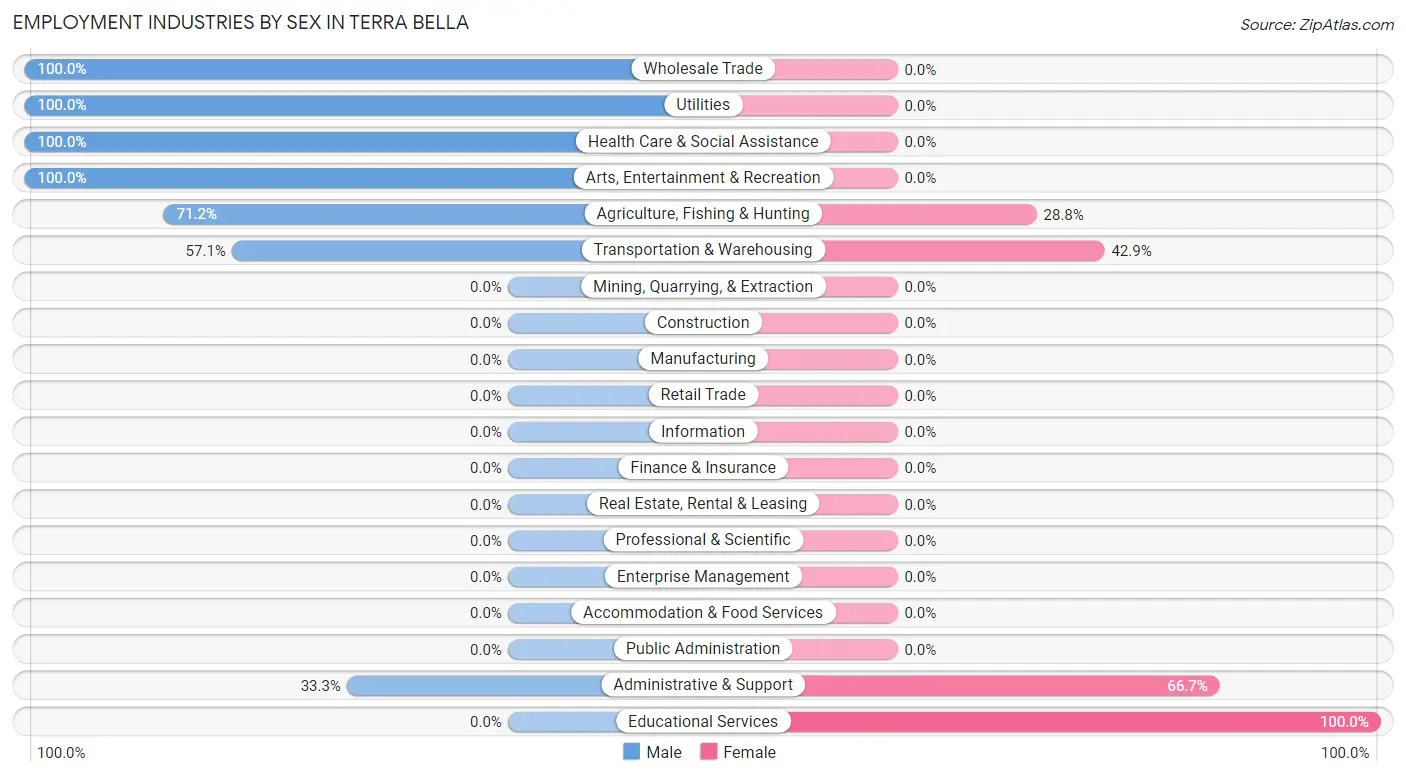
The Terra Bella industries that see more men than women are Wholesale Trade (100.0%), Utilities (100.0%), and Health Care & Social Assistance (100.0%), whereas the industries that tend to have a higher number of women are Educational Services (100.0%), Administrative & Support (66.7%), and Transportation & Warehousing (42.9%).
| Industry | Male | Female |
| Agriculture, Fishing & Hunting | 141 (71.2%) | 57 (28.8%) |
| Mining, Quarrying, & Extraction | 0 (0.0%) | 0 (0.0%) |
| Construction | 0 (0.0%) | 0 (0.0%) |
| Manufacturing | 0 (0.0%) | 0 (0.0%) |
| Wholesale Trade | 5 (100.0%) | 0 (0.0%) |
| Retail Trade | 0 (0.0%) | 0 (0.0%) |
| Transportation & Warehousing | 36 (57.1%) | 27 (42.9%) |
| Utilities | 6 (100.0%) | 0 (0.0%) |
| Information | 0 (0.0%) | 0 (0.0%) |
| Finance & Insurance | 0 (0.0%) | 0 (0.0%) |
| Real Estate, Rental & Leasing | 0 (0.0%) | 0 (0.0%) |
| Professional & Scientific | 0 (0.0%) | 0 (0.0%) |
| Enterprise Management | 0 (0.0%) | 0 (0.0%) |
| Administrative & Support | 6 (33.3%) | 12 (66.7%) |
| Educational Services | 0 (0.0%) | 13 (100.0%) |
| Health Care & Social Assistance | 18 (100.0%) | 0 (0.0%) |
| Arts, Entertainment & Recreation | 18 (100.0%) | 0 (0.0%) |
| Accommodation & Food Services | 0 (0.0%) | 0 (0.0%) |
| Public Administration | 0 (0.0%) | 0 (0.0%) |
| Total | 243 (69.0%) | 109 (31.0%) |
Education in Terra Bella
School Enrollment in Terra Bella
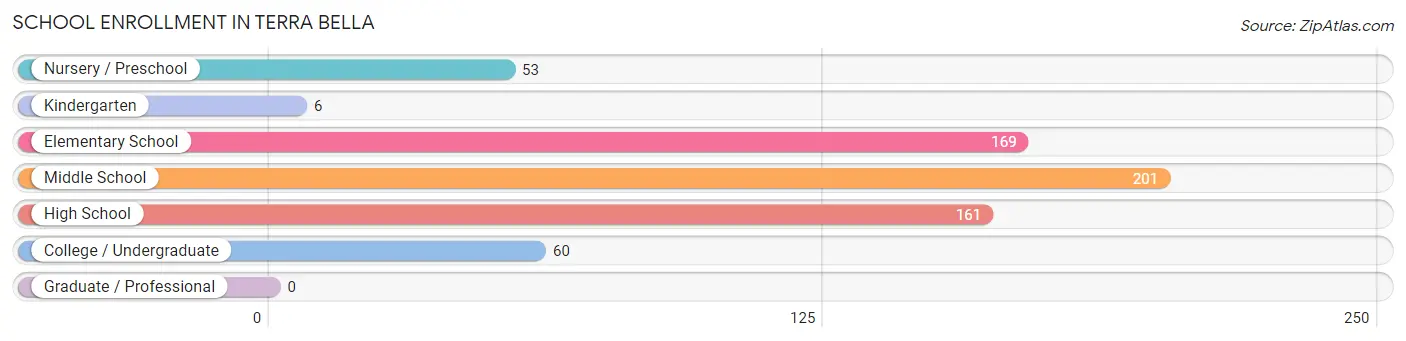
The most common levels of schooling among the 650 students in Terra Bella are middle school (201 | 30.9%), elementary school (169 | 26.0%), and high school (161 | 24.8%).
| School Level | # Students | % Students |
| Nursery / Preschool | 53 | 8.2% |
| Kindergarten | 6 | 0.9% |
| Elementary School | 169 | 26.0% |
| Middle School | 201 | 30.9% |
| High School | 161 | 24.8% |
| College / Undergraduate | 60 | 9.2% |
| Graduate / Professional | 0 | 0.0% |
| Total | 650 | 100.0% |
School Enrollment by Age by Funding Source in Terra Bella
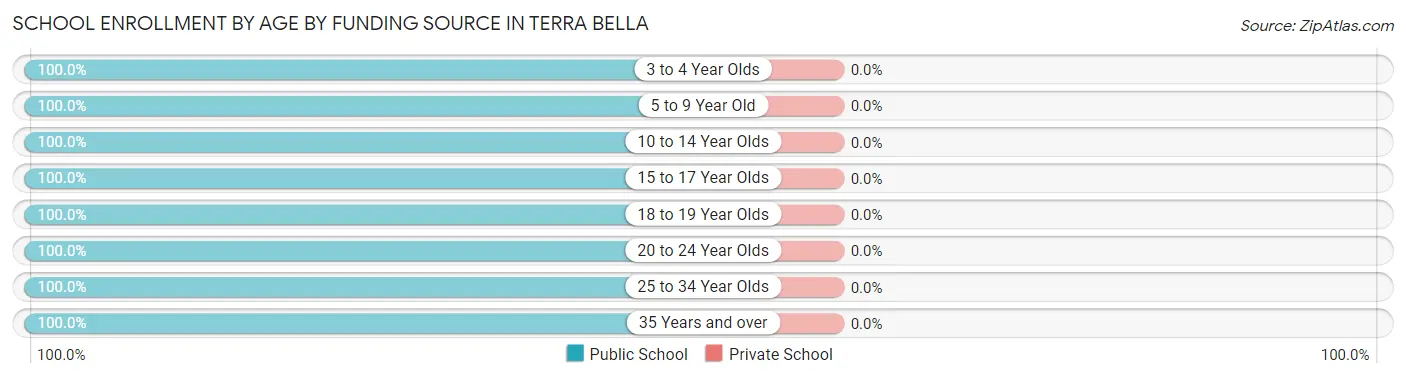
| Age Bracket | Public School | Private School |
| 3 to 4 Year Olds | 53 (100.0%) | 0 (0.0%) |
| 5 to 9 Year Old | 175 (100.0%) | 0 (0.0%) |
| 10 to 14 Year Olds | 201 (100.0%) | 0 (0.0%) |
| 15 to 17 Year Olds | 81 (100.0%) | 0 (0.0%) |
| 18 to 19 Year Olds | 62 (100.0%) | 0 (0.0%) |
| 20 to 24 Year Olds | 21 (100.0%) | 0 (0.0%) |
| 25 to 34 Year Olds | 20 (100.0%) | 0 (0.0%) |
| 35 Years and over | 37 (100.0%) | 0 (0.0%) |
| Total | 650 (100.0%) | 0 (0.0%) |
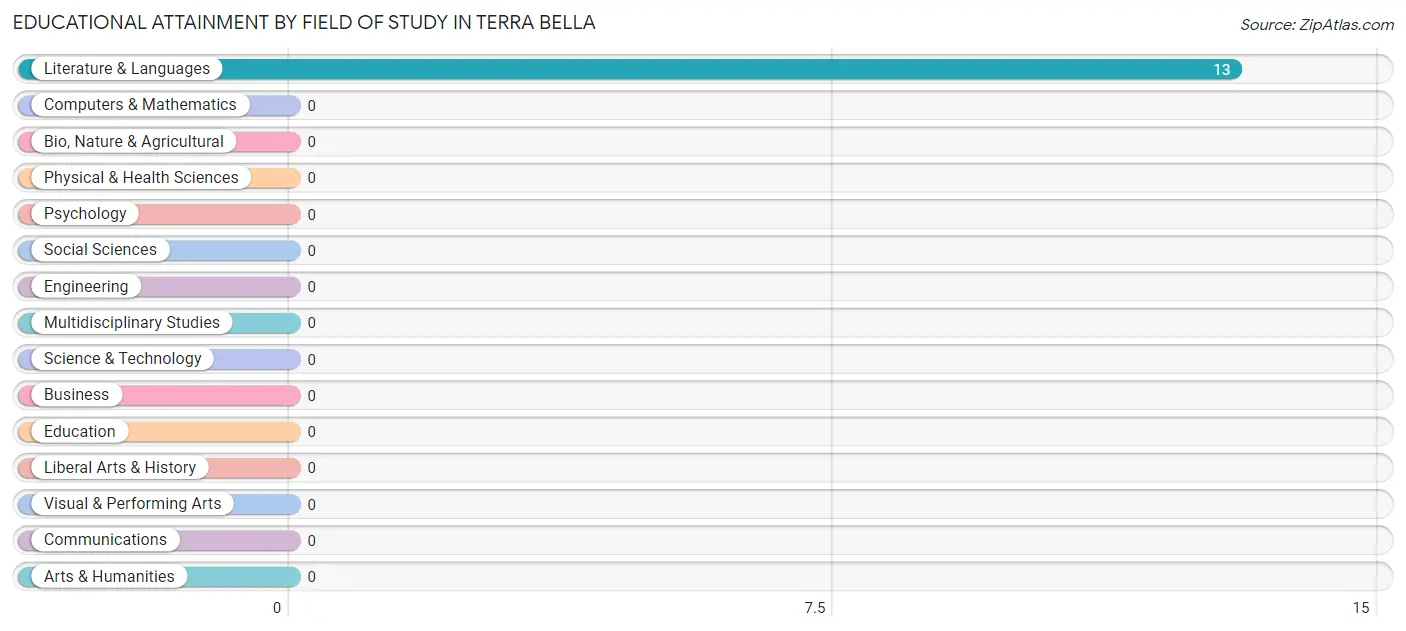
Educational Attainment by Field of Study in Terra Bella
, and literature & languages (13 | 100.0%) are the most common fields of study among 13 individuals in Terra Bella who have obtained a bachelor's degree or higher.
| Field of Study | # Graduates | % Graduates |
| Computers & Mathematics | 0 | 0.0% |
| Bio, Nature & Agricultural | 0 | 0.0% |
| Physical & Health Sciences | 0 | 0.0% |
| Psychology | 0 | 0.0% |
| Social Sciences | 0 | 0.0% |
| Engineering | 0 | 0.0% |
| Multidisciplinary Studies | 0 | 0.0% |
| Science & Technology | 0 | 0.0% |
| Business | 0 | 0.0% |
| Education | 0 | 0.0% |
| Literature & Languages | 13 | 100.0% |
| Liberal Arts & History | 0 | 0.0% |
| Visual & Performing Arts | 0 | 0.0% |
| Communications | 0 | 0.0% |
| Arts & Humanities | 0 | 0.0% |
| Total | 13 | 100.0% |
Transportation & Commute in Terra Bella
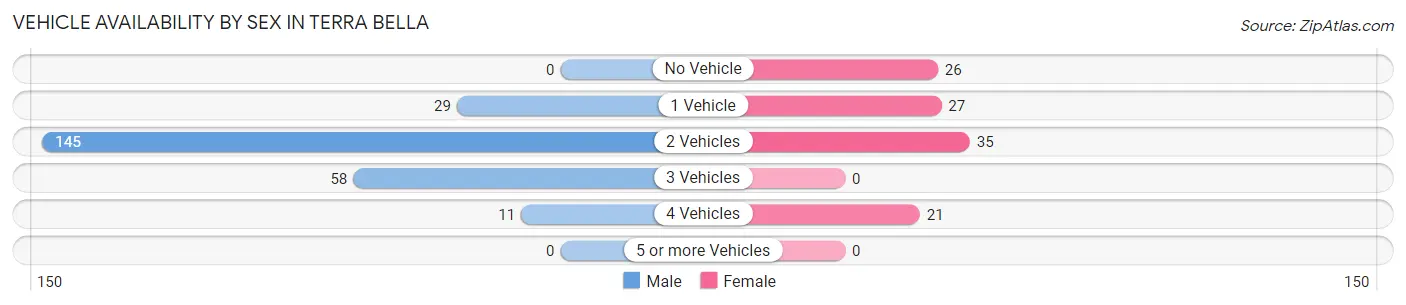
Vehicle Availability by Sex in Terra Bella
The most prevalent vehicle ownership categories in Terra Bella are males with 2 vehicles (145, accounting for 59.7%) and females with 2 vehicles (35, making up 133.0%).
| Vehicles Available | Male | Female |
| No Vehicle | 0 (0.0%) | 26 (23.8%) |
| 1 Vehicle | 29 (11.9%) | 27 (24.8%) |
| 2 Vehicles | 145 (59.7%) | 35 (32.1%) |
| 3 Vehicles | 58 (23.9%) | 0 (0.0%) |
| 4 Vehicles | 11 (4.5%) | 21 (19.3%) |
| 5 or more Vehicles | 0 (0.0%) | 0 (0.0%) |
| Total | 243 (100.0%) | 109 (100.0%) |
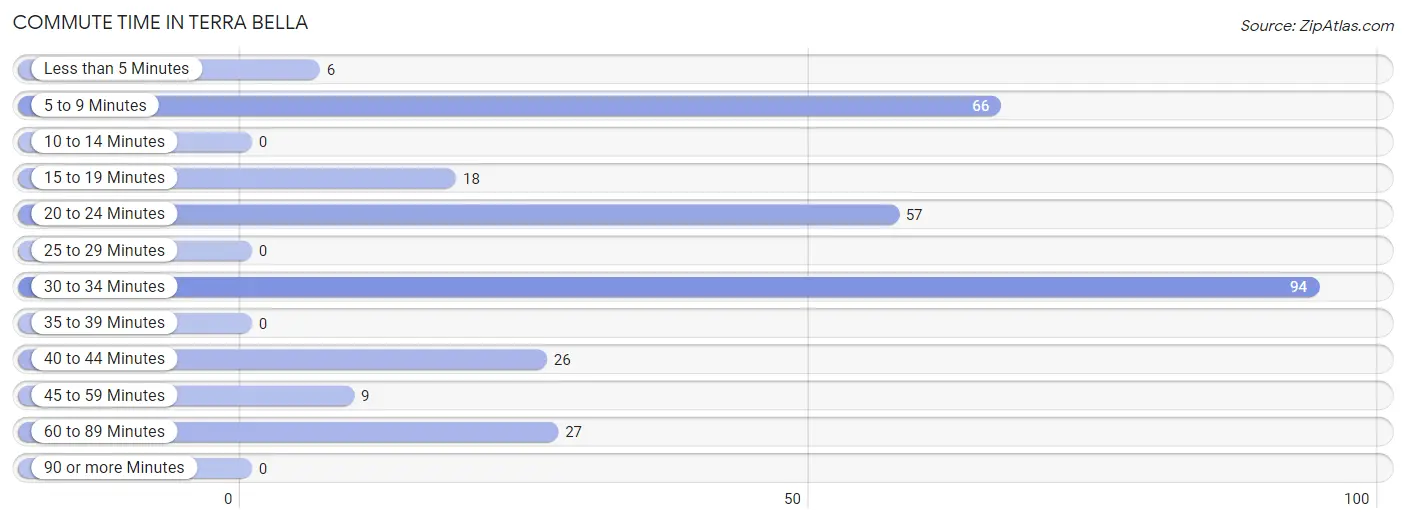
Commute Time in Terra Bella
The most frequently occuring commute durations in Terra Bella are 30 to 34 minutes (94 commuters, 31.0%), 5 to 9 minutes (66 commuters, 21.8%), and 20 to 24 minutes (57 commuters, 18.8%).
| Commute Time | # Commuters | % Commuters |
| Less than 5 Minutes | 6 | 2.0% |
| 5 to 9 Minutes | 66 | 21.8% |
| 10 to 14 Minutes | 0 | 0.0% |
| 15 to 19 Minutes | 18 | 5.9% |
| 20 to 24 Minutes | 57 | 18.8% |
| 25 to 29 Minutes | 0 | 0.0% |
| 30 to 34 Minutes | 94 | 31.0% |
| 35 to 39 Minutes | 0 | 0.0% |
| 40 to 44 Minutes | 26 | 8.6% |
| 45 to 59 Minutes | 9 | 3.0% |
| 60 to 89 Minutes | 27 | 8.9% |
| 90 or more Minutes | 0 | 0.0% |
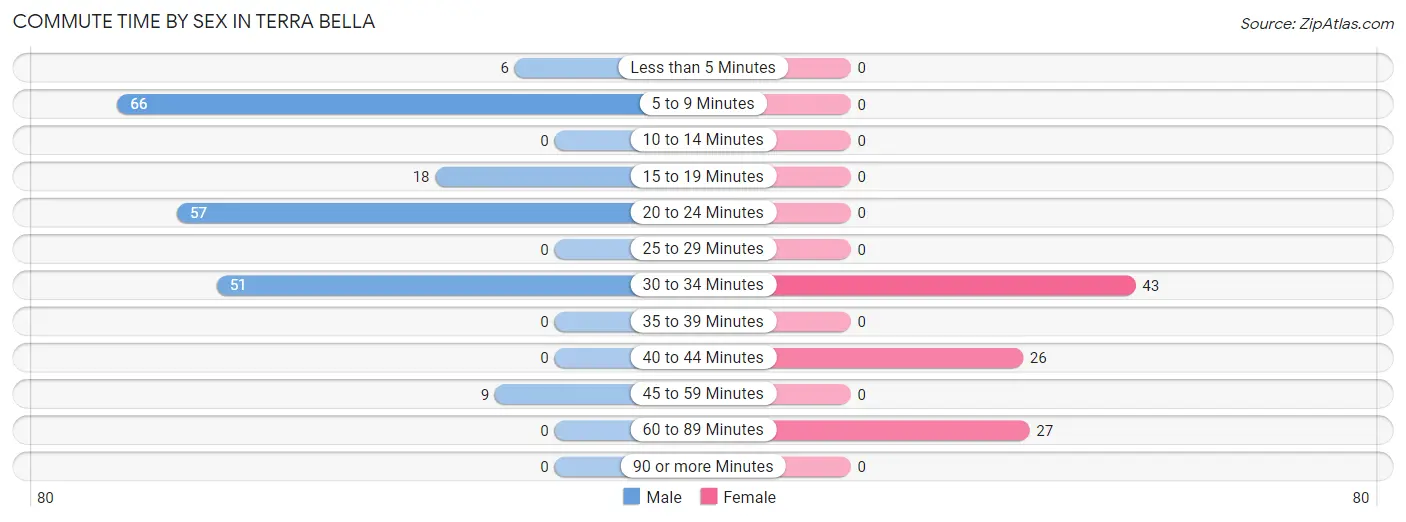
Commute Time by Sex in Terra Bella
The most common commute times in Terra Bella are 5 to 9 minutes (66 commuters, 31.9%) for males and 30 to 34 minutes (43 commuters, 44.8%) for females.
| Commute Time | Male | Female |
| Less than 5 Minutes | 6 (2.9%) | 0 (0.0%) |
| 5 to 9 Minutes | 66 (31.9%) | 0 (0.0%) |
| 10 to 14 Minutes | 0 (0.0%) | 0 (0.0%) |
| 15 to 19 Minutes | 18 (8.7%) | 0 (0.0%) |
| 20 to 24 Minutes | 57 (27.5%) | 0 (0.0%) |
| 25 to 29 Minutes | 0 (0.0%) | 0 (0.0%) |
| 30 to 34 Minutes | 51 (24.6%) | 43 (44.8%) |
| 35 to 39 Minutes | 0 (0.0%) | 0 (0.0%) |
| 40 to 44 Minutes | 0 (0.0%) | 26 (27.1%) |
| 45 to 59 Minutes | 9 (4.3%) | 0 (0.0%) |
| 60 to 89 Minutes | 0 (0.0%) | 27 (28.1%) |
| 90 or more Minutes | 0 (0.0%) | 0 (0.0%) |
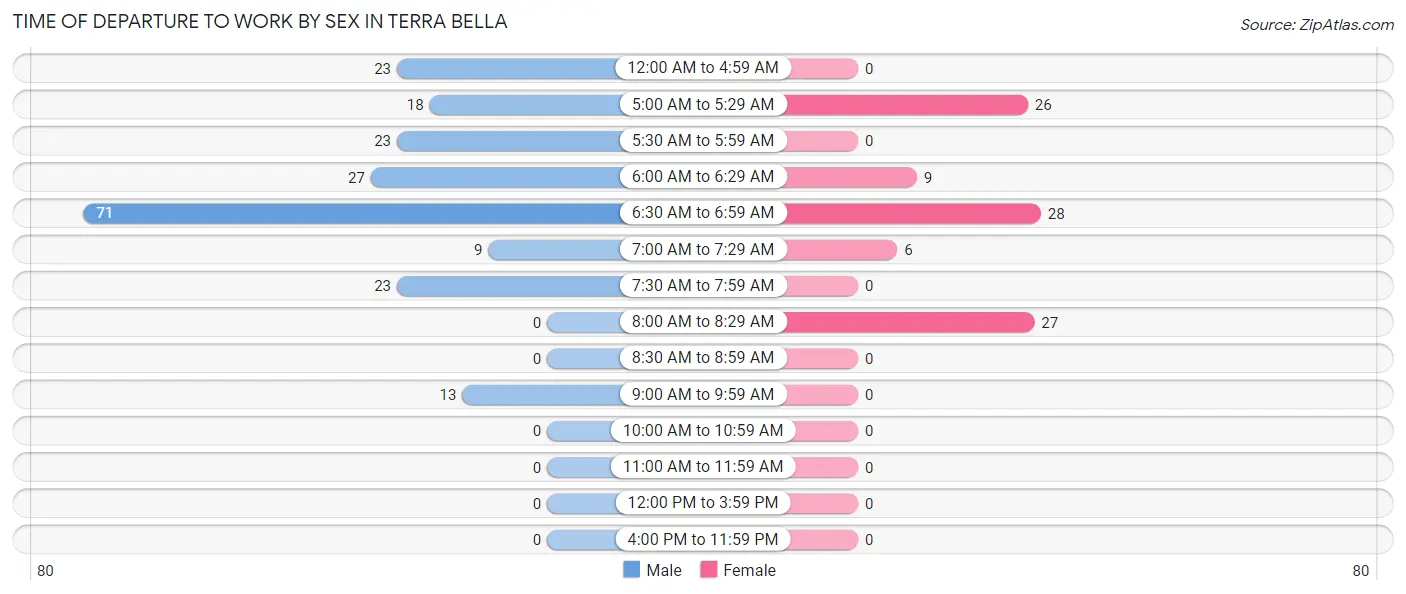
Time of Departure to Work by Sex in Terra Bella
The most frequent times of departure to work in Terra Bella are 6:30 AM to 6:59 AM (71, 34.3%) for males and 6:30 AM to 6:59 AM (28, 29.2%) for females.
| Time of Departure | Male | Female |
| 12:00 AM to 4:59 AM | 23 (11.1%) | 0 (0.0%) |
| 5:00 AM to 5:29 AM | 18 (8.7%) | 26 (27.1%) |
| 5:30 AM to 5:59 AM | 23 (11.1%) | 0 (0.0%) |
| 6:00 AM to 6:29 AM | 27 (13.0%) | 9 (9.4%) |
| 6:30 AM to 6:59 AM | 71 (34.3%) | 28 (29.2%) |
| 7:00 AM to 7:29 AM | 9 (4.3%) | 6 (6.2%) |
| 7:30 AM to 7:59 AM | 23 (11.1%) | 0 (0.0%) |
| 8:00 AM to 8:29 AM | 0 (0.0%) | 27 (28.1%) |
| 8:30 AM to 8:59 AM | 0 (0.0%) | 0 (0.0%) |
| 9:00 AM to 9:59 AM | 13 (6.3%) | 0 (0.0%) |
| 10:00 AM to 10:59 AM | 0 (0.0%) | 0 (0.0%) |
| 11:00 AM to 11:59 AM | 0 (0.0%) | 0 (0.0%) |
| 12:00 PM to 3:59 PM | 0 (0.0%) | 0 (0.0%) |
| 4:00 PM to 11:59 PM | 0 (0.0%) | 0 (0.0%) |
| Total | 207 (100.0%) | 96 (100.0%) |
Housing Occupancy in Terra Bella
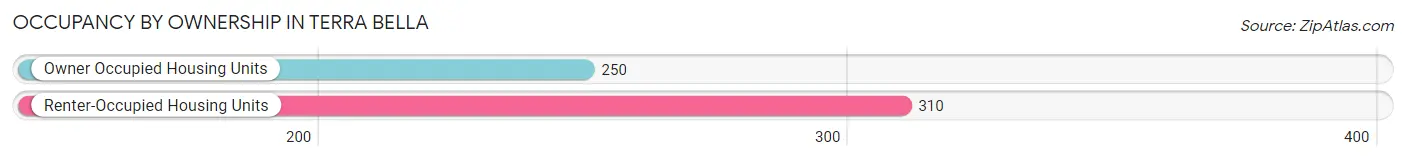
Occupancy by Ownership in Terra Bella
Of the total 560 dwellings in Terra Bella, owner-occupied units account for 250 (44.6%), while renter-occupied units make up 310 (55.4%).
| Occupancy | # Housing Units | % Housing Units |
| Owner Occupied Housing Units | 250 | 44.6% |
| Renter-Occupied Housing Units | 310 | 55.4% |
| Total Occupied Housing Units | 560 | 100.0% |
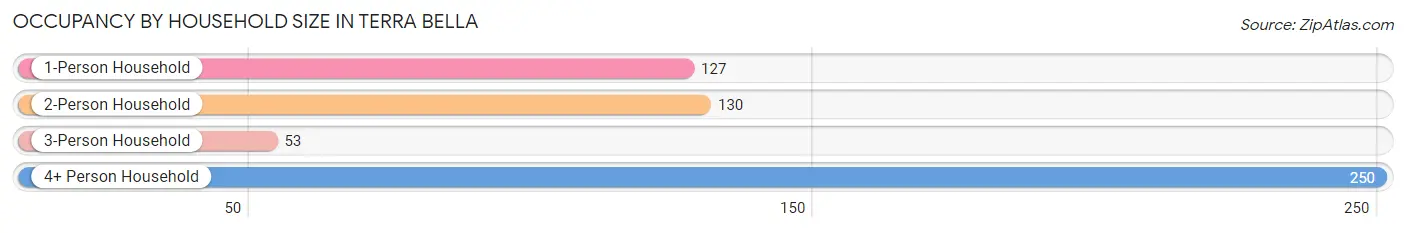
Occupancy by Household Size in Terra Bella
| Household Size | # Housing Units | % Housing Units |
| 1-Person Household | 127 | 22.7% |
| 2-Person Household | 130 | 23.2% |
| 3-Person Household | 53 | 9.5% |
| 4+ Person Household | 250 | 44.6% |
| Total Housing Units | 560 | 100.0% |
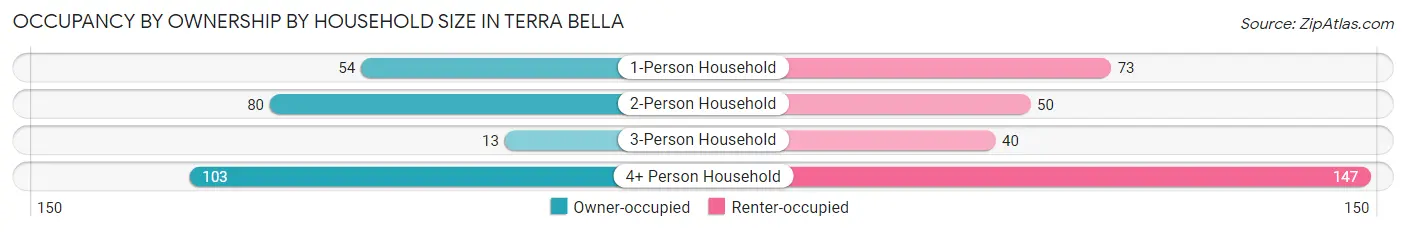
Occupancy by Ownership by Household Size in Terra Bella
| Household Size | Owner-occupied | Renter-occupied |
| 1-Person Household | 54 (42.5%) | 73 (57.5%) |
| 2-Person Household | 80 (61.5%) | 50 (38.5%) |
| 3-Person Household | 13 (24.5%) | 40 (75.5%) |
| 4+ Person Household | 103 (41.2%) | 147 (58.8%) |
| Total Housing Units | 250 (44.6%) | 310 (55.4%) |
Occupancy by Educational Attainment in Terra Bella
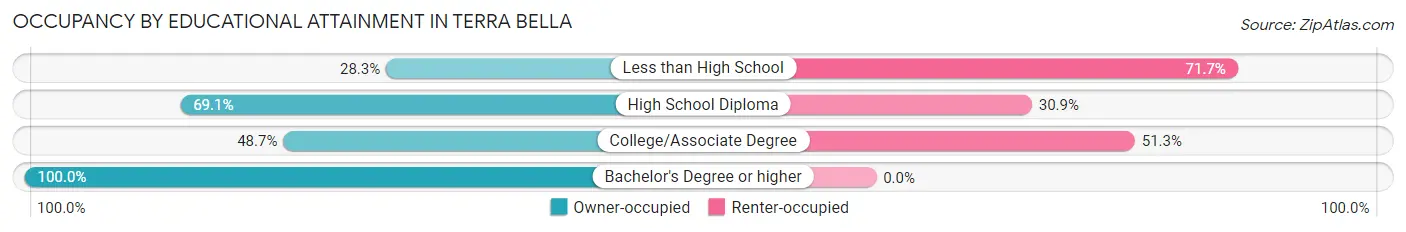
| Household Size | Owner-occupied | Renter-occupied |
| Less than High School | 87 (28.3%) | 220 (71.7%) |
| High School Diploma | 112 (69.1%) | 50 (30.9%) |
| College/Associate Degree | 38 (48.7%) | 40 (51.3%) |
| Bachelor's Degree or higher | 13 (100.0%) | 0 (0.0%) |
Occupancy by Age of Householder in Terra Bella
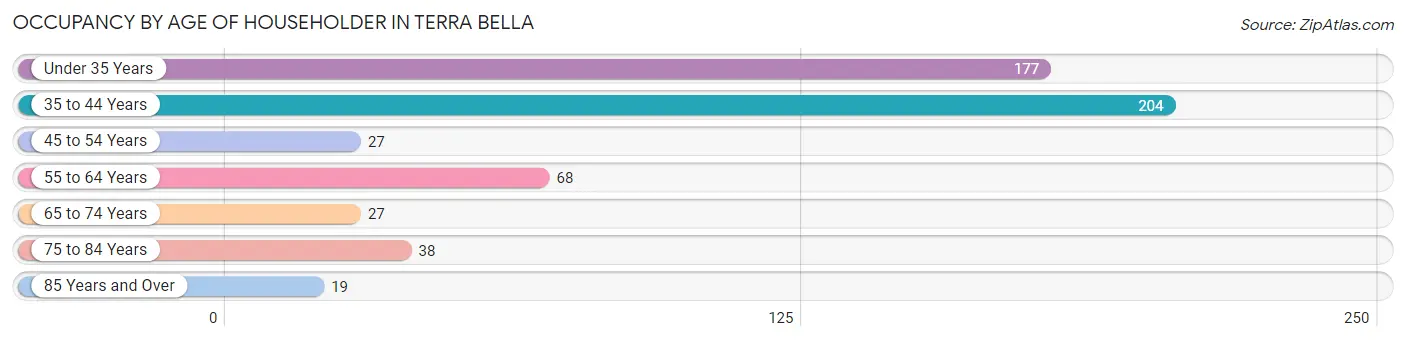
| Age Bracket | # Households | % Households |
| Under 35 Years | 177 | 31.6% |
| 35 to 44 Years | 204 | 36.4% |
| 45 to 54 Years | 27 | 4.8% |
| 55 to 64 Years | 68 | 12.1% |
| 65 to 74 Years | 27 | 4.8% |
| 75 to 84 Years | 38 | 6.8% |
| 85 Years and Over | 19 | 3.4% |
| Total | 560 | 100.0% |
Housing Finances in Terra Bella
Median Income by Occupancy in Terra Bella
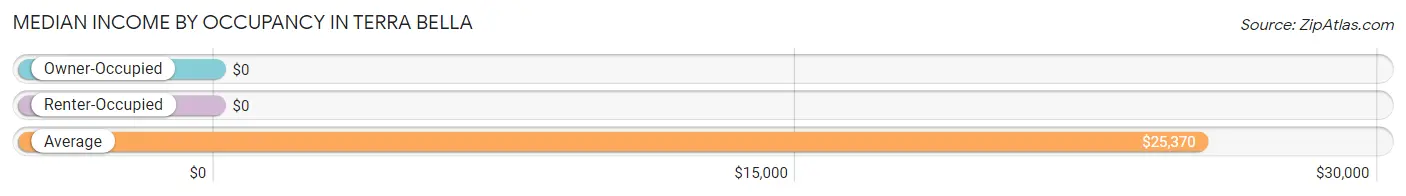
| Occupancy Type | # Households | Median Income |
| Owner-Occupied | 250 (44.6%) | $0 |
| Renter-Occupied | 310 (55.4%) | $0 |
| Average | 560 (100.0%) | $25,370 |
Occupancy by Householder Income Bracket in Terra Bella
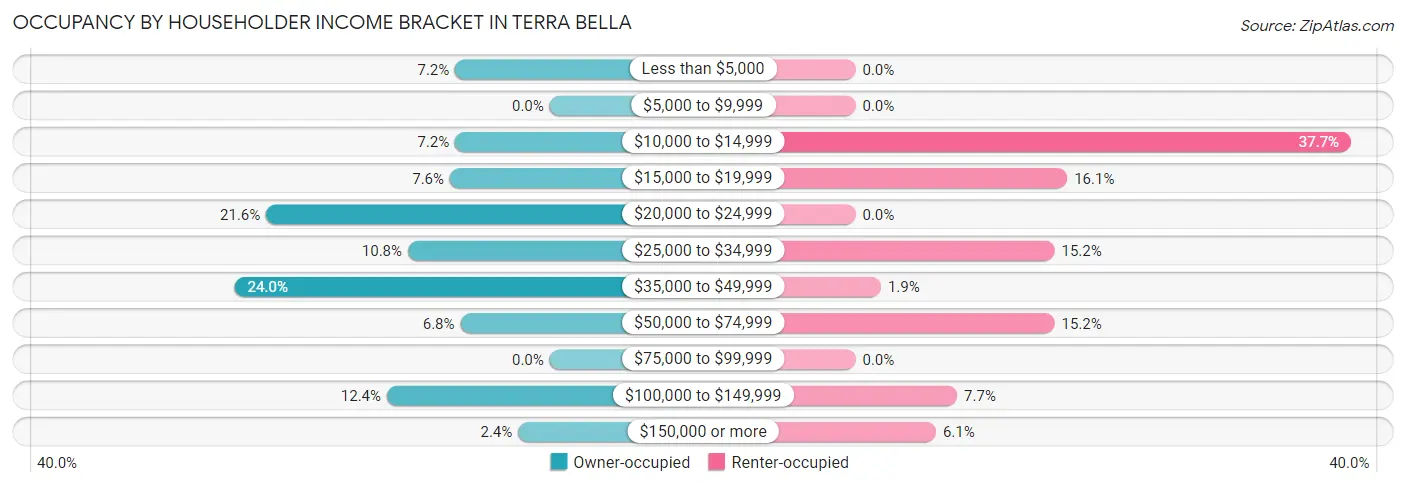
| Income Bracket | Owner-occupied | Renter-occupied |
| Less than $5,000 | 18 (7.2%) | 0 (0.0%) |
| $5,000 to $9,999 | 0 (0.0%) | 0 (0.0%) |
| $10,000 to $14,999 | 18 (7.2%) | 117 (37.7%) |
| $15,000 to $19,999 | 19 (7.6%) | 50 (16.1%) |
| $20,000 to $24,999 | 54 (21.6%) | 0 (0.0%) |
| $25,000 to $34,999 | 27 (10.8%) | 47 (15.2%) |
| $35,000 to $49,999 | 60 (24.0%) | 6 (1.9%) |
| $50,000 to $74,999 | 17 (6.8%) | 47 (15.2%) |
| $75,000 to $99,999 | 0 (0.0%) | 0 (0.0%) |
| $100,000 to $149,999 | 31 (12.4%) | 24 (7.7%) |
| $150,000 or more | 6 (2.4%) | 19 (6.1%) |
| Total | 250 (100.0%) | 310 (100.0%) |
Monthly Housing Cost Tiers in Terra Bella
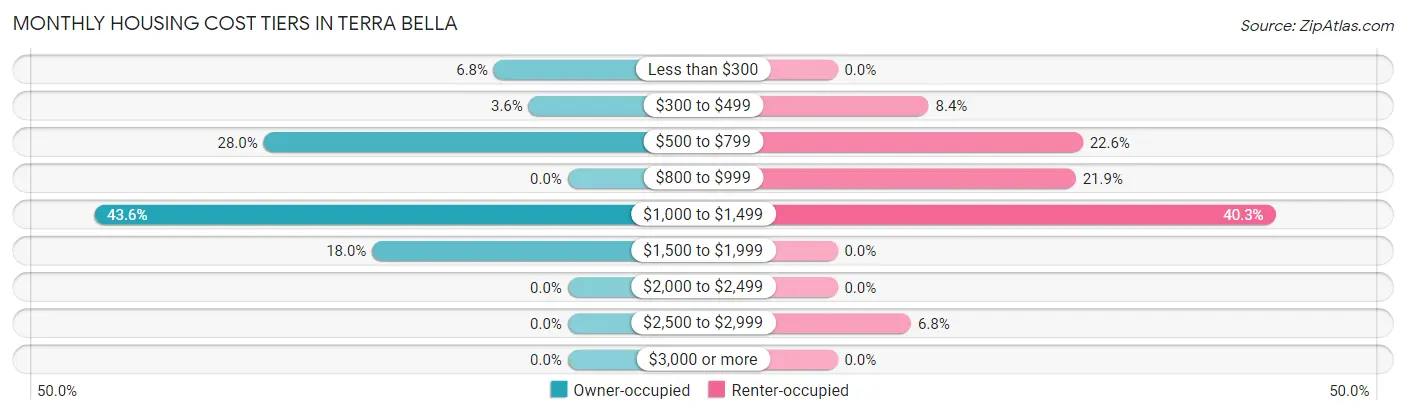
| Monthly Cost | Owner-occupied | Renter-occupied |
| Less than $300 | 17 (6.8%) | 0 (0.0%) |
| $300 to $499 | 9 (3.6%) | 26 (8.4%) |
| $500 to $799 | 70 (28.0%) | 70 (22.6%) |
| $800 to $999 | 0 (0.0%) | 68 (21.9%) |
| $1,000 to $1,499 | 109 (43.6%) | 125 (40.3%) |
| $1,500 to $1,999 | 45 (18.0%) | 0 (0.0%) |
| $2,000 to $2,499 | 0 (0.0%) | 0 (0.0%) |
| $2,500 to $2,999 | 0 (0.0%) | 21 (6.8%) |
| $3,000 or more | 0 (0.0%) | 0 (0.0%) |
| Total | 250 (100.0%) | 310 (100.0%) |
Physical Housing Characteristics in Terra Bella
Housing Structures in Terra Bella
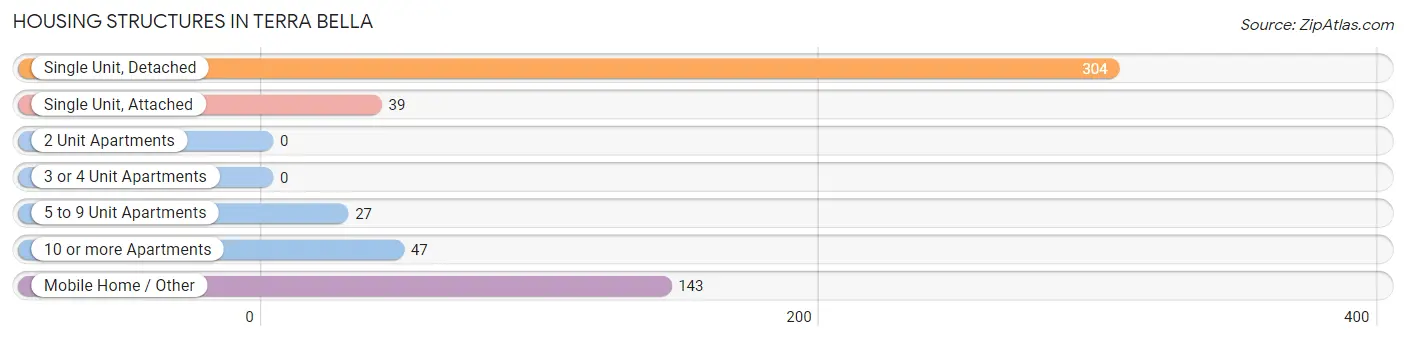
| Structure Type | # Housing Units | % Housing Units |
| Single Unit, Detached | 304 | 54.3% |
| Single Unit, Attached | 39 | 7.0% |
| 2 Unit Apartments | 0 | 0.0% |
| 3 or 4 Unit Apartments | 0 | 0.0% |
| 5 to 9 Unit Apartments | 27 | 4.8% |
| 10 or more Apartments | 47 | 8.4% |
| Mobile Home / Other | 143 | 25.5% |
| Total | 560 | 100.0% |
Housing Structures by Occupancy in Terra Bella
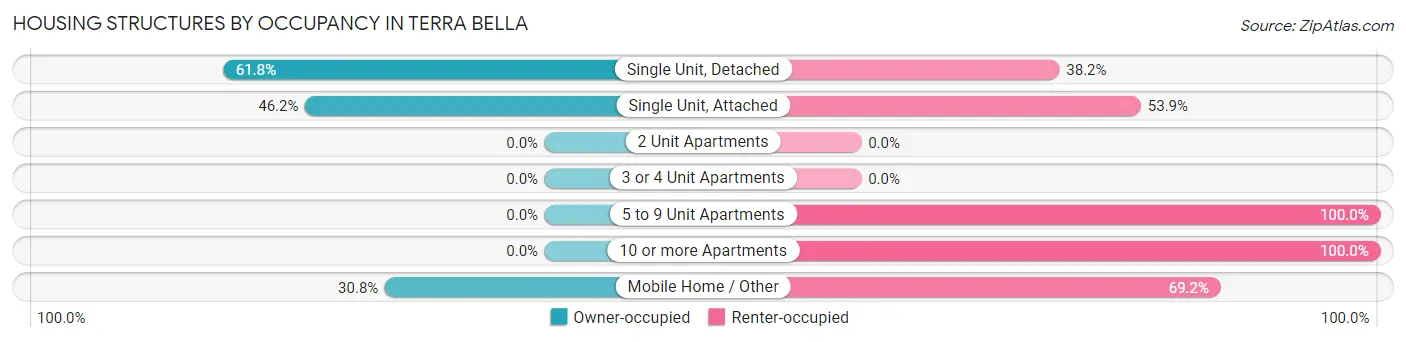
| Structure Type | Owner-occupied | Renter-occupied |
| Single Unit, Detached | 188 (61.8%) | 116 (38.2%) |
| Single Unit, Attached | 18 (46.2%) | 21 (53.8%) |
| 2 Unit Apartments | 0 (0.0%) | 0 (0.0%) |
| 3 or 4 Unit Apartments | 0 (0.0%) | 0 (0.0%) |
| 5 to 9 Unit Apartments | 0 (0.0%) | 27 (100.0%) |
| 10 or more Apartments | 0 (0.0%) | 47 (100.0%) |
| Mobile Home / Other | 44 (30.8%) | 99 (69.2%) |
| Total | 250 (44.6%) | 310 (55.4%) |
Housing Structures by Number of Rooms in Terra Bella
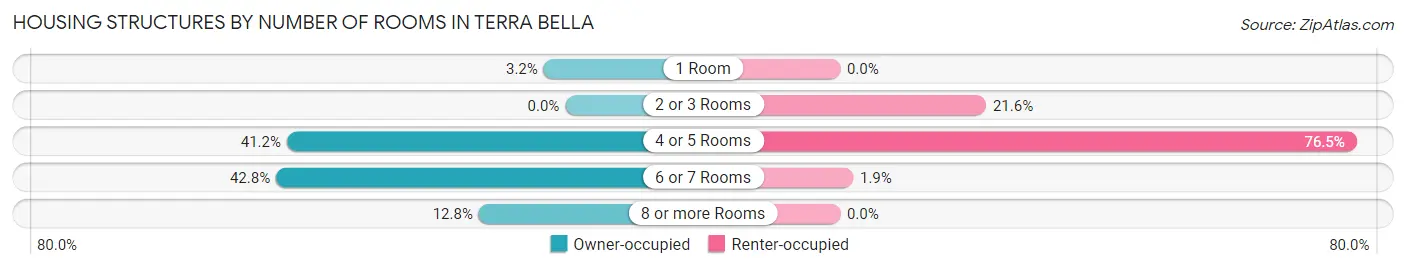
| Number of Rooms | Owner-occupied | Renter-occupied |
| 1 Room | 8 (3.2%) | 0 (0.0%) |
| 2 or 3 Rooms | 0 (0.0%) | 67 (21.6%) |
| 4 or 5 Rooms | 103 (41.2%) | 237 (76.4%) |
| 6 or 7 Rooms | 107 (42.8%) | 6 (1.9%) |
| 8 or more Rooms | 32 (12.8%) | 0 (0.0%) |
| Total | 250 (100.0%) | 310 (100.0%) |
Housing Structure by Heating Type in Terra Bella
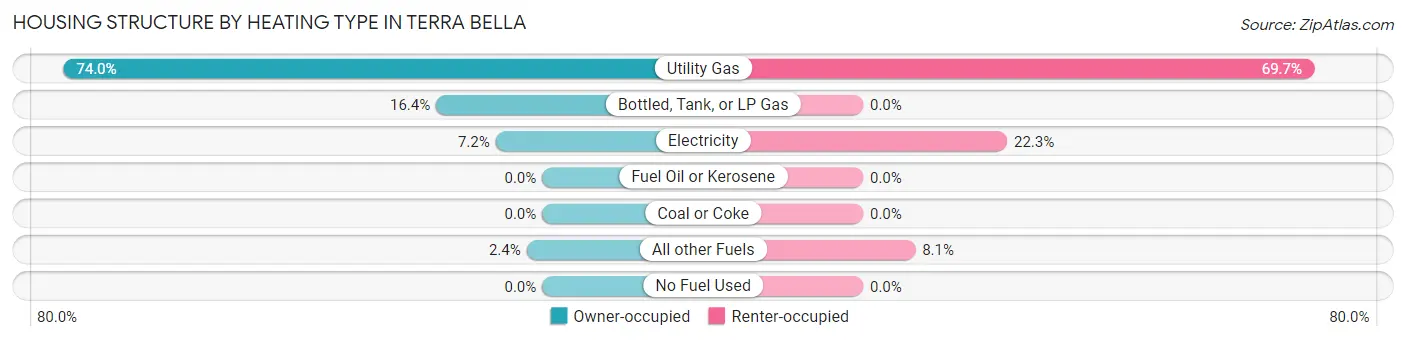
| Heating Type | Owner-occupied | Renter-occupied |
| Utility Gas | 185 (74.0%) | 216 (69.7%) |
| Bottled, Tank, or LP Gas | 41 (16.4%) | 0 (0.0%) |
| Electricity | 18 (7.2%) | 69 (22.3%) |
| Fuel Oil or Kerosene | 0 (0.0%) | 0 (0.0%) |
| Coal or Coke | 0 (0.0%) | 0 (0.0%) |
| All other Fuels | 6 (2.4%) | 25 (8.1%) |
| No Fuel Used | 0 (0.0%) | 0 (0.0%) |
| Total | 250 (100.0%) | 310 (100.0%) |
Household Vehicle Usage in Terra Bella
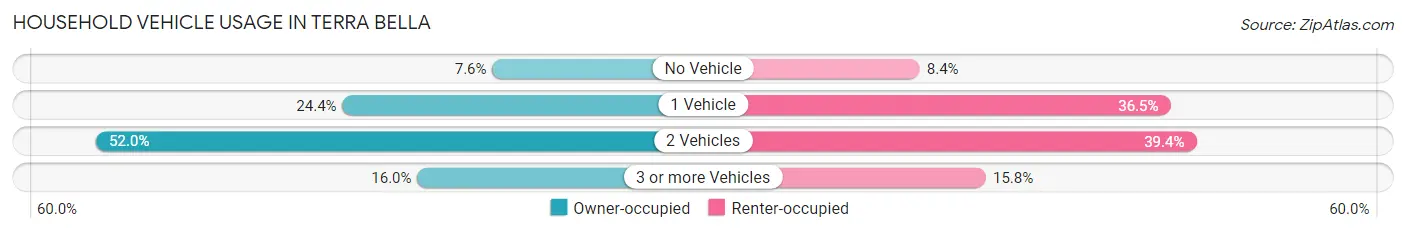
| Vehicles per Household | Owner-occupied | Renter-occupied |
| No Vehicle | 19 (7.6%) | 26 (8.4%) |
| 1 Vehicle | 61 (24.4%) | 113 (36.4%) |
| 2 Vehicles | 130 (52.0%) | 122 (39.4%) |
| 3 or more Vehicles | 40 (16.0%) | 49 (15.8%) |
| Total | 250 (100.0%) | 310 (100.0%) |
Real Estate & Mortgages in Terra Bella
Real Estate and Mortgage Overview in Terra Bella
| Characteristic | Without Mortgage | With Mortgage |
| Housing Units | 54 | 196 |
| Median Property Value | - | - |
| Median Household Income | - | - |
| Monthly Housing Costs | $556 | $0 |
| Real Estate Taxes | $1,179 | $8 |
Property Value by Mortgage Status in Terra Bella
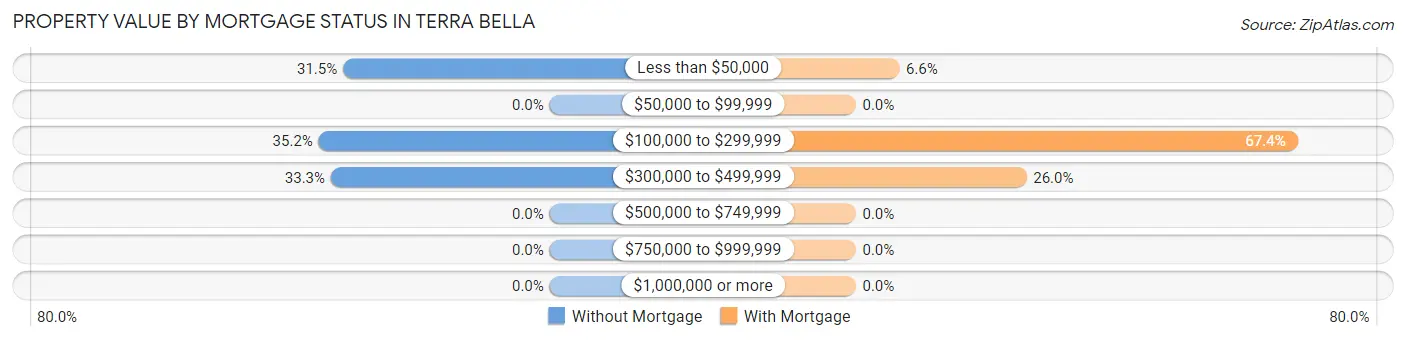
| Property Value | Without Mortgage | With Mortgage |
| Less than $50,000 | 17 (31.5%) | 13 (6.6%) |
| $50,000 to $99,999 | 0 (0.0%) | 0 (0.0%) |
| $100,000 to $299,999 | 19 (35.2%) | 132 (67.3%) |
| $300,000 to $499,999 | 18 (33.3%) | 51 (26.0%) |
| $500,000 to $749,999 | 0 (0.0%) | 0 (0.0%) |
| $750,000 to $999,999 | 0 (0.0%) | 0 (0.0%) |
| $1,000,000 or more | 0 (0.0%) | 0 (0.0%) |
| Total | 54 (100.0%) | 196 (100.0%) |
Household Income by Mortgage Status in Terra Bella
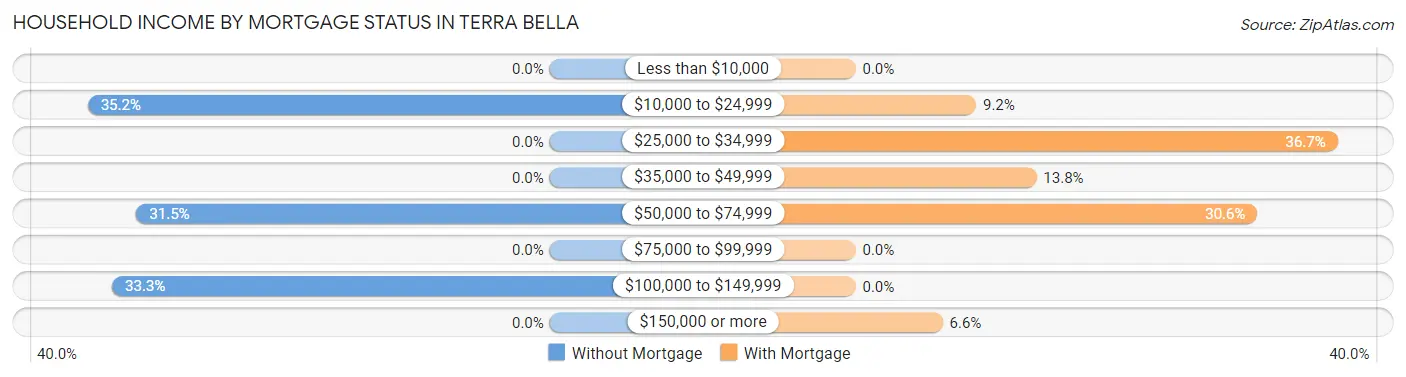
| Household Income | Without Mortgage | With Mortgage |
| Less than $10,000 | 0 (0.0%) | 0 (0.0%) |
| $10,000 to $24,999 | 19 (35.2%) | 18 (9.2%) |
| $25,000 to $34,999 | 0 (0.0%) | 72 (36.7%) |
| $35,000 to $49,999 | 0 (0.0%) | 27 (13.8%) |
| $50,000 to $74,999 | 17 (31.5%) | 60 (30.6%) |
| $75,000 to $99,999 | 0 (0.0%) | 0 (0.0%) |
| $100,000 to $149,999 | 18 (33.3%) | 0 (0.0%) |
| $150,000 or more | 0 (0.0%) | 13 (6.6%) |
| Total | 54 (100.0%) | 196 (100.0%) |
Property Value to Household Income Ratio in Terra Bella
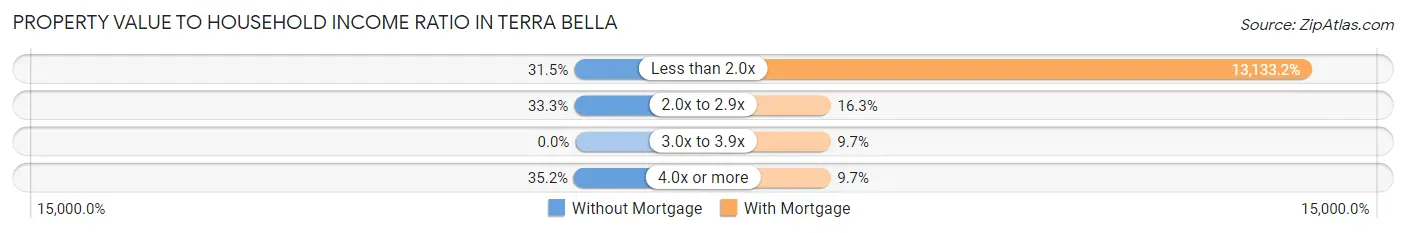
| Value-to-Income Ratio | Without Mortgage | With Mortgage |
| Less than 2.0x | 17 (31.5%) | 25,741 (13,133.2%) |
| 2.0x to 2.9x | 18 (33.3%) | 32 (16.3%) |
| 3.0x to 3.9x | 0 (0.0%) | 19 (9.7%) |
| 4.0x or more | 19 (35.2%) | 19 (9.7%) |
| Total | 54 (100.0%) | 196 (100.0%) |
Real Estate Taxes by Mortgage Status in Terra Bella

| Property Taxes | Without Mortgage | With Mortgage |
| Less than $800 | 17 (31.5%) | 18 (9.2%) |
| $800 to $1,499 | 28 (51.8%) | 19 (9.7%) |
| $800 to $1,499 | 9 (16.7%) | 53 (27.0%) |
| Total | 54 (100.0%) | 196 (100.0%) |
Health & Disability in Terra Bella
Health Insurance Coverage by Age in Terra Bella
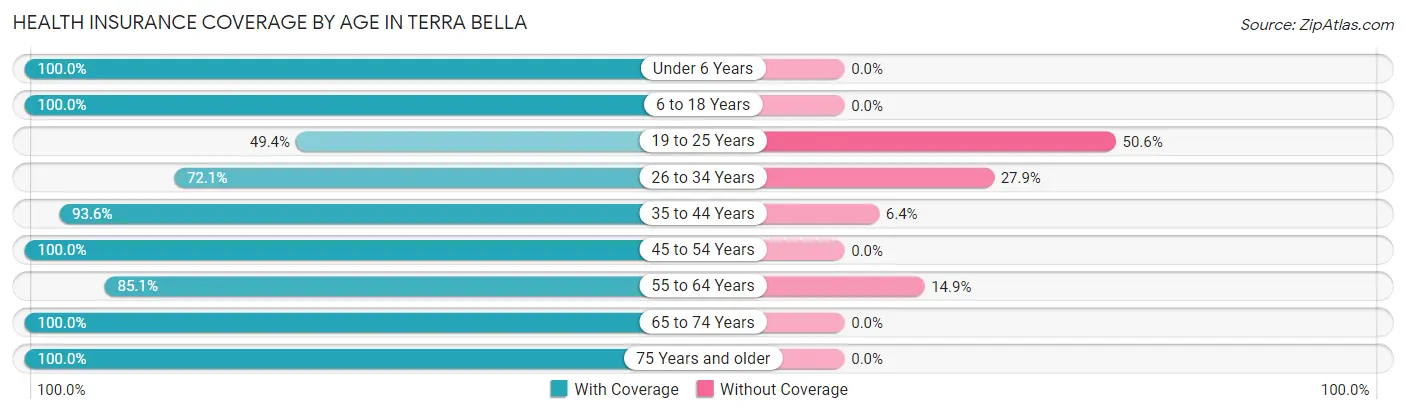
| Age Bracket | With Coverage | Without Coverage |
| Under 6 Years | 150 (100.0%) | 0 (0.0%) |
| 6 to 18 Years | 546 (100.0%) | 0 (0.0%) |
| 19 to 25 Years | 85 (49.4%) | 87 (50.6%) |
| 26 to 34 Years | 189 (72.1%) | 73 (27.9%) |
| 35 to 44 Years | 334 (93.6%) | 23 (6.4%) |
| 45 to 54 Years | 67 (100.0%) | 0 (0.0%) |
| 55 to 64 Years | 97 (85.1%) | 17 (14.9%) |
| 65 to 74 Years | 42 (100.0%) | 0 (0.0%) |
| 75 Years and older | 96 (100.0%) | 0 (0.0%) |
| Total | 1,606 (88.9%) | 200 (11.1%) |
Health Insurance Coverage by Citizenship Status in Terra Bella

| Citizenship Status | With Coverage | Without Coverage |
| Native Born | 150 (100.0%) | 0 (0.0%) |
| Foreign Born, Citizen | 546 (100.0%) | 0 (0.0%) |
| Foreign Born, not a Citizen | 85 (49.4%) | 87 (50.6%) |
Health Insurance Coverage by Household Income in Terra Bella
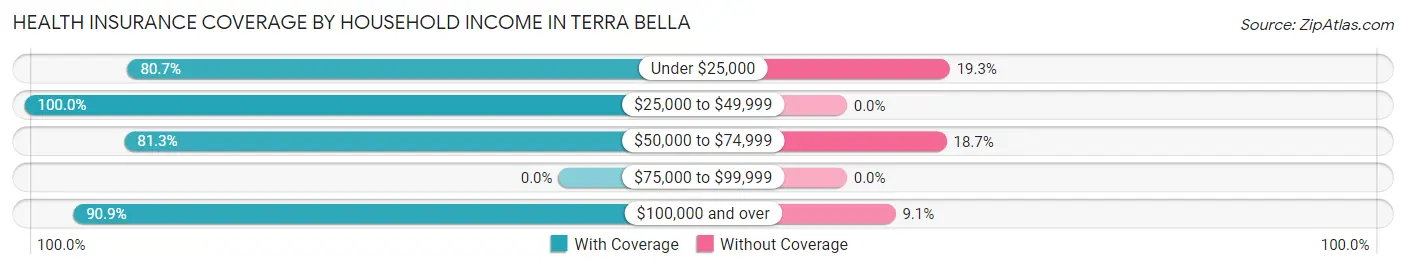
| Household Income | With Coverage | Without Coverage |
| Under $25,000 | 561 (80.7%) | 134 (19.3%) |
| $25,000 to $49,999 | 588 (100.0%) | 0 (0.0%) |
| $50,000 to $74,999 | 174 (81.3%) | 40 (18.7%) |
| $75,000 to $99,999 | 0 (0.0%) | 0 (0.0%) |
| $100,000 and over | 259 (90.9%) | 26 (9.1%) |
Public vs Private Health Insurance Coverage by Age in Terra Bella
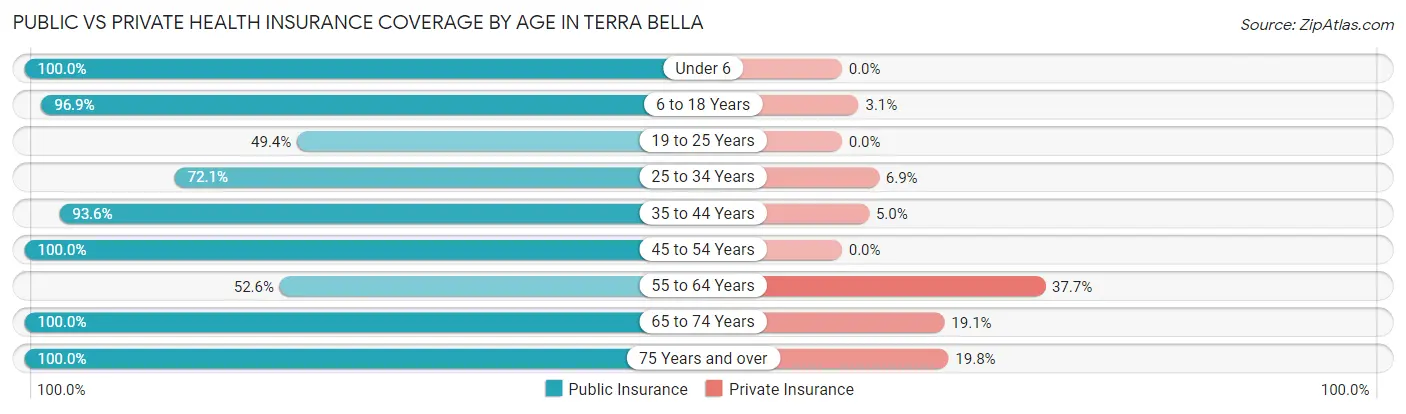
| Age Bracket | Public Insurance | Private Insurance |
| Under 6 | 150 (100.0%) | 0 (0.0%) |
| 6 to 18 Years | 529 (96.9%) | 17 (3.1%) |
| 19 to 25 Years | 85 (49.4%) | 0 (0.0%) |
| 25 to 34 Years | 189 (72.1%) | 18 (6.9%) |
| 35 to 44 Years | 334 (93.6%) | 18 (5.0%) |
| 45 to 54 Years | 67 (100.0%) | 0 (0.0%) |
| 55 to 64 Years | 60 (52.6%) | 43 (37.7%) |
| 65 to 74 Years | 42 (100.0%) | 8 (19.1%) |
| 75 Years and over | 96 (100.0%) | 19 (19.8%) |
| Total | 1,552 (85.9%) | 123 (6.8%) |
Disability Status by Sex by Age in Terra Bella
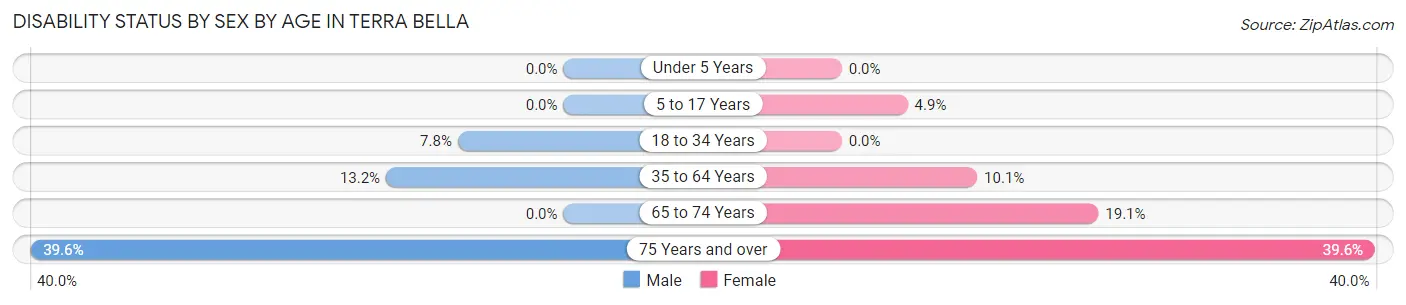
| Age Bracket | Male | Female |
| Under 5 Years | 0 (0.0%) | 0 (0.0%) |
| 5 to 17 Years | 0 (0.0%) | 11 (4.9%) |
| 18 to 34 Years | 21 (7.8%) | 0 (0.0%) |
| 35 to 64 Years | 42 (13.2%) | 22 (10.1%) |
| 65 to 74 Years | 0 (0.0%) | 8 (19.1%) |
| 75 Years and over | 19 (39.6%) | 19 (39.6%) |
Disability Class by Sex by Age in Terra Bella
Disability Class: Hearing Difficulty
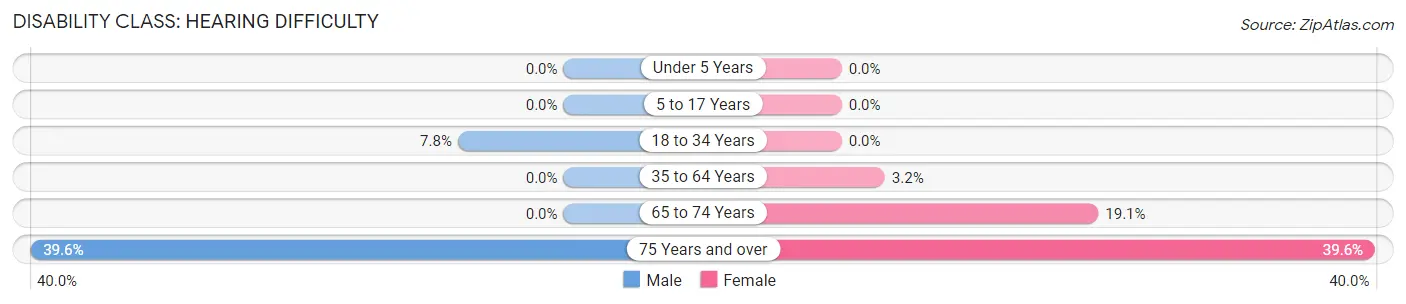
| Age Bracket | Male | Female |
| Under 5 Years | 0 (0.0%) | 0 (0.0%) |
| 5 to 17 Years | 0 (0.0%) | 0 (0.0%) |
| 18 to 34 Years | 21 (7.8%) | 0 (0.0%) |
| 35 to 64 Years | 0 (0.0%) | 7 (3.2%) |
| 65 to 74 Years | 0 (0.0%) | 8 (19.1%) |
| 75 Years and over | 19 (39.6%) | 19 (39.6%) |
Disability Class: Vision Difficulty
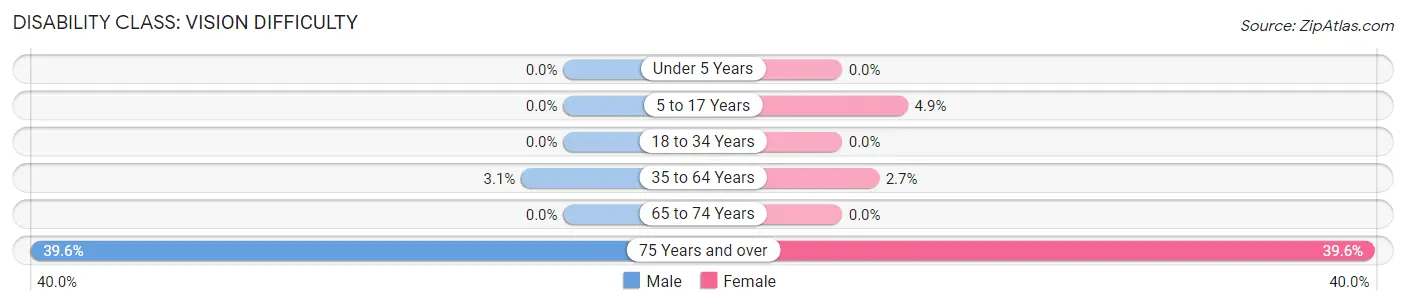
| Age Bracket | Male | Female |
| Under 5 Years | 0 (0.0%) | 0 (0.0%) |
| 5 to 17 Years | 0 (0.0%) | 11 (4.9%) |
| 18 to 34 Years | 0 (0.0%) | 0 (0.0%) |
| 35 to 64 Years | 10 (3.1%) | 6 (2.7%) |
| 65 to 74 Years | 0 (0.0%) | 0 (0.0%) |
| 75 Years and over | 19 (39.6%) | 19 (39.6%) |
Disability Class: Cognitive Difficulty
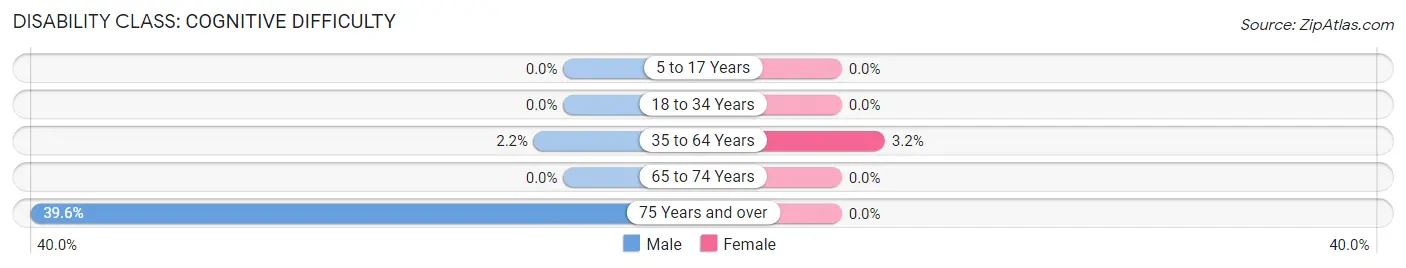
| Age Bracket | Male | Female |
| 5 to 17 Years | 0 (0.0%) | 0 (0.0%) |
| 18 to 34 Years | 0 (0.0%) | 0 (0.0%) |
| 35 to 64 Years | 7 (2.2%) | 7 (3.2%) |
| 65 to 74 Years | 0 (0.0%) | 0 (0.0%) |
| 75 Years and over | 19 (39.6%) | 0 (0.0%) |
Disability Class: Ambulatory Difficulty
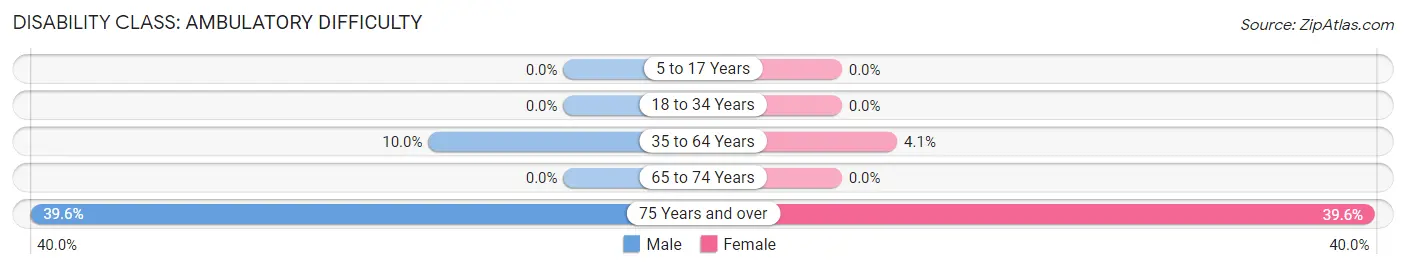
| Age Bracket | Male | Female |
| 5 to 17 Years | 0 (0.0%) | 0 (0.0%) |
| 18 to 34 Years | 0 (0.0%) | 0 (0.0%) |
| 35 to 64 Years | 32 (10.0%) | 9 (4.1%) |
| 65 to 74 Years | 0 (0.0%) | 0 (0.0%) |
| 75 Years and over | 19 (39.6%) | 19 (39.6%) |
Disability Class: Self-Care Difficulty
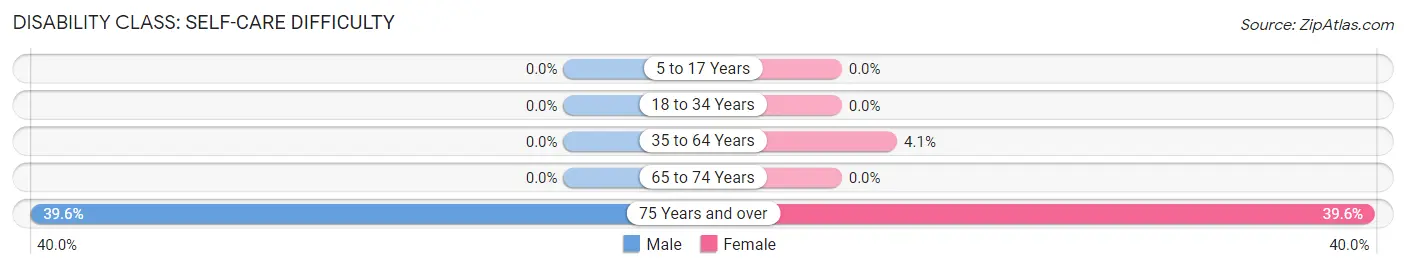
| Age Bracket | Male | Female |
| 5 to 17 Years | 0 (0.0%) | 0 (0.0%) |
| 18 to 34 Years | 0 (0.0%) | 0 (0.0%) |
| 35 to 64 Years | 0 (0.0%) | 9 (4.1%) |
| 65 to 74 Years | 0 (0.0%) | 0 (0.0%) |
| 75 Years and over | 19 (39.6%) | 19 (39.6%) |
Technology Access in Terra Bella
Computing Device Access in Terra Bella
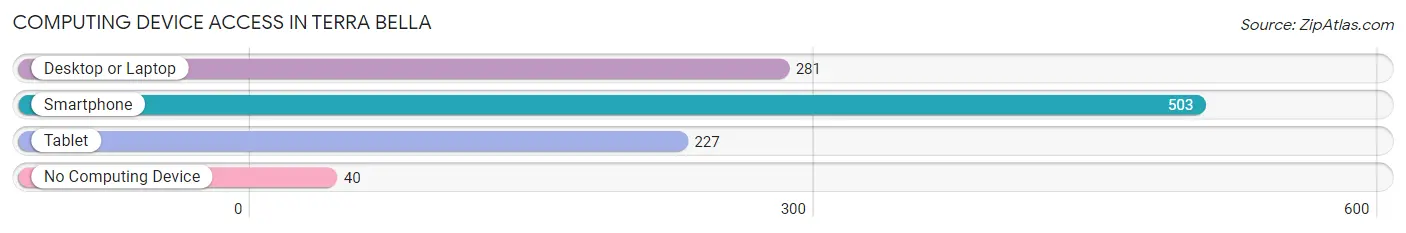
| Device Type | # Households | % Households |
| Desktop or Laptop | 281 | 50.2% |
| Smartphone | 503 | 89.8% |
| Tablet | 227 | 40.5% |
| No Computing Device | 40 | 7.1% |
| Total | 560 | 100.0% |
Internet Access in Terra Bella
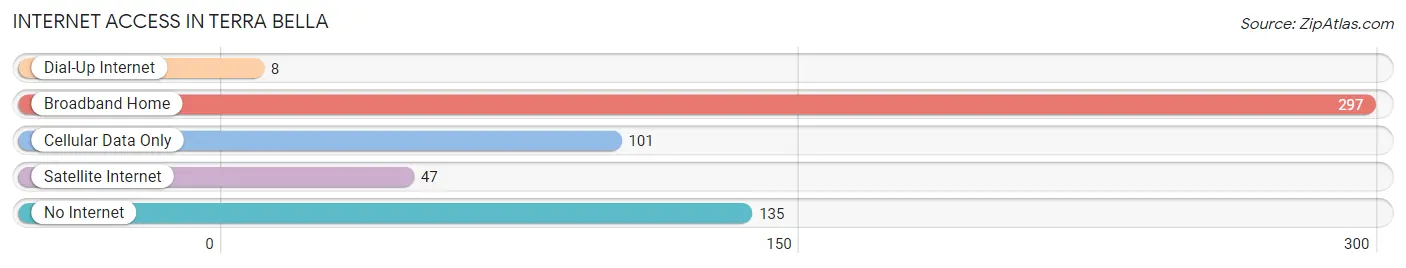
| Internet Type | # Households | % Households |
| Dial-Up Internet | 8 | 1.4% |
| Broadband Home | 297 | 53.0% |
| Cellular Data Only | 101 | 18.0% |
| Satellite Internet | 47 | 8.4% |
| No Internet | 135 | 24.1% |
| Total | 560 | 100.0% |
Terra Bella Summary
Terra Bella is a small town located in Tulare County, California. It is situated in the San Joaquin Valley, approximately 10 miles south of Porterville and 25 miles northwest of Bakersfield. The population of Terra Bella was 1,845 at the 2010 census, up from 1,717 at the 2000 census.
History
The area that is now Terra Bella was originally inhabited by the Yokuts Indians. The first European settlers arrived in the area in the late 1800s, and the town was officially founded in 1891. The town was originally called “Tulare Junction”, but was later renamed “Terra Bella”, which is Spanish for “beautiful land”.
The town was initially a farming community, and the main crops grown were cotton, wheat, and barley. In the early 1900s, the town began to grow and develop, and by the 1920s, it had become a thriving agricultural center. The town was also home to several businesses, including a bank, a hotel, a movie theater, and a post office.
In the 1950s, the town began to decline as many of the businesses closed and the population began to decline. However, in the late 1990s, the town began to experience a resurgence as new businesses opened and the population began to increase.
Geography
Terra Bella is located at an elevation of approximately 300 feet above sea level. The town is situated in the San Joaquin Valley, and is surrounded by rolling hills and farmland. The climate in Terra Bella is semi-arid, with hot summers and mild winters.
The town is located approximately 10 miles south of Porterville and 25 miles northwest of Bakersfield. It is also located near the Sequoia National Forest, which is a popular destination for outdoor recreation.
Economy
The economy of Terra Bella is largely based on agriculture. The main crops grown in the area are cotton, wheat, and barley. The town is also home to several businesses, including a bank, a hotel, a movie theater, and a post office.
In addition, the town is home to several manufacturing companies, including a furniture factory and a plastics factory. The town is also home to a number of small businesses, including restaurants, shops, and other services.
Demographics
As of the 2010 census, the population of Terra Bella was 1,845. The racial makeup of the town was 75.3% White, 0.7% African American, 0.7% Native American, 0.3% Asian, 0.1% Pacific Islander, 19.7% from other races, and 3.1% from two or more races. Hispanic or Latino of any race were 33.2% of the population.
The median household income in Terra Bella was $37,917, and the median family income was $41,250. The per capita income for the town was $15,945. About 17.2% of families and 20.2% of the population were below the poverty line, including 28.3% of those under age 18 and 8.3% of those age 65 or over.
Common Questions
What is Per Capita Income in Terra Bella?
Per Capita income in Terra Bella is $16,013.
What is the Median Family Income in Terra Bella?
Median Family Income in Terra Bella is $29,091.
What is the Median Household income in Terra Bella?
Median Household Income in Terra Bella is $25,370.
What is Income or Wage Gap in Terra Bella?
Income or Wage Gap in Terra Bella is 33.1%.
Women in Terra Bella earn 66.9 cents for every dollar earned by a man.
What is Inequality or Gini Index in Terra Bella?
Inequality or Gini Index in Terra Bella is 0.55.
What is the Total Population of Terra Bella?
Total Population of Terra Bella is 1,806.
What is the Total Male Population of Terra Bella?
Total Male Population of Terra Bella is 940.
What is the Total Female Population of Terra Bella?
Total Female Population of Terra Bella is 866.
What is the Ratio of Males per 100 Females in Terra Bella?
There are 108.55 Males per 100 Females in Terra Bella.
What is the Ratio of Females per 100 Males in Terra Bella?
There are 92.13 Females per 100 Males in Terra Bella.
What is the Median Population Age in Terra Bella?
Median Population Age in Terra Bella is 26.7 Years.
What is the Average Family Size in Terra Bella
Average Family Size in Terra Bella is 3.8 People.
What is the Average Household Size in Terra Bella
Average Household Size in Terra Bella is 3.2 People.
How Large is the Labor Force in Terra Bella?
There are 576 People in the Labor Forcein in Terra Bella.
What is the Percentage of People in the Labor Force in Terra Bella?
47.0% of People are in the Labor Force in Terra Bella.
What is the Unemployment Rate in Terra Bella?
Unemployment Rate in Terra Bella is 38.9%.