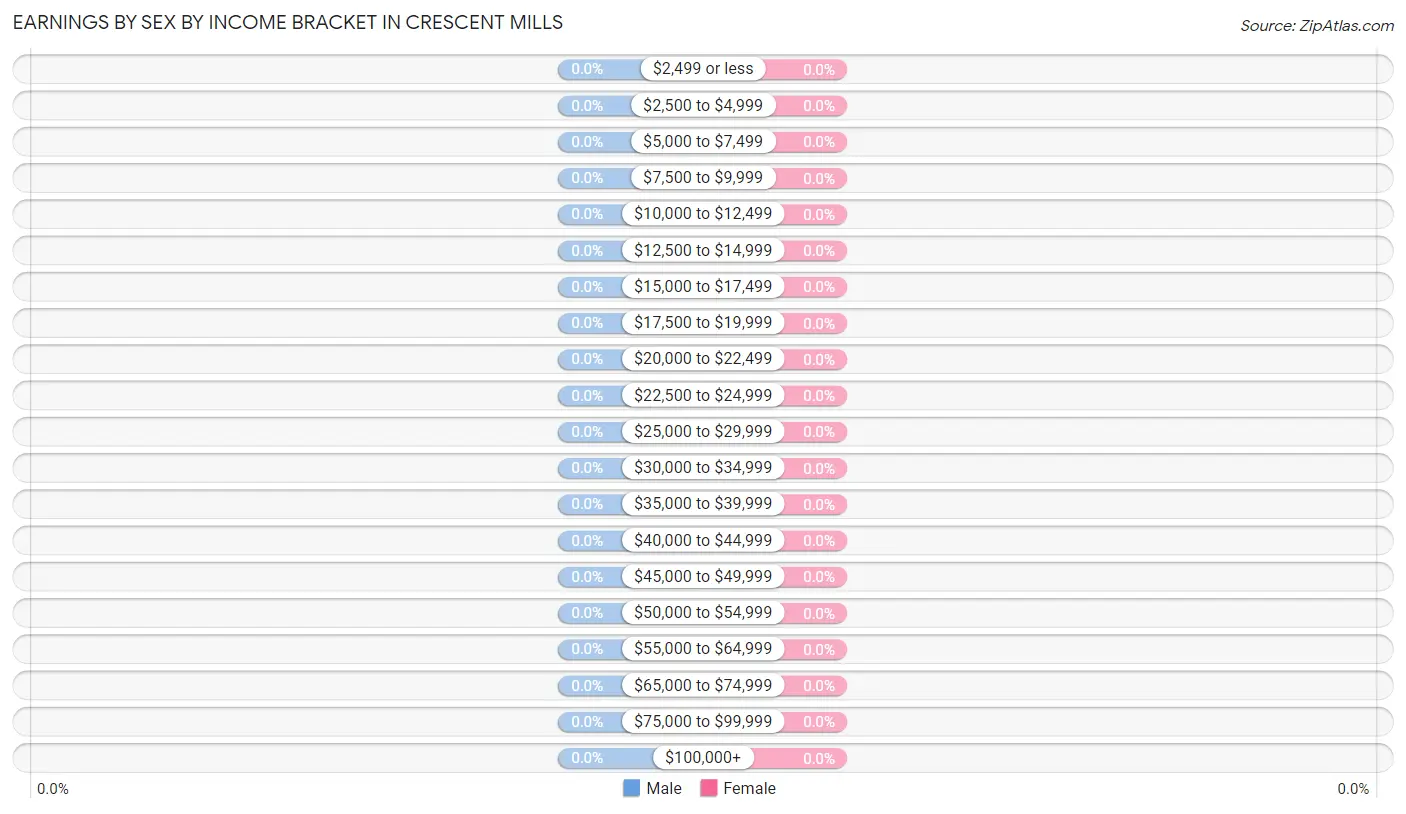
Earnings by Sex by Income Bracket in Crescent Mills
Income
Male
Female
$2,499 or less
0 (0.0%)
0 (0.0%)
$2,500 to $4,999
0 (0.0%)
0 (0.0%)
$5,000 to $7,499
0 (0.0%)
0 (0.0%)
$7,500 to $9,999
0 (0.0%)
0 (0.0%)
$10,000 to $12,499
0 (0.0%)
0 (0.0%)
$12,500 to $14,999
0 (0.0%)
0 (0.0%)
$15,000 to $17,499
0 (0.0%)
0 (0.0%)
$17,500 to $19,999
0 (0.0%)
0 (0.0%)
$20,000 to $22,499
0 (0.0%)
0 (0.0%)
$22,500 to $24,999
0 (0.0%)
0 (0.0%)
$25,000 to $29,999
0 (0.0%)
0 (0.0%)
$30,000 to $34,999
0 (0.0%)
0 (0.0%)
$35,000 to $39,999
0 (0.0%)
0 (0.0%)
$40,000 to $44,999
0 (0.0%)
0 (0.0%)
$45,000 to $49,999
0 (0.0%)
0 (0.0%)
$50,000 to $54,999
0 (0.0%)
0 (0.0%)
$55,000 to $64,999
0 (0.0%)
0 (0.0%)
$65,000 to $74,999
0 (0.0%)
0 (0.0%)
$75,000 to $99,999
0 (0.0%)
0 (0.0%)
$100,000+
0 (0.0%)
0 (0.0%)
Total
0 (0.0%)
0 (0.0%)
Earnings by Sex by Educational Attainment in Crescent Mills
Educational Attainment
Male Income
Female Income
Less than High School
-
-
High School Diploma
-
-
College or Associate's Degree
-
-
Bachelor's Degree
-
-
Graduate Degree
-
-
Total
-
-
Family Income in Crescent Mills
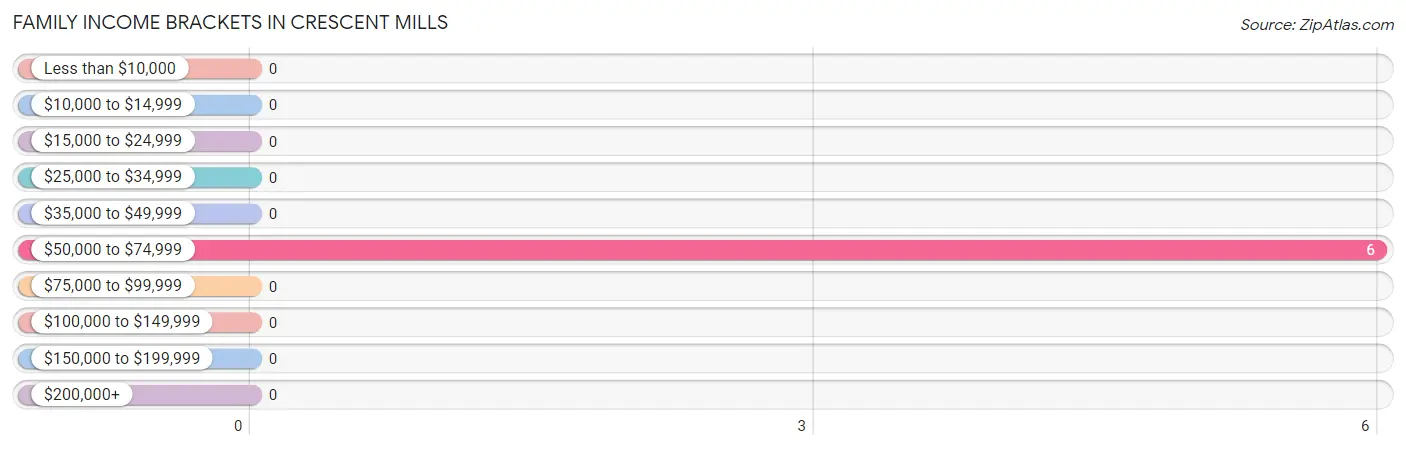
Family Income Brackets in Crescent Mills
According to the Crescent Mills family income data, there are 6 families falling into the $50,000 to $74,999 income range, which is the most common income bracket and makes up 100.0% of all families.
Income Bracket
# Families
% Families
Less than $10,000
0
0.0%
$10,000 to $14,999
0
0.0%
$15,000 to $24,999
0
0.0%
$25,000 to $34,999
0
0.0%
$35,000 to $49,999
0
0.0%
$50,000 to $74,999
6
100.0%
$75,000 to $99,999
0
0.0%
$100,000 to $149,999
0
0.0%
$150,000 to $199,999
0
0.0%
$200,000+
0
0.0%
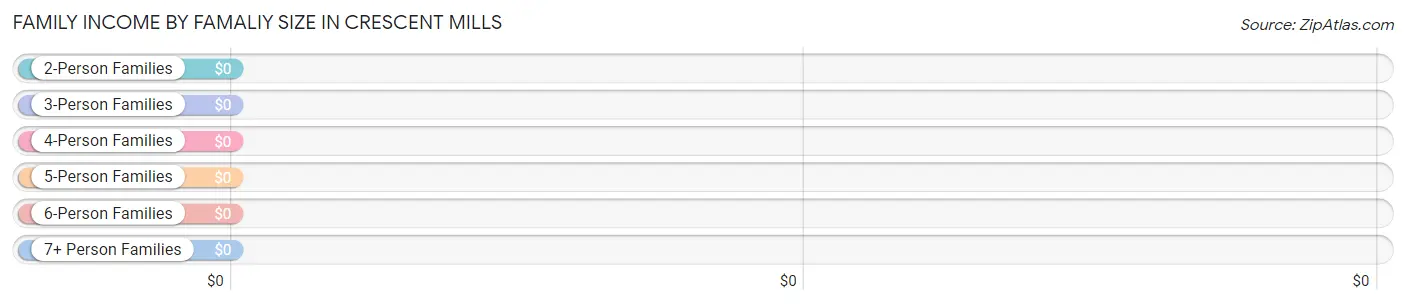
Family Income by Famaliy Size in Crescent Mills
Income Bracket
# Families
Median Income
2-Person Families
6 (100.0%)
$0
3-Person Families
0 (0.0%)
$0
4-Person Families
0 (0.0%)
$0
5-Person Families
0 (0.0%)
$0
6-Person Families
0 (0.0%)
$0
7+ Person Families
0 (0.0%)
$0
Total
6 (100.0%)
$0
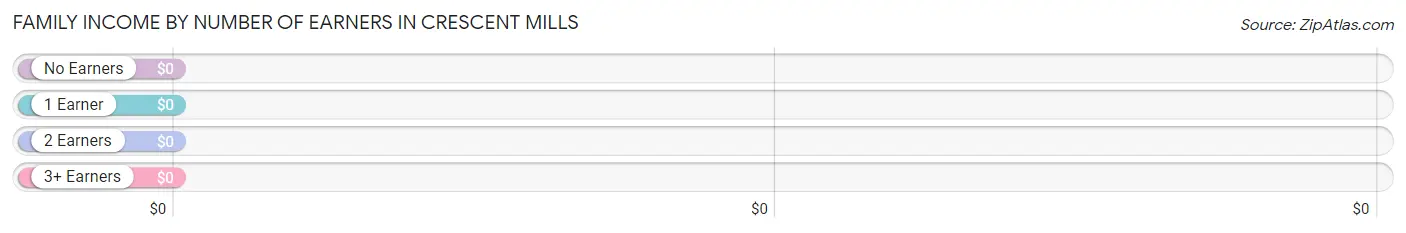
Family Income by Number of Earners in Crescent Mills
Number of Earners
# Families
Median Income
No Earners
6 (100.0%)
$0
1 Earner
0 (0.0%)
$0
2 Earners
0 (0.0%)
$0
3+ Earners
0 (0.0%)
$0
Total
6 (100.0%)
$0
Household Income in Crescent Mills
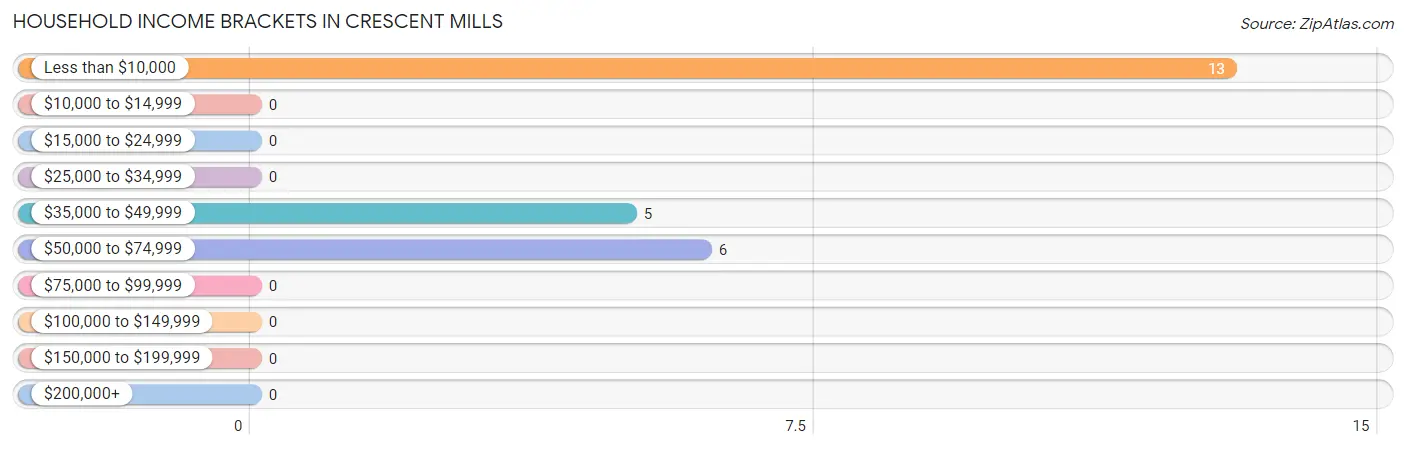
Household Income Brackets in Crescent Mills
With 13 households falling in the category, the less than $10,000 income range is the most frequent in Crescent Mills, accounting for 54.2% of all households.
Income Bracket
# Households
% Households
Less than $10,000
13
54.2%
$10,000 to $14,999
0
0.0%
$15,000 to $24,999
0
0.0%
$25,000 to $34,999
0
0.0%
$35,000 to $49,999
5
20.8%
$50,000 to $74,999
6
25.0%
$75,000 to $99,999
0
0.0%
$100,000 to $149,999
0
0.0%
$150,000 to $199,999
0
0.0%
$200,000+
0
0.0%
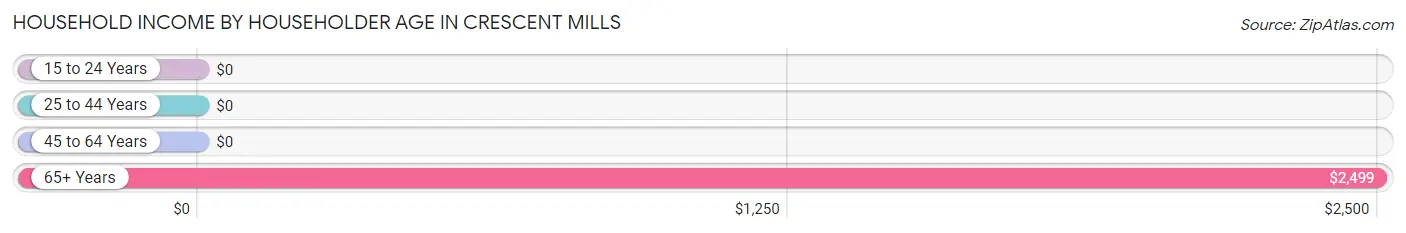
Household Income by Householder Age in Crescent Mills
The median household income in Crescent Mills is $2,499, with the highest median household income of $2,499 found in the 65+ years age bracket for the primary householder. A total of 24 households (100.0%) fall into this category.
Income Bracket
# Households
Median Income
15 to 24 Years
0 (0.0%)
$0
25 to 44 Years
0 (0.0%)
$0
45 to 64 Years
0 (0.0%)
$0
65+ Years
24 (100.0%)
$2,499
Total
24 (100.0%)
$2,499
Poverty in Crescent Mills
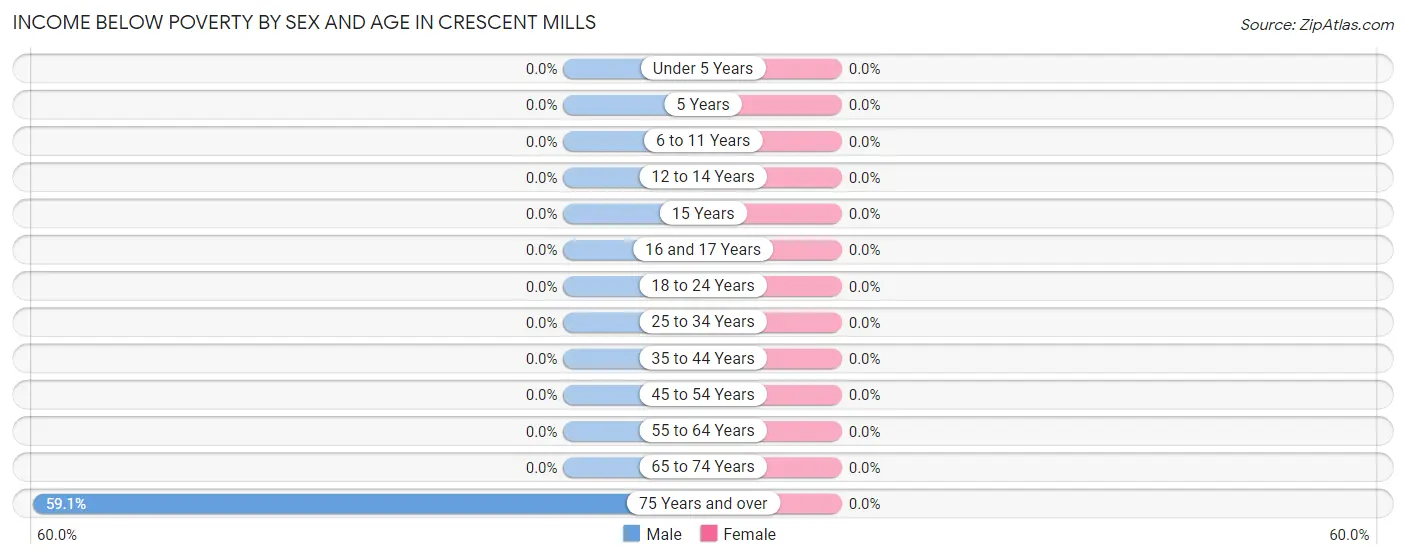
Income Below Poverty by Sex and Age in Crescent Mills
Age Bracket
Male
Female
Under 5 Years
0 (0.0%)
0 (0.0%)
5 Years
0 (0.0%)
0 (0.0%)
6 to 11 Years
0 (0.0%)
0 (0.0%)
12 to 14 Years
0 (0.0%)
0 (0.0%)
15 Years
0 (0.0%)
0 (0.0%)
16 and 17 Years
0 (0.0%)
0 (0.0%)
18 to 24 Years
0 (0.0%)
0 (0.0%)
25 to 34 Years
0 (0.0%)
0 (0.0%)
35 to 44 Years
0 (0.0%)
0 (0.0%)
45 to 54 Years
0 (0.0%)
0 (0.0%)
55 to 64 Years
0 (0.0%)
0 (0.0%)
65 to 74 Years
0 (0.0%)
0 (0.0%)
75 Years and over
13 (59.1%)
0 (0.0%)
Total
13 (59.1%)
0 (0.0%)
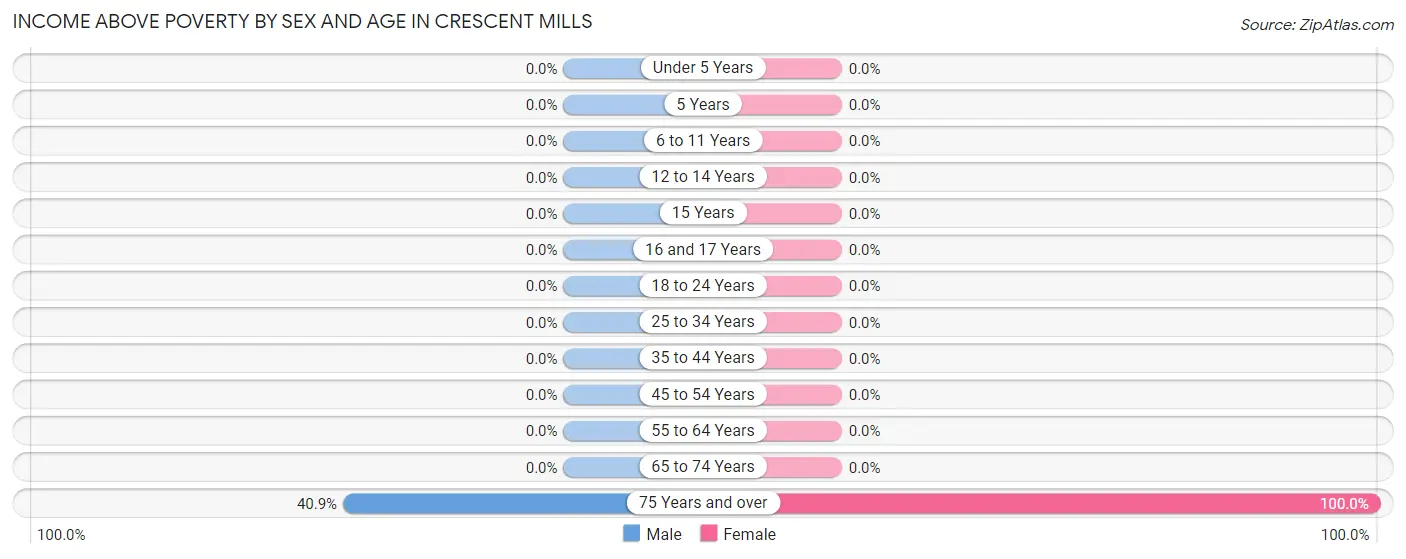
Income Above Poverty by Sex and Age in Crescent Mills
According to the poverty statistics in Crescent Mills, males aged 75 years and over and females aged 75 years and over are the age groups that are most secure financially, with 40.9% of males and 100.0% of females in these age groups living above the poverty line.
Age Bracket
Male
Female
Under 5 Years
0 (0.0%)
0 (0.0%)
5 Years
0 (0.0%)
0 (0.0%)
6 to 11 Years
0 (0.0%)
0 (0.0%)
12 to 14 Years
0 (0.0%)
0 (0.0%)
15 Years
0 (0.0%)
0 (0.0%)
16 and 17 Years
0 (0.0%)
0 (0.0%)
18 to 24 Years
0 (0.0%)
0 (0.0%)
25 to 34 Years
0 (0.0%)
0 (0.0%)
35 to 44 Years
0 (0.0%)
0 (0.0%)
45 to 54 Years
0 (0.0%)
0 (0.0%)
55 to 64 Years
0 (0.0%)
0 (0.0%)
65 to 74 Years
0 (0.0%)
0 (0.0%)
75 Years and over
9 (40.9%)
11 (100.0%)
Total
9 (40.9%)
11 (100.0%)
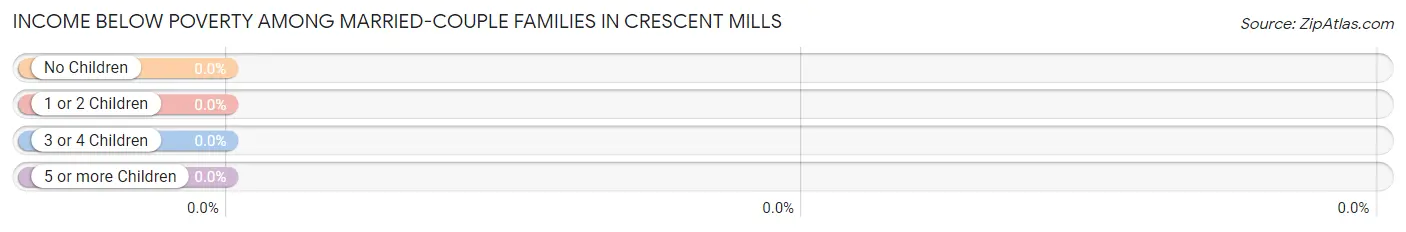
Income Below Poverty Among Married-Couple Families in Crescent Mills
Children
Above Poverty
Below Poverty
No Children
6 (100.0%)
0 (0.0%)
1 or 2 Children
0 (0.0%)
0 (0.0%)
3 or 4 Children
0 (0.0%)
0 (0.0%)
5 or more Children
0 (0.0%)
0 (0.0%)
Total
6 (100.0%)
0 (0.0%)
Income Below Poverty Among Single-Parent Households in Crescent Mills
Children
Single Father
Single Mother
No Children
0 (0.0%)
0 (0.0%)
1 or 2 Children
0 (0.0%)
0 (0.0%)
3 or 4 Children
0 (0.0%)
0 (0.0%)
5 or more Children
0 (0.0%)
0 (0.0%)
Total
0 (0.0%)
0 (0.0%)
Income Below Poverty Among Married-Couple vs Single-Parent Households in Crescent Mills
Children
Married-Couple Families
Single-Parent Households
No Children
0 (0.0%)
0 (0.0%)
1 or 2 Children
0 (0.0%)
0 (0.0%)
3 or 4 Children
0 (0.0%)
0 (0.0%)
5 or more Children
0 (0.0%)
0 (0.0%)
Total
0 (0.0%)
0 (0.0%)
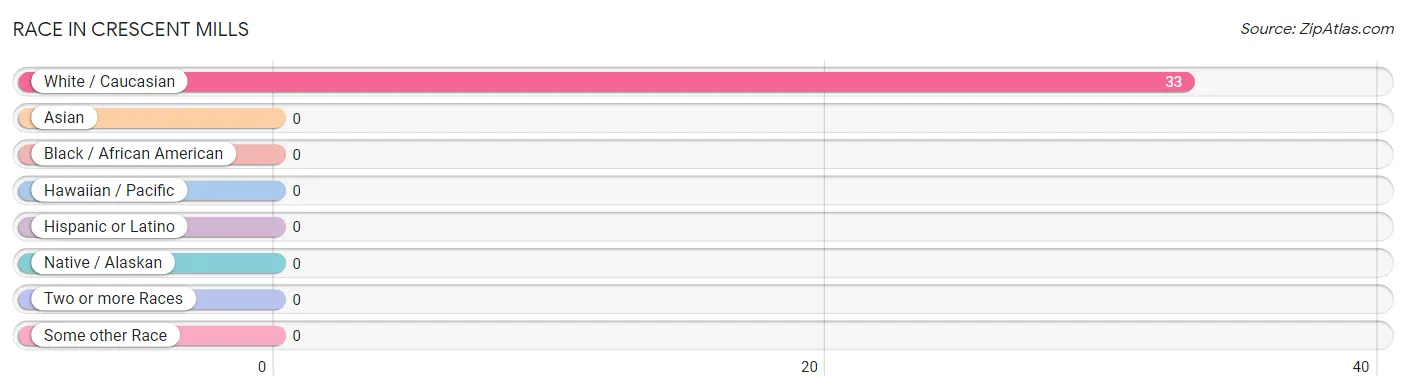
Race in Crescent Mills
The most populous races in Crescent Mills are , and White / Caucasian (33 | 100.0%).
Race
# Population
% Population
Asian
0
0.0%
Black / African American
0
0.0%
Hawaiian / Pacific
0
0.0%
Hispanic or Latino
0
0.0%
Native / Alaskan
0
0.0%
White / Caucasian
33
100.0%
Two or more Races
0
0.0%
Some other Race
0
0.0%
Total
33
100.0%
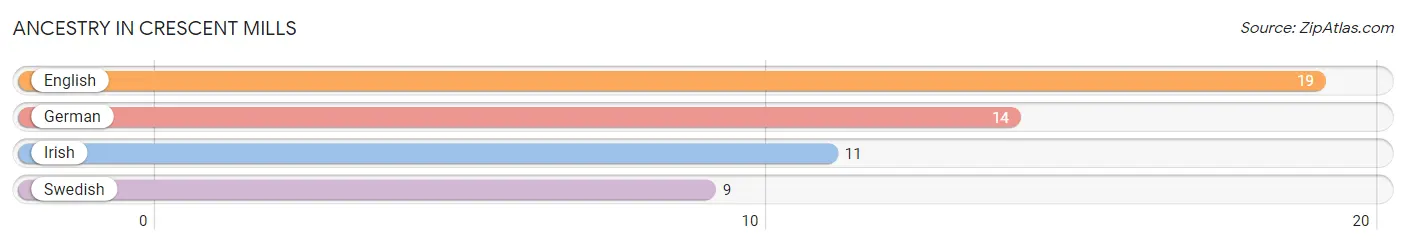
Ancestry in Crescent Mills
The most populous ancestries reported in Crescent Mills are English (19 | 57.6%), German (14 | 42.4%), Irish (11 | 33.3%), and Swedish (9 | 27.3%), together accounting for 160.6% of all Crescent Mills residents.
Ancestry
# Population
% Population
English
19
57.6%
German
14
42.4%
Irish
11
33.3%
Swedish
9
27.3%
View All 4 Rows
Immigrants in Crescent Mills
Immigration Origin
# Population
% Population
View All 0 Rows
Sex and Age in Crescent Mills
Sex and Age in Crescent Mills
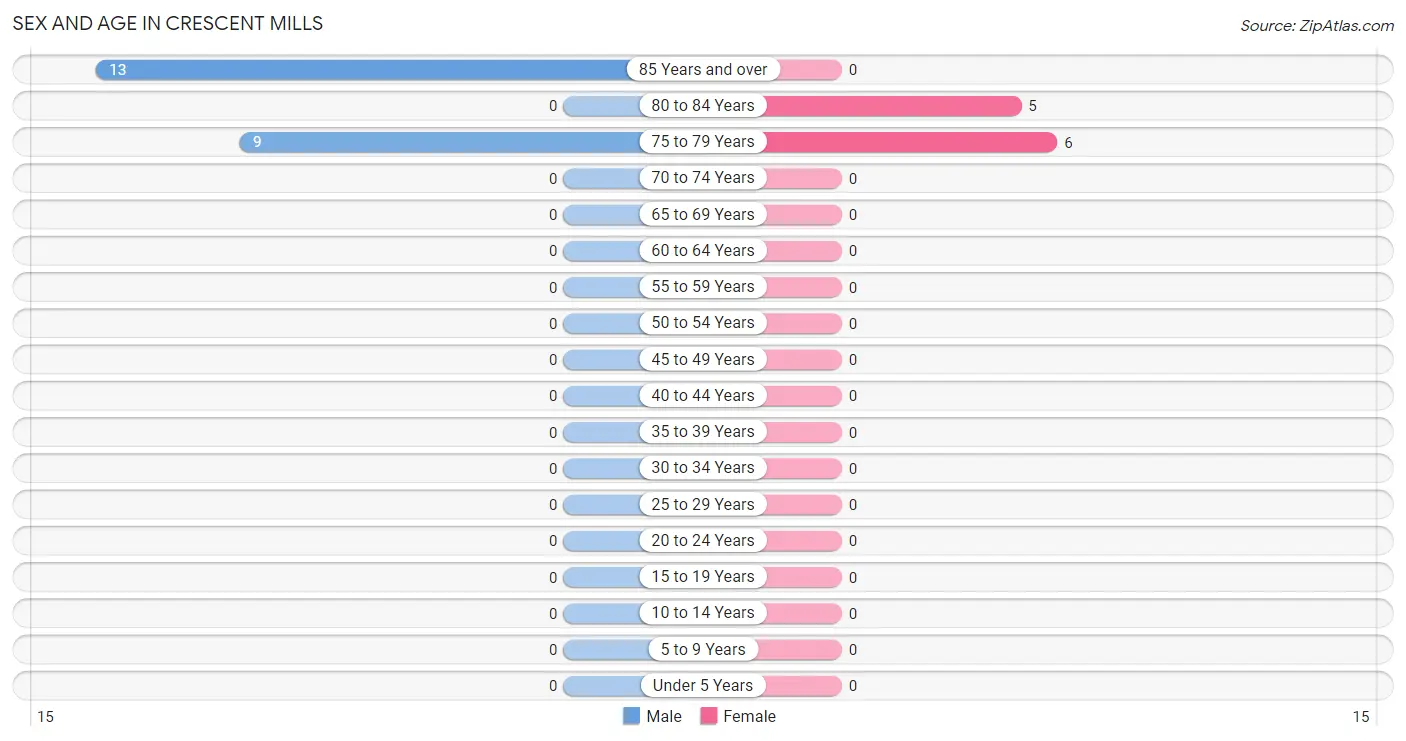
The most populous age groups in Crescent Mills are 85 Years and over (13 | 59.1%) for men and 75 to 79 Years (6 | 54.5%) for women.
Age Bracket
Male
Female
Under 5 Years
0 (0.0%)
0 (0.0%)
5 to 9 Years
0 (0.0%)
0 (0.0%)
10 to 14 Years
0 (0.0%)
0 (0.0%)
15 to 19 Years
0 (0.0%)
0 (0.0%)
20 to 24 Years
0 (0.0%)
0 (0.0%)
25 to 29 Years
0 (0.0%)
0 (0.0%)
30 to 34 Years
0 (0.0%)
0 (0.0%)
35 to 39 Years
0 (0.0%)
0 (0.0%)
40 to 44 Years
0 (0.0%)
0 (0.0%)
45 to 49 Years
0 (0.0%)
0 (0.0%)
50 to 54 Years
0 (0.0%)
0 (0.0%)
55 to 59 Years
0 (0.0%)
0 (0.0%)
60 to 64 Years
0 (0.0%)
0 (0.0%)
65 to 69 Years
0 (0.0%)
0 (0.0%)
70 to 74 Years
0 (0.0%)
0 (0.0%)
75 to 79 Years
9 (40.9%)
6 (54.5%)
80 to 84 Years
0 (0.0%)
5 (45.5%)
85 Years and over
13 (59.1%)
0 (0.0%)
Total
22 (100.0%)
11 (100.0%)
Families and Households in Crescent Mills
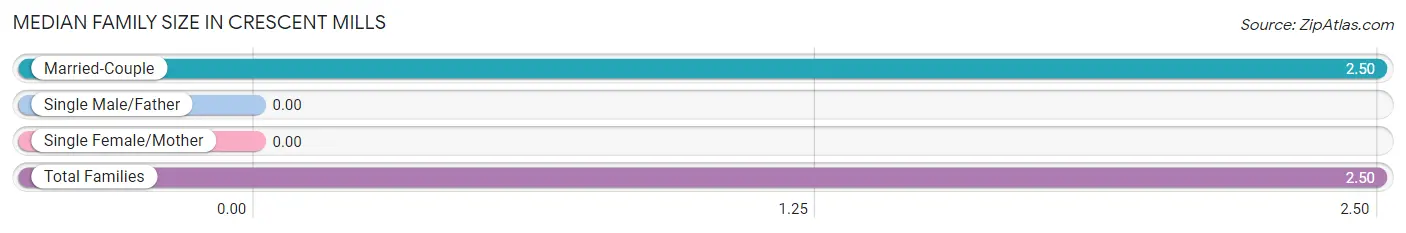
Median Family Size in Crescent Mills
Family Type
# Families
Family Size
Married-Couple
6 (100.0%)
2.50
Single Male/Father
0 (0.0%)
-
Single Female/Mother
0 (0.0%)
-
Total Families
6 (100.0%)
2.50
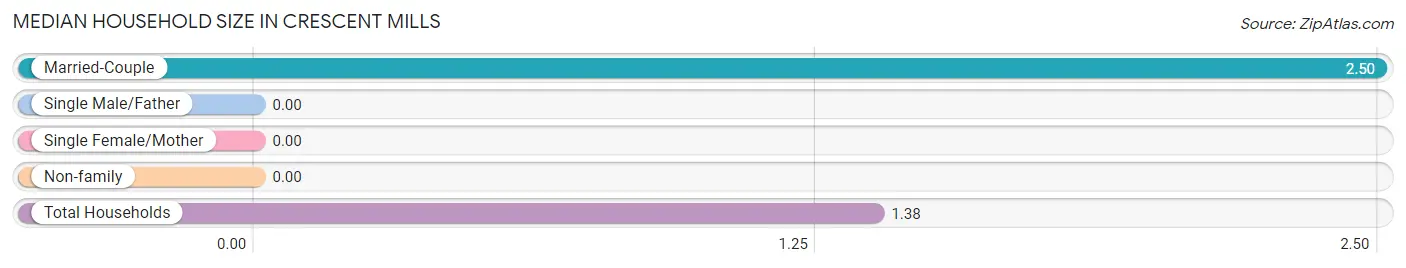
Median Household Size in Crescent Mills
Household Type
# Households
Household Size
Married-Couple
6 (25.0%)
2.50
Single Male/Father
0 (0.0%)
-
Single Female/Mother
0 (0.0%)
-
Non-family
18 (75.0%)
-
Total Households
24 (100.0%)
1.38
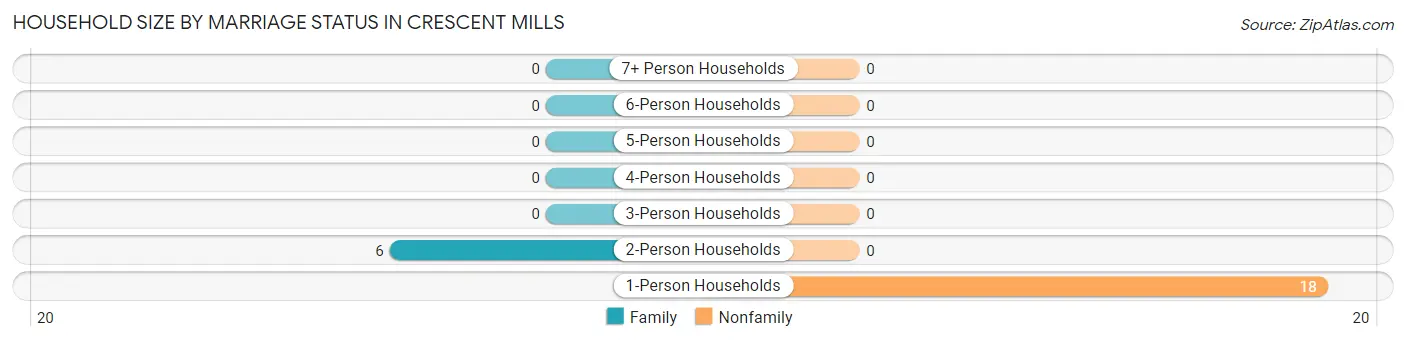
Household Size by Marriage Status in Crescent Mills
Out of a total of 24 households in Crescent Mills, 6 (25.0%) are family households, while 18 (75.0%) are nonfamily households. The most numerous type of family households are 2-person households, comprising 6, and the most common type of nonfamily households are 1-person households, comprising 18.
Household Size
Family Households
Nonfamily Households
1-Person Households
-
18 (75.0%)
2-Person Households
6 (25.0%)
0 (0.0%)
3-Person Households
0 (0.0%)
0 (0.0%)
4-Person Households
0 (0.0%)
0 (0.0%)
5-Person Households
0 (0.0%)
0 (0.0%)
6-Person Households
0 (0.0%)
0 (0.0%)
7+ Person Households
0 (0.0%)
0 (0.0%)
Total
6 (25.0%)
18 (75.0%)
Female Fertility in Crescent Mills
Fertility by Age in Crescent Mills
Age Bracket
Women with Births
Births / 1,000 Women
15 to 19 years
0 (0.0%)
0.0
20 to 34 years
0 (0.0%)
0.0
35 to 50 years
0 (0.0%)
0.0
Total
0 (0.0%)
0.0
Fertility by Age by Marriage Status in Crescent Mills
Age Bracket
Married
Unmarried
15 to 19 years
0 (0.0%)
0 (0.0%)
20 to 34 years
0 (0.0%)
0 (0.0%)
35 to 50 years
0 (0.0%)
0 (0.0%)
Total
0 (0.0%)
0 (0.0%)
Fertility by Education in Crescent Mills
Educational Attainment
Women with Births
Births / 1,000 Women
Less than High School
0 (0.0%)
0.0
High School Diploma
0 (0.0%)
0.0
College or Associate's Degree
0 (0.0%)
0.0
Bachelor's Degree
0 (0.0%)
0.0
Graduate Degree
0 (0.0%)
0.0
Total
0 (0.0%)
0.0
Fertility by Education by Marriage Status in Crescent Mills
Educational Attainment
Married
Unmarried
Less than High School
0 (0.0%)
0 (0.0%)
High School Diploma
0 (0.0%)
0 (0.0%)
College or Associate's Degree
0 (0.0%)
0 (0.0%)
Bachelor's Degree
0 (0.0%)
0 (0.0%)
Graduate Degree
0 (0.0%)
0 (0.0%)
Total
0 (0.0%)
0 (0.0%)
Employment Characteristics in Crescent Mills
Employment by Class of Employer in Crescent Mills
Employer Class
# Employees
% Employees
Private Company Employees
0
0.0%
Self-Employed (Incorporated)
0
0.0%
Self-Employed (Not Incorporated)
0
0.0%
Not-for-profit Organizations
0
0.0%
Local Government Employees
0
0.0%
State Government Employees
0
0.0%
Federal Government Employees
0
0.0%
Unpaid Family Workers
0
0.0%
Total
0
0.0%
Employment Status by Age in Crescent Mills
Age Bracket
In Labor Force
Unemployed
16 to 19 Years
0 (0.0%)
0 (0.0%)
20 to 24 Years
0 (0.0%)
0 (0.0%)
25 to 29 Years
0 (0.0%)
0 (0.0%)
30 to 34 Years
0 (0.0%)
0 (0.0%)
35 to 44 Years
0 (0.0%)
0 (0.0%)
45 to 54 Years
0 (0.0%)
0 (0.0%)
55 to 59 Years
0 (0.0%)
0 (0.0%)
60 to 64 Years
0 (0.0%)
0 (0.0%)
65 to 74 Years
0 (0.0%)
0 (0.0%)
75 Years and over
0 (0.0%)
0 (0.0%)
Total
0 (0.0%)
0 (0.0%)
Employment Status by Educational Attainment in Crescent Mills
Educational Attainment
In Labor Force
Unemployed
Less than High School
0 (0.0%)
0 (0.0%)
High School Diploma
0 (0.0%)
0 (0.0%)
College / Associate Degree
0 (0.0%)
0 (0.0%)
Bachelor's Degree or higher
0 (0.0%)
0 (0.0%)
Total
0 (0.0%)
0 (0.0%)
Employment Occupations by Sex in Crescent Mills
Management, Business, Science and Arts Occupations
Management, Business, Science and Arts Occupations by Sex
Occupation
Male
Female
Management
0 (0.0%)
0 (0.0%)
Business & Financial
0 (0.0%)
0 (0.0%)
Computers, Engineering & Science
0 (0.0%)
0 (0.0%)
Computers & Mathematics
0 (0.0%)
0 (0.0%)
Architecture & Engineering
0 (0.0%)
0 (0.0%)
Life, Physical & Social Science
0 (0.0%)
0 (0.0%)
Community & Social Service
0 (0.0%)
0 (0.0%)
Education, Arts & Media
0 (0.0%)
0 (0.0%)
Legal Services & Support
0 (0.0%)
0 (0.0%)
Education Instruction & Library
0 (0.0%)
0 (0.0%)
Arts, Media & Entertainment
0 (0.0%)
0 (0.0%)
Health Diagnosing & Treating
0 (0.0%)
0 (0.0%)
Health Technologists
0 (0.0%)
0 (0.0%)
Total (Category)
0 (0.0%)
0 (0.0%)
Total (Overall)
0 (0.0%)
0 (0.0%)
Services Occupations
Services Occupations by Sex
Occupation
Male
Female
Healthcare Support
0 (0.0%)
0 (0.0%)
Security & Protection
0 (0.0%)
0 (0.0%)
Firefighting & Prevention
0 (0.0%)
0 (0.0%)
Law Enforcement
0 (0.0%)
0 (0.0%)
Food Preparation & Serving
0 (0.0%)
0 (0.0%)
Cleaning & Maintenance
0 (0.0%)
0 (0.0%)
Personal Care & Service
0 (0.0%)
0 (0.0%)
Total (Category)
0 (0.0%)
0 (0.0%)
Total (Overall)
0 (0.0%)
0 (0.0%)
Sales and Office Occupations
Sales and Office Occupations by Sex
Occupation
Male
Female
Sales & Related
0 (0.0%)
0 (0.0%)
Office & Administration
0 (0.0%)
0 (0.0%)
Total (Category)
0 (0.0%)
0 (0.0%)
Total (Overall)
0 (0.0%)
0 (0.0%)
Natural Resources, Construction and Maintenance Occupations
Natural Resources, Construction and Maintenance Occupations by Sex
Occupation
Male
Female
Farming, Fishing & Forestry
0 (0.0%)
0 (0.0%)
Construction & Extraction
0 (0.0%)
0 (0.0%)
Installation, Maintenance & Repair
0 (0.0%)
0 (0.0%)
Total (Category)
0 (0.0%)
0 (0.0%)
Total (Overall)
0 (0.0%)
0 (0.0%)
Production, Transportation and Moving Occupations
Production, Transportation and Moving Occupations by Sex
Occupation
Male
Female
Production
0 (0.0%)
0 (0.0%)
Transportation
0 (0.0%)
0 (0.0%)
Material Moving
0 (0.0%)
0 (0.0%)
Total (Category)
0 (0.0%)
0 (0.0%)
Total (Overall)
0 (0.0%)
0 (0.0%)
Employment Industries by Sex in Crescent Mills
Employment Industries in Crescent Mills
Employment Industries by Sex in Crescent Mills
Industry
Male
Female
Agriculture, Fishing & Hunting
0 (0.0%)
0 (0.0%)
Mining, Quarrying, & Extraction
0 (0.0%)
0 (0.0%)
Construction
0 (0.0%)
0 (0.0%)
Manufacturing
0 (0.0%)
0 (0.0%)
Wholesale Trade
0 (0.0%)
0 (0.0%)
Retail Trade
0 (0.0%)
0 (0.0%)
Transportation & Warehousing
0 (0.0%)
0 (0.0%)
Utilities
0 (0.0%)
0 (0.0%)
Information
0 (0.0%)
0 (0.0%)
Finance & Insurance
0 (0.0%)
0 (0.0%)
Real Estate, Rental & Leasing
0 (0.0%)
0 (0.0%)
Professional & Scientific
0 (0.0%)
0 (0.0%)
Enterprise Management
0 (0.0%)
0 (0.0%)
Administrative & Support
0 (0.0%)
0 (0.0%)
Educational Services
0 (0.0%)
0 (0.0%)
Health Care & Social Assistance
0 (0.0%)
0 (0.0%)
Arts, Entertainment & Recreation
0 (0.0%)
0 (0.0%)
Accommodation & Food Services
0 (0.0%)
0 (0.0%)
Public Administration
0 (0.0%)
0 (0.0%)
Total
0 (0.0%)
0 (0.0%)
Education in Crescent Mills
School Enrollment in Crescent Mills
School Level
# Students
% Students
Nursery / Preschool
0
0.0%
Kindergarten
0
0.0%
Elementary School
0
0.0%
Middle School
0
0.0%
High School
0
0.0%
College / Undergraduate
0
0.0%
Graduate / Professional
0
0.0%
Total
0
0.0%
School Enrollment by Age by Funding Source in Crescent Mills
Age Bracket
Public School
Private School
3 to 4 Year Olds
0 (0.0%)
0 (0.0%)
5 to 9 Year Old
0 (0.0%)
0 (0.0%)
10 to 14 Year Olds
0 (0.0%)
0 (0.0%)
15 to 17 Year Olds
0 (0.0%)
0 (0.0%)
18 to 19 Year Olds
0 (0.0%)
0 (0.0%)
20 to 24 Year Olds
0 (0.0%)
0 (0.0%)
25 to 34 Year Olds
0 (0.0%)
0 (0.0%)
35 Years and over
0 (0.0%)
0 (0.0%)
Total
0 (0.0%)
0 (0.0%)
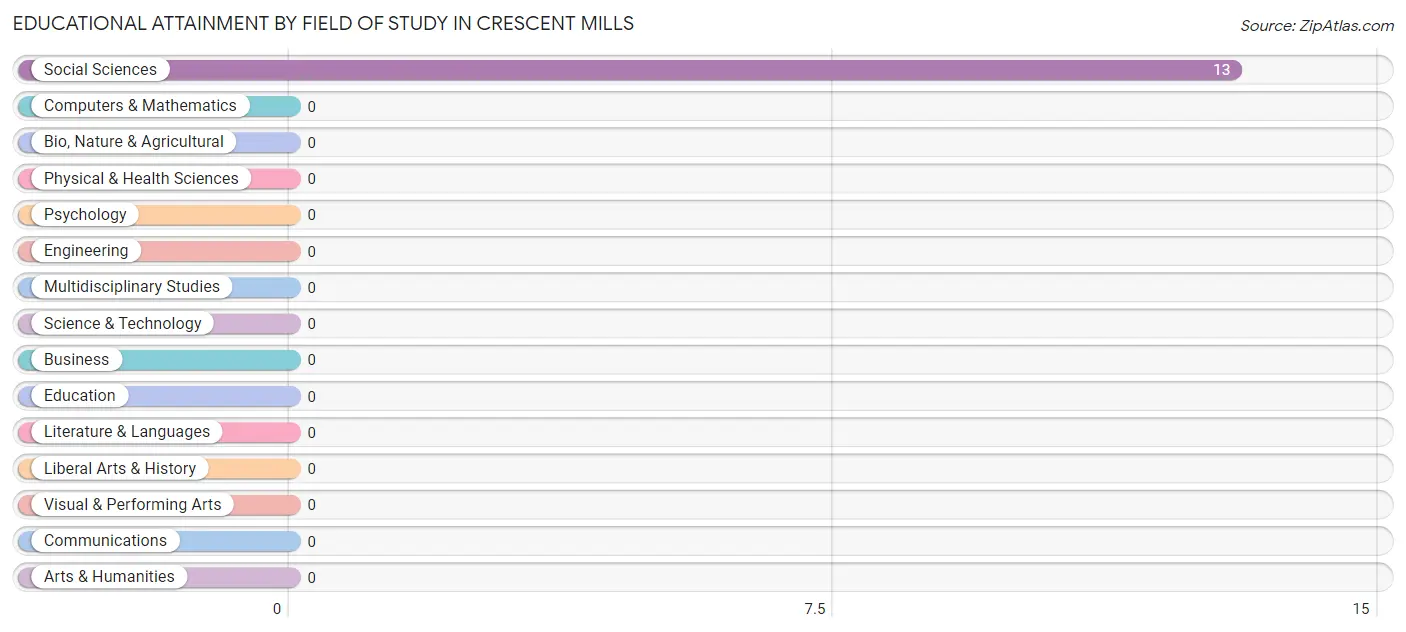
Educational Attainment by Field of Study in Crescent Mills
, and social sciences (13 | 100.0%) are the most common fields of study among 13 individuals in Crescent Mills who have obtained a bachelor's degree or higher.
Field of Study
# Graduates
% Graduates
Computers & Mathematics
0
0.0%
Bio, Nature & Agricultural
0
0.0%
Physical & Health Sciences
0
0.0%
Psychology
0
0.0%
Social Sciences
13
100.0%
Engineering
0
0.0%
Multidisciplinary Studies
0
0.0%
Science & Technology
0
0.0%
Business
0
0.0%
Education
0
0.0%
Literature & Languages
0
0.0%
Liberal Arts & History
0
0.0%
Visual & Performing Arts
0
0.0%
Communications
0
0.0%
Arts & Humanities
0
0.0%
Total
13
100.0%
Transportation & Commute in Crescent Mills
Vehicle Availability by Sex in Crescent Mills
Vehicles Available
Male
Female
No Vehicle
0 (0.0%)
0 (0.0%)
1 Vehicle
0 (0.0%)
0 (0.0%)
2 Vehicles
0 (0.0%)
0 (0.0%)
3 Vehicles
0 (0.0%)
0 (0.0%)
4 Vehicles
0 (0.0%)
0 (0.0%)
5 or more Vehicles
0 (0.0%)
0 (0.0%)
Total
0 (0.0%)
0 (0.0%)
Commute Time in Crescent Mills
Commute Time
# Commuters
% Commuters
Less than 5 Minutes
0
0.0%
5 to 9 Minutes
0
0.0%
10 to 14 Minutes
0
0.0%
15 to 19 Minutes
0
0.0%
20 to 24 Minutes
0
0.0%
25 to 29 Minutes
0
0.0%
30 to 34 Minutes
0
0.0%
35 to 39 Minutes
0
0.0%
40 to 44 Minutes
0
0.0%
45 to 59 Minutes
0
0.0%
60 to 89 Minutes
0
0.0%
90 or more Minutes
0
0.0%
Commute Time by Sex in Crescent Mills
Commute Time
Male
Female
Less than 5 Minutes
0 (0.0%)
0 (0.0%)
5 to 9 Minutes
0 (0.0%)
0 (0.0%)
10 to 14 Minutes
0 (0.0%)
0 (0.0%)
15 to 19 Minutes
0 (0.0%)
0 (0.0%)
20 to 24 Minutes
0 (0.0%)
0 (0.0%)
25 to 29 Minutes
0 (0.0%)
0 (0.0%)
30 to 34 Minutes
0 (0.0%)
0 (0.0%)
35 to 39 Minutes
0 (0.0%)
0 (0.0%)
40 to 44 Minutes
0 (0.0%)
0 (0.0%)
45 to 59 Minutes
0 (0.0%)
0 (0.0%)
60 to 89 Minutes
0 (0.0%)
0 (0.0%)
90 or more Minutes
0 (0.0%)
0 (0.0%)
Time of Departure to Work by Sex in Crescent Mills
Time of Departure
Male
Female
12:00 AM to 4:59 AM
0 (0.0%)
0 (0.0%)
5:00 AM to 5:29 AM
0 (0.0%)
0 (0.0%)
5:30 AM to 5:59 AM
0 (0.0%)
0 (0.0%)
6:00 AM to 6:29 AM
0 (0.0%)
0 (0.0%)
6:30 AM to 6:59 AM
0 (0.0%)
0 (0.0%)
7:00 AM to 7:29 AM
0 (0.0%)
0 (0.0%)
7:30 AM to 7:59 AM
0 (0.0%)
0 (0.0%)
8:00 AM to 8:29 AM
0 (0.0%)
0 (0.0%)
8:30 AM to 8:59 AM
0 (0.0%)
0 (0.0%)
9:00 AM to 9:59 AM
0 (0.0%)
0 (0.0%)
10:00 AM to 10:59 AM
0 (0.0%)
0 (0.0%)
11:00 AM to 11:59 AM
0 (0.0%)
0 (0.0%)
12:00 PM to 3:59 PM
0 (0.0%)
0 (0.0%)
4:00 PM to 11:59 PM
0 (0.0%)
0 (0.0%)
Total
0 (0.0%)
0 (0.0%)
Housing Occupancy in Crescent Mills
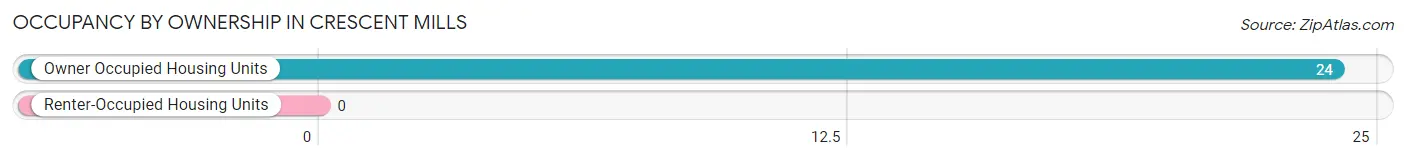
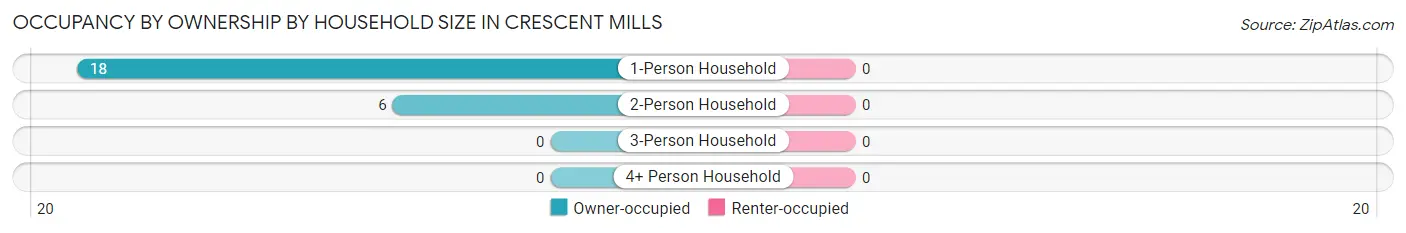
Occupancy by Ownership in Crescent Mills
Of the total 24 dwellings in Crescent Mills, owner-occupied units account for 24 (100.0%), while renter-occupied units make up 0 (0.0%).
Occupancy
# Housing Units
% Housing Units
Owner Occupied Housing Units
24
100.0%
Renter-Occupied Housing Units
0
0.0%
Total Occupied Housing Units
24
100.0%
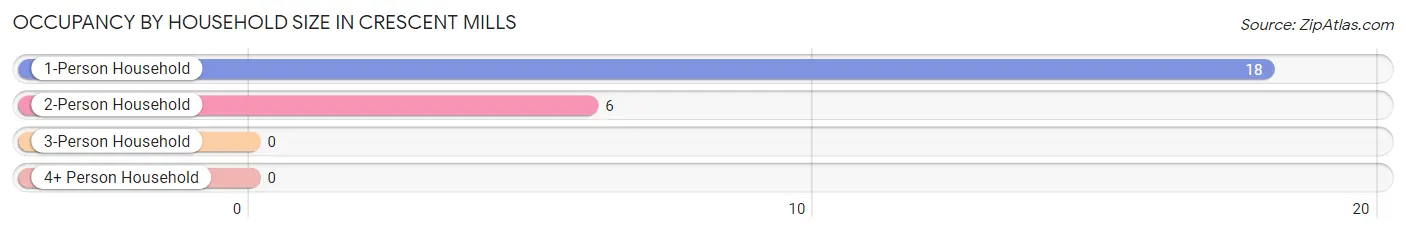
Occupancy by Household Size in Crescent Mills
Household Size
# Housing Units
% Housing Units
1-Person Household
18
75.0%
2-Person Household
6
25.0%
3-Person Household
0
0.0%
4+ Person Household
0
0.0%
Total Housing Units
24
100.0%
Occupancy by Ownership by Household Size in Crescent Mills
Household Size
Owner-occupied
Renter-occupied
1-Person Household
18 (100.0%)
0 (0.0%)
2-Person Household
6 (100.0%)
0 (0.0%)
3-Person Household
0 (0.0%)
0 (0.0%)
4+ Person Household
0 (0.0%)
0 (0.0%)
Total Housing Units
24 (100.0%)
0 (0.0%)
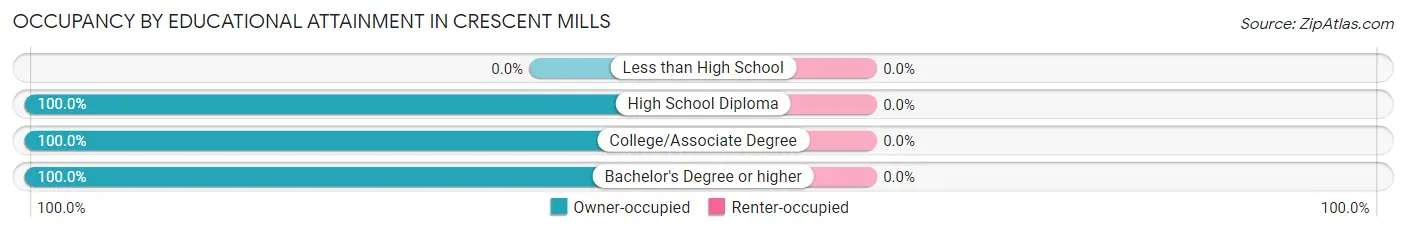
Occupancy by Educational Attainment in Crescent Mills
Household Size
Owner-occupied
Renter-occupied
Less than High School
0 (0.0%)
0 (0.0%)
High School Diploma
6 (100.0%)
0 (0.0%)
College/Associate Degree
5 (100.0%)
0 (0.0%)
Bachelor's Degree or higher
13 (100.0%)
0 (0.0%)
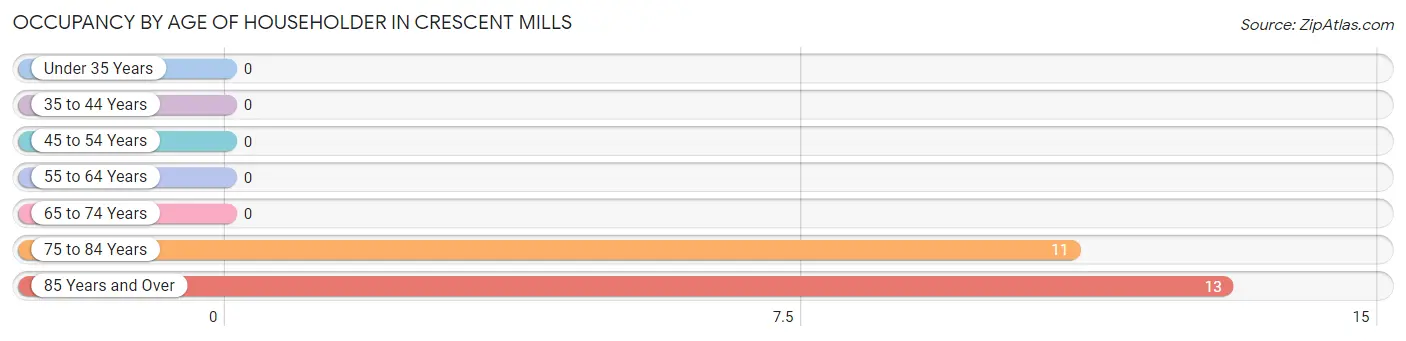
Occupancy by Age of Householder in Crescent Mills
Age Bracket
# Households
% Households
Under 35 Years
0
0.0%
35 to 44 Years
0
0.0%
45 to 54 Years
0
0.0%
55 to 64 Years
0
0.0%
65 to 74 Years
0
0.0%
75 to 84 Years
11
45.8%
85 Years and Over
13
54.2%
Total
24
100.0%
Housing Finances in Crescent Mills
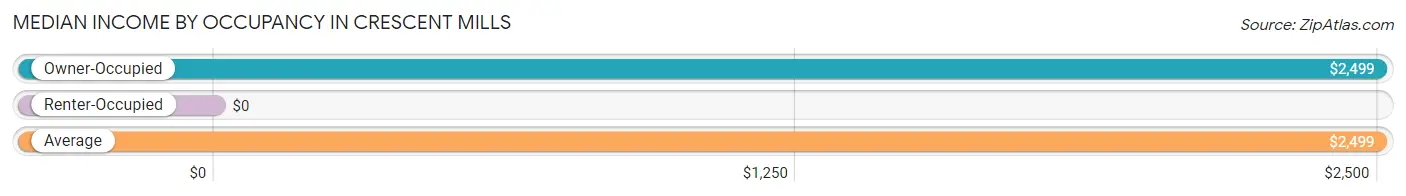
Median Income by Occupancy in Crescent Mills
Occupancy Type
# Households
Median Income
Owner-Occupied
24 (100.0%)
$2,499
Renter-Occupied
0 (0.0%)
$0
Average
24 (100.0%)
$2,499
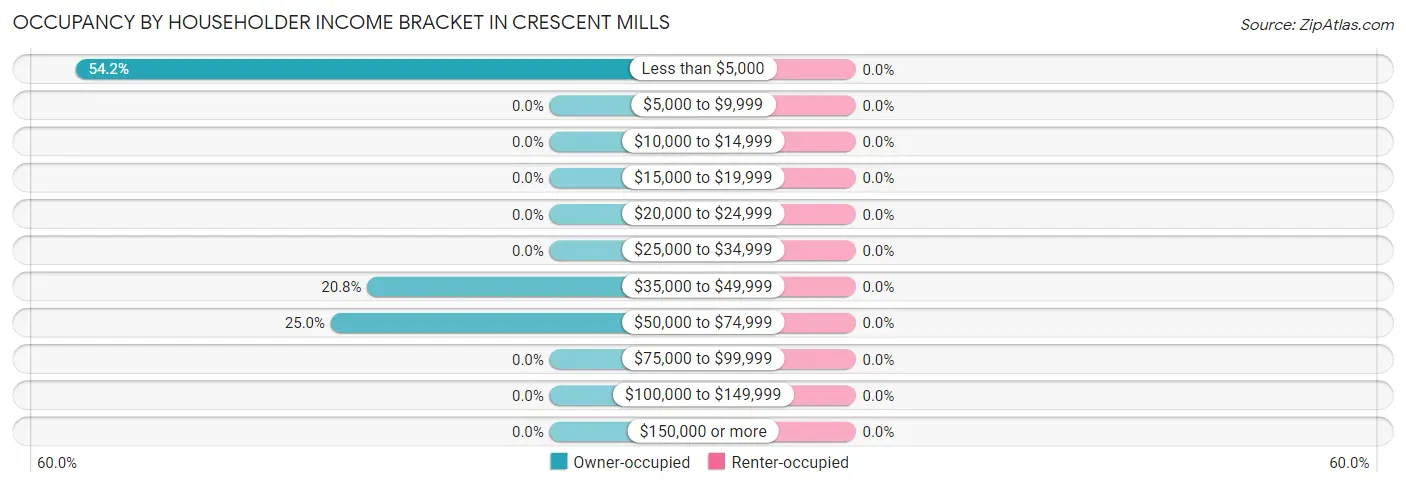
Occupancy by Householder Income Bracket in Crescent Mills
Income Bracket
Owner-occupied
Renter-occupied
Less than $5,000
13 (54.2%)
0 (0.0%)
$5,000 to $9,999
0 (0.0%)
0 (0.0%)
$10,000 to $14,999
0 (0.0%)
0 (0.0%)
$15,000 to $19,999
0 (0.0%)
0 (0.0%)
$20,000 to $24,999
0 (0.0%)
0 (0.0%)
$25,000 to $34,999
0 (0.0%)
0 (0.0%)
$35,000 to $49,999
5 (20.8%)
0 (0.0%)
$50,000 to $74,999
6 (25.0%)
0 (0.0%)
$75,000 to $99,999
0 (0.0%)
0 (0.0%)
$100,000 to $149,999
0 (0.0%)
0 (0.0%)
$150,000 or more
0 (0.0%)
0 (0.0%)
Total
24 (100.0%)
0 (0.0%)
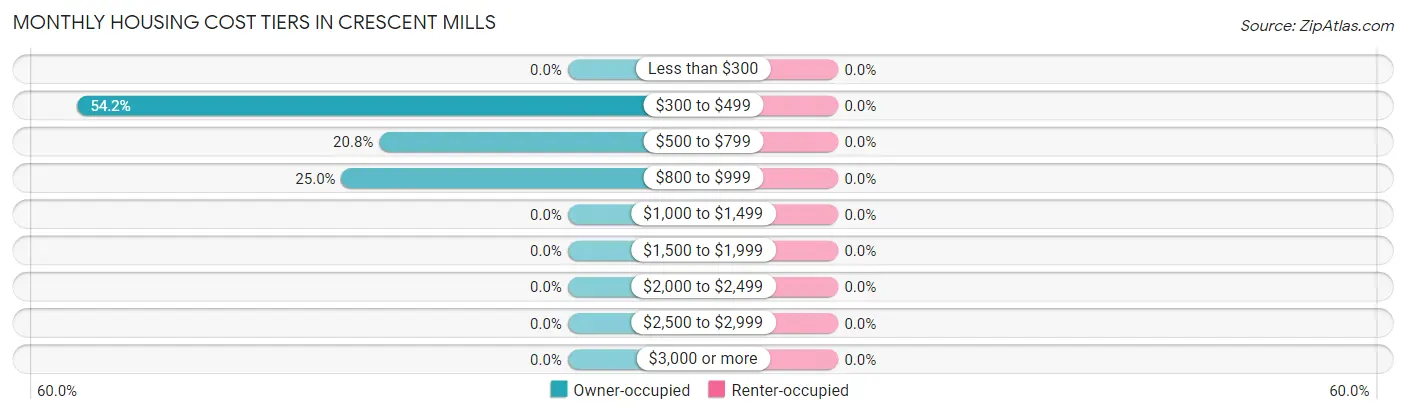
Monthly Housing Cost Tiers in Crescent Mills
Monthly Cost
Owner-occupied
Renter-occupied
Less than $300
0 (0.0%)
0 (0.0%)
$300 to $499
13 (54.2%)
0 (0.0%)
$500 to $799
5 (20.8%)
0 (0.0%)
$800 to $999
6 (25.0%)
0 (0.0%)
$1,000 to $1,499
0 (0.0%)
0 (0.0%)
$1,500 to $1,999
0 (0.0%)
0 (0.0%)
$2,000 to $2,499
0 (0.0%)
0 (0.0%)
$2,500 to $2,999
0 (0.0%)
0 (0.0%)
$3,000 or more
0 (0.0%)
0 (0.0%)
Total
24 (100.0%)
0 (0.0%)
Physical Housing Characteristics in Crescent Mills
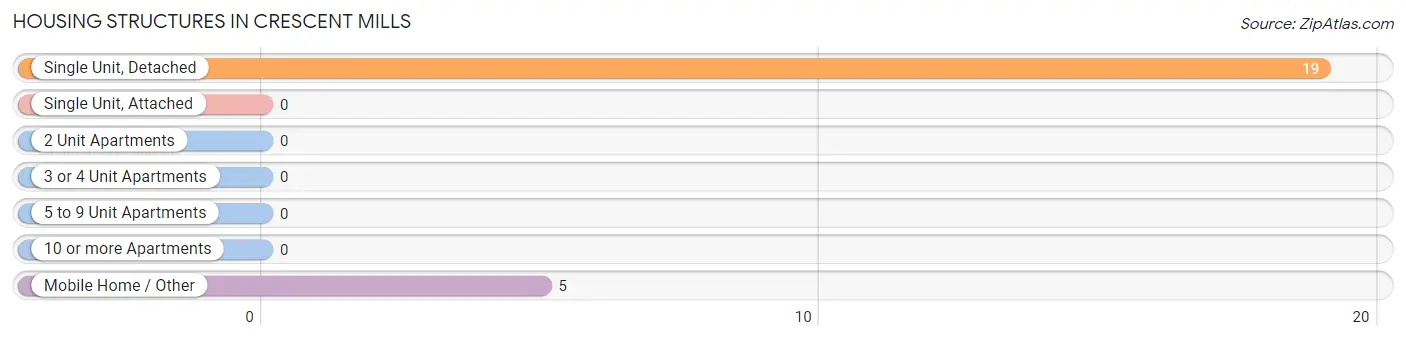
Housing Structures in Crescent Mills
Structure Type
# Housing Units
% Housing Units
Single Unit, Detached
19
79.2%
Single Unit, Attached
0
0.0%
2 Unit Apartments
0
0.0%
3 or 4 Unit Apartments
0
0.0%
5 to 9 Unit Apartments
0
0.0%
10 or more Apartments
0
0.0%
Mobile Home / Other
5
20.8%
Total
24
100.0%
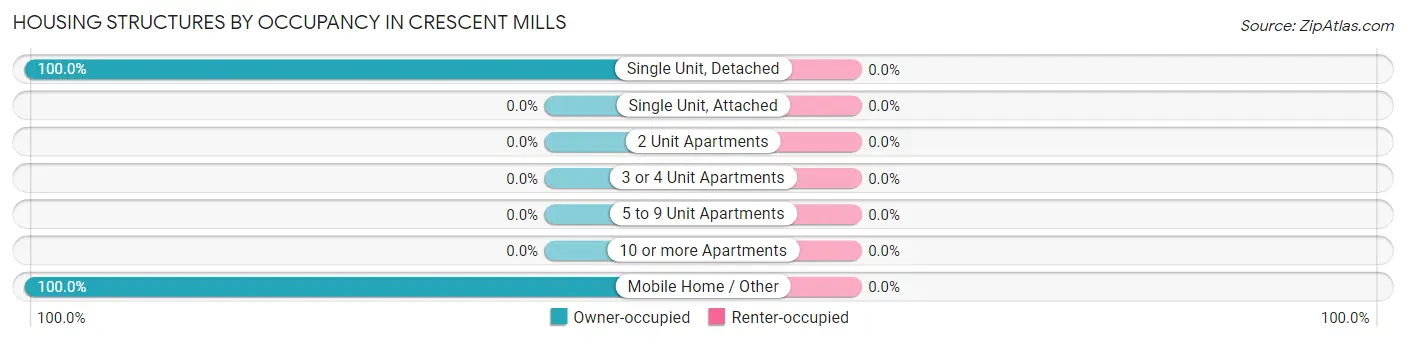
Housing Structures by Occupancy in Crescent Mills
Structure Type
Owner-occupied
Renter-occupied
Single Unit, Detached
19 (100.0%)
0 (0.0%)
Single Unit, Attached
0 (0.0%)
0 (0.0%)
2 Unit Apartments
0 (0.0%)
0 (0.0%)
3 or 4 Unit Apartments
0 (0.0%)
0 (0.0%)
5 to 9 Unit Apartments
0 (0.0%)
0 (0.0%)
10 or more Apartments
0 (0.0%)
0 (0.0%)
Mobile Home / Other
5 (100.0%)
0 (0.0%)
Total
24 (100.0%)
0 (0.0%)
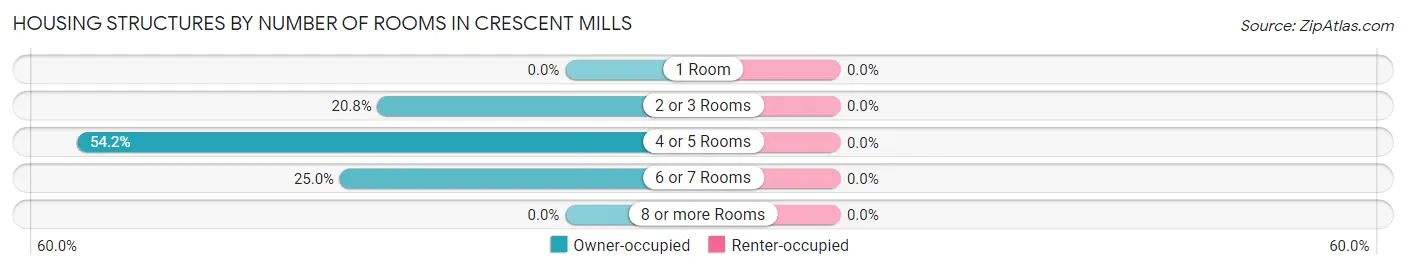
Housing Structures by Number of Rooms in Crescent Mills
Number of Rooms
Owner-occupied
Renter-occupied
1 Room
0 (0.0%)
0 (0.0%)
2 or 3 Rooms
5 (20.8%)
0 (0.0%)
4 or 5 Rooms
13 (54.2%)
0 (0.0%)
6 or 7 Rooms
6 (25.0%)
0 (0.0%)
8 or more Rooms
0 (0.0%)
0 (0.0%)
Total
24 (100.0%)
0 (0.0%)
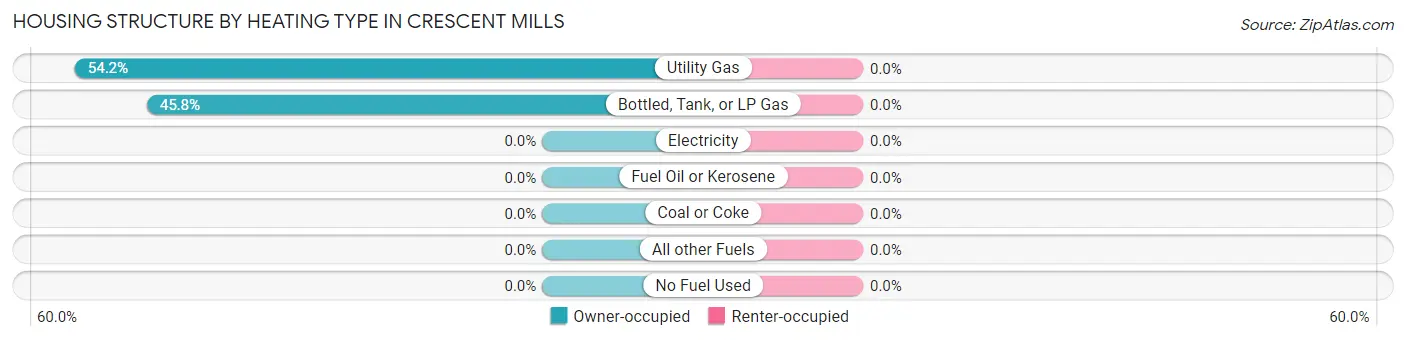
Housing Structure by Heating Type in Crescent Mills
Heating Type
Owner-occupied
Renter-occupied
Utility Gas
13 (54.2%)
0 (0.0%)
Bottled, Tank, or LP Gas
11 (45.8%)
0 (0.0%)
Electricity
0 (0.0%)
0 (0.0%)
Fuel Oil or Kerosene
0 (0.0%)
0 (0.0%)
Coal or Coke
0 (0.0%)
0 (0.0%)
All other Fuels
0 (0.0%)
0 (0.0%)
No Fuel Used
0 (0.0%)
0 (0.0%)
Total
24 (100.0%)
0 (0.0%)
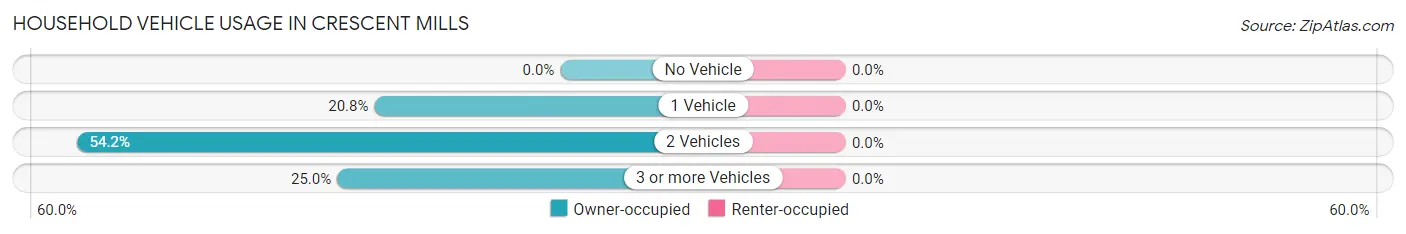
Household Vehicle Usage in Crescent Mills
Vehicles per Household
Owner-occupied
Renter-occupied
No Vehicle
0 (0.0%)
0 (0.0%)
1 Vehicle
5 (20.8%)
0 (0.0%)
2 Vehicles
13 (54.2%)
0 (0.0%)
3 or more Vehicles
6 (25.0%)
0 (0.0%)
Total
24 (100.0%)
0 (0.0%)
Real Estate & Mortgages in Crescent Mills
Real Estate and Mortgage Overview in Crescent Mills
Characteristic
Without Mortgage
With Mortgage
Housing Units
24
0
Median Property Value
$2,000,001
$0
Median Household Income
$2,499
$0
Monthly Housing Costs
$492
$0
Real Estate Taxes
$2,538
$0
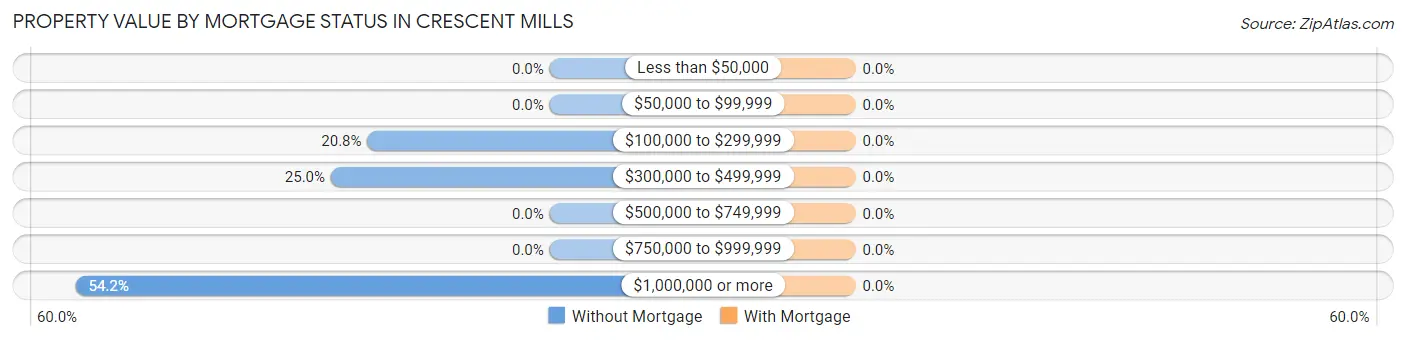
Property Value by Mortgage Status in Crescent Mills
Property Value
Without Mortgage
With Mortgage
Less than $50,000
0 (0.0%)
0 (0.0%)
$50,000 to $99,999
0 (0.0%)
0 (0.0%)
$100,000 to $299,999
5 (20.8%)
0 (0.0%)
$300,000 to $499,999
6 (25.0%)
0 (0.0%)
$500,000 to $749,999
0 (0.0%)
0 (0.0%)
$750,000 to $999,999
0 (0.0%)
0 (0.0%)
$1,000,000 or more
13 (54.2%)
0 (0.0%)
Total
24 (100.0%)
0 (0.0%)
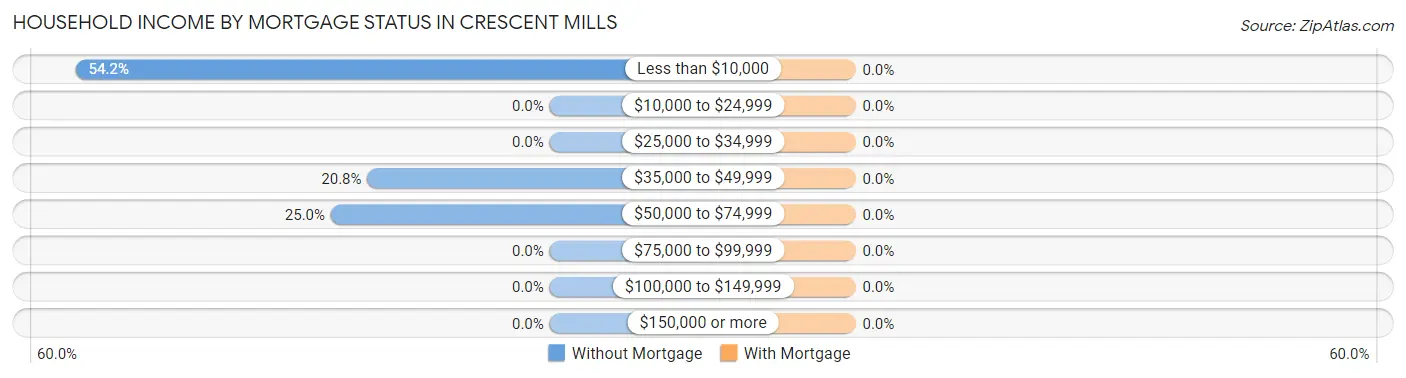
Household Income by Mortgage Status in Crescent Mills
Household Income
Without Mortgage
With Mortgage
Less than $10,000
13 (54.2%)
0 (0.0%)
$10,000 to $24,999
0 (0.0%)
0 (0.0%)
$25,000 to $34,999
0 (0.0%)
0 (0.0%)
$35,000 to $49,999
5 (20.8%)
0 (0.0%)
$50,000 to $74,999
6 (25.0%)
0 (0.0%)
$75,000 to $99,999
0 (0.0%)
0 (0.0%)
$100,000 to $149,999
0 (0.0%)
0 (0.0%)
$150,000 or more
0 (0.0%)
0 (0.0%)
Total
24 (100.0%)
0 (0.0%)
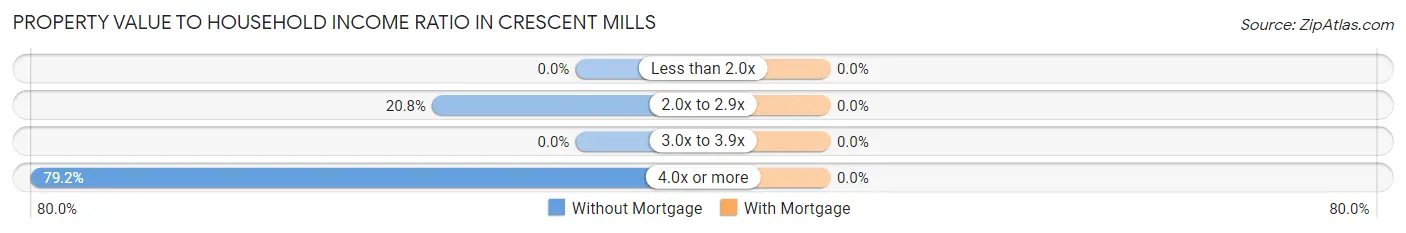
Property Value to Household Income Ratio in Crescent Mills
Value-to-Income Ratio
Without Mortgage
With Mortgage
Less than 2.0x
0 (0.0%)
0 (0.0%)
2.0x to 2.9x
5 (20.8%)
0 (0.0%)
3.0x to 3.9x
0 (0.0%)
0 (0.0%)
4.0x or more
19 (79.2%)
0 (0.0%)
Total
24 (100.0%)
0 (0.0%)
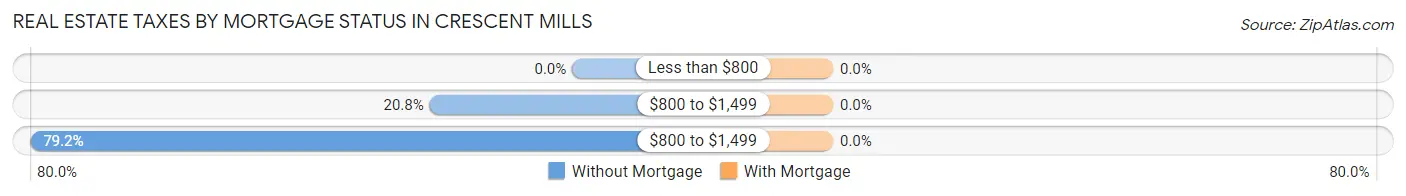
Real Estate Taxes by Mortgage Status in Crescent Mills
Property Taxes
Without Mortgage
With Mortgage
Less than $800
0 (0.0%)
0 (0.0%)
$800 to $1,499
5 (20.8%)
0 (0.0%)
$800 to $1,499
19 (79.2%)
0 (0.0%)
Total
24 (100.0%)
0 (0.0%)
Health & Disability in Crescent Mills
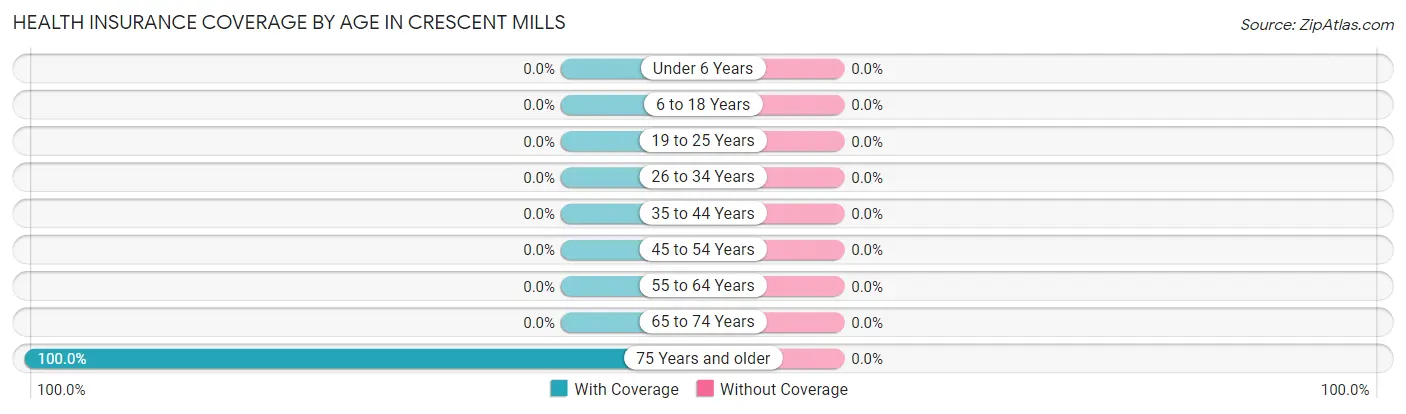
Health Insurance Coverage by Age in Crescent Mills
Age Bracket
With Coverage
Without Coverage
Under 6 Years
0 (0.0%)
0 (0.0%)
6 to 18 Years
0 (0.0%)
0 (0.0%)
19 to 25 Years
0 (0.0%)
0 (0.0%)
26 to 34 Years
0 (0.0%)
0 (0.0%)
35 to 44 Years
0 (0.0%)
0 (0.0%)
45 to 54 Years
0 (0.0%)
0 (0.0%)
55 to 64 Years
0 (0.0%)
0 (0.0%)
65 to 74 Years
0 (0.0%)
0 (0.0%)
75 Years and older
33 (100.0%)
0 (0.0%)
Total
33 (100.0%)
0 (0.0%)
Health Insurance Coverage by Citizenship Status in Crescent Mills
Citizenship Status
With Coverage
Without Coverage
Native Born
0 (0.0%)
0 (0.0%)
Foreign Born, Citizen
0 (0.0%)
0 (0.0%)
Foreign Born, not a Citizen
0 (0.0%)
0 (0.0%)
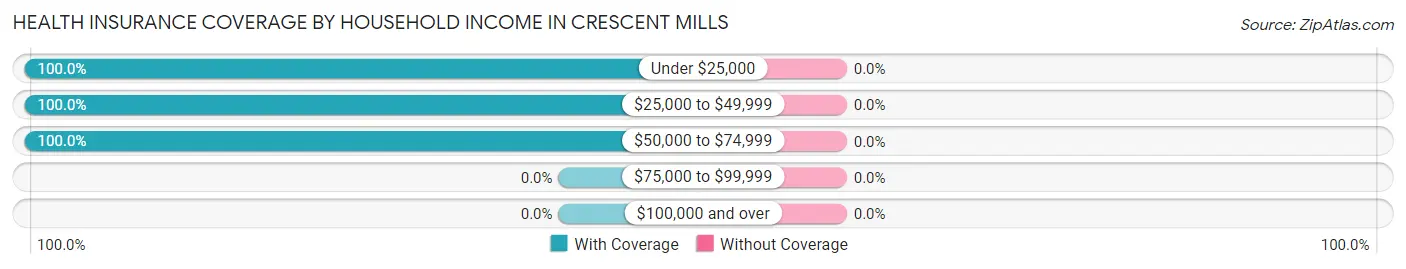
Health Insurance Coverage by Household Income in Crescent Mills
Household Income
With Coverage
Without Coverage
Under $25,000
13 (100.0%)
0 (0.0%)
$25,000 to $49,999
5 (100.0%)
0 (0.0%)
$50,000 to $74,999
15 (100.0%)
0 (0.0%)
$75,000 to $99,999
0 (0.0%)
0 (0.0%)
$100,000 and over
0 (0.0%)
0 (0.0%)
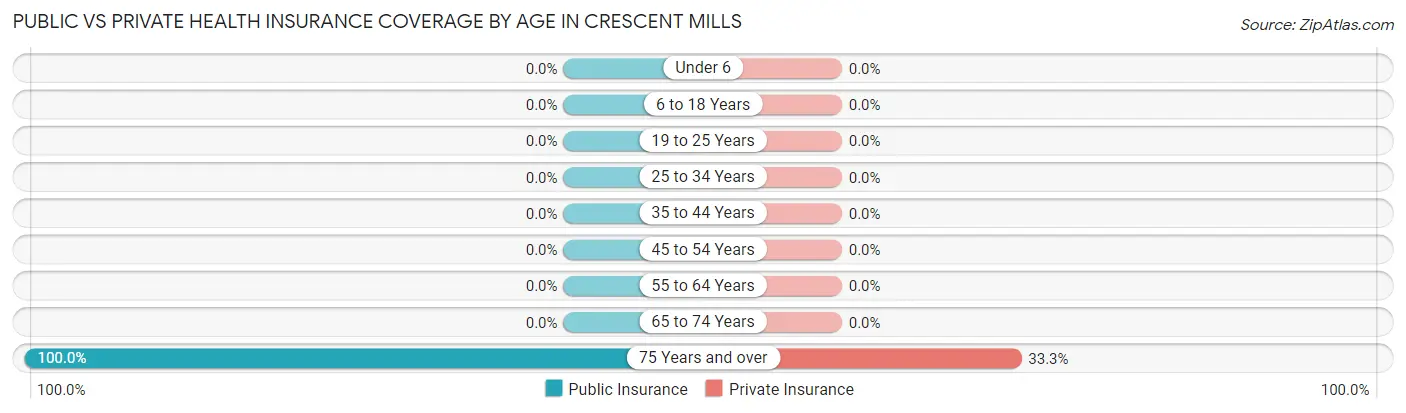
Public vs Private Health Insurance Coverage by Age in Crescent Mills
Age Bracket
Public Insurance
Private Insurance
Under 6
0 (0.0%)
0 (0.0%)
6 to 18 Years
0 (0.0%)
0 (0.0%)
19 to 25 Years
0 (0.0%)
0 (0.0%)
25 to 34 Years
0 (0.0%)
0 (0.0%)
35 to 44 Years
0 (0.0%)
0 (0.0%)
45 to 54 Years
0 (0.0%)
0 (0.0%)
55 to 64 Years
0 (0.0%)
0 (0.0%)
65 to 74 Years
0 (0.0%)
0 (0.0%)
75 Years and over
33 (100.0%)
11 (33.3%)
Total
33 (100.0%)
11 (33.3%)
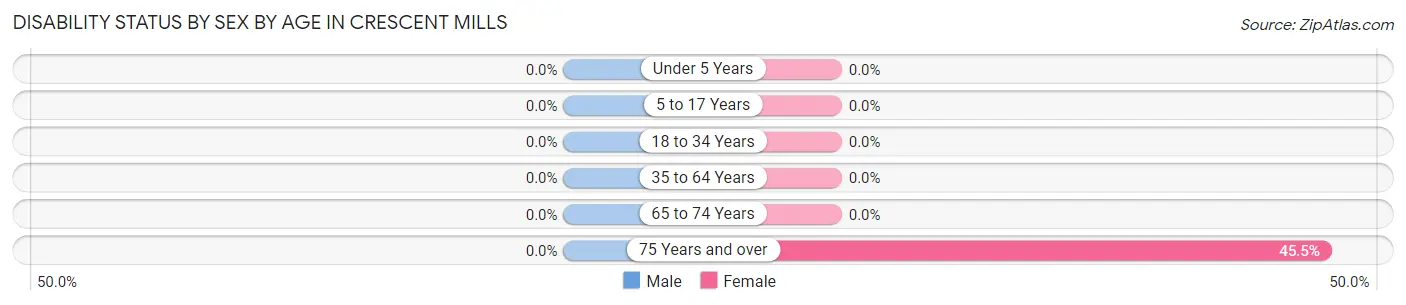
Disability Status by Sex by Age in Crescent Mills
Age Bracket
Male
Female
Under 5 Years
0 (0.0%)
0 (0.0%)
5 to 17 Years
0 (0.0%)
0 (0.0%)
18 to 34 Years
0 (0.0%)
0 (0.0%)
35 to 64 Years
0 (0.0%)
0 (0.0%)
65 to 74 Years
0 (0.0%)
0 (0.0%)
75 Years and over
0 (0.0%)
5 (45.5%)
Disability Class by Sex by Age in Crescent Mills
Disability Class: Hearing Difficulty
Age Bracket
Male
Female
Under 5 Years
0 (0.0%)
0 (0.0%)
5 to 17 Years
0 (0.0%)
0 (0.0%)
18 to 34 Years
0 (0.0%)
0 (0.0%)
35 to 64 Years
0 (0.0%)
0 (0.0%)
65 to 74 Years
0 (0.0%)
0 (0.0%)
75 Years and over
0 (0.0%)
0 (0.0%)
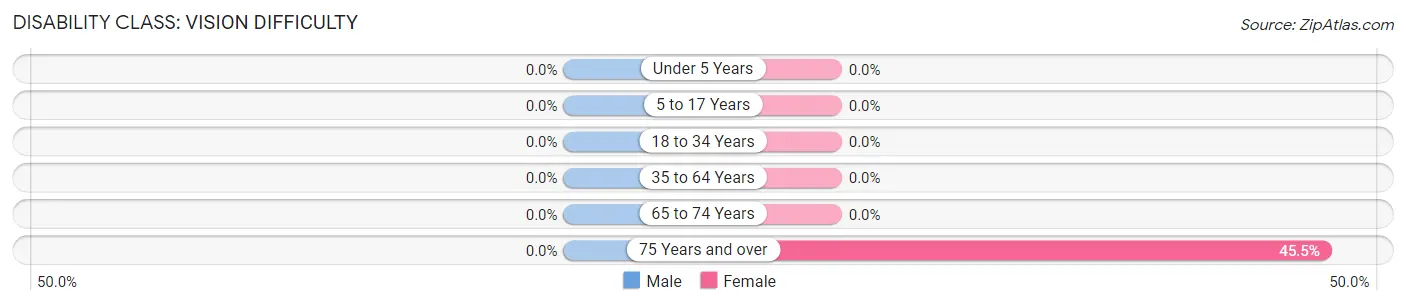
Disability Class: Vision Difficulty
Age Bracket
Male
Female
Under 5 Years
0 (0.0%)
0 (0.0%)
5 to 17 Years
0 (0.0%)
0 (0.0%)
18 to 34 Years
0 (0.0%)
0 (0.0%)
35 to 64 Years
0 (0.0%)
0 (0.0%)
65 to 74 Years
0 (0.0%)
0 (0.0%)
75 Years and over
0 (0.0%)
5 (45.5%)
Disability Class: Cognitive Difficulty
Age Bracket
Male
Female
5 to 17 Years
0 (0.0%)
0 (0.0%)
18 to 34 Years
0 (0.0%)
0 (0.0%)
35 to 64 Years
0 (0.0%)
0 (0.0%)
65 to 74 Years
0 (0.0%)
0 (0.0%)
75 Years and over
0 (0.0%)
0 (0.0%)
Disability Class: Ambulatory Difficulty
Age Bracket
Male
Female
5 to 17 Years
0 (0.0%)
0 (0.0%)
18 to 34 Years
0 (0.0%)
0 (0.0%)
35 to 64 Years
0 (0.0%)
0 (0.0%)
65 to 74 Years
0 (0.0%)
0 (0.0%)
75 Years and over
0 (0.0%)
0 (0.0%)
Disability Class: Self-Care Difficulty
Age Bracket
Male
Female
5 to 17 Years
0 (0.0%)
0 (0.0%)
18 to 34 Years
0 (0.0%)
0 (0.0%)
35 to 64 Years
0 (0.0%)
0 (0.0%)
65 to 74 Years
0 (0.0%)
0 (0.0%)
75 Years and over
0 (0.0%)
0 (0.0%)
Technology Access in Crescent Mills
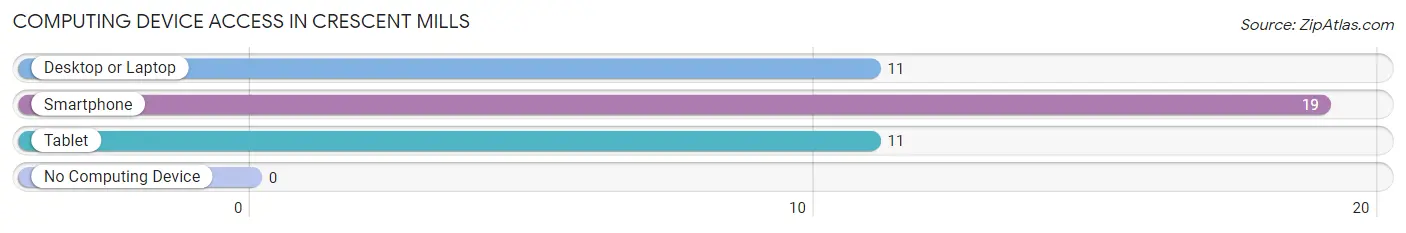
Computing Device Access in Crescent Mills
Device Type
# Households
% Households
Desktop or Laptop
11
45.8%
Smartphone
19
79.2%
Tablet
11
45.8%
No Computing Device
0
0.0%
Total
24
100.0%
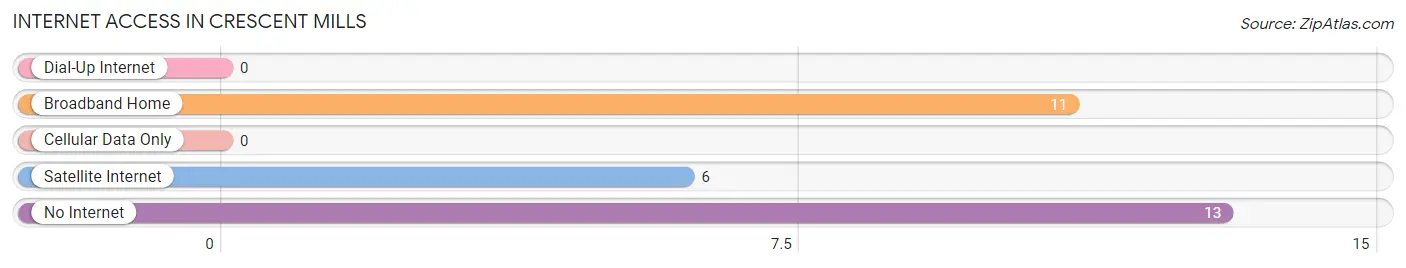
Internet Access in Crescent Mills
Internet Type
# Households
% Households
Dial-Up Internet
0
0.0%
Broadband Home
11
45.8%
Cellular Data Only
0
0.0%
Satellite Internet
6
25.0%
No Internet
13
54.2%
Total
24
100.0%
Crescent Mills Summary
Crescent Mills is a small unincorporated community located in Plumas County, California. It is situated in the Sierra Nevada mountain range, approximately 10 miles east of the town of Quincy. The population of Crescent Mills was estimated to be around 200 people in 2000.
History
Crescent Mills was founded in 1854 by a group of miners who were searching for gold in the area. The town was originally called “Crescent City”, but the name was changed to “Crescent Mills” in 1856 when a sawmill was built in the area. The sawmill was used to cut lumber for the construction of homes and businesses in the area.
In the late 1800s, Crescent Mills was a bustling town with a population of over 1,000 people. The town had several stores, a hotel, a post office, a school, and a church. The town was also home to a number of saloons and gambling halls.
In the early 1900s, the population of Crescent Mills began to decline as the gold rush ended and the timber industry moved away from the area. By the 1950s, the population had dropped to around 200 people.
Geography
Crescent Mills is located in the Sierra Nevada mountain range, approximately 10 miles east of the town of Quincy. The town is situated at an elevation of 4,000 feet and is surrounded by the Plumas National Forest. The climate in Crescent Mills is characterized by hot, dry summers and cold, wet winters.
The town is located near several lakes, including Lake Almanor, Lake Davis, and Lake Oroville. The nearby lakes provide recreational opportunities for fishing, boating, and swimming.
Economy
The economy of Crescent Mills is largely based on tourism. The town is a popular destination for outdoor recreation, such as camping, fishing, and hiking. The nearby lakes provide opportunities for boating and water sports.
The town is also home to a number of small businesses, including restaurants, stores, and a gas station. The town is also home to a number of bed and breakfasts, which provide lodging for visitors to the area.
Demographics
The population of Crescent Mills was estimated to be around 200 people in 2000. The racial makeup of the town was 95.5% White, 0.5% African American, 0.5% Native American, 0.5% Asian, and 3% from other races. The median household income in the town was $30,000.
Conclusion
Crescent Mills is a small unincorporated community located in Plumas County, California. It is situated in the Sierra Nevada mountain range, approximately 10 miles east of the town of Quincy. The population of Crescent Mills was estimated to be around 200 people in 2000. The economy of Crescent Mills is largely based on tourism, with visitors coming to the area for outdoor recreation and to stay at the town’s bed and breakfasts. The racial makeup of the town was 95.5% White, 0.5% African American, 0.5% Native American, 0.5% Asian, and 3% from other races. The median household income in the town was $30,000.
Common Questions
What is Per Capita Income in Crescent Mills?
Per Capita income in Crescent Mills is $24,482.
What is the Median Household income in Crescent Mills?
Median Household Income in Crescent Mills is $2,499.
What is Inequality or Gini Index in Crescent Mills?
Inequality or Gini Index in Crescent Mills is 0.55.
What is the Total Population of Crescent Mills?
Total Population of Crescent Mills is 33.
What is the Total Male Population of Crescent Mills?
Total Male Population of Crescent Mills is 22.
What is the Total Female Population of Crescent Mills?
Total Female Population of Crescent Mills is 11.
What is the Ratio of Males per 100 Females in Crescent Mills?
There are 200.00 Males per 100 Females in Crescent Mills.
What is the Ratio of Females per 100 Males in Crescent Mills?
There are 50.00 Females per 100 Males in Crescent Mills.
What is the Median Population Age in Crescent Mills?
Median Population Age in Crescent Mills is 83.3 Years.
What is the Average Family Size in Crescent Mills
Average Family Size in Crescent Mills is 2.5 People.
What is the Average Household Size in Crescent Mills
Average Household Size in Crescent Mills is 1.4 People.
Report Title
Report Link
HTML Copy & Paste Link
Social Media
Copy and paste the folowing code into any webpage where you would like this interactive chart to display