Greensboro Bend, VT Map & Demographics
Greensboro Bend Map
Greensboro Bend Overview
$33,317
PER CAPITA INCOME
$108,438
AVG FAMILY INCOME
$83,281
AVG HOUSEHOLD INCOME
34.5%
WAGE / INCOME GAP [ % ]
65.5¢/ $1
WAGE / INCOME GAP [ $ ]
0.38
INEQUALITY / GINI INDEX
265
TOTAL POPULATION
127
MALE POPULATION
138
FEMALE POPULATION
92.03
MALES / 100 FEMALES
108.66
FEMALES / 100 MALES
26.9
MEDIAN AGE
3.4
AVG FAMILY SIZE
2.7
AVG HOUSEHOLD SIZE
142
LABOR FORCE [ PEOPLE ]
71.7%
PERCENT IN LABOR FORCE
Greensboro Bend Zip Codes
Income in Greensboro Bend
Income Overview in Greensboro Bend
Per Capita Income in Greensboro Bend is $33,317, while median incomes of families and households are $108,438 and $83,281 respectively.
| Characteristic | Number | Measure |
| Per Capita Income | 265 | $33,317 |
| Median Family Income | 62 | $108,438 |
| Mean Family Income | 62 | $111,226 |
| Median Household Income | 98 | $83,281 |
| Mean Household Income | 98 | $92,978 |
| Income Deficit | 62 | $0 |
| Wage / Income Gap (%) | 265 | 34.47% |
| Wage / Income Gap ($) | 265 | 65.53¢ per $1 |
| Gini / Inequality Index | 265 | 0.38 |
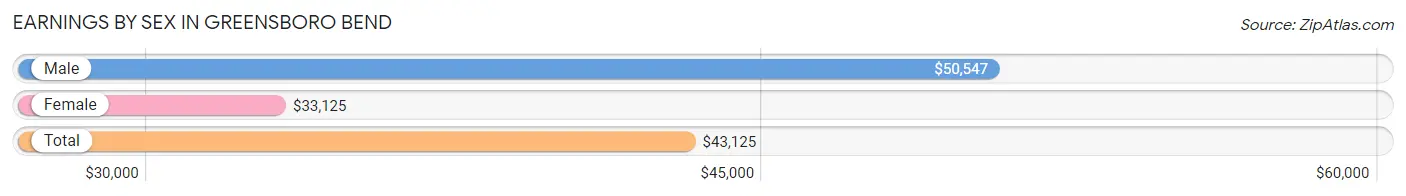
Earnings by Sex in Greensboro Bend
Average Earnings in Greensboro Bend are $43,125, $50,547 for men and $33,125 for women, a difference of 34.5%.
| Sex | Number | Average Earnings |
| Male | 95 (57.2%) | $50,547 |
| Female | 71 (42.8%) | $33,125 |
| Total | 166 (100.0%) | $43,125 |
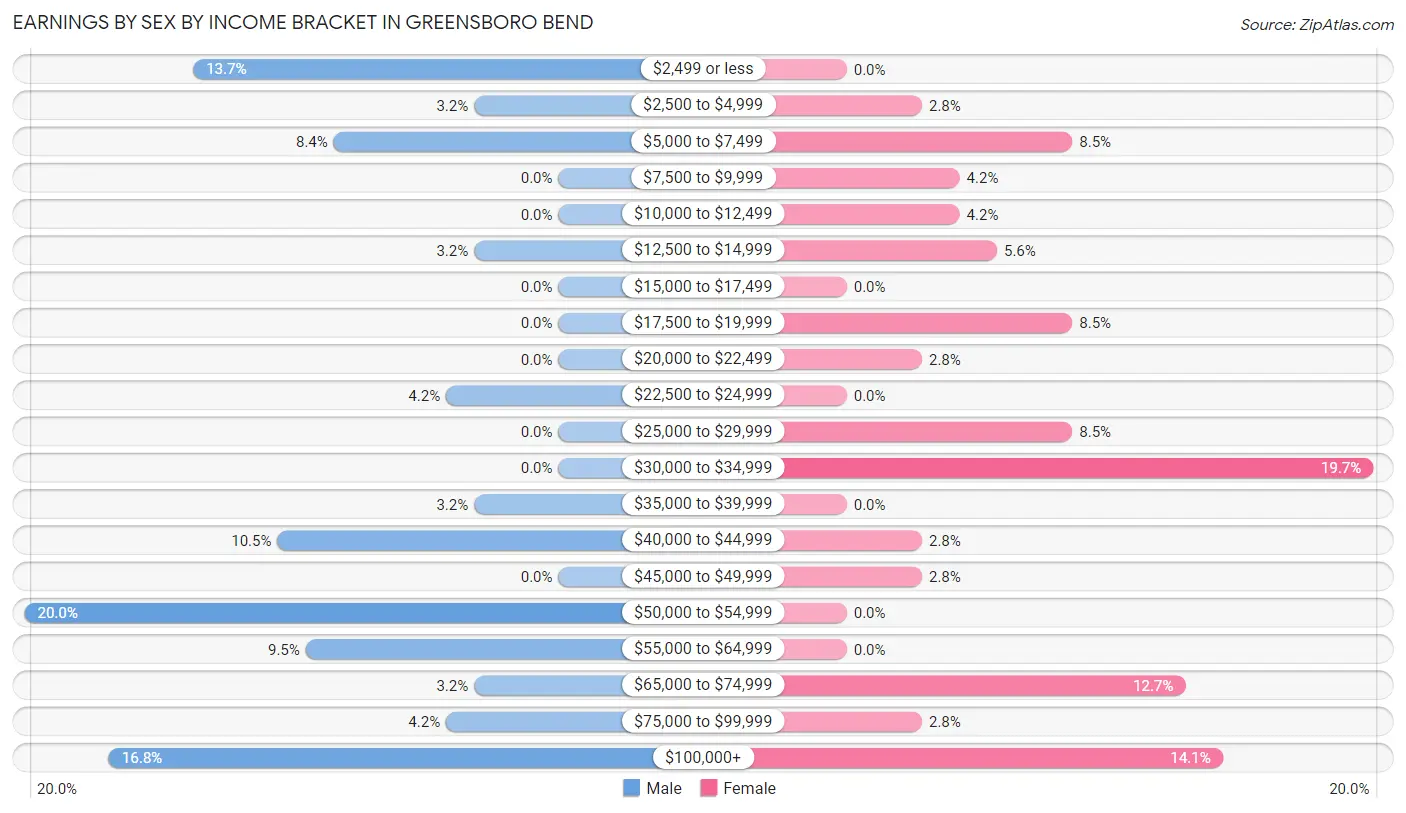
Earnings by Sex by Income Bracket in Greensboro Bend
The most common earnings brackets in Greensboro Bend are $50,000 to $54,999 for men (19 | 20.0%) and $30,000 to $34,999 for women (14 | 19.7%).
| Income | Male | Female |
| $2,499 or less | 13 (13.7%) | 0 (0.0%) |
| $2,500 to $4,999 | 3 (3.2%) | 2 (2.8%) |
| $5,000 to $7,499 | 8 (8.4%) | 6 (8.5%) |
| $7,500 to $9,999 | 0 (0.0%) | 3 (4.2%) |
| $10,000 to $12,499 | 0 (0.0%) | 3 (4.2%) |
| $12,500 to $14,999 | 3 (3.2%) | 4 (5.6%) |
| $15,000 to $17,499 | 0 (0.0%) | 0 (0.0%) |
| $17,500 to $19,999 | 0 (0.0%) | 6 (8.5%) |
| $20,000 to $22,499 | 0 (0.0%) | 2 (2.8%) |
| $22,500 to $24,999 | 4 (4.2%) | 0 (0.0%) |
| $25,000 to $29,999 | 0 (0.0%) | 6 (8.5%) |
| $30,000 to $34,999 | 0 (0.0%) | 14 (19.7%) |
| $35,000 to $39,999 | 3 (3.2%) | 0 (0.0%) |
| $40,000 to $44,999 | 10 (10.5%) | 2 (2.8%) |
| $45,000 to $49,999 | 0 (0.0%) | 2 (2.8%) |
| $50,000 to $54,999 | 19 (20.0%) | 0 (0.0%) |
| $55,000 to $64,999 | 9 (9.5%) | 0 (0.0%) |
| $65,000 to $74,999 | 3 (3.2%) | 9 (12.7%) |
| $75,000 to $99,999 | 4 (4.2%) | 2 (2.8%) |
| $100,000+ | 16 (16.8%) | 10 (14.1%) |
| Total | 95 (100.0%) | 71 (100.0%) |
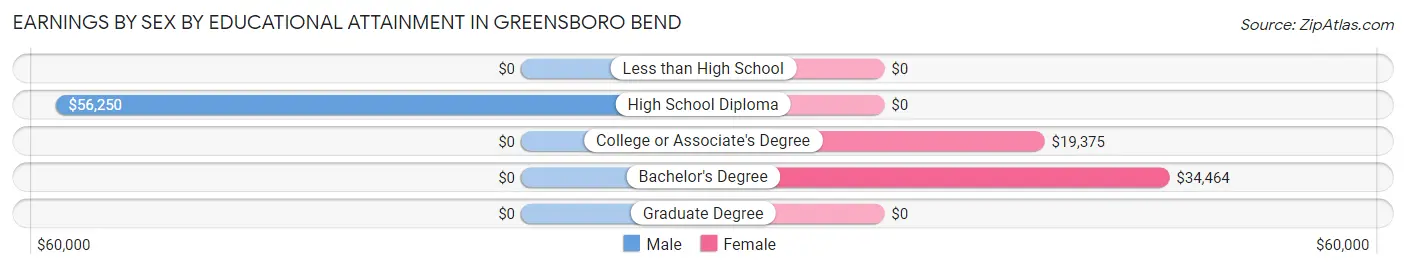
Earnings by Sex by Educational Attainment in Greensboro Bend
Average earnings in Greensboro Bend are $52,188 for men and $33,661 for women, a difference of 35.5%. Men with an educational attainment of high school diploma enjoy the highest average annual earnings of $56,250, while those with high school diploma education earn the least with $56,250. Women with an educational attainment of bachelor's degree earn the most with the average annual earnings of $34,464, while those with college or associate's degree education have the smallest earnings of $19,375.
| Educational Attainment | Male Income | Female Income |
| Less than High School | - | - |
| High School Diploma | $56,250 | $0 |
| College or Associate's Degree | - | - |
| Bachelor's Degree | - | - |
| Graduate Degree | - | - |
| Total | $52,188 | $33,661 |
Family Income in Greensboro Bend
Family Income Brackets in Greensboro Bend
According to the Greensboro Bend family income data, there are 16 families falling into the $150,000 to $199,999 income range, which is the most common income bracket and makes up 25.8% of all families.
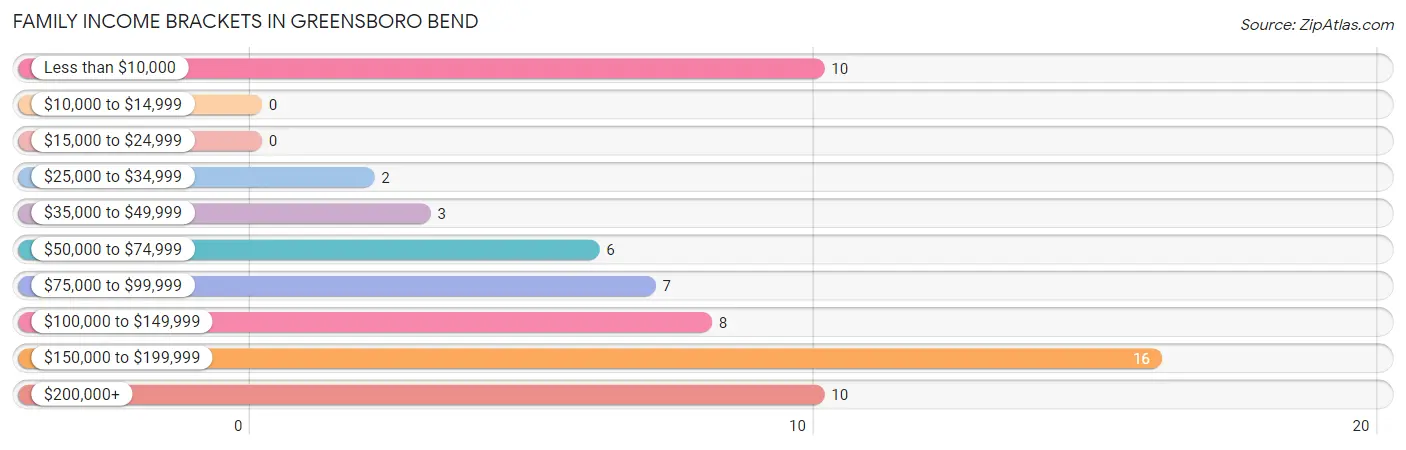
| Income Bracket | # Families | % Families |
| Less than $10,000 | 10 | 16.1% |
| $10,000 to $14,999 | 0 | 0.0% |
| $15,000 to $24,999 | 0 | 0.0% |
| $25,000 to $34,999 | 2 | 3.2% |
| $35,000 to $49,999 | 3 | 4.8% |
| $50,000 to $74,999 | 6 | 9.7% |
| $75,000 to $99,999 | 7 | 11.3% |
| $100,000 to $149,999 | 8 | 12.9% |
| $150,000 to $199,999 | 16 | 25.8% |
| $200,000+ | 10 | 16.1% |
Family Income by Famaliy Size in Greensboro Bend
4-person families (19 | 30.6%) account for the highest median family income in Greensboro Bend with $175,375 per family, while 4-person families (19 | 30.6%) have the highest median income of $43,844 per family member.
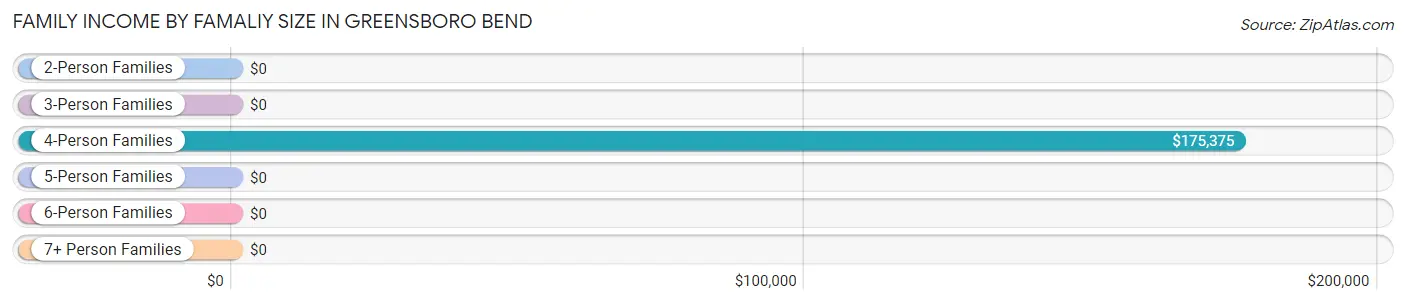
| Income Bracket | # Families | Median Income |
| 2-Person Families | 28 (45.2%) | $0 |
| 3-Person Families | 6 (9.7%) | $0 |
| 4-Person Families | 19 (30.6%) | $175,375 |
| 5-Person Families | 0 (0.0%) | $0 |
| 6-Person Families | 6 (9.7%) | $0 |
| 7+ Person Families | 3 (4.8%) | $0 |
| Total | 62 (100.0%) | $108,438 |
Family Income by Number of Earners in Greensboro Bend
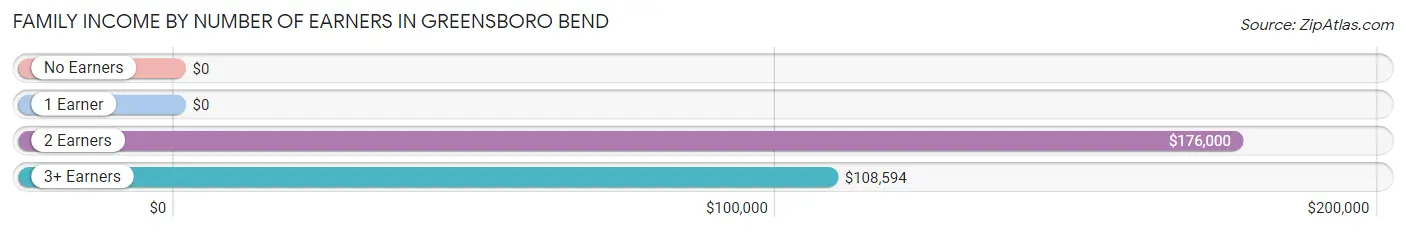
| Number of Earners | # Families | Median Income |
| No Earners | 5 (8.1%) | $0 |
| 1 Earner | 10 (16.1%) | $0 |
| 2 Earners | 32 (51.6%) | $176,000 |
| 3+ Earners | 15 (24.2%) | $108,594 |
| Total | 62 (100.0%) | $108,438 |
Household Income in Greensboro Bend
Household Income Brackets in Greensboro Bend
With 26 households falling in the category, the $75,000 to $99,999 income range is the most frequent in Greensboro Bend, accounting for 26.5% of all households.
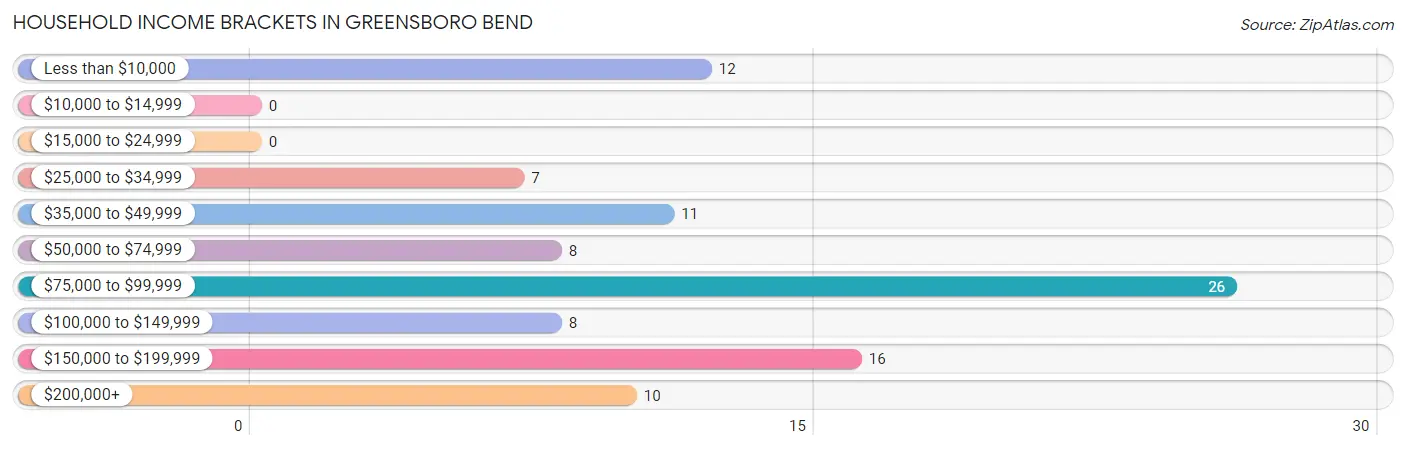
| Income Bracket | # Households | % Households |
| Less than $10,000 | 12 | 12.2% |
| $10,000 to $14,999 | 0 | 0.0% |
| $15,000 to $24,999 | 0 | 0.0% |
| $25,000 to $34,999 | 7 | 7.1% |
| $35,000 to $49,999 | 11 | 11.2% |
| $50,000 to $74,999 | 8 | 8.2% |
| $75,000 to $99,999 | 26 | 26.5% |
| $100,000 to $149,999 | 8 | 8.2% |
| $150,000 to $199,999 | 16 | 16.3% |
| $200,000+ | 10 | 10.2% |
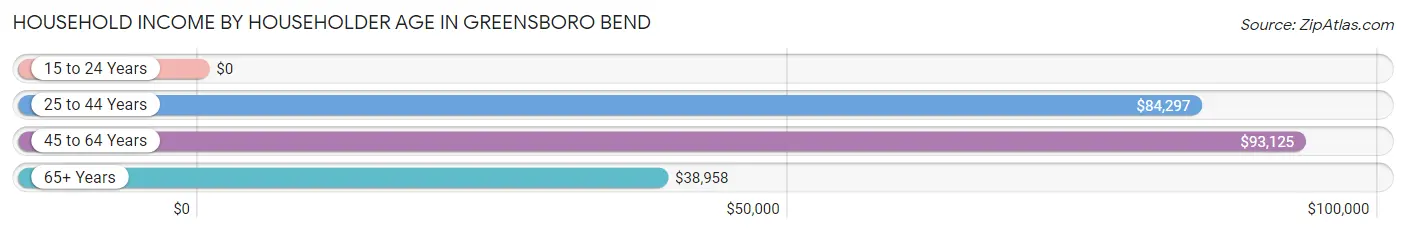
Household Income by Householder Age in Greensboro Bend
The median household income in Greensboro Bend is $83,281, with the highest median household income of $93,125 found in the 45 to 64 years age bracket for the primary householder. A total of 44 households (44.9%) fall into this category.
| Income Bracket | # Households | Median Income |
| 15 to 24 Years | 0 (0.0%) | $0 |
| 25 to 44 Years | 39 (39.8%) | $84,297 |
| 45 to 64 Years | 44 (44.9%) | $93,125 |
| 65+ Years | 15 (15.3%) | $38,958 |
| Total | 98 (100.0%) | $83,281 |
Poverty in Greensboro Bend
Income Below Poverty by Sex and Age in Greensboro Bend
With 7.1% poverty level for males and 12.3% for females among the residents of Greensboro Bend, 16 and 17 year old males and 45 to 54 year old females are the most vulnerable to poverty, with 9 males (47.4%) and 10 females (50.0%) in their respective age groups living below the poverty level.
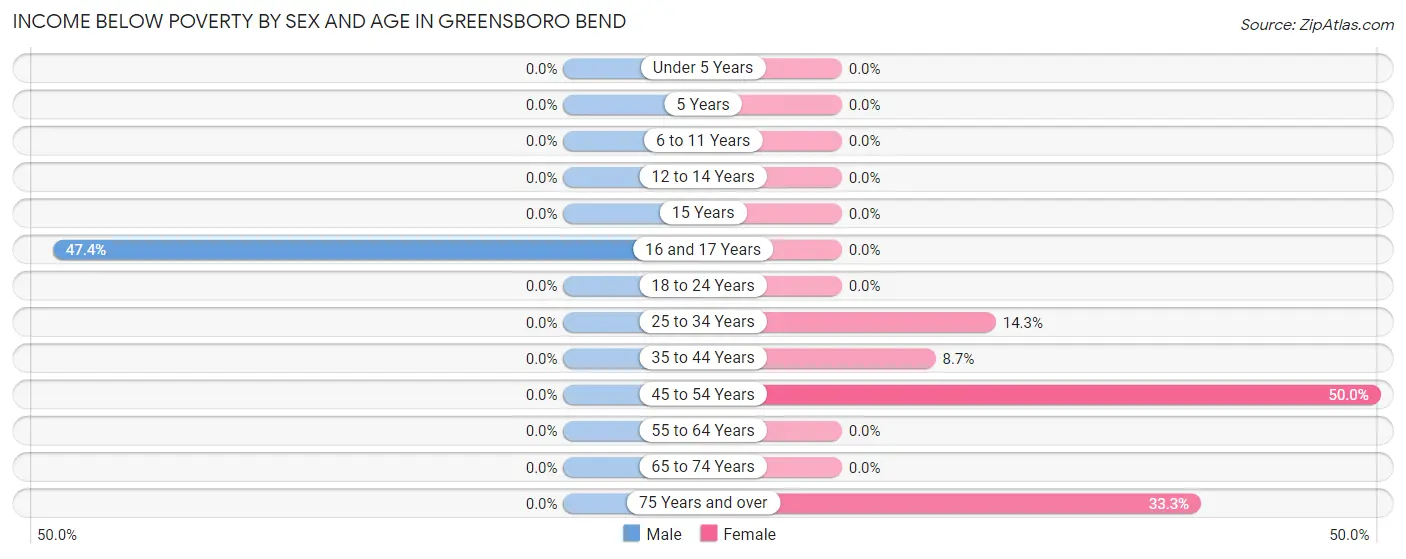
| Age Bracket | Male | Female |
| Under 5 Years | 0 (0.0%) | 0 (0.0%) |
| 5 Years | 0 (0.0%) | 0 (0.0%) |
| 6 to 11 Years | 0 (0.0%) | 0 (0.0%) |
| 12 to 14 Years | 0 (0.0%) | 0 (0.0%) |
| 15 Years | 0 (0.0%) | 0 (0.0%) |
| 16 and 17 Years | 9 (47.4%) | 0 (0.0%) |
| 18 to 24 Years | 0 (0.0%) | 0 (0.0%) |
| 25 to 34 Years | 0 (0.0%) | 3 (14.3%) |
| 35 to 44 Years | 0 (0.0%) | 2 (8.7%) |
| 45 to 54 Years | 0 (0.0%) | 10 (50.0%) |
| 55 to 64 Years | 0 (0.0%) | 0 (0.0%) |
| 65 to 74 Years | 0 (0.0%) | 0 (0.0%) |
| 75 Years and over | 0 (0.0%) | 2 (33.3%) |
| Total | 9 (7.1%) | 17 (12.3%) |
Income Above Poverty by Sex and Age in Greensboro Bend
According to the poverty statistics in Greensboro Bend, males aged 5 years and females aged under 5 years are the age groups that are most secure financially, with 100.0% of males and 100.0% of females in these age groups living above the poverty line.
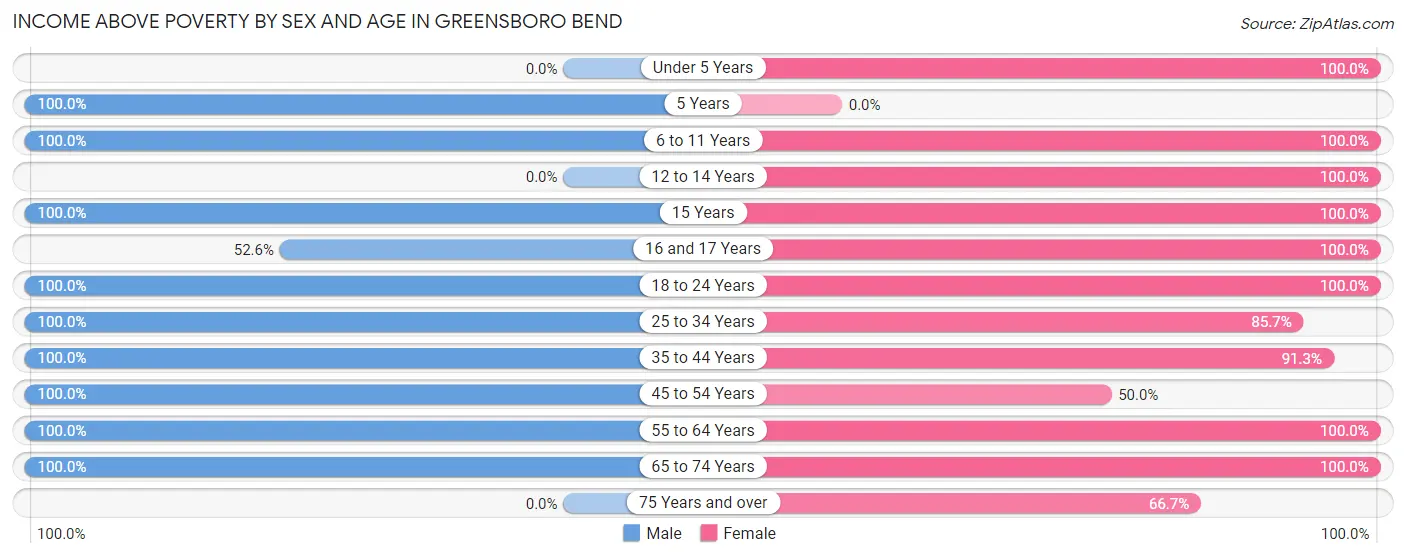
| Age Bracket | Male | Female |
| Under 5 Years | 0 (0.0%) | 16 (100.0%) |
| 5 Years | 6 (100.0%) | 0 (0.0%) |
| 6 to 11 Years | 15 (100.0%) | 4 (100.0%) |
| 12 to 14 Years | 0 (0.0%) | 17 (100.0%) |
| 15 Years | 6 (100.0%) | 3 (100.0%) |
| 16 and 17 Years | 10 (52.6%) | 7 (100.0%) |
| 18 to 24 Years | 8 (100.0%) | 2 (100.0%) |
| 25 to 34 Years | 16 (100.0%) | 18 (85.7%) |
| 35 to 44 Years | 16 (100.0%) | 21 (91.3%) |
| 45 to 54 Years | 22 (100.0%) | 10 (50.0%) |
| 55 to 64 Years | 14 (100.0%) | 10 (100.0%) |
| 65 to 74 Years | 5 (100.0%) | 9 (100.0%) |
| 75 Years and over | 0 (0.0%) | 4 (66.7%) |
| Total | 118 (92.9%) | 121 (87.7%) |
Income Below Poverty Among Married-Couple Families in Greensboro Bend
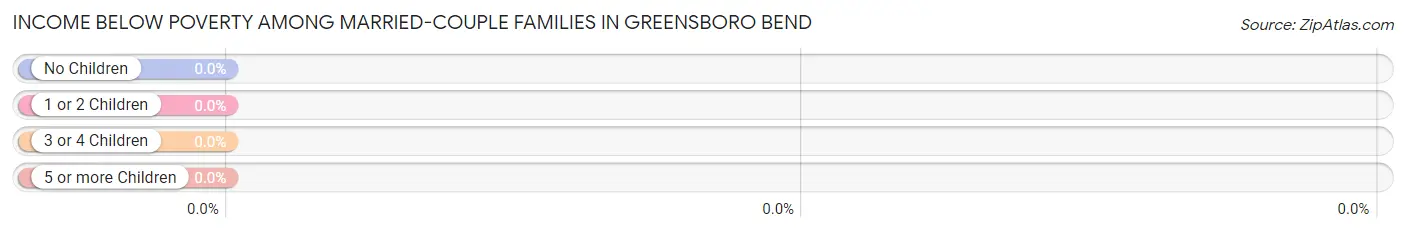
| Children | Above Poverty | Below Poverty |
| No Children | 21 (100.0%) | 0 (0.0%) |
| 1 or 2 Children | 18 (100.0%) | 0 (0.0%) |
| 3 or 4 Children | 6 (100.0%) | 0 (0.0%) |
| 5 or more Children | 3 (100.0%) | 0 (0.0%) |
| Total | 48 (100.0%) | 0 (0.0%) |
Income Below Poverty Among Single-Parent Households in Greensboro Bend
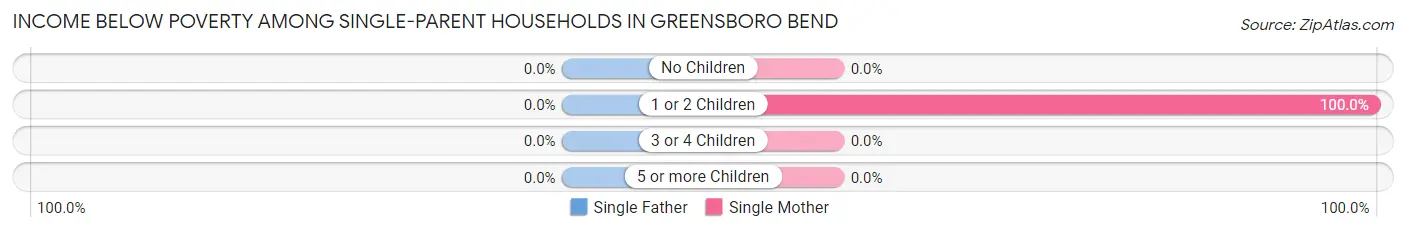
| Children | Single Father | Single Mother |
| No Children | 0 (0.0%) | 0 (0.0%) |
| 1 or 2 Children | 0 (0.0%) | 10 (100.0%) |
| 3 or 4 Children | 0 (0.0%) | 0 (0.0%) |
| 5 or more Children | 0 (0.0%) | 0 (0.0%) |
| Total | 0 (0.0%) | 10 (100.0%) |
Income Below Poverty Among Married-Couple vs Single-Parent Households in Greensboro Bend
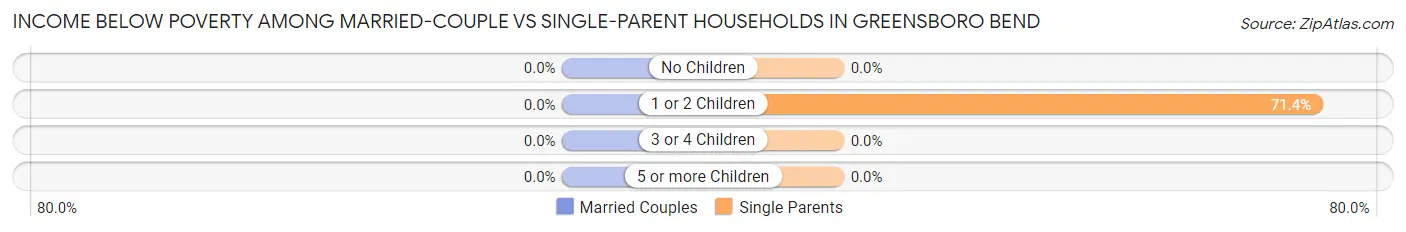
| Children | Married-Couple Families | Single-Parent Households |
| No Children | 0 (0.0%) | 0 (0.0%) |
| 1 or 2 Children | 0 (0.0%) | 10 (71.4%) |
| 3 or 4 Children | 0 (0.0%) | 0 (0.0%) |
| 5 or more Children | 0 (0.0%) | 0 (0.0%) |
| Total | 0 (0.0%) | 10 (71.4%) |
Race in Greensboro Bend
The most populous races in Greensboro Bend are White / Caucasian (263 | 99.3%), Hispanic or Latino (3 | 1.1%), and Black / African American (2 | 0.7%).
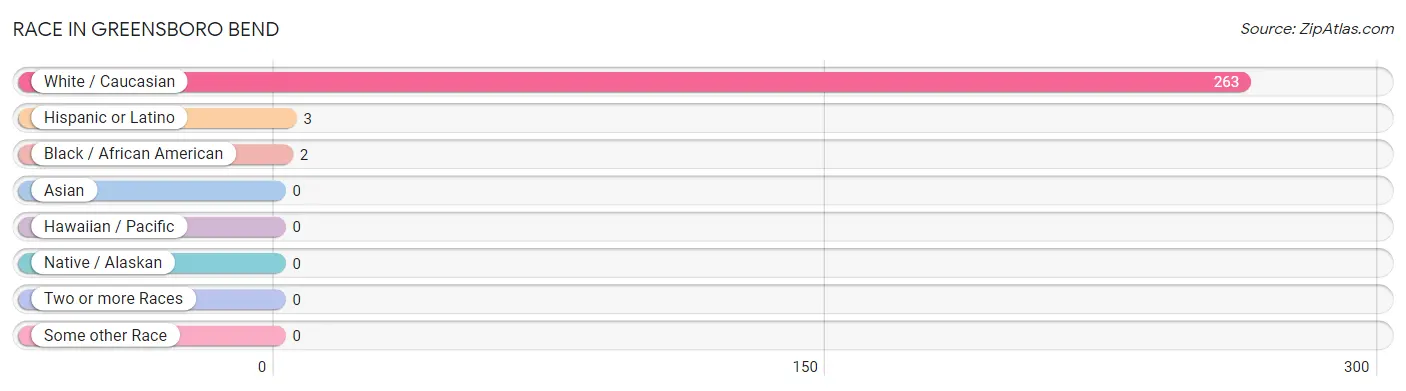
| Race | # Population | % Population |
| Asian | 0 | 0.0% |
| Black / African American | 2 | 0.7% |
| Hawaiian / Pacific | 0 | 0.0% |
| Hispanic or Latino | 3 | 1.1% |
| Native / Alaskan | 0 | 0.0% |
| White / Caucasian | 263 | 99.3% |
| Two or more Races | 0 | 0.0% |
| Some other Race | 0 | 0.0% |
| Total | 265 | 100.0% |
Ancestry in Greensboro Bend
The most populous ancestries reported in Greensboro Bend are French Canadian (61 | 23.0%), Irish (59 | 22.3%), French (37 | 14.0%), German (35 | 13.2%), and Dutch (20 | 7.5%), together accounting for 80.0% of all Greensboro Bend residents.
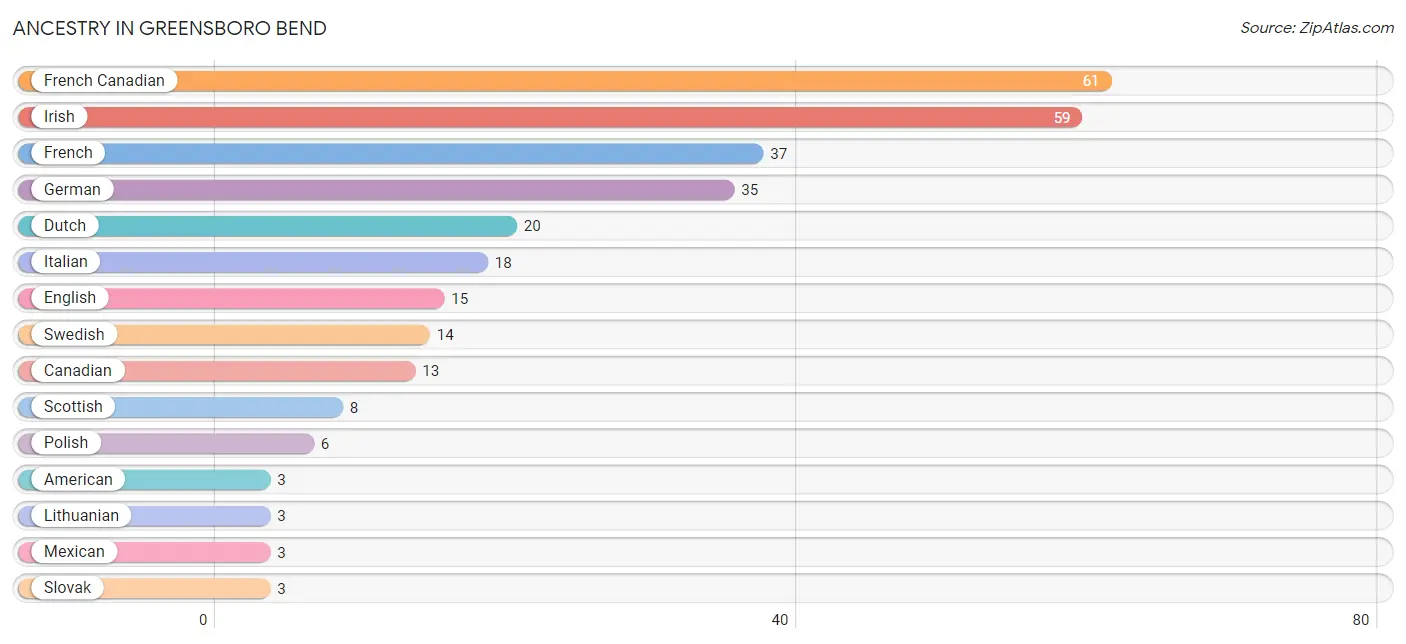
| Ancestry | # Population | % Population |
| American | 3 | 1.1% |
| Canadian | 13 | 4.9% |
| Dutch | 20 | 7.5% |
| English | 15 | 5.7% |
| French | 37 | 14.0% |
| French Canadian | 61 | 23.0% |
| German | 35 | 13.2% |
| Irish | 59 | 22.3% |
| Italian | 18 | 6.8% |
| Jamaican | 2 | 0.7% |
| Lithuanian | 3 | 1.1% |
| Mexican | 3 | 1.1% |
| Polish | 6 | 2.3% |
| Scottish | 8 | 3.0% |
| Slovak | 3 | 1.1% |
| Swedish | 14 | 5.3% | View All 16 Rows |
Immigrants in Greensboro Bend
The most numerous immigrant groups reported in Greensboro Bend came from , and Canada (4 | 1.5%), together accounting for 1.5% of all Greensboro Bend residents.

| Immigration Origin | # Population | % Population |
| Canada | 4 | 1.5% | View All 1 Rows |
Sex and Age in Greensboro Bend
Sex and Age in Greensboro Bend
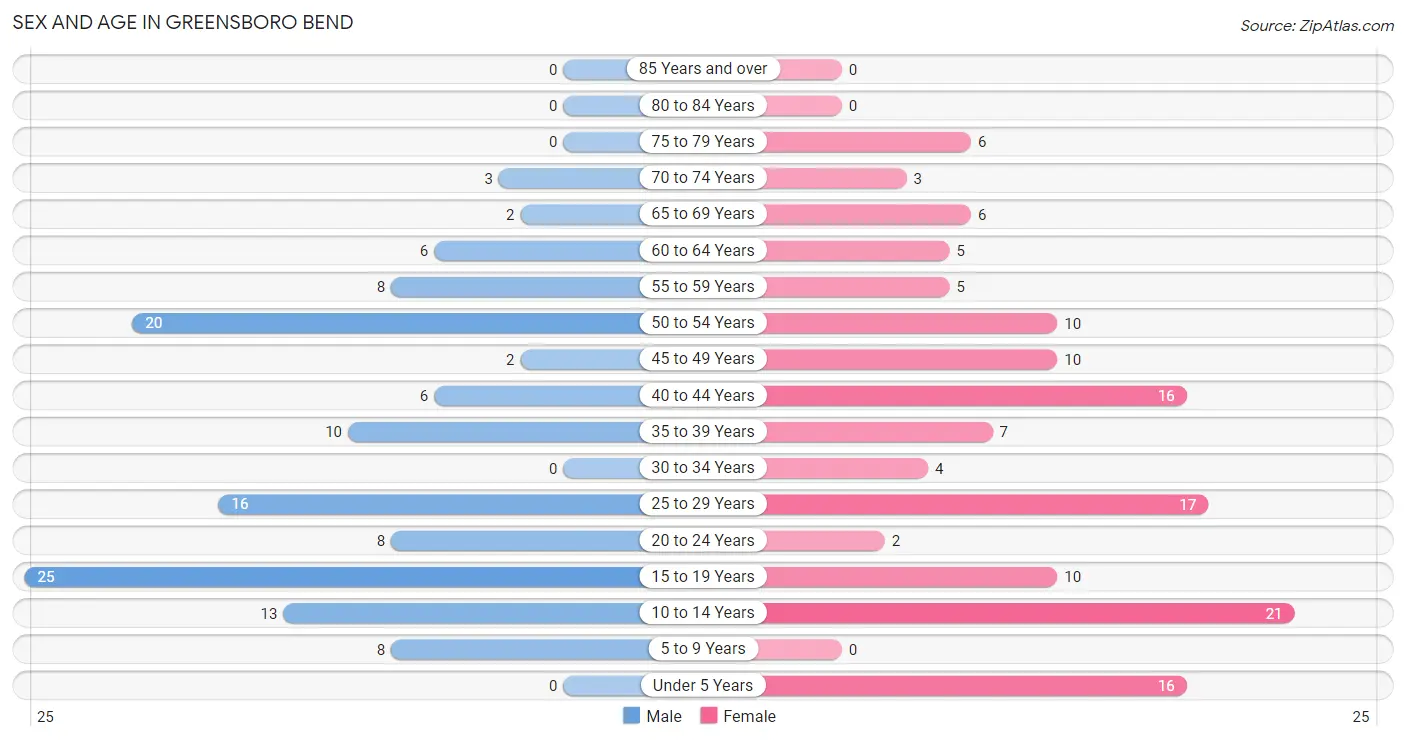
The most populous age groups in Greensboro Bend are 15 to 19 Years (25 | 19.7%) for men and 10 to 14 Years (21 | 15.2%) for women.
| Age Bracket | Male | Female |
| Under 5 Years | 0 (0.0%) | 16 (11.6%) |
| 5 to 9 Years | 8 (6.3%) | 0 (0.0%) |
| 10 to 14 Years | 13 (10.2%) | 21 (15.2%) |
| 15 to 19 Years | 25 (19.7%) | 10 (7.2%) |
| 20 to 24 Years | 8 (6.3%) | 2 (1.5%) |
| 25 to 29 Years | 16 (12.6%) | 17 (12.3%) |
| 30 to 34 Years | 0 (0.0%) | 4 (2.9%) |
| 35 to 39 Years | 10 (7.9%) | 7 (5.1%) |
| 40 to 44 Years | 6 (4.7%) | 16 (11.6%) |
| 45 to 49 Years | 2 (1.6%) | 10 (7.2%) |
| 50 to 54 Years | 20 (15.8%) | 10 (7.2%) |
| 55 to 59 Years | 8 (6.3%) | 5 (3.6%) |
| 60 to 64 Years | 6 (4.7%) | 5 (3.6%) |
| 65 to 69 Years | 2 (1.6%) | 6 (4.3%) |
| 70 to 74 Years | 3 (2.4%) | 3 (2.2%) |
| 75 to 79 Years | 0 (0.0%) | 6 (4.3%) |
| 80 to 84 Years | 0 (0.0%) | 0 (0.0%) |
| 85 Years and over | 0 (0.0%) | 0 (0.0%) |
| Total | 127 (100.0%) | 138 (100.0%) |
Families and Households in Greensboro Bend
Median Family Size in Greensboro Bend
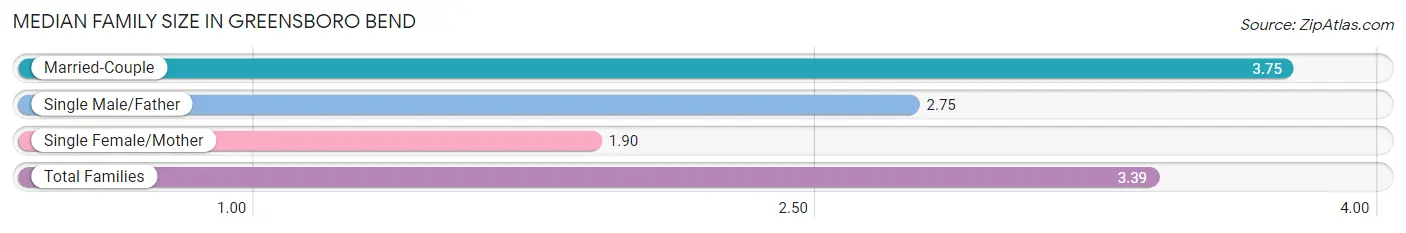
The median family size in Greensboro Bend is 3.39 persons per family, with married-couple families (48 | 77.4%) accounting for the largest median family size of 3.75 persons per family. On the other hand, single female/mother families (10 | 16.1%) represent the smallest median family size with 1.90 persons per family.
| Family Type | # Families | Family Size |
| Married-Couple | 48 (77.4%) | 3.75 |
| Single Male/Father | 4 (6.5%) | 2.75 |
| Single Female/Mother | 10 (16.1%) | 1.90 |
| Total Families | 62 (100.0%) | 3.39 |
Median Household Size in Greensboro Bend
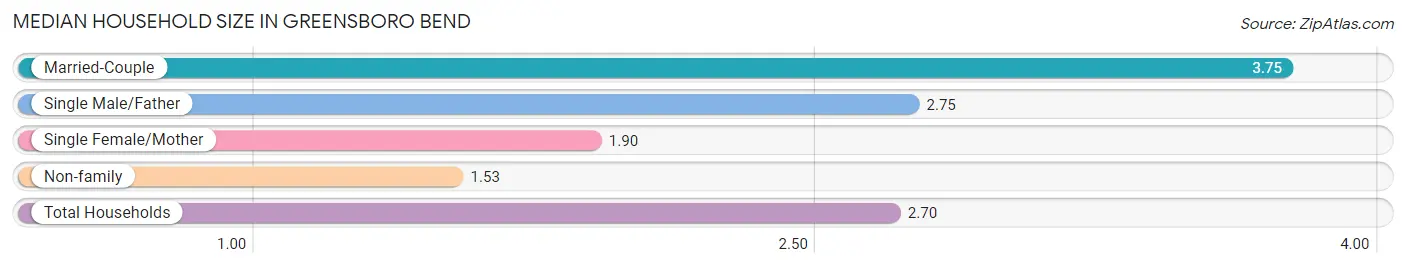
The median household size in Greensboro Bend is 2.70 persons per household, with married-couple households (48 | 49.0%) accounting for the largest median household size of 3.75 persons per household. non-family households (36 | 36.7%) represent the smallest median household size with 1.53 persons per household.
| Household Type | # Households | Household Size |
| Married-Couple | 48 (49.0%) | 3.75 |
| Single Male/Father | 4 (4.1%) | 2.75 |
| Single Female/Mother | 10 (10.2%) | 1.90 |
| Non-family | 36 (36.7%) | 1.53 |
| Total Households | 98 (100.0%) | 2.70 |
Household Size by Marriage Status in Greensboro Bend
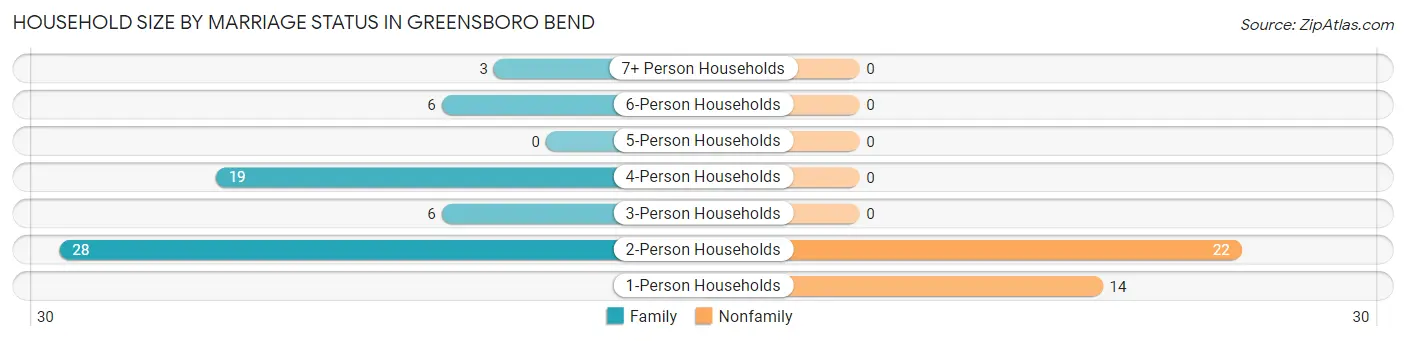
Out of a total of 98 households in Greensboro Bend, 62 (63.3%) are family households, while 36 (36.7%) are nonfamily households. The most numerous type of family households are 2-person households, comprising 28, and the most common type of nonfamily households are 2-person households, comprising 22.
| Household Size | Family Households | Nonfamily Households |
| 1-Person Households | - | 14 (14.3%) |
| 2-Person Households | 28 (28.6%) | 22 (22.5%) |
| 3-Person Households | 6 (6.1%) | 0 (0.0%) |
| 4-Person Households | 19 (19.4%) | 0 (0.0%) |
| 5-Person Households | 0 (0.0%) | 0 (0.0%) |
| 6-Person Households | 6 (6.1%) | 0 (0.0%) |
| 7+ Person Households | 3 (3.1%) | 0 (0.0%) |
| Total | 62 (63.3%) | 36 (36.7%) |
Female Fertility in Greensboro Bend
Fertility by Age in Greensboro Bend
| Age Bracket | Women with Births | Births / 1,000 Women |
| 15 to 19 years | 0 (0.0%) | 0.0 |
| 20 to 34 years | 0 (0.0%) | 0.0 |
| 35 to 50 years | 0 (0.0%) | 0.0 |
| Total | 0 (0.0%) | 0.0 |
Fertility by Age by Marriage Status in Greensboro Bend
| Age Bracket | Married | Unmarried |
| 15 to 19 years | 0 (0.0%) | 0 (0.0%) |
| 20 to 34 years | 0 (0.0%) | 0 (0.0%) |
| 35 to 50 years | 0 (0.0%) | 0 (0.0%) |
| Total | 0 (0.0%) | 0 (0.0%) |
Fertility by Education in Greensboro Bend
| Educational Attainment | Women with Births | Births / 1,000 Women |
| Less than High School | 0 (0.0%) | 0.0 |
| High School Diploma | 0 (0.0%) | 0.0 |
| College or Associate's Degree | 0 (0.0%) | 0.0 |
| Bachelor's Degree | 0 (0.0%) | 0.0 |
| Graduate Degree | 0 (0.0%) | 0.0 |
| Total | 0 (0.0%) | 0.0 |
Fertility by Education by Marriage Status in Greensboro Bend
| Educational Attainment | Married | Unmarried |
| Less than High School | 0 (0.0%) | 0 (0.0%) |
| High School Diploma | 0 (0.0%) | 0 (0.0%) |
| College or Associate's Degree | 0 (0.0%) | 0 (0.0%) |
| Bachelor's Degree | 0 (0.0%) | 0 (0.0%) |
| Graduate Degree | 0 (0.0%) | 0 (0.0%) |
| Total | 0 (0.0%) | 0 (0.0%) |
Employment Characteristics in Greensboro Bend
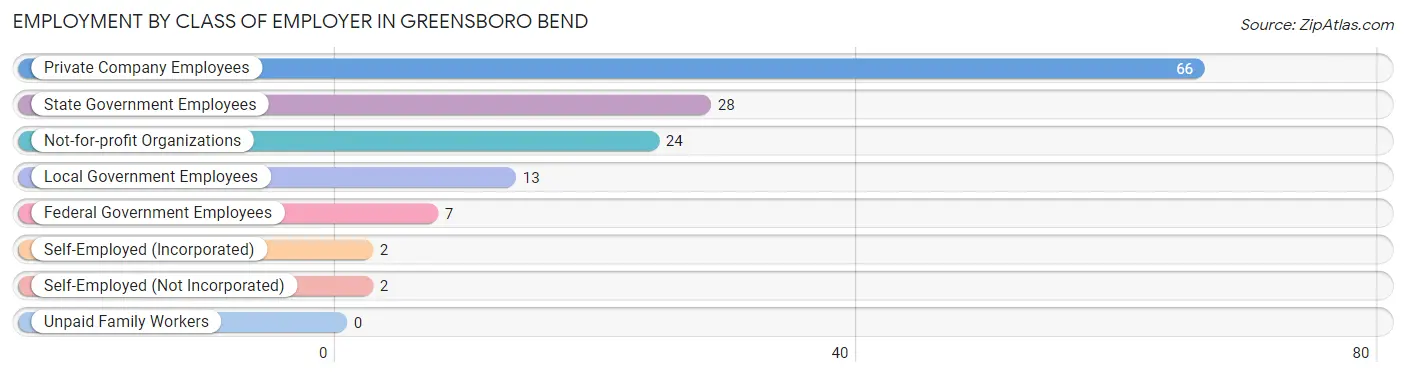
Employment by Class of Employer in Greensboro Bend
Among the 142 employed individuals in Greensboro Bend, private company employees (66 | 46.5%), state government employees (28 | 19.7%), and not-for-profit organizations (24 | 16.9%) make up the most common classes of employment.
| Employer Class | # Employees | % Employees |
| Private Company Employees | 66 | 46.5% |
| Self-Employed (Incorporated) | 2 | 1.4% |
| Self-Employed (Not Incorporated) | 2 | 1.4% |
| Not-for-profit Organizations | 24 | 16.9% |
| Local Government Employees | 13 | 9.1% |
| State Government Employees | 28 | 19.7% |
| Federal Government Employees | 7 | 4.9% |
| Unpaid Family Workers | 0 | 0.0% |
| Total | 142 | 100.0% |
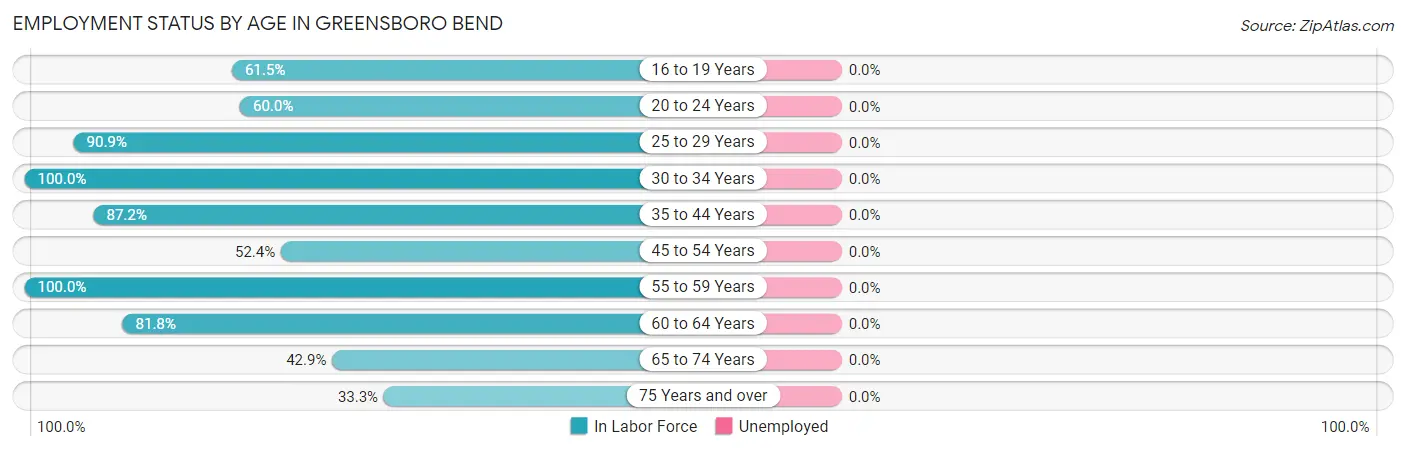
Employment Status by Age in Greensboro Bend
| Age Bracket | In Labor Force | Unemployed |
| 16 to 19 Years | 16 (61.5%) | 0 (0.0%) |
| 20 to 24 Years | 6 (60.0%) | 0 (0.0%) |
| 25 to 29 Years | 30 (90.9%) | 0 (0.0%) |
| 30 to 34 Years | 4 (100.0%) | 0 (0.0%) |
| 35 to 44 Years | 34 (87.2%) | 0 (0.0%) |
| 45 to 54 Years | 22 (52.4%) | 0 (0.0%) |
| 55 to 59 Years | 13 (100.0%) | 0 (0.0%) |
| 60 to 64 Years | 9 (81.8%) | 0 (0.0%) |
| 65 to 74 Years | 6 (42.9%) | 0 (0.0%) |
| 75 Years and over | 2 (33.3%) | 0 (0.0%) |
| Total | 142 (71.7%) | 0 (0.0%) |
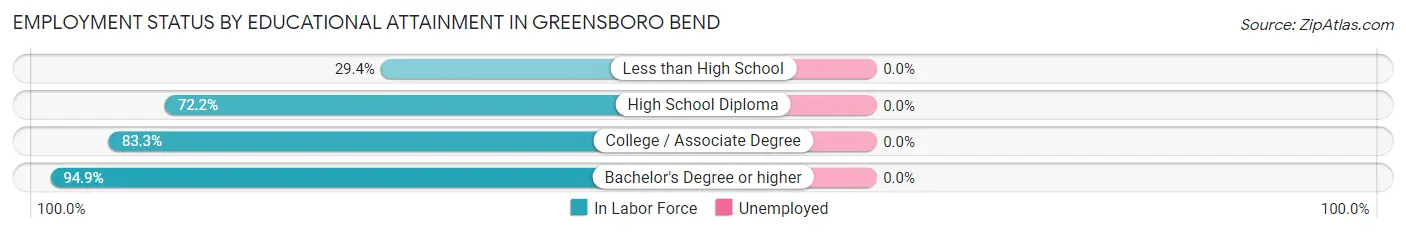
Employment Status by Educational Attainment in Greensboro Bend
| Educational Attainment | In Labor Force | Unemployed |
| Less than High School | 5 (29.4%) | 0 (0.0%) |
| High School Diploma | 26 (72.2%) | 0 (0.0%) |
| College / Associate Degree | 25 (83.3%) | 0 (0.0%) |
| Bachelor's Degree or higher | 56 (94.9%) | 0 (0.0%) |
| Total | 112 (78.9%) | 0 (0.0%) |
Employment Occupations by Sex in Greensboro Bend
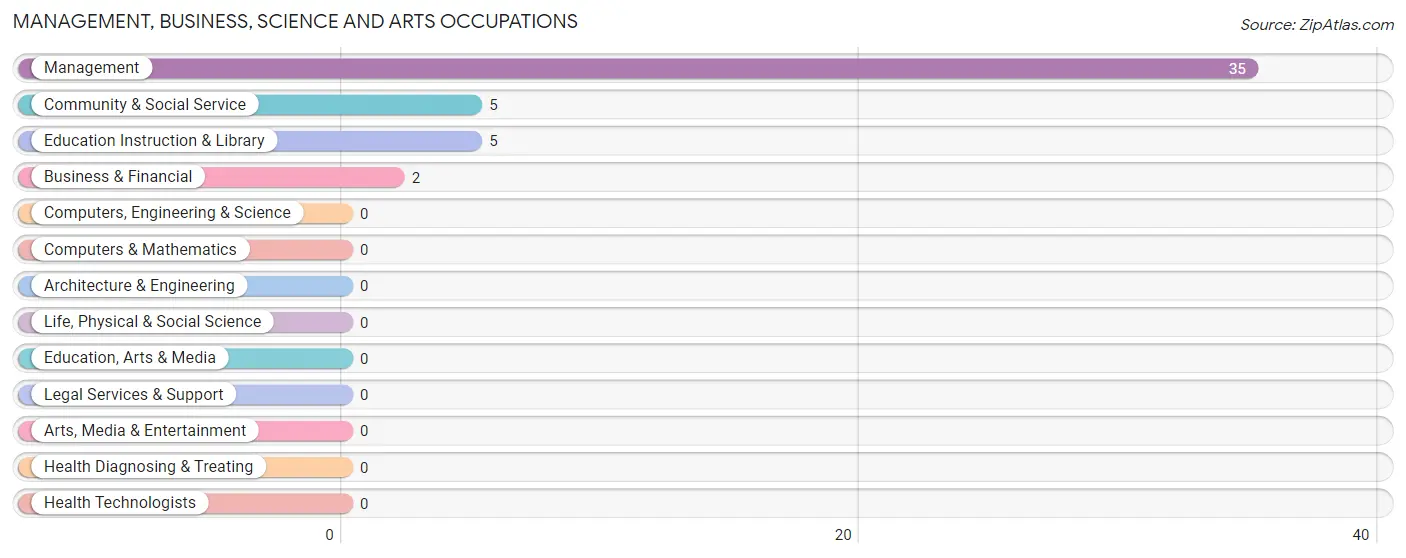
Management, Business, Science and Arts Occupations
The most common Management, Business, Science and Arts occupations in Greensboro Bend are Management (35 | 25.2%), Community & Social Service (5 | 3.6%), Education Instruction & Library (5 | 3.6%), and Business & Financial (2 | 1.4%).
Management, Business, Science and Arts Occupations by Sex
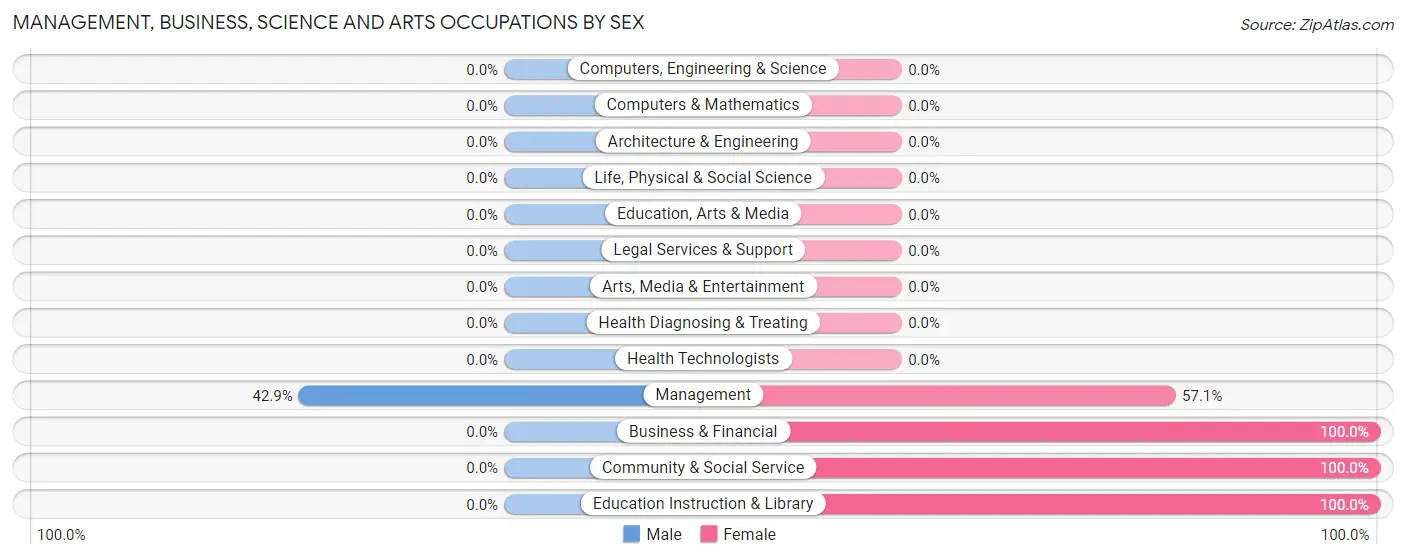
| Occupation | Male | Female |
| Management | 15 (42.9%) | 20 (57.1%) |
| Business & Financial | 0 (0.0%) | 2 (100.0%) |
| Computers, Engineering & Science | 0 (0.0%) | 0 (0.0%) |
| Computers & Mathematics | 0 (0.0%) | 0 (0.0%) |
| Architecture & Engineering | 0 (0.0%) | 0 (0.0%) |
| Life, Physical & Social Science | 0 (0.0%) | 0 (0.0%) |
| Community & Social Service | 0 (0.0%) | 5 (100.0%) |
| Education, Arts & Media | 0 (0.0%) | 0 (0.0%) |
| Legal Services & Support | 0 (0.0%) | 0 (0.0%) |
| Education Instruction & Library | 0 (0.0%) | 5 (100.0%) |
| Arts, Media & Entertainment | 0 (0.0%) | 0 (0.0%) |
| Health Diagnosing & Treating | 0 (0.0%) | 0 (0.0%) |
| Health Technologists | 0 (0.0%) | 0 (0.0%) |
| Total (Category) | 15 (35.7%) | 27 (64.3%) |
| Total (Overall) | 77 (55.4%) | 62 (44.6%) |
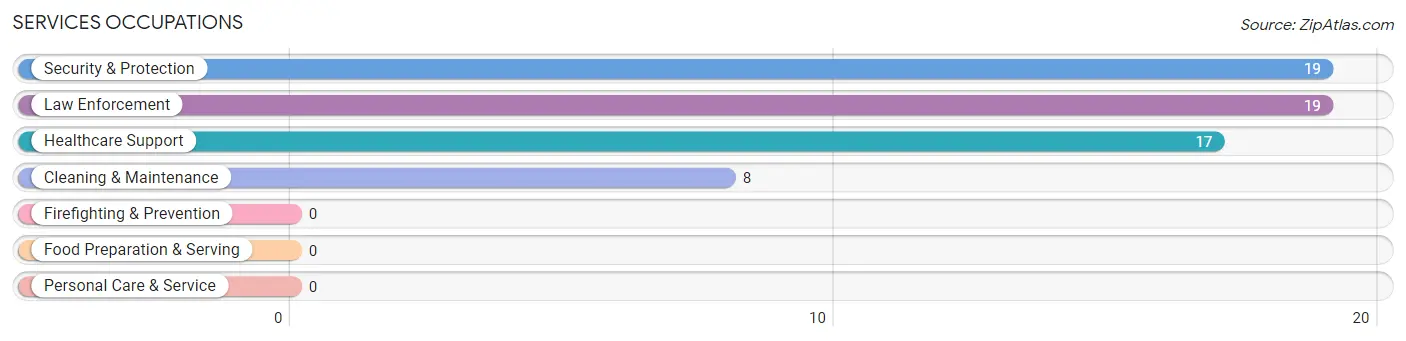
Services Occupations
The most common Services occupations in Greensboro Bend are Security & Protection (19 | 13.7%), Law Enforcement (19 | 13.7%), Healthcare Support (17 | 12.2%), and Cleaning & Maintenance (8 | 5.8%).
Services Occupations by Sex
Within the Services occupations in Greensboro Bend, the most male-oriented occupations are Security & Protection (100.0%), Law Enforcement (100.0%), and Cleaning & Maintenance (37.5%), while the most female-oriented occupations are Healthcare Support (100.0%), and Cleaning & Maintenance (62.5%).
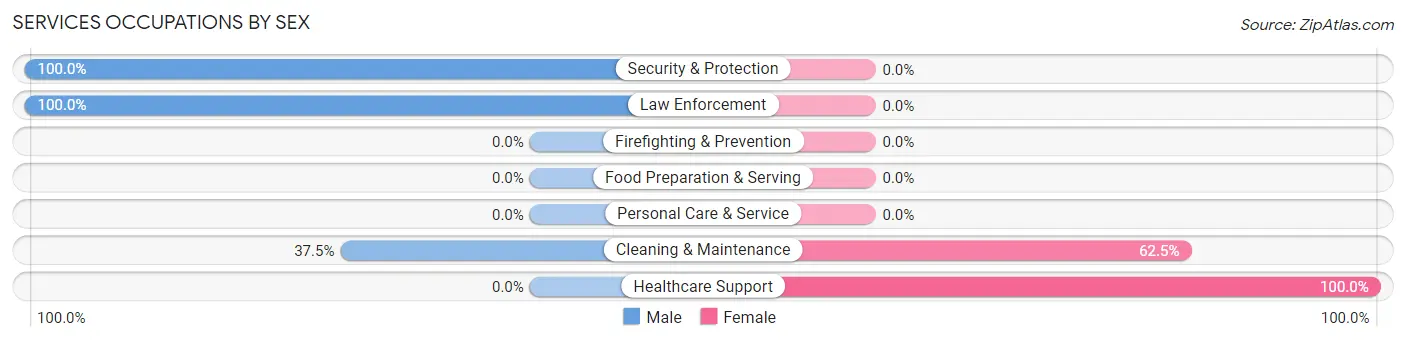
| Occupation | Male | Female |
| Healthcare Support | 0 (0.0%) | 17 (100.0%) |
| Security & Protection | 19 (100.0%) | 0 (0.0%) |
| Firefighting & Prevention | 0 (0.0%) | 0 (0.0%) |
| Law Enforcement | 19 (100.0%) | 0 (0.0%) |
| Food Preparation & Serving | 0 (0.0%) | 0 (0.0%) |
| Cleaning & Maintenance | 3 (37.5%) | 5 (62.5%) |
| Personal Care & Service | 0 (0.0%) | 0 (0.0%) |
| Total (Category) | 22 (50.0%) | 22 (50.0%) |
| Total (Overall) | 77 (55.4%) | 62 (44.6%) |
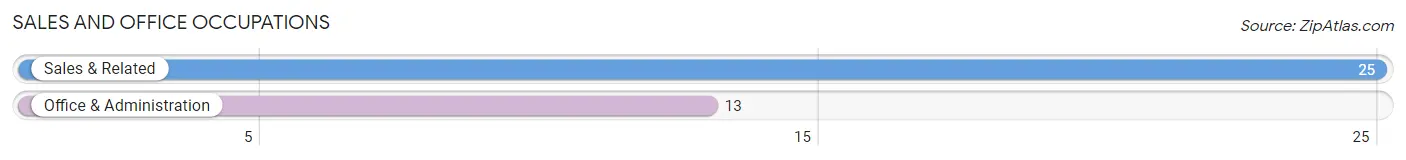
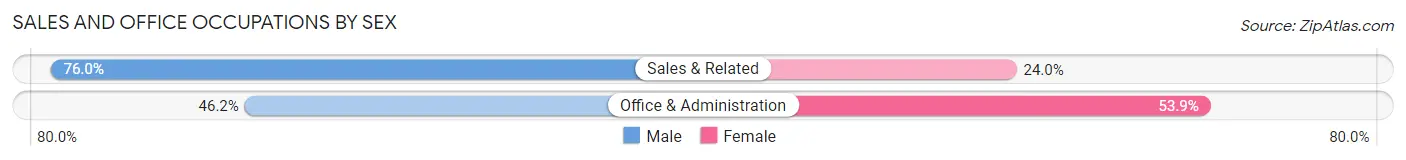
Sales and Office Occupations
The most common Sales and Office occupations in Greensboro Bend are Sales & Related (25 | 18.0%), and Office & Administration (13 | 9.3%).
Sales and Office Occupations by Sex
| Occupation | Male | Female |
| Sales & Related | 19 (76.0%) | 6 (24.0%) |
| Office & Administration | 6 (46.2%) | 7 (53.8%) |
| Total (Category) | 25 (65.8%) | 13 (34.2%) |
| Total (Overall) | 77 (55.4%) | 62 (44.6%) |
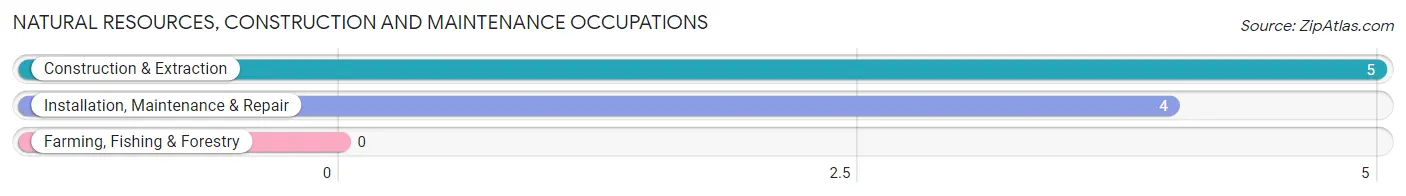
Natural Resources, Construction and Maintenance Occupations
The most common Natural Resources, Construction and Maintenance occupations in Greensboro Bend are Construction & Extraction (5 | 3.6%), and Installation, Maintenance & Repair (4 | 2.9%).
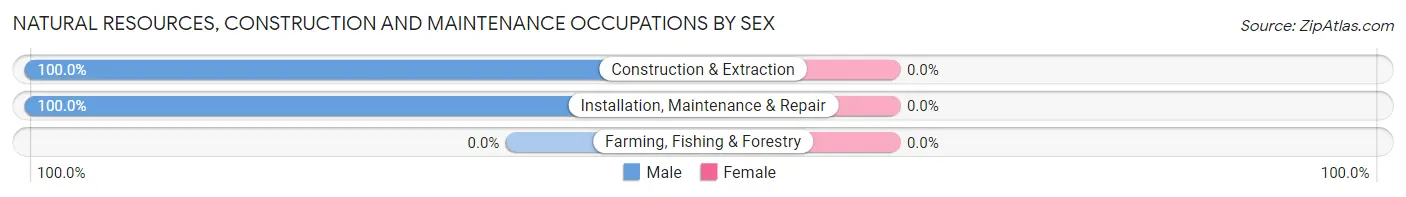
Natural Resources, Construction and Maintenance Occupations by Sex
| Occupation | Male | Female |
| Farming, Fishing & Forestry | 0 (0.0%) | 0 (0.0%) |
| Construction & Extraction | 5 (100.0%) | 0 (0.0%) |
| Installation, Maintenance & Repair | 4 (100.0%) | 0 (0.0%) |
| Total (Category) | 9 (100.0%) | 0 (0.0%) |
| Total (Overall) | 77 (55.4%) | 62 (44.6%) |
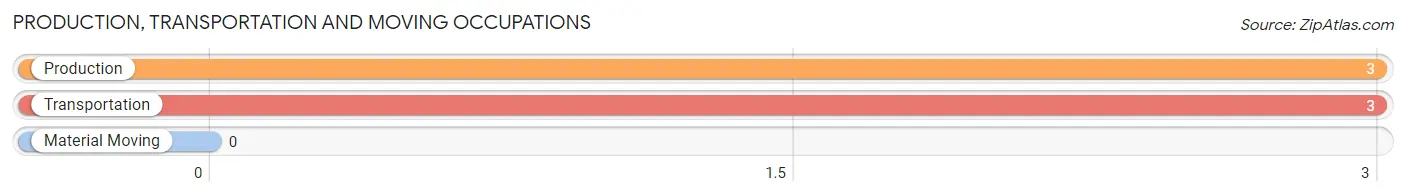
Production, Transportation and Moving Occupations
The most common Production, Transportation and Moving occupations in Greensboro Bend are Production (3 | 2.2%), and Transportation (3 | 2.2%).
Production, Transportation and Moving Occupations by Sex
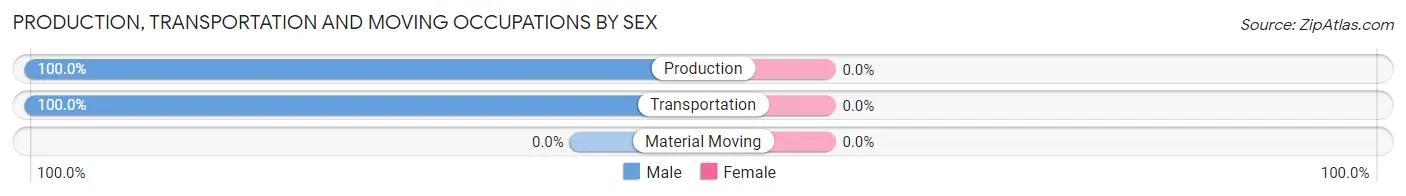
| Occupation | Male | Female |
| Production | 3 (100.0%) | 0 (0.0%) |
| Transportation | 3 (100.0%) | 0 (0.0%) |
| Material Moving | 0 (0.0%) | 0 (0.0%) |
| Total (Category) | 6 (100.0%) | 0 (0.0%) |
| Total (Overall) | 77 (55.4%) | 62 (44.6%) |
Employment Industries by Sex in Greensboro Bend
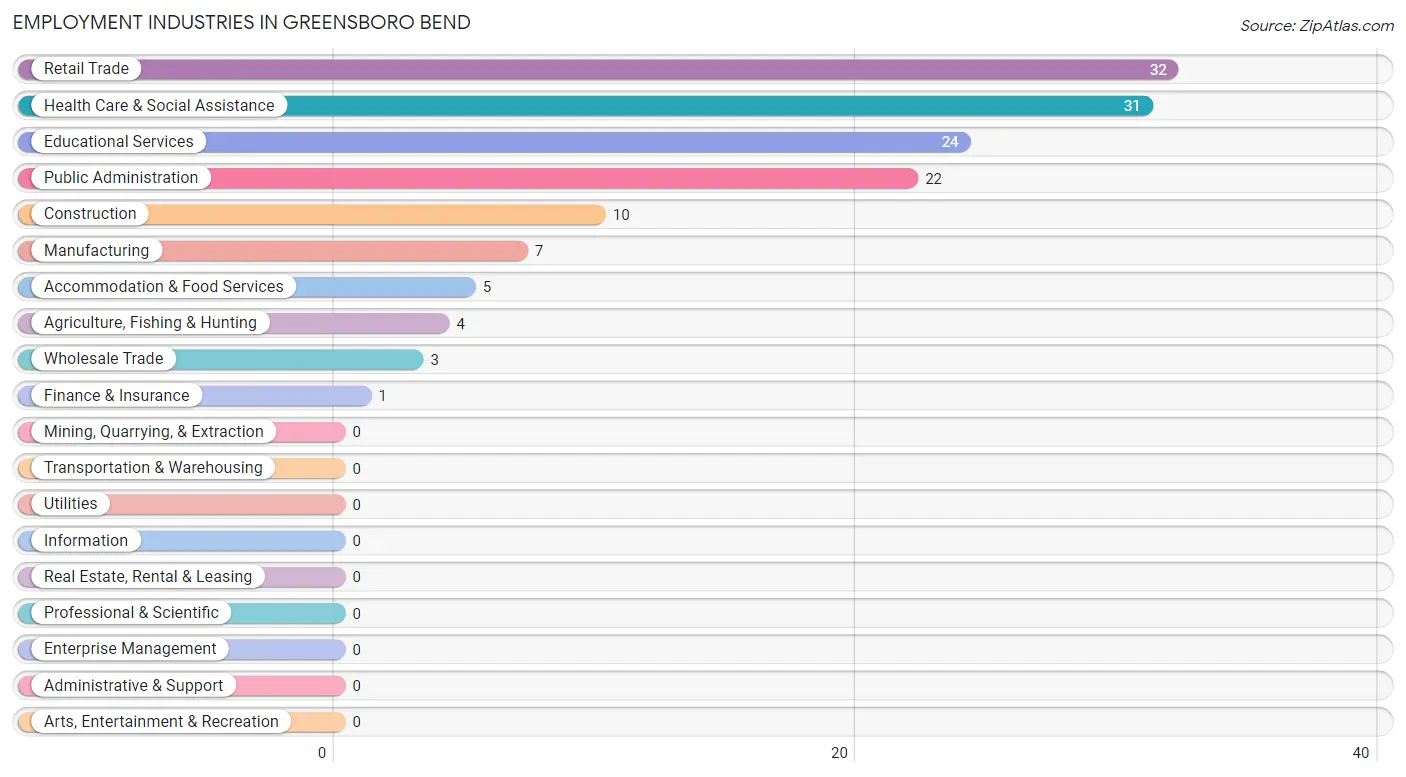
Employment Industries in Greensboro Bend
The major employment industries in Greensboro Bend include Retail Trade (32 | 23.0%), Health Care & Social Assistance (31 | 22.3%), Educational Services (24 | 17.3%), Public Administration (22 | 15.8%), and Construction (10 | 7.2%).
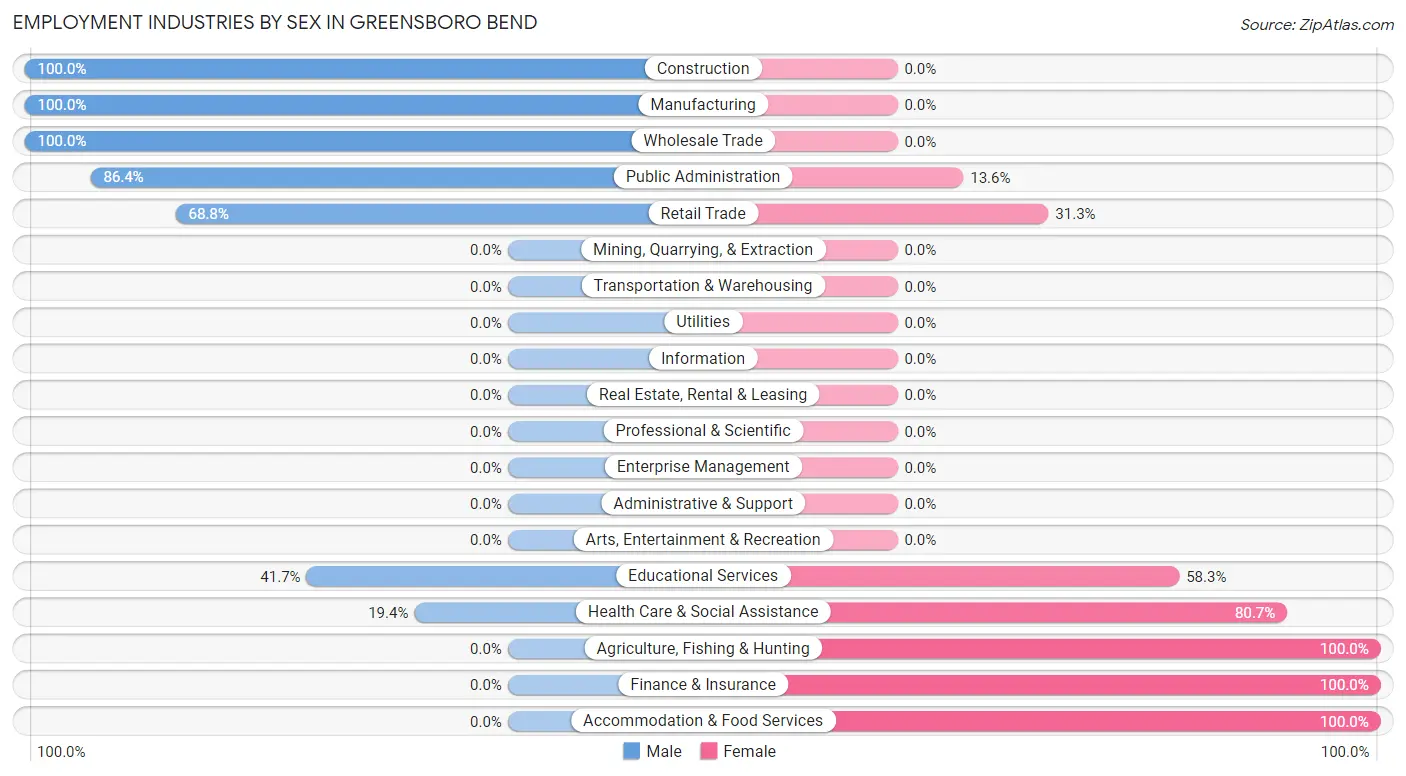
Employment Industries by Sex in Greensboro Bend
The Greensboro Bend industries that see more men than women are Construction (100.0%), Manufacturing (100.0%), and Wholesale Trade (100.0%), whereas the industries that tend to have a higher number of women are Agriculture, Fishing & Hunting (100.0%), Finance & Insurance (100.0%), and Accommodation & Food Services (100.0%).
| Industry | Male | Female |
| Agriculture, Fishing & Hunting | 0 (0.0%) | 4 (100.0%) |
| Mining, Quarrying, & Extraction | 0 (0.0%) | 0 (0.0%) |
| Construction | 10 (100.0%) | 0 (0.0%) |
| Manufacturing | 7 (100.0%) | 0 (0.0%) |
| Wholesale Trade | 3 (100.0%) | 0 (0.0%) |
| Retail Trade | 22 (68.8%) | 10 (31.2%) |
| Transportation & Warehousing | 0 (0.0%) | 0 (0.0%) |
| Utilities | 0 (0.0%) | 0 (0.0%) |
| Information | 0 (0.0%) | 0 (0.0%) |
| Finance & Insurance | 0 (0.0%) | 1 (100.0%) |
| Real Estate, Rental & Leasing | 0 (0.0%) | 0 (0.0%) |
| Professional & Scientific | 0 (0.0%) | 0 (0.0%) |
| Enterprise Management | 0 (0.0%) | 0 (0.0%) |
| Administrative & Support | 0 (0.0%) | 0 (0.0%) |
| Educational Services | 10 (41.7%) | 14 (58.3%) |
| Health Care & Social Assistance | 6 (19.4%) | 25 (80.6%) |
| Arts, Entertainment & Recreation | 0 (0.0%) | 0 (0.0%) |
| Accommodation & Food Services | 0 (0.0%) | 5 (100.0%) |
| Public Administration | 19 (86.4%) | 3 (13.6%) |
| Total | 77 (55.4%) | 62 (44.6%) |
Education in Greensboro Bend
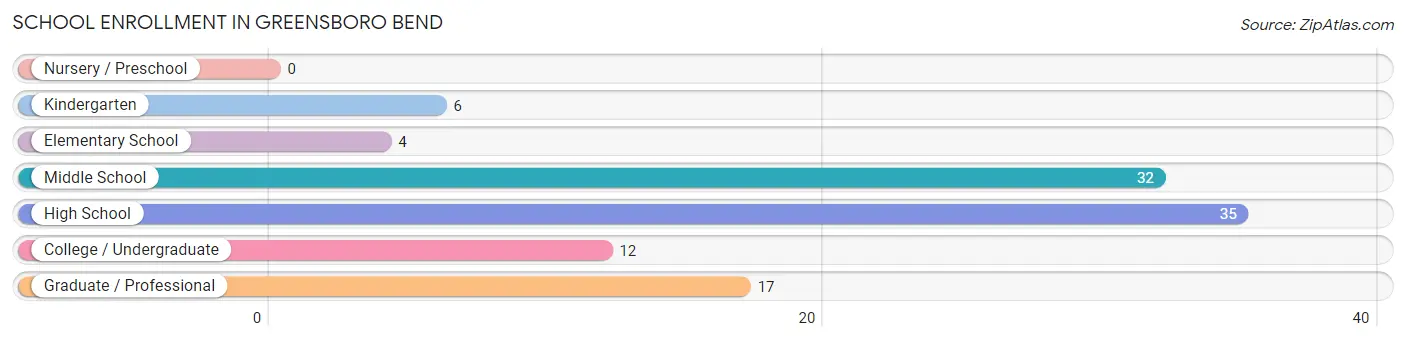
School Enrollment in Greensboro Bend
The most common levels of schooling among the 106 students in Greensboro Bend are high school (35 | 33.0%), middle school (32 | 30.2%), and graduate / professional (17 | 16.0%).
| School Level | # Students | % Students |
| Nursery / Preschool | 0 | 0.0% |
| Kindergarten | 6 | 5.7% |
| Elementary School | 4 | 3.8% |
| Middle School | 32 | 30.2% |
| High School | 35 | 33.0% |
| College / Undergraduate | 12 | 11.3% |
| Graduate / Professional | 17 | 16.0% |
| Total | 106 | 100.0% |
School Enrollment by Age by Funding Source in Greensboro Bend
Out of a total of 106 students who are enrolled in schools in Greensboro Bend, 36 (34.0%) attend a private institution, while the remaining 70 (66.0%) are enrolled in public schools. The age group of 5 to 9 year old has the highest likelihood of being enrolled in private schools, with 8 (100.0% in the age bracket) enrolled. Conversely, the age group of 25 to 34 year olds has the lowest likelihood of being enrolled in a private school, with 14 (82.4% in the age bracket) attending a public institution.
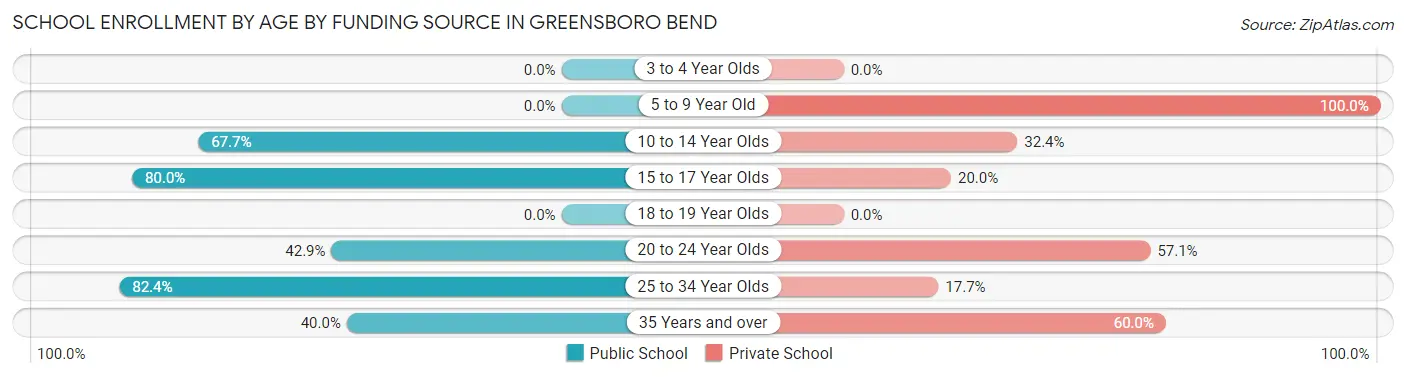
| Age Bracket | Public School | Private School |
| 3 to 4 Year Olds | 0 (0.0%) | 0 (0.0%) |
| 5 to 9 Year Old | 0 (0.0%) | 8 (100.0%) |
| 10 to 14 Year Olds | 23 (67.6%) | 11 (32.4%) |
| 15 to 17 Year Olds | 28 (80.0%) | 7 (20.0%) |
| 18 to 19 Year Olds | 0 (0.0%) | 0 (0.0%) |
| 20 to 24 Year Olds | 3 (42.9%) | 4 (57.1%) |
| 25 to 34 Year Olds | 14 (82.4%) | 3 (17.6%) |
| 35 Years and over | 2 (40.0%) | 3 (60.0%) |
| Total | 70 (66.0%) | 36 (34.0%) |
Educational Attainment by Field of Study in Greensboro Bend
Arts & humanities (16 | 27.1%), science & technology (14 | 23.7%), business (9 | 15.2%), education (9 | 15.2%), and bio, nature & agricultural (5 | 8.5%) are the most common fields of study among 59 individuals in Greensboro Bend who have obtained a bachelor's degree or higher.
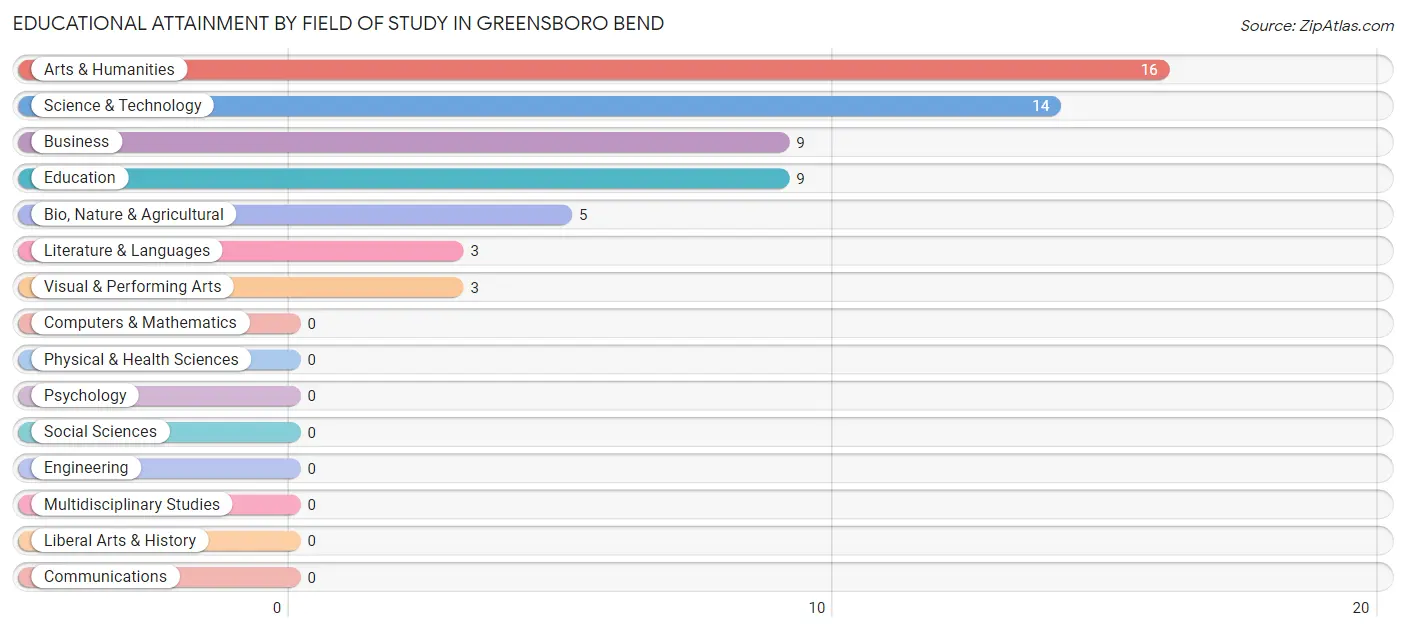
| Field of Study | # Graduates | % Graduates |
| Computers & Mathematics | 0 | 0.0% |
| Bio, Nature & Agricultural | 5 | 8.5% |
| Physical & Health Sciences | 0 | 0.0% |
| Psychology | 0 | 0.0% |
| Social Sciences | 0 | 0.0% |
| Engineering | 0 | 0.0% |
| Multidisciplinary Studies | 0 | 0.0% |
| Science & Technology | 14 | 23.7% |
| Business | 9 | 15.2% |
| Education | 9 | 15.2% |
| Literature & Languages | 3 | 5.1% |
| Liberal Arts & History | 0 | 0.0% |
| Visual & Performing Arts | 3 | 5.1% |
| Communications | 0 | 0.0% |
| Arts & Humanities | 16 | 27.1% |
| Total | 59 | 100.0% |
Transportation & Commute in Greensboro Bend
Vehicle Availability by Sex in Greensboro Bend
The most prevalent vehicle ownership categories in Greensboro Bend are males with 2 vehicles (43, accounting for 53.7%) and females with 2 vehicles (38, making up 69.4%).
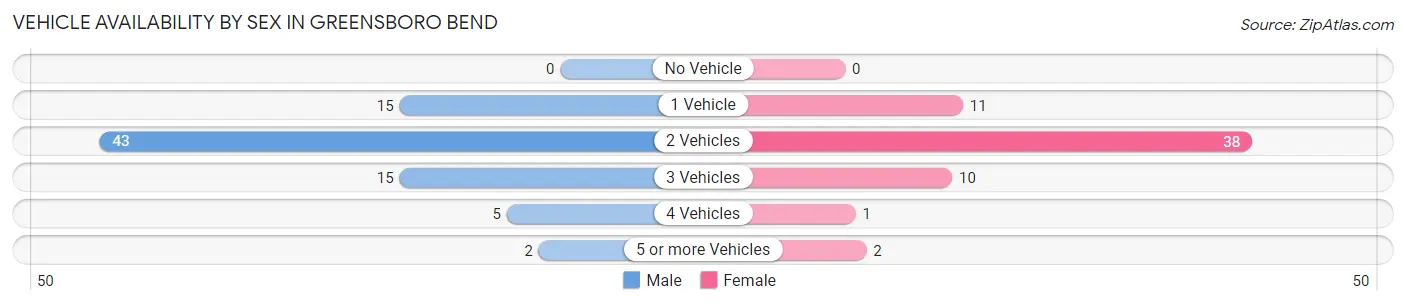
| Vehicles Available | Male | Female |
| No Vehicle | 0 (0.0%) | 0 (0.0%) |
| 1 Vehicle | 15 (18.8%) | 11 (17.7%) |
| 2 Vehicles | 43 (53.7%) | 38 (61.3%) |
| 3 Vehicles | 15 (18.8%) | 10 (16.1%) |
| 4 Vehicles | 5 (6.2%) | 1 (1.6%) |
| 5 or more Vehicles | 2 (2.5%) | 2 (3.2%) |
| Total | 80 (100.0%) | 62 (100.0%) |
Commute Time in Greensboro Bend
The most frequently occuring commute durations in Greensboro Bend are less than 5 minutes (25 commuters, 18.9%), 45 to 59 minutes (23 commuters, 17.4%), and 15 to 19 minutes (21 commuters, 15.9%).
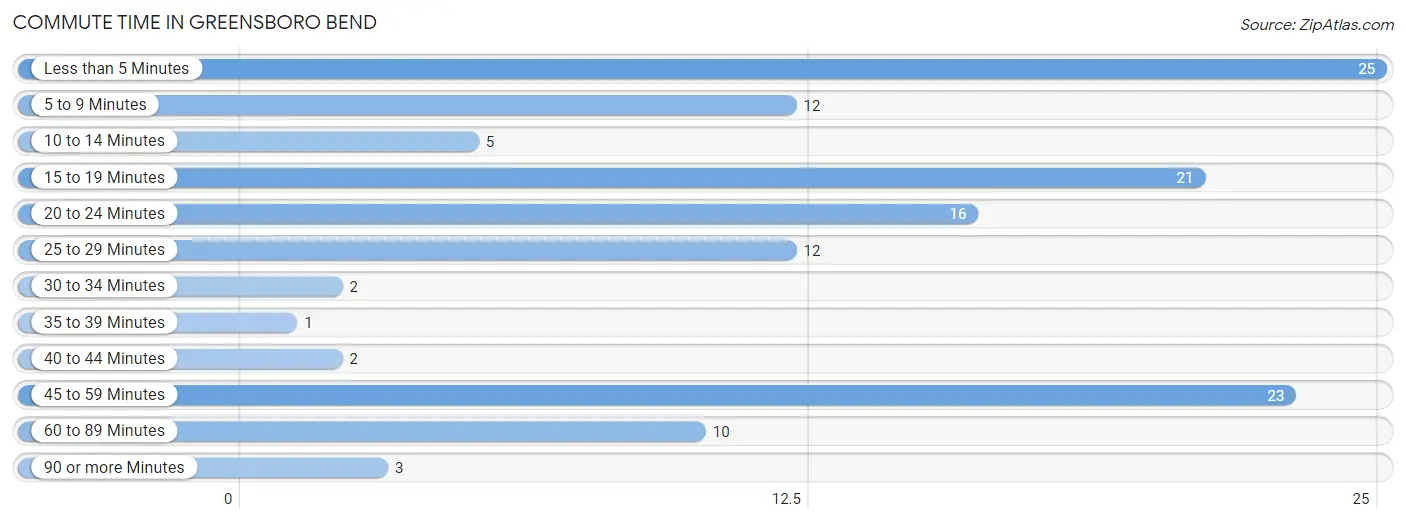
| Commute Time | # Commuters | % Commuters |
| Less than 5 Minutes | 25 | 18.9% |
| 5 to 9 Minutes | 12 | 9.1% |
| 10 to 14 Minutes | 5 | 3.8% |
| 15 to 19 Minutes | 21 | 15.9% |
| 20 to 24 Minutes | 16 | 12.1% |
| 25 to 29 Minutes | 12 | 9.1% |
| 30 to 34 Minutes | 2 | 1.5% |
| 35 to 39 Minutes | 1 | 0.8% |
| 40 to 44 Minutes | 2 | 1.5% |
| 45 to 59 Minutes | 23 | 17.4% |
| 60 to 89 Minutes | 10 | 7.6% |
| 90 or more Minutes | 3 | 2.3% |
Commute Time by Sex in Greensboro Bend
The most common commute times in Greensboro Bend are 15 to 19 minutes (19 commuters, 25.7%) for males and less than 5 minutes (17 commuters, 29.3%) for females.
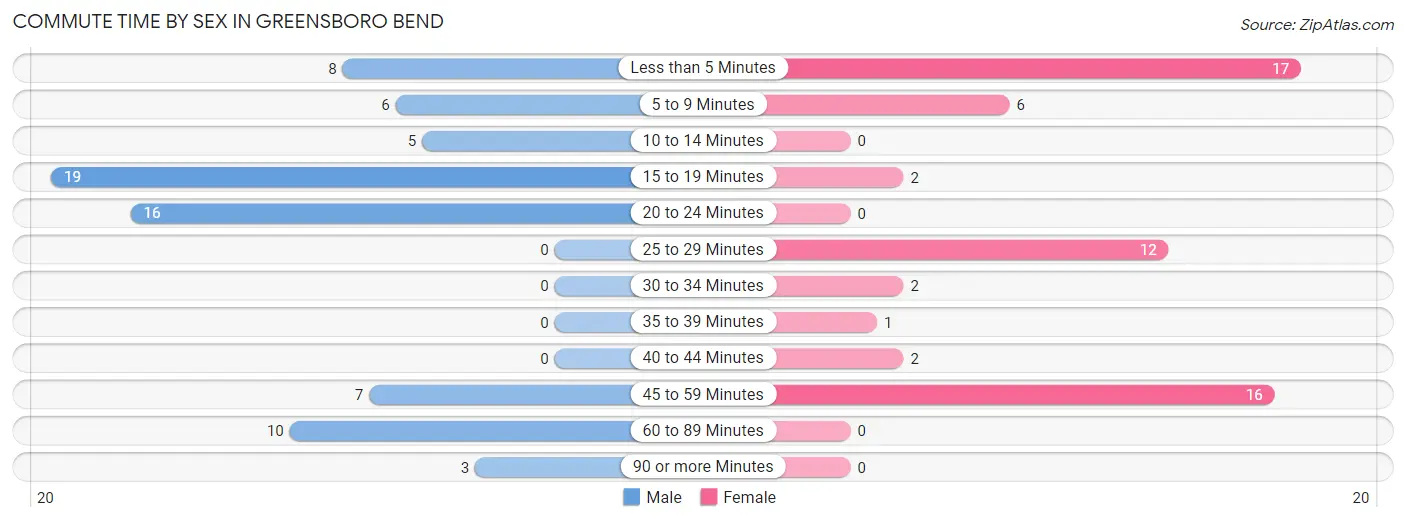
| Commute Time | Male | Female |
| Less than 5 Minutes | 8 (10.8%) | 17 (29.3%) |
| 5 to 9 Minutes | 6 (8.1%) | 6 (10.3%) |
| 10 to 14 Minutes | 5 (6.8%) | 0 (0.0%) |
| 15 to 19 Minutes | 19 (25.7%) | 2 (3.5%) |
| 20 to 24 Minutes | 16 (21.6%) | 0 (0.0%) |
| 25 to 29 Minutes | 0 (0.0%) | 12 (20.7%) |
| 30 to 34 Minutes | 0 (0.0%) | 2 (3.5%) |
| 35 to 39 Minutes | 0 (0.0%) | 1 (1.7%) |
| 40 to 44 Minutes | 0 (0.0%) | 2 (3.5%) |
| 45 to 59 Minutes | 7 (9.5%) | 16 (27.6%) |
| 60 to 89 Minutes | 10 (13.5%) | 0 (0.0%) |
| 90 or more Minutes | 3 (4.1%) | 0 (0.0%) |
Time of Departure to Work by Sex in Greensboro Bend
The most frequent times of departure to work in Greensboro Bend are 4:00 PM to 11:59 PM (16, 21.6%) for males and 7:00 AM to 7:29 AM (29, 50.0%) for females.
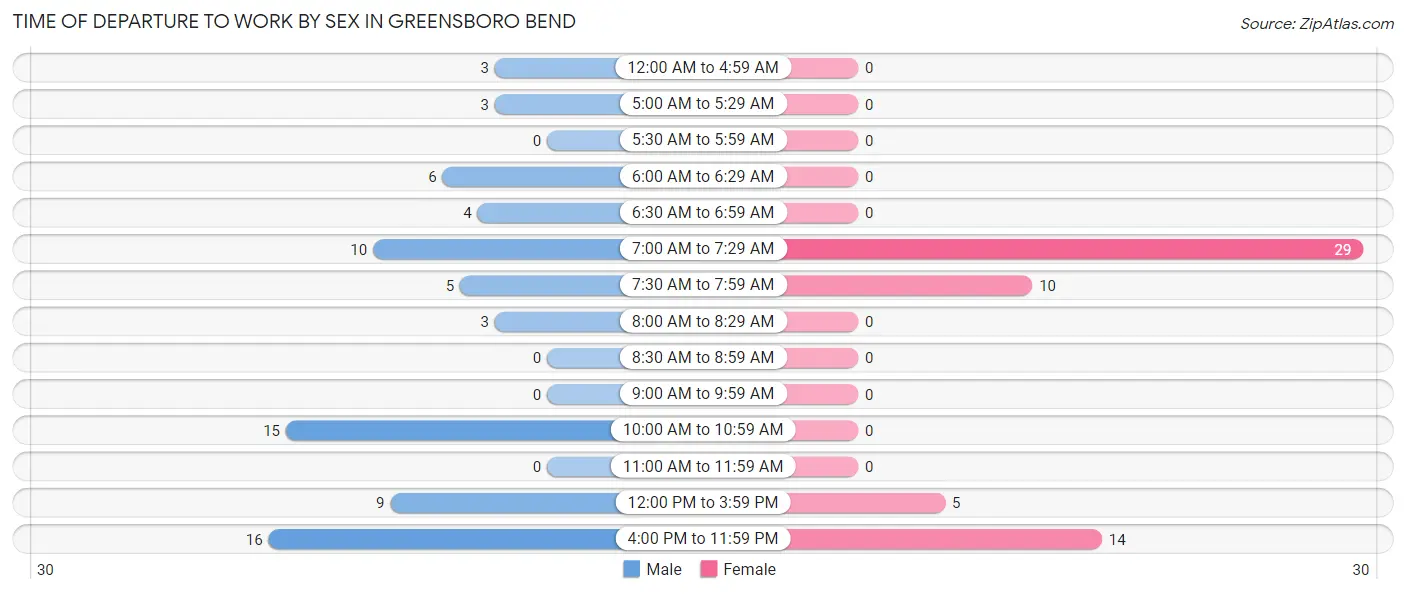
| Time of Departure | Male | Female |
| 12:00 AM to 4:59 AM | 3 (4.1%) | 0 (0.0%) |
| 5:00 AM to 5:29 AM | 3 (4.1%) | 0 (0.0%) |
| 5:30 AM to 5:59 AM | 0 (0.0%) | 0 (0.0%) |
| 6:00 AM to 6:29 AM | 6 (8.1%) | 0 (0.0%) |
| 6:30 AM to 6:59 AM | 4 (5.4%) | 0 (0.0%) |
| 7:00 AM to 7:29 AM | 10 (13.5%) | 29 (50.0%) |
| 7:30 AM to 7:59 AM | 5 (6.8%) | 10 (17.2%) |
| 8:00 AM to 8:29 AM | 3 (4.1%) | 0 (0.0%) |
| 8:30 AM to 8:59 AM | 0 (0.0%) | 0 (0.0%) |
| 9:00 AM to 9:59 AM | 0 (0.0%) | 0 (0.0%) |
| 10:00 AM to 10:59 AM | 15 (20.3%) | 0 (0.0%) |
| 11:00 AM to 11:59 AM | 0 (0.0%) | 0 (0.0%) |
| 12:00 PM to 3:59 PM | 9 (12.2%) | 5 (8.6%) |
| 4:00 PM to 11:59 PM | 16 (21.6%) | 14 (24.1%) |
| Total | 74 (100.0%) | 58 (100.0%) |
Housing Occupancy in Greensboro Bend
Occupancy by Ownership in Greensboro Bend
Of the total 98 dwellings in Greensboro Bend, owner-occupied units account for 69 (70.4%), while renter-occupied units make up 29 (29.6%).
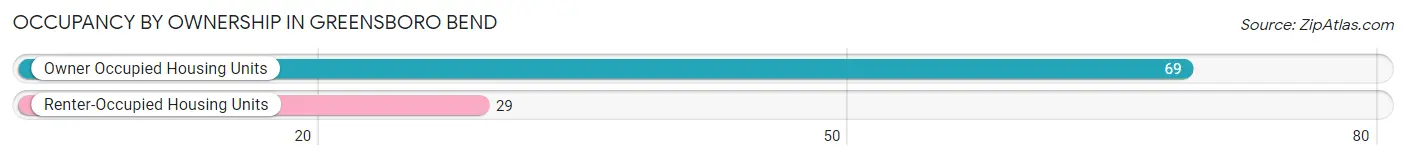
| Occupancy | # Housing Units | % Housing Units |
| Owner Occupied Housing Units | 69 | 70.4% |
| Renter-Occupied Housing Units | 29 | 29.6% |
| Total Occupied Housing Units | 98 | 100.0% |
Occupancy by Household Size in Greensboro Bend
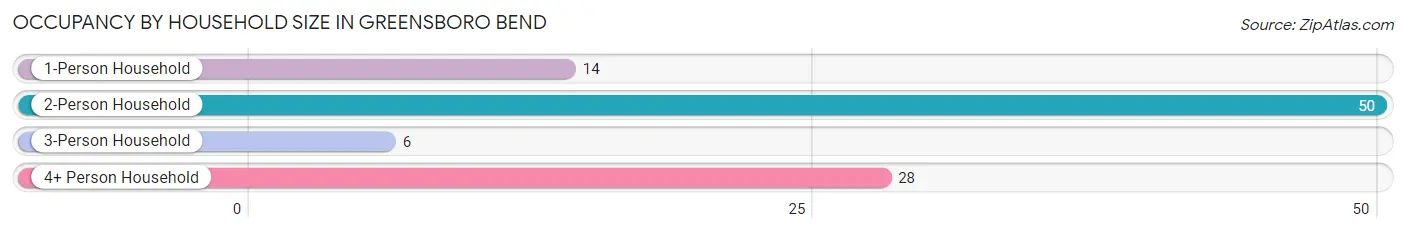
| Household Size | # Housing Units | % Housing Units |
| 1-Person Household | 14 | 14.3% |
| 2-Person Household | 50 | 51.0% |
| 3-Person Household | 6 | 6.1% |
| 4+ Person Household | 28 | 28.6% |
| Total Housing Units | 98 | 100.0% |
Occupancy by Ownership by Household Size in Greensboro Bend
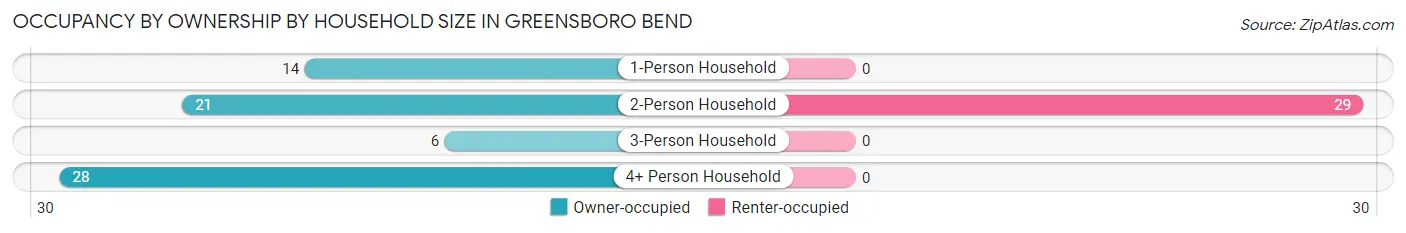
| Household Size | Owner-occupied | Renter-occupied |
| 1-Person Household | 14 (100.0%) | 0 (0.0%) |
| 2-Person Household | 21 (42.0%) | 29 (58.0%) |
| 3-Person Household | 6 (100.0%) | 0 (0.0%) |
| 4+ Person Household | 28 (100.0%) | 0 (0.0%) |
| Total Housing Units | 69 (70.4%) | 29 (29.6%) |
Occupancy by Educational Attainment in Greensboro Bend
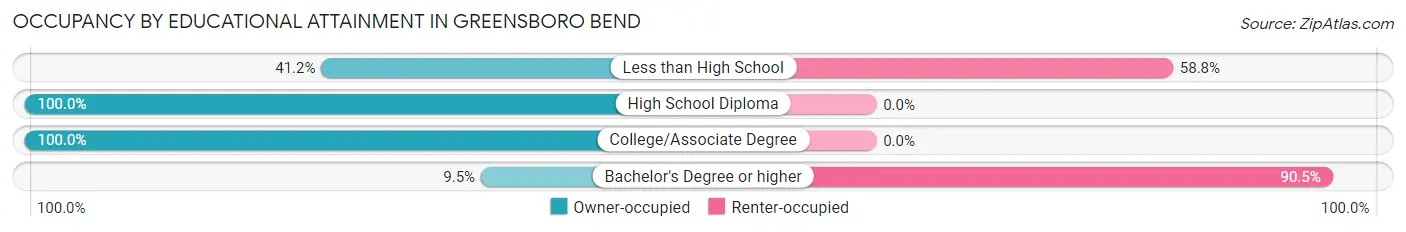
| Household Size | Owner-occupied | Renter-occupied |
| Less than High School | 7 (41.2%) | 10 (58.8%) |
| High School Diploma | 35 (100.0%) | 0 (0.0%) |
| College/Associate Degree | 25 (100.0%) | 0 (0.0%) |
| Bachelor's Degree or higher | 2 (9.5%) | 19 (90.5%) |
Occupancy by Age of Householder in Greensboro Bend
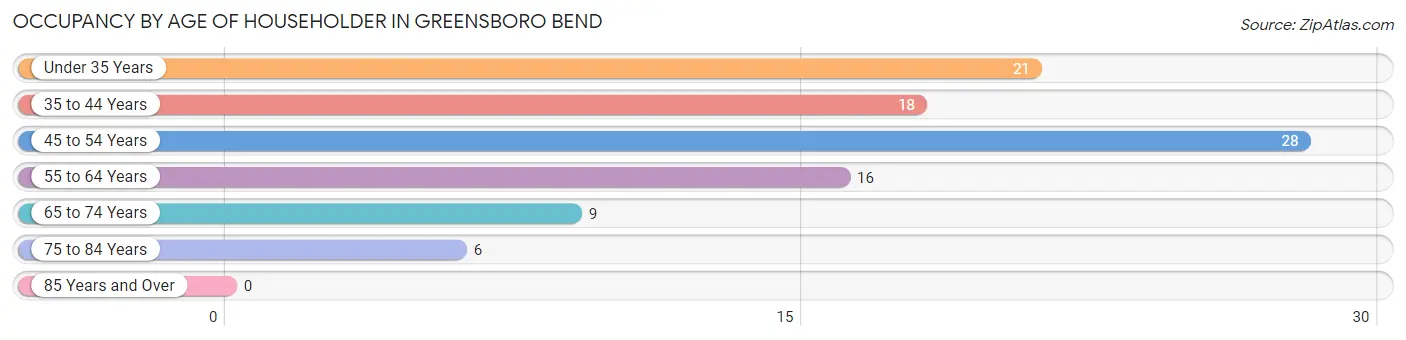
| Age Bracket | # Households | % Households |
| Under 35 Years | 21 | 21.4% |
| 35 to 44 Years | 18 | 18.4% |
| 45 to 54 Years | 28 | 28.6% |
| 55 to 64 Years | 16 | 16.3% |
| 65 to 74 Years | 9 | 9.2% |
| 75 to 84 Years | 6 | 6.1% |
| 85 Years and Over | 0 | 0.0% |
| Total | 98 | 100.0% |
Housing Finances in Greensboro Bend
Median Income by Occupancy in Greensboro Bend
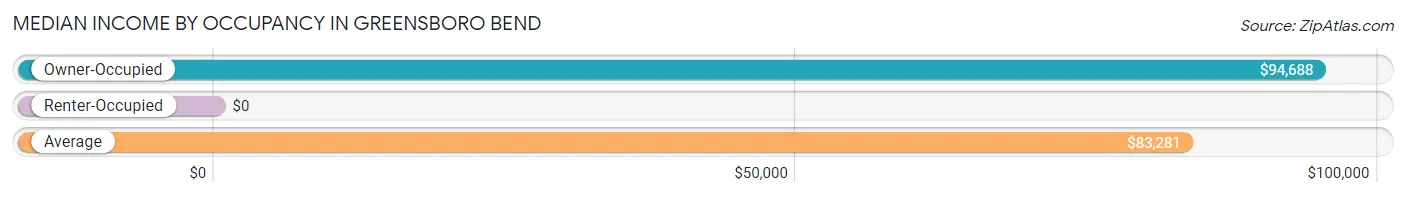
| Occupancy Type | # Households | Median Income |
| Owner-Occupied | 69 (70.4%) | $94,688 |
| Renter-Occupied | 29 (29.6%) | $0 |
| Average | 98 (100.0%) | $83,281 |
Occupancy by Householder Income Bracket in Greensboro Bend
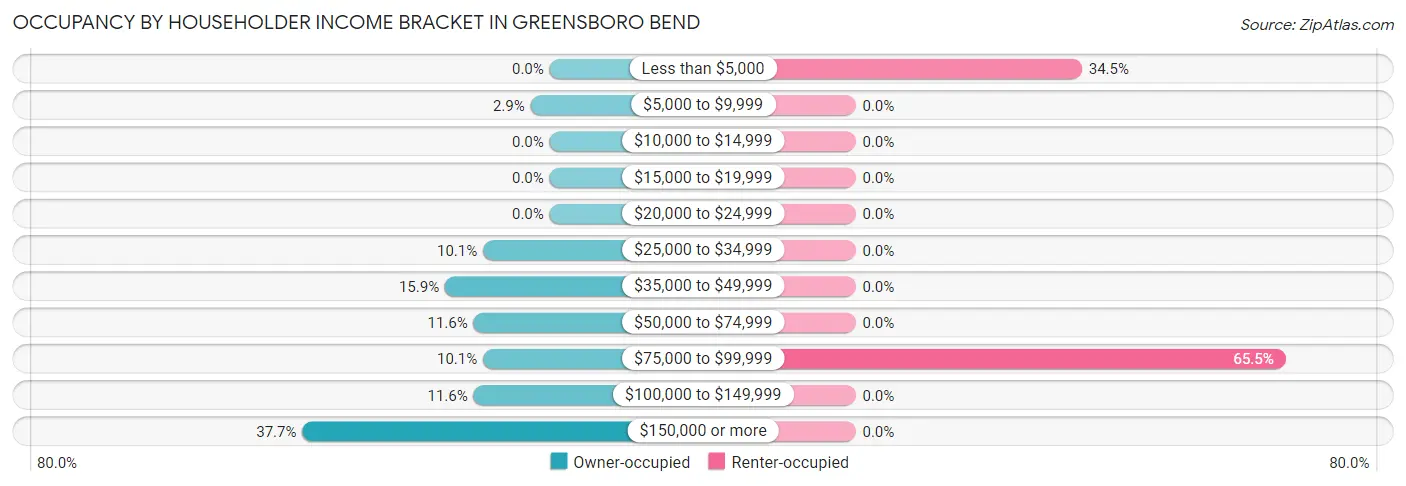
| Income Bracket | Owner-occupied | Renter-occupied |
| Less than $5,000 | 0 (0.0%) | 10 (34.5%) |
| $5,000 to $9,999 | 2 (2.9%) | 0 (0.0%) |
| $10,000 to $14,999 | 0 (0.0%) | 0 (0.0%) |
| $15,000 to $19,999 | 0 (0.0%) | 0 (0.0%) |
| $20,000 to $24,999 | 0 (0.0%) | 0 (0.0%) |
| $25,000 to $34,999 | 7 (10.1%) | 0 (0.0%) |
| $35,000 to $49,999 | 11 (15.9%) | 0 (0.0%) |
| $50,000 to $74,999 | 8 (11.6%) | 0 (0.0%) |
| $75,000 to $99,999 | 7 (10.1%) | 19 (65.5%) |
| $100,000 to $149,999 | 8 (11.6%) | 0 (0.0%) |
| $150,000 or more | 26 (37.7%) | 0 (0.0%) |
| Total | 69 (100.0%) | 29 (100.0%) |
Monthly Housing Cost Tiers in Greensboro Bend
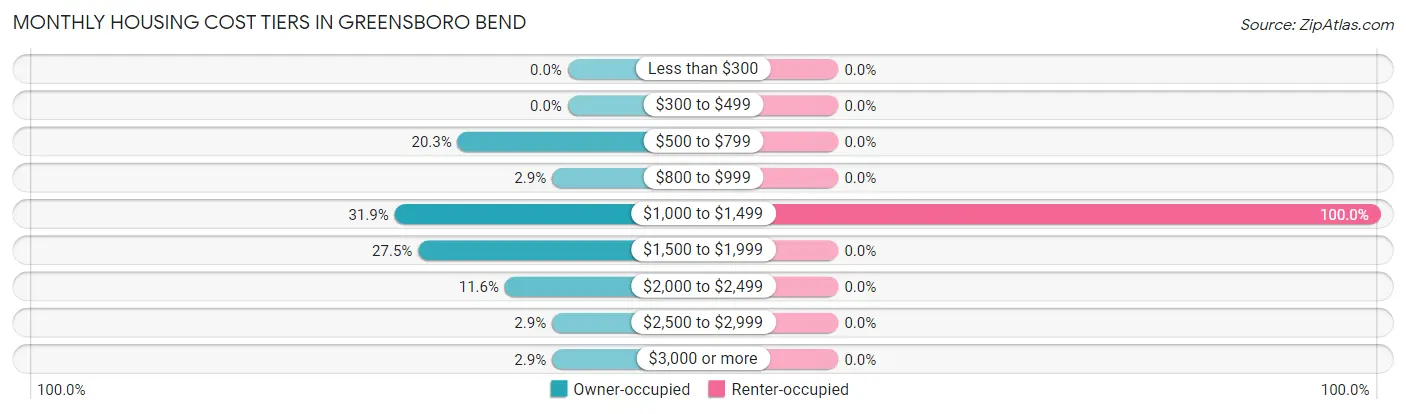
| Monthly Cost | Owner-occupied | Renter-occupied |
| Less than $300 | 0 (0.0%) | 0 (0.0%) |
| $300 to $499 | 0 (0.0%) | 0 (0.0%) |
| $500 to $799 | 14 (20.3%) | 0 (0.0%) |
| $800 to $999 | 2 (2.9%) | 0 (0.0%) |
| $1,000 to $1,499 | 22 (31.9%) | 29 (100.0%) |
| $1,500 to $1,999 | 19 (27.5%) | 0 (0.0%) |
| $2,000 to $2,499 | 8 (11.6%) | 0 (0.0%) |
| $2,500 to $2,999 | 2 (2.9%) | 0 (0.0%) |
| $3,000 or more | 2 (2.9%) | 0 (0.0%) |
| Total | 69 (100.0%) | 29 (100.0%) |
Physical Housing Characteristics in Greensboro Bend
Housing Structures in Greensboro Bend
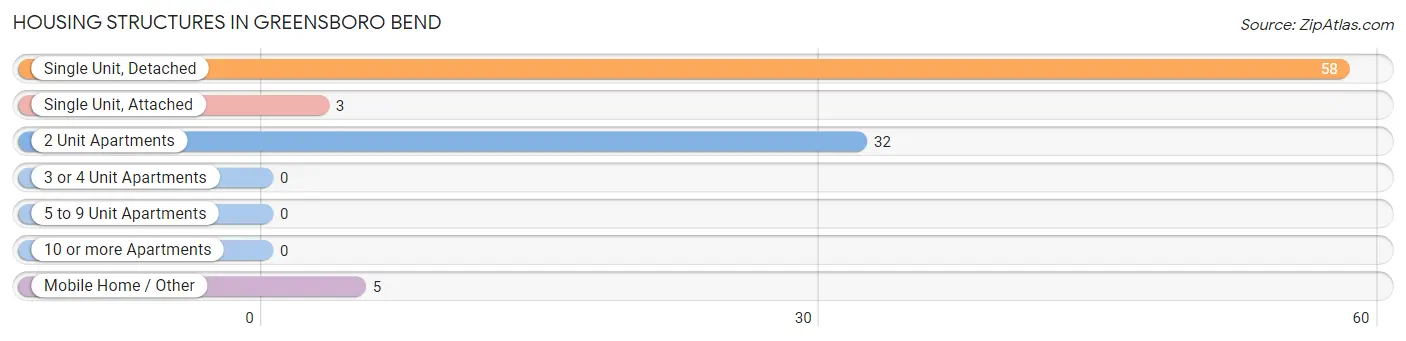
| Structure Type | # Housing Units | % Housing Units |
| Single Unit, Detached | 58 | 59.2% |
| Single Unit, Attached | 3 | 3.1% |
| 2 Unit Apartments | 32 | 32.7% |
| 3 or 4 Unit Apartments | 0 | 0.0% |
| 5 to 9 Unit Apartments | 0 | 0.0% |
| 10 or more Apartments | 0 | 0.0% |
| Mobile Home / Other | 5 | 5.1% |
| Total | 98 | 100.0% |
Housing Structures by Occupancy in Greensboro Bend
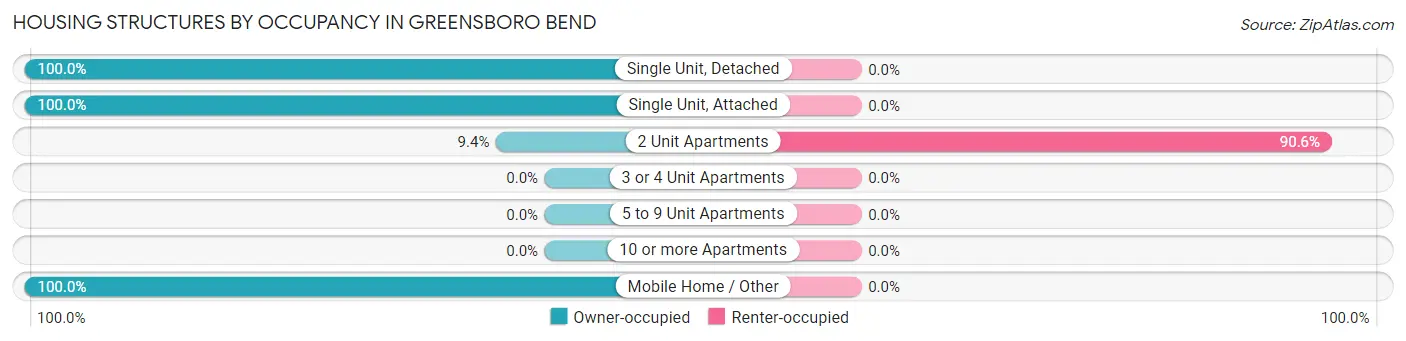
| Structure Type | Owner-occupied | Renter-occupied |
| Single Unit, Detached | 58 (100.0%) | 0 (0.0%) |
| Single Unit, Attached | 3 (100.0%) | 0 (0.0%) |
| 2 Unit Apartments | 3 (9.4%) | 29 (90.6%) |
| 3 or 4 Unit Apartments | 0 (0.0%) | 0 (0.0%) |
| 5 to 9 Unit Apartments | 0 (0.0%) | 0 (0.0%) |
| 10 or more Apartments | 0 (0.0%) | 0 (0.0%) |
| Mobile Home / Other | 5 (100.0%) | 0 (0.0%) |
| Total | 69 (70.4%) | 29 (29.6%) |
Housing Structures by Number of Rooms in Greensboro Bend
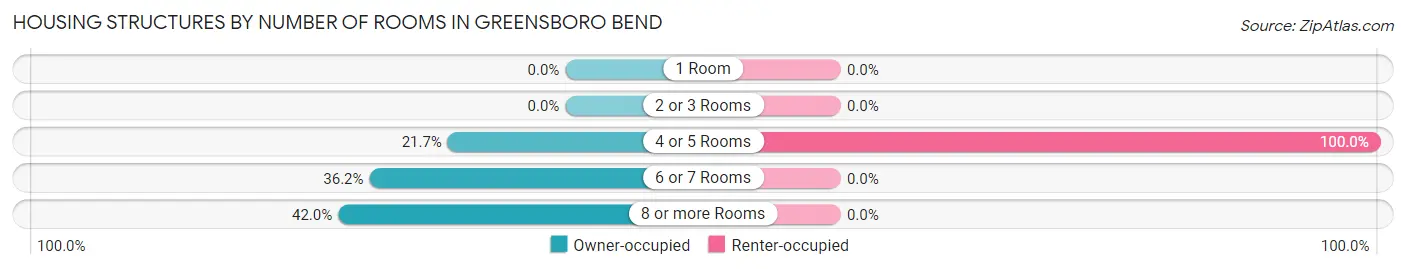
| Number of Rooms | Owner-occupied | Renter-occupied |
| 1 Room | 0 (0.0%) | 0 (0.0%) |
| 2 or 3 Rooms | 0 (0.0%) | 0 (0.0%) |
| 4 or 5 Rooms | 15 (21.7%) | 29 (100.0%) |
| 6 or 7 Rooms | 25 (36.2%) | 0 (0.0%) |
| 8 or more Rooms | 29 (42.0%) | 0 (0.0%) |
| Total | 69 (100.0%) | 29 (100.0%) |
Housing Structure by Heating Type in Greensboro Bend
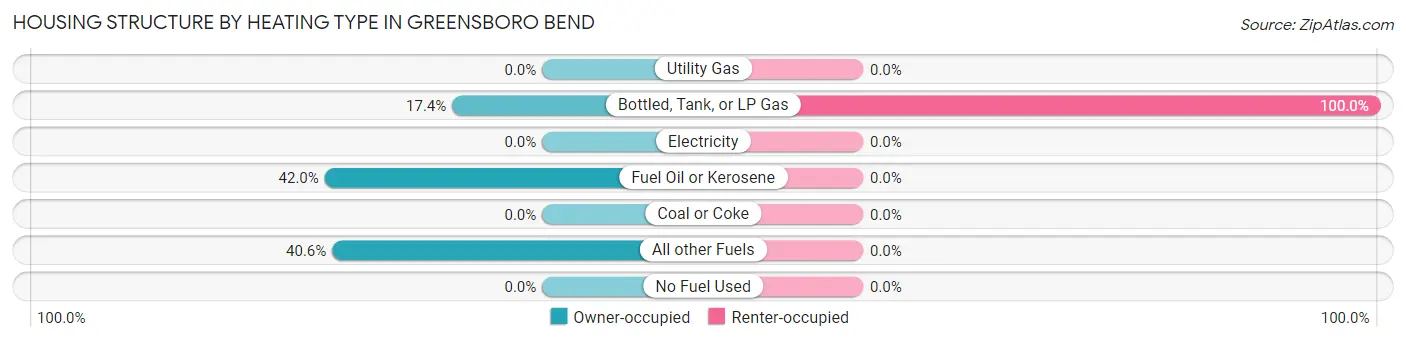
| Heating Type | Owner-occupied | Renter-occupied |
| Utility Gas | 0 (0.0%) | 0 (0.0%) |
| Bottled, Tank, or LP Gas | 12 (17.4%) | 29 (100.0%) |
| Electricity | 0 (0.0%) | 0 (0.0%) |
| Fuel Oil or Kerosene | 29 (42.0%) | 0 (0.0%) |
| Coal or Coke | 0 (0.0%) | 0 (0.0%) |
| All other Fuels | 28 (40.6%) | 0 (0.0%) |
| No Fuel Used | 0 (0.0%) | 0 (0.0%) |
| Total | 69 (100.0%) | 29 (100.0%) |
Household Vehicle Usage in Greensboro Bend
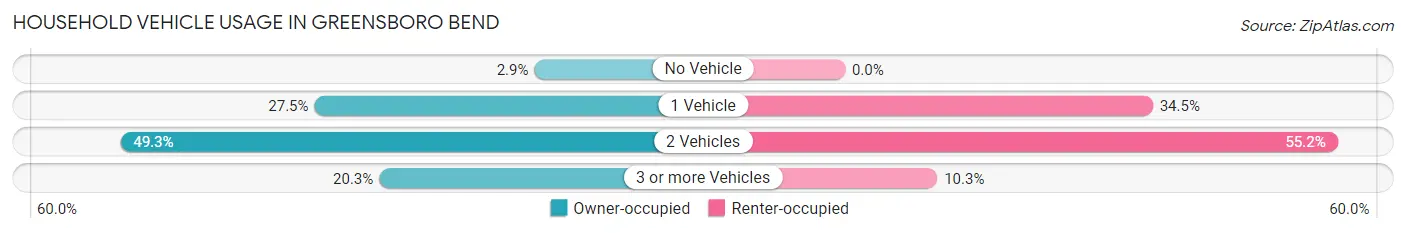
| Vehicles per Household | Owner-occupied | Renter-occupied |
| No Vehicle | 2 (2.9%) | 0 (0.0%) |
| 1 Vehicle | 19 (27.5%) | 10 (34.5%) |
| 2 Vehicles | 34 (49.3%) | 16 (55.2%) |
| 3 or more Vehicles | 14 (20.3%) | 3 (10.3%) |
| Total | 69 (100.0%) | 29 (100.0%) |
Real Estate & Mortgages in Greensboro Bend
Real Estate and Mortgage Overview in Greensboro Bend
| Characteristic | Without Mortgage | With Mortgage |
| Housing Units | 11 | 58 |
| Median Property Value | - | - |
| Median Household Income | $62,917 | $26 |
| Monthly Housing Costs | $592 | $2 |
| Real Estate Taxes | $2,583 | $0 |
Property Value by Mortgage Status in Greensboro Bend
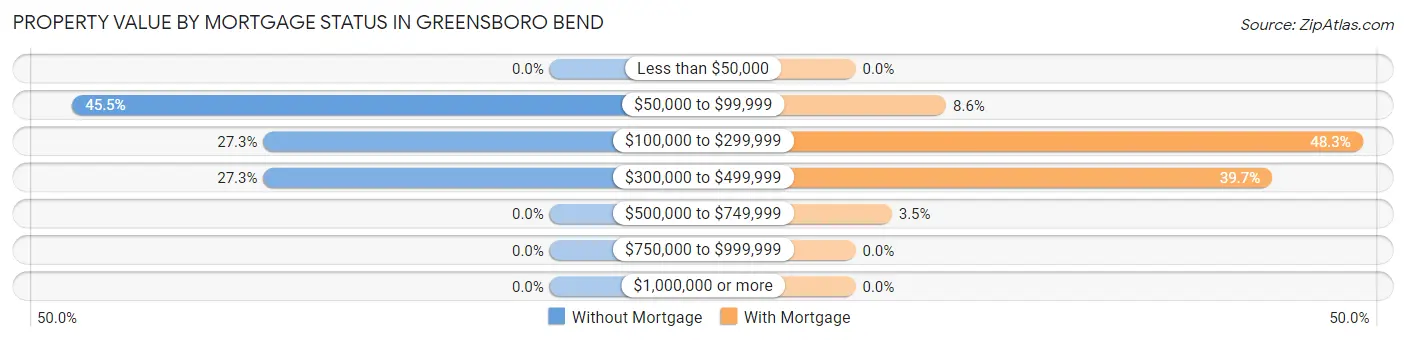
| Property Value | Without Mortgage | With Mortgage |
| Less than $50,000 | 0 (0.0%) | 0 (0.0%) |
| $50,000 to $99,999 | 5 (45.5%) | 5 (8.6%) |
| $100,000 to $299,999 | 3 (27.3%) | 28 (48.3%) |
| $300,000 to $499,999 | 3 (27.3%) | 23 (39.7%) |
| $500,000 to $749,999 | 0 (0.0%) | 2 (3.5%) |
| $750,000 to $999,999 | 0 (0.0%) | 0 (0.0%) |
| $1,000,000 or more | 0 (0.0%) | 0 (0.0%) |
| Total | 11 (100.0%) | 58 (100.0%) |
Household Income by Mortgage Status in Greensboro Bend
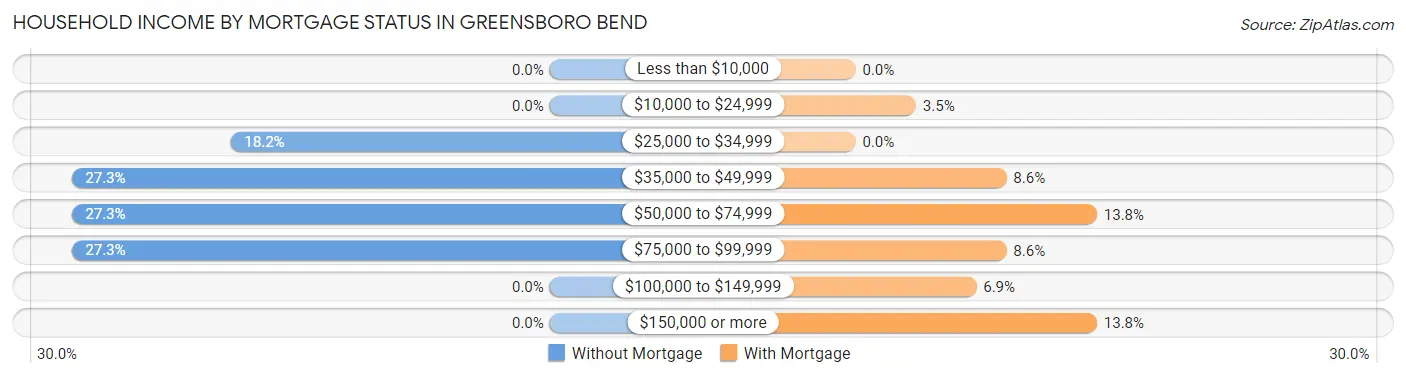
| Household Income | Without Mortgage | With Mortgage |
| Less than $10,000 | 0 (0.0%) | 0 (0.0%) |
| $10,000 to $24,999 | 0 (0.0%) | 2 (3.5%) |
| $25,000 to $34,999 | 2 (18.2%) | 0 (0.0%) |
| $35,000 to $49,999 | 3 (27.3%) | 5 (8.6%) |
| $50,000 to $74,999 | 3 (27.3%) | 8 (13.8%) |
| $75,000 to $99,999 | 3 (27.3%) | 5 (8.6%) |
| $100,000 to $149,999 | 0 (0.0%) | 4 (6.9%) |
| $150,000 or more | 0 (0.0%) | 8 (13.8%) |
| Total | 11 (100.0%) | 58 (100.0%) |
Property Value to Household Income Ratio in Greensboro Bend
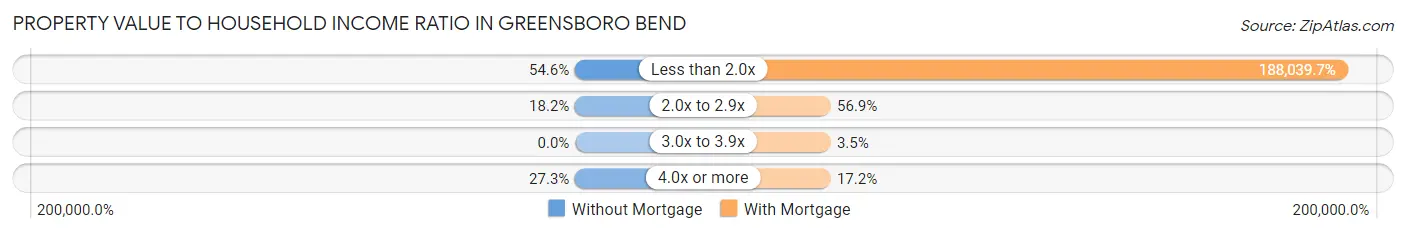
| Value-to-Income Ratio | Without Mortgage | With Mortgage |
| Less than 2.0x | 6 (54.5%) | 109,063 (188,039.7%) |
| 2.0x to 2.9x | 2 (18.2%) | 33 (56.9%) |
| 3.0x to 3.9x | 0 (0.0%) | 2 (3.5%) |
| 4.0x or more | 3 (27.3%) | 10 (17.2%) |
| Total | 11 (100.0%) | 58 (100.0%) |
Real Estate Taxes by Mortgage Status in Greensboro Bend
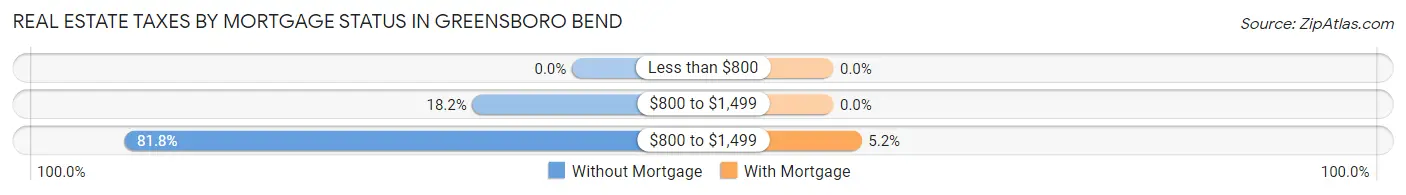
| Property Taxes | Without Mortgage | With Mortgage |
| Less than $800 | 0 (0.0%) | 0 (0.0%) |
| $800 to $1,499 | 2 (18.2%) | 0 (0.0%) |
| $800 to $1,499 | 9 (81.8%) | 3 (5.2%) |
| Total | 11 (100.0%) | 58 (100.0%) |
Health & Disability in Greensboro Bend
Health Insurance Coverage by Age in Greensboro Bend
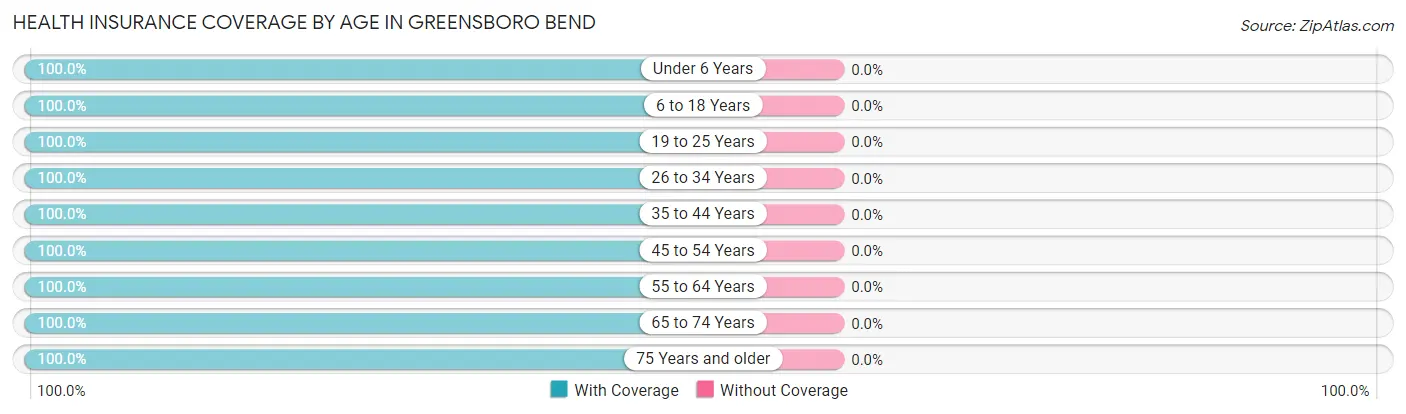
| Age Bracket | With Coverage | Without Coverage |
| Under 6 Years | 22 (100.0%) | 0 (0.0%) |
| 6 to 18 Years | 71 (100.0%) | 0 (0.0%) |
| 19 to 25 Years | 13 (100.0%) | 0 (0.0%) |
| 26 to 34 Years | 34 (100.0%) | 0 (0.0%) |
| 35 to 44 Years | 39 (100.0%) | 0 (0.0%) |
| 45 to 54 Years | 39 (100.0%) | 0 (0.0%) |
| 55 to 64 Years | 24 (100.0%) | 0 (0.0%) |
| 65 to 74 Years | 14 (100.0%) | 0 (0.0%) |
| 75 Years and older | 6 (100.0%) | 0 (0.0%) |
| Total | 262 (100.0%) | 0 (0.0%) |
Health Insurance Coverage by Citizenship Status in Greensboro Bend
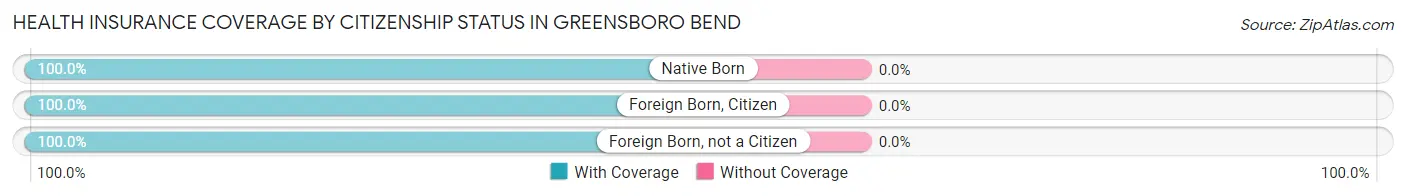
| Citizenship Status | With Coverage | Without Coverage |
| Native Born | 22 (100.0%) | 0 (0.0%) |
| Foreign Born, Citizen | 71 (100.0%) | 0 (0.0%) |
| Foreign Born, not a Citizen | 13 (100.0%) | 0 (0.0%) |
Health Insurance Coverage by Household Income in Greensboro Bend
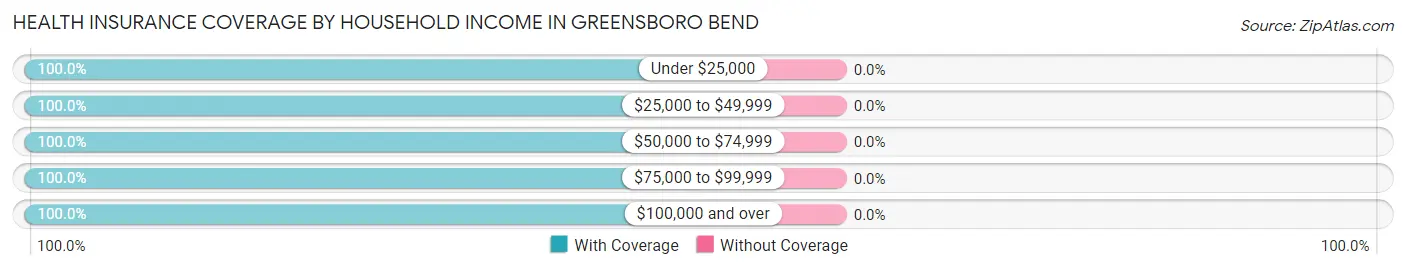
| Household Income | With Coverage | Without Coverage |
| Under $25,000 | 21 (100.0%) | 0 (0.0%) |
| $25,000 to $49,999 | 25 (100.0%) | 0 (0.0%) |
| $50,000 to $74,999 | 39 (100.0%) | 0 (0.0%) |
| $75,000 to $99,999 | 53 (100.0%) | 0 (0.0%) |
| $100,000 and over | 124 (100.0%) | 0 (0.0%) |
Public vs Private Health Insurance Coverage by Age in Greensboro Bend
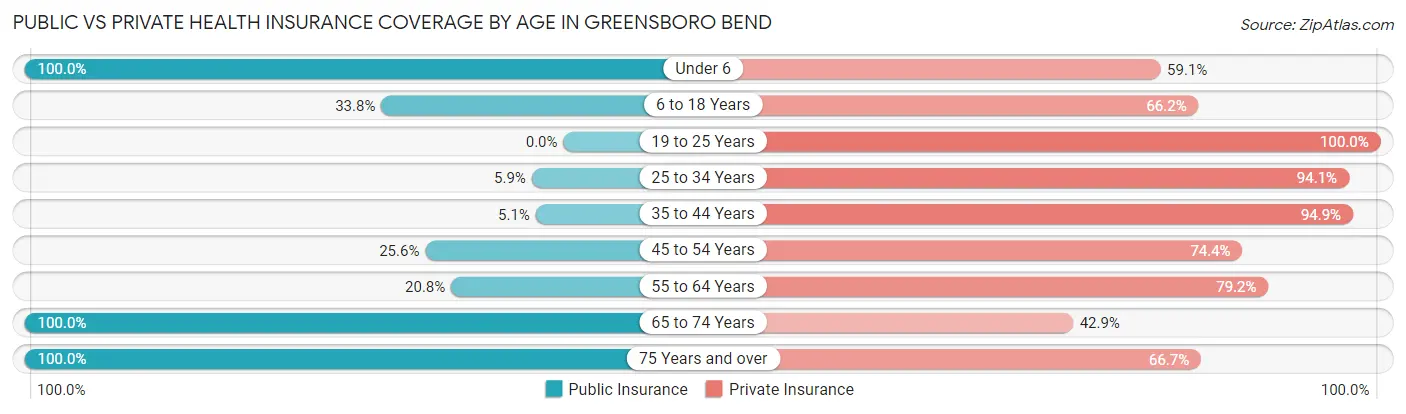
| Age Bracket | Public Insurance | Private Insurance |
| Under 6 | 22 (100.0%) | 13 (59.1%) |
| 6 to 18 Years | 24 (33.8%) | 47 (66.2%) |
| 19 to 25 Years | 0 (0.0%) | 13 (100.0%) |
| 25 to 34 Years | 2 (5.9%) | 32 (94.1%) |
| 35 to 44 Years | 2 (5.1%) | 37 (94.9%) |
| 45 to 54 Years | 10 (25.6%) | 29 (74.4%) |
| 55 to 64 Years | 5 (20.8%) | 19 (79.2%) |
| 65 to 74 Years | 14 (100.0%) | 6 (42.9%) |
| 75 Years and over | 6 (100.0%) | 4 (66.7%) |
| Total | 85 (32.4%) | 200 (76.3%) |
Disability Status by Sex by Age in Greensboro Bend
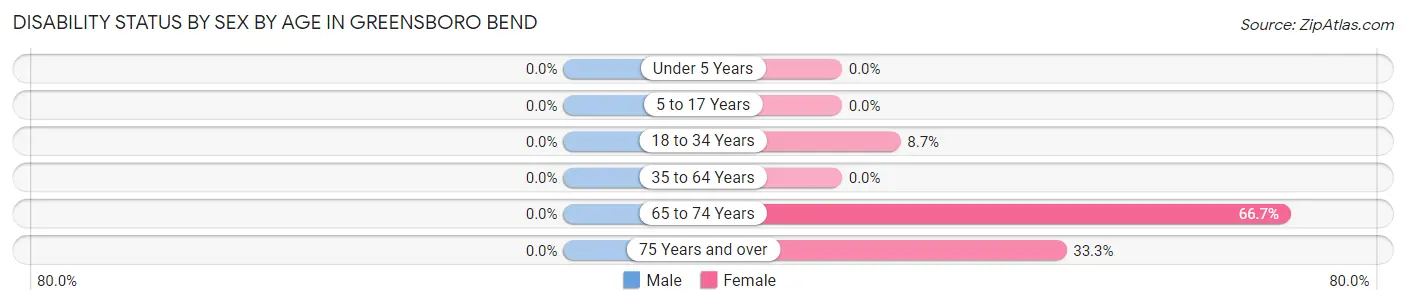
| Age Bracket | Male | Female |
| Under 5 Years | 0 (0.0%) | 0 (0.0%) |
| 5 to 17 Years | 0 (0.0%) | 0 (0.0%) |
| 18 to 34 Years | 0 (0.0%) | 2 (8.7%) |
| 35 to 64 Years | 0 (0.0%) | 0 (0.0%) |
| 65 to 74 Years | 0 (0.0%) | 6 (66.7%) |
| 75 Years and over | 0 (0.0%) | 2 (33.3%) |
Disability Class by Sex by Age in Greensboro Bend
Disability Class: Hearing Difficulty
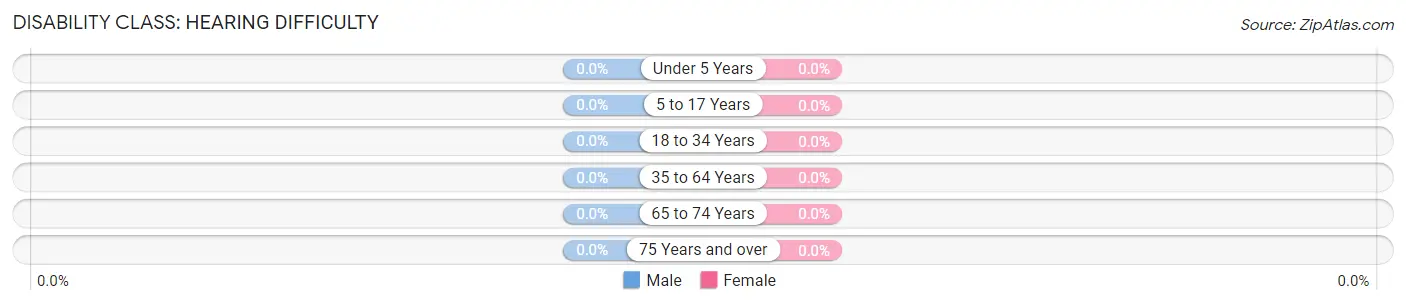
| Age Bracket | Male | Female |
| Under 5 Years | 0 (0.0%) | 0 (0.0%) |
| 5 to 17 Years | 0 (0.0%) | 0 (0.0%) |
| 18 to 34 Years | 0 (0.0%) | 0 (0.0%) |
| 35 to 64 Years | 0 (0.0%) | 0 (0.0%) |
| 65 to 74 Years | 0 (0.0%) | 0 (0.0%) |
| 75 Years and over | 0 (0.0%) | 0 (0.0%) |
Disability Class: Vision Difficulty
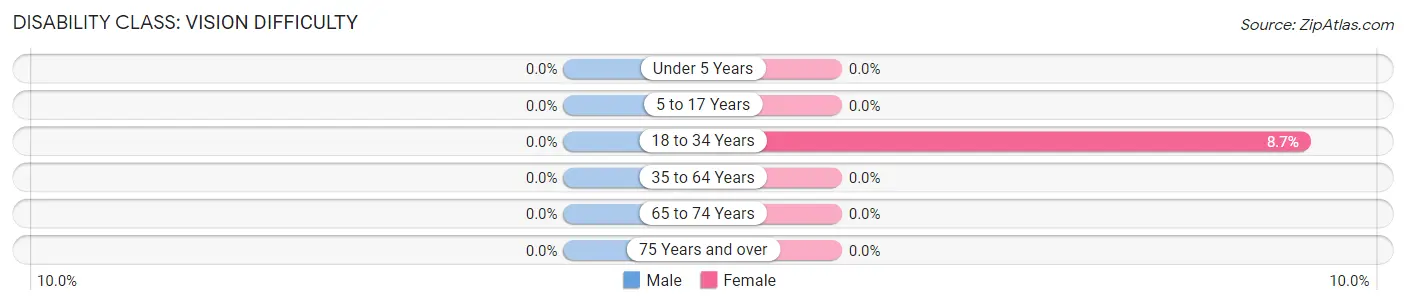
| Age Bracket | Male | Female |
| Under 5 Years | 0 (0.0%) | 0 (0.0%) |
| 5 to 17 Years | 0 (0.0%) | 0 (0.0%) |
| 18 to 34 Years | 0 (0.0%) | 2 (8.7%) |
| 35 to 64 Years | 0 (0.0%) | 0 (0.0%) |
| 65 to 74 Years | 0 (0.0%) | 0 (0.0%) |
| 75 Years and over | 0 (0.0%) | 0 (0.0%) |
Disability Class: Cognitive Difficulty
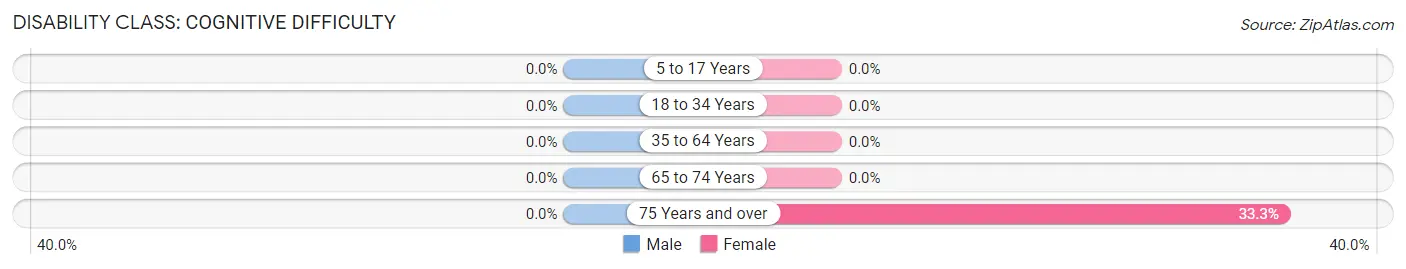
| Age Bracket | Male | Female |
| 5 to 17 Years | 0 (0.0%) | 0 (0.0%) |
| 18 to 34 Years | 0 (0.0%) | 0 (0.0%) |
| 35 to 64 Years | 0 (0.0%) | 0 (0.0%) |
| 65 to 74 Years | 0 (0.0%) | 0 (0.0%) |
| 75 Years and over | 0 (0.0%) | 2 (33.3%) |
Disability Class: Ambulatory Difficulty
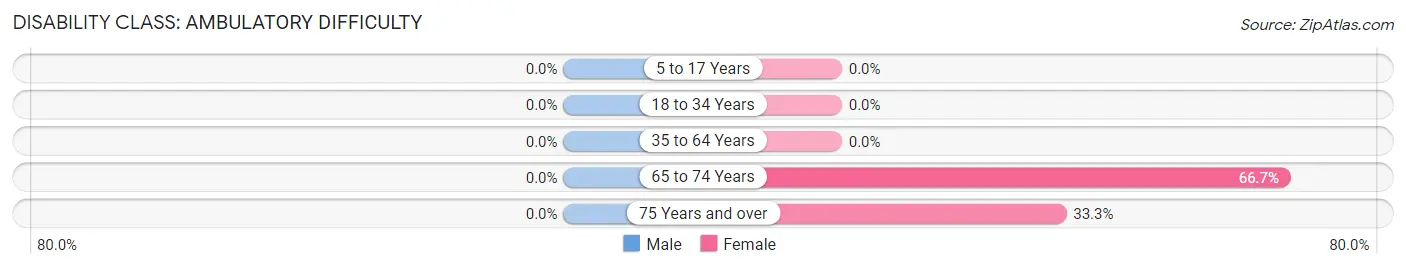
| Age Bracket | Male | Female |
| 5 to 17 Years | 0 (0.0%) | 0 (0.0%) |
| 18 to 34 Years | 0 (0.0%) | 0 (0.0%) |
| 35 to 64 Years | 0 (0.0%) | 0 (0.0%) |
| 65 to 74 Years | 0 (0.0%) | 6 (66.7%) |
| 75 Years and over | 0 (0.0%) | 2 (33.3%) |
Disability Class: Self-Care Difficulty
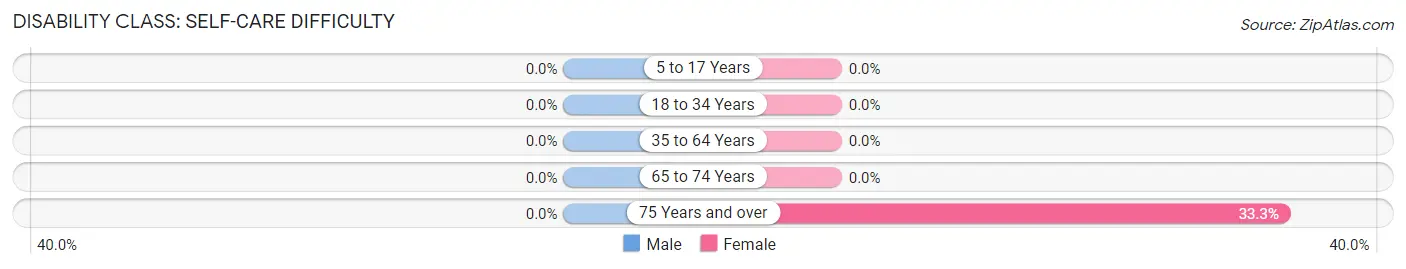
| Age Bracket | Male | Female |
| 5 to 17 Years | 0 (0.0%) | 0 (0.0%) |
| 18 to 34 Years | 0 (0.0%) | 0 (0.0%) |
| 35 to 64 Years | 0 (0.0%) | 0 (0.0%) |
| 65 to 74 Years | 0 (0.0%) | 0 (0.0%) |
| 75 Years and over | 0 (0.0%) | 2 (33.3%) |
Technology Access in Greensboro Bend
Computing Device Access in Greensboro Bend
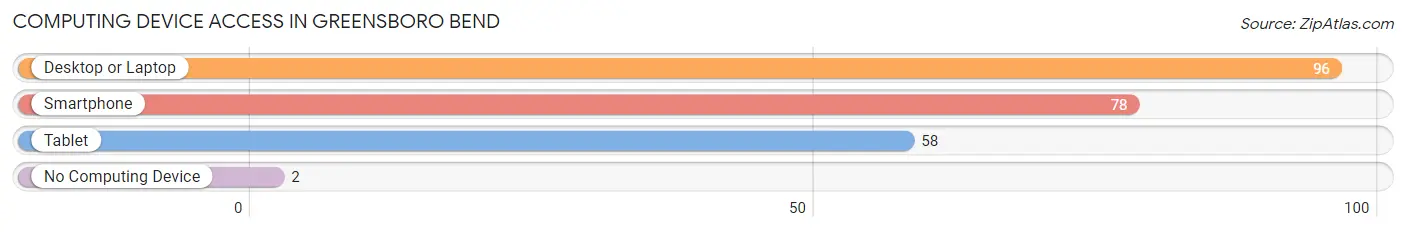
| Device Type | # Households | % Households |
| Desktop or Laptop | 96 | 98.0% |
| Smartphone | 78 | 79.6% |
| Tablet | 58 | 59.2% |
| No Computing Device | 2 | 2.0% |
| Total | 98 | 100.0% |
Internet Access in Greensboro Bend
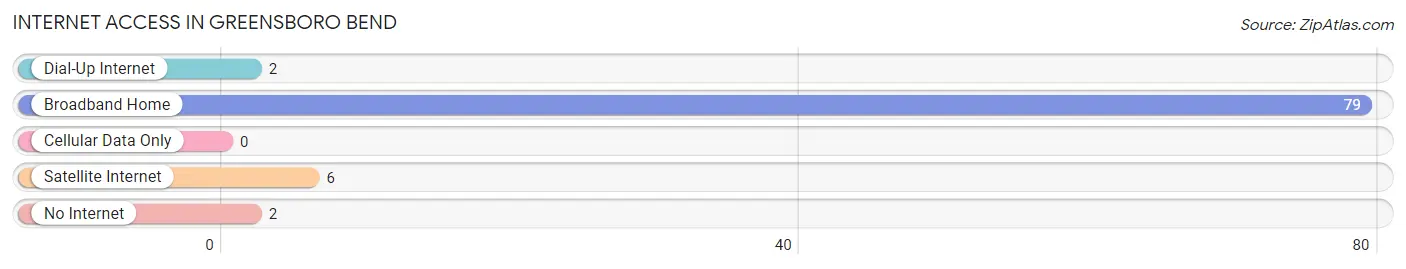
| Internet Type | # Households | % Households |
| Dial-Up Internet | 2 | 2.0% |
| Broadband Home | 79 | 80.6% |
| Cellular Data Only | 0 | 0.0% |
| Satellite Internet | 6 | 6.1% |
| No Internet | 2 | 2.0% |
| Total | 98 | 100.0% |
Greensboro Bend Summary
Greensboro Bend is a small unincorporated village located in the town of Greensboro, Vermont, in the United States. It is situated in the northern part of the state, in the Green Mountains, and is part of the larger Greensboro-Craftsbury area. The village is located on the banks of the Winooski River, and is home to a population of approximately 500 people.
History
Greensboro Bend was first settled in the late 1700s by a group of settlers from Massachusetts. The settlers were attracted to the area due to its fertile soil and abundant natural resources. The village was originally known as “Greensborough”, and was later changed to “Greensboro Bend” in 1820. The name was chosen to reflect the bend in the Winooski River that runs through the village.
The village was an important stop on the stagecoach route between Montpelier and Burlington, and was also a popular destination for travelers and tourists. In the late 1800s, the village was home to several mills, including a sawmill, gristmill, and a woolen mill. The mills provided employment for many of the residents, and the village was a thriving community.
In the early 1900s, the village began to decline as the mills closed and the population began to dwindle. The decline continued until the 1950s, when the village was revitalized by the construction of a new bridge over the Winooski River. The bridge allowed for easier access to the village, and the population began to grow again.
Geography
Greensboro Bend is located in the northern part of Vermont, in the Green Mountains. The village is situated on the banks of the Winooski River, and is surrounded by rolling hills and forests. The village is located approximately 25 miles north of Montpelier, the state capital, and is about an hour’s drive from Burlington, the largest city in the state.
The village is home to several small lakes, including Lake Elmore, Lake Elmore State Park, and Lake Elmore State Forest. The area is also home to several hiking trails, including the Long Trail, which runs through the village.
Economy
Greensboro Bend is a small, rural community with a limited economy. The village is home to several small businesses, including a general store, a post office, and a few restaurants. The village is also home to a small sawmill, which provides employment for some of the residents.
The village is also home to several farms, which produce a variety of crops, including corn, hay, and vegetables. The farms also raise livestock, including cows, pigs, and chickens.
Demographics
As of the 2010 census, the population of Greensboro Bend was 498. The population is predominantly white, with a small minority of African Americans and Native Americans. The median age of the population is 44.7 years, and the median household income is $45,000.
The village is home to several churches, including the United Church of Christ, the Episcopal Church, and the Methodist Church. The village is also home to a small library, which serves the community.
Conclusion
Greensboro Bend is a small, rural village located in the northern part of Vermont. The village is situated on the banks of the Winooski River, and is home to a population of approximately 500 people. The village is home to several small businesses, farms, and churches, and is a popular destination for hikers and outdoor enthusiasts. The village is also home to a small library, which serves the community.
Common Questions
What is Per Capita Income in Greensboro Bend?
Per Capita income in Greensboro Bend is $33,317.
What is the Median Family Income in Greensboro Bend?
Median Family Income in Greensboro Bend is $108,438.
What is the Median Household income in Greensboro Bend?
Median Household Income in Greensboro Bend is $83,281.
What is Income or Wage Gap in Greensboro Bend?
Income or Wage Gap in Greensboro Bend is 34.5%.
Women in Greensboro Bend earn 65.5 cents for every dollar earned by a man.
What is Inequality or Gini Index in Greensboro Bend?
Inequality or Gini Index in Greensboro Bend is 0.38.
What is the Total Population of Greensboro Bend?
Total Population of Greensboro Bend is 265.
What is the Total Male Population of Greensboro Bend?
Total Male Population of Greensboro Bend is 127.
What is the Total Female Population of Greensboro Bend?
Total Female Population of Greensboro Bend is 138.
What is the Ratio of Males per 100 Females in Greensboro Bend?
There are 92.03 Males per 100 Females in Greensboro Bend.
What is the Ratio of Females per 100 Males in Greensboro Bend?
There are 108.66 Females per 100 Males in Greensboro Bend.
What is the Median Population Age in Greensboro Bend?
Median Population Age in Greensboro Bend is 26.9 Years.
What is the Average Family Size in Greensboro Bend
Average Family Size in Greensboro Bend is 3.4 People.
What is the Average Household Size in Greensboro Bend
Average Household Size in Greensboro Bend is 2.7 People.
How Large is the Labor Force in Greensboro Bend?
There are 142 People in the Labor Forcein in Greensboro Bend.
What is the Percentage of People in the Labor Force in Greensboro Bend?
71.7% of People are in the Labor Force in Greensboro Bend.