Derby Center, VT Map & Demographics
Derby Center Map
Derby Center Overview
$26,918
PER CAPITA INCOME
$70,625
AVG FAMILY INCOME
$57,188
AVG HOUSEHOLD INCOME
50.9%
WAGE / INCOME GAP [ % ]
49.1¢/ $1
WAGE / INCOME GAP [ $ ]
0.43
INEQUALITY / GINI INDEX
802
TOTAL POPULATION
339
MALE POPULATION
463
FEMALE POPULATION
73.22
MALES / 100 FEMALES
136.58
FEMALES / 100 MALES
45.4
MEDIAN AGE
2.9
AVG FAMILY SIZE
2.5
AVG HOUSEHOLD SIZE
414
LABOR FORCE [ PEOPLE ]
62.8%
PERCENT IN LABOR FORCE
2.9%
UNEMPLOYMENT RATE
Income in Derby Center
Income Overview in Derby Center
Per Capita Income in Derby Center is $26,918, while median incomes of families and households are $70,625 and $57,188 respectively.
| Characteristic | Number | Measure |
| Per Capita Income | 802 | $26,918 |
| Median Family Income | 209 | $70,625 |
| Mean Family Income | 209 | $79,698 |
| Median Household Income | 317 | $57,188 |
| Mean Household Income | 317 | $65,889 |
| Income Deficit | 209 | $0 |
| Wage / Income Gap (%) | 802 | 50.85% |
| Wage / Income Gap ($) | 802 | 49.15¢ per $1 |
| Gini / Inequality Index | 802 | 0.43 |
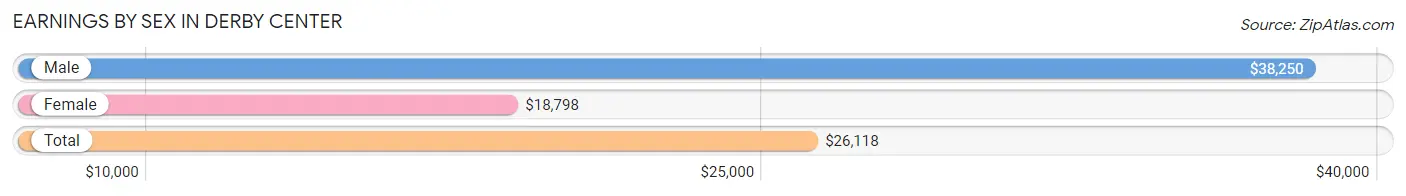
Earnings by Sex in Derby Center
Average Earnings in Derby Center are $26,118, $38,250 for men and $18,798 for women, a difference of 50.8%.
| Sex | Number | Average Earnings |
| Male | 178 (38.6%) | $38,250 |
| Female | 283 (61.4%) | $18,798 |
| Total | 461 (100.0%) | $26,118 |
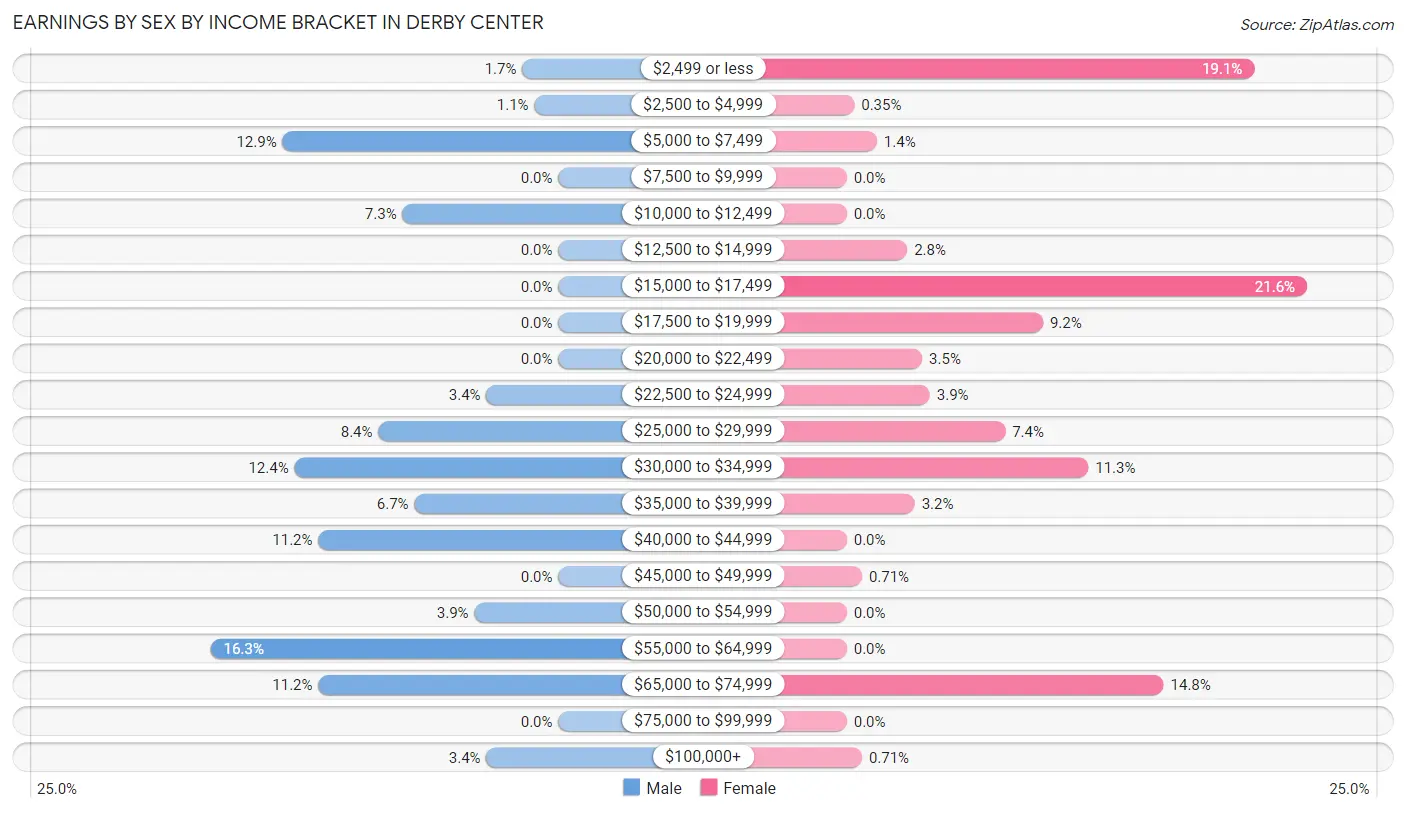
Earnings by Sex by Income Bracket in Derby Center
The most common earnings brackets in Derby Center are $55,000 to $64,999 for men (29 | 16.3%) and $15,000 to $17,499 for women (61 | 21.5%).
| Income | Male | Female |
| $2,499 or less | 3 (1.7%) | 54 (19.1%) |
| $2,500 to $4,999 | 2 (1.1%) | 1 (0.4%) |
| $5,000 to $7,499 | 23 (12.9%) | 4 (1.4%) |
| $7,500 to $9,999 | 0 (0.0%) | 0 (0.0%) |
| $10,000 to $12,499 | 13 (7.3%) | 0 (0.0%) |
| $12,500 to $14,999 | 0 (0.0%) | 8 (2.8%) |
| $15,000 to $17,499 | 0 (0.0%) | 61 (21.5%) |
| $17,500 to $19,999 | 0 (0.0%) | 26 (9.2%) |
| $20,000 to $22,499 | 0 (0.0%) | 10 (3.5%) |
| $22,500 to $24,999 | 6 (3.4%) | 11 (3.9%) |
| $25,000 to $29,999 | 15 (8.4%) | 21 (7.4%) |
| $30,000 to $34,999 | 22 (12.4%) | 32 (11.3%) |
| $35,000 to $39,999 | 12 (6.7%) | 9 (3.2%) |
| $40,000 to $44,999 | 20 (11.2%) | 0 (0.0%) |
| $45,000 to $49,999 | 0 (0.0%) | 2 (0.7%) |
| $50,000 to $54,999 | 7 (3.9%) | 0 (0.0%) |
| $55,000 to $64,999 | 29 (16.3%) | 0 (0.0%) |
| $65,000 to $74,999 | 20 (11.2%) | 42 (14.8%) |
| $75,000 to $99,999 | 0 (0.0%) | 0 (0.0%) |
| $100,000+ | 6 (3.4%) | 2 (0.7%) |
| Total | 178 (100.0%) | 283 (100.0%) |
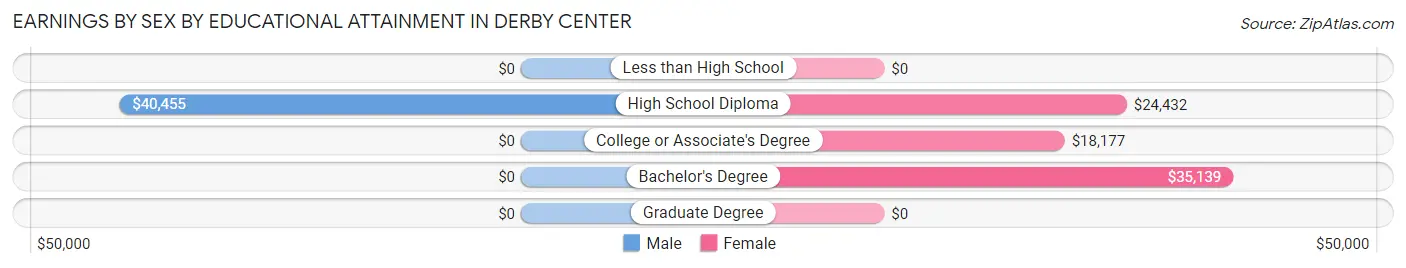
Earnings by Sex by Educational Attainment in Derby Center
Average earnings in Derby Center are $41,932 for men and $22,614 for women, a difference of 46.1%. Men with an educational attainment of high school diploma enjoy the highest average annual earnings of $40,455, while those with high school diploma education earn the least with $40,455. Women with an educational attainment of bachelor's degree earn the most with the average annual earnings of $35,139, while those with college or associate's degree education have the smallest earnings of $18,177.
| Educational Attainment | Male Income | Female Income |
| Less than High School | - | - |
| High School Diploma | $40,455 | $24,432 |
| College or Associate's Degree | - | - |
| Bachelor's Degree | - | - |
| Graduate Degree | - | - |
| Total | $41,932 | $22,614 |
Family Income in Derby Center
Family Income Brackets in Derby Center
According to the Derby Center family income data, there are 63 families falling into the $50,000 to $74,999 income range, which is the most common income bracket and makes up 30.1% of all families.
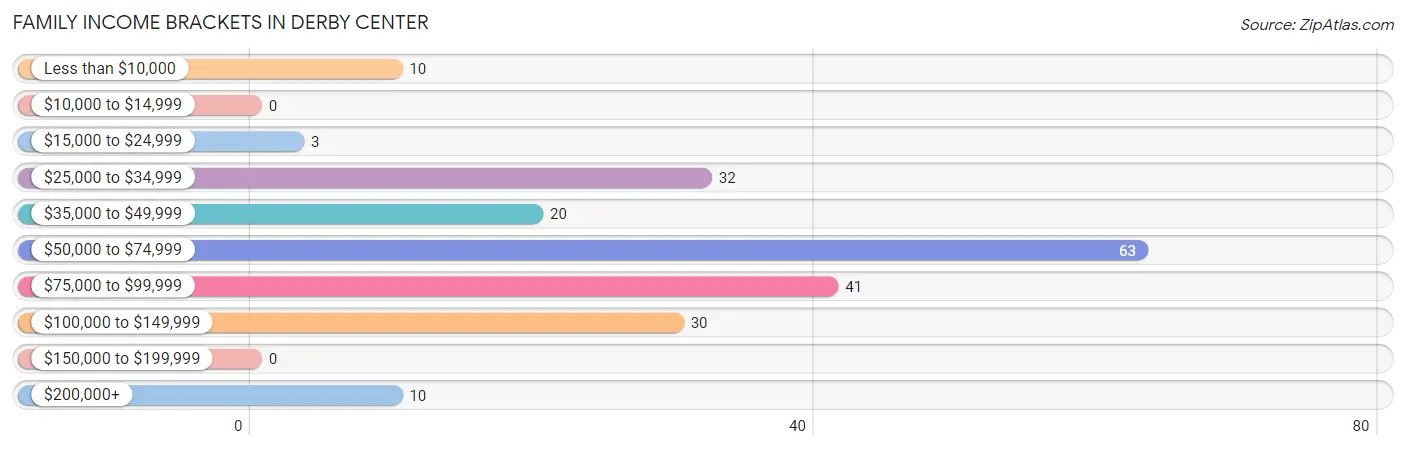
| Income Bracket | # Families | % Families |
| Less than $10,000 | 10 | 4.8% |
| $10,000 to $14,999 | 0 | 0.0% |
| $15,000 to $24,999 | 3 | 1.4% |
| $25,000 to $34,999 | 32 | 15.3% |
| $35,000 to $49,999 | 20 | 9.6% |
| $50,000 to $74,999 | 63 | 30.1% |
| $75,000 to $99,999 | 41 | 19.6% |
| $100,000 to $149,999 | 30 | 14.4% |
| $150,000 to $199,999 | 0 | 0.0% |
| $200,000+ | 10 | 4.8% |
Family Income by Famaliy Size in Derby Center
4-person families (50 | 23.9%) account for the highest median family income in Derby Center with $137,826 per family, while 2-person families (96 | 45.9%) have the highest median income of $35,512 per family member.
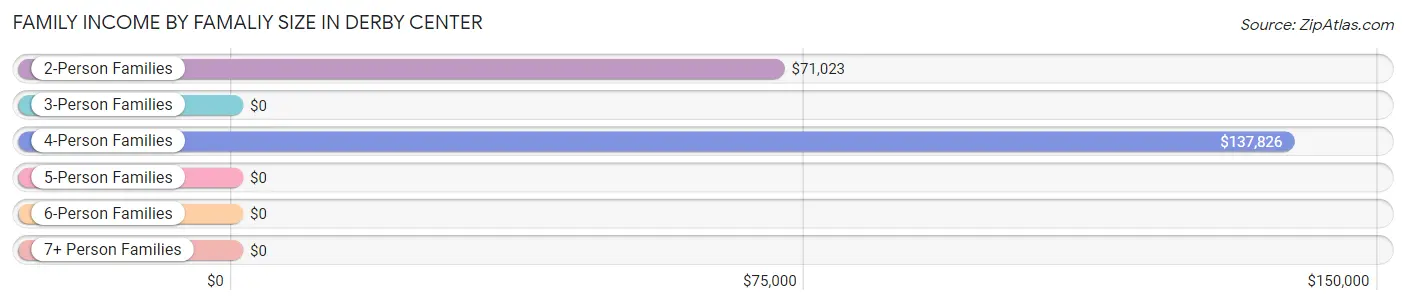
| Income Bracket | # Families | Median Income |
| 2-Person Families | 96 (45.9%) | $71,023 |
| 3-Person Families | 52 (24.9%) | $0 |
| 4-Person Families | 50 (23.9%) | $137,826 |
| 5-Person Families | 11 (5.3%) | $0 |
| 6-Person Families | 0 (0.0%) | $0 |
| 7+ Person Families | 0 (0.0%) | $0 |
| Total | 209 (100.0%) | $70,625 |
Family Income by Number of Earners in Derby Center
The median family income in Derby Center is $70,625, with families comprising 3+ earners (48) having the highest median family income of $98,750, while families with 1 earner (63) have the lowest median family income of $32,386, accounting for 23.0% and 30.1% of families, respectively.
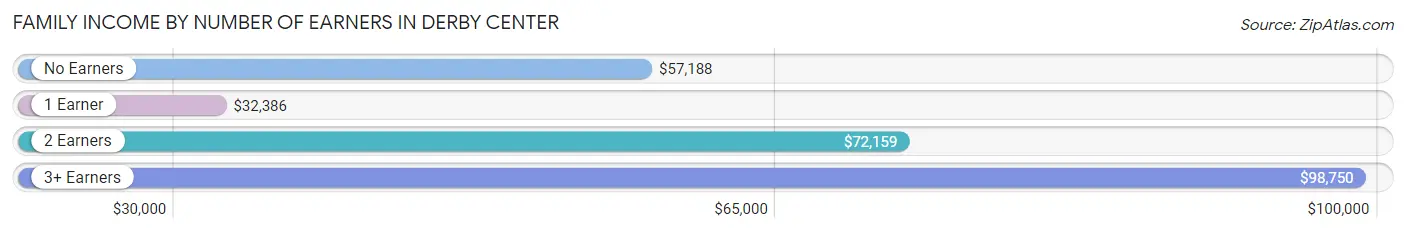
| Number of Earners | # Families | Median Income |
| No Earners | 41 (19.6%) | $57,188 |
| 1 Earner | 63 (30.1%) | $32,386 |
| 2 Earners | 57 (27.3%) | $72,159 |
| 3+ Earners | 48 (23.0%) | $98,750 |
| Total | 209 (100.0%) | $70,625 |
Household Income in Derby Center
Household Income Brackets in Derby Center
With 97 households falling in the category, the $50,000 to $74,999 income range is the most frequent in Derby Center, accounting for 30.6% of all households. In contrast, only 9 households (2.8%) fall into the $100,000 to $149,999 income bracket, making it the least populous group.
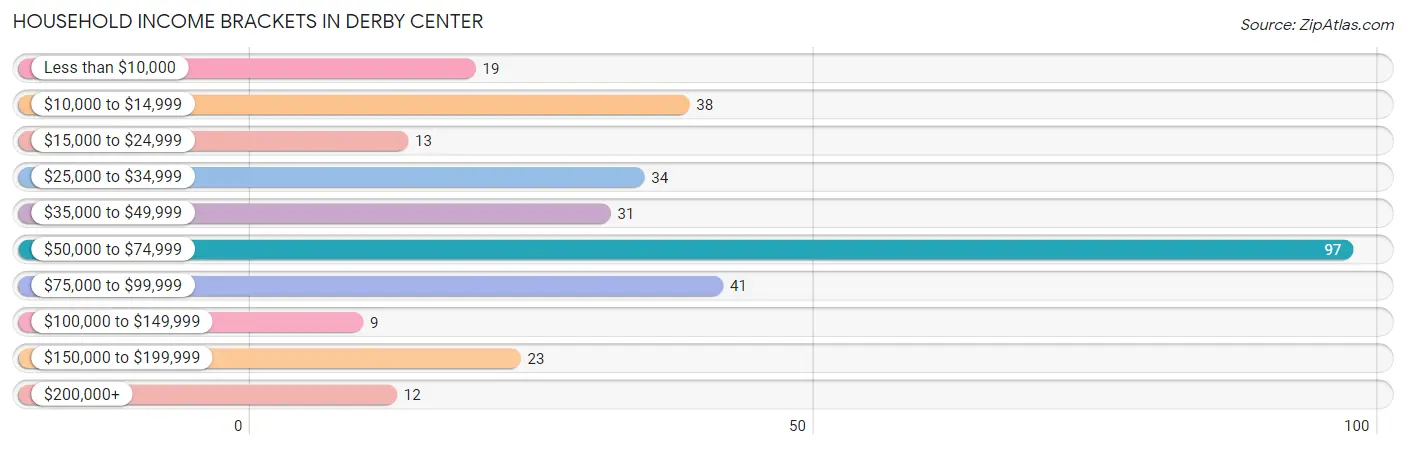
| Income Bracket | # Households | % Households |
| Less than $10,000 | 19 | 6.0% |
| $10,000 to $14,999 | 38 | 12.0% |
| $15,000 to $24,999 | 13 | 4.1% |
| $25,000 to $34,999 | 34 | 10.7% |
| $35,000 to $49,999 | 31 | 9.8% |
| $50,000 to $74,999 | 97 | 30.6% |
| $75,000 to $99,999 | 41 | 12.9% |
| $100,000 to $149,999 | 9 | 2.8% |
| $150,000 to $199,999 | 23 | 7.3% |
| $200,000+ | 12 | 3.8% |
Household Income by Householder Age in Derby Center
The median household income in Derby Center is $57,188, with the highest median household income of $58,875 found in the 25 to 44 years age bracket for the primary householder. A total of 57 households (18.0%) fall into this category. Meanwhile, the 15 to 24 years age bracket for the primary householder has the lowest median household income of $0, with 2 households (0.6%) in this group.
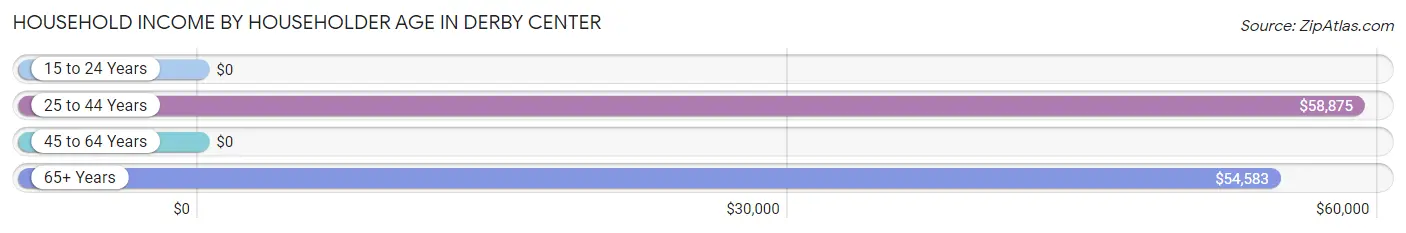
| Income Bracket | # Households | Median Income |
| 15 to 24 Years | 2 (0.6%) | $0 |
| 25 to 44 Years | 57 (18.0%) | $58,875 |
| 45 to 64 Years | 167 (52.7%) | $0 |
| 65+ Years | 91 (28.7%) | $54,583 |
| Total | 317 (100.0%) | $57,188 |
Poverty in Derby Center
Income Below Poverty by Sex and Age in Derby Center
With 18.4% poverty level for males and 21.7% for females among the residents of Derby Center, 6 to 11 year old males and 25 to 34 year old females are the most vulnerable to poverty, with 23 males (56.1%) and 10 females (76.9%) in their respective age groups living below the poverty level.
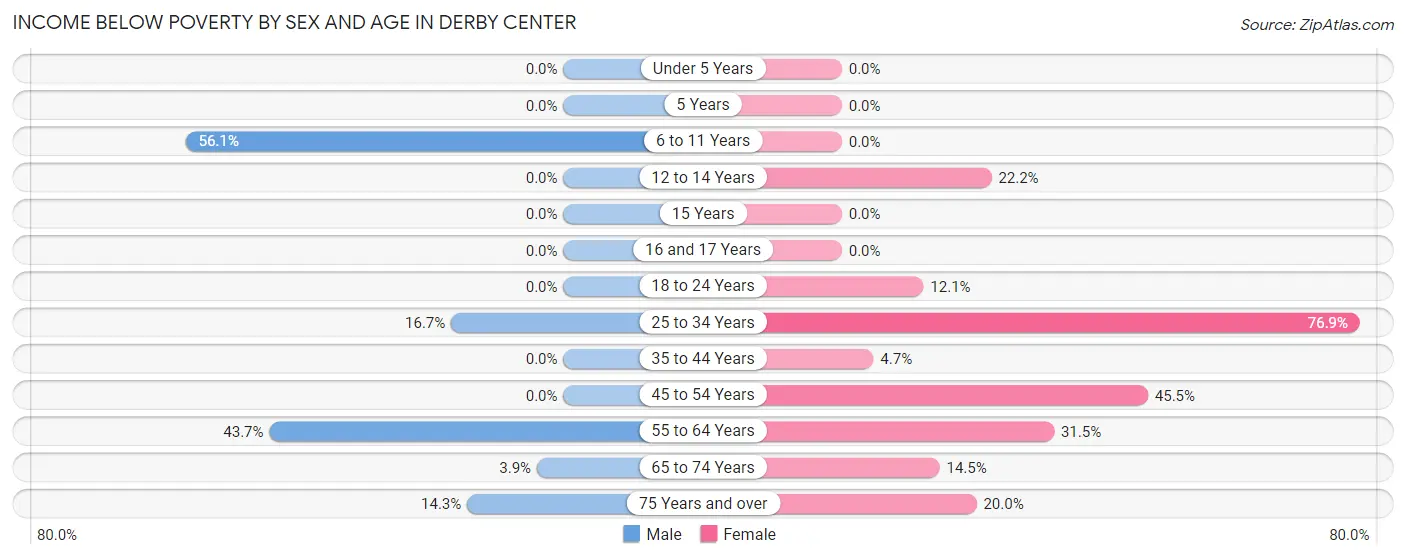
| Age Bracket | Male | Female |
| Under 5 Years | 0 (0.0%) | 0 (0.0%) |
| 5 Years | 0 (0.0%) | 0 (0.0%) |
| 6 to 11 Years | 23 (56.1%) | 0 (0.0%) |
| 12 to 14 Years | 0 (0.0%) | 12 (22.2%) |
| 15 Years | 0 (0.0%) | 0 (0.0%) |
| 16 and 17 Years | 0 (0.0%) | 0 (0.0%) |
| 18 to 24 Years | 0 (0.0%) | 4 (12.1%) |
| 25 to 34 Years | 3 (16.7%) | 10 (76.9%) |
| 35 to 44 Years | 0 (0.0%) | 3 (4.7%) |
| 45 to 54 Years | 0 (0.0%) | 30 (45.5%) |
| 55 to 64 Years | 31 (43.7%) | 23 (31.5%) |
| 65 to 74 Years | 2 (3.9%) | 9 (14.5%) |
| 75 Years and over | 3 (14.3%) | 5 (20.0%) |
| Total | 62 (18.4%) | 96 (21.7%) |
Income Above Poverty by Sex and Age in Derby Center
According to the poverty statistics in Derby Center, males aged under 5 years and females aged under 5 years are the age groups that are most secure financially, with 100.0% of males and 100.0% of females in these age groups living above the poverty line.
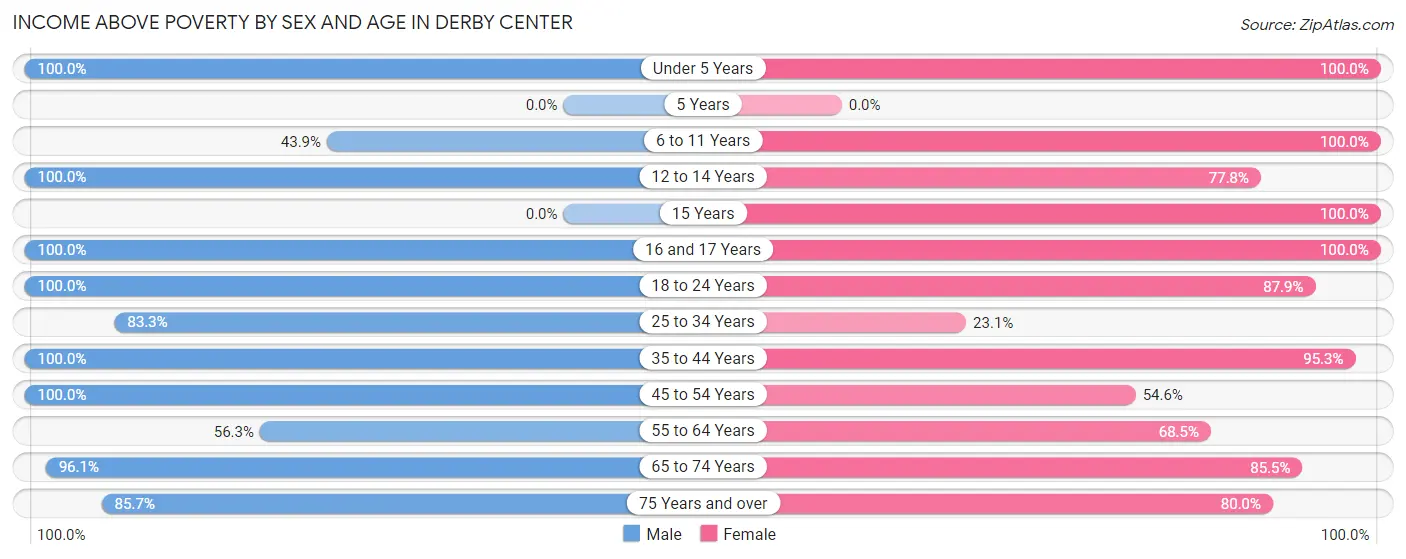
| Age Bracket | Male | Female |
| Under 5 Years | 15 (100.0%) | 3 (100.0%) |
| 5 Years | 0 (0.0%) | 0 (0.0%) |
| 6 to 11 Years | 18 (43.9%) | 8 (100.0%) |
| 12 to 14 Years | 9 (100.0%) | 42 (77.8%) |
| 15 Years | 0 (0.0%) | 13 (100.0%) |
| 16 and 17 Years | 13 (100.0%) | 29 (100.0%) |
| 18 to 24 Years | 29 (100.0%) | 29 (87.9%) |
| 25 to 34 Years | 15 (83.3%) | 3 (23.1%) |
| 35 to 44 Years | 25 (100.0%) | 61 (95.3%) |
| 45 to 54 Years | 44 (100.0%) | 36 (54.5%) |
| 55 to 64 Years | 40 (56.3%) | 50 (68.5%) |
| 65 to 74 Years | 49 (96.1%) | 53 (85.5%) |
| 75 Years and over | 18 (85.7%) | 20 (80.0%) |
| Total | 275 (81.6%) | 347 (78.3%) |
Income Below Poverty Among Married-Couple Families in Derby Center
The poverty statistics for married-couple families in Derby Center show that 6.9% or 10 of the total 145 families live below the poverty line. Families with no children have the highest poverty rate of 9.1%, comprising of 10 families. On the other hand, families with 1 or 2 children have the lowest poverty rate of 0.0%, which includes 0 families.
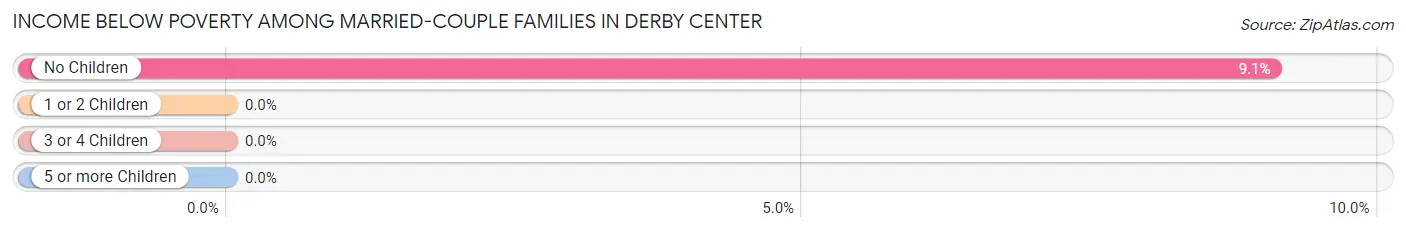
| Children | Above Poverty | Below Poverty |
| No Children | 100 (90.9%) | 10 (9.1%) |
| 1 or 2 Children | 35 (100.0%) | 0 (0.0%) |
| 3 or 4 Children | 0 (0.0%) | 0 (0.0%) |
| 5 or more Children | 0 (0.0%) | 0 (0.0%) |
| Total | 135 (93.1%) | 10 (6.9%) |
Income Below Poverty Among Single-Parent Households in Derby Center
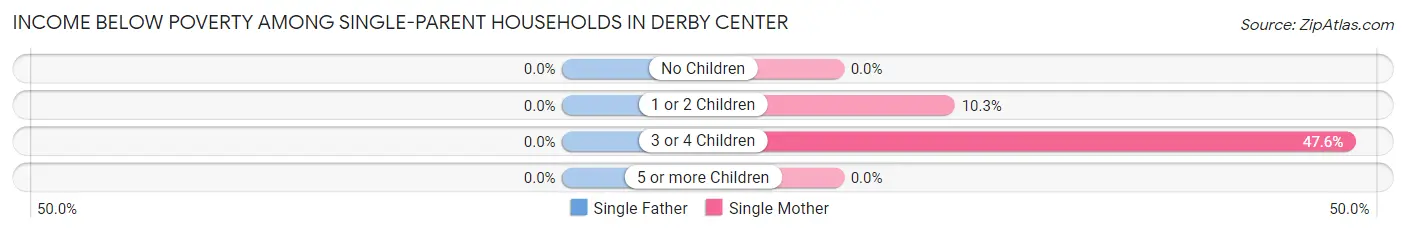
| Children | Single Father | Single Mother |
| No Children | 0 (0.0%) | 0 (0.0%) |
| 1 or 2 Children | 0 (0.0%) | 3 (10.3%) |
| 3 or 4 Children | 0 (0.0%) | 10 (47.6%) |
| 5 or more Children | 0 (0.0%) | 0 (0.0%) |
| Total | 0 (0.0%) | 13 (23.2%) |
Income Below Poverty Among Married-Couple vs Single-Parent Households in Derby Center
The poverty data for Derby Center shows that 10 of the married-couple family households (6.9%) and 13 of the single-parent households (20.3%) are living below the poverty level. Within the married-couple family households, those with no children have the highest poverty rate, with 10 households (9.1%) falling below the poverty line. Among the single-parent households, those with 3 or 4 children have the highest poverty rate, with 10 household (47.6%) living below poverty.
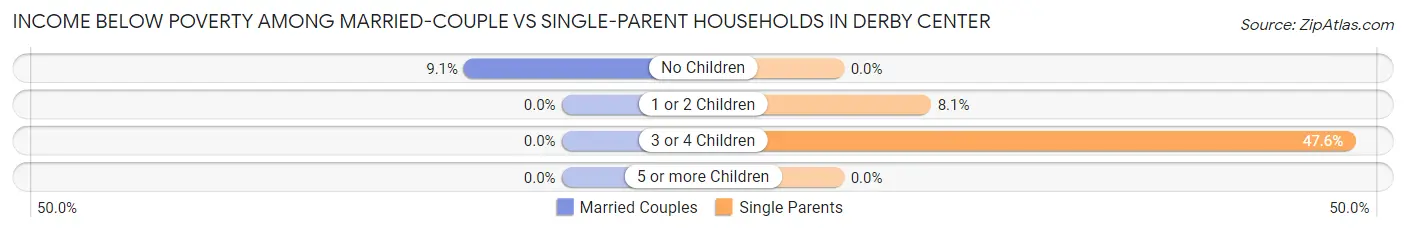
| Children | Married-Couple Families | Single-Parent Households |
| No Children | 10 (9.1%) | 0 (0.0%) |
| 1 or 2 Children | 0 (0.0%) | 3 (8.1%) |
| 3 or 4 Children | 0 (0.0%) | 10 (47.6%) |
| 5 or more Children | 0 (0.0%) | 0 (0.0%) |
| Total | 10 (6.9%) | 13 (20.3%) |
Race in Derby Center
The most populous races in Derby Center are White / Caucasian (802 | 100.0%), and Hispanic or Latino (18 | 2.2%).
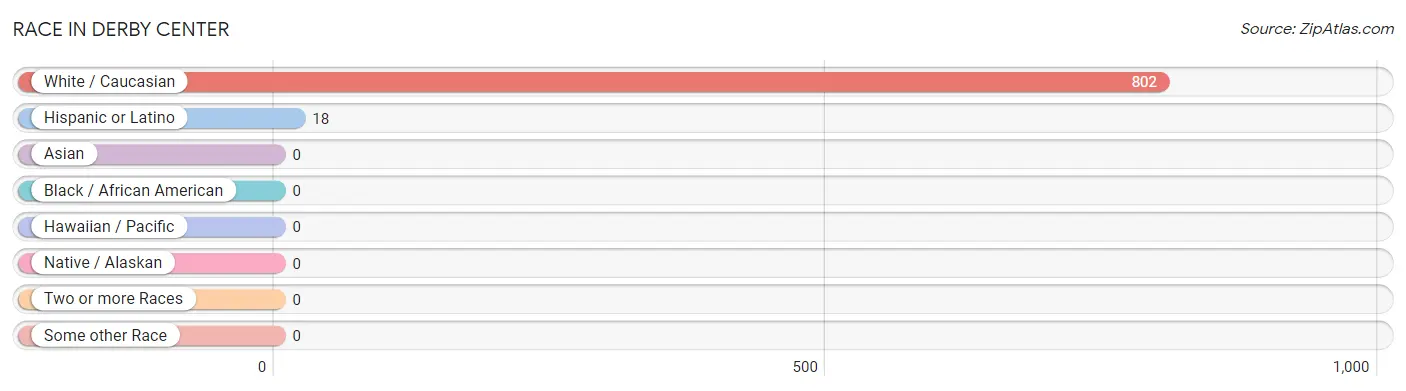
| Race | # Population | % Population |
| Asian | 0 | 0.0% |
| Black / African American | 0 | 0.0% |
| Hawaiian / Pacific | 0 | 0.0% |
| Hispanic or Latino | 18 | 2.2% |
| Native / Alaskan | 0 | 0.0% |
| White / Caucasian | 802 | 100.0% |
| Two or more Races | 0 | 0.0% |
| Some other Race | 0 | 0.0% |
| Total | 802 | 100.0% |
Ancestry in Derby Center
The most populous ancestries reported in Derby Center are French Canadian (99 | 12.3%), English (95 | 11.8%), American (83 | 10.3%), French (65 | 8.1%), and German (51 | 6.4%), together accounting for 49.0% of all Derby Center residents.
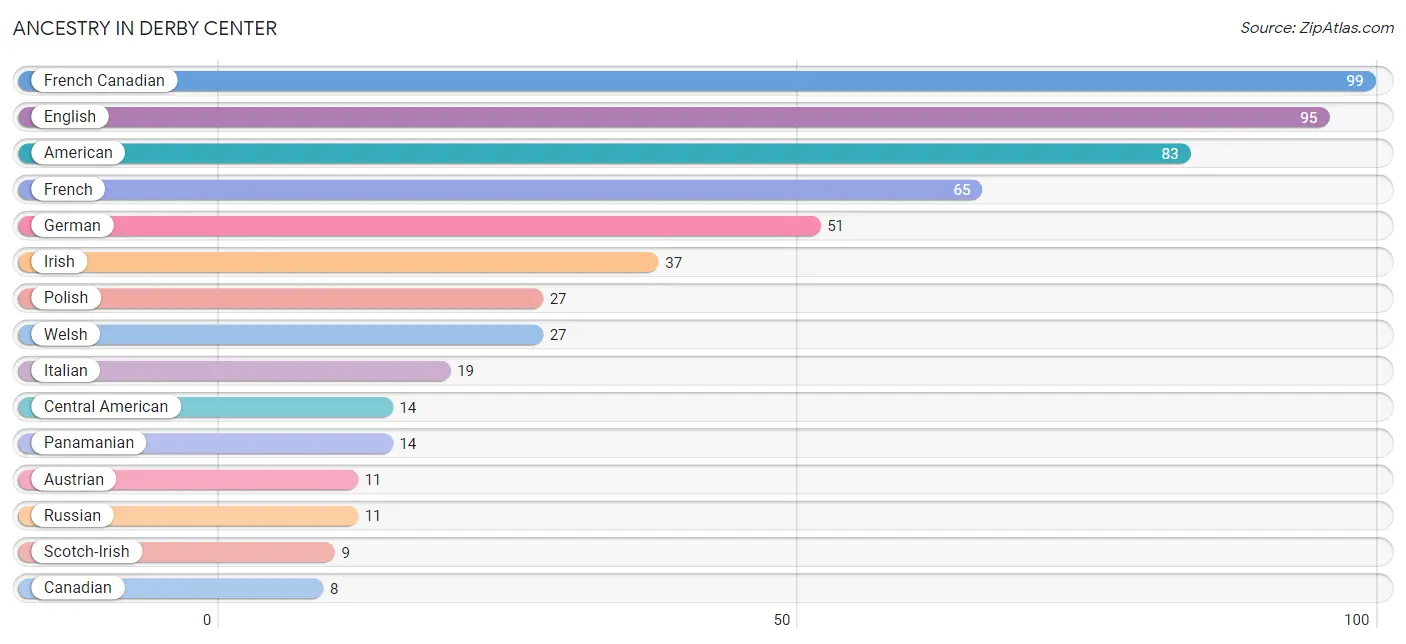
| Ancestry | # Population | % Population |
| American | 83 | 10.3% |
| Austrian | 11 | 1.4% |
| Canadian | 8 | 1.0% |
| Central American | 14 | 1.8% |
| Czech | 5 | 0.6% |
| English | 95 | 11.8% |
| French | 65 | 8.1% |
| French Canadian | 99 | 12.3% |
| German | 51 | 6.4% |
| Irish | 37 | 4.6% |
| Italian | 19 | 2.4% |
| Mexican | 4 | 0.5% |
| Norwegian | 2 | 0.3% |
| Panamanian | 14 | 1.8% |
| Polish | 27 | 3.4% |
| Russian | 11 | 1.4% |
| Scotch-Irish | 9 | 1.1% |
| Scottish | 2 | 0.3% |
| Swedish | 3 | 0.4% |
| Welsh | 27 | 3.4% | View All 20 Rows |
Immigrants in Derby Center
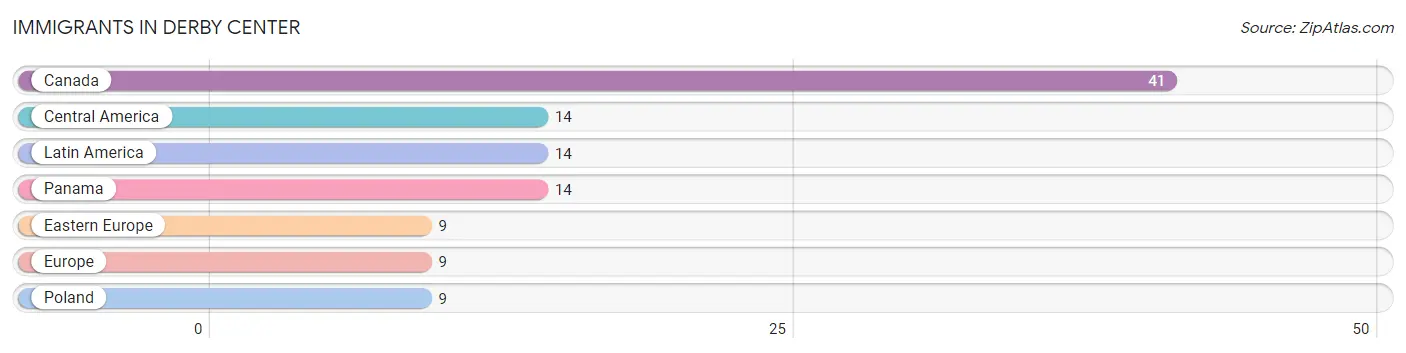
The most numerous immigrant groups reported in Derby Center came from Canada (41 | 5.1%), Central America (14 | 1.8%), Latin America (14 | 1.8%), Panama (14 | 1.8%), and Eastern Europe (9 | 1.1%), together accounting for 11.5% of all Derby Center residents.
| Immigration Origin | # Population | % Population |
| Canada | 41 | 5.1% |
| Central America | 14 | 1.8% |
| Eastern Europe | 9 | 1.1% |
| Europe | 9 | 1.1% |
| Latin America | 14 | 1.8% |
| Panama | 14 | 1.8% |
| Poland | 9 | 1.1% | View All 7 Rows |
Sex and Age in Derby Center
Sex and Age in Derby Center
The most populous age groups in Derby Center are 60 to 64 Years (47 | 13.9%) for men and 45 to 49 Years (64 | 13.8%) for women.
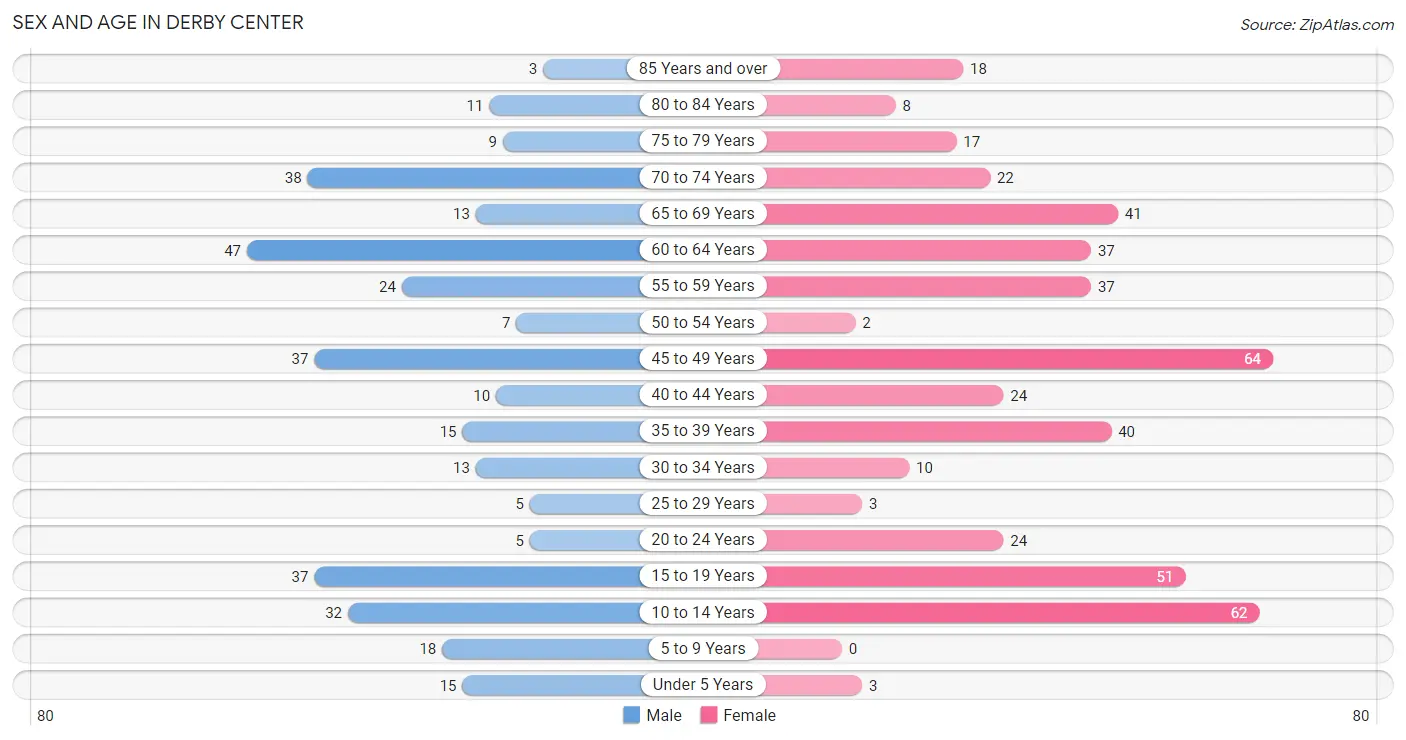
| Age Bracket | Male | Female |
| Under 5 Years | 15 (4.4%) | 3 (0.6%) |
| 5 to 9 Years | 18 (5.3%) | 0 (0.0%) |
| 10 to 14 Years | 32 (9.4%) | 62 (13.4%) |
| 15 to 19 Years | 37 (10.9%) | 51 (11.0%) |
| 20 to 24 Years | 5 (1.5%) | 24 (5.2%) |
| 25 to 29 Years | 5 (1.5%) | 3 (0.6%) |
| 30 to 34 Years | 13 (3.8%) | 10 (2.2%) |
| 35 to 39 Years | 15 (4.4%) | 40 (8.6%) |
| 40 to 44 Years | 10 (2.9%) | 24 (5.2%) |
| 45 to 49 Years | 37 (10.9%) | 64 (13.8%) |
| 50 to 54 Years | 7 (2.1%) | 2 (0.4%) |
| 55 to 59 Years | 24 (7.1%) | 37 (8.0%) |
| 60 to 64 Years | 47 (13.9%) | 37 (8.0%) |
| 65 to 69 Years | 13 (3.8%) | 41 (8.9%) |
| 70 to 74 Years | 38 (11.2%) | 22 (4.8%) |
| 75 to 79 Years | 9 (2.6%) | 17 (3.7%) |
| 80 to 84 Years | 11 (3.2%) | 8 (1.7%) |
| 85 Years and over | 3 (0.9%) | 18 (3.9%) |
| Total | 339 (100.0%) | 463 (100.0%) |
Families and Households in Derby Center
Median Family Size in Derby Center
The median family size in Derby Center is 2.91 persons per family, with single female/mother families (56 | 26.8%) accounting for the largest median family size of 3.43 persons per family. On the other hand, married-couple families (145 | 69.4%) represent the smallest median family size with 2.70 persons per family.
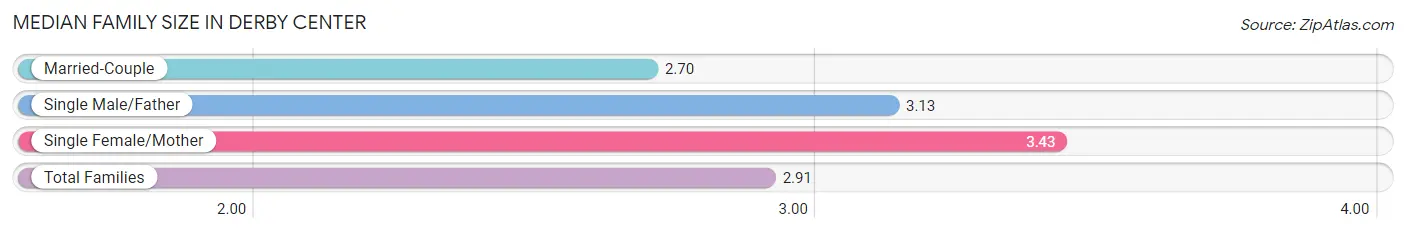
| Family Type | # Families | Family Size |
| Married-Couple | 145 (69.4%) | 2.70 |
| Single Male/Father | 8 (3.8%) | 3.13 |
| Single Female/Mother | 56 (26.8%) | 3.43 |
| Total Families | 209 (100.0%) | 2.91 |
Median Household Size in Derby Center
The median household size in Derby Center is 2.46 persons per household, with single male/father households (8 | 2.5%) accounting for the largest median household size of 4.13 persons per household. non-family households (108 | 34.1%) represent the smallest median household size with 1.09 persons per household.
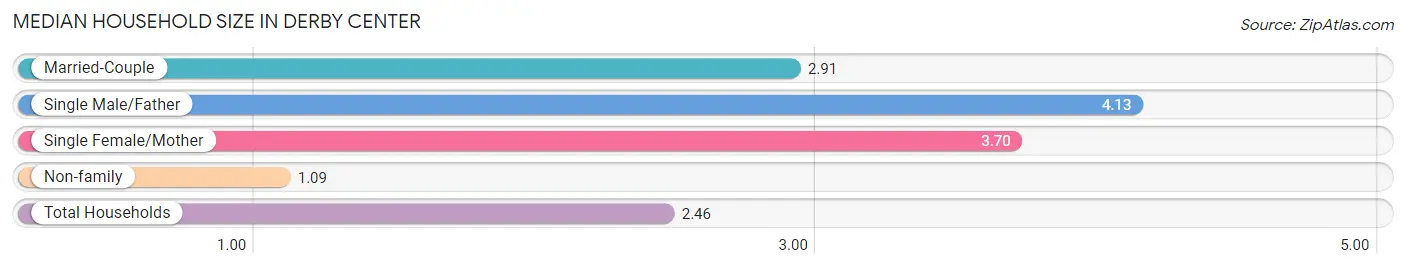
| Household Type | # Households | Household Size |
| Married-Couple | 145 (45.7%) | 2.91 |
| Single Male/Father | 8 (2.5%) | 4.13 |
| Single Female/Mother | 56 (17.7%) | 3.70 |
| Non-family | 108 (34.1%) | 1.09 |
| Total Households | 317 (100.0%) | 2.46 |
Household Size by Marriage Status in Derby Center
Out of a total of 317 households in Derby Center, 209 (65.9%) are family households, while 108 (34.1%) are nonfamily households. The most numerous type of family households are 2-person households, comprising 96, and the most common type of nonfamily households are 1-person households, comprising 98.
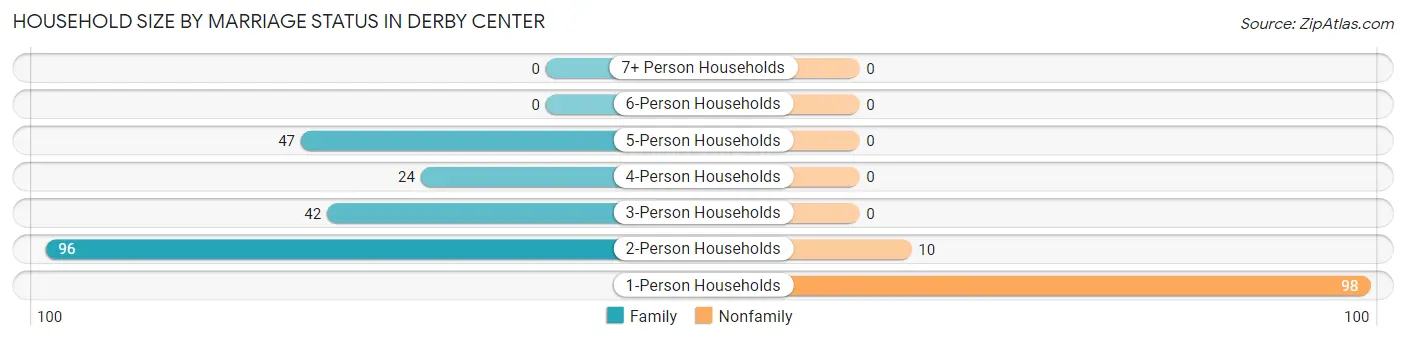
| Household Size | Family Households | Nonfamily Households |
| 1-Person Households | - | 98 (30.9%) |
| 2-Person Households | 96 (30.3%) | 10 (3.2%) |
| 3-Person Households | 42 (13.3%) | 0 (0.0%) |
| 4-Person Households | 24 (7.6%) | 0 (0.0%) |
| 5-Person Households | 47 (14.8%) | 0 (0.0%) |
| 6-Person Households | 0 (0.0%) | 0 (0.0%) |
| 7+ Person Households | 0 (0.0%) | 0 (0.0%) |
| Total | 209 (65.9%) | 108 (34.1%) |
Female Fertility in Derby Center
Fertility by Age in Derby Center
Average fertility rate in Derby Center is 41.0 births per 1,000 women. Women in the age bracket of 15 to 19 years have the highest fertility rate with 176.0 births per 1,000 women. Women in the age bracket of 15 to 19 years acount for 100.0% of all women with births.
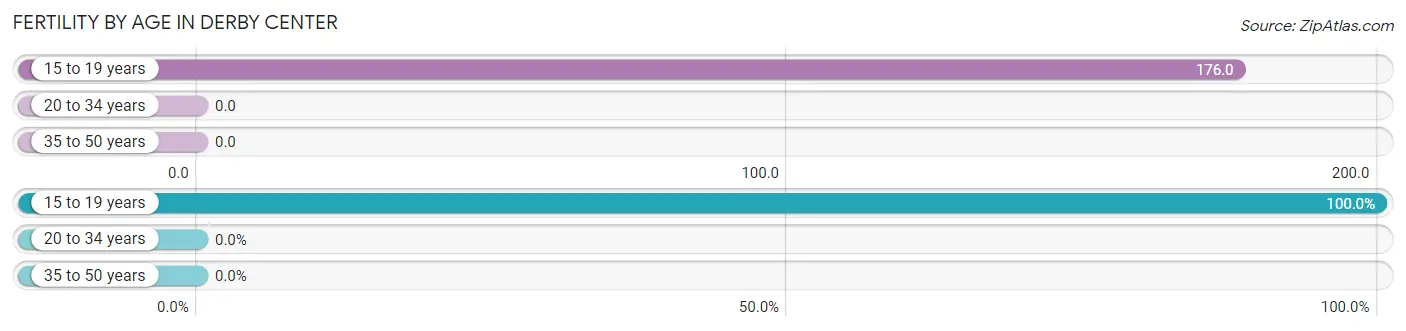
| Age Bracket | Women with Births | Births / 1,000 Women |
| 15 to 19 years | 9 (100.0%) | 176.0 |
| 20 to 34 years | 0 (0.0%) | 0.0 |
| 35 to 50 years | 0 (0.0%) | 0.0 |
| Total | 9 (100.0%) | 41.0 |
Fertility by Age by Marriage Status in Derby Center
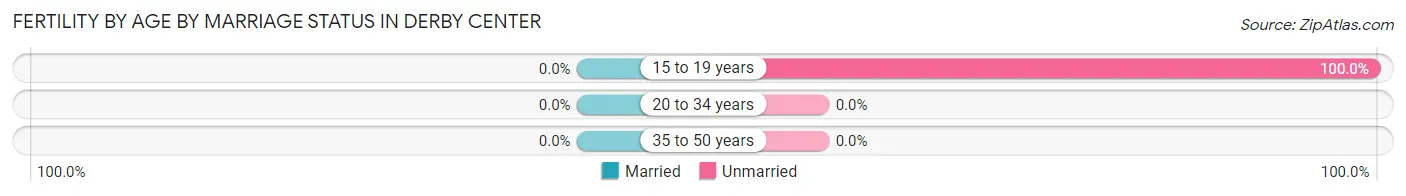
| Age Bracket | Married | Unmarried |
| 15 to 19 years | 0 (0.0%) | 9 (100.0%) |
| 20 to 34 years | 0 (0.0%) | 0 (0.0%) |
| 35 to 50 years | 0 (0.0%) | 0 (0.0%) |
| Total | 0 (0.0%) | 9 (100.0%) |
Fertility by Education in Derby Center
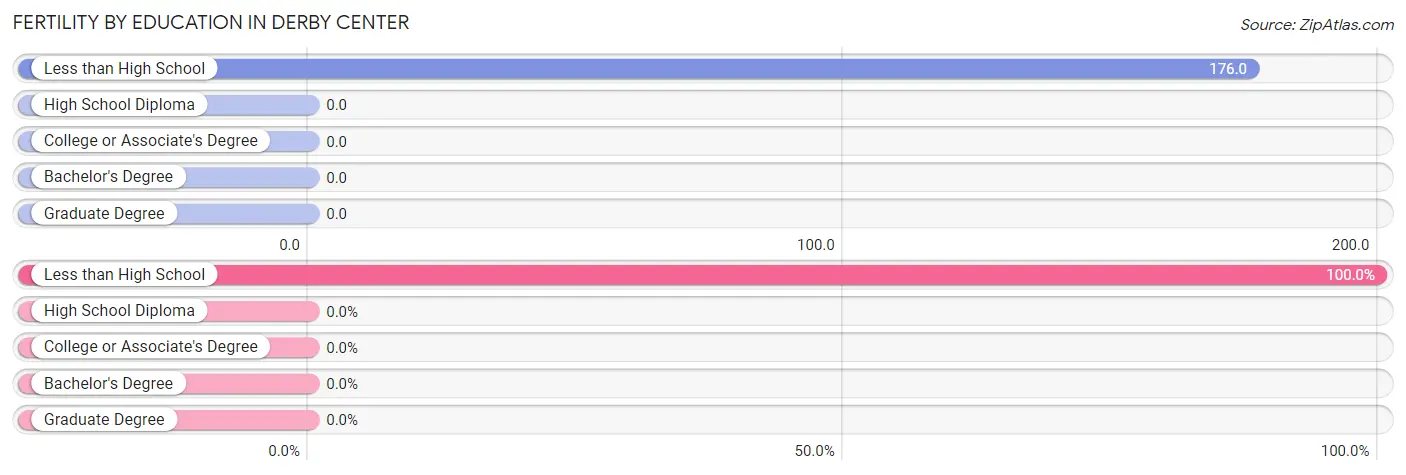
| Educational Attainment | Women with Births | Births / 1,000 Women |
| Less than High School | 9 (100.0%) | 176.0 |
| High School Diploma | 0 (0.0%) | 0.0 |
| College or Associate's Degree | 0 (0.0%) | 0.0 |
| Bachelor's Degree | 0 (0.0%) | 0.0 |
| Graduate Degree | 0 (0.0%) | 0.0 |
| Total | 9 (100.0%) | 41.0 |
Fertility by Education by Marriage Status in Derby Center
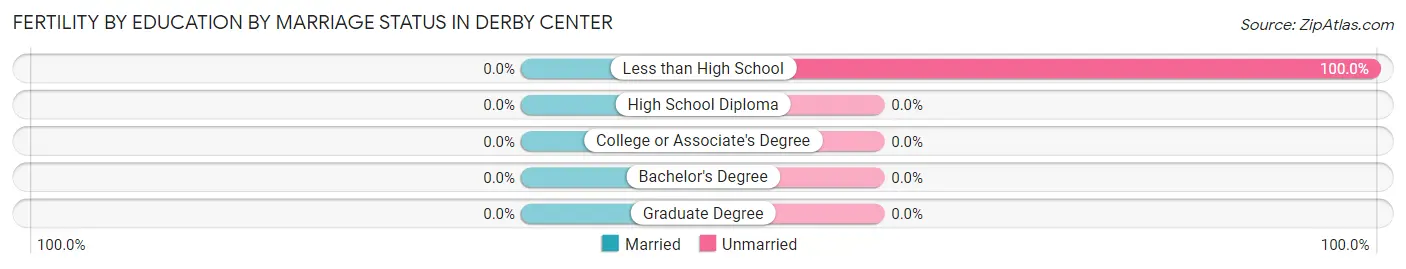
| Educational Attainment | Married | Unmarried |
| Less than High School | 0 (0.0%) | 9 (100.0%) |
| High School Diploma | 0 (0.0%) | 0 (0.0%) |
| College or Associate's Degree | 0 (0.0%) | 0 (0.0%) |
| Bachelor's Degree | 0 (0.0%) | 0 (0.0%) |
| Graduate Degree | 0 (0.0%) | 0 (0.0%) |
| Total | 0 (0.0%) | 9 (100.0%) |
Employment Characteristics in Derby Center
Employment by Class of Employer in Derby Center
Among the 397 employed individuals in Derby Center, private company employees (250 | 63.0%), local government employees (79 | 19.9%), and self-employed (not incorporated) (31 | 7.8%) make up the most common classes of employment.
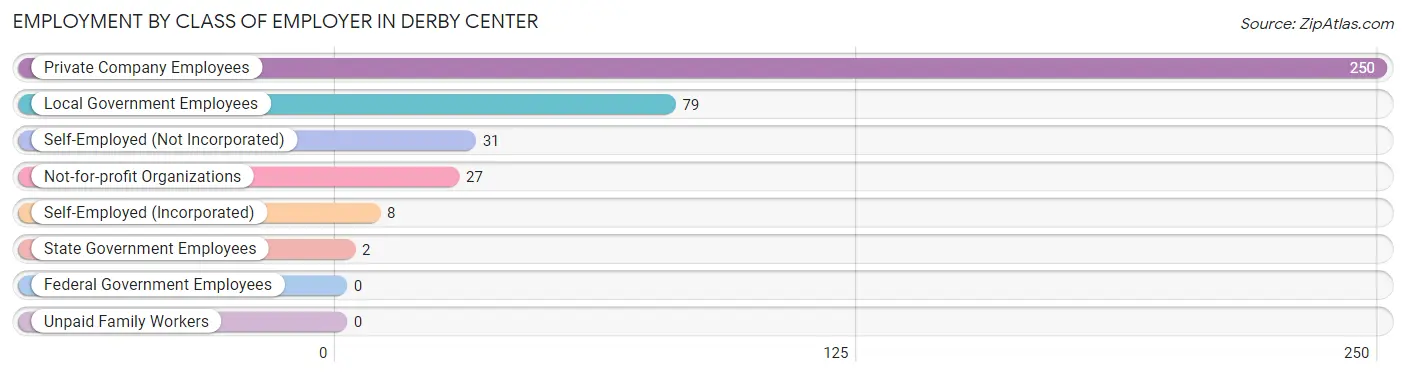
| Employer Class | # Employees | % Employees |
| Private Company Employees | 250 | 63.0% |
| Self-Employed (Incorporated) | 8 | 2.0% |
| Self-Employed (Not Incorporated) | 31 | 7.8% |
| Not-for-profit Organizations | 27 | 6.8% |
| Local Government Employees | 79 | 19.9% |
| State Government Employees | 2 | 0.5% |
| Federal Government Employees | 0 | 0.0% |
| Unpaid Family Workers | 0 | 0.0% |
| Total | 397 | 100.0% |
Employment Status by Age in Derby Center
According to the labor force statistics for Derby Center, out of the total population over 16 years of age (659), 62.8% or 414 individuals are in the labor force, with 2.9% or 12 of them unemployed. The age group with the highest labor force participation rate is 25 to 29 years, with 100.0% or 8 individuals in the labor force. Within the labor force, the 16 to 19 years age range has the highest percentage of unemployed individuals, with 25.7% or 9 of them being unemployed.
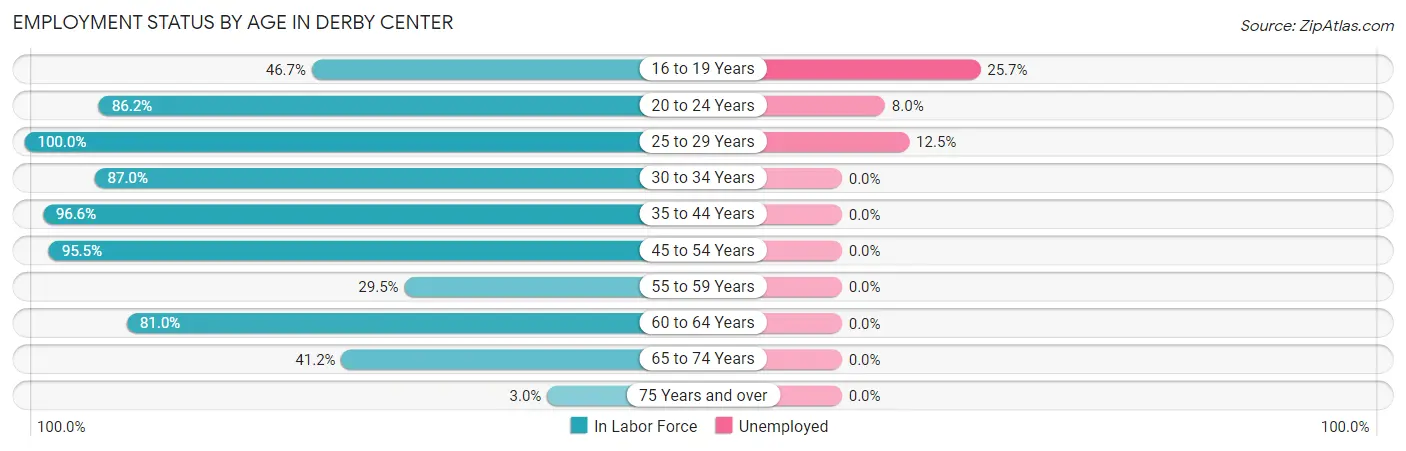
| Age Bracket | In Labor Force | Unemployed |
| 16 to 19 Years | 35 (46.7%) | 9 (25.7%) |
| 20 to 24 Years | 25 (86.2%) | 2 (8.0%) |
| 25 to 29 Years | 8 (100.0%) | 1 (12.5%) |
| 30 to 34 Years | 20 (87.0%) | 0 (0.0%) |
| 35 to 44 Years | 86 (96.6%) | 0 (0.0%) |
| 45 to 54 Years | 105 (95.5%) | 0 (0.0%) |
| 55 to 59 Years | 18 (29.5%) | 0 (0.0%) |
| 60 to 64 Years | 68 (81.0%) | 0 (0.0%) |
| 65 to 74 Years | 47 (41.2%) | 0 (0.0%) |
| 75 Years and over | 2 (3.0%) | 0 (0.0%) |
| Total | 414 (62.8%) | 12 (2.9%) |
Employment Status by Educational Attainment in Derby Center
According to labor force statistics for Derby Center, 81.3% of individuals (305) out of the total population between 25 and 64 years of age (375) are in the labor force, with 0.3% or 1 of them being unemployed. The group with the highest labor force participation rate are those with the educational attainment of college / associate degree, with 92.5% or 86 individuals in the labor force. Within the labor force, individuals with high school diploma education have the highest percentage of unemployment, with 0.6% or 1 of them being unemployed.
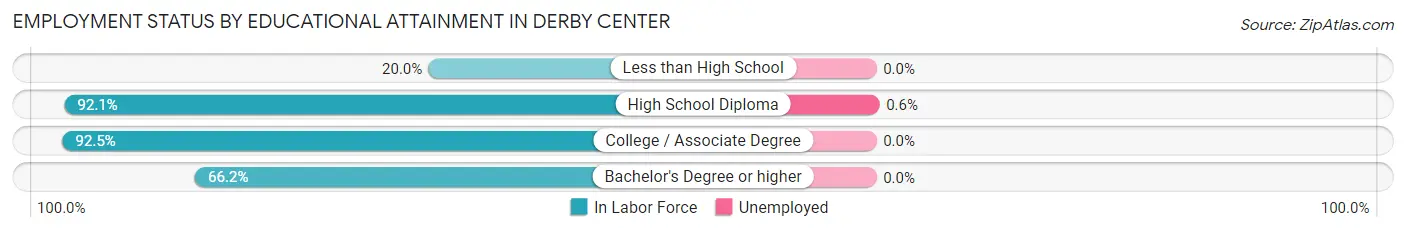
| Educational Attainment | In Labor Force | Unemployed |
| Less than High School | 6 (20.0%) | 0 (0.0%) |
| High School Diploma | 164 (92.1%) | 1 (0.6%) |
| College / Associate Degree | 86 (92.5%) | 0 (0.0%) |
| Bachelor's Degree or higher | 49 (66.2%) | 0 (0.0%) |
| Total | 305 (81.3%) | 1 (0.3%) |
Employment Occupations by Sex in Derby Center
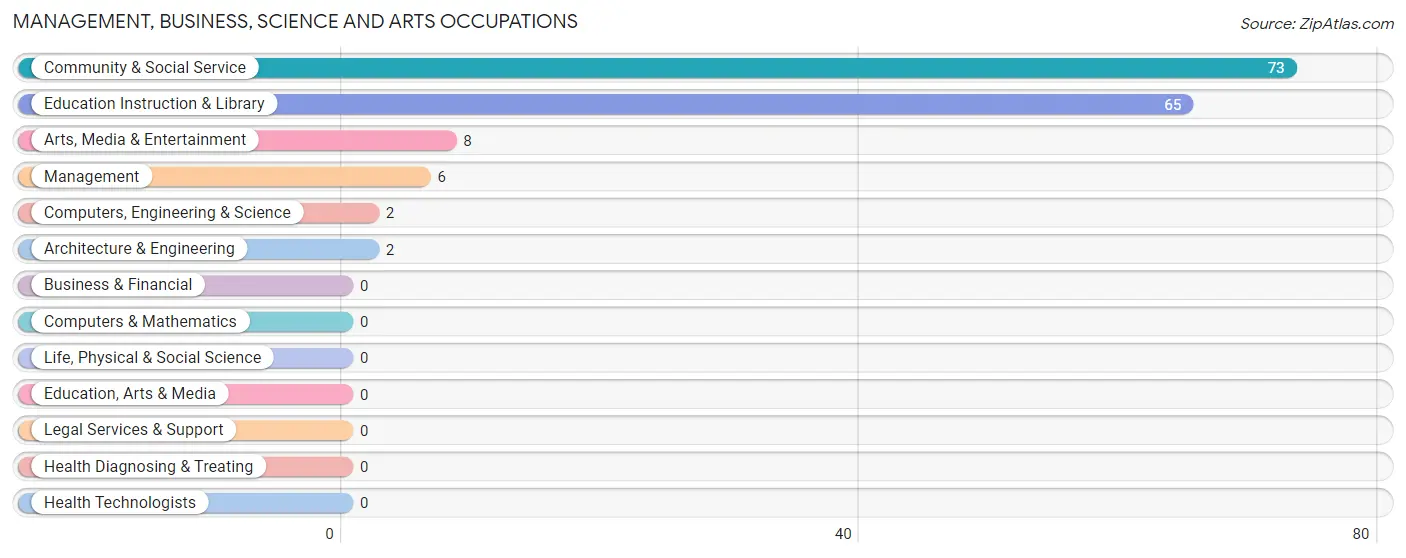
Management, Business, Science and Arts Occupations
The most common Management, Business, Science and Arts occupations in Derby Center are Community & Social Service (73 | 18.2%), Education Instruction & Library (65 | 16.2%), Arts, Media & Entertainment (8 | 2.0%), Management (6 | 1.5%), and Computers, Engineering & Science (2 | 0.5%).
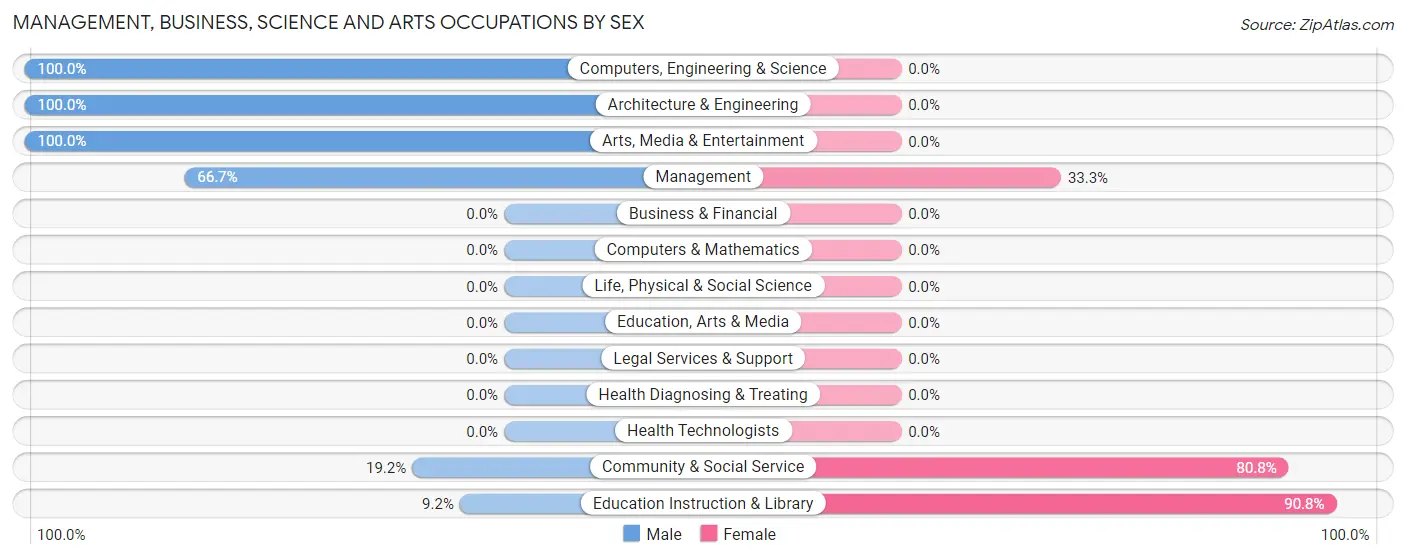
Management, Business, Science and Arts Occupations by Sex
Within the Management, Business, Science and Arts occupations in Derby Center, the most male-oriented occupations are Computers, Engineering & Science (100.0%), Architecture & Engineering (100.0%), and Arts, Media & Entertainment (100.0%), while the most female-oriented occupations are Education Instruction & Library (90.8%), Community & Social Service (80.8%), and Management (33.3%).
| Occupation | Male | Female |
| Management | 4 (66.7%) | 2 (33.3%) |
| Business & Financial | 0 (0.0%) | 0 (0.0%) |
| Computers, Engineering & Science | 2 (100.0%) | 0 (0.0%) |
| Computers & Mathematics | 0 (0.0%) | 0 (0.0%) |
| Architecture & Engineering | 2 (100.0%) | 0 (0.0%) |
| Life, Physical & Social Science | 0 (0.0%) | 0 (0.0%) |
| Community & Social Service | 14 (19.2%) | 59 (80.8%) |
| Education, Arts & Media | 0 (0.0%) | 0 (0.0%) |
| Legal Services & Support | 0 (0.0%) | 0 (0.0%) |
| Education Instruction & Library | 6 (9.2%) | 59 (90.8%) |
| Arts, Media & Entertainment | 8 (100.0%) | 0 (0.0%) |
| Health Diagnosing & Treating | 0 (0.0%) | 0 (0.0%) |
| Health Technologists | 0 (0.0%) | 0 (0.0%) |
| Total (Category) | 20 (24.7%) | 61 (75.3%) |
| Total (Overall) | 177 (44.0%) | 225 (56.0%) |
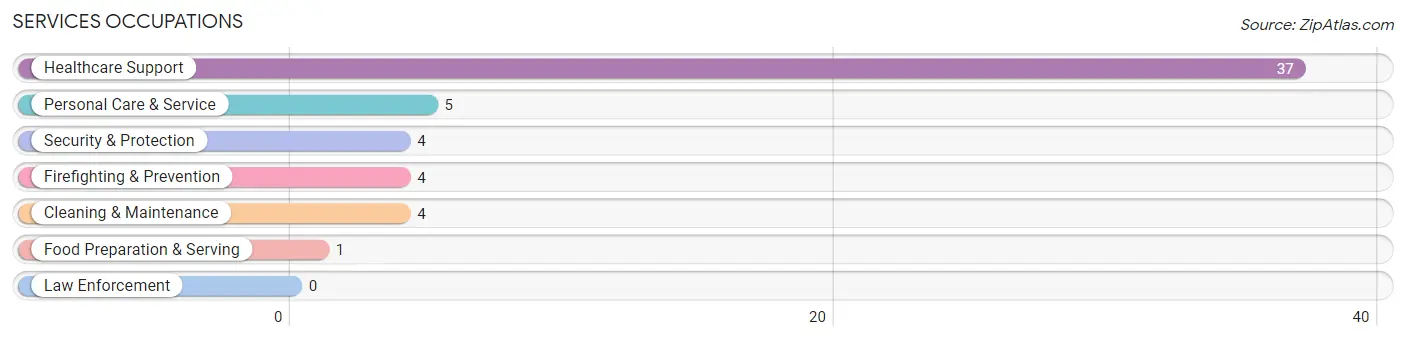
Services Occupations
The most common Services occupations in Derby Center are Healthcare Support (37 | 9.2%), Personal Care & Service (5 | 1.2%), Security & Protection (4 | 1.0%), Firefighting & Prevention (4 | 1.0%), and Cleaning & Maintenance (4 | 1.0%).
Services Occupations by Sex
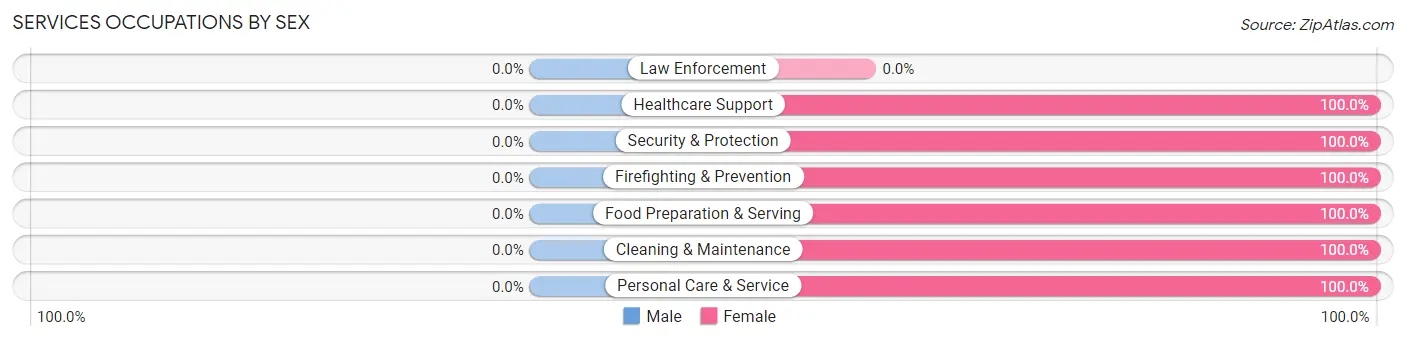
| Occupation | Male | Female |
| Healthcare Support | 0 (0.0%) | 37 (100.0%) |
| Security & Protection | 0 (0.0%) | 4 (100.0%) |
| Firefighting & Prevention | 0 (0.0%) | 4 (100.0%) |
| Law Enforcement | 0 (0.0%) | 0 (0.0%) |
| Food Preparation & Serving | 0 (0.0%) | 1 (100.0%) |
| Cleaning & Maintenance | 0 (0.0%) | 4 (100.0%) |
| Personal Care & Service | 0 (0.0%) | 5 (100.0%) |
| Total (Category) | 0 (0.0%) | 51 (100.0%) |
| Total (Overall) | 177 (44.0%) | 225 (56.0%) |
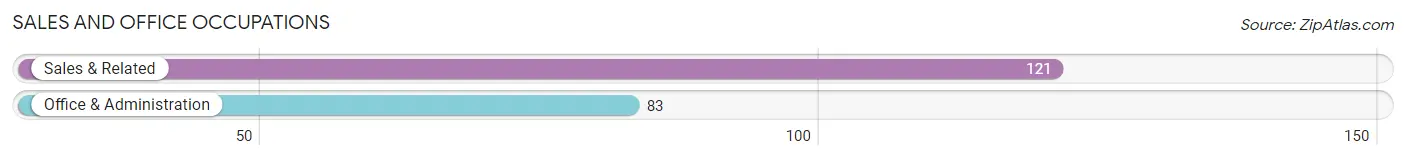
Sales and Office Occupations
The most common Sales and Office occupations in Derby Center are Sales & Related (121 | 30.1%), and Office & Administration (83 | 20.6%).
Sales and Office Occupations by Sex
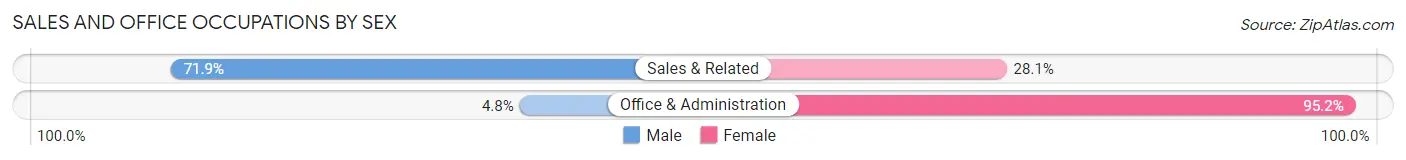
| Occupation | Male | Female |
| Sales & Related | 87 (71.9%) | 34 (28.1%) |
| Office & Administration | 4 (4.8%) | 79 (95.2%) |
| Total (Category) | 91 (44.6%) | 113 (55.4%) |
| Total (Overall) | 177 (44.0%) | 225 (56.0%) |
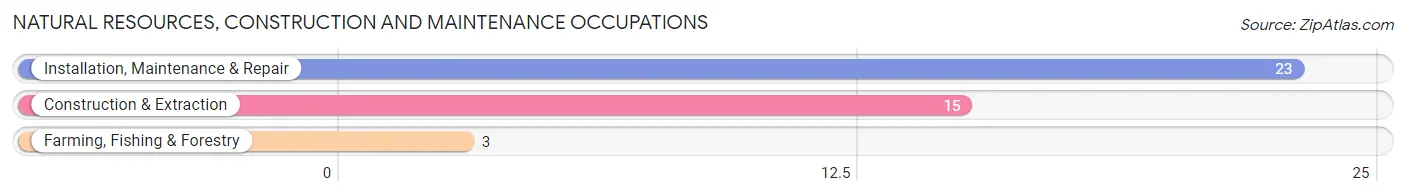
Natural Resources, Construction and Maintenance Occupations
The most common Natural Resources, Construction and Maintenance occupations in Derby Center are Installation, Maintenance & Repair (23 | 5.7%), Construction & Extraction (15 | 3.7%), and Farming, Fishing & Forestry (3 | 0.7%).
Natural Resources, Construction and Maintenance Occupations by Sex
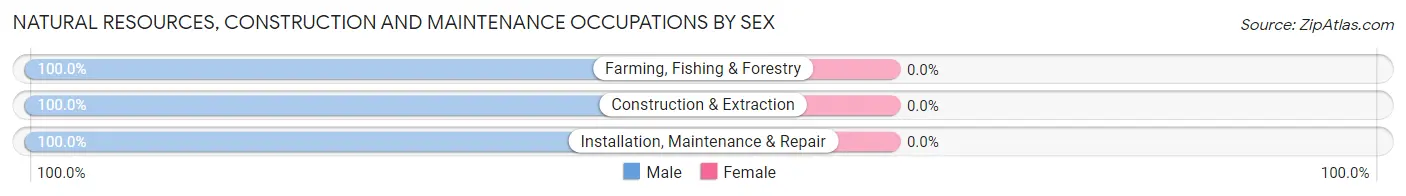
| Occupation | Male | Female |
| Farming, Fishing & Forestry | 3 (100.0%) | 0 (0.0%) |
| Construction & Extraction | 15 (100.0%) | 0 (0.0%) |
| Installation, Maintenance & Repair | 23 (100.0%) | 0 (0.0%) |
| Total (Category) | 41 (100.0%) | 0 (0.0%) |
| Total (Overall) | 177 (44.0%) | 225 (56.0%) |
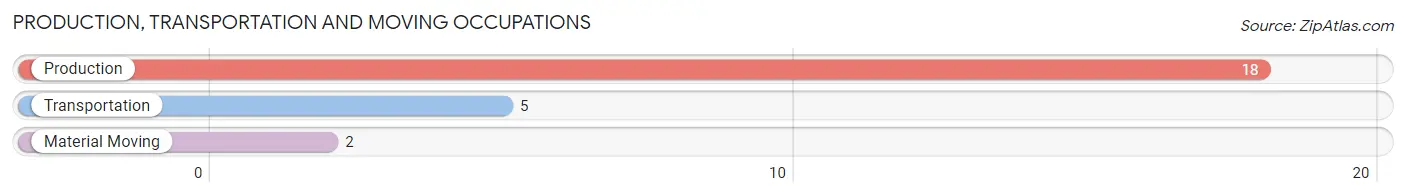
Production, Transportation and Moving Occupations
The most common Production, Transportation and Moving occupations in Derby Center are Production (18 | 4.5%), Transportation (5 | 1.2%), and Material Moving (2 | 0.5%).
Production, Transportation and Moving Occupations by Sex
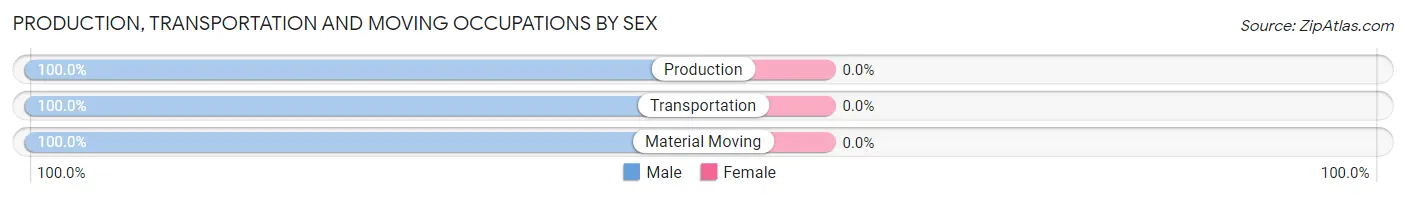
| Occupation | Male | Female |
| Production | 18 (100.0%) | 0 (0.0%) |
| Transportation | 5 (100.0%) | 0 (0.0%) |
| Material Moving | 2 (100.0%) | 0 (0.0%) |
| Total (Category) | 25 (100.0%) | 0 (0.0%) |
| Total (Overall) | 177 (44.0%) | 225 (56.0%) |
Employment Industries by Sex in Derby Center
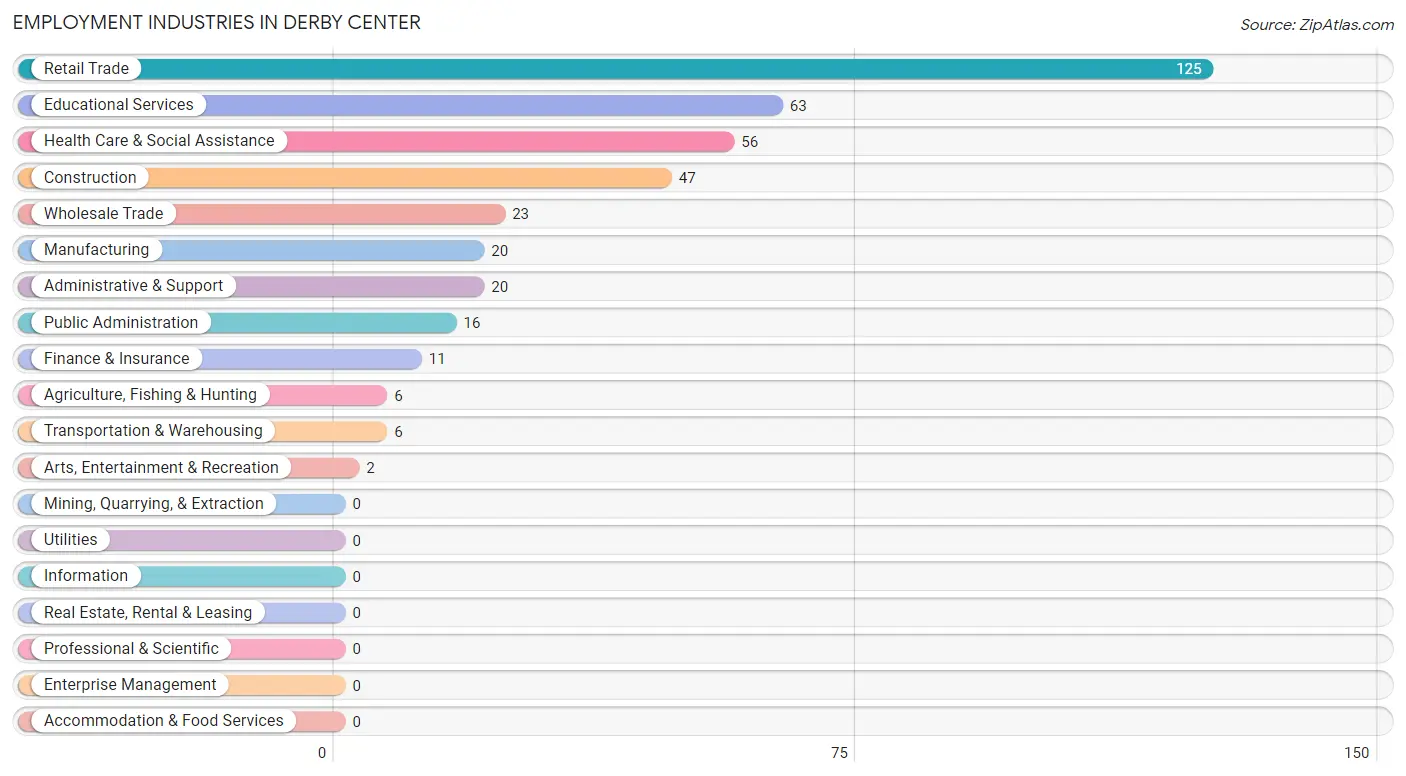
Employment Industries in Derby Center
The major employment industries in Derby Center include Retail Trade (125 | 31.1%), Educational Services (63 | 15.7%), Health Care & Social Assistance (56 | 13.9%), Construction (47 | 11.7%), and Wholesale Trade (23 | 5.7%).
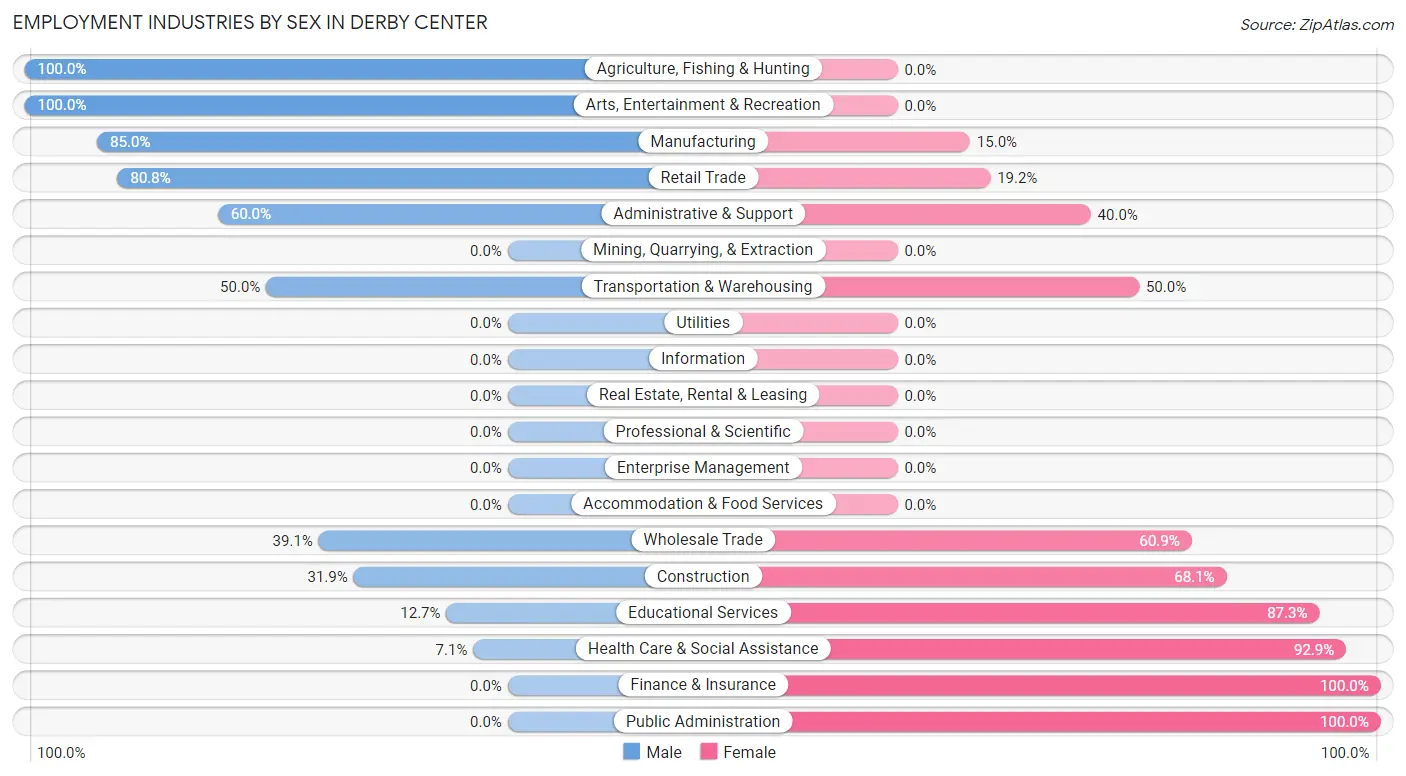
Employment Industries by Sex in Derby Center
The Derby Center industries that see more men than women are Agriculture, Fishing & Hunting (100.0%), Arts, Entertainment & Recreation (100.0%), and Manufacturing (85.0%), whereas the industries that tend to have a higher number of women are Finance & Insurance (100.0%), Public Administration (100.0%), and Health Care & Social Assistance (92.9%).
| Industry | Male | Female |
| Agriculture, Fishing & Hunting | 6 (100.0%) | 0 (0.0%) |
| Mining, Quarrying, & Extraction | 0 (0.0%) | 0 (0.0%) |
| Construction | 15 (31.9%) | 32 (68.1%) |
| Manufacturing | 17 (85.0%) | 3 (15.0%) |
| Wholesale Trade | 9 (39.1%) | 14 (60.9%) |
| Retail Trade | 101 (80.8%) | 24 (19.2%) |
| Transportation & Warehousing | 3 (50.0%) | 3 (50.0%) |
| Utilities | 0 (0.0%) | 0 (0.0%) |
| Information | 0 (0.0%) | 0 (0.0%) |
| Finance & Insurance | 0 (0.0%) | 11 (100.0%) |
| Real Estate, Rental & Leasing | 0 (0.0%) | 0 (0.0%) |
| Professional & Scientific | 0 (0.0%) | 0 (0.0%) |
| Enterprise Management | 0 (0.0%) | 0 (0.0%) |
| Administrative & Support | 12 (60.0%) | 8 (40.0%) |
| Educational Services | 8 (12.7%) | 55 (87.3%) |
| Health Care & Social Assistance | 4 (7.1%) | 52 (92.9%) |
| Arts, Entertainment & Recreation | 2 (100.0%) | 0 (0.0%) |
| Accommodation & Food Services | 0 (0.0%) | 0 (0.0%) |
| Public Administration | 0 (0.0%) | 16 (100.0%) |
| Total | 177 (44.0%) | 225 (56.0%) |
Education in Derby Center
School Enrollment in Derby Center
The most common levels of schooling among the 219 students in Derby Center are high school (86 | 39.3%), middle school (80 | 36.5%), and college / undergraduate (30 | 13.7%).
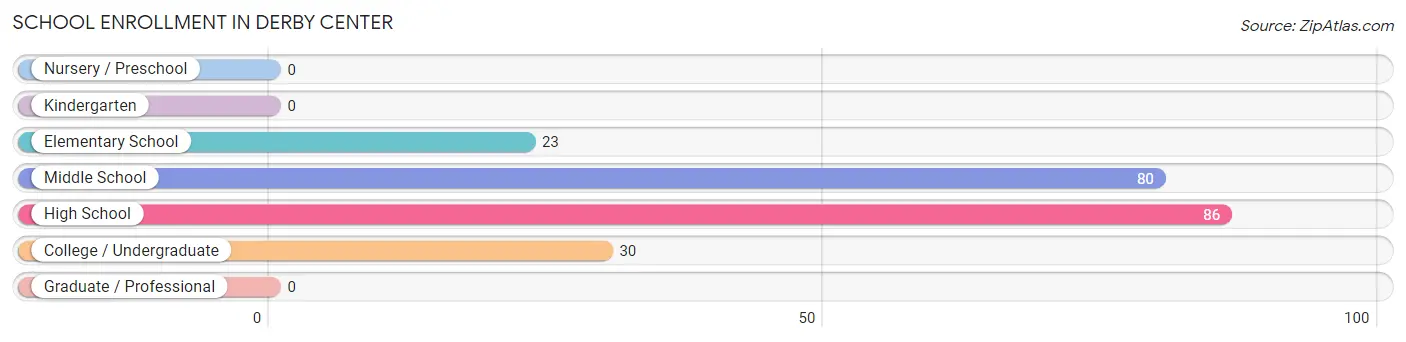
| School Level | # Students | % Students |
| Nursery / Preschool | 0 | 0.0% |
| Kindergarten | 0 | 0.0% |
| Elementary School | 23 | 10.5% |
| Middle School | 80 | 36.5% |
| High School | 86 | 39.3% |
| College / Undergraduate | 30 | 13.7% |
| Graduate / Professional | 0 | 0.0% |
| Total | 219 | 100.0% |
School Enrollment by Age by Funding Source in Derby Center
Out of a total of 219 students who are enrolled in schools in Derby Center, 25 (11.4%) attend a private institution, while the remaining 194 (88.6%) are enrolled in public schools. The age group of 35 years and over has the highest likelihood of being enrolled in private schools, with 16 (100.0% in the age bracket) enrolled. Conversely, the age group of 15 to 17 year olds has the lowest likelihood of being enrolled in a private school, with 55 (100.0% in the age bracket) attending a public institution.
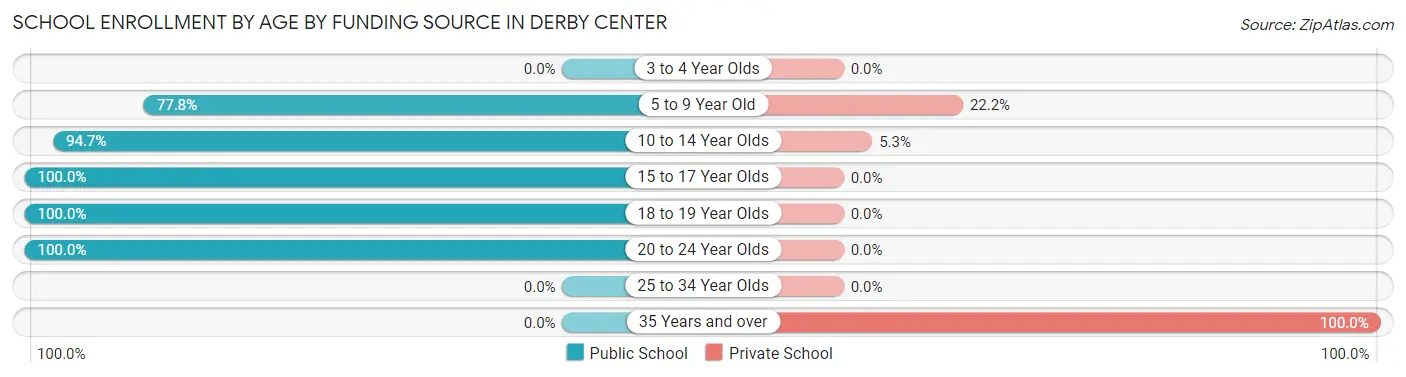
| Age Bracket | Public School | Private School |
| 3 to 4 Year Olds | 0 (0.0%) | 0 (0.0%) |
| 5 to 9 Year Old | 14 (77.8%) | 4 (22.2%) |
| 10 to 14 Year Olds | 89 (94.7%) | 5 (5.3%) |
| 15 to 17 Year Olds | 55 (100.0%) | 0 (0.0%) |
| 18 to 19 Year Olds | 22 (100.0%) | 0 (0.0%) |
| 20 to 24 Year Olds | 14 (100.0%) | 0 (0.0%) |
| 25 to 34 Year Olds | 0 (0.0%) | 0 (0.0%) |
| 35 Years and over | 0 (0.0%) | 16 (100.0%) |
| Total | 194 (88.6%) | 25 (11.4%) |
Educational Attainment by Field of Study in Derby Center
Literature & languages (40 | 37.0%), education (15 | 13.9%), liberal arts & history (15 | 13.9%), business (14 | 13.0%), and bio, nature & agricultural (9 | 8.3%) are the most common fields of study among 108 individuals in Derby Center who have obtained a bachelor's degree or higher.
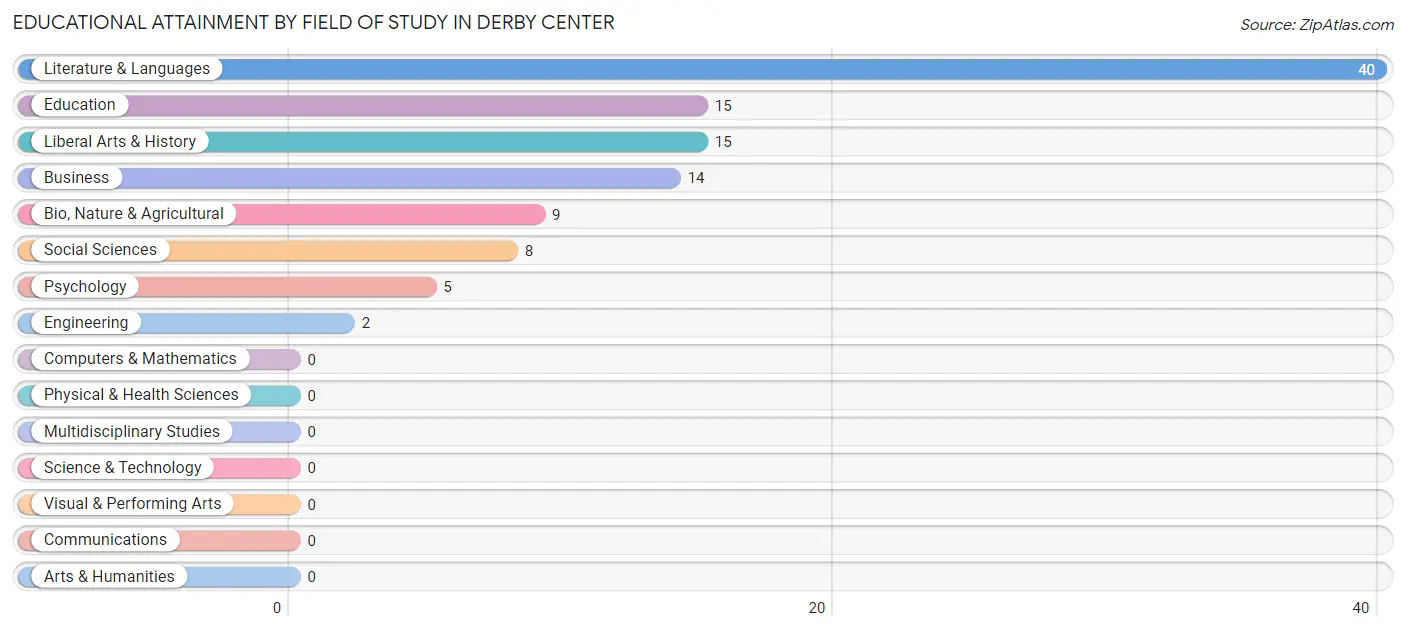
| Field of Study | # Graduates | % Graduates |
| Computers & Mathematics | 0 | 0.0% |
| Bio, Nature & Agricultural | 9 | 8.3% |
| Physical & Health Sciences | 0 | 0.0% |
| Psychology | 5 | 4.6% |
| Social Sciences | 8 | 7.4% |
| Engineering | 2 | 1.8% |
| Multidisciplinary Studies | 0 | 0.0% |
| Science & Technology | 0 | 0.0% |
| Business | 14 | 13.0% |
| Education | 15 | 13.9% |
| Literature & Languages | 40 | 37.0% |
| Liberal Arts & History | 15 | 13.9% |
| Visual & Performing Arts | 0 | 0.0% |
| Communications | 0 | 0.0% |
| Arts & Humanities | 0 | 0.0% |
| Total | 108 | 100.0% |
Transportation & Commute in Derby Center
Vehicle Availability by Sex in Derby Center
The most prevalent vehicle ownership categories in Derby Center are males with 2 vehicles (85, accounting for 49.4%) and females with 2 vehicles (87, making up 37.8%).
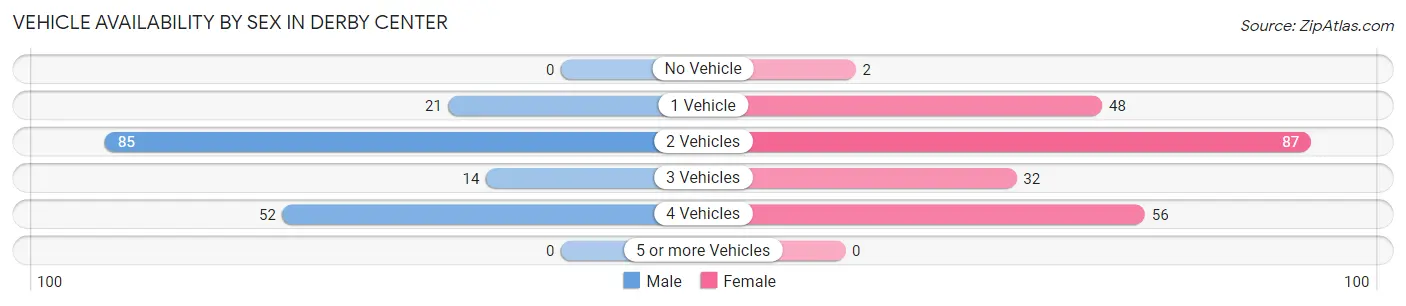
| Vehicles Available | Male | Female |
| No Vehicle | 0 (0.0%) | 2 (0.9%) |
| 1 Vehicle | 21 (12.2%) | 48 (21.3%) |
| 2 Vehicles | 85 (49.4%) | 87 (38.7%) |
| 3 Vehicles | 14 (8.1%) | 32 (14.2%) |
| 4 Vehicles | 52 (30.2%) | 56 (24.9%) |
| 5 or more Vehicles | 0 (0.0%) | 0 (0.0%) |
| Total | 172 (100.0%) | 225 (100.0%) |
Commute Time in Derby Center
The most frequently occuring commute durations in Derby Center are 10 to 14 minutes (83 commuters, 22.5%), less than 5 minutes (73 commuters, 19.8%), and 5 to 9 minutes (59 commuters, 16.0%).
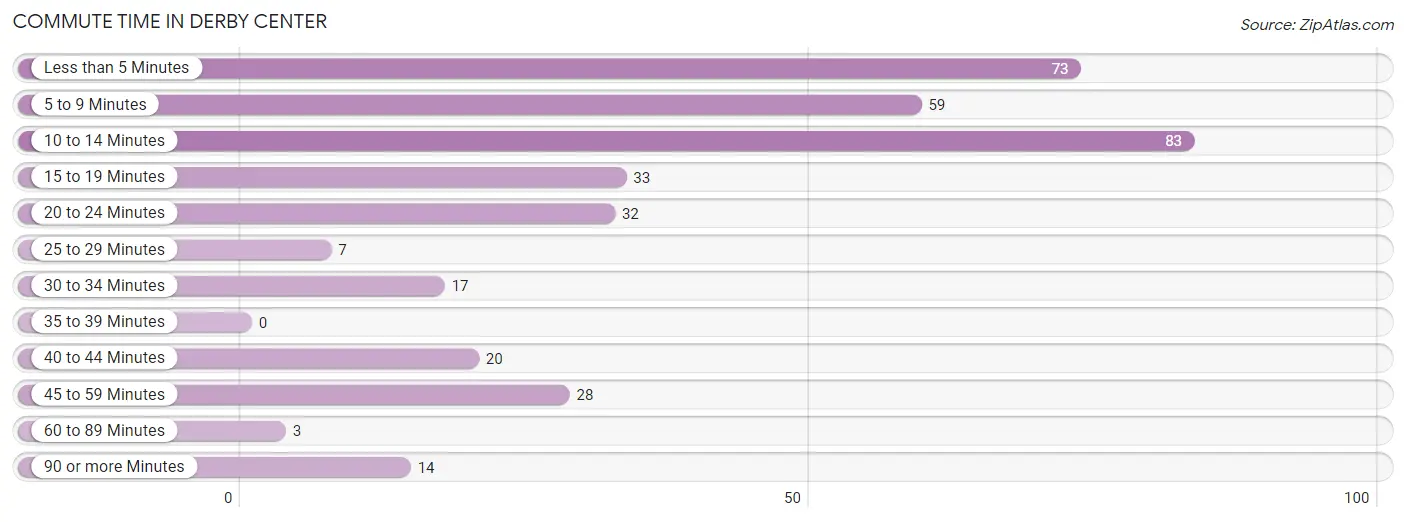
| Commute Time | # Commuters | % Commuters |
| Less than 5 Minutes | 73 | 19.8% |
| 5 to 9 Minutes | 59 | 16.0% |
| 10 to 14 Minutes | 83 | 22.5% |
| 15 to 19 Minutes | 33 | 8.9% |
| 20 to 24 Minutes | 32 | 8.7% |
| 25 to 29 Minutes | 7 | 1.9% |
| 30 to 34 Minutes | 17 | 4.6% |
| 35 to 39 Minutes | 0 | 0.0% |
| 40 to 44 Minutes | 20 | 5.4% |
| 45 to 59 Minutes | 28 | 7.6% |
| 60 to 89 Minutes | 3 | 0.8% |
| 90 or more Minutes | 14 | 3.8% |
Commute Time by Sex in Derby Center
The most common commute times in Derby Center are less than 5 minutes (57 commuters, 37.5%) for males and 5 to 9 minutes (57 commuters, 26.3%) for females.
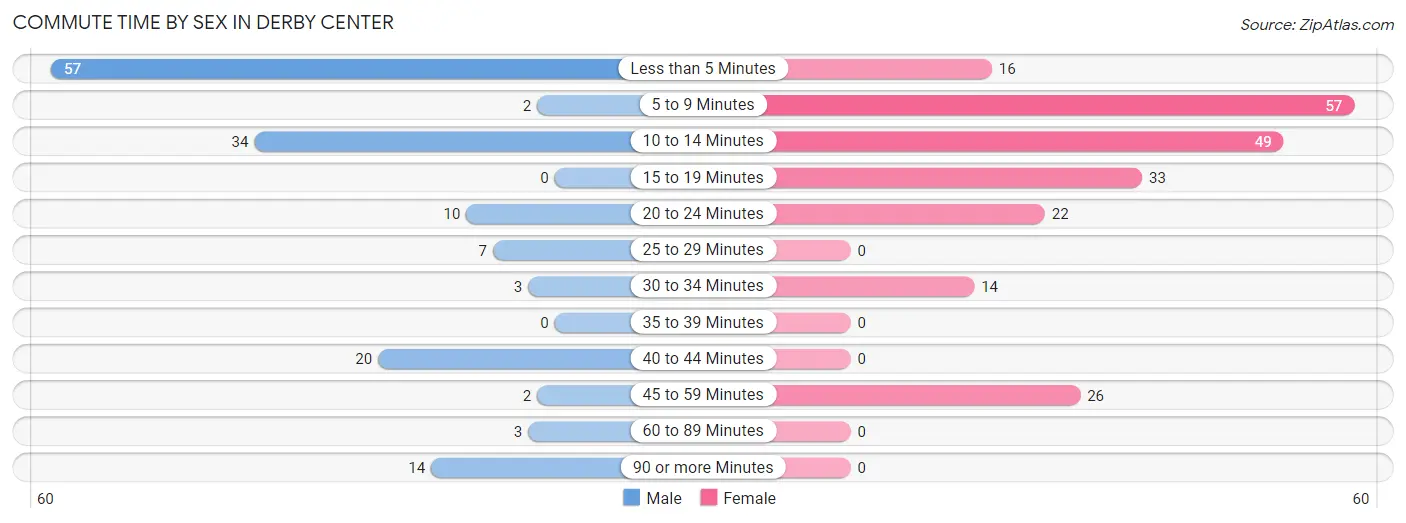
| Commute Time | Male | Female |
| Less than 5 Minutes | 57 (37.5%) | 16 (7.4%) |
| 5 to 9 Minutes | 2 (1.3%) | 57 (26.3%) |
| 10 to 14 Minutes | 34 (22.4%) | 49 (22.6%) |
| 15 to 19 Minutes | 0 (0.0%) | 33 (15.2%) |
| 20 to 24 Minutes | 10 (6.6%) | 22 (10.1%) |
| 25 to 29 Minutes | 7 (4.6%) | 0 (0.0%) |
| 30 to 34 Minutes | 3 (2.0%) | 14 (6.5%) |
| 35 to 39 Minutes | 0 (0.0%) | 0 (0.0%) |
| 40 to 44 Minutes | 20 (13.2%) | 0 (0.0%) |
| 45 to 59 Minutes | 2 (1.3%) | 26 (12.0%) |
| 60 to 89 Minutes | 3 (2.0%) | 0 (0.0%) |
| 90 or more Minutes | 14 (9.2%) | 0 (0.0%) |
Time of Departure to Work by Sex in Derby Center
The most frequent times of departure to work in Derby Center are 6:00 AM to 6:29 AM (86, 56.6%) for males and 6:00 AM to 6:29 AM (32, 14.7%) for females.
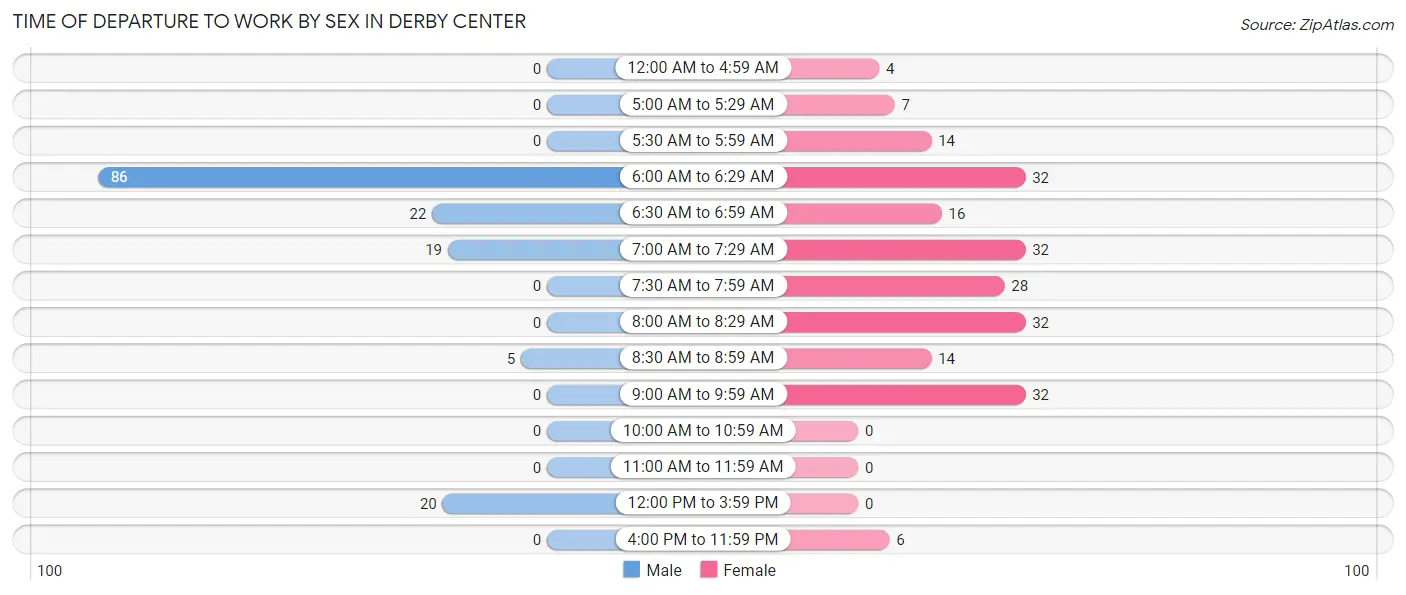
| Time of Departure | Male | Female |
| 12:00 AM to 4:59 AM | 0 (0.0%) | 4 (1.8%) |
| 5:00 AM to 5:29 AM | 0 (0.0%) | 7 (3.2%) |
| 5:30 AM to 5:59 AM | 0 (0.0%) | 14 (6.5%) |
| 6:00 AM to 6:29 AM | 86 (56.6%) | 32 (14.7%) |
| 6:30 AM to 6:59 AM | 22 (14.5%) | 16 (7.4%) |
| 7:00 AM to 7:29 AM | 19 (12.5%) | 32 (14.7%) |
| 7:30 AM to 7:59 AM | 0 (0.0%) | 28 (12.9%) |
| 8:00 AM to 8:29 AM | 0 (0.0%) | 32 (14.7%) |
| 8:30 AM to 8:59 AM | 5 (3.3%) | 14 (6.5%) |
| 9:00 AM to 9:59 AM | 0 (0.0%) | 32 (14.7%) |
| 10:00 AM to 10:59 AM | 0 (0.0%) | 0 (0.0%) |
| 11:00 AM to 11:59 AM | 0 (0.0%) | 0 (0.0%) |
| 12:00 PM to 3:59 PM | 20 (13.2%) | 0 (0.0%) |
| 4:00 PM to 11:59 PM | 0 (0.0%) | 6 (2.8%) |
| Total | 152 (100.0%) | 217 (100.0%) |
Housing Occupancy in Derby Center
Occupancy by Ownership in Derby Center
Of the total 317 dwellings in Derby Center, owner-occupied units account for 142 (44.8%), while renter-occupied units make up 175 (55.2%).
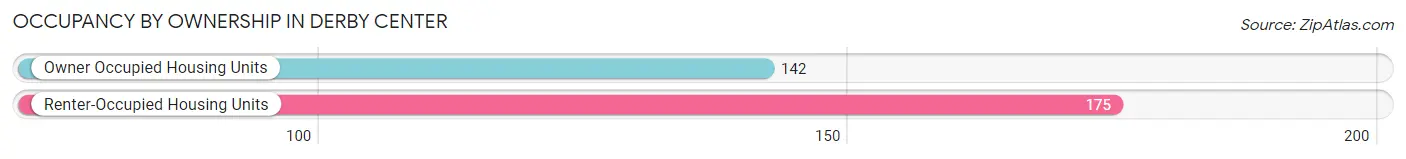
| Occupancy | # Housing Units | % Housing Units |
| Owner Occupied Housing Units | 142 | 44.8% |
| Renter-Occupied Housing Units | 175 | 55.2% |
| Total Occupied Housing Units | 317 | 100.0% |
Occupancy by Household Size in Derby Center
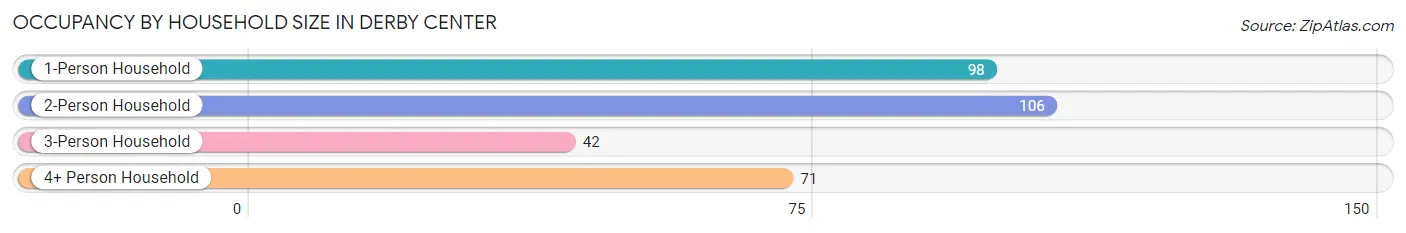
| Household Size | # Housing Units | % Housing Units |
| 1-Person Household | 98 | 30.9% |
| 2-Person Household | 106 | 33.4% |
| 3-Person Household | 42 | 13.3% |
| 4+ Person Household | 71 | 22.4% |
| Total Housing Units | 317 | 100.0% |
Occupancy by Ownership by Household Size in Derby Center
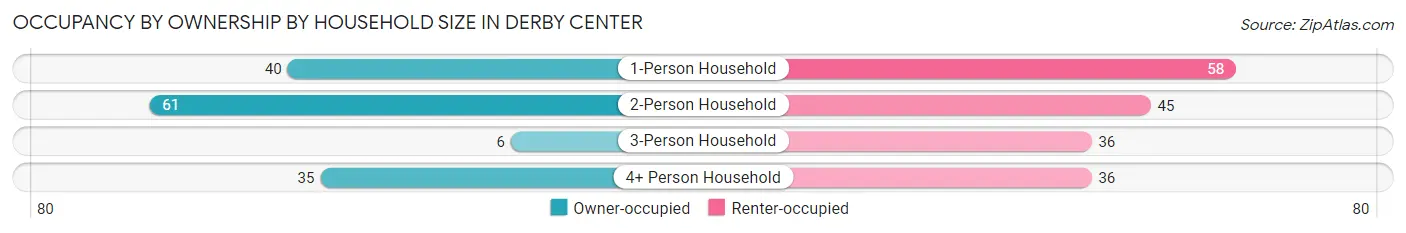
| Household Size | Owner-occupied | Renter-occupied |
| 1-Person Household | 40 (40.8%) | 58 (59.2%) |
| 2-Person Household | 61 (57.6%) | 45 (42.4%) |
| 3-Person Household | 6 (14.3%) | 36 (85.7%) |
| 4+ Person Household | 35 (49.3%) | 36 (50.7%) |
| Total Housing Units | 142 (44.8%) | 175 (55.2%) |
Occupancy by Educational Attainment in Derby Center
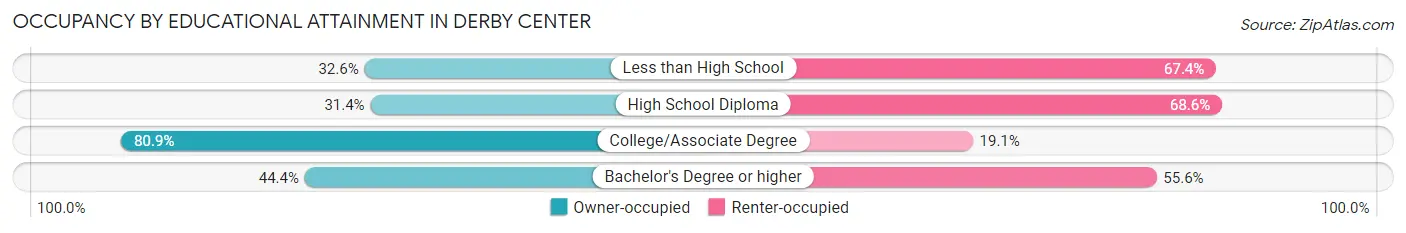
| Household Size | Owner-occupied | Renter-occupied |
| Less than High School | 15 (32.6%) | 31 (67.4%) |
| High School Diploma | 44 (31.4%) | 96 (68.6%) |
| College/Associate Degree | 55 (80.9%) | 13 (19.1%) |
| Bachelor's Degree or higher | 28 (44.4%) | 35 (55.6%) |
Occupancy by Age of Householder in Derby Center
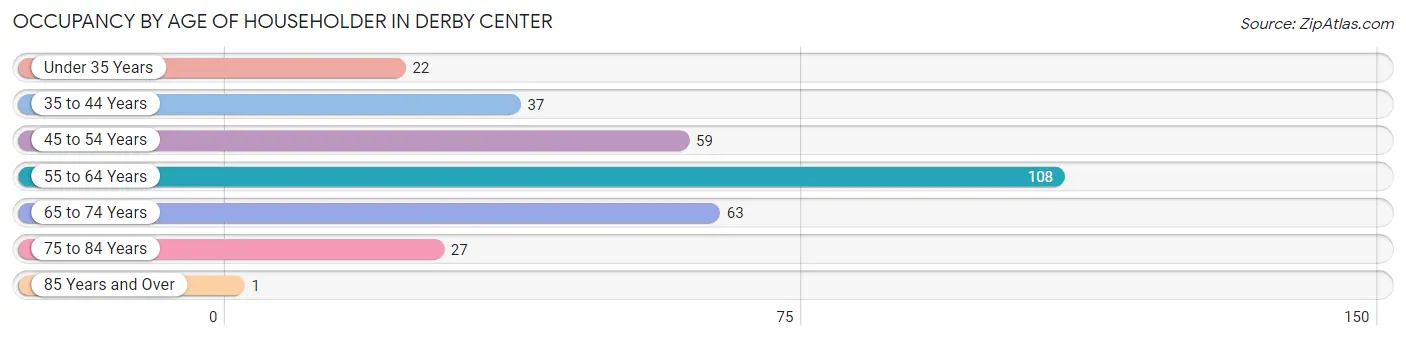
| Age Bracket | # Households | % Households |
| Under 35 Years | 22 | 6.9% |
| 35 to 44 Years | 37 | 11.7% |
| 45 to 54 Years | 59 | 18.6% |
| 55 to 64 Years | 108 | 34.1% |
| 65 to 74 Years | 63 | 19.9% |
| 75 to 84 Years | 27 | 8.5% |
| 85 Years and Over | 1 | 0.3% |
| Total | 317 | 100.0% |
Housing Finances in Derby Center
Median Income by Occupancy in Derby Center
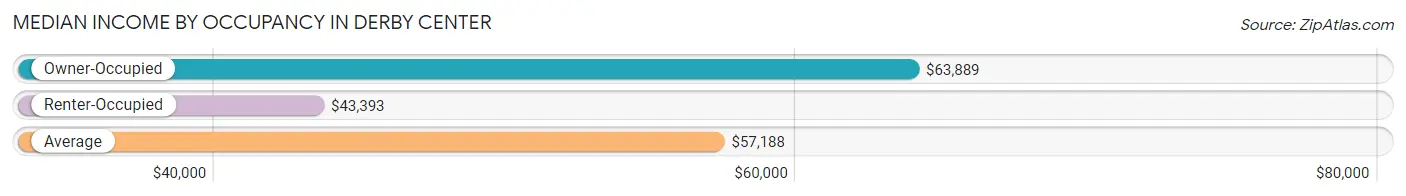
| Occupancy Type | # Households | Median Income |
| Owner-Occupied | 142 (44.8%) | $63,889 |
| Renter-Occupied | 175 (55.2%) | $43,393 |
| Average | 317 (100.0%) | $57,188 |
Occupancy by Householder Income Bracket in Derby Center
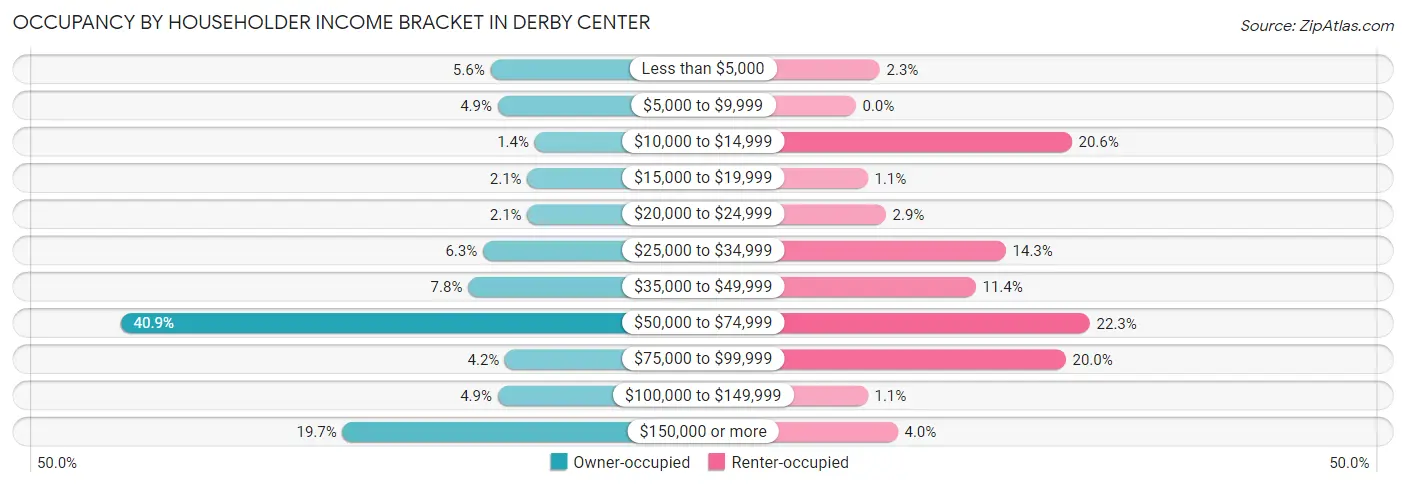
| Income Bracket | Owner-occupied | Renter-occupied |
| Less than $5,000 | 8 (5.6%) | 4 (2.3%) |
| $5,000 to $9,999 | 7 (4.9%) | 0 (0.0%) |
| $10,000 to $14,999 | 2 (1.4%) | 36 (20.6%) |
| $15,000 to $19,999 | 3 (2.1%) | 2 (1.1%) |
| $20,000 to $24,999 | 3 (2.1%) | 5 (2.9%) |
| $25,000 to $34,999 | 9 (6.3%) | 25 (14.3%) |
| $35,000 to $49,999 | 11 (7.7%) | 20 (11.4%) |
| $50,000 to $74,999 | 58 (40.8%) | 39 (22.3%) |
| $75,000 to $99,999 | 6 (4.2%) | 35 (20.0%) |
| $100,000 to $149,999 | 7 (4.9%) | 2 (1.1%) |
| $150,000 or more | 28 (19.7%) | 7 (4.0%) |
| Total | 142 (100.0%) | 175 (100.0%) |
Monthly Housing Cost Tiers in Derby Center
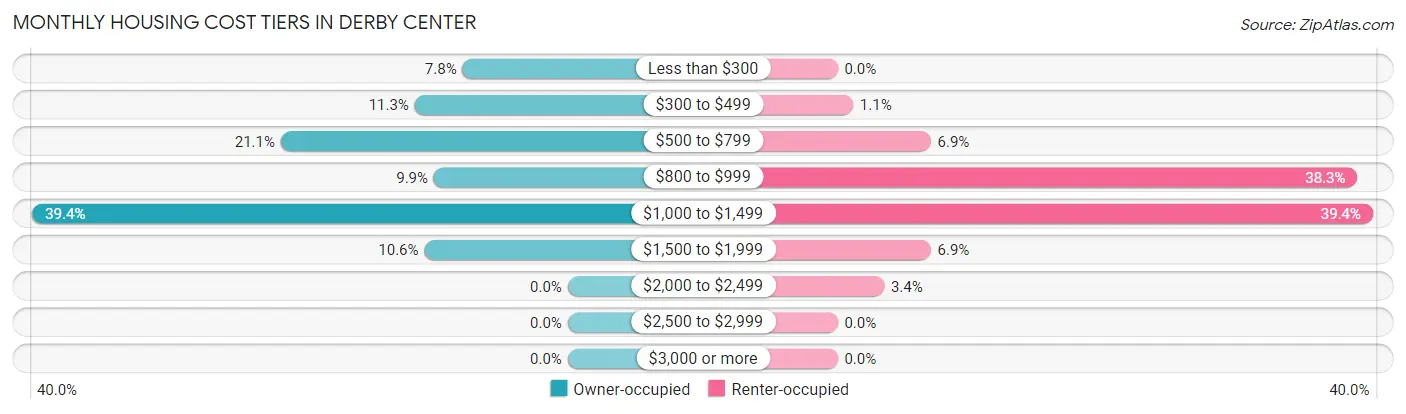
| Monthly Cost | Owner-occupied | Renter-occupied |
| Less than $300 | 11 (7.7%) | 0 (0.0%) |
| $300 to $499 | 16 (11.3%) | 2 (1.1%) |
| $500 to $799 | 30 (21.1%) | 12 (6.9%) |
| $800 to $999 | 14 (9.9%) | 67 (38.3%) |
| $1,000 to $1,499 | 56 (39.4%) | 69 (39.4%) |
| $1,500 to $1,999 | 15 (10.6%) | 12 (6.9%) |
| $2,000 to $2,499 | 0 (0.0%) | 6 (3.4%) |
| $2,500 to $2,999 | 0 (0.0%) | 0 (0.0%) |
| $3,000 or more | 0 (0.0%) | 0 (0.0%) |
| Total | 142 (100.0%) | 175 (100.0%) |
Physical Housing Characteristics in Derby Center
Housing Structures in Derby Center
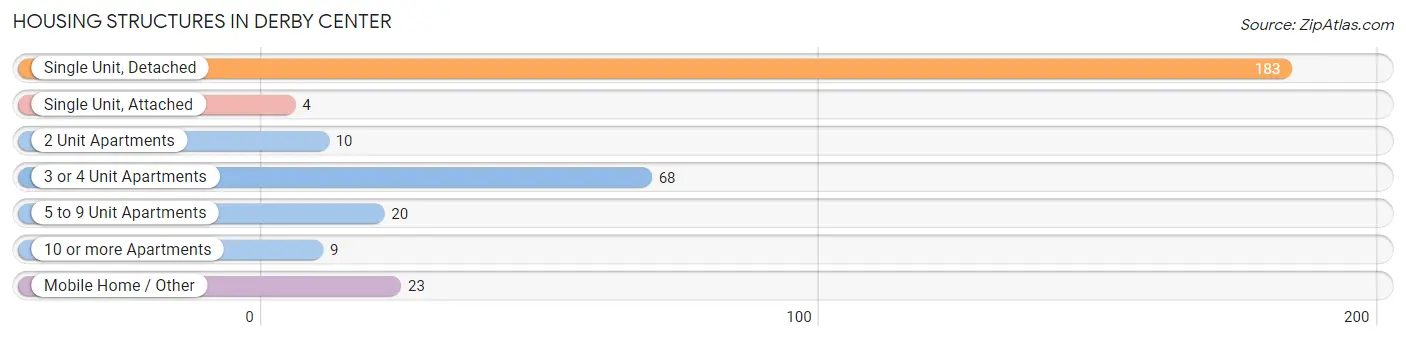
| Structure Type | # Housing Units | % Housing Units |
| Single Unit, Detached | 183 | 57.7% |
| Single Unit, Attached | 4 | 1.3% |
| 2 Unit Apartments | 10 | 3.2% |
| 3 or 4 Unit Apartments | 68 | 21.4% |
| 5 to 9 Unit Apartments | 20 | 6.3% |
| 10 or more Apartments | 9 | 2.8% |
| Mobile Home / Other | 23 | 7.3% |
| Total | 317 | 100.0% |
Housing Structures by Occupancy in Derby Center
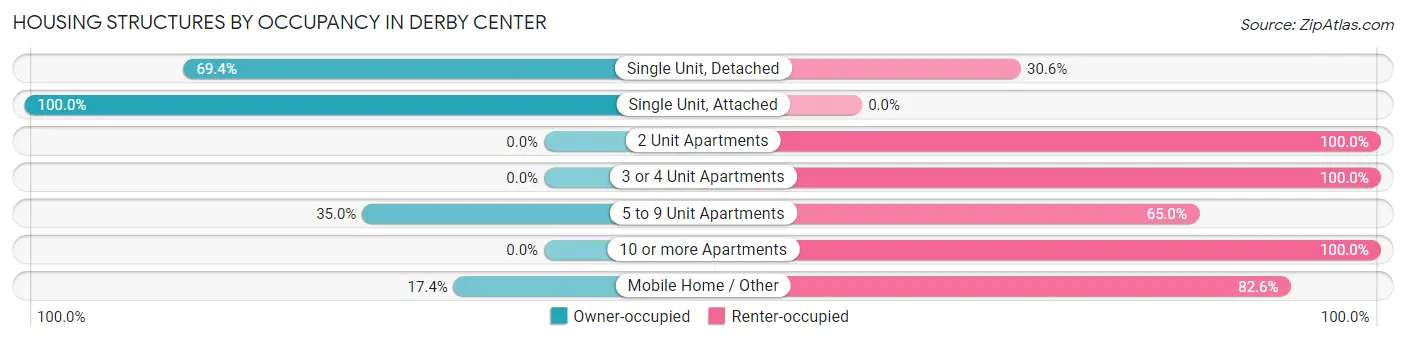
| Structure Type | Owner-occupied | Renter-occupied |
| Single Unit, Detached | 127 (69.4%) | 56 (30.6%) |
| Single Unit, Attached | 4 (100.0%) | 0 (0.0%) |
| 2 Unit Apartments | 0 (0.0%) | 10 (100.0%) |
| 3 or 4 Unit Apartments | 0 (0.0%) | 68 (100.0%) |
| 5 to 9 Unit Apartments | 7 (35.0%) | 13 (65.0%) |
| 10 or more Apartments | 0 (0.0%) | 9 (100.0%) |
| Mobile Home / Other | 4 (17.4%) | 19 (82.6%) |
| Total | 142 (44.8%) | 175 (55.2%) |
Housing Structures by Number of Rooms in Derby Center
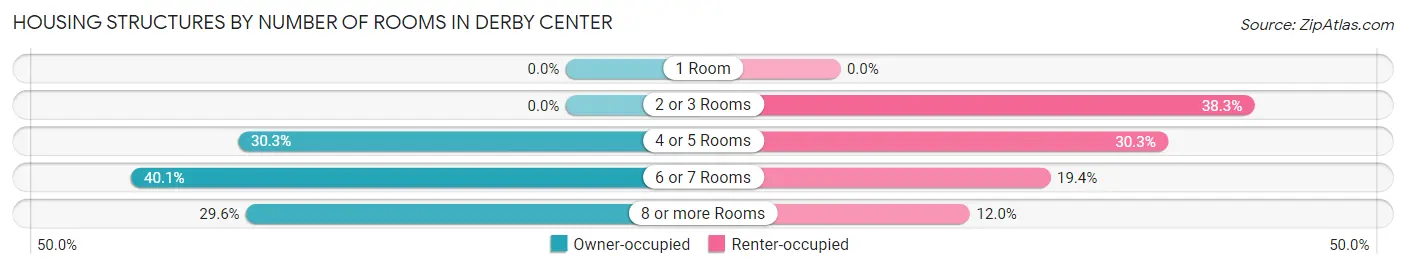
| Number of Rooms | Owner-occupied | Renter-occupied |
| 1 Room | 0 (0.0%) | 0 (0.0%) |
| 2 or 3 Rooms | 0 (0.0%) | 67 (38.3%) |
| 4 or 5 Rooms | 43 (30.3%) | 53 (30.3%) |
| 6 or 7 Rooms | 57 (40.1%) | 34 (19.4%) |
| 8 or more Rooms | 42 (29.6%) | 21 (12.0%) |
| Total | 142 (100.0%) | 175 (100.0%) |
Housing Structure by Heating Type in Derby Center
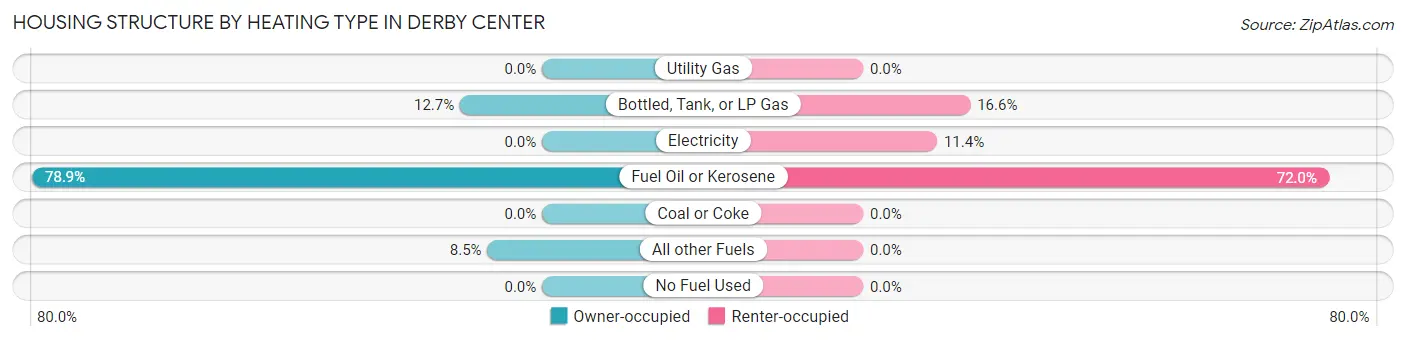
| Heating Type | Owner-occupied | Renter-occupied |
| Utility Gas | 0 (0.0%) | 0 (0.0%) |
| Bottled, Tank, or LP Gas | 18 (12.7%) | 29 (16.6%) |
| Electricity | 0 (0.0%) | 20 (11.4%) |
| Fuel Oil or Kerosene | 112 (78.9%) | 126 (72.0%) |
| Coal or Coke | 0 (0.0%) | 0 (0.0%) |
| All other Fuels | 12 (8.5%) | 0 (0.0%) |
| No Fuel Used | 0 (0.0%) | 0 (0.0%) |
| Total | 142 (100.0%) | 175 (100.0%) |
Household Vehicle Usage in Derby Center
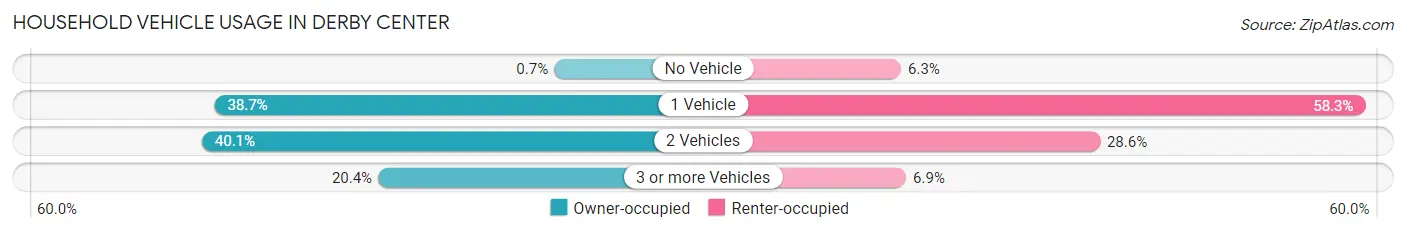
| Vehicles per Household | Owner-occupied | Renter-occupied |
| No Vehicle | 1 (0.7%) | 11 (6.3%) |
| 1 Vehicle | 55 (38.7%) | 102 (58.3%) |
| 2 Vehicles | 57 (40.1%) | 50 (28.6%) |
| 3 or more Vehicles | 29 (20.4%) | 12 (6.9%) |
| Total | 142 (100.0%) | 175 (100.0%) |
Real Estate & Mortgages in Derby Center
Real Estate and Mortgage Overview in Derby Center
| Characteristic | Without Mortgage | With Mortgage |
| Housing Units | 57 | 85 |
| Median Property Value | $164,800 | $227,000 |
| Median Household Income | $63,750 | $23 |
| Monthly Housing Costs | $517 | $0 |
| Real Estate Taxes | $2,587 | $0 |
Property Value by Mortgage Status in Derby Center
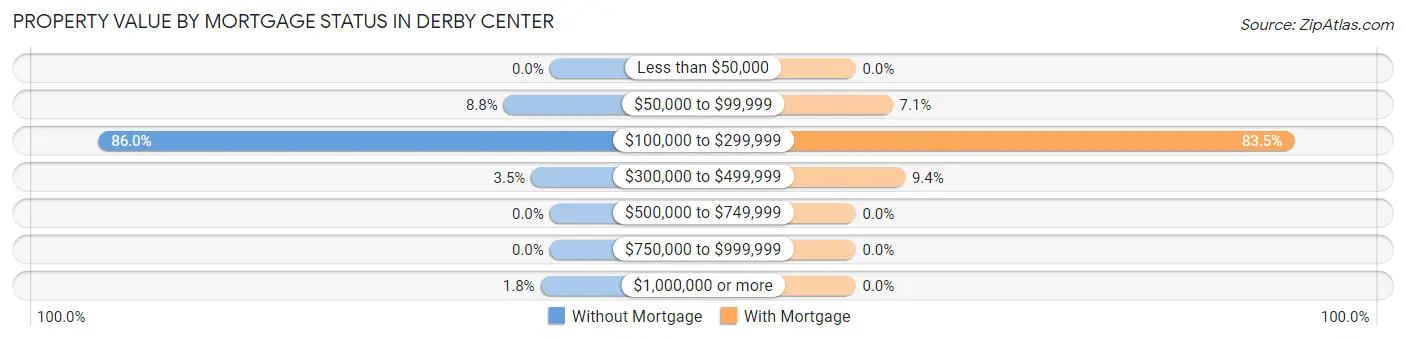
| Property Value | Without Mortgage | With Mortgage |
| Less than $50,000 | 0 (0.0%) | 0 (0.0%) |
| $50,000 to $99,999 | 5 (8.8%) | 6 (7.1%) |
| $100,000 to $299,999 | 49 (86.0%) | 71 (83.5%) |
| $300,000 to $499,999 | 2 (3.5%) | 8 (9.4%) |
| $500,000 to $749,999 | 0 (0.0%) | 0 (0.0%) |
| $750,000 to $999,999 | 0 (0.0%) | 0 (0.0%) |
| $1,000,000 or more | 1 (1.8%) | 0 (0.0%) |
| Total | 57 (100.0%) | 85 (100.0%) |
Household Income by Mortgage Status in Derby Center
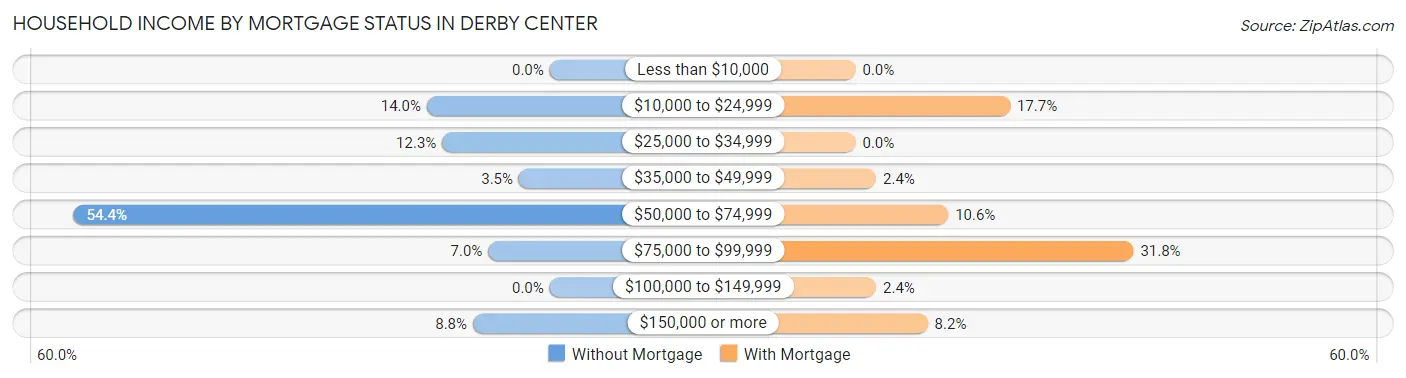
| Household Income | Without Mortgage | With Mortgage |
| Less than $10,000 | 0 (0.0%) | 0 (0.0%) |
| $10,000 to $24,999 | 8 (14.0%) | 15 (17.6%) |
| $25,000 to $34,999 | 7 (12.3%) | 0 (0.0%) |
| $35,000 to $49,999 | 2 (3.5%) | 2 (2.4%) |
| $50,000 to $74,999 | 31 (54.4%) | 9 (10.6%) |
| $75,000 to $99,999 | 4 (7.0%) | 27 (31.8%) |
| $100,000 to $149,999 | 0 (0.0%) | 2 (2.4%) |
| $150,000 or more | 5 (8.8%) | 7 (8.2%) |
| Total | 57 (100.0%) | 85 (100.0%) |
Property Value to Household Income Ratio in Derby Center
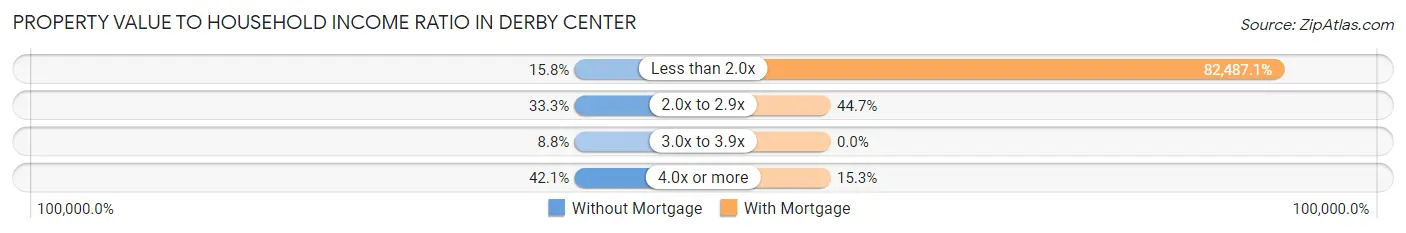
| Value-to-Income Ratio | Without Mortgage | With Mortgage |
| Less than 2.0x | 9 (15.8%) | 70,114 (82,487.1%) |
| 2.0x to 2.9x | 19 (33.3%) | 38 (44.7%) |
| 3.0x to 3.9x | 5 (8.8%) | 0 (0.0%) |
| 4.0x or more | 24 (42.1%) | 13 (15.3%) |
| Total | 57 (100.0%) | 85 (100.0%) |
Real Estate Taxes by Mortgage Status in Derby Center
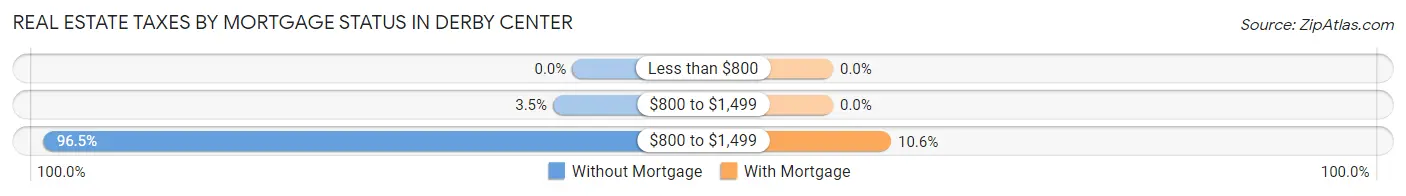
| Property Taxes | Without Mortgage | With Mortgage |
| Less than $800 | 0 (0.0%) | 0 (0.0%) |
| $800 to $1,499 | 2 (3.5%) | 0 (0.0%) |
| $800 to $1,499 | 55 (96.5%) | 9 (10.6%) |
| Total | 57 (100.0%) | 85 (100.0%) |
Health & Disability in Derby Center
Health Insurance Coverage by Age in Derby Center
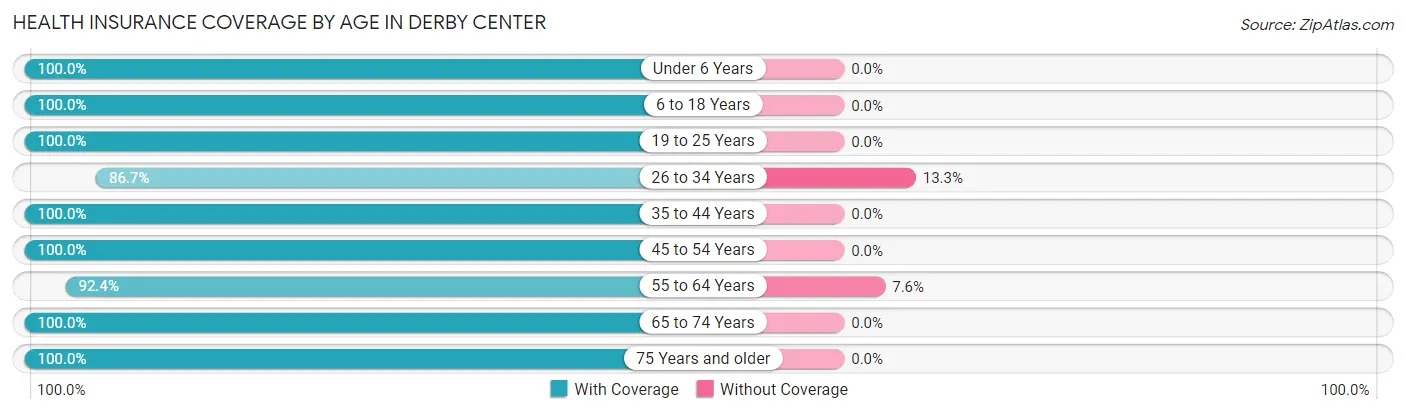
| Age Bracket | With Coverage | Without Coverage |
| Under 6 Years | 18 (100.0%) | 0 (0.0%) |
| 6 to 18 Years | 198 (100.0%) | 0 (0.0%) |
| 19 to 25 Years | 32 (100.0%) | 0 (0.0%) |
| 26 to 34 Years | 26 (86.7%) | 4 (13.3%) |
| 35 to 44 Years | 89 (100.0%) | 0 (0.0%) |
| 45 to 54 Years | 110 (100.0%) | 0 (0.0%) |
| 55 to 64 Years | 133 (92.4%) | 11 (7.6%) |
| 65 to 74 Years | 113 (100.0%) | 0 (0.0%) |
| 75 Years and older | 46 (100.0%) | 0 (0.0%) |
| Total | 765 (98.1%) | 15 (1.9%) |
Health Insurance Coverage by Citizenship Status in Derby Center
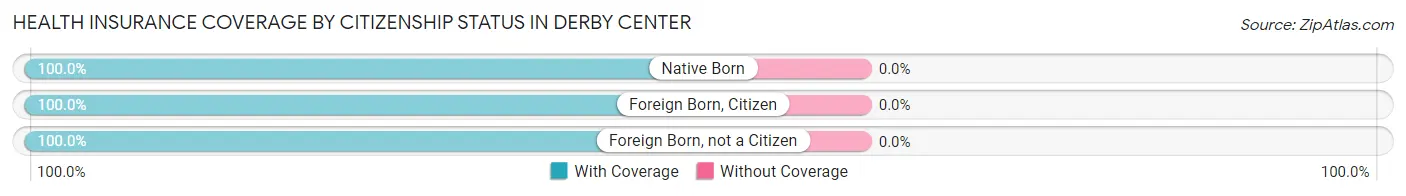
| Citizenship Status | With Coverage | Without Coverage |
| Native Born | 18 (100.0%) | 0 (0.0%) |
| Foreign Born, Citizen | 198 (100.0%) | 0 (0.0%) |
| Foreign Born, not a Citizen | 32 (100.0%) | 0 (0.0%) |
Health Insurance Coverage by Household Income in Derby Center
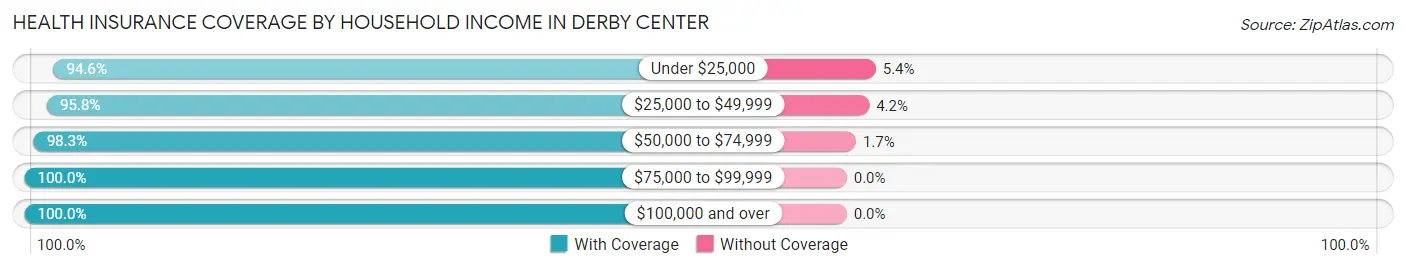
| Household Income | With Coverage | Without Coverage |
| Under $25,000 | 87 (94.6%) | 5 (5.4%) |
| $25,000 to $49,999 | 114 (95.8%) | 5 (4.2%) |
| $50,000 to $74,999 | 286 (98.3%) | 5 (1.7%) |
| $75,000 to $99,999 | 97 (100.0%) | 0 (0.0%) |
| $100,000 and over | 181 (100.0%) | 0 (0.0%) |
Public vs Private Health Insurance Coverage by Age in Derby Center
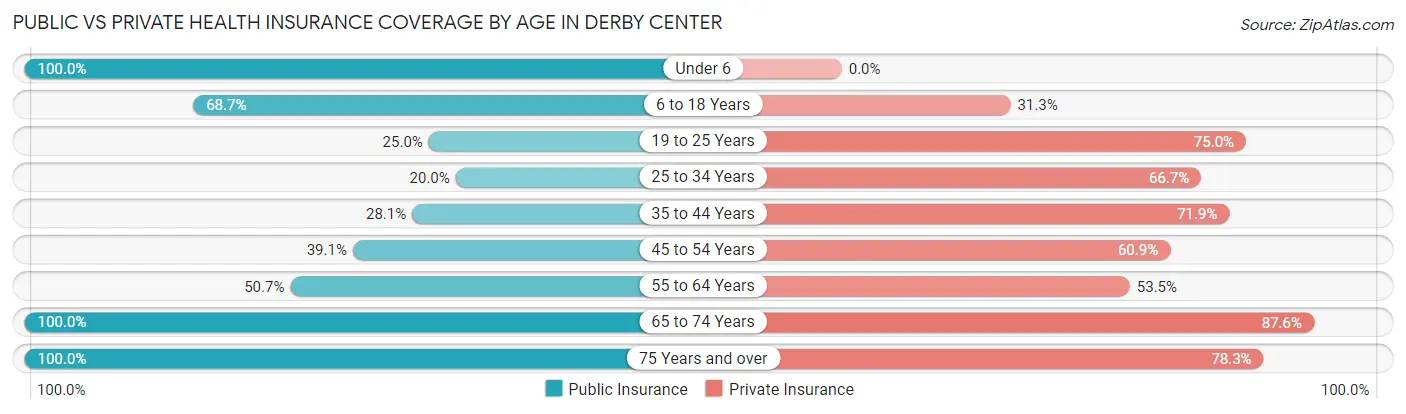
| Age Bracket | Public Insurance | Private Insurance |
| Under 6 | 18 (100.0%) | 0 (0.0%) |
| 6 to 18 Years | 136 (68.7%) | 62 (31.3%) |
| 19 to 25 Years | 8 (25.0%) | 24 (75.0%) |
| 25 to 34 Years | 6 (20.0%) | 20 (66.7%) |
| 35 to 44 Years | 25 (28.1%) | 64 (71.9%) |
| 45 to 54 Years | 43 (39.1%) | 67 (60.9%) |
| 55 to 64 Years | 73 (50.7%) | 77 (53.5%) |
| 65 to 74 Years | 113 (100.0%) | 99 (87.6%) |
| 75 Years and over | 46 (100.0%) | 36 (78.3%) |
| Total | 468 (60.0%) | 449 (57.6%) |
Disability Status by Sex by Age in Derby Center
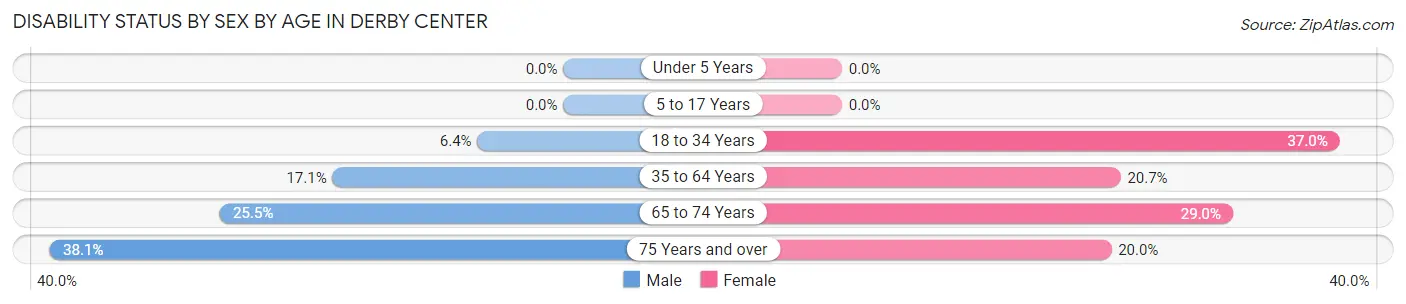
| Age Bracket | Male | Female |
| Under 5 Years | 0 (0.0%) | 0 (0.0%) |
| 5 to 17 Years | 0 (0.0%) | 0 (0.0%) |
| 18 to 34 Years | 3 (6.4%) | 17 (37.0%) |
| 35 to 64 Years | 24 (17.1%) | 42 (20.7%) |
| 65 to 74 Years | 13 (25.5%) | 18 (29.0%) |
| 75 Years and over | 8 (38.1%) | 5 (20.0%) |
Disability Class by Sex by Age in Derby Center
Disability Class: Hearing Difficulty
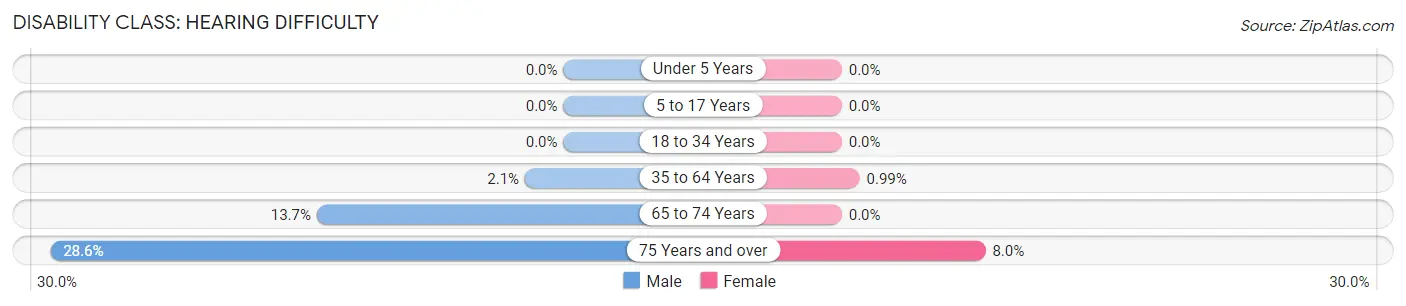
| Age Bracket | Male | Female |
| Under 5 Years | 0 (0.0%) | 0 (0.0%) |
| 5 to 17 Years | 0 (0.0%) | 0 (0.0%) |
| 18 to 34 Years | 0 (0.0%) | 0 (0.0%) |
| 35 to 64 Years | 3 (2.1%) | 2 (1.0%) |
| 65 to 74 Years | 7 (13.7%) | 0 (0.0%) |
| 75 Years and over | 6 (28.6%) | 2 (8.0%) |
Disability Class: Vision Difficulty
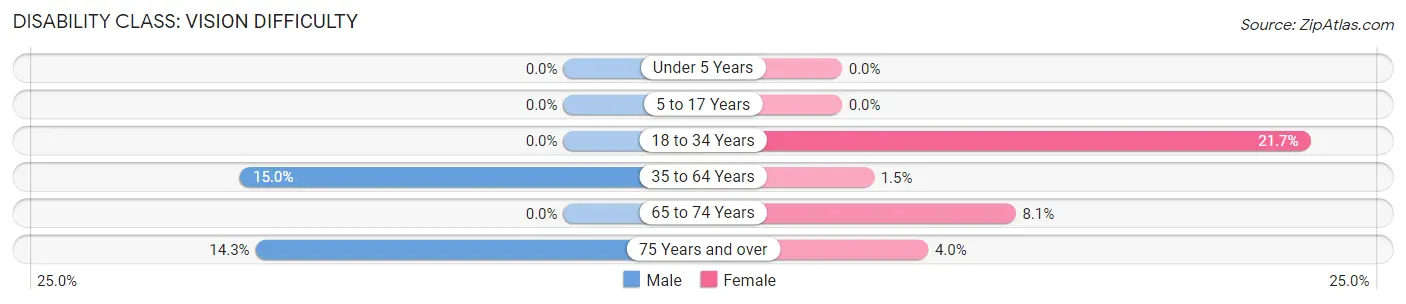
| Age Bracket | Male | Female |
| Under 5 Years | 0 (0.0%) | 0 (0.0%) |
| 5 to 17 Years | 0 (0.0%) | 0 (0.0%) |
| 18 to 34 Years | 0 (0.0%) | 10 (21.7%) |
| 35 to 64 Years | 21 (15.0%) | 3 (1.5%) |
| 65 to 74 Years | 0 (0.0%) | 5 (8.1%) |
| 75 Years and over | 3 (14.3%) | 1 (4.0%) |
Disability Class: Cognitive Difficulty
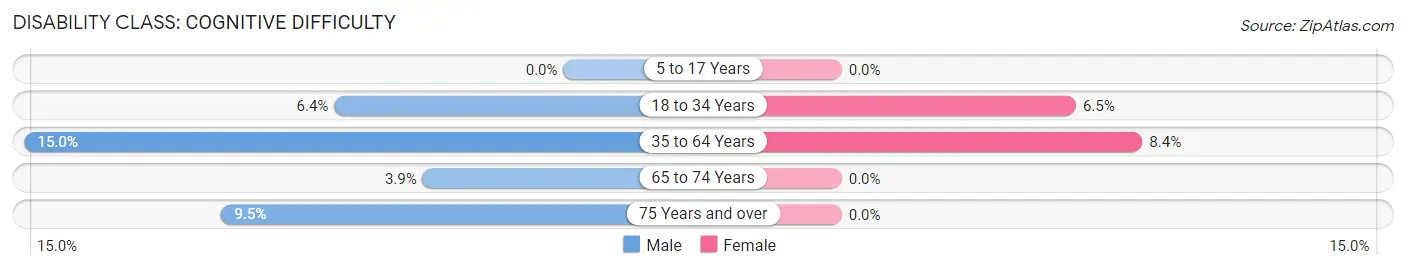
| Age Bracket | Male | Female |
| 5 to 17 Years | 0 (0.0%) | 0 (0.0%) |
| 18 to 34 Years | 3 (6.4%) | 3 (6.5%) |
| 35 to 64 Years | 21 (15.0%) | 17 (8.4%) |
| 65 to 74 Years | 2 (3.9%) | 0 (0.0%) |
| 75 Years and over | 2 (9.5%) | 0 (0.0%) |
Disability Class: Ambulatory Difficulty
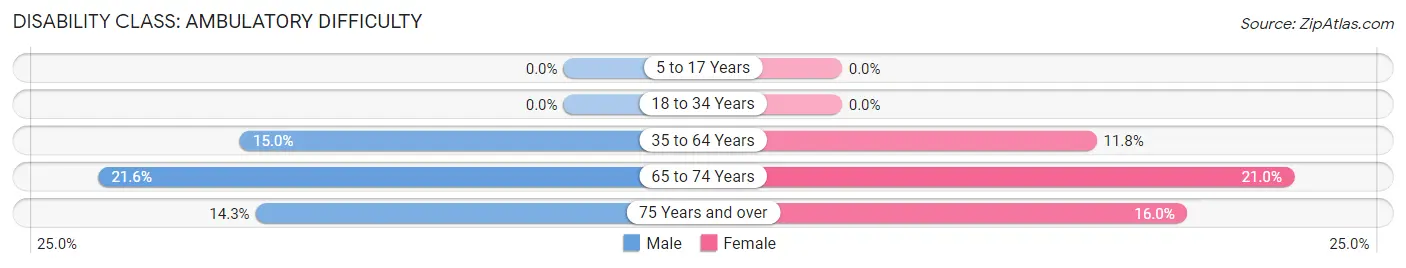
| Age Bracket | Male | Female |
| 5 to 17 Years | 0 (0.0%) | 0 (0.0%) |
| 18 to 34 Years | 0 (0.0%) | 0 (0.0%) |
| 35 to 64 Years | 21 (15.0%) | 24 (11.8%) |
| 65 to 74 Years | 11 (21.6%) | 13 (21.0%) |
| 75 Years and over | 3 (14.3%) | 4 (16.0%) |
Disability Class: Self-Care Difficulty
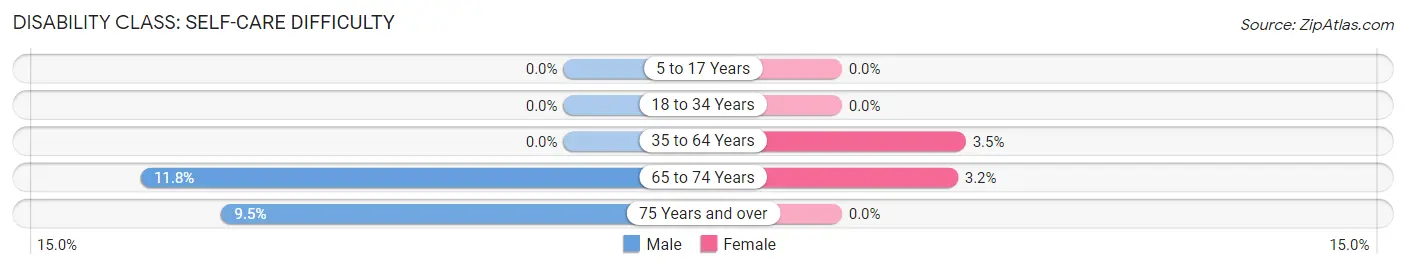
| Age Bracket | Male | Female |
| 5 to 17 Years | 0 (0.0%) | 0 (0.0%) |
| 18 to 34 Years | 0 (0.0%) | 0 (0.0%) |
| 35 to 64 Years | 0 (0.0%) | 7 (3.5%) |
| 65 to 74 Years | 6 (11.8%) | 2 (3.2%) |
| 75 Years and over | 2 (9.5%) | 0 (0.0%) |
Technology Access in Derby Center
Computing Device Access in Derby Center
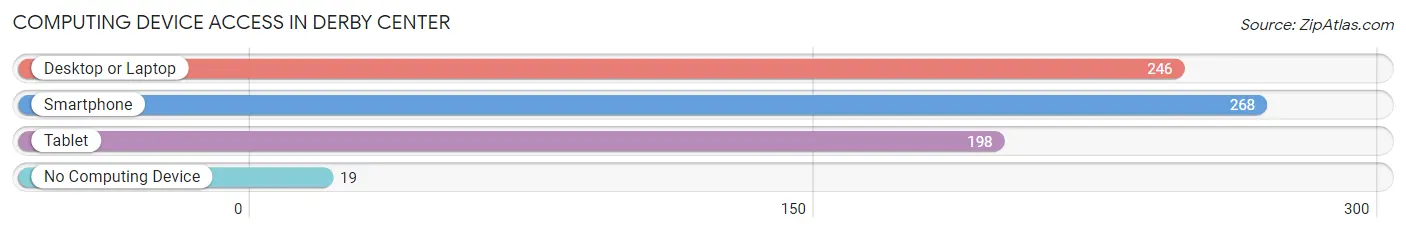
| Device Type | # Households | % Households |
| Desktop or Laptop | 246 | 77.6% |
| Smartphone | 268 | 84.5% |
| Tablet | 198 | 62.5% |
| No Computing Device | 19 | 6.0% |
| Total | 317 | 100.0% |
Internet Access in Derby Center
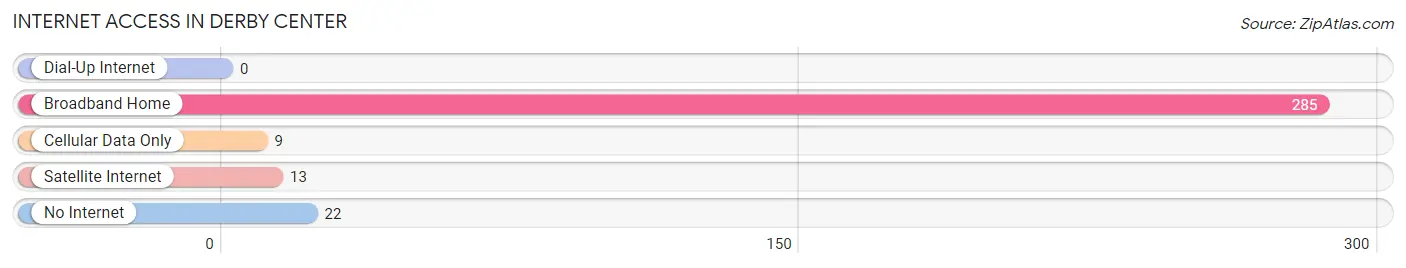
| Internet Type | # Households | % Households |
| Dial-Up Internet | 0 | 0.0% |
| Broadband Home | 285 | 89.9% |
| Cellular Data Only | 9 | 2.8% |
| Satellite Internet | 13 | 4.1% |
| No Internet | 22 | 6.9% |
| Total | 317 | 100.0% |
Derby Center Summary
Derby Center is a small unincorporated village located in the town of Derby, Vermont. It is situated in the northern part of the state, in Orleans County, and is part of the larger Northeast Kingdom region. The village is home to a population of approximately 500 people, and is the commercial and cultural center of the town.
History
Derby Center was first settled in 1790 by a group of settlers from Massachusetts. The village was originally known as “Derbytown”, and was named after the town of Derby, Connecticut, from which many of the settlers had come. The village was incorporated in 1810, and was the first town in Orleans County to be incorporated.
In the early 19th century, Derby Center was a thriving agricultural and industrial center. The village was home to several mills, including a sawmill, gristmill, and a woolen mill. The village also had a blacksmith shop, a tannery, and a general store.
In the late 19th century, the village began to decline as the mills closed and the population began to move away. The village was revitalized in the early 20th century, when the Derby Center Electric Company was established in 1906. The company provided electricity to the village, and the surrounding area, and helped to spur economic growth.
Geography
Derby Center is located in the northern part of Vermont, in Orleans County. The village is situated in the valley of the Missisquoi River, and is surrounded by the Green Mountains. The village is located approximately 25 miles north of Montpelier, the state capital, and is about an hour’s drive from Burlington, the largest city in the state.
The village is located in a rural area, and is surrounded by farmland and forests. The nearest major city is St. Johnsbury, which is about 20 miles away. The village is also close to several ski resorts, including Jay Peak and Burke Mountain.
Economy
Derby Center is a small, rural village, and the economy is largely based on agriculture and tourism. The village is home to several small businesses, including a general store, a hardware store, and a restaurant. The village is also home to a small manufacturing plant, which produces plastic products.
The village is also home to several farms, which produce a variety of crops, including corn, hay, and vegetables. The village is also home to several small businesses, which provide services to the local community, such as auto repair, plumbing, and electrical services.
Demographics
As of the 2010 census, the population of Derby Center was 498. The population is largely white (97.2%), with a small minority population (2.8%). The median age of the population is 44.7 years, and the median household income is $45,000. The village is home to a small number of immigrants, mostly from Mexico and Central America.
Conclusion
Derby Center is a small, rural village located in the northern part of Vermont. The village is home to a population of approximately 500 people, and is the commercial and cultural center of the town. The economy of the village is largely based on agriculture and tourism, and the village is home to several small businesses. The population of the village is largely white, with a small minority population.
Common Questions
What is Per Capita Income in Derby Center?
Per Capita income in Derby Center is $26,918.
What is the Median Family Income in Derby Center?
Median Family Income in Derby Center is $70,625.
What is the Median Household income in Derby Center?
Median Household Income in Derby Center is $57,188.
What is Income or Wage Gap in Derby Center?
Income or Wage Gap in Derby Center is 50.9%.
Women in Derby Center earn 49.1 cents for every dollar earned by a man.
What is Inequality or Gini Index in Derby Center?
Inequality or Gini Index in Derby Center is 0.43.
What is the Total Population of Derby Center?
Total Population of Derby Center is 802.
What is the Total Male Population of Derby Center?
Total Male Population of Derby Center is 339.
What is the Total Female Population of Derby Center?
Total Female Population of Derby Center is 463.
What is the Ratio of Males per 100 Females in Derby Center?
There are 73.22 Males per 100 Females in Derby Center.
What is the Ratio of Females per 100 Males in Derby Center?
There are 136.58 Females per 100 Males in Derby Center.
What is the Median Population Age in Derby Center?
Median Population Age in Derby Center is 45.4 Years.
What is the Average Family Size in Derby Center
Average Family Size in Derby Center is 2.9 People.
What is the Average Household Size in Derby Center
Average Household Size in Derby Center is 2.5 People.
How Large is the Labor Force in Derby Center?
There are 414 People in the Labor Forcein in Derby Center.
What is the Percentage of People in the Labor Force in Derby Center?
62.8% of People are in the Labor Force in Derby Center.
What is the Unemployment Rate in Derby Center?
Unemployment Rate in Derby Center is 2.9%.