Ludlow, VT Map & Demographics
Ludlow Map
Ludlow Overview
$43,620
PER CAPITA INCOME
$73,750
AVG FAMILY INCOME
$48,413
AVG HOUSEHOLD INCOME
25.9%
WAGE / INCOME GAP [ % ]
74.1¢/ $1
WAGE / INCOME GAP [ $ ]
0.56
INEQUALITY / GINI INDEX
711
TOTAL POPULATION
324
MALE POPULATION
387
FEMALE POPULATION
83.72
MALES / 100 FEMALES
119.44
FEMALES / 100 MALES
48.1
MEDIAN AGE
2.6
AVG FAMILY SIZE
1.8
AVG HOUSEHOLD SIZE
397
LABOR FORCE [ PEOPLE ]
62.1%
PERCENT IN LABOR FORCE
3.5%
UNEMPLOYMENT RATE
Ludlow Zip Codes
Ludlow Area Codes
Income in Ludlow
Income Overview in Ludlow
Per Capita Income in Ludlow is $43,620, while median incomes of families and households are $73,750 and $48,413 respectively.
| Characteristic | Number | Measure |
| Per Capita Income | 711 | $43,620 |
| Median Family Income | 156 | $73,750 |
| Mean Family Income | 156 | $140,419 |
| Median Household Income | 357 | $48,413 |
| Mean Household Income | 357 | $85,803 |
| Income Deficit | 156 | $0 |
| Wage / Income Gap (%) | 711 | 25.85% |
| Wage / Income Gap ($) | 711 | 74.15¢ per $1 |
| Gini / Inequality Index | 711 | 0.56 |
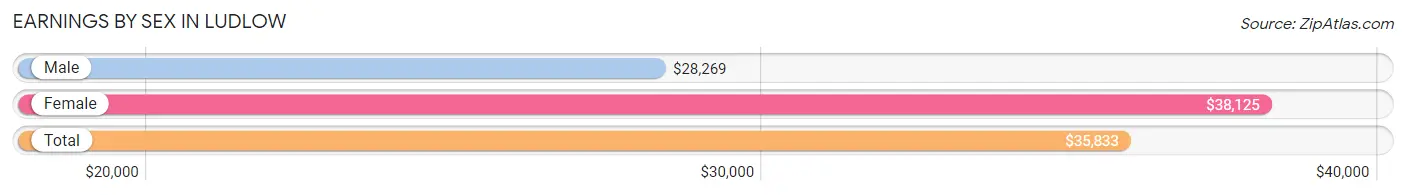
Earnings by Sex in Ludlow
Average Earnings in Ludlow are $35,833, $28,269 for men and $38,125 for women, a difference of 25.9%.
| Sex | Number | Average Earnings |
| Male | 182 (44.6%) | $28,269 |
| Female | 226 (55.4%) | $38,125 |
| Total | 408 (100.0%) | $35,833 |
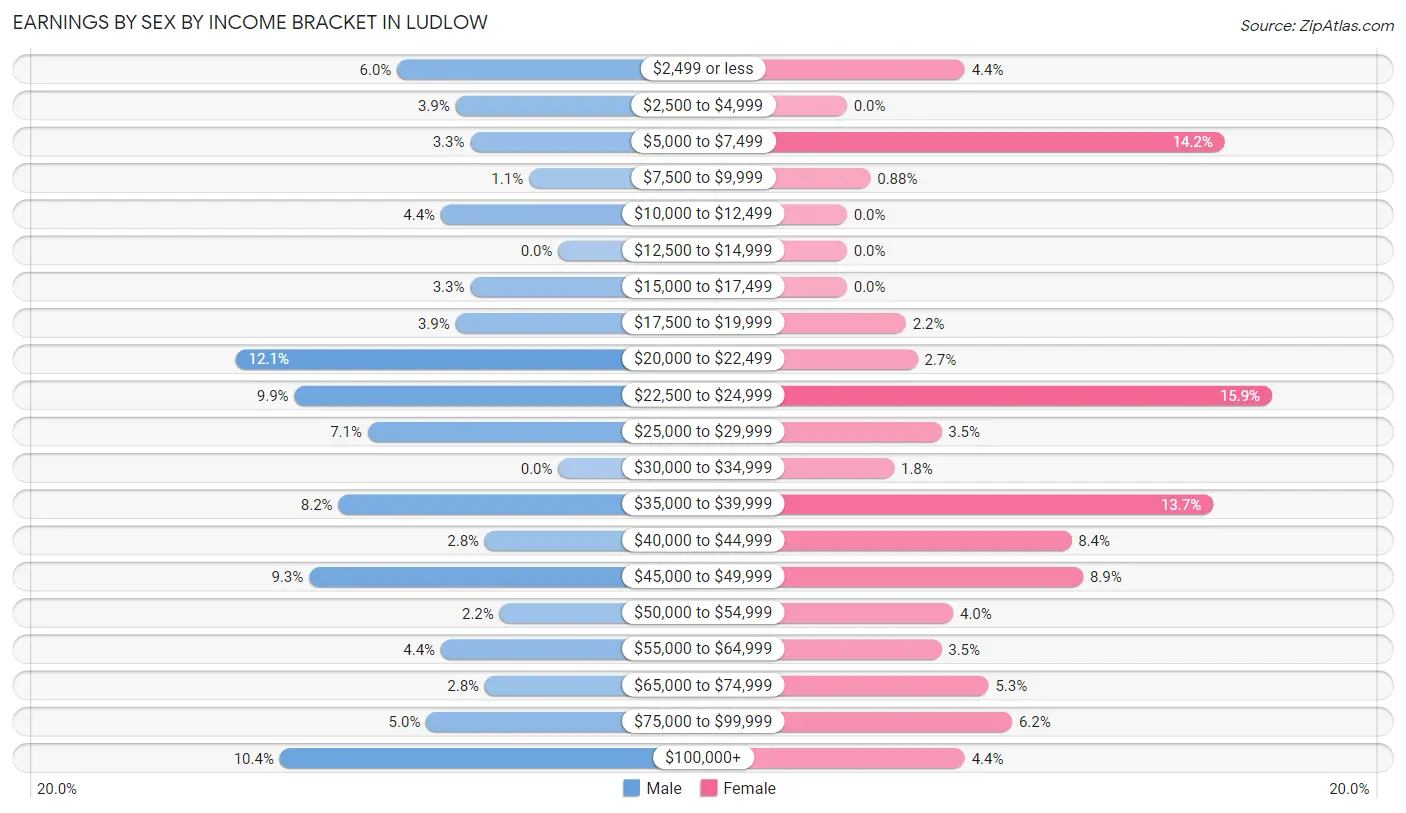
Earnings by Sex by Income Bracket in Ludlow
The most common earnings brackets in Ludlow are $20,000 to $22,499 for men (22 | 12.1%) and $22,500 to $24,999 for women (36 | 15.9%).
| Income | Male | Female |
| $2,499 or less | 11 (6.0%) | 10 (4.4%) |
| $2,500 to $4,999 | 7 (3.8%) | 0 (0.0%) |
| $5,000 to $7,499 | 6 (3.3%) | 32 (14.2%) |
| $7,500 to $9,999 | 2 (1.1%) | 2 (0.9%) |
| $10,000 to $12,499 | 8 (4.4%) | 0 (0.0%) |
| $12,500 to $14,999 | 0 (0.0%) | 0 (0.0%) |
| $15,000 to $17,499 | 6 (3.3%) | 0 (0.0%) |
| $17,500 to $19,999 | 7 (3.8%) | 5 (2.2%) |
| $20,000 to $22,499 | 22 (12.1%) | 6 (2.6%) |
| $22,500 to $24,999 | 18 (9.9%) | 36 (15.9%) |
| $25,000 to $29,999 | 13 (7.1%) | 8 (3.5%) |
| $30,000 to $34,999 | 0 (0.0%) | 4 (1.8%) |
| $35,000 to $39,999 | 15 (8.2%) | 31 (13.7%) |
| $40,000 to $44,999 | 5 (2.8%) | 19 (8.4%) |
| $45,000 to $49,999 | 17 (9.3%) | 20 (8.8%) |
| $50,000 to $54,999 | 4 (2.2%) | 9 (4.0%) |
| $55,000 to $64,999 | 8 (4.4%) | 8 (3.5%) |
| $65,000 to $74,999 | 5 (2.8%) | 12 (5.3%) |
| $75,000 to $99,999 | 9 (5.0%) | 14 (6.2%) |
| $100,000+ | 19 (10.4%) | 10 (4.4%) |
| Total | 182 (100.0%) | 226 (100.0%) |
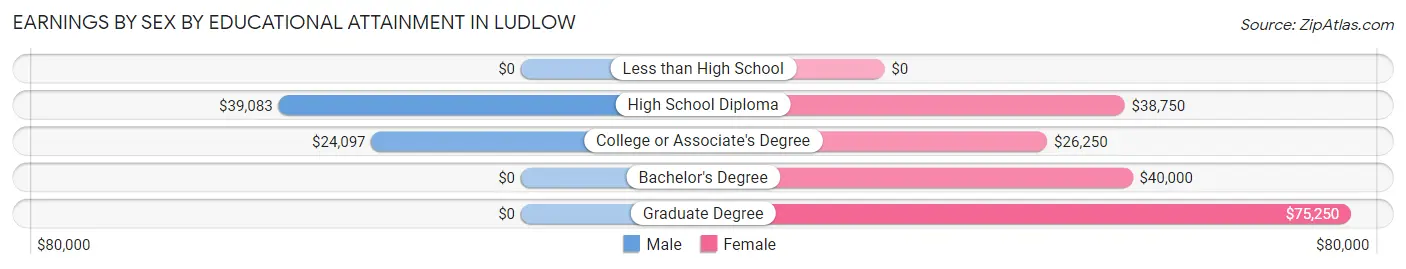
Earnings by Sex by Educational Attainment in Ludlow
Average earnings in Ludlow are $39,333 for men and $39,286 for women, a difference of 0.1%. Men with an educational attainment of high school diploma enjoy the highest average annual earnings of $39,083, while those with college or associate's degree education earn the least with $24,097. Women with an educational attainment of graduate degree earn the most with the average annual earnings of $75,250, while those with college or associate's degree education have the smallest earnings of $26,250.
| Educational Attainment | Male Income | Female Income |
| Less than High School | - | - |
| High School Diploma | $39,083 | $38,750 |
| College or Associate's Degree | $24,097 | $26,250 |
| Bachelor's Degree | - | - |
| Graduate Degree | - | - |
| Total | $39,333 | $39,286 |
Family Income in Ludlow
Family Income Brackets in Ludlow
According to the Ludlow family income data, there are 46 families falling into the $35,000 to $49,999 income range, which is the most common income bracket and makes up 29.5% of all families.
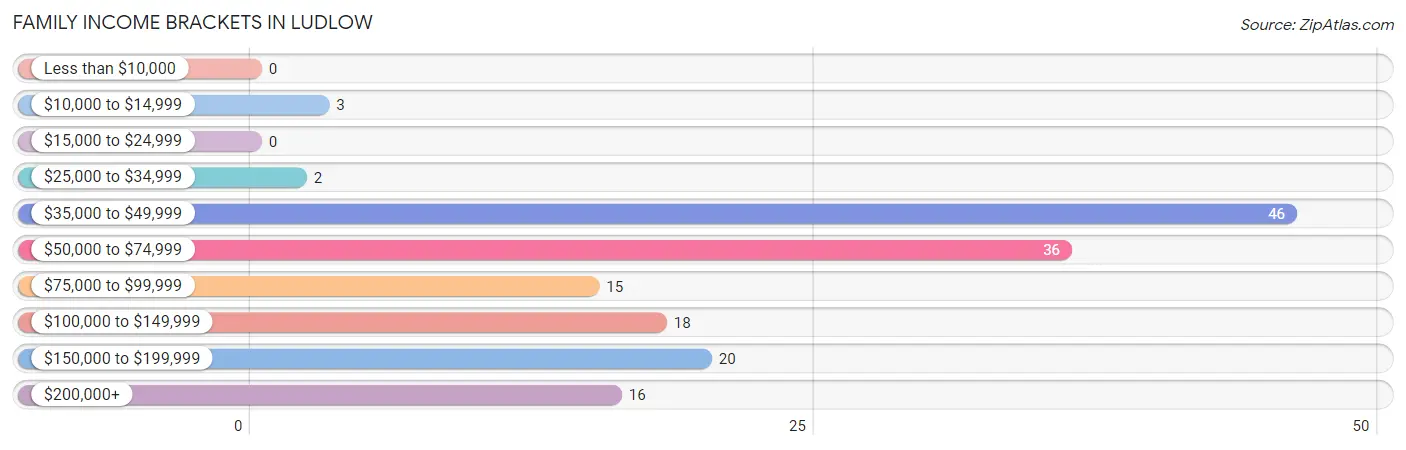
| Income Bracket | # Families | % Families |
| Less than $10,000 | 0 | 0.0% |
| $10,000 to $14,999 | 3 | 1.9% |
| $15,000 to $24,999 | 0 | 0.0% |
| $25,000 to $34,999 | 2 | 1.3% |
| $35,000 to $49,999 | 46 | 29.5% |
| $50,000 to $74,999 | 36 | 23.1% |
| $75,000 to $99,999 | 15 | 9.6% |
| $100,000 to $149,999 | 18 | 11.5% |
| $150,000 to $199,999 | 20 | 12.8% |
| $200,000+ | 16 | 10.3% |
Family Income by Famaliy Size in Ludlow
2-person families (82 | 52.6%) account for the highest median family income in Ludlow with $101,667 per family, while 2-person families (82 | 52.6%) have the highest median income of $50,834 per family member.
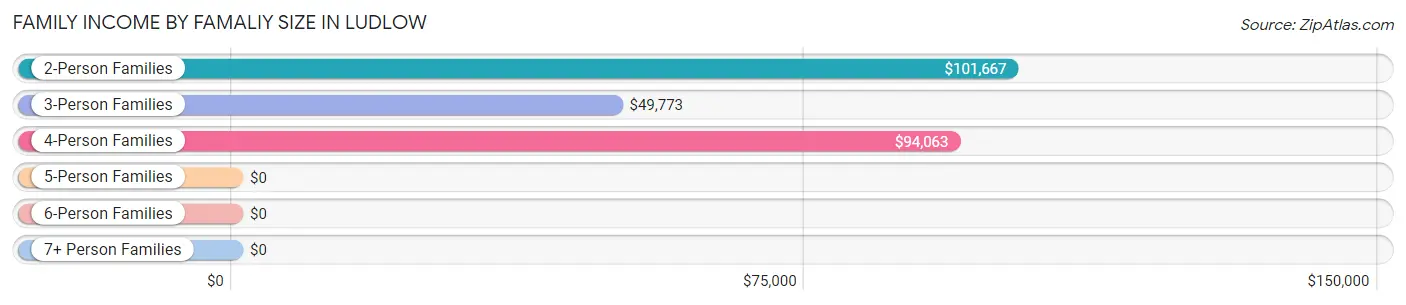
| Income Bracket | # Families | Median Income |
| 2-Person Families | 82 (52.6%) | $101,667 |
| 3-Person Families | 64 (41.0%) | $49,773 |
| 4-Person Families | 9 (5.8%) | $94,063 |
| 5-Person Families | 0 (0.0%) | $0 |
| 6-Person Families | 1 (0.6%) | $0 |
| 7+ Person Families | 0 (0.0%) | $0 |
| Total | 156 (100.0%) | $73,750 |
Family Income by Number of Earners in Ludlow
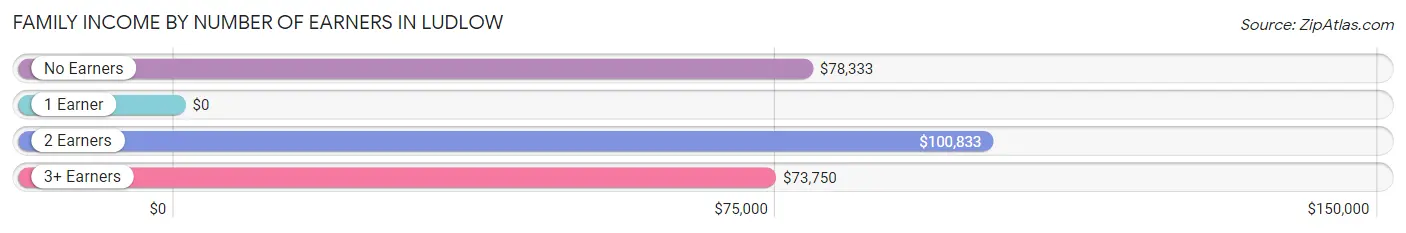
| Number of Earners | # Families | Median Income |
| No Earners | 10 (6.4%) | $78,333 |
| 1 Earner | 70 (44.9%) | $0 |
| 2 Earners | 44 (28.2%) | $100,833 |
| 3+ Earners | 32 (20.5%) | $73,750 |
| Total | 156 (100.0%) | $73,750 |
Household Income in Ludlow
Household Income Brackets in Ludlow
With 91 households falling in the category, the $35,000 to $49,999 income range is the most frequent in Ludlow, accounting for 25.5% of all households. In contrast, only 16 households (4.5%) fall into the $200,000+ income bracket, making it the least populous group.
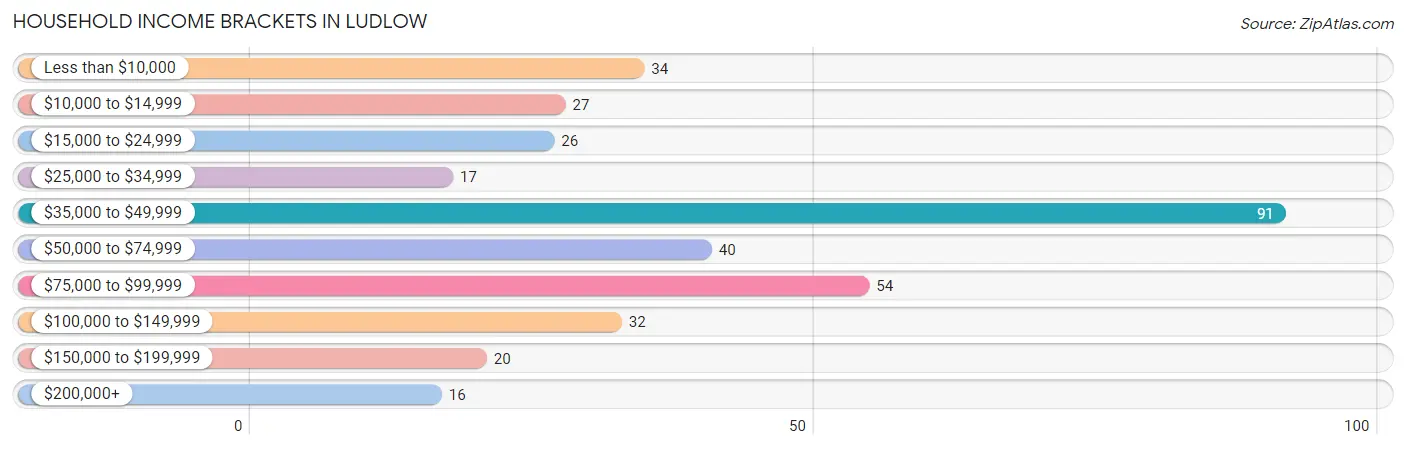
| Income Bracket | # Households | % Households |
| Less than $10,000 | 34 | 9.5% |
| $10,000 to $14,999 | 27 | 7.6% |
| $15,000 to $24,999 | 26 | 7.3% |
| $25,000 to $34,999 | 17 | 4.8% |
| $35,000 to $49,999 | 91 | 25.5% |
| $50,000 to $74,999 | 40 | 11.2% |
| $75,000 to $99,999 | 54 | 15.1% |
| $100,000 to $149,999 | 32 | 9.0% |
| $150,000 to $199,999 | 20 | 5.6% |
| $200,000+ | 16 | 4.5% |
Household Income by Householder Age in Ludlow
The median household income in Ludlow is $48,413, with the highest median household income of $75,500 found in the 45 to 64 years age bracket for the primary householder. A total of 140 households (39.2%) fall into this category. Meanwhile, the 15 to 24 years age bracket for the primary householder has the lowest median household income of $0, with 23 households (6.4%) in this group.
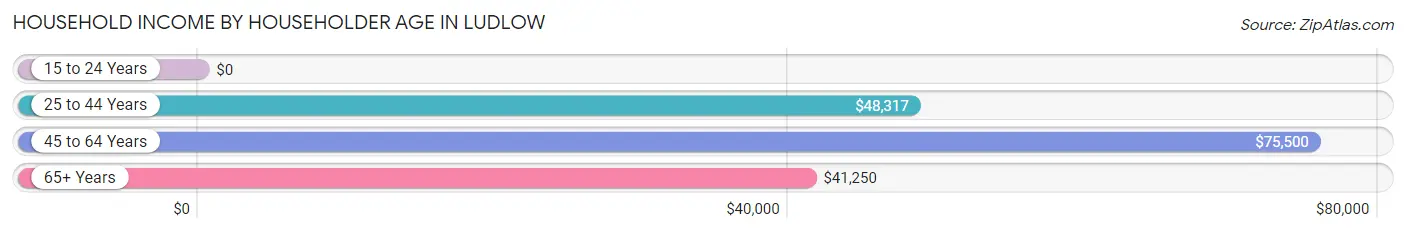
| Income Bracket | # Households | Median Income |
| 15 to 24 Years | 23 (6.4%) | $0 |
| 25 to 44 Years | 75 (21.0%) | $48,317 |
| 45 to 64 Years | 140 (39.2%) | $75,500 |
| 65+ Years | 119 (33.3%) | $41,250 |
| Total | 357 (100.0%) | $48,413 |
Poverty in Ludlow
Income Below Poverty by Sex and Age in Ludlow
With 11.2% poverty level for males and 13.6% for females among the residents of Ludlow, 45 to 54 year old males and 18 to 24 year old females are the most vulnerable to poverty, with 11 males (23.4%) and 16 females (55.2%) in their respective age groups living below the poverty level.
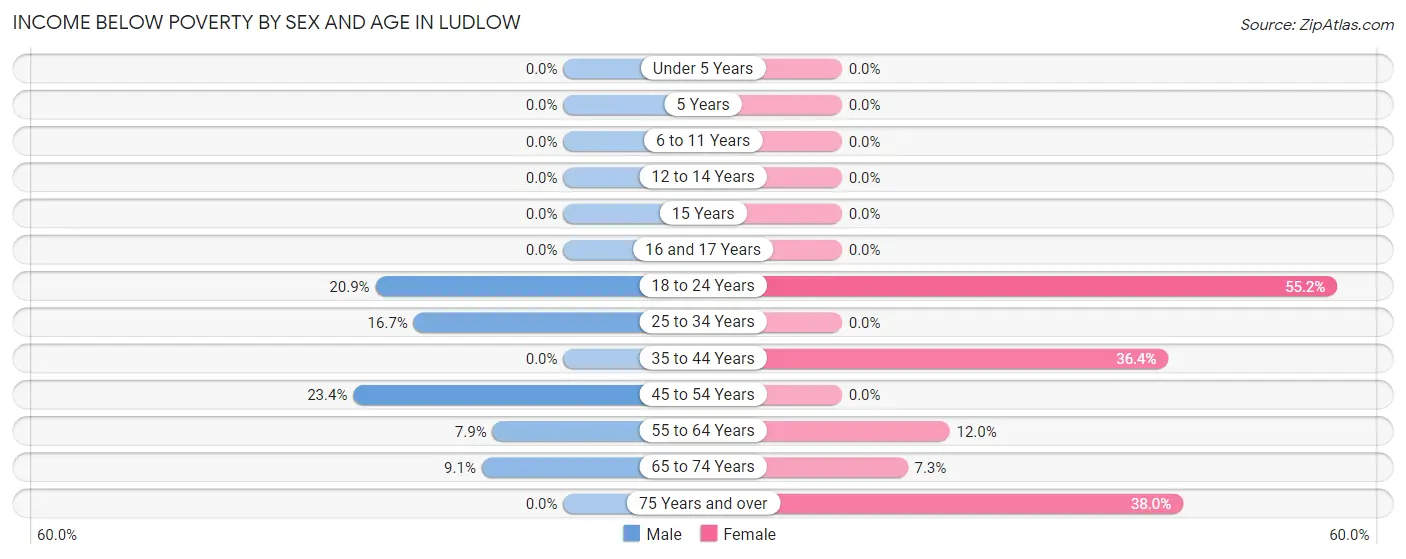
| Age Bracket | Male | Female |
| Under 5 Years | 0 (0.0%) | 0 (0.0%) |
| 5 Years | 0 (0.0%) | 0 (0.0%) |
| 6 to 11 Years | 0 (0.0%) | 0 (0.0%) |
| 12 to 14 Years | 0 (0.0%) | 0 (0.0%) |
| 15 Years | 0 (0.0%) | 0 (0.0%) |
| 16 and 17 Years | 0 (0.0%) | 0 (0.0%) |
| 18 to 24 Years | 9 (20.9%) | 16 (55.2%) |
| 25 to 34 Years | 7 (16.7%) | 0 (0.0%) |
| 35 to 44 Years | 0 (0.0%) | 4 (36.4%) |
| 45 to 54 Years | 11 (23.4%) | 0 (0.0%) |
| 55 to 64 Years | 3 (7.9%) | 6 (12.0%) |
| 65 to 74 Years | 4 (9.1%) | 3 (7.3%) |
| 75 Years and over | 0 (0.0%) | 19 (38.0%) |
| Total | 34 (11.2%) | 48 (13.6%) |
Income Above Poverty by Sex and Age in Ludlow
According to the poverty statistics in Ludlow, males aged under 5 years and females aged under 5 years are the age groups that are most secure financially, with 100.0% of males and 100.0% of females in these age groups living above the poverty line.
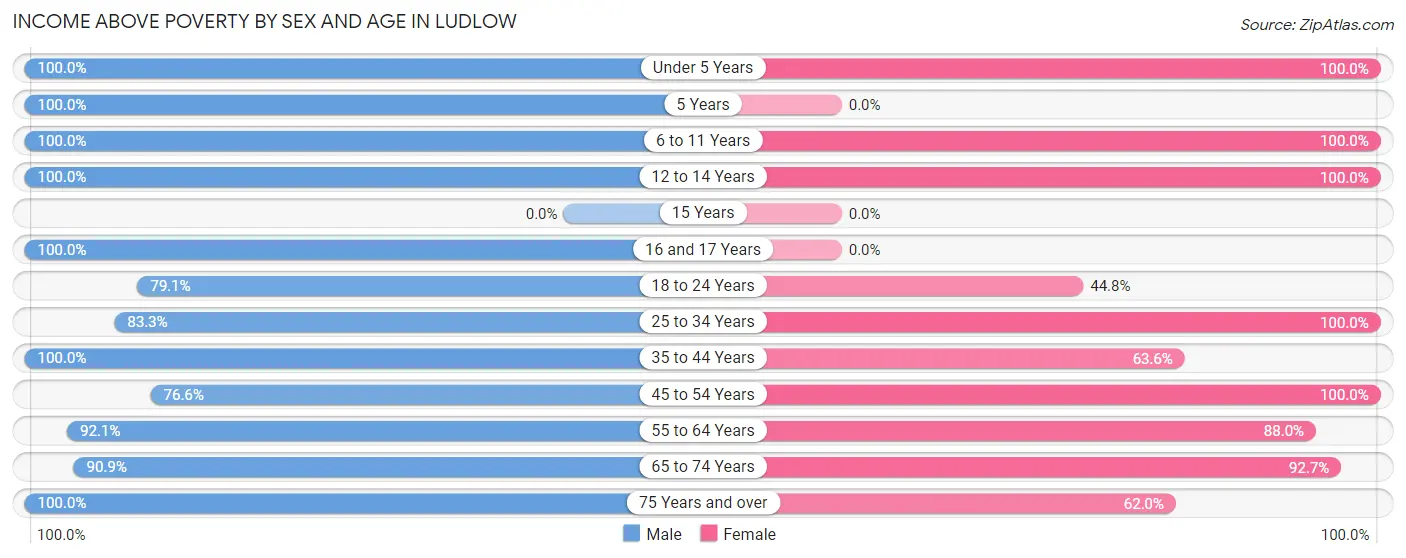
| Age Bracket | Male | Female |
| Under 5 Years | 3 (100.0%) | 11 (100.0%) |
| 5 Years | 2 (100.0%) | 0 (0.0%) |
| 6 to 11 Years | 31 (100.0%) | 3 (100.0%) |
| 12 to 14 Years | 4 (100.0%) | 13 (100.0%) |
| 15 Years | 0 (0.0%) | 0 (0.0%) |
| 16 and 17 Years | 10 (100.0%) | 0 (0.0%) |
| 18 to 24 Years | 34 (79.1%) | 13 (44.8%) |
| 25 to 34 Years | 35 (83.3%) | 85 (100.0%) |
| 35 to 44 Years | 23 (100.0%) | 7 (63.6%) |
| 45 to 54 Years | 36 (76.6%) | 61 (100.0%) |
| 55 to 64 Years | 35 (92.1%) | 44 (88.0%) |
| 65 to 74 Years | 40 (90.9%) | 38 (92.7%) |
| 75 Years and over | 18 (100.0%) | 31 (62.0%) |
| Total | 271 (88.8%) | 306 (86.4%) |
Income Below Poverty Among Married-Couple Families in Ludlow
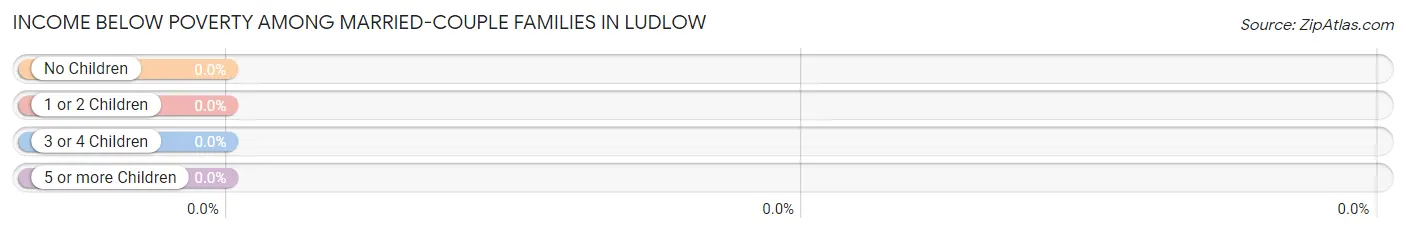
| Children | Above Poverty | Below Poverty |
| No Children | 87 (100.0%) | 0 (0.0%) |
| 1 or 2 Children | 25 (100.0%) | 0 (0.0%) |
| 3 or 4 Children | 1 (100.0%) | 0 (0.0%) |
| 5 or more Children | 0 (0.0%) | 0 (0.0%) |
| Total | 113 (100.0%) | 0 (0.0%) |
Income Below Poverty Among Single-Parent Households in Ludlow
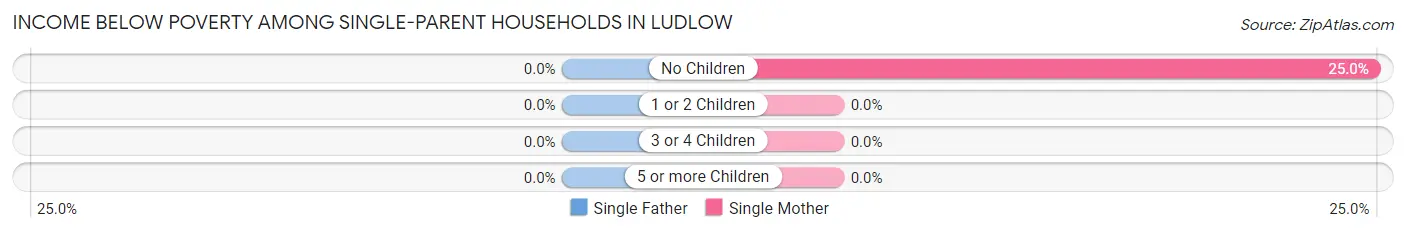
| Children | Single Father | Single Mother |
| No Children | 0 (0.0%) | 3 (25.0%) |
| 1 or 2 Children | 0 (0.0%) | 0 (0.0%) |
| 3 or 4 Children | 0 (0.0%) | 0 (0.0%) |
| 5 or more Children | 0 (0.0%) | 0 (0.0%) |
| Total | 0 (0.0%) | 3 (7.7%) |
Income Below Poverty Among Married-Couple vs Single-Parent Households in Ludlow
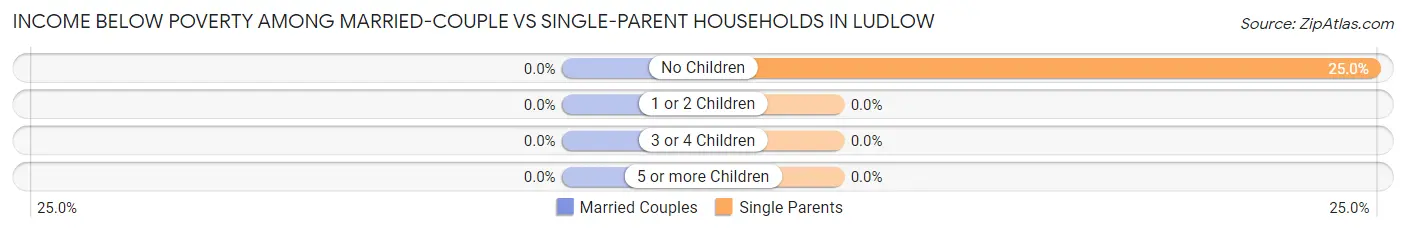
| Children | Married-Couple Families | Single-Parent Households |
| No Children | 0 (0.0%) | 3 (25.0%) |
| 1 or 2 Children | 0 (0.0%) | 0 (0.0%) |
| 3 or 4 Children | 0 (0.0%) | 0 (0.0%) |
| 5 or more Children | 0 (0.0%) | 0 (0.0%) |
| Total | 0 (0.0%) | 3 (7.0%) |
Race in Ludlow
The most populous races in Ludlow are White / Caucasian (681 | 95.8%), Two or more Races (24 | 3.4%), and Native / Alaskan (4 | 0.6%).
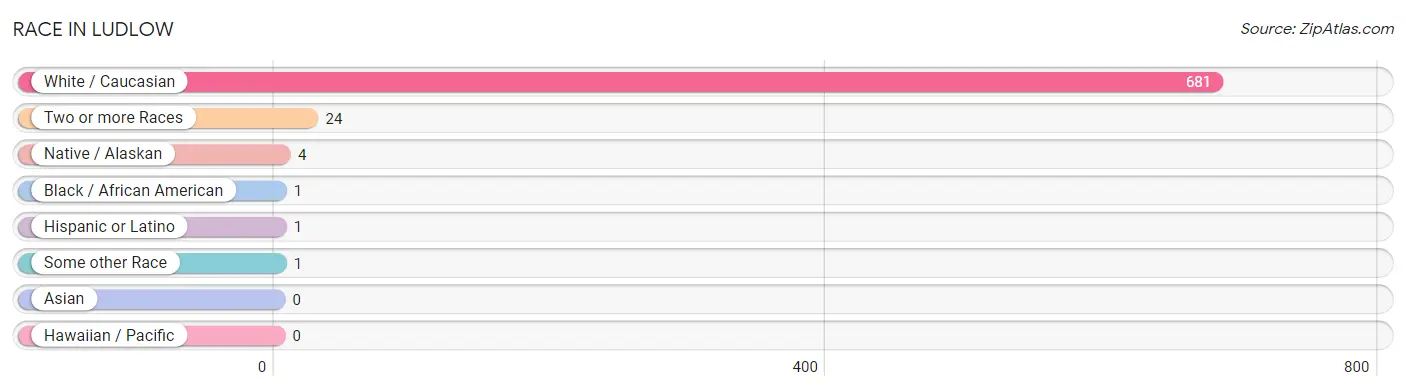
| Race | # Population | % Population |
| Asian | 0 | 0.0% |
| Black / African American | 1 | 0.1% |
| Hawaiian / Pacific | 0 | 0.0% |
| Hispanic or Latino | 1 | 0.1% |
| Native / Alaskan | 4 | 0.6% |
| White / Caucasian | 681 | 95.8% |
| Two or more Races | 24 | 3.4% |
| Some other Race | 1 | 0.1% |
| Total | 711 | 100.0% |
Ancestry in Ludlow
The most populous ancestries reported in Ludlow are English (158 | 22.2%), Irish (124 | 17.4%), German (88 | 12.4%), French (63 | 8.9%), and Italian (36 | 5.1%), together accounting for 66.0% of all Ludlow residents.
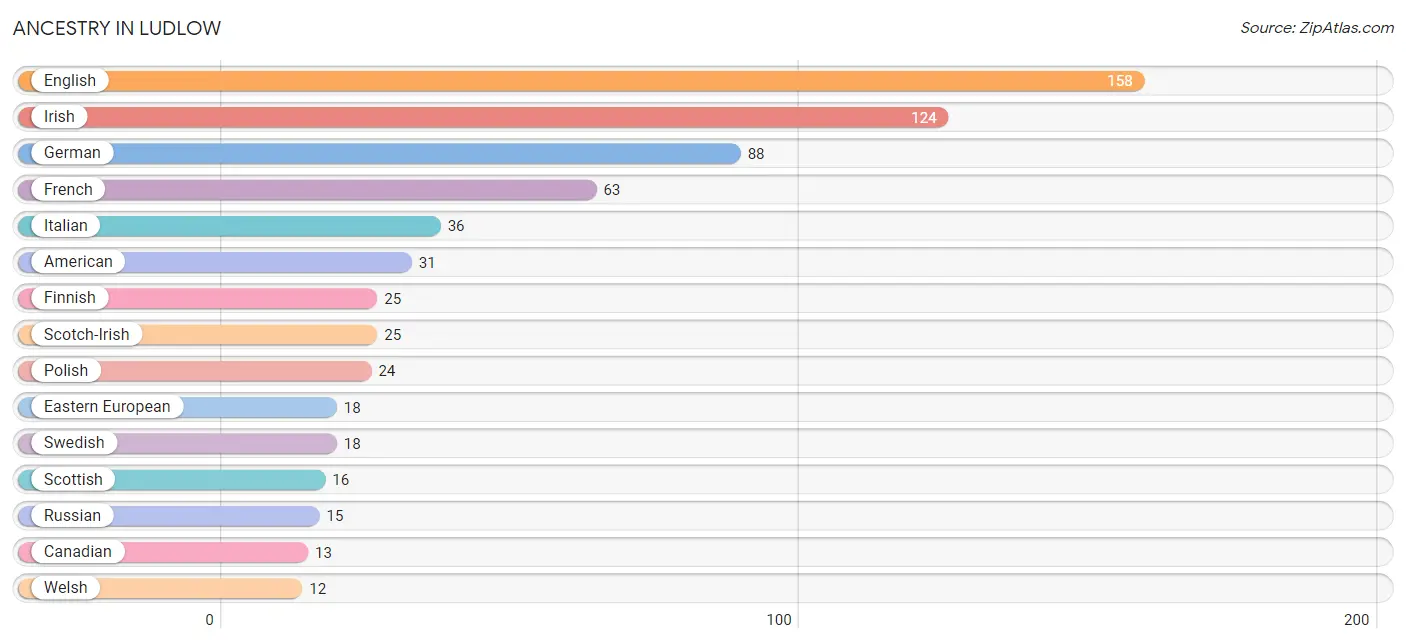
| Ancestry | # Population | % Population |
| American | 31 | 4.4% |
| Australian | 2 | 0.3% |
| Canadian | 13 | 1.8% |
| Eastern European | 18 | 2.5% |
| English | 158 | 22.2% |
| Finnish | 25 | 3.5% |
| French | 63 | 8.9% |
| French Canadian | 5 | 0.7% |
| German | 88 | 12.4% |
| Irish | 124 | 17.4% |
| Italian | 36 | 5.1% |
| Native Hawaiian | 6 | 0.8% |
| Norwegian | 5 | 0.7% |
| Polish | 24 | 3.4% |
| Russian | 15 | 2.1% |
| Scandinavian | 6 | 0.8% |
| Scotch-Irish | 25 | 3.5% |
| Scottish | 16 | 2.2% |
| Swedish | 18 | 2.5% |
| Swiss | 3 | 0.4% |
| Ukrainian | 11 | 1.5% |
| Welsh | 12 | 1.7% | View All 22 Rows |
Immigrants in Ludlow
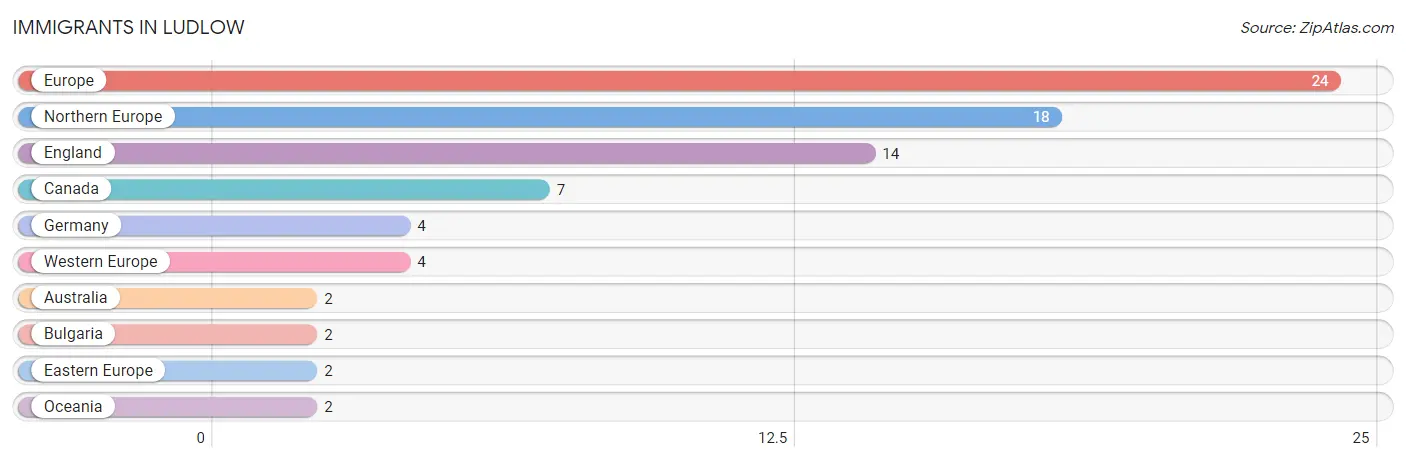
The most numerous immigrant groups reported in Ludlow came from Europe (24 | 3.4%), Northern Europe (18 | 2.5%), England (14 | 2.0%), Canada (7 | 1.0%), and Germany (4 | 0.6%), together accounting for 9.4% of all Ludlow residents.
| Immigration Origin | # Population | % Population |
| Australia | 2 | 0.3% |
| Bulgaria | 2 | 0.3% |
| Canada | 7 | 1.0% |
| Eastern Europe | 2 | 0.3% |
| England | 14 | 2.0% |
| Europe | 24 | 3.4% |
| Germany | 4 | 0.6% |
| Northern Europe | 18 | 2.5% |
| Oceania | 2 | 0.3% |
| Western Europe | 4 | 0.6% | View All 10 Rows |
Sex and Age in Ludlow
Sex and Age in Ludlow
The most populous age groups in Ludlow are 20 to 24 Years (39 | 12.0%) for men and 25 to 29 Years (49 | 12.7%) for women.
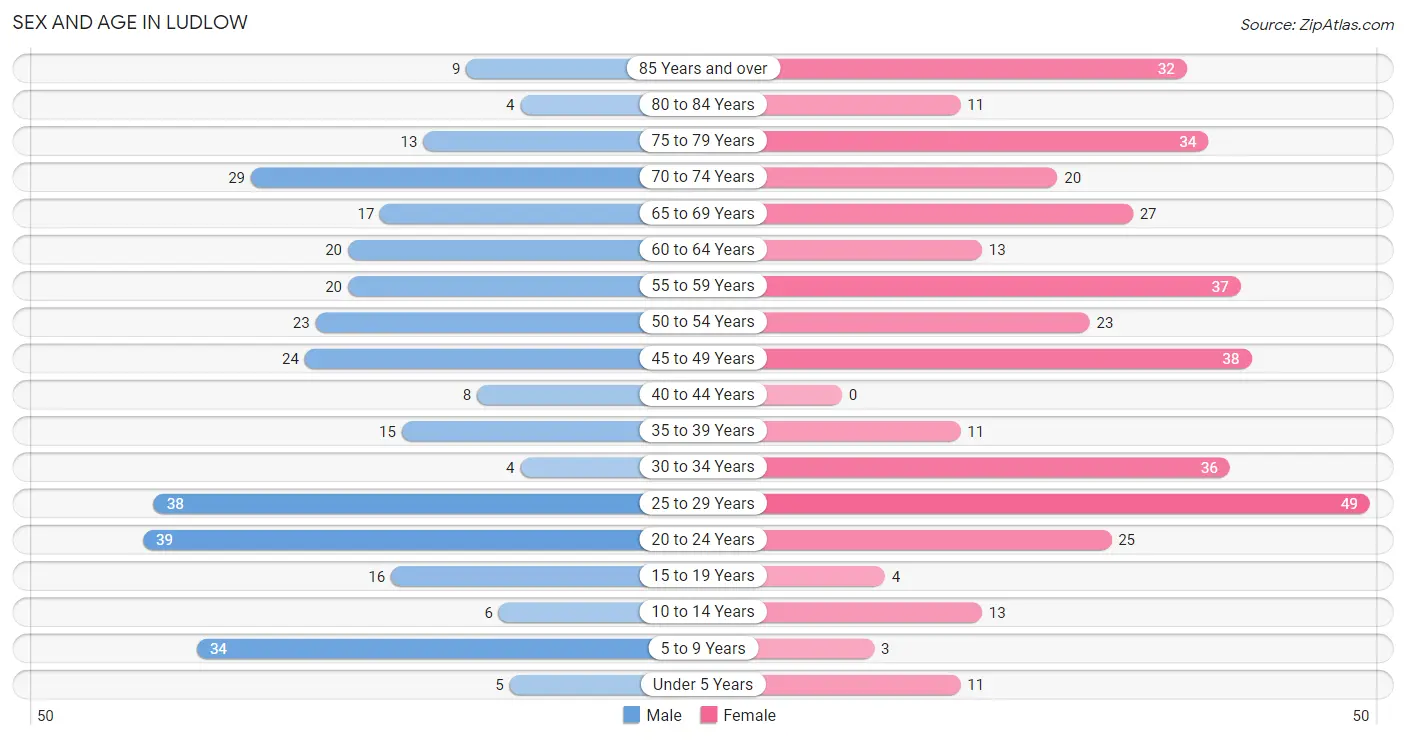
| Age Bracket | Male | Female |
| Under 5 Years | 5 (1.5%) | 11 (2.8%) |
| 5 to 9 Years | 34 (10.5%) | 3 (0.8%) |
| 10 to 14 Years | 6 (1.8%) | 13 (3.4%) |
| 15 to 19 Years | 16 (4.9%) | 4 (1.0%) |
| 20 to 24 Years | 39 (12.0%) | 25 (6.5%) |
| 25 to 29 Years | 38 (11.7%) | 49 (12.7%) |
| 30 to 34 Years | 4 (1.2%) | 36 (9.3%) |
| 35 to 39 Years | 15 (4.6%) | 11 (2.8%) |
| 40 to 44 Years | 8 (2.5%) | 0 (0.0%) |
| 45 to 49 Years | 24 (7.4%) | 38 (9.8%) |
| 50 to 54 Years | 23 (7.1%) | 23 (5.9%) |
| 55 to 59 Years | 20 (6.2%) | 37 (9.6%) |
| 60 to 64 Years | 20 (6.2%) | 13 (3.4%) |
| 65 to 69 Years | 17 (5.2%) | 27 (7.0%) |
| 70 to 74 Years | 29 (8.9%) | 20 (5.2%) |
| 75 to 79 Years | 13 (4.0%) | 34 (8.8%) |
| 80 to 84 Years | 4 (1.2%) | 11 (2.8%) |
| 85 Years and over | 9 (2.8%) | 32 (8.3%) |
| Total | 324 (100.0%) | 387 (100.0%) |
Families and Households in Ludlow
Median Family Size in Ludlow
The median family size in Ludlow is 2.59 persons per family, with single female/mother families (39 | 25.0%) accounting for the largest median family size of 2.62 persons per family. On the other hand, single male/father families (4 | 2.6%) represent the smallest median family size with 2.00 persons per family.
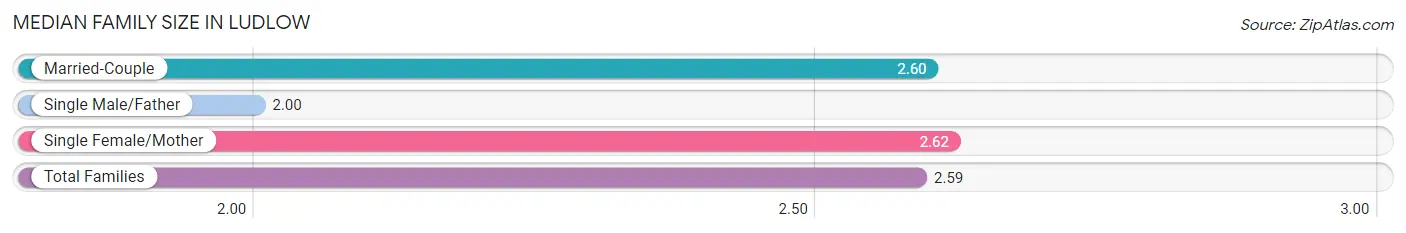
| Family Type | # Families | Family Size |
| Married-Couple | 113 (72.4%) | 2.60 |
| Single Male/Father | 4 (2.6%) | 2.00 |
| Single Female/Mother | 39 (25.0%) | 2.62 |
| Total Families | 156 (100.0%) | 2.59 |
Median Household Size in Ludlow
The median household size in Ludlow is 1.84 persons per household, with single female/mother households (39 | 10.9%) accounting for the largest median household size of 2.79 persons per household. non-family households (201 | 56.3%) represent the smallest median household size with 1.17 persons per household.
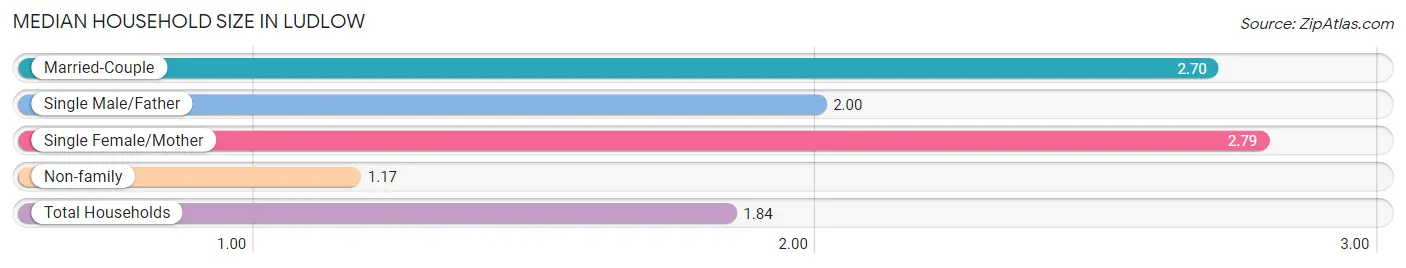
| Household Type | # Households | Household Size |
| Married-Couple | 113 (31.7%) | 2.70 |
| Single Male/Father | 4 (1.1%) | 2.00 |
| Single Female/Mother | 39 (10.9%) | 2.79 |
| Non-family | 201 (56.3%) | 1.17 |
| Total Households | 357 (100.0%) | 1.84 |
Household Size by Marriage Status in Ludlow
Out of a total of 357 households in Ludlow, 156 (43.7%) are family households, while 201 (56.3%) are nonfamily households. The most numerous type of family households are 2-person households, comprising 76, and the most common type of nonfamily households are 1-person households, comprising 183.
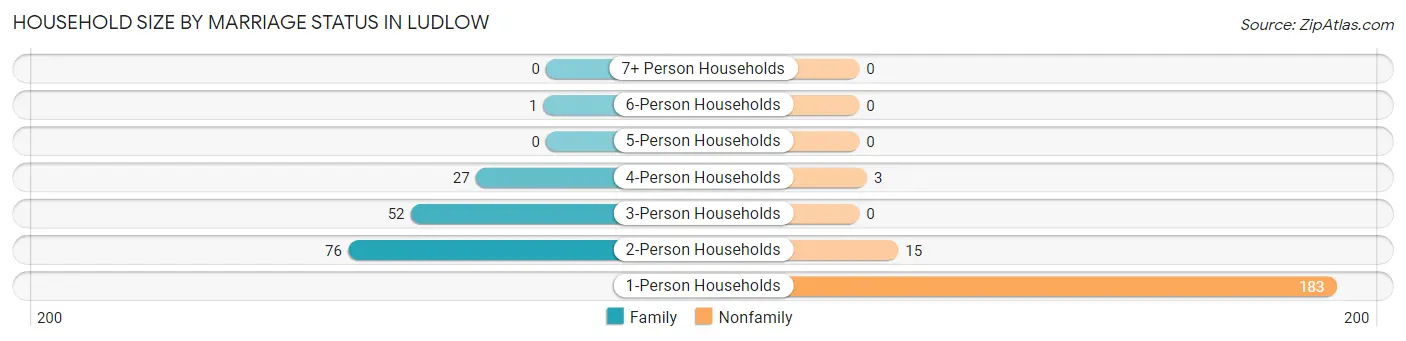
| Household Size | Family Households | Nonfamily Households |
| 1-Person Households | - | 183 (51.3%) |
| 2-Person Households | 76 (21.3%) | 15 (4.2%) |
| 3-Person Households | 52 (14.6%) | 0 (0.0%) |
| 4-Person Households | 27 (7.6%) | 3 (0.8%) |
| 5-Person Households | 0 (0.0%) | 0 (0.0%) |
| 6-Person Households | 1 (0.3%) | 0 (0.0%) |
| 7+ Person Households | 0 (0.0%) | 0 (0.0%) |
| Total | 156 (43.7%) | 201 (56.3%) |
Female Fertility in Ludlow
Fertility by Age in Ludlow
Average fertility rate in Ludlow is 25.0 births per 1,000 women. Women in the age bracket of 20 to 34 years have the highest fertility rate with 36.0 births per 1,000 women. Women in the age bracket of 20 to 34 years acount for 100.0% of all women with births.
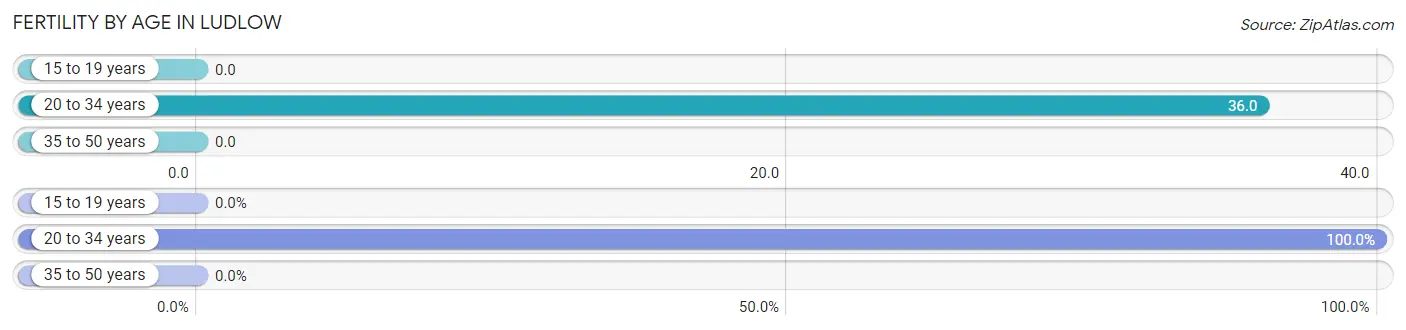
| Age Bracket | Women with Births | Births / 1,000 Women |
| 15 to 19 years | 0 (0.0%) | 0.0 |
| 20 to 34 years | 4 (100.0%) | 36.0 |
| 35 to 50 years | 0 (0.0%) | 0.0 |
| Total | 4 (100.0%) | 25.0 |
Fertility by Age by Marriage Status in Ludlow
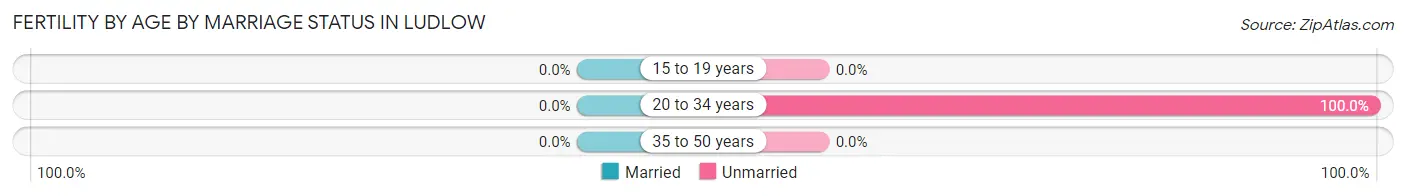
| Age Bracket | Married | Unmarried |
| 15 to 19 years | 0 (0.0%) | 0 (0.0%) |
| 20 to 34 years | 0 (0.0%) | 4 (100.0%) |
| 35 to 50 years | 0 (0.0%) | 0 (0.0%) |
| Total | 0 (0.0%) | 4 (100.0%) |
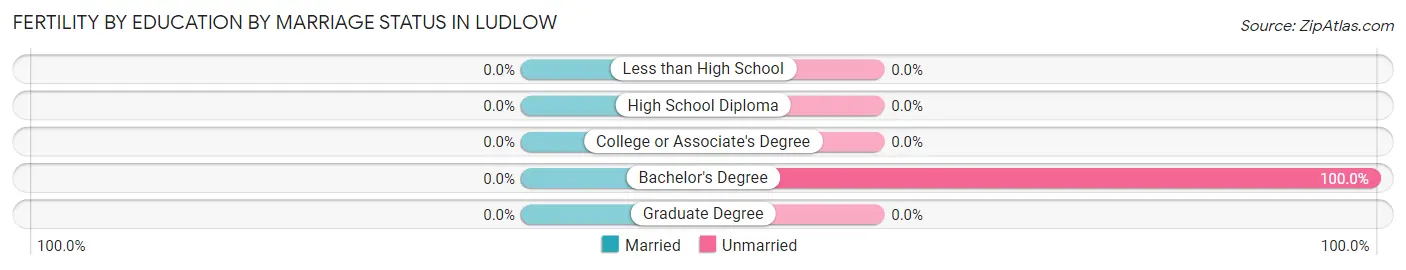
Fertility by Education in Ludlow
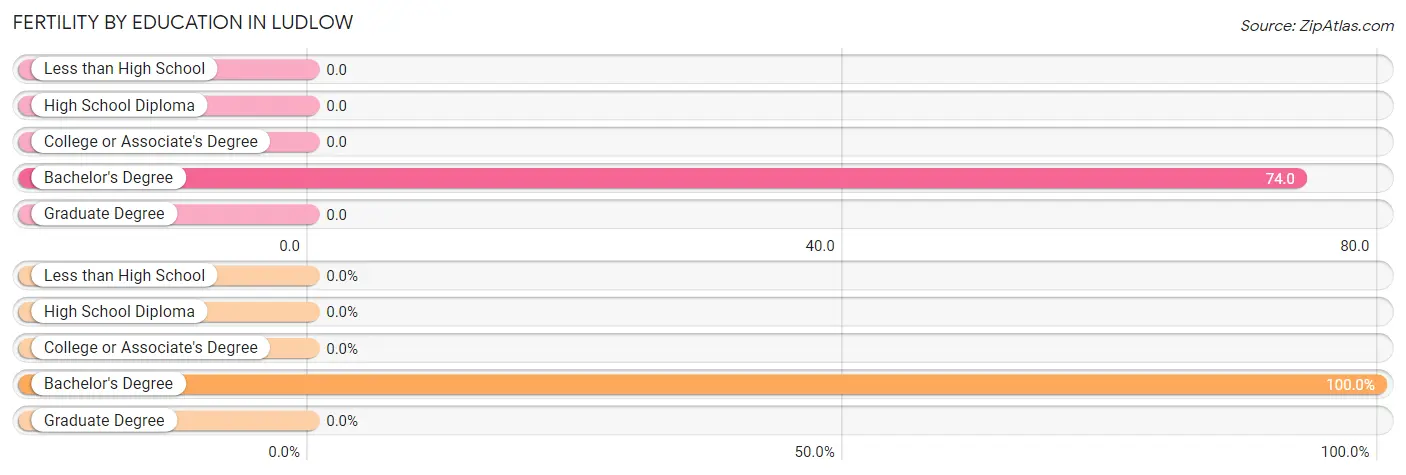
| Educational Attainment | Women with Births | Births / 1,000 Women |
| Less than High School | 0 (0.0%) | 0.0 |
| High School Diploma | 0 (0.0%) | 0.0 |
| College or Associate's Degree | 0 (0.0%) | 0.0 |
| Bachelor's Degree | 4 (100.0%) | 74.0 |
| Graduate Degree | 0 (0.0%) | 0.0 |
| Total | 4 (100.0%) | 25.0 |
Fertility by Education by Marriage Status in Ludlow
| Educational Attainment | Married | Unmarried |
| Less than High School | 0 (0.0%) | 0 (0.0%) |
| High School Diploma | 0 (0.0%) | 0 (0.0%) |
| College or Associate's Degree | 0 (0.0%) | 0 (0.0%) |
| Bachelor's Degree | 0 (0.0%) | 4 (100.0%) |
| Graduate Degree | 0 (0.0%) | 0 (0.0%) |
| Total | 0 (0.0%) | 4 (100.0%) |
Employment Characteristics in Ludlow
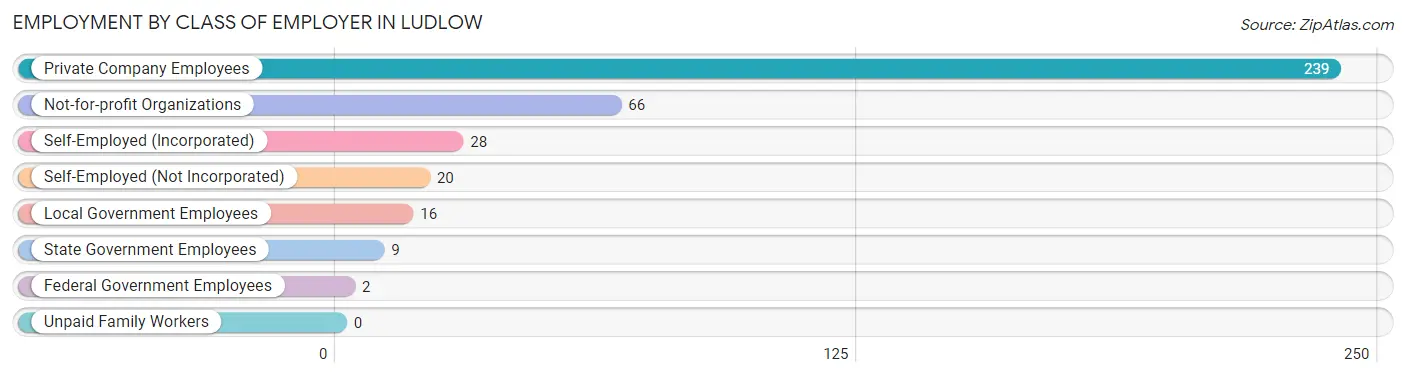
Employment by Class of Employer in Ludlow
Among the 380 employed individuals in Ludlow, private company employees (239 | 62.9%), not-for-profit organizations (66 | 17.4%), and self-employed (incorporated) (28 | 7.4%) make up the most common classes of employment.
| Employer Class | # Employees | % Employees |
| Private Company Employees | 239 | 62.9% |
| Self-Employed (Incorporated) | 28 | 7.4% |
| Self-Employed (Not Incorporated) | 20 | 5.3% |
| Not-for-profit Organizations | 66 | 17.4% |
| Local Government Employees | 16 | 4.2% |
| State Government Employees | 9 | 2.4% |
| Federal Government Employees | 2 | 0.5% |
| Unpaid Family Workers | 0 | 0.0% |
| Total | 380 | 100.0% |
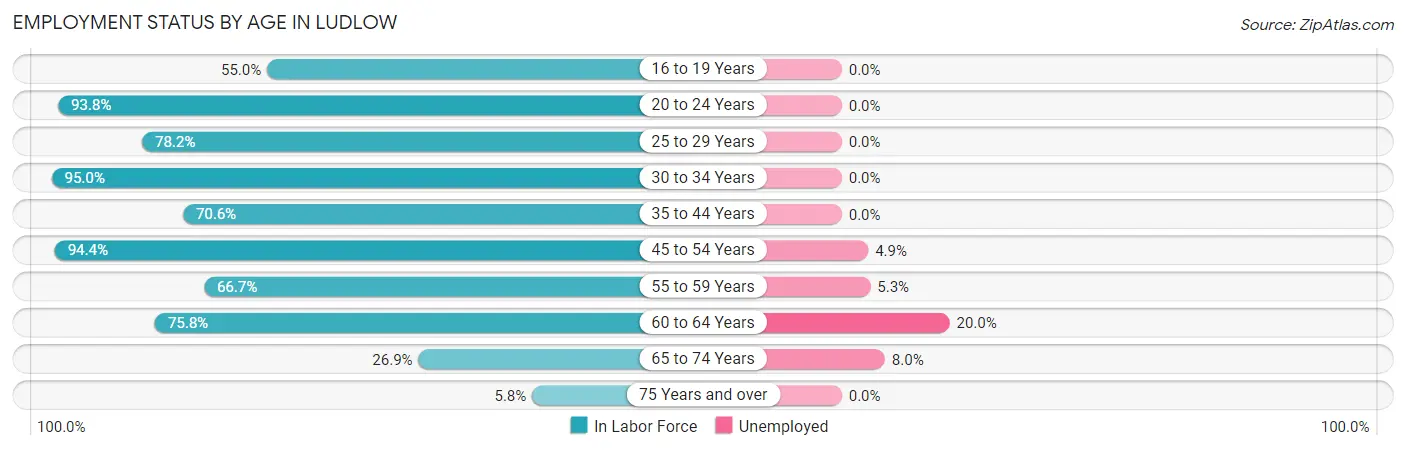
Employment Status by Age in Ludlow
According to the labor force statistics for Ludlow, out of the total population over 16 years of age (639), 62.1% or 397 individuals are in the labor force, with 3.5% or 14 of them unemployed. The age group with the highest labor force participation rate is 30 to 34 years, with 95.0% or 38 individuals in the labor force. Within the labor force, the 60 to 64 years age range has the highest percentage of unemployed individuals, with 20.0% or 5 of them being unemployed.
| Age Bracket | In Labor Force | Unemployed |
| 16 to 19 Years | 11 (55.0%) | 0 (0.0%) |
| 20 to 24 Years | 60 (93.8%) | 0 (0.0%) |
| 25 to 29 Years | 68 (78.2%) | 0 (0.0%) |
| 30 to 34 Years | 38 (95.0%) | 0 (0.0%) |
| 35 to 44 Years | 24 (70.6%) | 0 (0.0%) |
| 45 to 54 Years | 102 (94.4%) | 5 (4.9%) |
| 55 to 59 Years | 38 (66.7%) | 2 (5.3%) |
| 60 to 64 Years | 25 (75.8%) | 5 (20.0%) |
| 65 to 74 Years | 25 (26.9%) | 2 (8.0%) |
| 75 Years and over | 6 (5.8%) | 0 (0.0%) |
| Total | 397 (62.1%) | 14 (3.5%) |
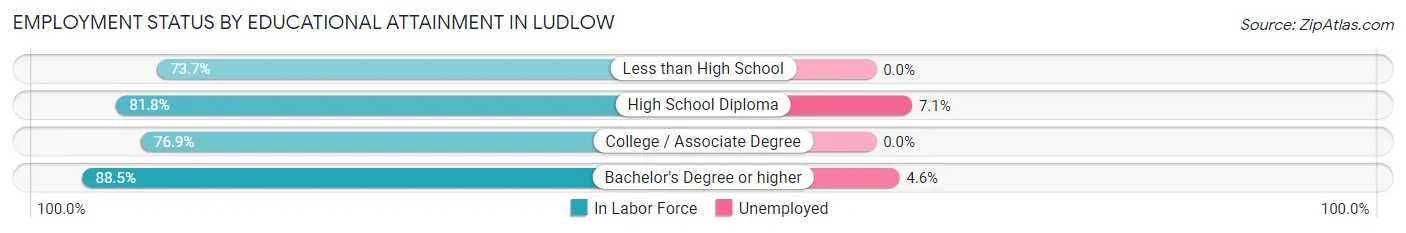
Employment Status by Educational Attainment in Ludlow
According to labor force statistics for Ludlow, 82.2% of individuals (295) out of the total population between 25 and 64 years of age (359) are in the labor force, with 4.1% or 12 of them being unemployed. The group with the highest labor force participation rate are those with the educational attainment of bachelor's degree or higher, with 88.5% or 108 individuals in the labor force. Within the labor force, individuals with high school diploma education have the highest percentage of unemployment, with 7.1% or 7 of them being unemployed.
| Educational Attainment | In Labor Force | Unemployed |
| Less than High School | 28 (73.7%) | 0 (0.0%) |
| High School Diploma | 99 (81.8%) | 9 (7.1%) |
| College / Associate Degree | 60 (76.9%) | 0 (0.0%) |
| Bachelor's Degree or higher | 108 (88.5%) | 6 (4.6%) |
| Total | 295 (82.2%) | 15 (4.1%) |
Employment Occupations by Sex in Ludlow
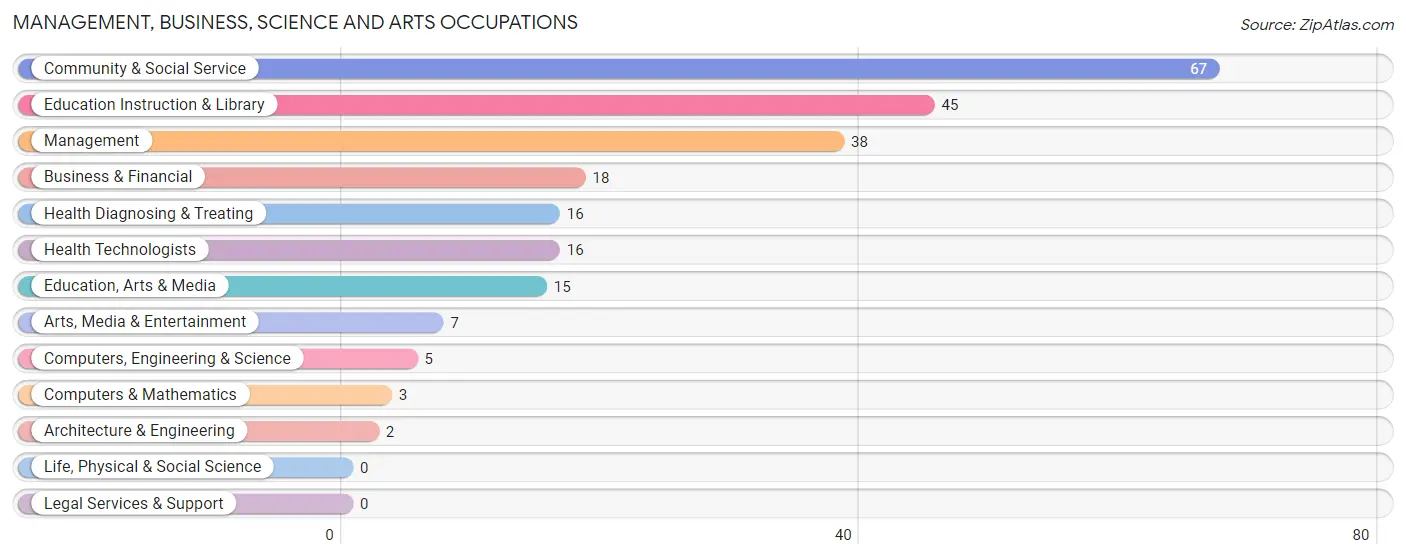
Management, Business, Science and Arts Occupations
The most common Management, Business, Science and Arts occupations in Ludlow are Community & Social Service (67 | 17.5%), Education Instruction & Library (45 | 11.7%), Management (38 | 9.9%), Business & Financial (18 | 4.7%), and Health Diagnosing & Treating (16 | 4.2%).
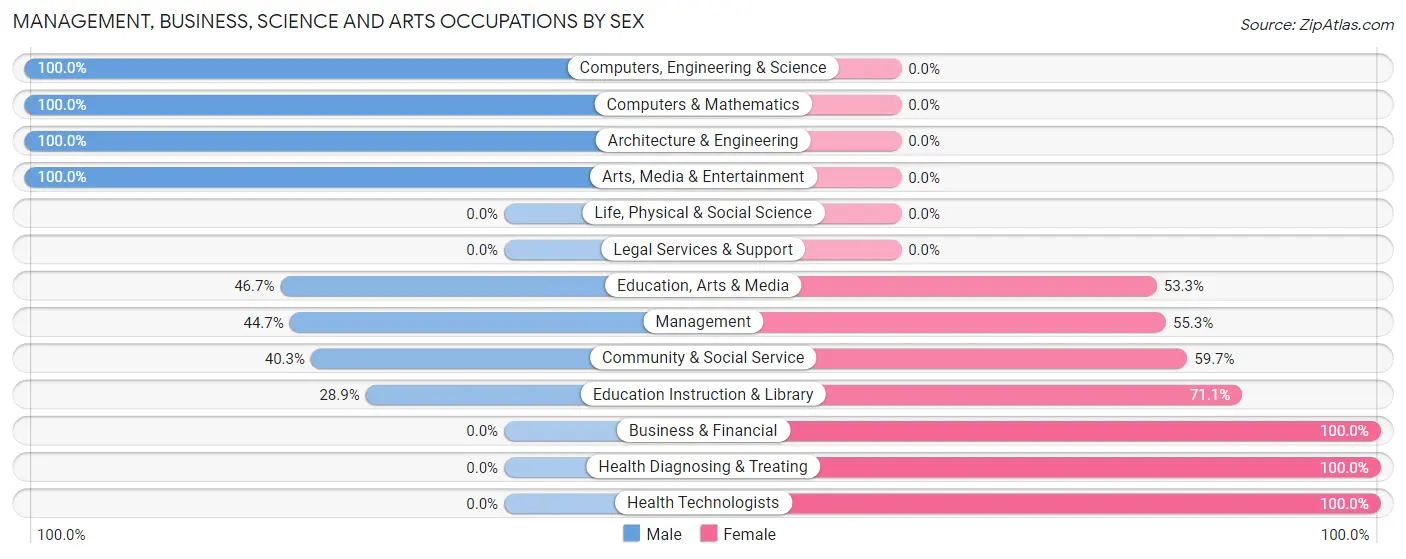
Management, Business, Science and Arts Occupations by Sex
Within the Management, Business, Science and Arts occupations in Ludlow, the most male-oriented occupations are Computers, Engineering & Science (100.0%), Computers & Mathematics (100.0%), and Architecture & Engineering (100.0%), while the most female-oriented occupations are Business & Financial (100.0%), Health Diagnosing & Treating (100.0%), and Health Technologists (100.0%).
| Occupation | Male | Female |
| Management | 17 (44.7%) | 21 (55.3%) |
| Business & Financial | 0 (0.0%) | 18 (100.0%) |
| Computers, Engineering & Science | 5 (100.0%) | 0 (0.0%) |
| Computers & Mathematics | 3 (100.0%) | 0 (0.0%) |
| Architecture & Engineering | 2 (100.0%) | 0 (0.0%) |
| Life, Physical & Social Science | 0 (0.0%) | 0 (0.0%) |
| Community & Social Service | 27 (40.3%) | 40 (59.7%) |
| Education, Arts & Media | 7 (46.7%) | 8 (53.3%) |
| Legal Services & Support | 0 (0.0%) | 0 (0.0%) |
| Education Instruction & Library | 13 (28.9%) | 32 (71.1%) |
| Arts, Media & Entertainment | 7 (100.0%) | 0 (0.0%) |
| Health Diagnosing & Treating | 0 (0.0%) | 16 (100.0%) |
| Health Technologists | 0 (0.0%) | 16 (100.0%) |
| Total (Category) | 49 (34.0%) | 95 (66.0%) |
| Total (Overall) | 171 (44.7%) | 212 (55.3%) |
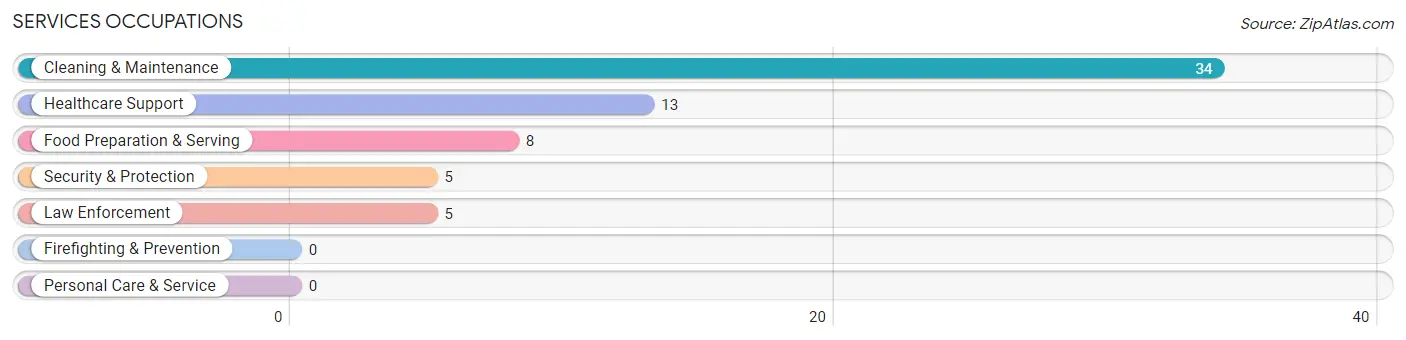
Services Occupations
The most common Services occupations in Ludlow are Cleaning & Maintenance (34 | 8.9%), Healthcare Support (13 | 3.4%), Food Preparation & Serving (8 | 2.1%), Security & Protection (5 | 1.3%), and Law Enforcement (5 | 1.3%).
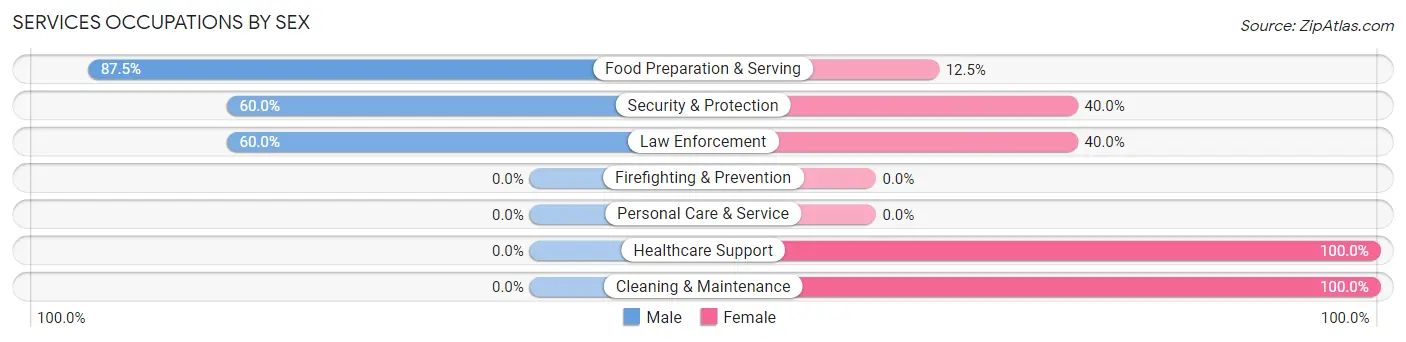
Services Occupations by Sex
Within the Services occupations in Ludlow, the most male-oriented occupations are Food Preparation & Serving (87.5%), Security & Protection (60.0%), and Law Enforcement (60.0%), while the most female-oriented occupations are Healthcare Support (100.0%), Cleaning & Maintenance (100.0%), and Security & Protection (40.0%).
| Occupation | Male | Female |
| Healthcare Support | 0 (0.0%) | 13 (100.0%) |
| Security & Protection | 3 (60.0%) | 2 (40.0%) |
| Firefighting & Prevention | 0 (0.0%) | 0 (0.0%) |
| Law Enforcement | 3 (60.0%) | 2 (40.0%) |
| Food Preparation & Serving | 7 (87.5%) | 1 (12.5%) |
| Cleaning & Maintenance | 0 (0.0%) | 34 (100.0%) |
| Personal Care & Service | 0 (0.0%) | 0 (0.0%) |
| Total (Category) | 10 (16.7%) | 50 (83.3%) |
| Total (Overall) | 171 (44.7%) | 212 (55.3%) |
Sales and Office Occupations
The most common Sales and Office occupations in Ludlow are Sales & Related (24 | 6.3%), and Office & Administration (23 | 6.0%).
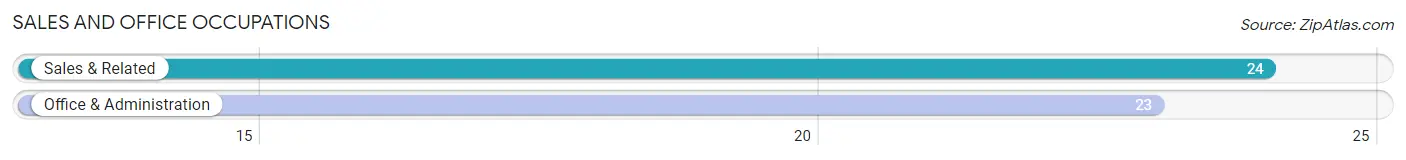
Sales and Office Occupations by Sex
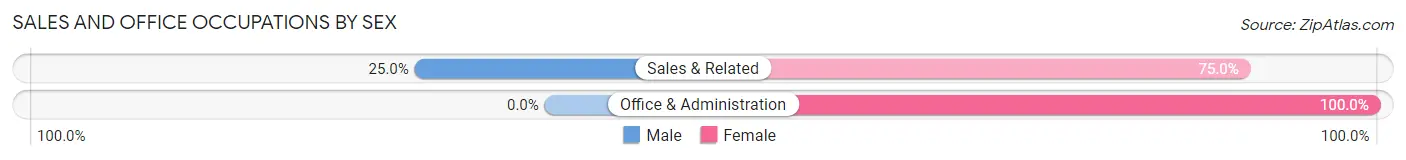
| Occupation | Male | Female |
| Sales & Related | 6 (25.0%) | 18 (75.0%) |
| Office & Administration | 0 (0.0%) | 23 (100.0%) |
| Total (Category) | 6 (12.8%) | 41 (87.2%) |
| Total (Overall) | 171 (44.7%) | 212 (55.3%) |
Natural Resources, Construction and Maintenance Occupations
The most common Natural Resources, Construction and Maintenance occupations in Ludlow are Construction & Extraction (54 | 14.1%), and Installation, Maintenance & Repair (18 | 4.7%).
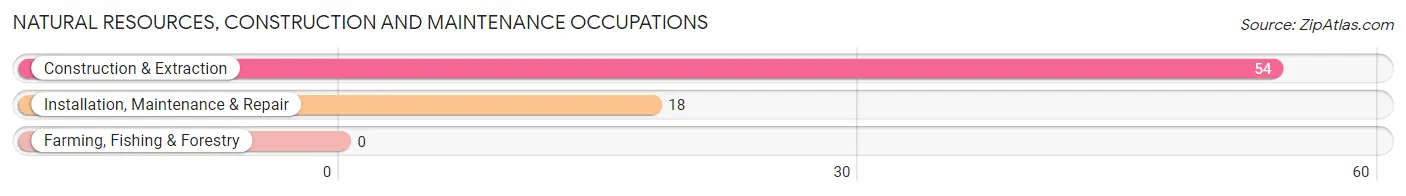
Natural Resources, Construction and Maintenance Occupations by Sex
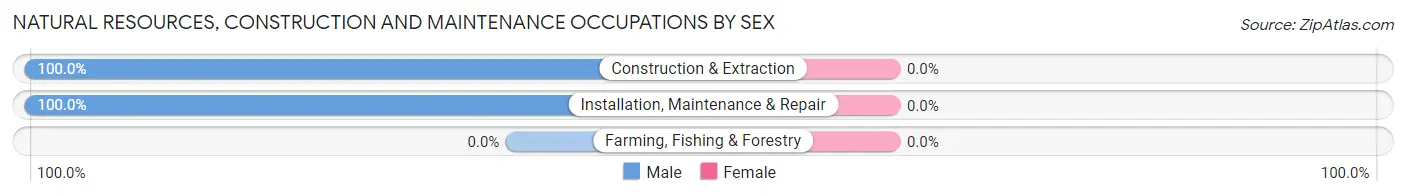
| Occupation | Male | Female |
| Farming, Fishing & Forestry | 0 (0.0%) | 0 (0.0%) |
| Construction & Extraction | 54 (100.0%) | 0 (0.0%) |
| Installation, Maintenance & Repair | 18 (100.0%) | 0 (0.0%) |
| Total (Category) | 72 (100.0%) | 0 (0.0%) |
| Total (Overall) | 171 (44.7%) | 212 (55.3%) |
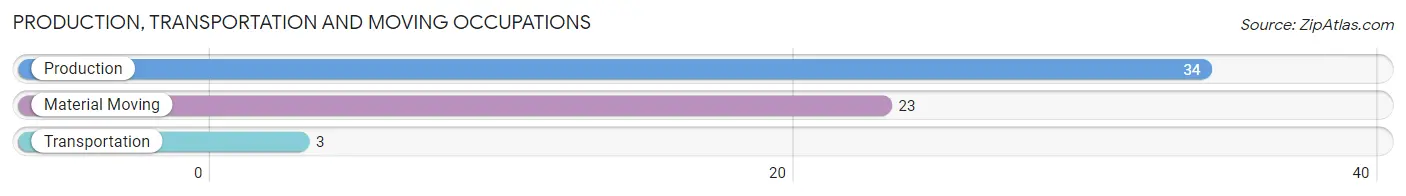
Production, Transportation and Moving Occupations
The most common Production, Transportation and Moving occupations in Ludlow are Production (34 | 8.9%), Material Moving (23 | 6.0%), and Transportation (3 | 0.8%).
Production, Transportation and Moving Occupations by Sex
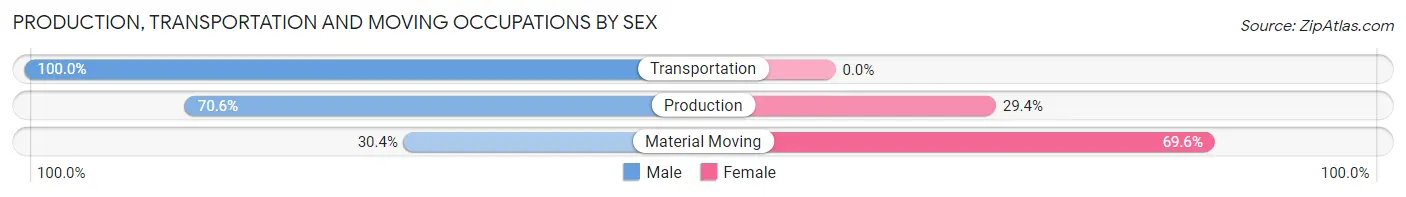
| Occupation | Male | Female |
| Production | 24 (70.6%) | 10 (29.4%) |
| Transportation | 3 (100.0%) | 0 (0.0%) |
| Material Moving | 7 (30.4%) | 16 (69.6%) |
| Total (Category) | 34 (56.7%) | 26 (43.3%) |
| Total (Overall) | 171 (44.7%) | 212 (55.3%) |
Employment Industries by Sex in Ludlow
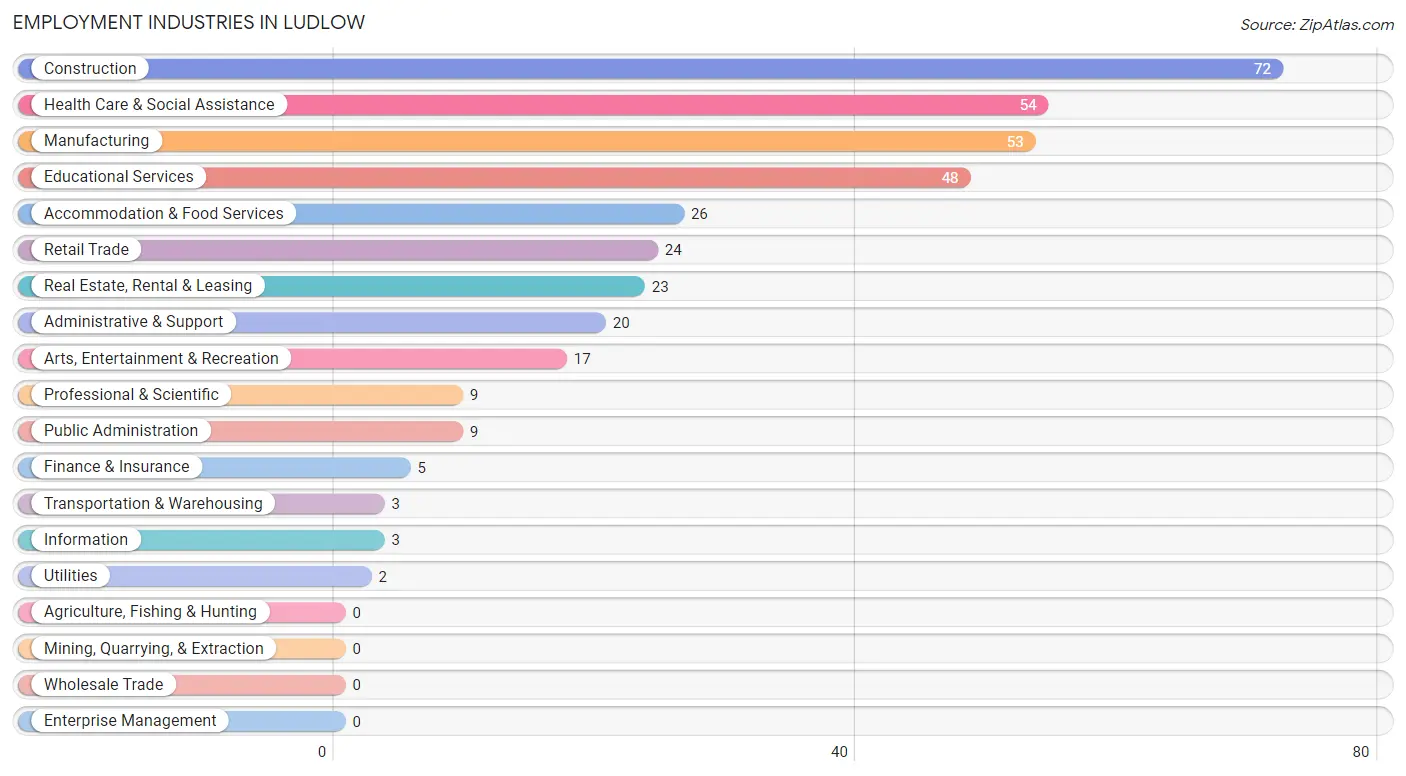
Employment Industries in Ludlow
The major employment industries in Ludlow include Construction (72 | 18.8%), Health Care & Social Assistance (54 | 14.1%), Manufacturing (53 | 13.8%), Educational Services (48 | 12.5%), and Accommodation & Food Services (26 | 6.8%).
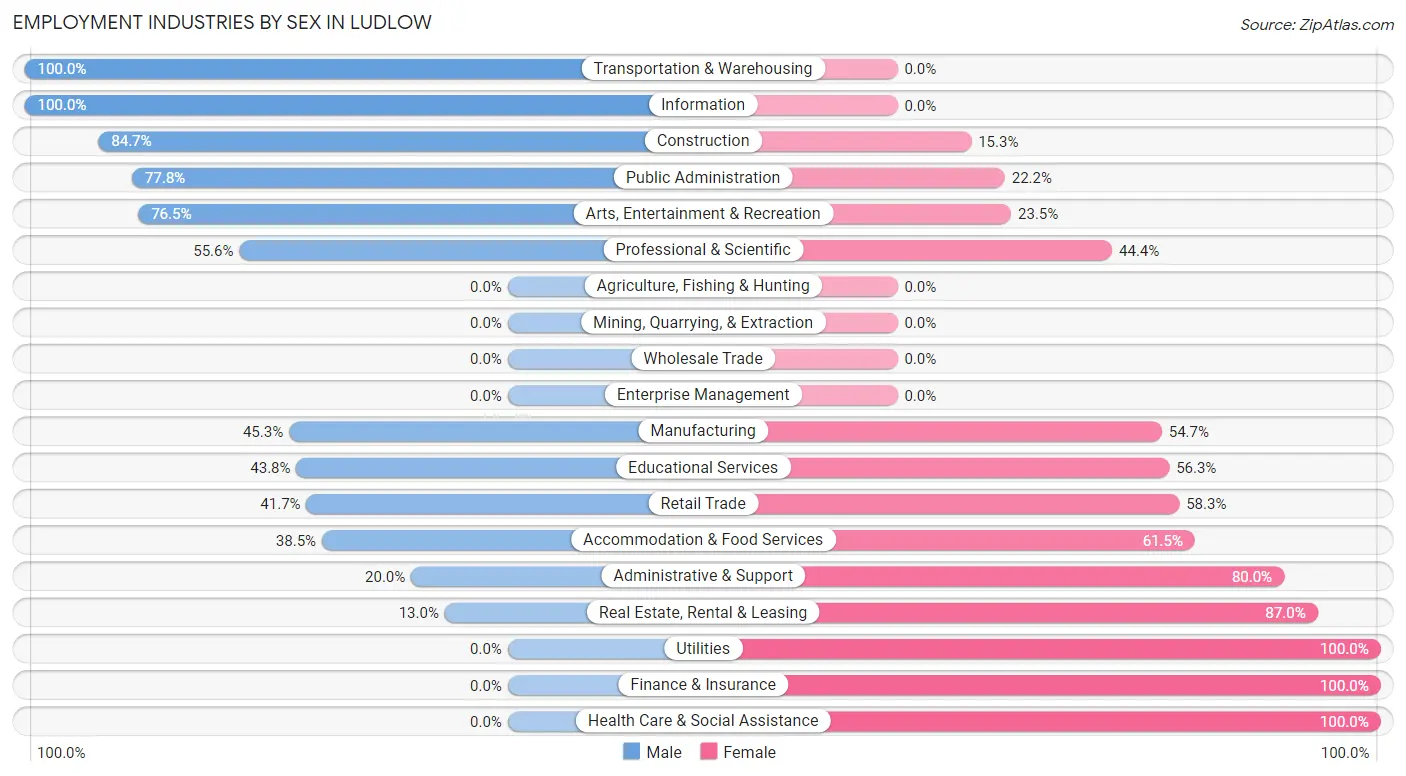
Employment Industries by Sex in Ludlow
The Ludlow industries that see more men than women are Transportation & Warehousing (100.0%), Information (100.0%), and Construction (84.7%), whereas the industries that tend to have a higher number of women are Utilities (100.0%), Finance & Insurance (100.0%), and Health Care & Social Assistance (100.0%).
| Industry | Male | Female |
| Agriculture, Fishing & Hunting | 0 (0.0%) | 0 (0.0%) |
| Mining, Quarrying, & Extraction | 0 (0.0%) | 0 (0.0%) |
| Construction | 61 (84.7%) | 11 (15.3%) |
| Manufacturing | 24 (45.3%) | 29 (54.7%) |
| Wholesale Trade | 0 (0.0%) | 0 (0.0%) |
| Retail Trade | 10 (41.7%) | 14 (58.3%) |
| Transportation & Warehousing | 3 (100.0%) | 0 (0.0%) |
| Utilities | 0 (0.0%) | 2 (100.0%) |
| Information | 3 (100.0%) | 0 (0.0%) |
| Finance & Insurance | 0 (0.0%) | 5 (100.0%) |
| Real Estate, Rental & Leasing | 3 (13.0%) | 20 (87.0%) |
| Professional & Scientific | 5 (55.6%) | 4 (44.4%) |
| Enterprise Management | 0 (0.0%) | 0 (0.0%) |
| Administrative & Support | 4 (20.0%) | 16 (80.0%) |
| Educational Services | 21 (43.8%) | 27 (56.2%) |
| Health Care & Social Assistance | 0 (0.0%) | 54 (100.0%) |
| Arts, Entertainment & Recreation | 13 (76.5%) | 4 (23.5%) |
| Accommodation & Food Services | 10 (38.5%) | 16 (61.5%) |
| Public Administration | 7 (77.8%) | 2 (22.2%) |
| Total | 171 (44.7%) | 212 (55.3%) |
Education in Ludlow
School Enrollment in Ludlow
The most common levels of schooling among the 92 students in Ludlow are elementary school (35 | 38.0%), high school (25 | 27.2%), and middle school (18 | 19.6%).
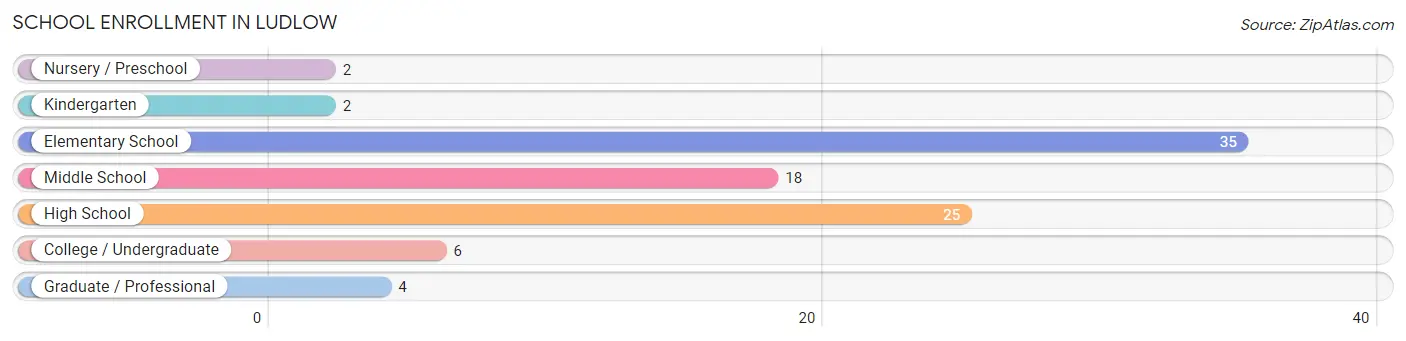
| School Level | # Students | % Students |
| Nursery / Preschool | 2 | 2.2% |
| Kindergarten | 2 | 2.2% |
| Elementary School | 35 | 38.0% |
| Middle School | 18 | 19.6% |
| High School | 25 | 27.2% |
| College / Undergraduate | 6 | 6.5% |
| Graduate / Professional | 4 | 4.3% |
| Total | 92 | 100.0% |
School Enrollment by Age by Funding Source in Ludlow
Out of a total of 92 students who are enrolled in schools in Ludlow, 16 (17.4%) attend a private institution, while the remaining 76 (82.6%) are enrolled in public schools. The age group of 25 to 34 year olds has the highest likelihood of being enrolled in private schools, with 4 (100.0% in the age bracket) enrolled. Conversely, the age group of 3 to 4 year olds has the lowest likelihood of being enrolled in a private school, with 2 (100.0% in the age bracket) attending a public institution.
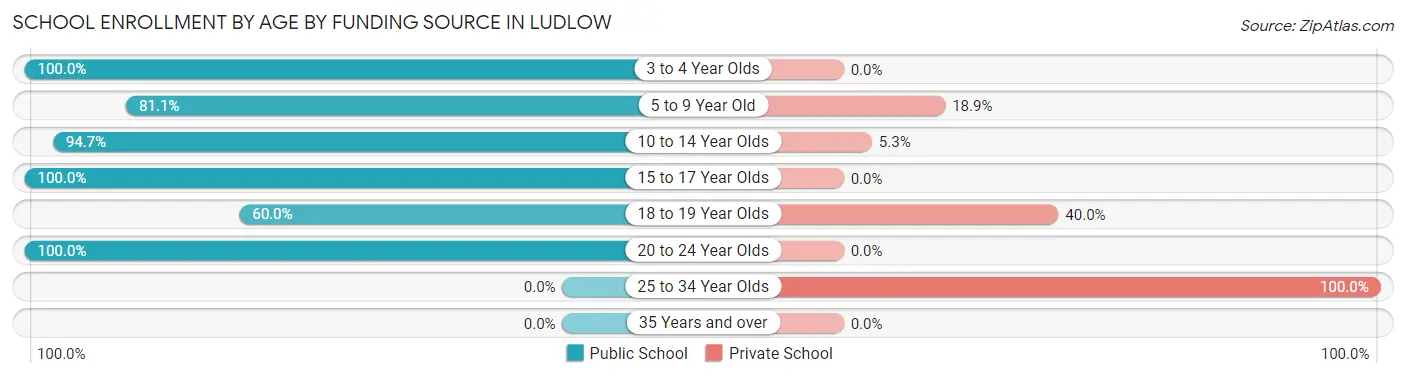
| Age Bracket | Public School | Private School |
| 3 to 4 Year Olds | 2 (100.0%) | 0 (0.0%) |
| 5 to 9 Year Old | 30 (81.1%) | 7 (18.9%) |
| 10 to 14 Year Olds | 18 (94.7%) | 1 (5.3%) |
| 15 to 17 Year Olds | 10 (100.0%) | 0 (0.0%) |
| 18 to 19 Year Olds | 6 (60.0%) | 4 (40.0%) |
| 20 to 24 Year Olds | 10 (100.0%) | 0 (0.0%) |
| 25 to 34 Year Olds | 0 (0.0%) | 4 (100.0%) |
| 35 Years and over | 0 (0.0%) | 0 (0.0%) |
| Total | 76 (82.6%) | 16 (17.4%) |
Educational Attainment by Field of Study in Ludlow
Business (40 | 17.6%), literature & languages (32 | 14.1%), liberal arts & history (28 | 12.3%), education (27 | 11.9%), and science & technology (26 | 11.5%) are the most common fields of study among 227 individuals in Ludlow who have obtained a bachelor's degree or higher.
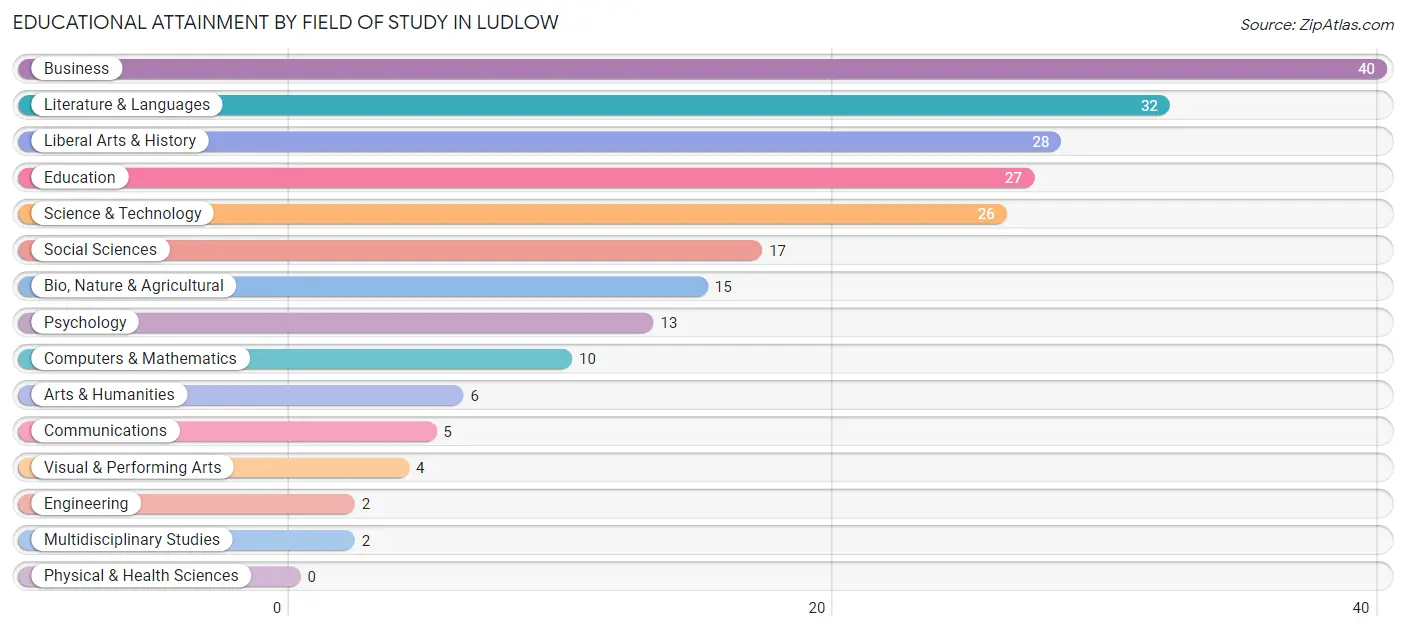
| Field of Study | # Graduates | % Graduates |
| Computers & Mathematics | 10 | 4.4% |
| Bio, Nature & Agricultural | 15 | 6.6% |
| Physical & Health Sciences | 0 | 0.0% |
| Psychology | 13 | 5.7% |
| Social Sciences | 17 | 7.5% |
| Engineering | 2 | 0.9% |
| Multidisciplinary Studies | 2 | 0.9% |
| Science & Technology | 26 | 11.5% |
| Business | 40 | 17.6% |
| Education | 27 | 11.9% |
| Literature & Languages | 32 | 14.1% |
| Liberal Arts & History | 28 | 12.3% |
| Visual & Performing Arts | 4 | 1.8% |
| Communications | 5 | 2.2% |
| Arts & Humanities | 6 | 2.6% |
| Total | 227 | 100.0% |
Transportation & Commute in Ludlow
Vehicle Availability by Sex in Ludlow
The most prevalent vehicle ownership categories in Ludlow are males with 2 vehicles (61, accounting for 36.3%) and females with 2 vehicles (62, making up 28.8%).
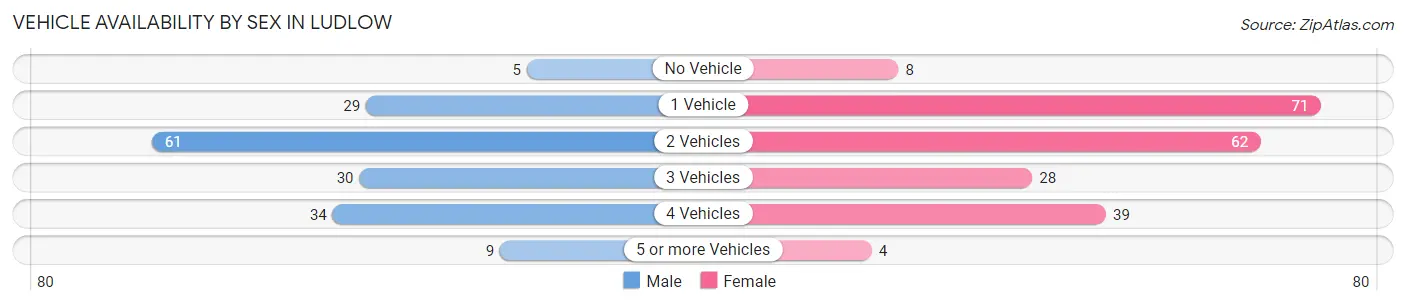
| Vehicles Available | Male | Female |
| No Vehicle | 5 (3.0%) | 8 (3.8%) |
| 1 Vehicle | 29 (17.3%) | 71 (33.5%) |
| 2 Vehicles | 61 (36.3%) | 62 (29.2%) |
| 3 Vehicles | 30 (17.9%) | 28 (13.2%) |
| 4 Vehicles | 34 (20.2%) | 39 (18.4%) |
| 5 or more Vehicles | 9 (5.4%) | 4 (1.9%) |
| Total | 168 (100.0%) | 212 (100.0%) |
Commute Time in Ludlow
The most frequently occuring commute durations in Ludlow are 5 to 9 minutes (103 commuters, 30.2%), 30 to 34 minutes (55 commuters, 16.1%), and less than 5 minutes (34 commuters, 10.0%).

| Commute Time | # Commuters | % Commuters |
| Less than 5 Minutes | 34 | 10.0% |
| 5 to 9 Minutes | 103 | 30.2% |
| 10 to 14 Minutes | 29 | 8.5% |
| 15 to 19 Minutes | 20 | 5.9% |
| 20 to 24 Minutes | 25 | 7.3% |
| 25 to 29 Minutes | 28 | 8.2% |
| 30 to 34 Minutes | 55 | 16.1% |
| 35 to 39 Minutes | 9 | 2.6% |
| 40 to 44 Minutes | 0 | 0.0% |
| 45 to 59 Minutes | 25 | 7.3% |
| 60 to 89 Minutes | 8 | 2.4% |
| 90 or more Minutes | 5 | 1.5% |
Commute Time by Sex in Ludlow
The most common commute times in Ludlow are 5 to 9 minutes (27 commuters, 18.5%) for males and 5 to 9 minutes (76 commuters, 39.0%) for females.
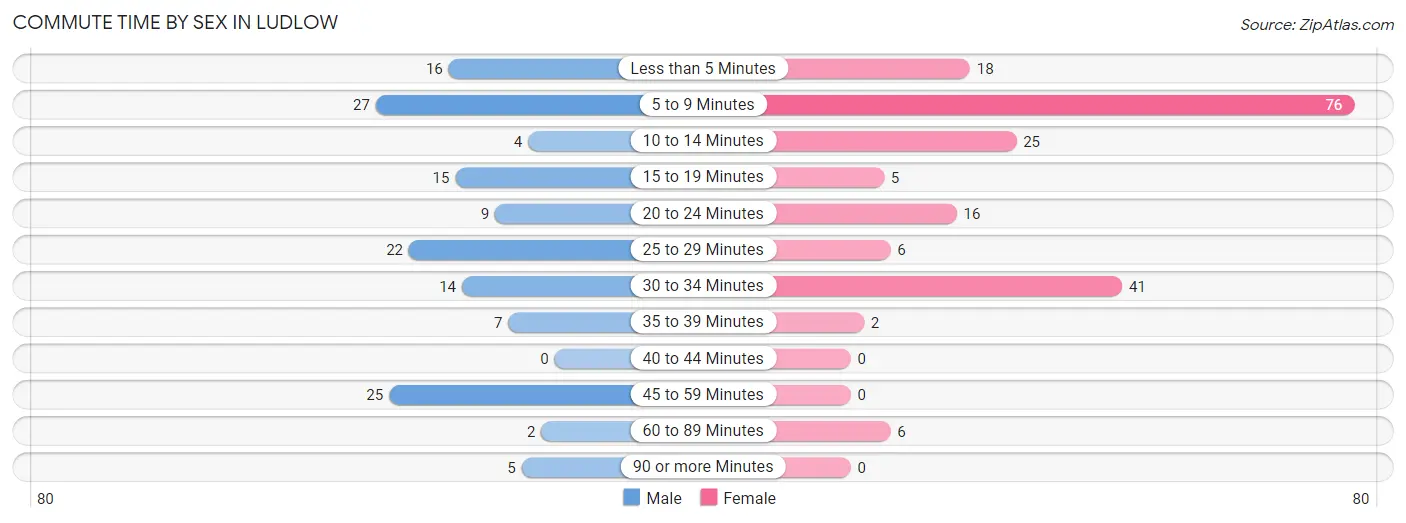
| Commute Time | Male | Female |
| Less than 5 Minutes | 16 (11.0%) | 18 (9.2%) |
| 5 to 9 Minutes | 27 (18.5%) | 76 (39.0%) |
| 10 to 14 Minutes | 4 (2.7%) | 25 (12.8%) |
| 15 to 19 Minutes | 15 (10.3%) | 5 (2.6%) |
| 20 to 24 Minutes | 9 (6.2%) | 16 (8.2%) |
| 25 to 29 Minutes | 22 (15.1%) | 6 (3.1%) |
| 30 to 34 Minutes | 14 (9.6%) | 41 (21.0%) |
| 35 to 39 Minutes | 7 (4.8%) | 2 (1.0%) |
| 40 to 44 Minutes | 0 (0.0%) | 0 (0.0%) |
| 45 to 59 Minutes | 25 (17.1%) | 0 (0.0%) |
| 60 to 89 Minutes | 2 (1.4%) | 6 (3.1%) |
| 90 or more Minutes | 5 (3.4%) | 0 (0.0%) |
Time of Departure to Work by Sex in Ludlow
The most frequent times of departure to work in Ludlow are 6:30 AM to 6:59 AM (41, 28.1%) for males and 7:30 AM to 7:59 AM (69, 35.4%) for females.
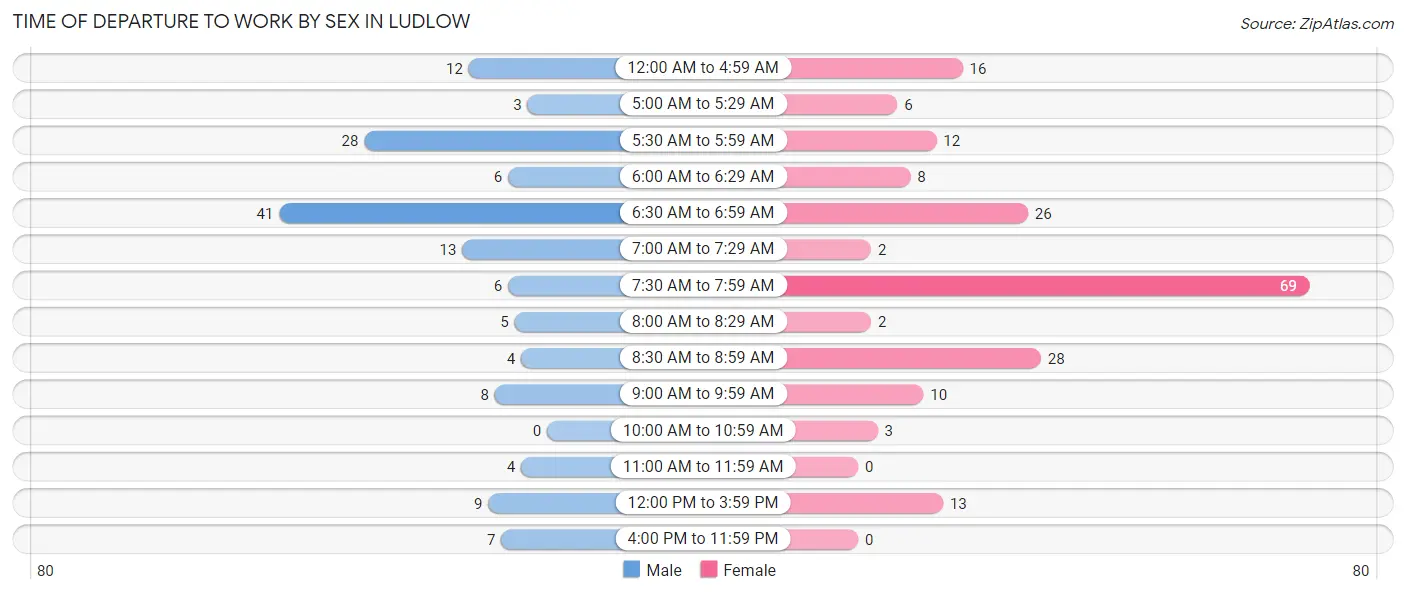
| Time of Departure | Male | Female |
| 12:00 AM to 4:59 AM | 12 (8.2%) | 16 (8.2%) |
| 5:00 AM to 5:29 AM | 3 (2.1%) | 6 (3.1%) |
| 5:30 AM to 5:59 AM | 28 (19.2%) | 12 (6.1%) |
| 6:00 AM to 6:29 AM | 6 (4.1%) | 8 (4.1%) |
| 6:30 AM to 6:59 AM | 41 (28.1%) | 26 (13.3%) |
| 7:00 AM to 7:29 AM | 13 (8.9%) | 2 (1.0%) |
| 7:30 AM to 7:59 AM | 6 (4.1%) | 69 (35.4%) |
| 8:00 AM to 8:29 AM | 5 (3.4%) | 2 (1.0%) |
| 8:30 AM to 8:59 AM | 4 (2.7%) | 28 (14.4%) |
| 9:00 AM to 9:59 AM | 8 (5.5%) | 10 (5.1%) |
| 10:00 AM to 10:59 AM | 0 (0.0%) | 3 (1.5%) |
| 11:00 AM to 11:59 AM | 4 (2.7%) | 0 (0.0%) |
| 12:00 PM to 3:59 PM | 9 (6.2%) | 13 (6.7%) |
| 4:00 PM to 11:59 PM | 7 (4.8%) | 0 (0.0%) |
| Total | 146 (100.0%) | 195 (100.0%) |
Housing Occupancy in Ludlow
Occupancy by Ownership in Ludlow
Of the total 357 dwellings in Ludlow, owner-occupied units account for 166 (46.5%), while renter-occupied units make up 191 (53.5%).
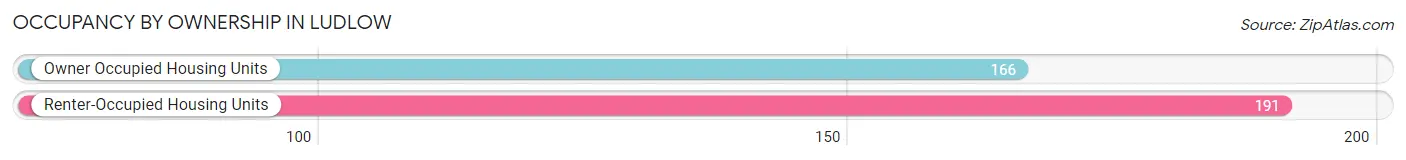
| Occupancy | # Housing Units | % Housing Units |
| Owner Occupied Housing Units | 166 | 46.5% |
| Renter-Occupied Housing Units | 191 | 53.5% |
| Total Occupied Housing Units | 357 | 100.0% |
Occupancy by Household Size in Ludlow
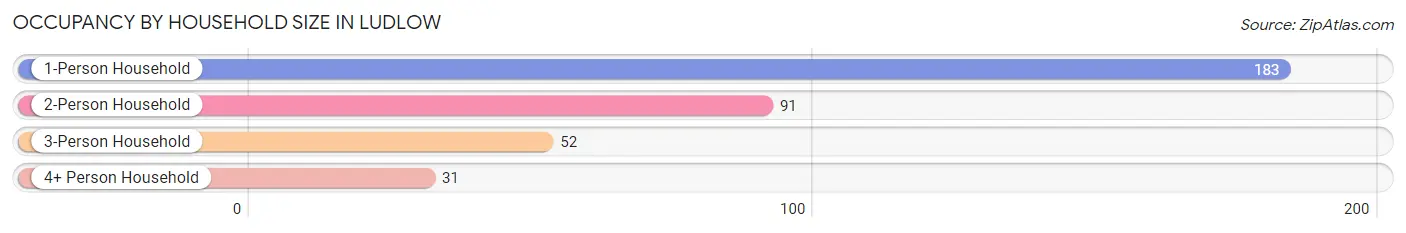
| Household Size | # Housing Units | % Housing Units |
| 1-Person Household | 183 | 51.3% |
| 2-Person Household | 91 | 25.5% |
| 3-Person Household | 52 | 14.6% |
| 4+ Person Household | 31 | 8.7% |
| Total Housing Units | 357 | 100.0% |
Occupancy by Ownership by Household Size in Ludlow
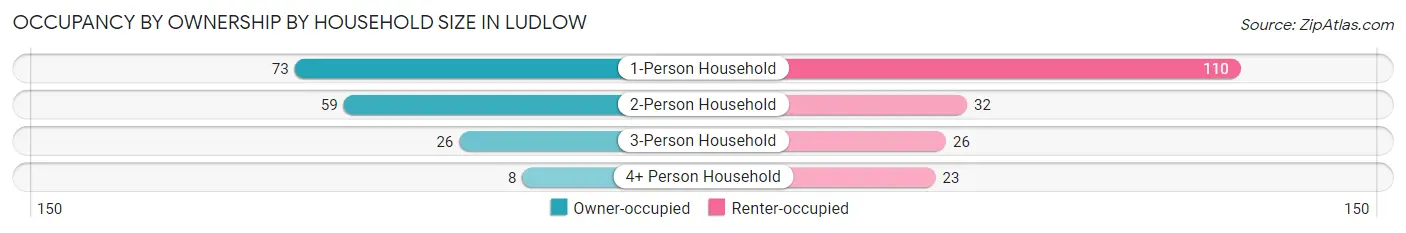
| Household Size | Owner-occupied | Renter-occupied |
| 1-Person Household | 73 (39.9%) | 110 (60.1%) |
| 2-Person Household | 59 (64.8%) | 32 (35.2%) |
| 3-Person Household | 26 (50.0%) | 26 (50.0%) |
| 4+ Person Household | 8 (25.8%) | 23 (74.2%) |
| Total Housing Units | 166 (46.5%) | 191 (53.5%) |
Occupancy by Educational Attainment in Ludlow
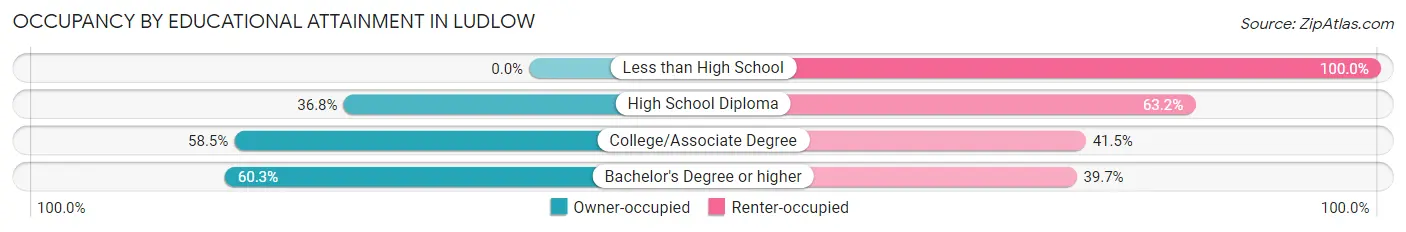
| Household Size | Owner-occupied | Renter-occupied |
| Less than High School | 0 (0.0%) | 31 (100.0%) |
| High School Diploma | 46 (36.8%) | 79 (63.2%) |
| College/Associate Degree | 38 (58.5%) | 27 (41.5%) |
| Bachelor's Degree or higher | 82 (60.3%) | 54 (39.7%) |
Occupancy by Age of Householder in Ludlow
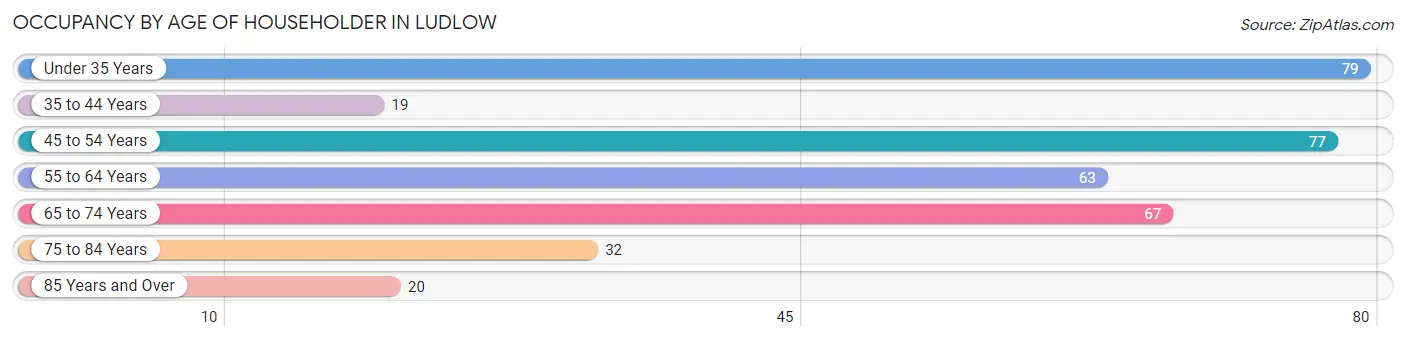
| Age Bracket | # Households | % Households |
| Under 35 Years | 79 | 22.1% |
| 35 to 44 Years | 19 | 5.3% |
| 45 to 54 Years | 77 | 21.6% |
| 55 to 64 Years | 63 | 17.6% |
| 65 to 74 Years | 67 | 18.8% |
| 75 to 84 Years | 32 | 9.0% |
| 85 Years and Over | 20 | 5.6% |
| Total | 357 | 100.0% |
Housing Finances in Ludlow
Median Income by Occupancy in Ludlow
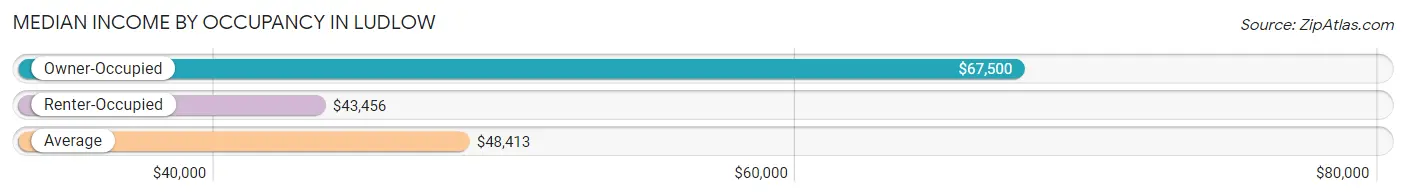
| Occupancy Type | # Households | Median Income |
| Owner-Occupied | 166 (46.5%) | $67,500 |
| Renter-Occupied | 191 (53.5%) | $43,456 |
| Average | 357 (100.0%) | $48,413 |
Occupancy by Householder Income Bracket in Ludlow
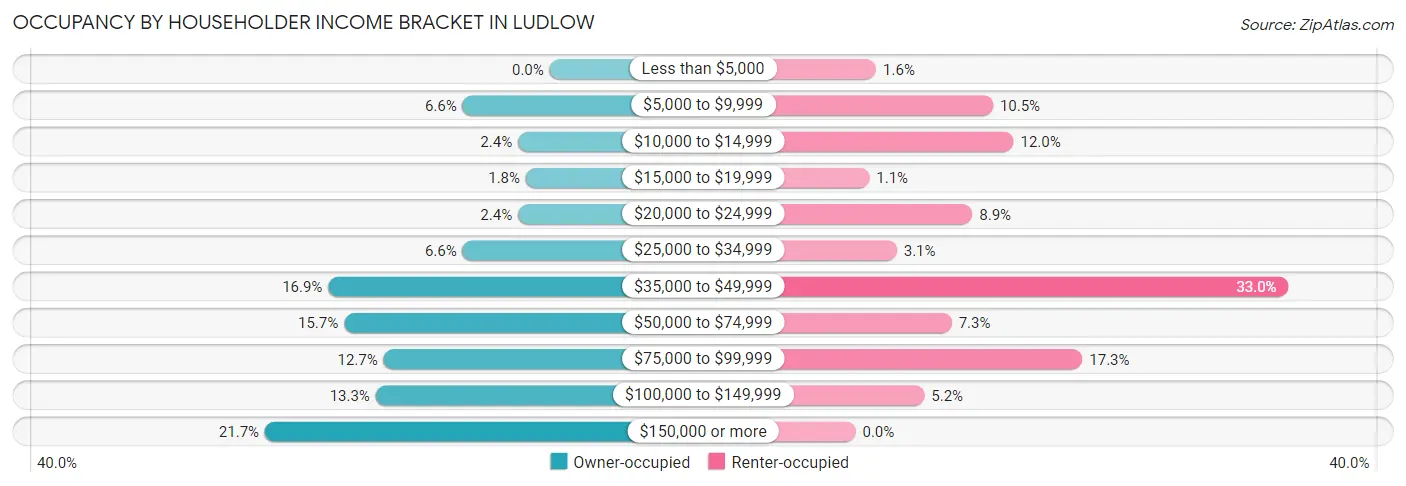
| Income Bracket | Owner-occupied | Renter-occupied |
| Less than $5,000 | 0 (0.0%) | 3 (1.6%) |
| $5,000 to $9,999 | 11 (6.6%) | 20 (10.5%) |
| $10,000 to $14,999 | 4 (2.4%) | 23 (12.0%) |
| $15,000 to $19,999 | 3 (1.8%) | 2 (1.1%) |
| $20,000 to $24,999 | 4 (2.4%) | 17 (8.9%) |
| $25,000 to $34,999 | 11 (6.6%) | 6 (3.1%) |
| $35,000 to $49,999 | 28 (16.9%) | 63 (33.0%) |
| $50,000 to $74,999 | 26 (15.7%) | 14 (7.3%) |
| $75,000 to $99,999 | 21 (12.7%) | 33 (17.3%) |
| $100,000 to $149,999 | 22 (13.3%) | 10 (5.2%) |
| $150,000 or more | 36 (21.7%) | 0 (0.0%) |
| Total | 166 (100.0%) | 191 (100.0%) |
Monthly Housing Cost Tiers in Ludlow
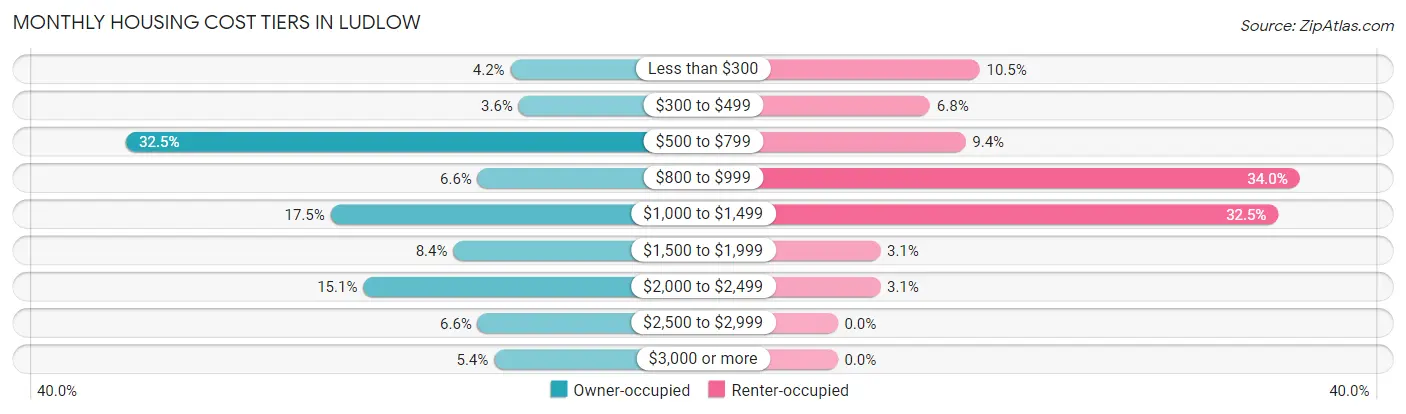
| Monthly Cost | Owner-occupied | Renter-occupied |
| Less than $300 | 7 (4.2%) | 20 (10.5%) |
| $300 to $499 | 6 (3.6%) | 13 (6.8%) |
| $500 to $799 | 54 (32.5%) | 18 (9.4%) |
| $800 to $999 | 11 (6.6%) | 65 (34.0%) |
| $1,000 to $1,499 | 29 (17.5%) | 62 (32.5%) |
| $1,500 to $1,999 | 14 (8.4%) | 6 (3.1%) |
| $2,000 to $2,499 | 25 (15.1%) | 6 (3.1%) |
| $2,500 to $2,999 | 11 (6.6%) | 0 (0.0%) |
| $3,000 or more | 9 (5.4%) | 0 (0.0%) |
| Total | 166 (100.0%) | 191 (100.0%) |
Physical Housing Characteristics in Ludlow
Housing Structures in Ludlow
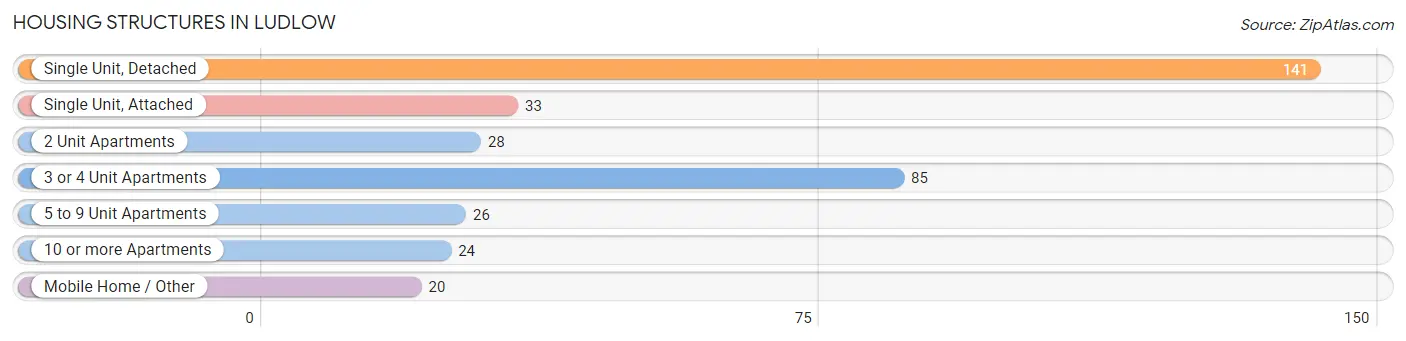
| Structure Type | # Housing Units | % Housing Units |
| Single Unit, Detached | 141 | 39.5% |
| Single Unit, Attached | 33 | 9.2% |
| 2 Unit Apartments | 28 | 7.8% |
| 3 or 4 Unit Apartments | 85 | 23.8% |
| 5 to 9 Unit Apartments | 26 | 7.3% |
| 10 or more Apartments | 24 | 6.7% |
| Mobile Home / Other | 20 | 5.6% |
| Total | 357 | 100.0% |
Housing Structures by Occupancy in Ludlow
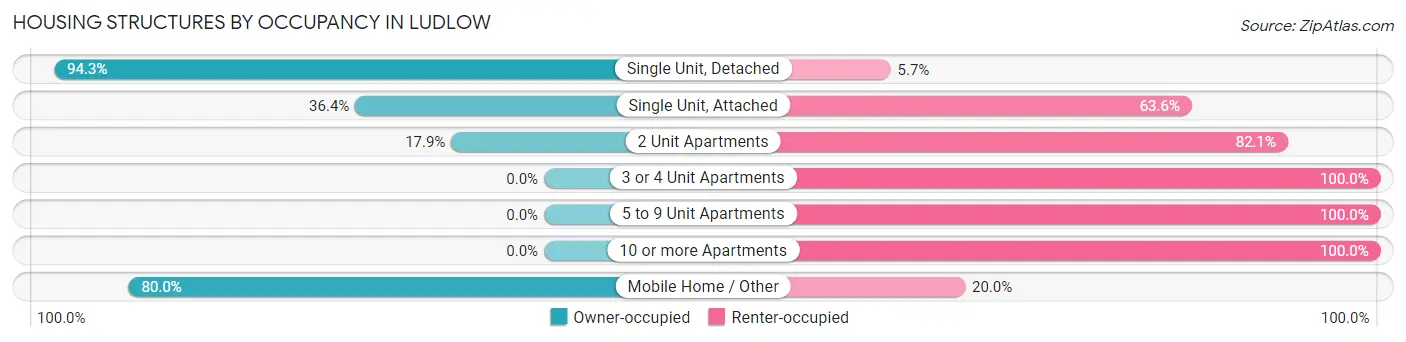
| Structure Type | Owner-occupied | Renter-occupied |
| Single Unit, Detached | 133 (94.3%) | 8 (5.7%) |
| Single Unit, Attached | 12 (36.4%) | 21 (63.6%) |
| 2 Unit Apartments | 5 (17.9%) | 23 (82.1%) |
| 3 or 4 Unit Apartments | 0 (0.0%) | 85 (100.0%) |
| 5 to 9 Unit Apartments | 0 (0.0%) | 26 (100.0%) |
| 10 or more Apartments | 0 (0.0%) | 24 (100.0%) |
| Mobile Home / Other | 16 (80.0%) | 4 (20.0%) |
| Total | 166 (46.5%) | 191 (53.5%) |
Housing Structures by Number of Rooms in Ludlow
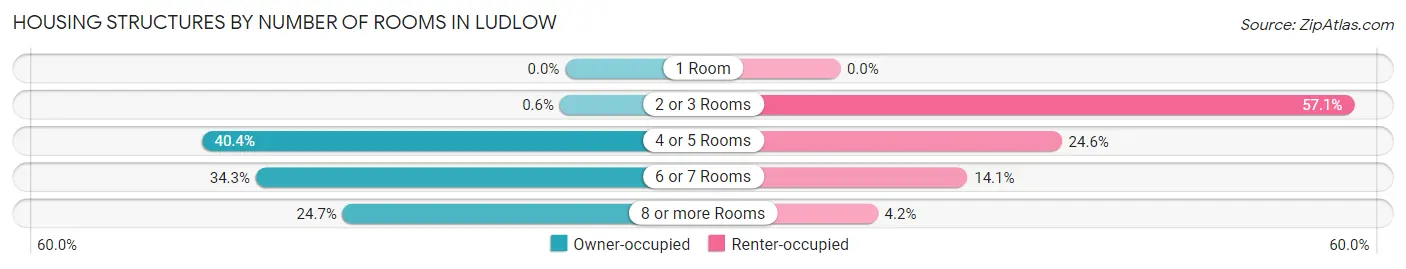
| Number of Rooms | Owner-occupied | Renter-occupied |
| 1 Room | 0 (0.0%) | 0 (0.0%) |
| 2 or 3 Rooms | 1 (0.6%) | 109 (57.1%) |
| 4 or 5 Rooms | 67 (40.4%) | 47 (24.6%) |
| 6 or 7 Rooms | 57 (34.3%) | 27 (14.1%) |
| 8 or more Rooms | 41 (24.7%) | 8 (4.2%) |
| Total | 166 (100.0%) | 191 (100.0%) |
Housing Structure by Heating Type in Ludlow
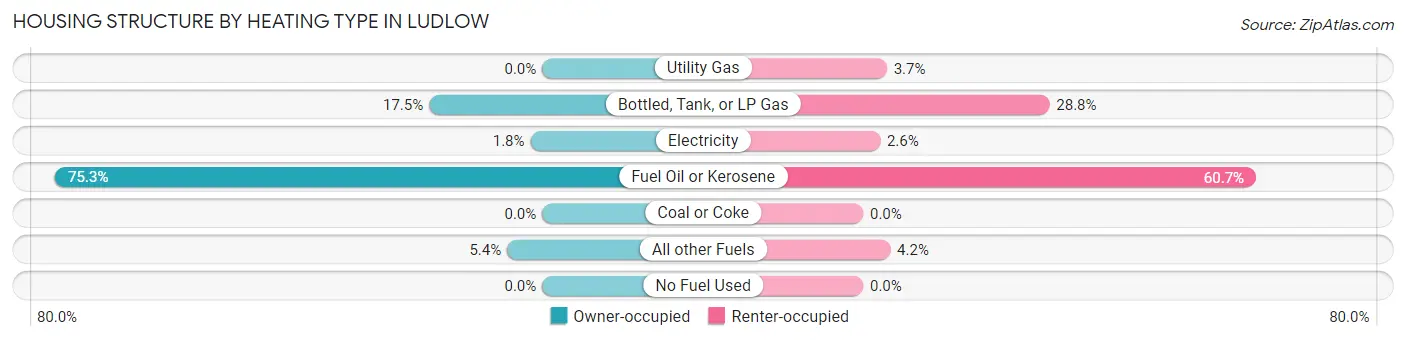
| Heating Type | Owner-occupied | Renter-occupied |
| Utility Gas | 0 (0.0%) | 7 (3.7%) |
| Bottled, Tank, or LP Gas | 29 (17.5%) | 55 (28.8%) |
| Electricity | 3 (1.8%) | 5 (2.6%) |
| Fuel Oil or Kerosene | 125 (75.3%) | 116 (60.7%) |
| Coal or Coke | 0 (0.0%) | 0 (0.0%) |
| All other Fuels | 9 (5.4%) | 8 (4.2%) |
| No Fuel Used | 0 (0.0%) | 0 (0.0%) |
| Total | 166 (100.0%) | 191 (100.0%) |
Household Vehicle Usage in Ludlow
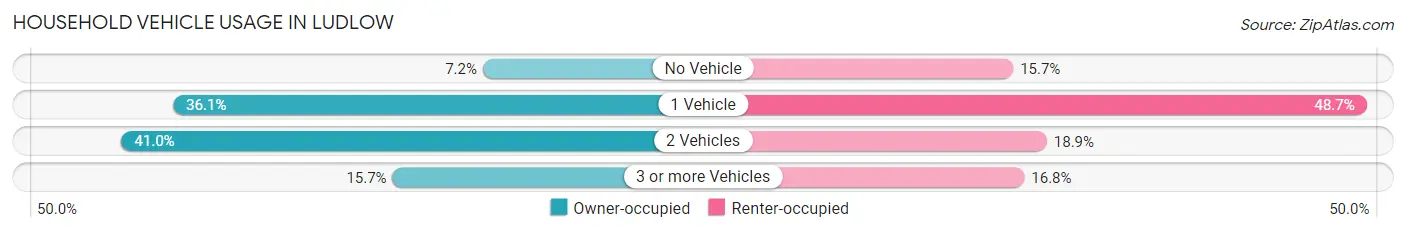
| Vehicles per Household | Owner-occupied | Renter-occupied |
| No Vehicle | 12 (7.2%) | 30 (15.7%) |
| 1 Vehicle | 60 (36.1%) | 93 (48.7%) |
| 2 Vehicles | 68 (41.0%) | 36 (18.9%) |
| 3 or more Vehicles | 26 (15.7%) | 32 (16.8%) |
| Total | 166 (100.0%) | 191 (100.0%) |
Real Estate & Mortgages in Ludlow
Real Estate and Mortgage Overview in Ludlow
| Characteristic | Without Mortgage | With Mortgage |
| Housing Units | 78 | 88 |
| Median Property Value | $217,500 | $275,000 |
| Median Household Income | $54,167 | $18 |
| Monthly Housing Costs | $690 | $9 |
| Real Estate Taxes | $3,841 | $0 |
Property Value by Mortgage Status in Ludlow
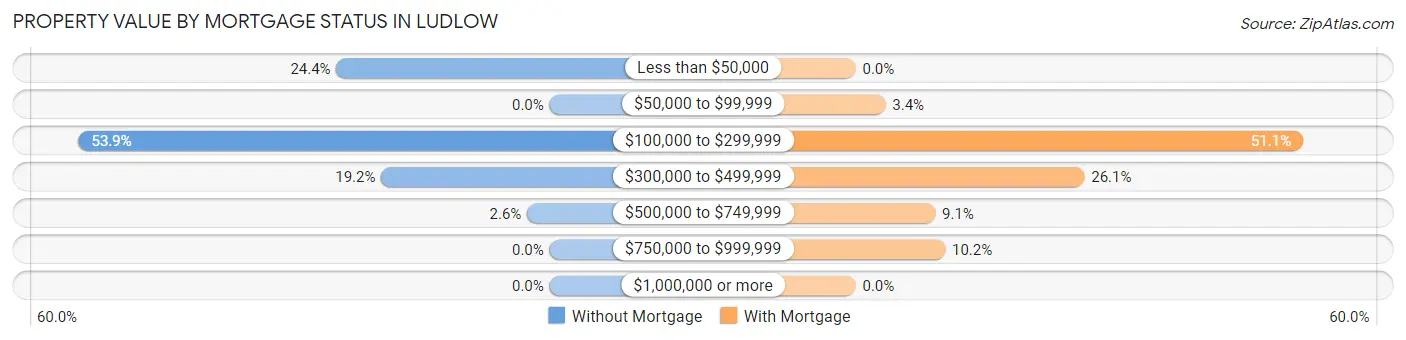
| Property Value | Without Mortgage | With Mortgage |
| Less than $50,000 | 19 (24.4%) | 0 (0.0%) |
| $50,000 to $99,999 | 0 (0.0%) | 3 (3.4%) |
| $100,000 to $299,999 | 42 (53.8%) | 45 (51.1%) |
| $300,000 to $499,999 | 15 (19.2%) | 23 (26.1%) |
| $500,000 to $749,999 | 2 (2.6%) | 8 (9.1%) |
| $750,000 to $999,999 | 0 (0.0%) | 9 (10.2%) |
| $1,000,000 or more | 0 (0.0%) | 0 (0.0%) |
| Total | 78 (100.0%) | 88 (100.0%) |
Household Income by Mortgage Status in Ludlow
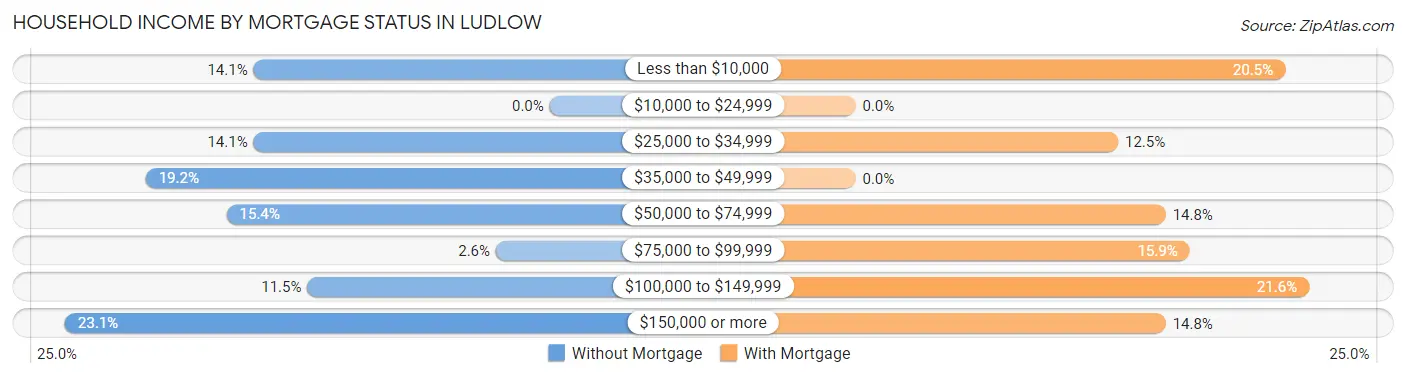
| Household Income | Without Mortgage | With Mortgage |
| Less than $10,000 | 11 (14.1%) | 18 (20.4%) |
| $10,000 to $24,999 | 0 (0.0%) | 0 (0.0%) |
| $25,000 to $34,999 | 11 (14.1%) | 11 (12.5%) |
| $35,000 to $49,999 | 15 (19.2%) | 0 (0.0%) |
| $50,000 to $74,999 | 12 (15.4%) | 13 (14.8%) |
| $75,000 to $99,999 | 2 (2.6%) | 14 (15.9%) |
| $100,000 to $149,999 | 9 (11.5%) | 19 (21.6%) |
| $150,000 or more | 18 (23.1%) | 13 (14.8%) |
| Total | 78 (100.0%) | 88 (100.0%) |
Property Value to Household Income Ratio in Ludlow
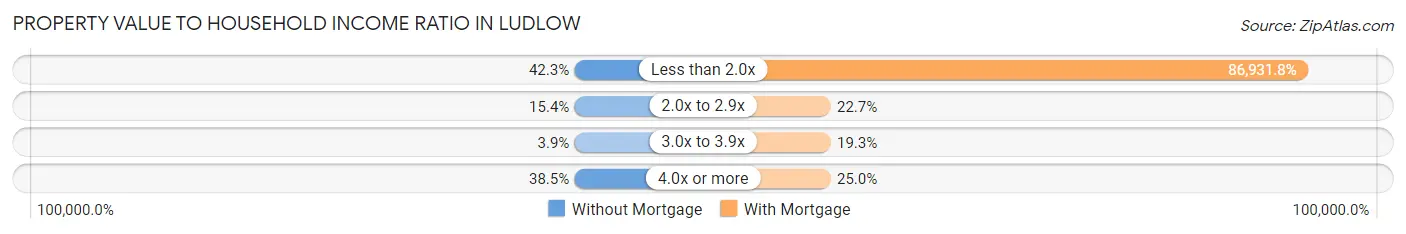
| Value-to-Income Ratio | Without Mortgage | With Mortgage |
| Less than 2.0x | 33 (42.3%) | 76,500 (86,931.8%) |
| 2.0x to 2.9x | 12 (15.4%) | 20 (22.7%) |
| 3.0x to 3.9x | 3 (3.8%) | 17 (19.3%) |
| 4.0x or more | 30 (38.5%) | 22 (25.0%) |
| Total | 78 (100.0%) | 88 (100.0%) |
Real Estate Taxes by Mortgage Status in Ludlow
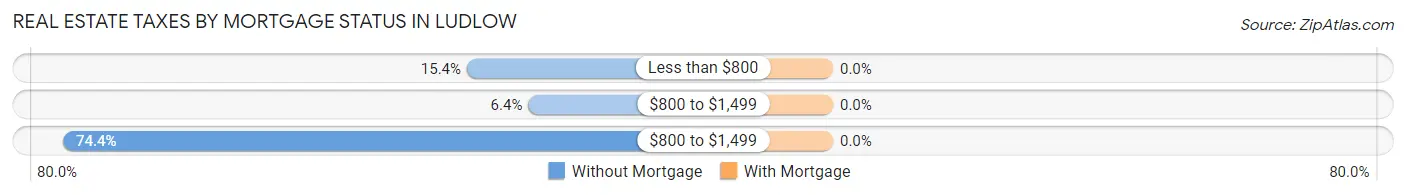
| Property Taxes | Without Mortgage | With Mortgage |
| Less than $800 | 12 (15.4%) | 0 (0.0%) |
| $800 to $1,499 | 5 (6.4%) | 0 (0.0%) |
| $800 to $1,499 | 58 (74.4%) | 0 (0.0%) |
| Total | 78 (100.0%) | 88 (100.0%) |
Health & Disability in Ludlow
Health Insurance Coverage by Age in Ludlow
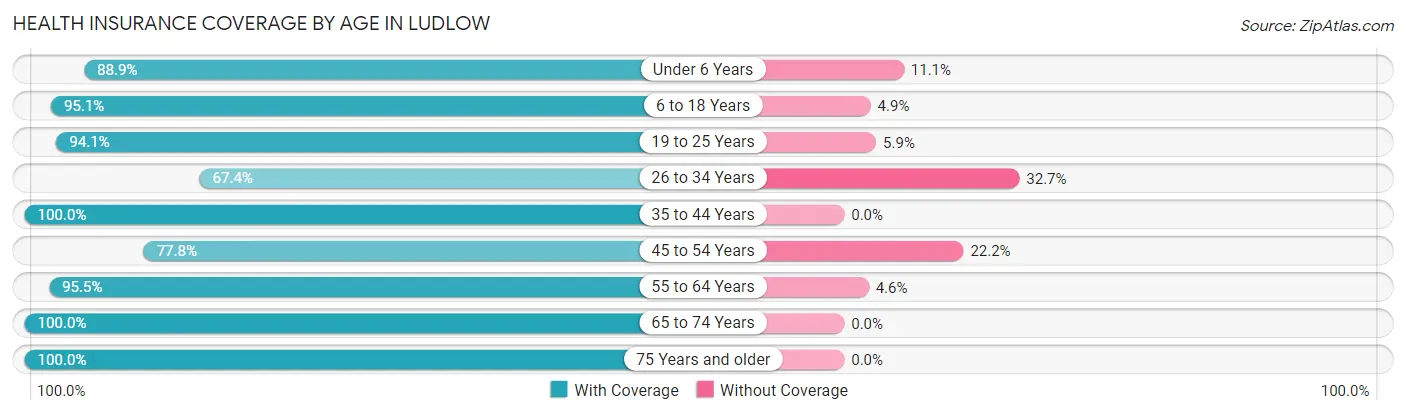
| Age Bracket | With Coverage | Without Coverage |
| Under 6 Years | 16 (88.9%) | 2 (11.1%) |
| 6 to 18 Years | 58 (95.1%) | 3 (4.9%) |
| 19 to 25 Years | 95 (94.1%) | 6 (5.9%) |
| 26 to 34 Years | 66 (67.3%) | 32 (32.7%) |
| 35 to 44 Years | 34 (100.0%) | 0 (0.0%) |
| 45 to 54 Years | 84 (77.8%) | 24 (22.2%) |
| 55 to 64 Years | 84 (95.5%) | 4 (4.5%) |
| 65 to 74 Years | 85 (100.0%) | 0 (0.0%) |
| 75 Years and older | 68 (100.0%) | 0 (0.0%) |
| Total | 590 (89.3%) | 71 (10.7%) |
Health Insurance Coverage by Citizenship Status in Ludlow
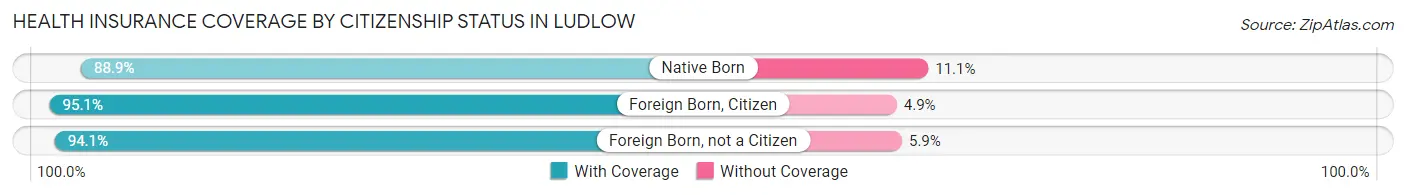
| Citizenship Status | With Coverage | Without Coverage |
| Native Born | 16 (88.9%) | 2 (11.1%) |
| Foreign Born, Citizen | 58 (95.1%) | 3 (4.9%) |
| Foreign Born, not a Citizen | 95 (94.1%) | 6 (5.9%) |
Health Insurance Coverage by Household Income in Ludlow
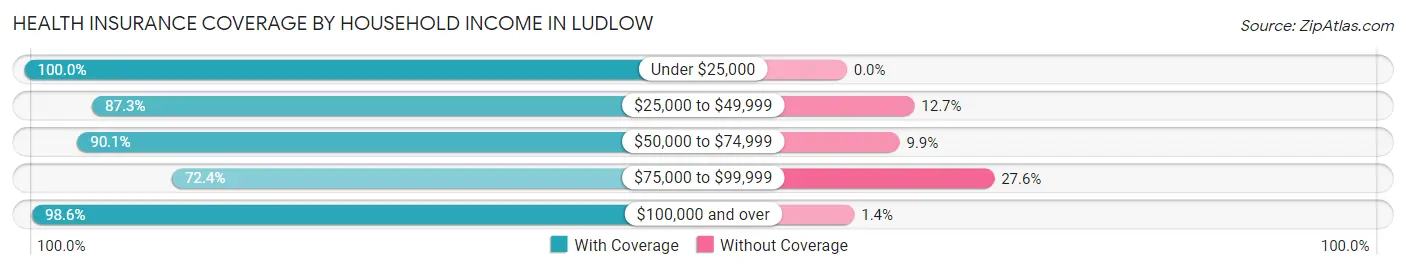
| Household Income | With Coverage | Without Coverage |
| Under $25,000 | 91 (100.0%) | 0 (0.0%) |
| $25,000 to $49,999 | 207 (87.3%) | 30 (12.7%) |
| $50,000 to $74,999 | 73 (90.1%) | 8 (9.9%) |
| $75,000 to $99,999 | 76 (72.4%) | 29 (27.6%) |
| $100,000 and over | 141 (98.6%) | 2 (1.4%) |
Public vs Private Health Insurance Coverage by Age in Ludlow
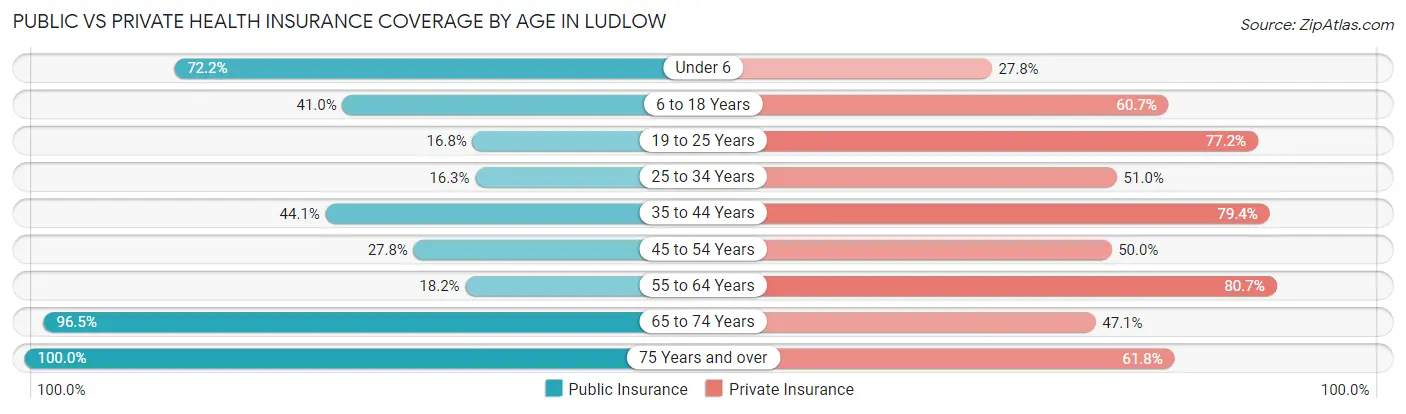
| Age Bracket | Public Insurance | Private Insurance |
| Under 6 | 13 (72.2%) | 5 (27.8%) |
| 6 to 18 Years | 25 (41.0%) | 37 (60.7%) |
| 19 to 25 Years | 17 (16.8%) | 78 (77.2%) |
| 25 to 34 Years | 16 (16.3%) | 50 (51.0%) |
| 35 to 44 Years | 15 (44.1%) | 27 (79.4%) |
| 45 to 54 Years | 30 (27.8%) | 54 (50.0%) |
| 55 to 64 Years | 16 (18.2%) | 71 (80.7%) |
| 65 to 74 Years | 82 (96.5%) | 40 (47.1%) |
| 75 Years and over | 68 (100.0%) | 42 (61.8%) |
| Total | 282 (42.7%) | 404 (61.1%) |
Disability Status by Sex by Age in Ludlow
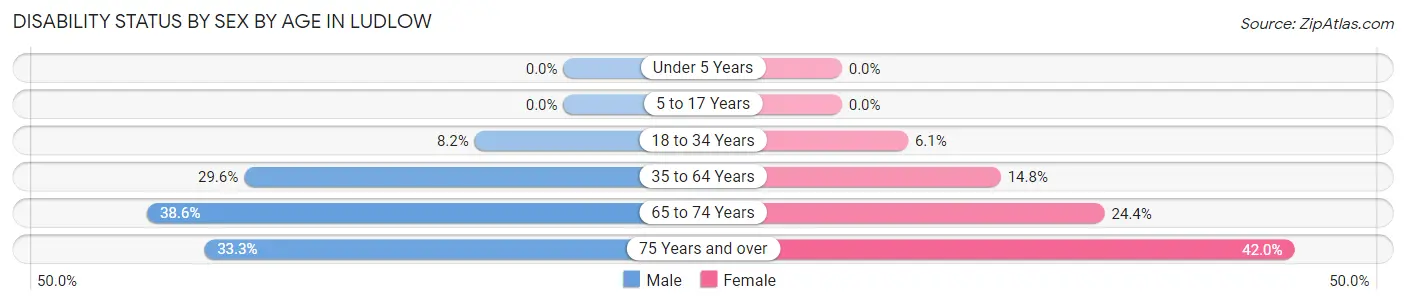
| Age Bracket | Male | Female |
| Under 5 Years | 0 (0.0%) | 0 (0.0%) |
| 5 to 17 Years | 0 (0.0%) | 0 (0.0%) |
| 18 to 34 Years | 7 (8.2%) | 7 (6.1%) |
| 35 to 64 Years | 32 (29.6%) | 18 (14.7%) |
| 65 to 74 Years | 17 (38.6%) | 10 (24.4%) |
| 75 Years and over | 6 (33.3%) | 21 (42.0%) |
Disability Class by Sex by Age in Ludlow
Disability Class: Hearing Difficulty
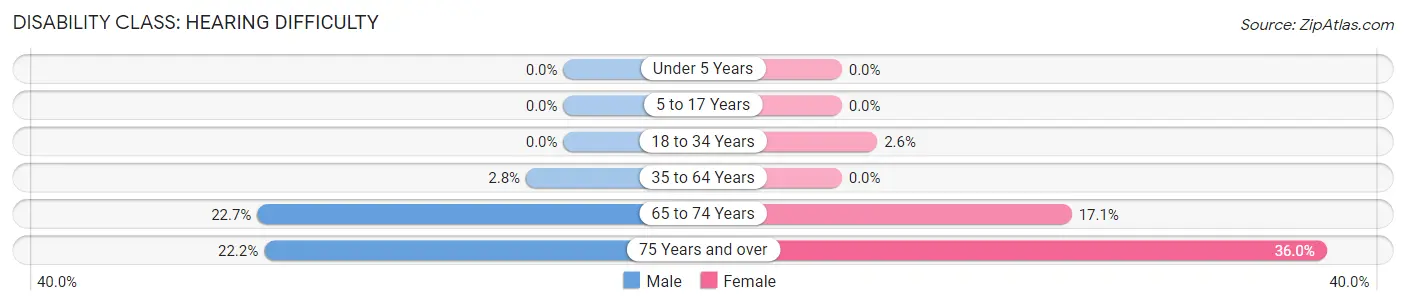
| Age Bracket | Male | Female |
| Under 5 Years | 0 (0.0%) | 0 (0.0%) |
| 5 to 17 Years | 0 (0.0%) | 0 (0.0%) |
| 18 to 34 Years | 0 (0.0%) | 3 (2.6%) |
| 35 to 64 Years | 3 (2.8%) | 0 (0.0%) |
| 65 to 74 Years | 10 (22.7%) | 7 (17.1%) |
| 75 Years and over | 4 (22.2%) | 18 (36.0%) |
Disability Class: Vision Difficulty
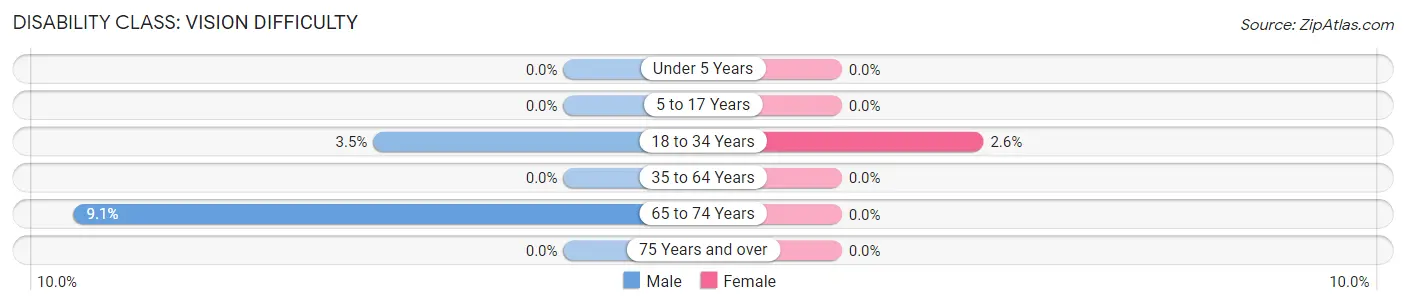
| Age Bracket | Male | Female |
| Under 5 Years | 0 (0.0%) | 0 (0.0%) |
| 5 to 17 Years | 0 (0.0%) | 0 (0.0%) |
| 18 to 34 Years | 3 (3.5%) | 3 (2.6%) |
| 35 to 64 Years | 0 (0.0%) | 0 (0.0%) |
| 65 to 74 Years | 4 (9.1%) | 0 (0.0%) |
| 75 Years and over | 0 (0.0%) | 0 (0.0%) |
Disability Class: Cognitive Difficulty
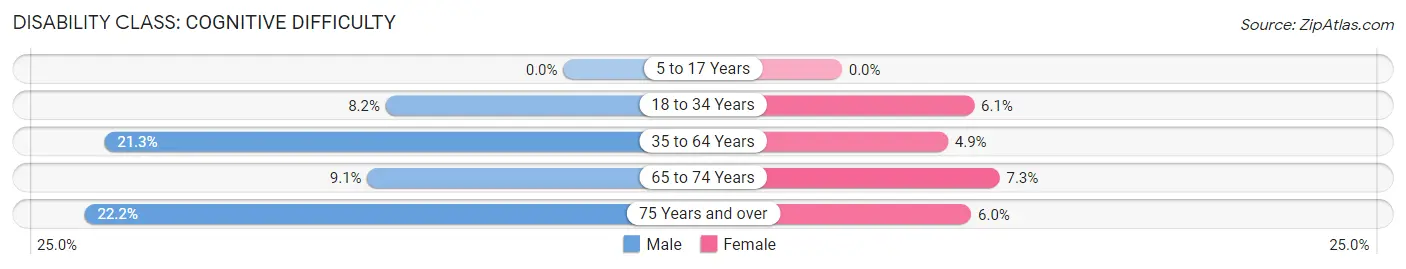
| Age Bracket | Male | Female |
| 5 to 17 Years | 0 (0.0%) | 0 (0.0%) |
| 18 to 34 Years | 7 (8.2%) | 7 (6.1%) |
| 35 to 64 Years | 23 (21.3%) | 6 (4.9%) |
| 65 to 74 Years | 4 (9.1%) | 3 (7.3%) |
| 75 Years and over | 4 (22.2%) | 3 (6.0%) |
Disability Class: Ambulatory Difficulty
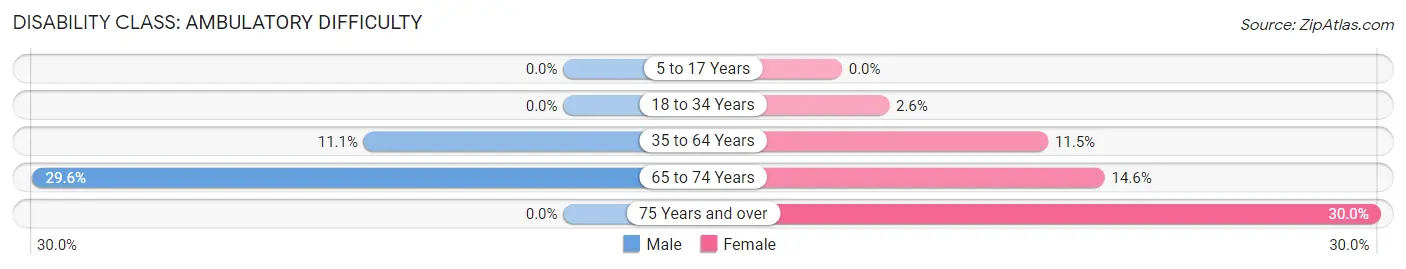
| Age Bracket | Male | Female |
| 5 to 17 Years | 0 (0.0%) | 0 (0.0%) |
| 18 to 34 Years | 0 (0.0%) | 3 (2.6%) |
| 35 to 64 Years | 12 (11.1%) | 14 (11.5%) |
| 65 to 74 Years | 13 (29.5%) | 6 (14.6%) |
| 75 Years and over | 0 (0.0%) | 15 (30.0%) |
Disability Class: Self-Care Difficulty
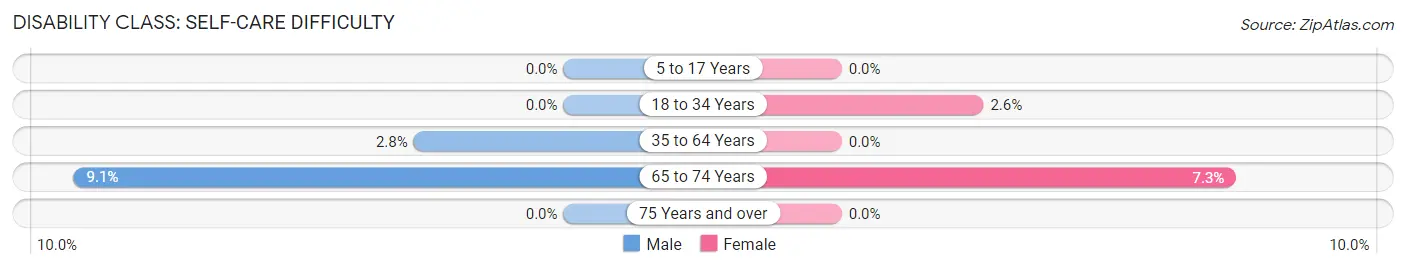
| Age Bracket | Male | Female |
| 5 to 17 Years | 0 (0.0%) | 0 (0.0%) |
| 18 to 34 Years | 0 (0.0%) | 3 (2.6%) |
| 35 to 64 Years | 3 (2.8%) | 0 (0.0%) |
| 65 to 74 Years | 4 (9.1%) | 3 (7.3%) |
| 75 Years and over | 0 (0.0%) | 0 (0.0%) |
Technology Access in Ludlow
Computing Device Access in Ludlow
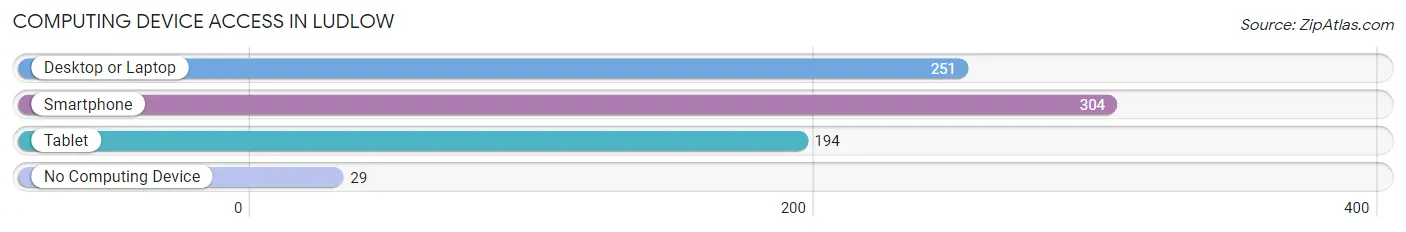
| Device Type | # Households | % Households |
| Desktop or Laptop | 251 | 70.3% |
| Smartphone | 304 | 85.2% |
| Tablet | 194 | 54.3% |
| No Computing Device | 29 | 8.1% |
| Total | 357 | 100.0% |
Internet Access in Ludlow
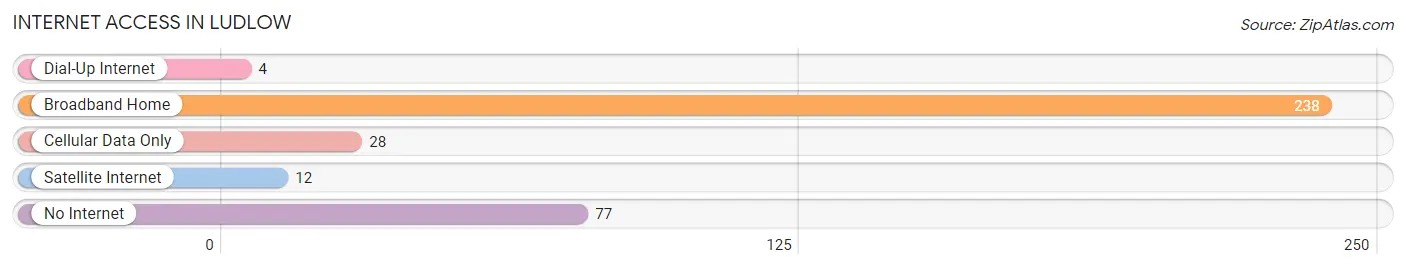
| Internet Type | # Households | % Households |
| Dial-Up Internet | 4 | 1.1% |
| Broadband Home | 238 | 66.7% |
| Cellular Data Only | 28 | 7.8% |
| Satellite Internet | 12 | 3.4% |
| No Internet | 77 | 21.6% |
| Total | 357 | 100.0% |
Ludlow Summary
Ludlow, Vermont is a small town located in Windsor County in the state of Vermont. It is situated in the Green Mountains and is part of the Okemo Valley region. The town was first settled in 1774 and was incorporated in 1782. The town is named after the Earl of Ludlow, who was a British nobleman.
Geography
Ludlow is located in the southeastern part of Vermont, in the Okemo Valley region. It is bordered by the towns of Cavendish, Plymouth, Mount Holly, and Proctorsville. The town is situated in the Green Mountains and is surrounded by the Black River, which flows through the town. The town has a total area of 24.2 square miles, of which 24.1 square miles is land and 0.1 square miles is water. The highest point in the town is Mount Ascutney, which has an elevation of 3,144 feet.
Economy
Ludlow’s economy is largely based on tourism. The town is home to the Okemo Mountain Resort, which is a popular ski resort. The resort attracts visitors from all over the world and provides jobs for many of the town’s residents. The town is also home to several other businesses, including restaurants, shops, and lodging.
Demographics
As of the 2010 census, the town had a population of 1,963. The median age of the population was 44.7 years. The racial makeup of the town was 97.2% White, 0.3% African American, 0.3% Native American, 0.5% Asian, 0.1% Pacific Islander, 0.3% from other races, and 1.3% from two or more races. The median household income was $50,938 and the median family income was $60,938.
History
Ludlow was first settled in 1774 by settlers from Connecticut. The town was incorporated in 1782 and was named after the Earl of Ludlow, who was a British nobleman. The town was an important stop on the stagecoach route between Boston and Montreal. The town was also an important stop on the railroad line between Boston and Montreal. The town was home to several mills, including a woolen mill, a paper mill, and a grist mill. The town was also home to several quarries, which provided stone for many of the buildings in the area. The town was also home to several farms, which provided food for the local population.
In the late 19th century, the town was home to several resorts, which attracted visitors from all over the country. The town was also home to several summer camps, which provided activities for children. The town was also home to several ski resorts, which attracted visitors from all over the world.
Today, Ludlow is a popular tourist destination. The town is home to the Okemo Mountain Resort, which is a popular ski resort. The town is also home to several restaurants, shops, and lodging. The town is also home to several festivals, including the Okemo Valley Music Festival and the Okemo Valley Craft Fair.
Common Questions
What is Per Capita Income in Ludlow?
Per Capita income in Ludlow is $43,620.
What is the Median Family Income in Ludlow?
Median Family Income in Ludlow is $73,750.
What is the Median Household income in Ludlow?
Median Household Income in Ludlow is $48,413.
What is Income or Wage Gap in Ludlow?
Income or Wage Gap in Ludlow is 25.9%.
Women in Ludlow earn 74.1 cents for every dollar earned by a man.
What is Inequality or Gini Index in Ludlow?
Inequality or Gini Index in Ludlow is 0.56.
What is the Total Population of Ludlow?
Total Population of Ludlow is 711.
What is the Total Male Population of Ludlow?
Total Male Population of Ludlow is 324.
What is the Total Female Population of Ludlow?
Total Female Population of Ludlow is 387.
What is the Ratio of Males per 100 Females in Ludlow?
There are 83.72 Males per 100 Females in Ludlow.
What is the Ratio of Females per 100 Males in Ludlow?
There are 119.44 Females per 100 Males in Ludlow.
What is the Median Population Age in Ludlow?
Median Population Age in Ludlow is 48.1 Years.
What is the Average Family Size in Ludlow
Average Family Size in Ludlow is 2.6 People.
What is the Average Household Size in Ludlow
Average Household Size in Ludlow is 1.8 People.
How Large is the Labor Force in Ludlow?
There are 397 People in the Labor Forcein in Ludlow.
What is the Percentage of People in the Labor Force in Ludlow?
62.1% of People are in the Labor Force in Ludlow.
What is the Unemployment Rate in Ludlow?
Unemployment Rate in Ludlow is 3.5%.