Zip Codes with the Highest Percentage of Population Employed in Security & Protection in Burlington, VT
RELATED REPORTS & OPTIONS
Security & Protection
Burlington
Compare Zip Codes
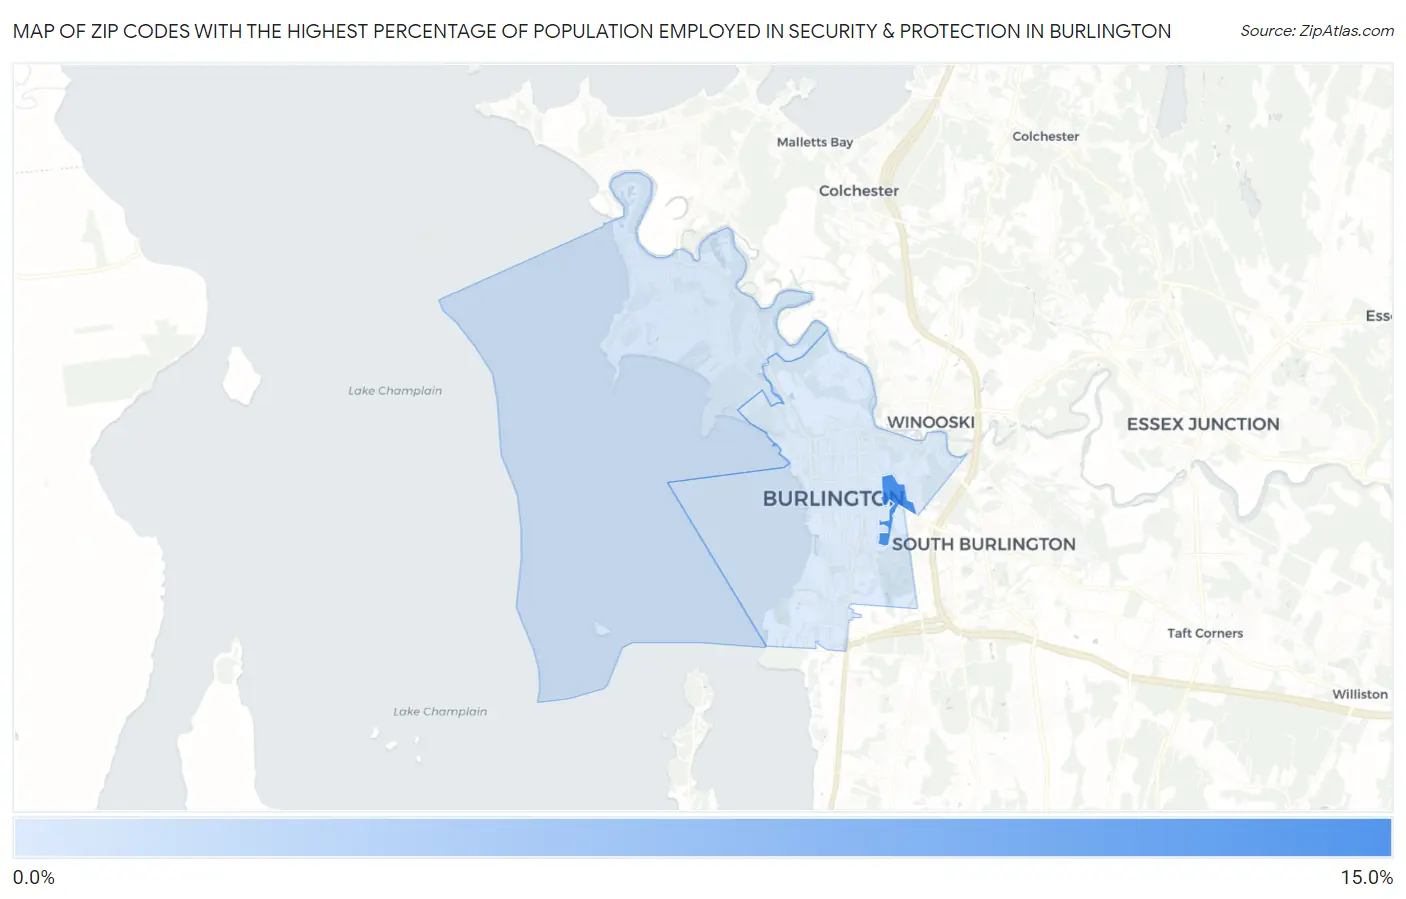
Map of Zip Codes with the Highest Percentage of Population Employed in Security & Protection in Burlington
1.1%
13.1%
Zip Codes with the Highest Percentage of Population Employed in Security & Protection in Burlington, VT
| Zip Code | % Employed | vs State | vs National | |
| 1. | 05405 | 13.1% | 1.4%(+11.7)#4 | 2.1%(+10.9)#473 |
| 2. | 05408 | 1.4% | 1.4%(+0.037)#75 | 2.1%(-0.761)#17,045 |
| 3. | 05401 | 1.1% | 1.4%(-0.292)#90 | 2.1%(-1.09)#19,592 |
1
Common Questions
What are the Top Zip Codes with the Highest Percentage of Population Employed in Security & Protection in Burlington, VT?
Top Zip Codes with the Highest Percentage of Population Employed in Security & Protection in Burlington, VT are:
What zip code has the Highest Percentage of Population Employed in Security & Protection in Burlington, VT?
05405 has the Highest Percentage of Population Employed in Security & Protection in Burlington, VT with 13.1%.
What is the Percentage of Population Employed in Security & Protection in Burlington, VT?
Percentage of Population Employed in Security & Protection in Burlington is 1.5%.
What is the Percentage of Population Employed in Security & Protection in Vermont?
Percentage of Population Employed in Security & Protection in Vermont is 1.4%.
What is the Percentage of Population Employed in Security & Protection in the United States?
Percentage of Population Employed in Security & Protection in the United States is 2.1%.