Canaan, VT Map & Demographics
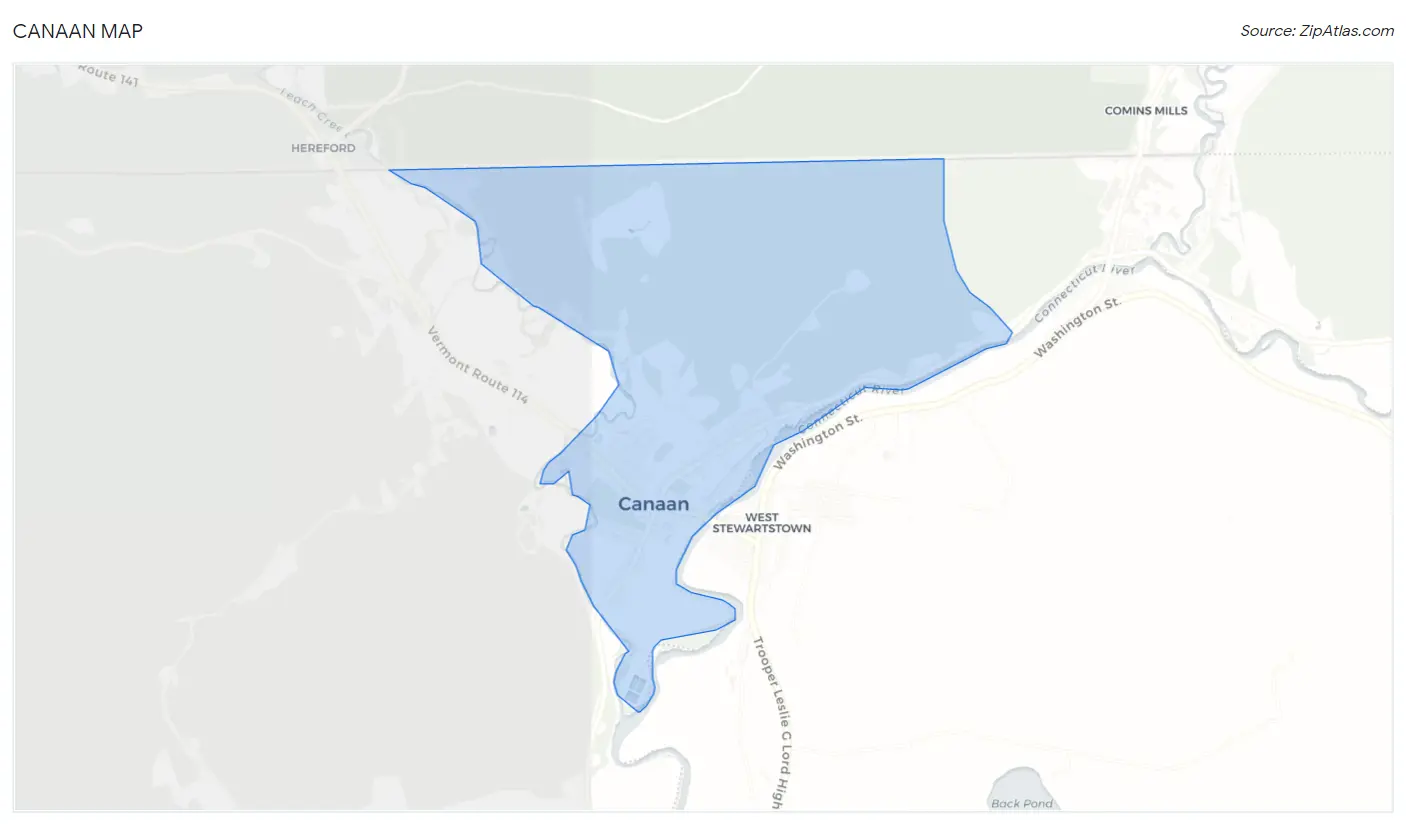
Canaan Map
Canaan Overview
$32,476
PER CAPITA INCOME
$63,125
AVG FAMILY INCOME
$58,188
AVG HOUSEHOLD INCOME
23.9%
WAGE / INCOME GAP [ % ]
76.1¢/ $1
WAGE / INCOME GAP [ $ ]
0.40
INEQUALITY / GINI INDEX
286
TOTAL POPULATION
121
MALE POPULATION
165
FEMALE POPULATION
73.33
MALES / 100 FEMALES
136.36
FEMALES / 100 MALES
54.8
MEDIAN AGE
2.6
AVG FAMILY SIZE
2.1
AVG HOUSEHOLD SIZE
164
LABOR FORCE [ PEOPLE ]
65.6%
PERCENT IN LABOR FORCE
12.2%
UNEMPLOYMENT RATE
Canaan Zip Codes
Canaan Area Codes
Income in Canaan
Income Overview in Canaan
Per Capita Income in Canaan is $32,476, while median incomes of families and households are $63,125 and $58,188 respectively.
| Characteristic | Number | Measure |
| Per Capita Income | 286 | $32,476 |
| Median Family Income | 90 | $63,125 |
| Mean Family Income | 90 | $86,147 |
| Median Household Income | 137 | $58,188 |
| Mean Household Income | 137 | $67,156 |
| Income Deficit | 90 | $0 |
| Wage / Income Gap (%) | 286 | 23.92% |
| Wage / Income Gap ($) | 286 | 76.08¢ per $1 |
| Gini / Inequality Index | 286 | 0.40 |
Earnings by Sex in Canaan
Average Earnings in Canaan are $30,893, $35,417 for men and $26,944 for women, a difference of 23.9%.
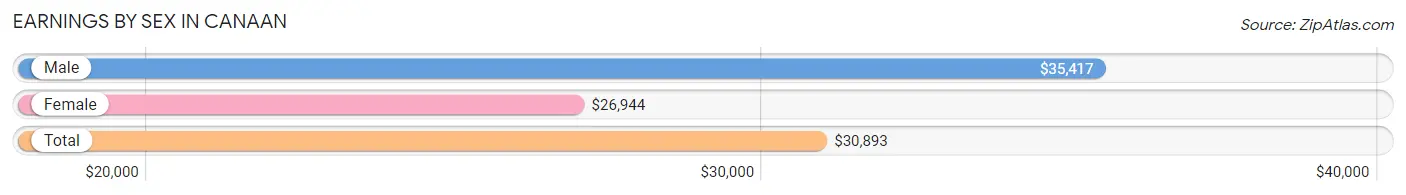
| Sex | Number | Average Earnings |
| Male | 73 (40.8%) | $35,417 |
| Female | 106 (59.2%) | $26,944 |
| Total | 179 (100.0%) | $30,893 |
Earnings by Sex by Income Bracket in Canaan
The most common earnings brackets in Canaan are $15,000 to $17,499 for men (19 | 26.0%) and $2,500 to $4,999 for women (20 | 18.9%).
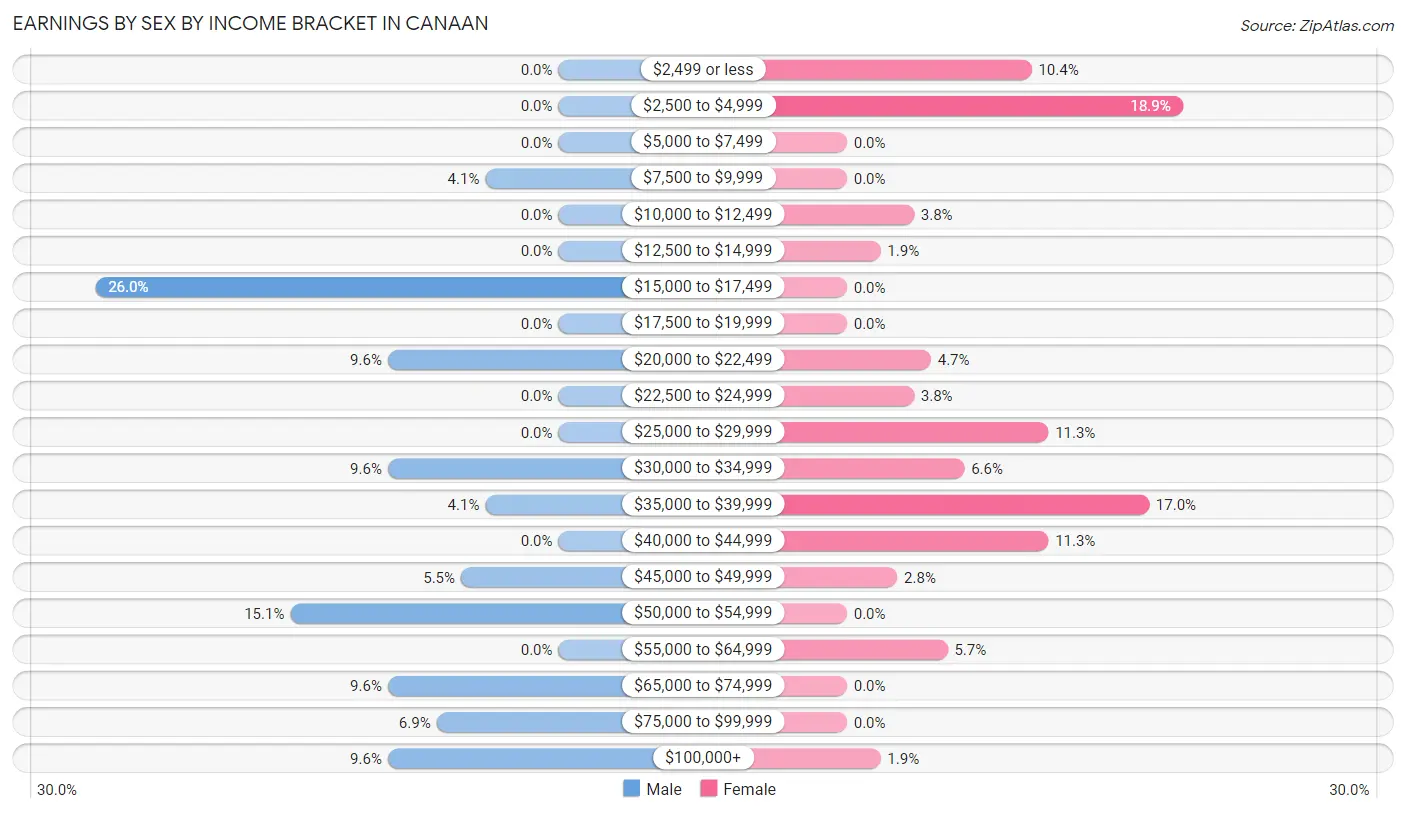
| Income | Male | Female |
| $2,499 or less | 0 (0.0%) | 11 (10.4%) |
| $2,500 to $4,999 | 0 (0.0%) | 20 (18.9%) |
| $5,000 to $7,499 | 0 (0.0%) | 0 (0.0%) |
| $7,500 to $9,999 | 3 (4.1%) | 0 (0.0%) |
| $10,000 to $12,499 | 0 (0.0%) | 4 (3.8%) |
| $12,500 to $14,999 | 0 (0.0%) | 2 (1.9%) |
| $15,000 to $17,499 | 19 (26.0%) | 0 (0.0%) |
| $17,500 to $19,999 | 0 (0.0%) | 0 (0.0%) |
| $20,000 to $22,499 | 7 (9.6%) | 5 (4.7%) |
| $22,500 to $24,999 | 0 (0.0%) | 4 (3.8%) |
| $25,000 to $29,999 | 0 (0.0%) | 12 (11.3%) |
| $30,000 to $34,999 | 7 (9.6%) | 7 (6.6%) |
| $35,000 to $39,999 | 3 (4.1%) | 18 (17.0%) |
| $40,000 to $44,999 | 0 (0.0%) | 12 (11.3%) |
| $45,000 to $49,999 | 4 (5.5%) | 3 (2.8%) |
| $50,000 to $54,999 | 11 (15.1%) | 0 (0.0%) |
| $55,000 to $64,999 | 0 (0.0%) | 6 (5.7%) |
| $65,000 to $74,999 | 7 (9.6%) | 0 (0.0%) |
| $75,000 to $99,999 | 5 (6.9%) | 0 (0.0%) |
| $100,000+ | 7 (9.6%) | 2 (1.9%) |
| Total | 73 (100.0%) | 106 (100.0%) |
Earnings by Sex by Educational Attainment in Canaan
Average earnings in Canaan are $33,214 for men and $26,250 for women, a difference of 21.0%. Men with an educational attainment of college or associate's degree enjoy the highest average annual earnings of $150,000, while those with college or associate's degree education earn the least with $150,000. Women with an educational attainment of bachelor's degree earn the most with the average annual earnings of $44,000, while those with high school diploma education have the smallest earnings of $31,786.
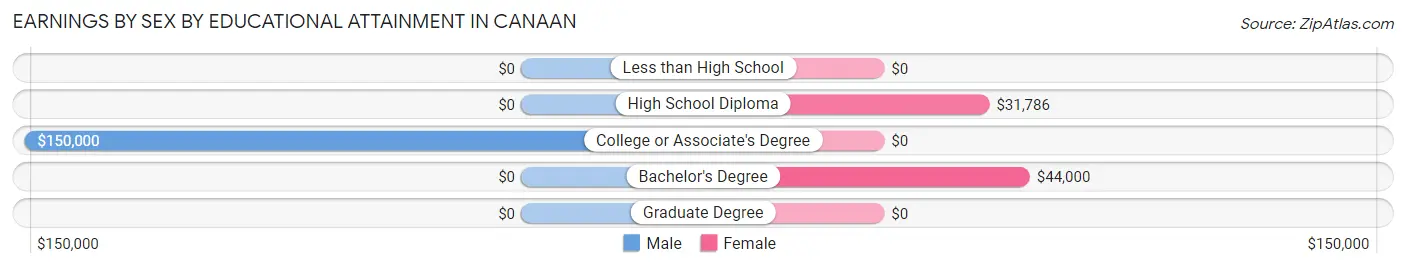
| Educational Attainment | Male Income | Female Income |
| Less than High School | - | - |
| High School Diploma | - | - |
| College or Associate's Degree | $150,000 | $0 |
| Bachelor's Degree | - | - |
| Graduate Degree | - | - |
| Total | $33,214 | $26,250 |
Family Income in Canaan
Family Income Brackets in Canaan
According to the Canaan family income data, there are 37 families falling into the $50,000 to $74,999 income range, which is the most common income bracket and makes up 41.1% of all families.
| Income Bracket | # Families | % Families |
| Less than $10,000 | 0 | 0.0% |
| $10,000 to $14,999 | 0 | 0.0% |
| $15,000 to $24,999 | 0 | 0.0% |
| $25,000 to $34,999 | 6 | 6.7% |
| $35,000 to $49,999 | 8 | 8.9% |
| $50,000 to $74,999 | 37 | 41.1% |
| $75,000 to $99,999 | 20 | 22.2% |
| $100,000 to $149,999 | 8 | 8.9% |
| $150,000 to $199,999 | 0 | 0.0% |
| $200,000+ | 11 | 12.2% |
Family Income by Famaliy Size in Canaan
2-person families (64 | 71.1%) account for the highest median family income in Canaan with $59,875 per family, while 2-person families (64 | 71.1%) have the highest median income of $29,938 per family member.
| Income Bracket | # Families | Median Income |
| 2-Person Families | 64 (71.1%) | $59,875 |
| 3-Person Families | 2 (2.2%) | $0 |
| 4-Person Families | 18 (20.0%) | $0 |
| 5-Person Families | 0 (0.0%) | $0 |
| 6-Person Families | 6 (6.7%) | $0 |
| 7+ Person Families | 0 (0.0%) | $0 |
| Total | 90 (100.0%) | $63,125 |
Family Income by Number of Earners in Canaan
| Number of Earners | # Families | Median Income |
| No Earners | 14 (15.6%) | $53,125 |
| 1 Earner | 8 (8.9%) | $0 |
| 2 Earners | 57 (63.3%) | $92,578 |
| 3+ Earners | 11 (12.2%) | $0 |
| Total | 90 (100.0%) | $63,125 |
Household Income in Canaan
Household Income Brackets in Canaan
With 37 households falling in the category, the $50,000 to $74,999 income range is the most frequent in Canaan, accounting for 27.0% of all households.
| Income Bracket | # Households | % Households |
| Less than $10,000 | 0 | 0.0% |
| $10,000 to $14,999 | 15 | 10.9% |
| $15,000 to $24,999 | 16 | 11.7% |
| $25,000 to $34,999 | 11 | 8.0% |
| $35,000 to $49,999 | 12 | 8.8% |
| $50,000 to $74,999 | 37 | 27.0% |
| $75,000 to $99,999 | 25 | 18.2% |
| $100,000 to $149,999 | 10 | 7.3% |
| $150,000 to $199,999 | 0 | 0.0% |
| $200,000+ | 11 | 8.0% |
Household Income by Householder Age in Canaan
The median household income in Canaan is $58,188, with the highest median household income of $64,844 found in the 45 to 64 years age bracket for the primary householder. A total of 31 households (22.6%) fall into this category. Meanwhile, the 15 to 24 years age bracket for the primary householder has the lowest median household income of $0, with 13 households (9.5%) in this group.
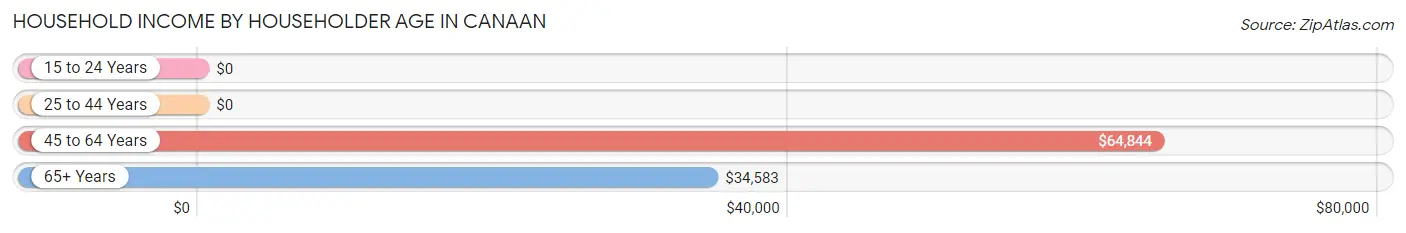
| Income Bracket | # Households | Median Income |
| 15 to 24 Years | 13 (9.5%) | $0 |
| 25 to 44 Years | 18 (13.1%) | $0 |
| 45 to 64 Years | 31 (22.6%) | $64,844 |
| 65+ Years | 75 (54.7%) | $34,583 |
| Total | 137 (100.0%) | $58,188 |
Poverty in Canaan
Income Below Poverty by Sex and Age in Canaan
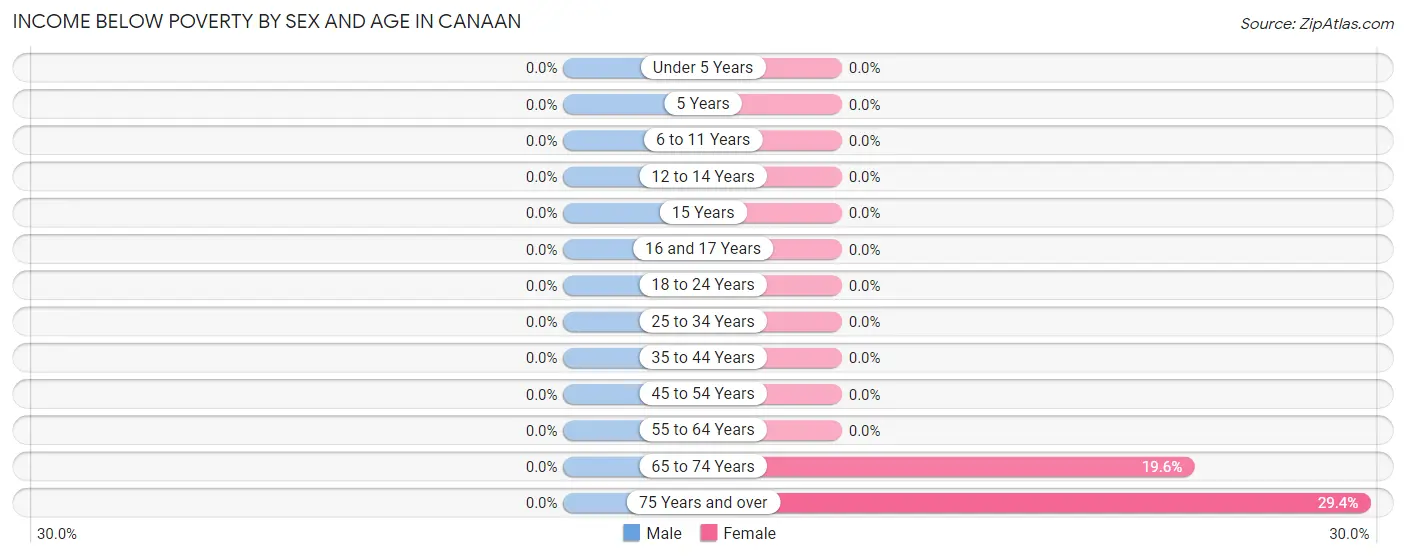
| Age Bracket | Male | Female |
| Under 5 Years | 0 (0.0%) | 0 (0.0%) |
| 5 Years | 0 (0.0%) | 0 (0.0%) |
| 6 to 11 Years | 0 (0.0%) | 0 (0.0%) |
| 12 to 14 Years | 0 (0.0%) | 0 (0.0%) |
| 15 Years | 0 (0.0%) | 0 (0.0%) |
| 16 and 17 Years | 0 (0.0%) | 0 (0.0%) |
| 18 to 24 Years | 0 (0.0%) | 0 (0.0%) |
| 25 to 34 Years | 0 (0.0%) | 0 (0.0%) |
| 35 to 44 Years | 0 (0.0%) | 0 (0.0%) |
| 45 to 54 Years | 0 (0.0%) | 0 (0.0%) |
| 55 to 64 Years | 0 (0.0%) | 0 (0.0%) |
| 65 to 74 Years | 0 (0.0%) | 10 (19.6%) |
| 75 Years and over | 0 (0.0%) | 5 (29.4%) |
| Total | 0 (0.0%) | 15 (9.1%) |
Income Above Poverty by Sex and Age in Canaan
According to the poverty statistics in Canaan, males aged under 5 years and females aged under 5 years are the age groups that are most secure financially, with 100.0% of males and 100.0% of females in these age groups living above the poverty line.
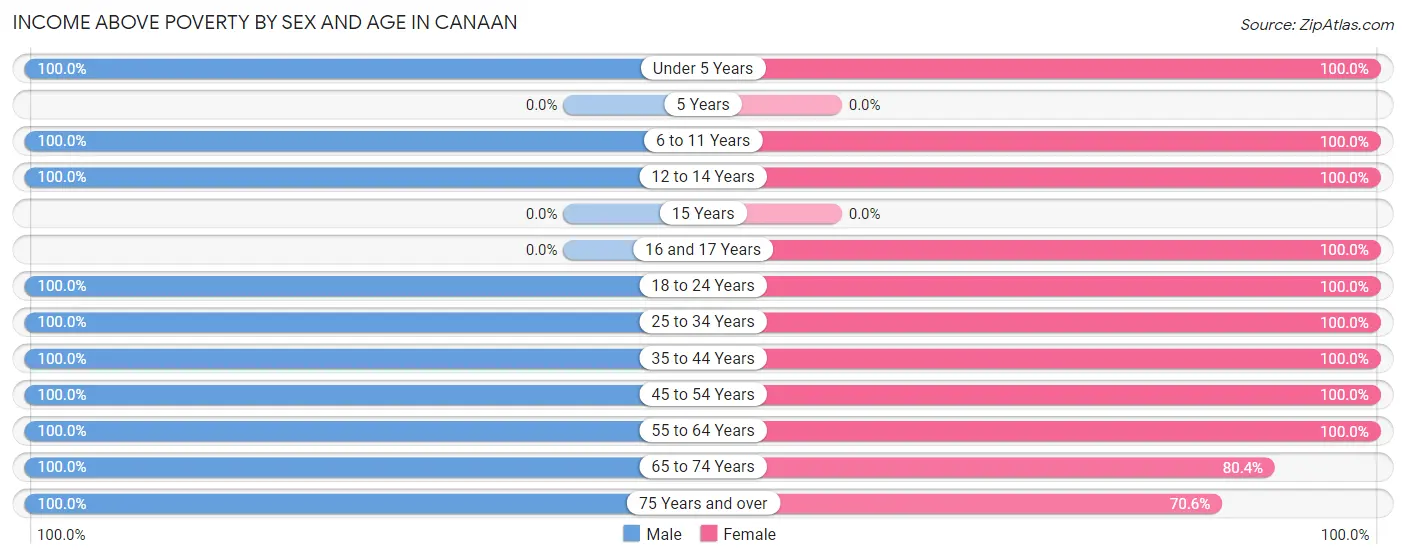
| Age Bracket | Male | Female |
| Under 5 Years | 10 (100.0%) | 4 (100.0%) |
| 5 Years | 0 (0.0%) | 0 (0.0%) |
| 6 to 11 Years | 7 (100.0%) | 10 (100.0%) |
| 12 to 14 Years | 2 (100.0%) | 3 (100.0%) |
| 15 Years | 0 (0.0%) | 0 (0.0%) |
| 16 and 17 Years | 0 (0.0%) | 11 (100.0%) |
| 18 to 24 Years | 11 (100.0%) | 24 (100.0%) |
| 25 to 34 Years | 3 (100.0%) | 5 (100.0%) |
| 35 to 44 Years | 17 (100.0%) | 12 (100.0%) |
| 45 to 54 Years | 9 (100.0%) | 16 (100.0%) |
| 55 to 64 Years | 19 (100.0%) | 12 (100.0%) |
| 65 to 74 Years | 27 (100.0%) | 41 (80.4%) |
| 75 Years and over | 16 (100.0%) | 12 (70.6%) |
| Total | 121 (100.0%) | 150 (90.9%) |
Income Below Poverty Among Married-Couple Families in Canaan
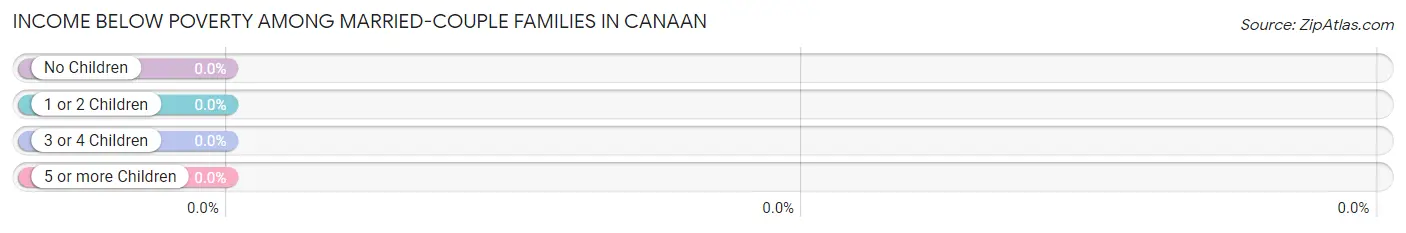
| Children | Above Poverty | Below Poverty |
| No Children | 70 (100.0%) | 0 (0.0%) |
| 1 or 2 Children | 15 (100.0%) | 0 (0.0%) |
| 3 or 4 Children | 0 (0.0%) | 0 (0.0%) |
| 5 or more Children | 0 (0.0%) | 0 (0.0%) |
| Total | 85 (100.0%) | 0 (0.0%) |
Income Below Poverty Among Single-Parent Households in Canaan
| Children | Single Father | Single Mother |
| No Children | 0 (0.0%) | 0 (0.0%) |
| 1 or 2 Children | 0 (0.0%) | 0 (0.0%) |
| 3 or 4 Children | 0 (0.0%) | 0 (0.0%) |
| 5 or more Children | 0 (0.0%) | 0 (0.0%) |
| Total | 0 (0.0%) | 0 (0.0%) |
Income Below Poverty Among Married-Couple vs Single-Parent Households in Canaan
| Children | Married-Couple Families | Single-Parent Households |
| No Children | 0 (0.0%) | 0 (0.0%) |
| 1 or 2 Children | 0 (0.0%) | 0 (0.0%) |
| 3 or 4 Children | 0 (0.0%) | 0 (0.0%) |
| 5 or more Children | 0 (0.0%) | 0 (0.0%) |
| Total | 0 (0.0%) | 0 (0.0%) |
Race in Canaan
The most populous races in Canaan are White / Caucasian (282 | 98.6%), and Two or more Races (4 | 1.4%).
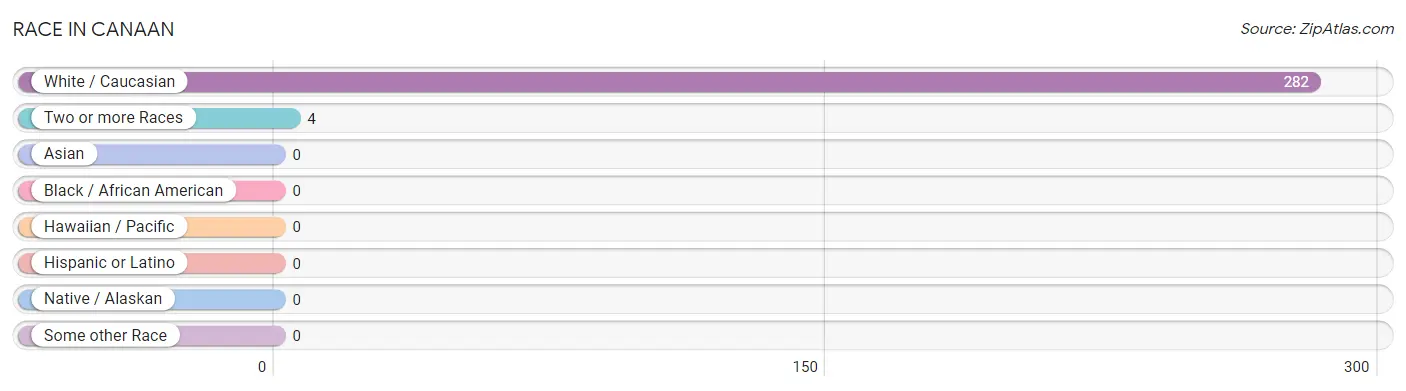
| Race | # Population | % Population |
| Asian | 0 | 0.0% |
| Black / African American | 0 | 0.0% |
| Hawaiian / Pacific | 0 | 0.0% |
| Hispanic or Latino | 0 | 0.0% |
| Native / Alaskan | 0 | 0.0% |
| White / Caucasian | 282 | 98.6% |
| Two or more Races | 4 | 1.4% |
| Some other Race | 0 | 0.0% |
| Total | 286 | 100.0% |
Ancestry in Canaan
The most populous ancestries reported in Canaan are American (55 | 19.2%), French Canadian (55 | 19.2%), French (39 | 13.6%), Italian (23 | 8.0%), and Irish (22 | 7.7%), together accounting for 67.8% of all Canaan residents.
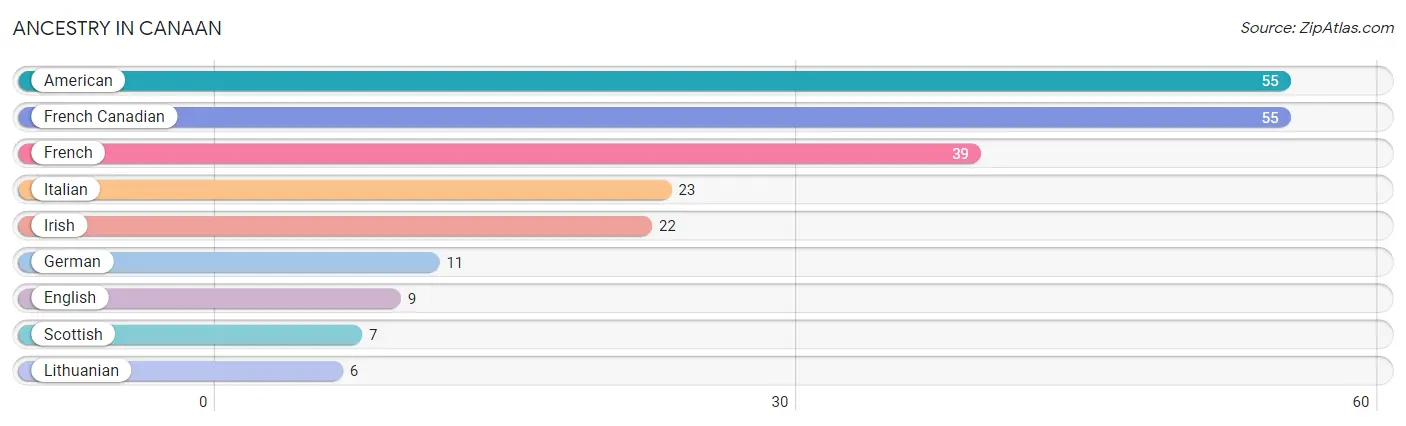
| Ancestry | # Population | % Population |
| American | 55 | 19.2% |
| English | 9 | 3.2% |
| French | 39 | 13.6% |
| French Canadian | 55 | 19.2% |
| German | 11 | 3.8% |
| Irish | 22 | 7.7% |
| Italian | 23 | 8.0% |
| Lithuanian | 6 | 2.1% |
| Scottish | 7 | 2.5% | View All 9 Rows |
Immigrants in Canaan
The most numerous immigrant groups reported in Canaan came from , and Canada (24 | 8.4%), together accounting for 8.4% of all Canaan residents.

| Immigration Origin | # Population | % Population |
| Canada | 24 | 8.4% | View All 1 Rows |
Sex and Age in Canaan
Sex and Age in Canaan
The most populous age groups in Canaan are 70 to 74 Years (27 | 22.3%) for men and 65 to 69 Years (32 | 19.4%) for women.
| Age Bracket | Male | Female |
| Under 5 Years | 10 (8.3%) | 4 (2.4%) |
| 5 to 9 Years | 0 (0.0%) | 10 (6.1%) |
| 10 to 14 Years | 9 (7.4%) | 3 (1.8%) |
| 15 to 19 Years | 0 (0.0%) | 15 (9.1%) |
| 20 to 24 Years | 11 (9.1%) | 20 (12.1%) |
| 25 to 29 Years | 0 (0.0%) | 5 (3.0%) |
| 30 to 34 Years | 3 (2.5%) | 0 (0.0%) |
| 35 to 39 Years | 12 (9.9%) | 5 (3.0%) |
| 40 to 44 Years | 5 (4.1%) | 7 (4.2%) |
| 45 to 49 Years | 0 (0.0%) | 10 (6.1%) |
| 50 to 54 Years | 9 (7.4%) | 6 (3.6%) |
| 55 to 59 Years | 7 (5.8%) | 5 (3.0%) |
| 60 to 64 Years | 12 (9.9%) | 7 (4.2%) |
| 65 to 69 Years | 0 (0.0%) | 32 (19.4%) |
| 70 to 74 Years | 27 (22.3%) | 19 (11.5%) |
| 75 to 79 Years | 3 (2.5%) | 2 (1.2%) |
| 80 to 84 Years | 8 (6.6%) | 3 (1.8%) |
| 85 Years and over | 5 (4.1%) | 12 (7.3%) |
| Total | 121 (100.0%) | 165 (100.0%) |
Families and Households in Canaan
Median Family Size in Canaan
| Family Type | # Families | Family Size |
| Married-Couple | 85 (94.4%) | 2.55 |
| Single Male/Father | 0 (0.0%) | - |
| Single Female/Mother | 5 (5.6%) | 3.80 |
| Total Families | 90 (100.0%) | 2.62 |
Median Household Size in Canaan
| Household Type | # Households | Household Size |
| Married-Couple | 85 (62.0%) | 2.55 |
| Single Male/Father | 0 (0.0%) | - |
| Single Female/Mother | 5 (3.6%) | 4.40 |
| Non-family | 47 (34.3%) | - |
| Total Households | 137 (100.0%) | 2.09 |
Household Size by Marriage Status in Canaan
Out of a total of 137 households in Canaan, 90 (65.7%) are family households, while 47 (34.3%) are nonfamily households. The most numerous type of family households are 2-person households, comprising 64, and the most common type of nonfamily households are 1-person households, comprising 47.
| Household Size | Family Households | Nonfamily Households |
| 1-Person Households | - | 47 (34.3%) |
| 2-Person Households | 64 (46.7%) | 0 (0.0%) |
| 3-Person Households | 2 (1.5%) | 0 (0.0%) |
| 4-Person Households | 13 (9.5%) | 0 (0.0%) |
| 5-Person Households | 5 (3.6%) | 0 (0.0%) |
| 6-Person Households | 6 (4.4%) | 0 (0.0%) |
| 7+ Person Households | 0 (0.0%) | 0 (0.0%) |
| Total | 90 (65.7%) | 47 (34.3%) |
Female Fertility in Canaan
Fertility by Age in Canaan
| Age Bracket | Women with Births | Births / 1,000 Women |
| 15 to 19 years | 0 (0.0%) | 0.0 |
| 20 to 34 years | 0 (0.0%) | 0.0 |
| 35 to 50 years | 0 (0.0%) | 0.0 |
| Total | 0 (0.0%) | 0.0 |
Fertility by Age by Marriage Status in Canaan
| Age Bracket | Married | Unmarried |
| 15 to 19 years | 0 (0.0%) | 0 (0.0%) |
| 20 to 34 years | 0 (0.0%) | 0 (0.0%) |
| 35 to 50 years | 0 (0.0%) | 0 (0.0%) |
| Total | 0 (0.0%) | 0 (0.0%) |
Fertility by Education in Canaan
| Educational Attainment | Women with Births | Births / 1,000 Women |
| Less than High School | 0 (0.0%) | 0.0 |
| High School Diploma | 0 (0.0%) | 0.0 |
| College or Associate's Degree | 0 (0.0%) | 0.0 |
| Bachelor's Degree | 0 (0.0%) | 0.0 |
| Graduate Degree | 0 (0.0%) | 0.0 |
| Total | 0 (0.0%) | 0.0 |
Fertility by Education by Marriage Status in Canaan
| Educational Attainment | Married | Unmarried |
| Less than High School | 0 (0.0%) | 0 (0.0%) |
| High School Diploma | 0 (0.0%) | 0 (0.0%) |
| College or Associate's Degree | 0 (0.0%) | 0 (0.0%) |
| Bachelor's Degree | 0 (0.0%) | 0 (0.0%) |
| Graduate Degree | 0 (0.0%) | 0 (0.0%) |
| Total | 0 (0.0%) | 0 (0.0%) |
Employment Characteristics in Canaan
Employment by Class of Employer in Canaan
Among the 144 employed individuals in Canaan, private company employees (108 | 75.0%), local government employees (18 | 12.5%), and self-employed (incorporated) (8 | 5.6%) make up the most common classes of employment.
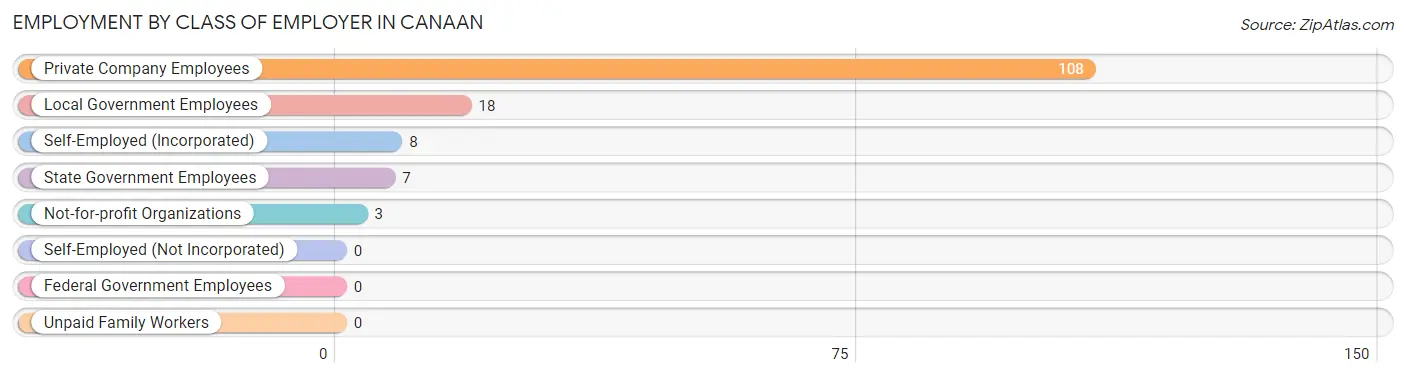
| Employer Class | # Employees | % Employees |
| Private Company Employees | 108 | 75.0% |
| Self-Employed (Incorporated) | 8 | 5.6% |
| Self-Employed (Not Incorporated) | 0 | 0.0% |
| Not-for-profit Organizations | 3 | 2.1% |
| Local Government Employees | 18 | 12.5% |
| State Government Employees | 7 | 4.9% |
| Federal Government Employees | 0 | 0.0% |
| Unpaid Family Workers | 0 | 0.0% |
| Total | 144 | 100.0% |
Employment Status by Age in Canaan
According to the labor force statistics for Canaan, out of the total population over 16 years of age (250), 65.6% or 164 individuals are in the labor force, with 12.2% or 20 of them unemployed. The age group with the highest labor force participation rate is 20 to 24 years, with 100.0% or 31 individuals in the labor force. Within the labor force, the 65 to 74 years age range has the highest percentage of unemployed individuals, with 40.0% or 20 of them being unemployed.
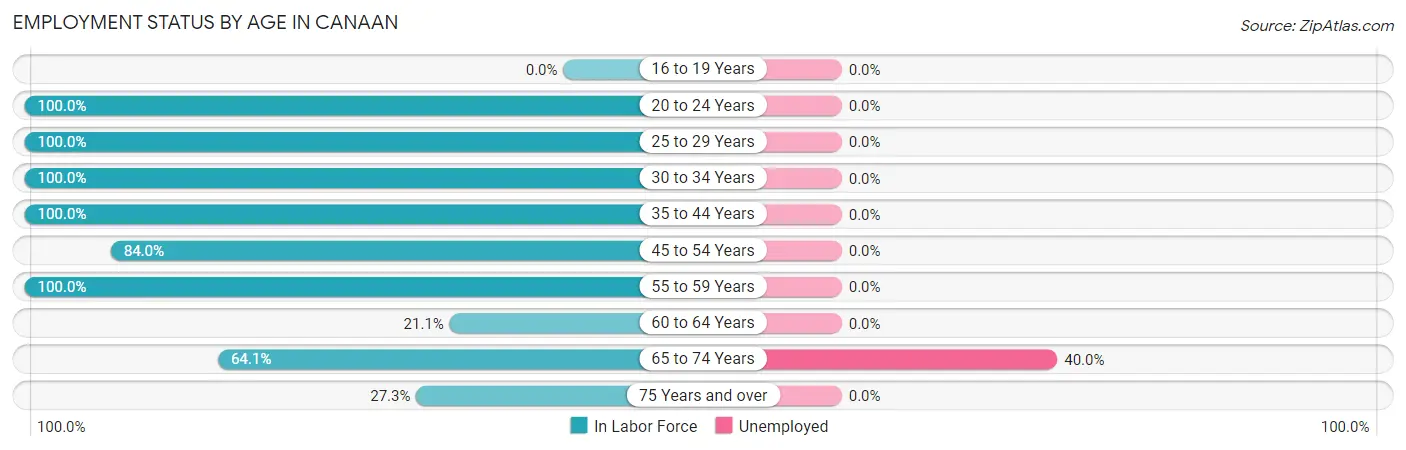
| Age Bracket | In Labor Force | Unemployed |
| 16 to 19 Years | 0 (0.0%) | 0 (0.0%) |
| 20 to 24 Years | 31 (100.0%) | 0 (0.0%) |
| 25 to 29 Years | 5 (100.0%) | 0 (0.0%) |
| 30 to 34 Years | 3 (100.0%) | 0 (0.0%) |
| 35 to 44 Years | 29 (100.0%) | 0 (0.0%) |
| 45 to 54 Years | 21 (84.0%) | 0 (0.0%) |
| 55 to 59 Years | 12 (100.0%) | 0 (0.0%) |
| 60 to 64 Years | 4 (21.1%) | 0 (0.0%) |
| 65 to 74 Years | 50 (64.1%) | 20 (40.0%) |
| 75 Years and over | 9 (27.3%) | 0 (0.0%) |
| Total | 164 (65.6%) | 20 (12.2%) |
Employment Status by Educational Attainment in Canaan
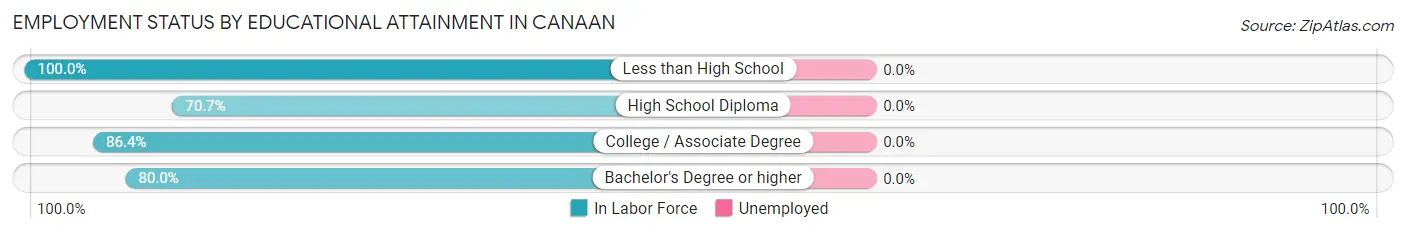
| Educational Attainment | In Labor Force | Unemployed |
| Less than High School | 10 (100.0%) | 0 (0.0%) |
| High School Diploma | 29 (70.7%) | 0 (0.0%) |
| College / Associate Degree | 19 (86.4%) | 0 (0.0%) |
| Bachelor's Degree or higher | 16 (80.0%) | 0 (0.0%) |
| Total | 74 (79.6%) | 0 (0.0%) |
Employment Occupations by Sex in Canaan
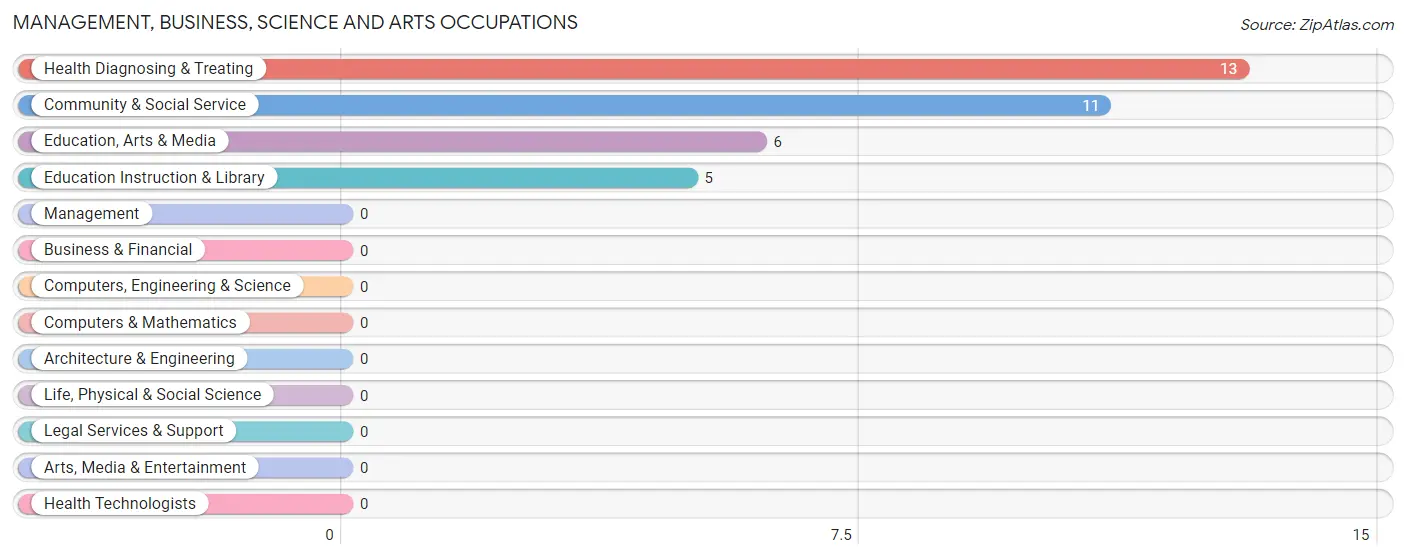
Management, Business, Science and Arts Occupations
The most common Management, Business, Science and Arts occupations in Canaan are Health Diagnosing & Treating (13 | 9.0%), Community & Social Service (11 | 7.6%), Education, Arts & Media (6 | 4.2%), and Education Instruction & Library (5 | 3.5%).
Management, Business, Science and Arts Occupations by Sex
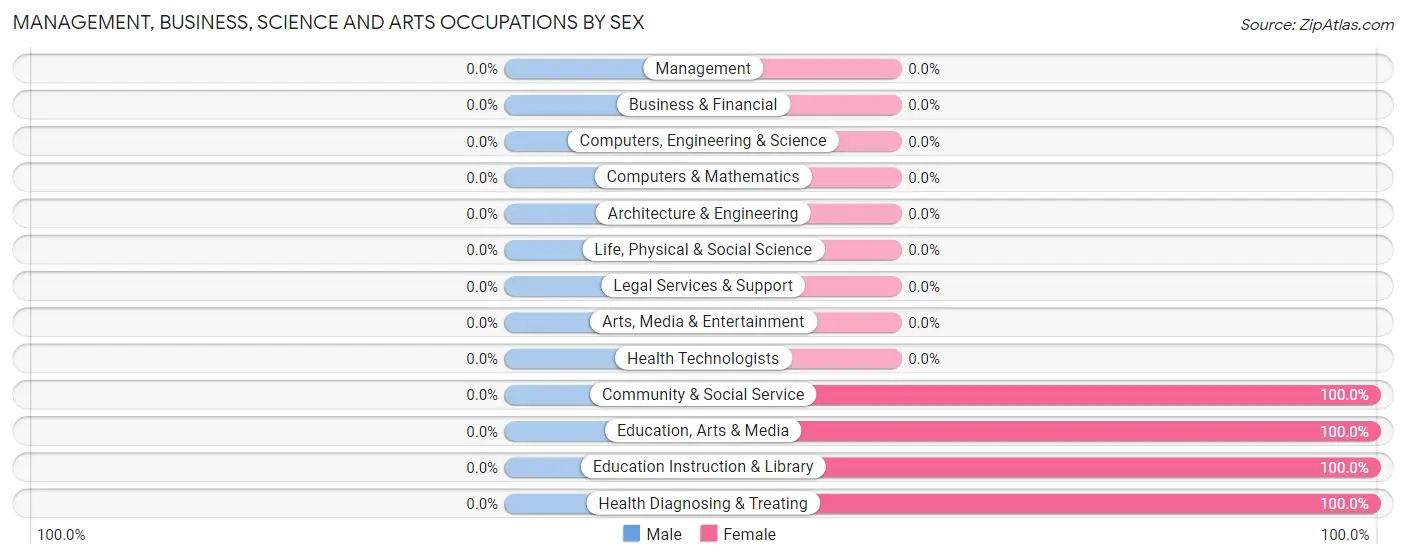
| Occupation | Male | Female |
| Management | 0 (0.0%) | 0 (0.0%) |
| Business & Financial | 0 (0.0%) | 0 (0.0%) |
| Computers, Engineering & Science | 0 (0.0%) | 0 (0.0%) |
| Computers & Mathematics | 0 (0.0%) | 0 (0.0%) |
| Architecture & Engineering | 0 (0.0%) | 0 (0.0%) |
| Life, Physical & Social Science | 0 (0.0%) | 0 (0.0%) |
| Community & Social Service | 0 (0.0%) | 11 (100.0%) |
| Education, Arts & Media | 0 (0.0%) | 6 (100.0%) |
| Legal Services & Support | 0 (0.0%) | 0 (0.0%) |
| Education Instruction & Library | 0 (0.0%) | 5 (100.0%) |
| Arts, Media & Entertainment | 0 (0.0%) | 0 (0.0%) |
| Health Diagnosing & Treating | 0 (0.0%) | 13 (100.0%) |
| Health Technologists | 0 (0.0%) | 0 (0.0%) |
| Total (Category) | 0 (0.0%) | 24 (100.0%) |
| Total (Overall) | 73 (50.7%) | 71 (49.3%) |
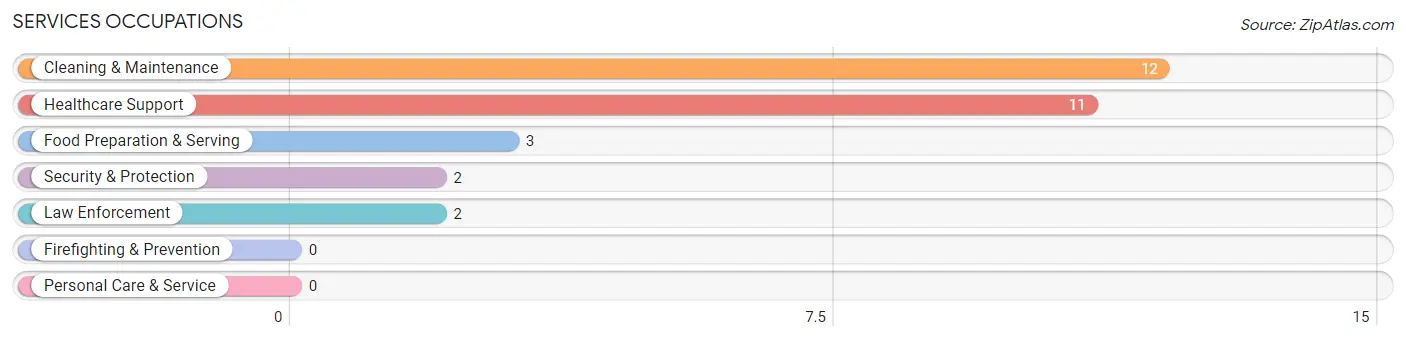
Services Occupations
The most common Services occupations in Canaan are Cleaning & Maintenance (12 | 8.3%), Healthcare Support (11 | 7.6%), Food Preparation & Serving (3 | 2.1%), Security & Protection (2 | 1.4%), and Law Enforcement (2 | 1.4%).
Services Occupations by Sex
Within the Services occupations in Canaan, the most male-oriented occupations are Security & Protection (100.0%), Law Enforcement (100.0%), and Food Preparation & Serving (100.0%), while the most female-oriented occupations are Healthcare Support (100.0%), and Cleaning & Maintenance (66.7%).
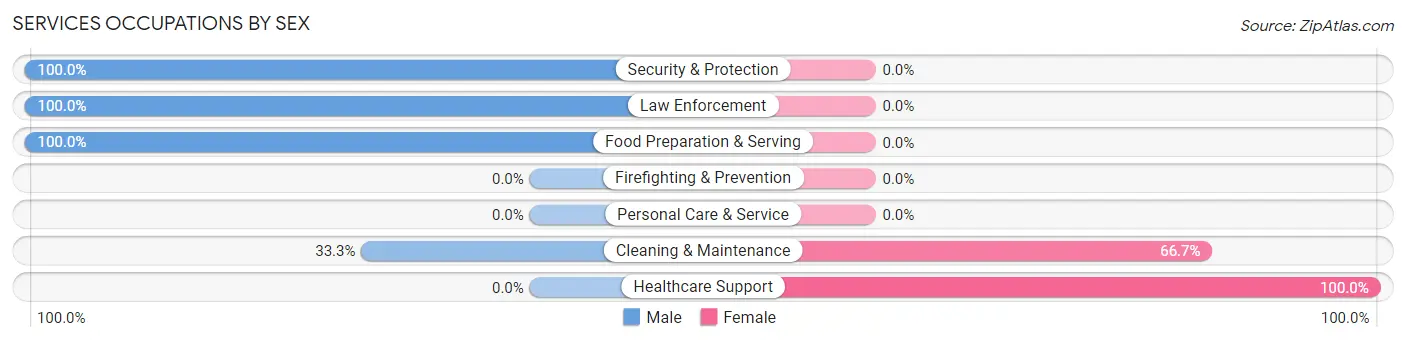
| Occupation | Male | Female |
| Healthcare Support | 0 (0.0%) | 11 (100.0%) |
| Security & Protection | 2 (100.0%) | 0 (0.0%) |
| Firefighting & Prevention | 0 (0.0%) | 0 (0.0%) |
| Law Enforcement | 2 (100.0%) | 0 (0.0%) |
| Food Preparation & Serving | 3 (100.0%) | 0 (0.0%) |
| Cleaning & Maintenance | 4 (33.3%) | 8 (66.7%) |
| Personal Care & Service | 0 (0.0%) | 0 (0.0%) |
| Total (Category) | 9 (32.1%) | 19 (67.9%) |
| Total (Overall) | 73 (50.7%) | 71 (49.3%) |
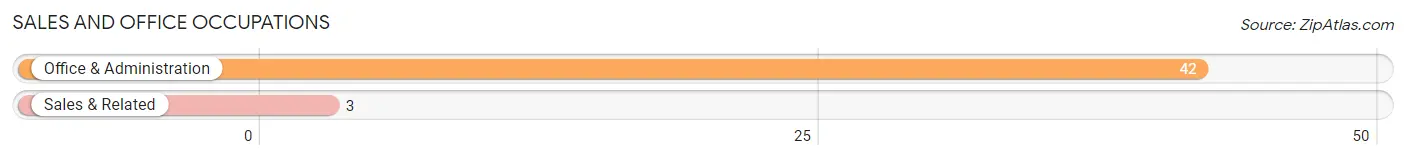
Sales and Office Occupations
The most common Sales and Office occupations in Canaan are Office & Administration (42 | 29.2%), and Sales & Related (3 | 2.1%).
Sales and Office Occupations by Sex
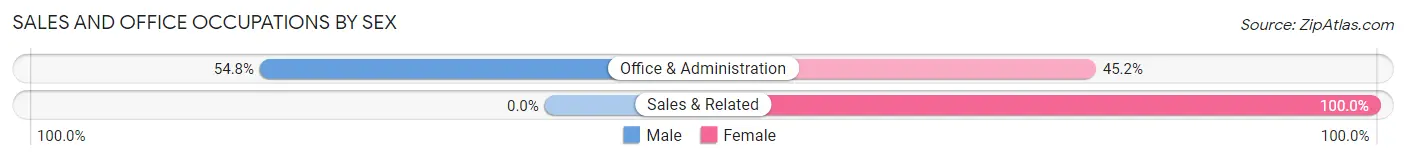
| Occupation | Male | Female |
| Sales & Related | 0 (0.0%) | 3 (100.0%) |
| Office & Administration | 23 (54.8%) | 19 (45.2%) |
| Total (Category) | 23 (51.1%) | 22 (48.9%) |
| Total (Overall) | 73 (50.7%) | 71 (49.3%) |
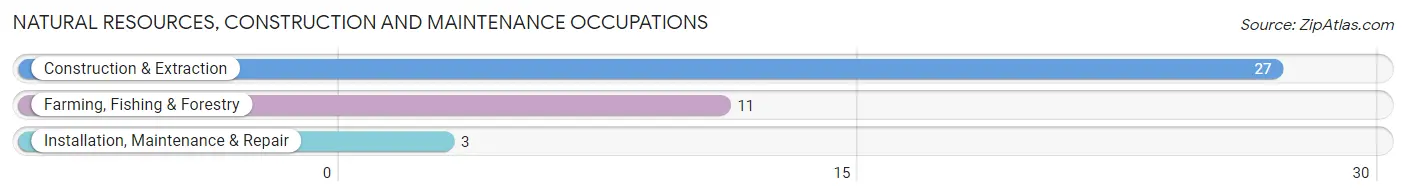
Natural Resources, Construction and Maintenance Occupations
The most common Natural Resources, Construction and Maintenance occupations in Canaan are Construction & Extraction (27 | 18.8%), Farming, Fishing & Forestry (11 | 7.6%), and Installation, Maintenance & Repair (3 | 2.1%).
Natural Resources, Construction and Maintenance Occupations by Sex
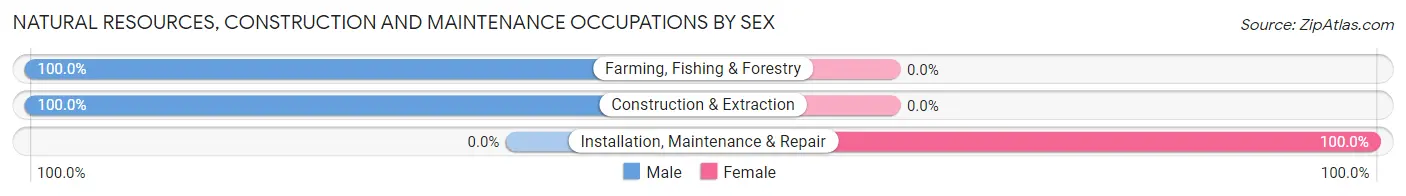
| Occupation | Male | Female |
| Farming, Fishing & Forestry | 11 (100.0%) | 0 (0.0%) |
| Construction & Extraction | 27 (100.0%) | 0 (0.0%) |
| Installation, Maintenance & Repair | 0 (0.0%) | 3 (100.0%) |
| Total (Category) | 38 (92.7%) | 3 (7.3%) |
| Total (Overall) | 73 (50.7%) | 71 (49.3%) |
Production, Transportation and Moving Occupations
The most common Production, Transportation and Moving occupations in Canaan are , and Material Moving (6 | 4.2%).
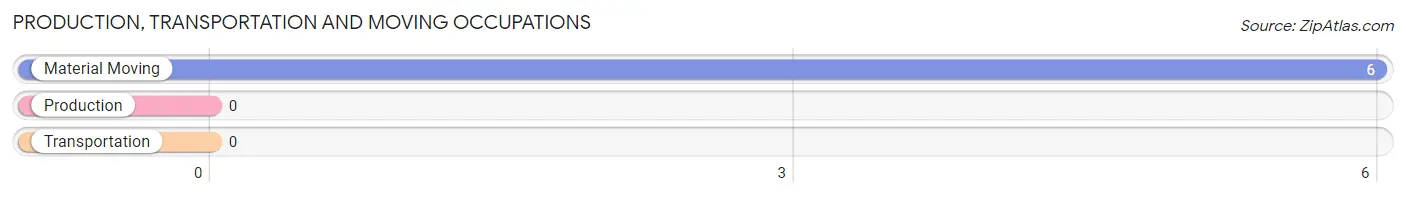
Production, Transportation and Moving Occupations by Sex
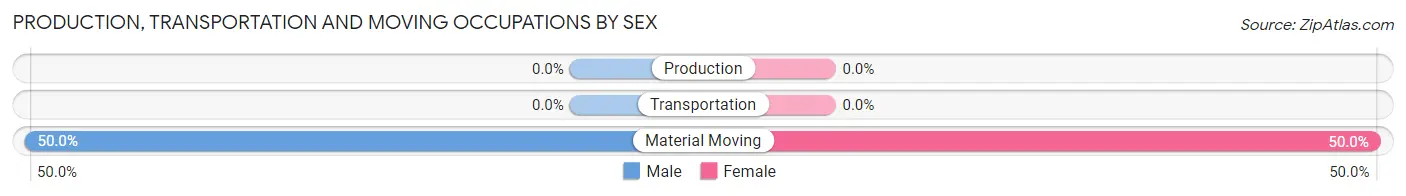
| Occupation | Male | Female |
| Production | 0 (0.0%) | 0 (0.0%) |
| Transportation | 0 (0.0%) | 0 (0.0%) |
| Material Moving | 3 (50.0%) | 3 (50.0%) |
| Total (Category) | 3 (50.0%) | 3 (50.0%) |
| Total (Overall) | 73 (50.7%) | 71 (49.3%) |
Employment Industries by Sex in Canaan
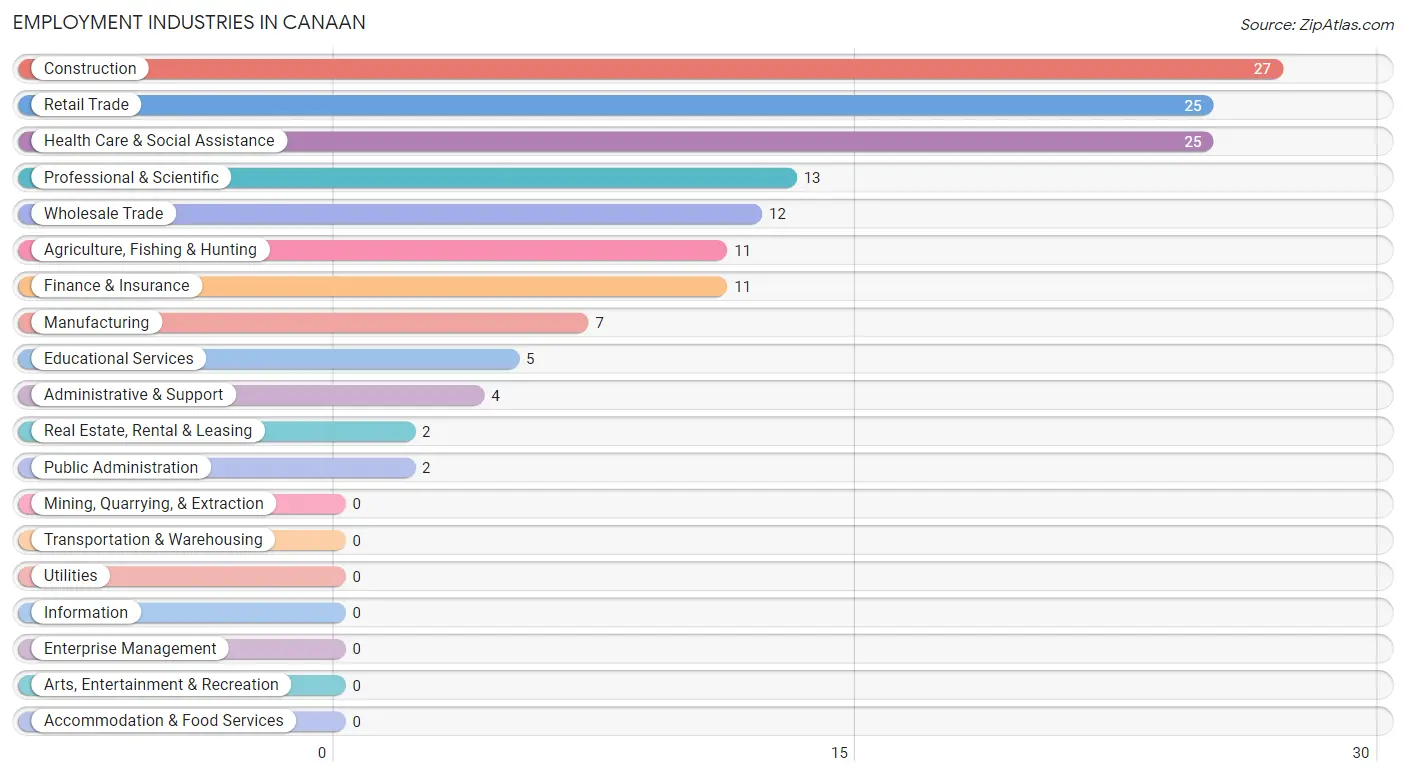
Employment Industries in Canaan
The major employment industries in Canaan include Construction (27 | 18.8%), Retail Trade (25 | 17.4%), Health Care & Social Assistance (25 | 17.4%), Professional & Scientific (13 | 9.0%), and Wholesale Trade (12 | 8.3%).
Employment Industries by Sex in Canaan
The Canaan industries that see more men than women are Agriculture, Fishing & Hunting (100.0%), Construction (100.0%), and Manufacturing (100.0%), whereas the industries that tend to have a higher number of women are Wholesale Trade (100.0%), Real Estate, Rental & Leasing (100.0%), and Professional & Scientific (100.0%).
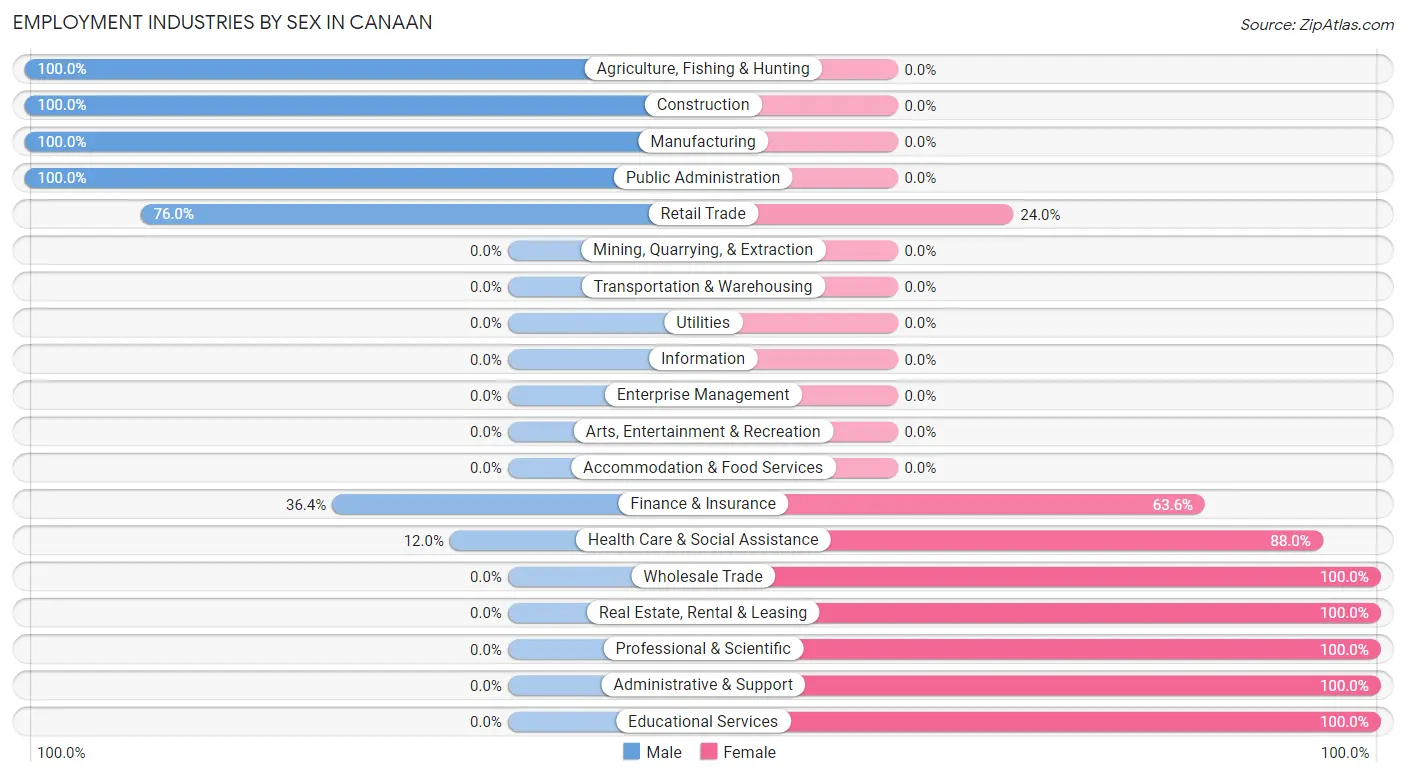
| Industry | Male | Female |
| Agriculture, Fishing & Hunting | 11 (100.0%) | 0 (0.0%) |
| Mining, Quarrying, & Extraction | 0 (0.0%) | 0 (0.0%) |
| Construction | 27 (100.0%) | 0 (0.0%) |
| Manufacturing | 7 (100.0%) | 0 (0.0%) |
| Wholesale Trade | 0 (0.0%) | 12 (100.0%) |
| Retail Trade | 19 (76.0%) | 6 (24.0%) |
| Transportation & Warehousing | 0 (0.0%) | 0 (0.0%) |
| Utilities | 0 (0.0%) | 0 (0.0%) |
| Information | 0 (0.0%) | 0 (0.0%) |
| Finance & Insurance | 4 (36.4%) | 7 (63.6%) |
| Real Estate, Rental & Leasing | 0 (0.0%) | 2 (100.0%) |
| Professional & Scientific | 0 (0.0%) | 13 (100.0%) |
| Enterprise Management | 0 (0.0%) | 0 (0.0%) |
| Administrative & Support | 0 (0.0%) | 4 (100.0%) |
| Educational Services | 0 (0.0%) | 5 (100.0%) |
| Health Care & Social Assistance | 3 (12.0%) | 22 (88.0%) |
| Arts, Entertainment & Recreation | 0 (0.0%) | 0 (0.0%) |
| Accommodation & Food Services | 0 (0.0%) | 0 (0.0%) |
| Public Administration | 2 (100.0%) | 0 (0.0%) |
| Total | 73 (50.7%) | 71 (49.3%) |
Education in Canaan
School Enrollment in Canaan
The most common levels of schooling among the 54 students in Canaan are elementary school (12 | 22.2%), high school (11 | 20.4%), and college / undergraduate (11 | 20.4%).
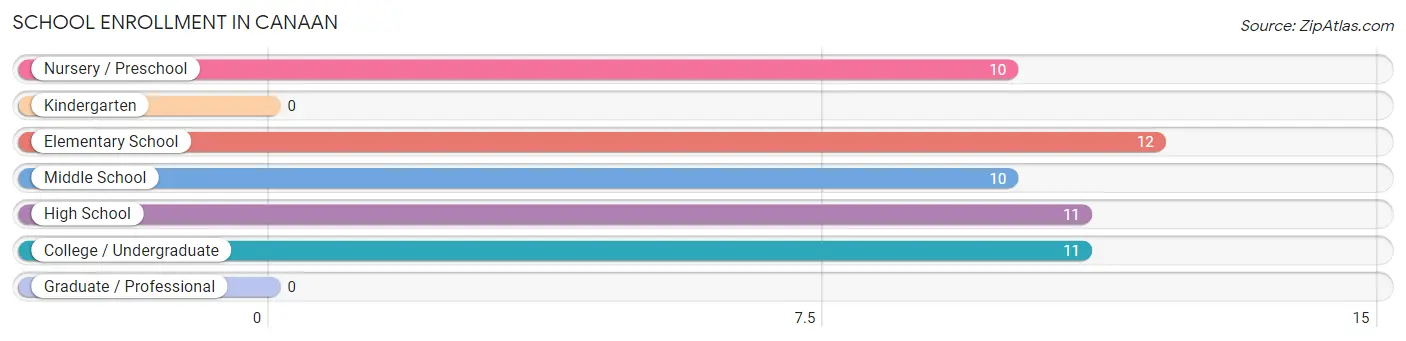
| School Level | # Students | % Students |
| Nursery / Preschool | 10 | 18.5% |
| Kindergarten | 0 | 0.0% |
| Elementary School | 12 | 22.2% |
| Middle School | 10 | 18.5% |
| High School | 11 | 20.4% |
| College / Undergraduate | 11 | 20.4% |
| Graduate / Professional | 0 | 0.0% |
| Total | 54 | 100.0% |
School Enrollment by Age by Funding Source in Canaan
Out of a total of 54 students who are enrolled in schools in Canaan, 2 (3.7%) attend a private institution, while the remaining 52 (96.3%) are enrolled in public schools. The age group of 18 to 19 year olds has the highest likelihood of being enrolled in private schools, with 2 (50.0% in the age bracket) enrolled. Conversely, the age group of 3 to 4 year olds has the lowest likelihood of being enrolled in a private school, with 10 (100.0% in the age bracket) attending a public institution.
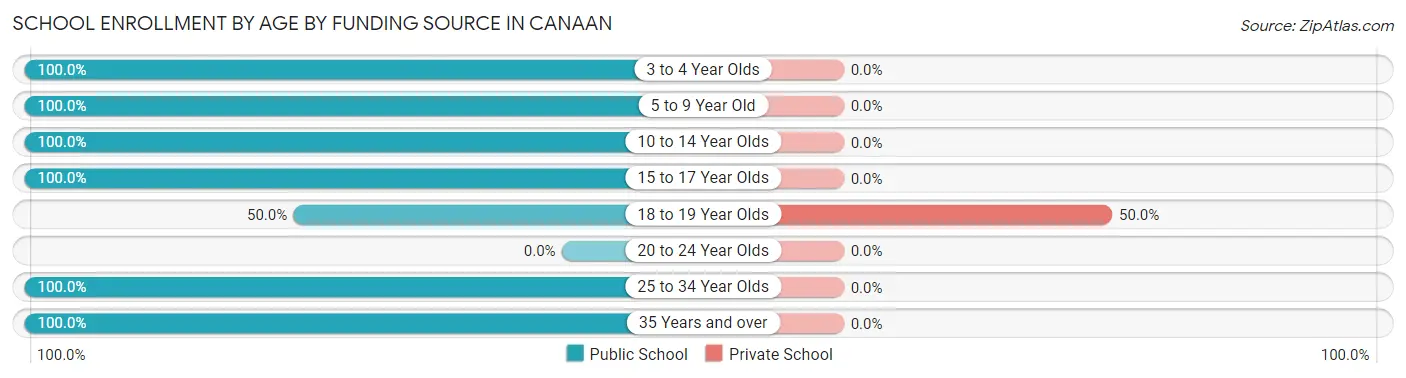
| Age Bracket | Public School | Private School |
| 3 to 4 Year Olds | 10 (100.0%) | 0 (0.0%) |
| 5 to 9 Year Old | 10 (100.0%) | 0 (0.0%) |
| 10 to 14 Year Olds | 12 (100.0%) | 0 (0.0%) |
| 15 to 17 Year Olds | 11 (100.0%) | 0 (0.0%) |
| 18 to 19 Year Olds | 2 (50.0%) | 2 (50.0%) |
| 20 to 24 Year Olds | 0 (0.0%) | 0 (0.0%) |
| 25 to 34 Year Olds | 5 (100.0%) | 0 (0.0%) |
| 35 Years and over | 2 (100.0%) | 0 (0.0%) |
| Total | 52 (96.3%) | 2 (3.7%) |
Educational Attainment by Field of Study in Canaan
Psychology (6 | 30.0%), education (5 | 25.0%), liberal arts & history (4 | 20.0%), multidisciplinary studies (3 | 15.0%), and social sciences (2 | 10.0%) are the most common fields of study among 20 individuals in Canaan who have obtained a bachelor's degree or higher.
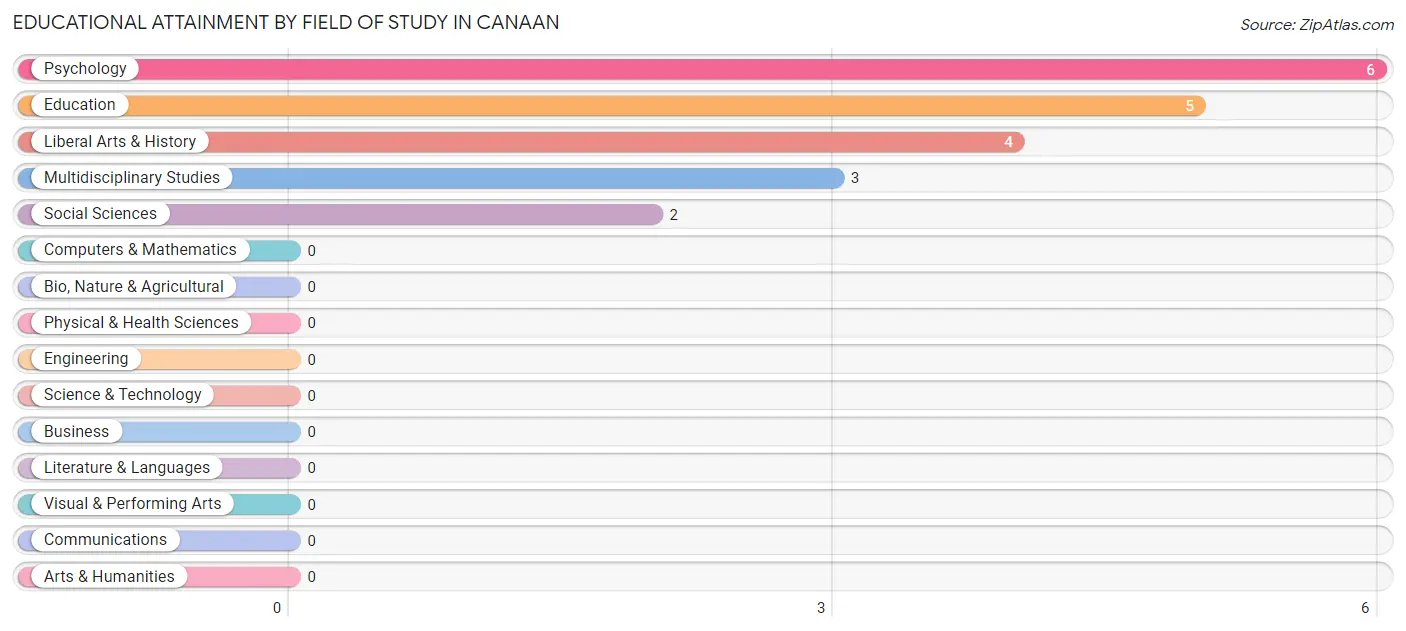
| Field of Study | # Graduates | % Graduates |
| Computers & Mathematics | 0 | 0.0% |
| Bio, Nature & Agricultural | 0 | 0.0% |
| Physical & Health Sciences | 0 | 0.0% |
| Psychology | 6 | 30.0% |
| Social Sciences | 2 | 10.0% |
| Engineering | 0 | 0.0% |
| Multidisciplinary Studies | 3 | 15.0% |
| Science & Technology | 0 | 0.0% |
| Business | 0 | 0.0% |
| Education | 5 | 25.0% |
| Literature & Languages | 0 | 0.0% |
| Liberal Arts & History | 4 | 20.0% |
| Visual & Performing Arts | 0 | 0.0% |
| Communications | 0 | 0.0% |
| Arts & Humanities | 0 | 0.0% |
| Total | 20 | 100.0% |
Transportation & Commute in Canaan
Vehicle Availability by Sex in Canaan
The most prevalent vehicle ownership categories in Canaan are males with 2 vehicles (53, accounting for 72.6%) and females with 2 vehicles (44, making up 74.7%).
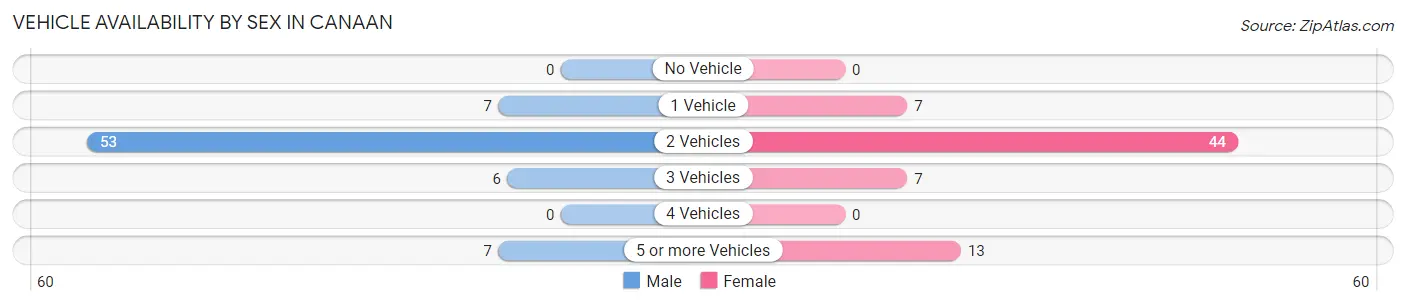
| Vehicles Available | Male | Female |
| No Vehicle | 0 (0.0%) | 0 (0.0%) |
| 1 Vehicle | 7 (9.6%) | 7 (9.9%) |
| 2 Vehicles | 53 (72.6%) | 44 (62.0%) |
| 3 Vehicles | 6 (8.2%) | 7 (9.9%) |
| 4 Vehicles | 0 (0.0%) | 0 (0.0%) |
| 5 or more Vehicles | 7 (9.6%) | 13 (18.3%) |
| Total | 73 (100.0%) | 71 (100.0%) |
Commute Time in Canaan
The most frequently occuring commute durations in Canaan are 15 to 19 minutes (35 commuters, 24.3%), 10 to 14 minutes (33 commuters, 22.9%), and 60 to 89 minutes (18 commuters, 12.5%).
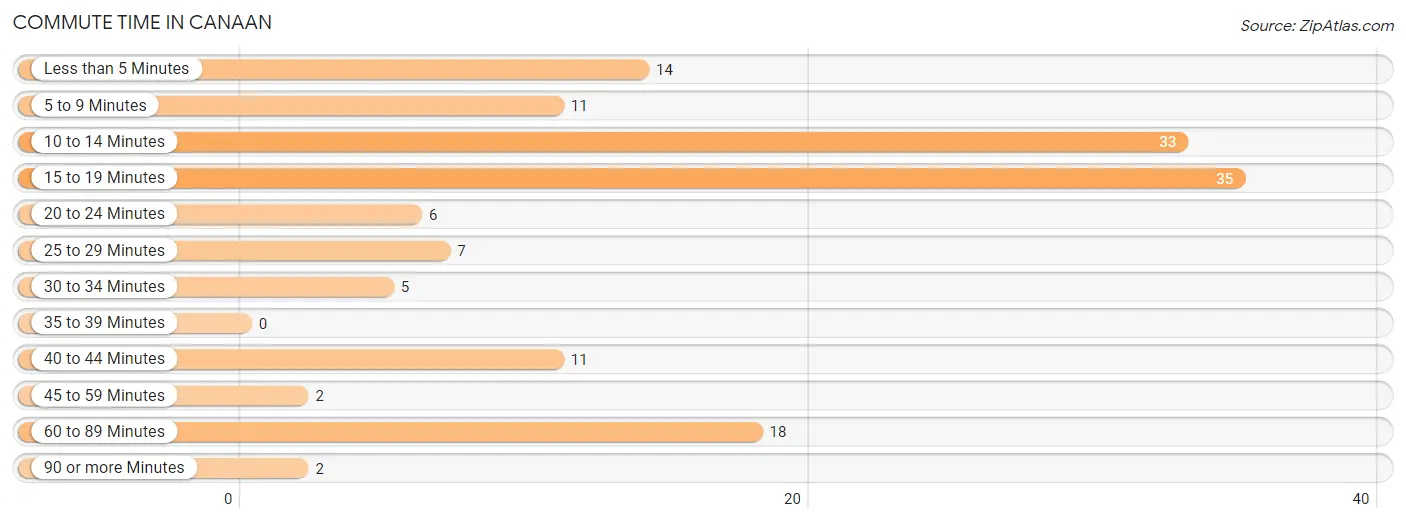
| Commute Time | # Commuters | % Commuters |
| Less than 5 Minutes | 14 | 9.7% |
| 5 to 9 Minutes | 11 | 7.6% |
| 10 to 14 Minutes | 33 | 22.9% |
| 15 to 19 Minutes | 35 | 24.3% |
| 20 to 24 Minutes | 6 | 4.2% |
| 25 to 29 Minutes | 7 | 4.9% |
| 30 to 34 Minutes | 5 | 3.5% |
| 35 to 39 Minutes | 0 | 0.0% |
| 40 to 44 Minutes | 11 | 7.6% |
| 45 to 59 Minutes | 2 | 1.4% |
| 60 to 89 Minutes | 18 | 12.5% |
| 90 or more Minutes | 2 | 1.4% |
Commute Time by Sex in Canaan
The most common commute times in Canaan are 10 to 14 minutes (27 commuters, 37.0%) for males and 15 to 19 minutes (23 commuters, 32.4%) for females.
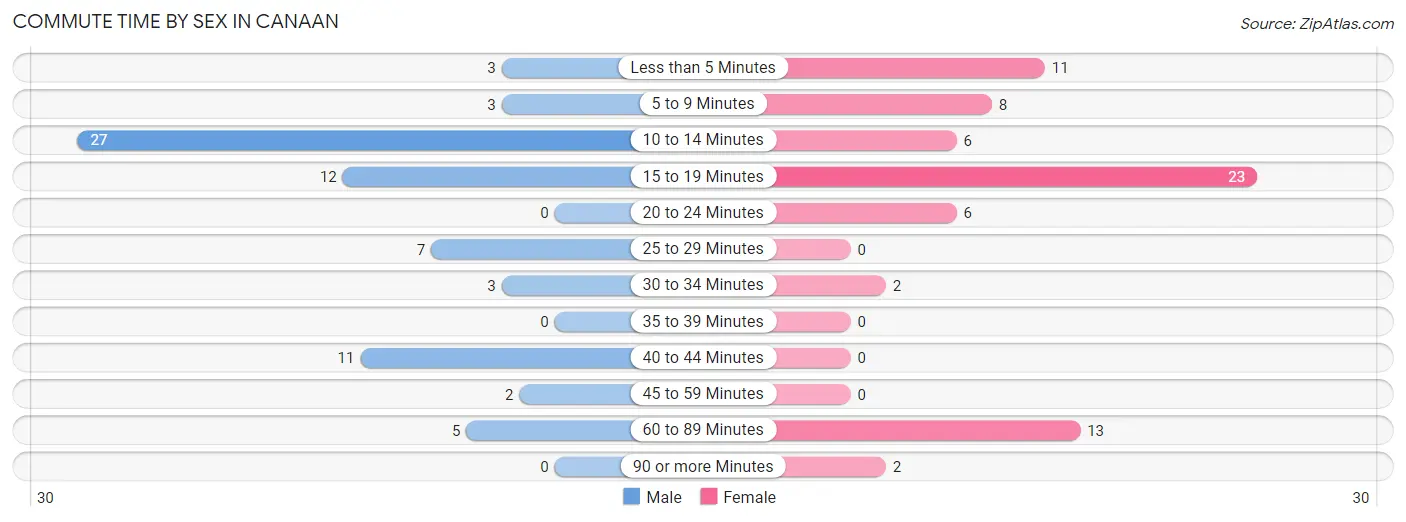
| Commute Time | Male | Female |
| Less than 5 Minutes | 3 (4.1%) | 11 (15.5%) |
| 5 to 9 Minutes | 3 (4.1%) | 8 (11.3%) |
| 10 to 14 Minutes | 27 (37.0%) | 6 (8.5%) |
| 15 to 19 Minutes | 12 (16.4%) | 23 (32.4%) |
| 20 to 24 Minutes | 0 (0.0%) | 6 (8.5%) |
| 25 to 29 Minutes | 7 (9.6%) | 0 (0.0%) |
| 30 to 34 Minutes | 3 (4.1%) | 2 (2.8%) |
| 35 to 39 Minutes | 0 (0.0%) | 0 (0.0%) |
| 40 to 44 Minutes | 11 (15.1%) | 0 (0.0%) |
| 45 to 59 Minutes | 2 (2.7%) | 0 (0.0%) |
| 60 to 89 Minutes | 5 (6.9%) | 13 (18.3%) |
| 90 or more Minutes | 0 (0.0%) | 2 (2.8%) |
Time of Departure to Work by Sex in Canaan
The most frequent times of departure to work in Canaan are 11:00 AM to 11:59 AM (19, 26.0%) for males and 7:30 AM to 7:59 AM (19, 26.8%) for females.
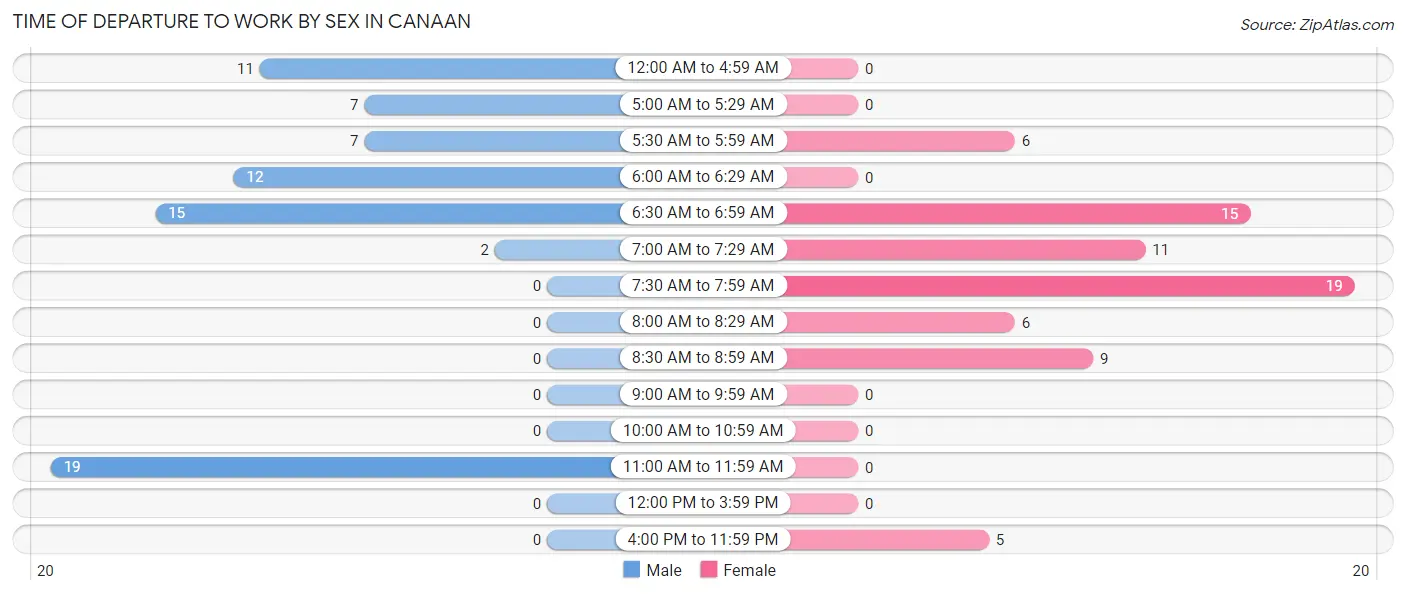
| Time of Departure | Male | Female |
| 12:00 AM to 4:59 AM | 11 (15.1%) | 0 (0.0%) |
| 5:00 AM to 5:29 AM | 7 (9.6%) | 0 (0.0%) |
| 5:30 AM to 5:59 AM | 7 (9.6%) | 6 (8.5%) |
| 6:00 AM to 6:29 AM | 12 (16.4%) | 0 (0.0%) |
| 6:30 AM to 6:59 AM | 15 (20.5%) | 15 (21.1%) |
| 7:00 AM to 7:29 AM | 2 (2.7%) | 11 (15.5%) |
| 7:30 AM to 7:59 AM | 0 (0.0%) | 19 (26.8%) |
| 8:00 AM to 8:29 AM | 0 (0.0%) | 6 (8.5%) |
| 8:30 AM to 8:59 AM | 0 (0.0%) | 9 (12.7%) |
| 9:00 AM to 9:59 AM | 0 (0.0%) | 0 (0.0%) |
| 10:00 AM to 10:59 AM | 0 (0.0%) | 0 (0.0%) |
| 11:00 AM to 11:59 AM | 19 (26.0%) | 0 (0.0%) |
| 12:00 PM to 3:59 PM | 0 (0.0%) | 0 (0.0%) |
| 4:00 PM to 11:59 PM | 0 (0.0%) | 5 (7.0%) |
| Total | 73 (100.0%) | 71 (100.0%) |
Housing Occupancy in Canaan
Occupancy by Ownership in Canaan
Of the total 137 dwellings in Canaan, owner-occupied units account for 103 (75.2%), while renter-occupied units make up 34 (24.8%).
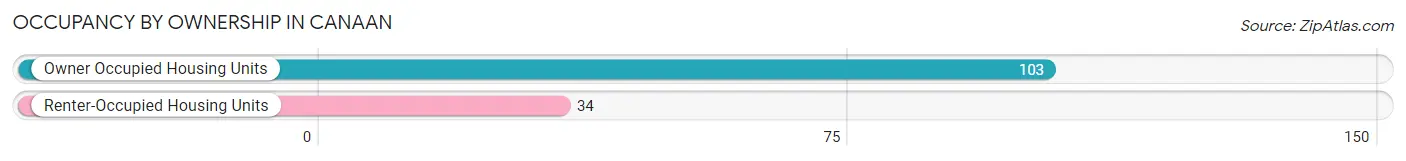
| Occupancy | # Housing Units | % Housing Units |
| Owner Occupied Housing Units | 103 | 75.2% |
| Renter-Occupied Housing Units | 34 | 24.8% |
| Total Occupied Housing Units | 137 | 100.0% |
Occupancy by Household Size in Canaan
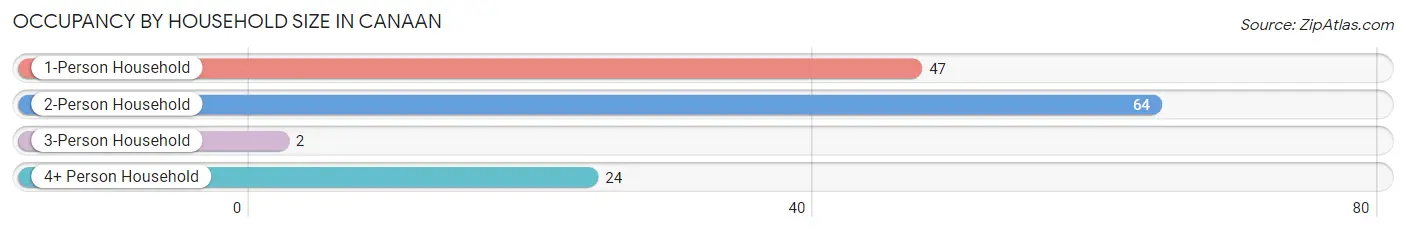
| Household Size | # Housing Units | % Housing Units |
| 1-Person Household | 47 | 34.3% |
| 2-Person Household | 64 | 46.7% |
| 3-Person Household | 2 | 1.5% |
| 4+ Person Household | 24 | 17.5% |
| Total Housing Units | 137 | 100.0% |
Occupancy by Ownership by Household Size in Canaan
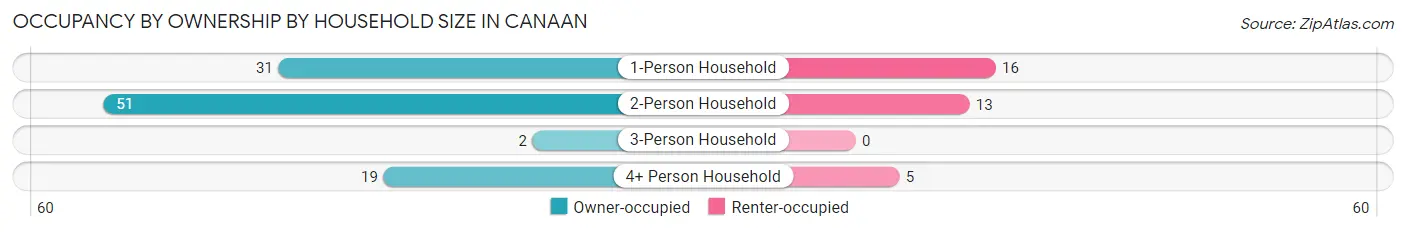
| Household Size | Owner-occupied | Renter-occupied |
| 1-Person Household | 31 (66.0%) | 16 (34.0%) |
| 2-Person Household | 51 (79.7%) | 13 (20.3%) |
| 3-Person Household | 2 (100.0%) | 0 (0.0%) |
| 4+ Person Household | 19 (79.2%) | 5 (20.8%) |
| Total Housing Units | 103 (75.2%) | 34 (24.8%) |
Occupancy by Educational Attainment in Canaan
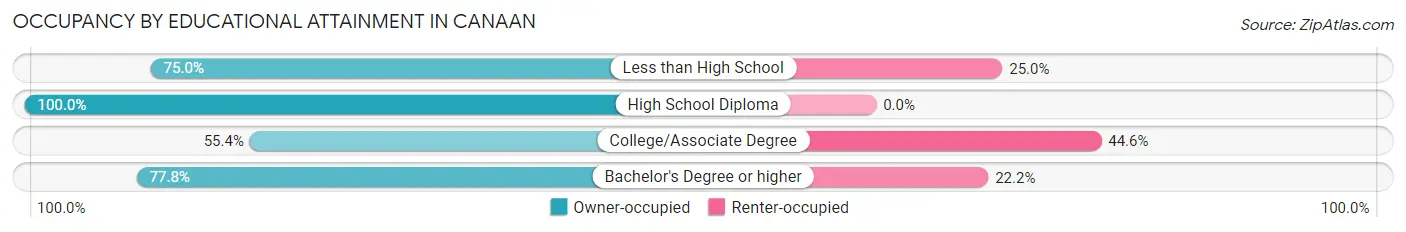
| Household Size | Owner-occupied | Renter-occupied |
| Less than High School | 15 (75.0%) | 5 (25.0%) |
| High School Diploma | 43 (100.0%) | 0 (0.0%) |
| College/Associate Degree | 31 (55.4%) | 25 (44.6%) |
| Bachelor's Degree or higher | 14 (77.8%) | 4 (22.2%) |
Occupancy by Age of Householder in Canaan
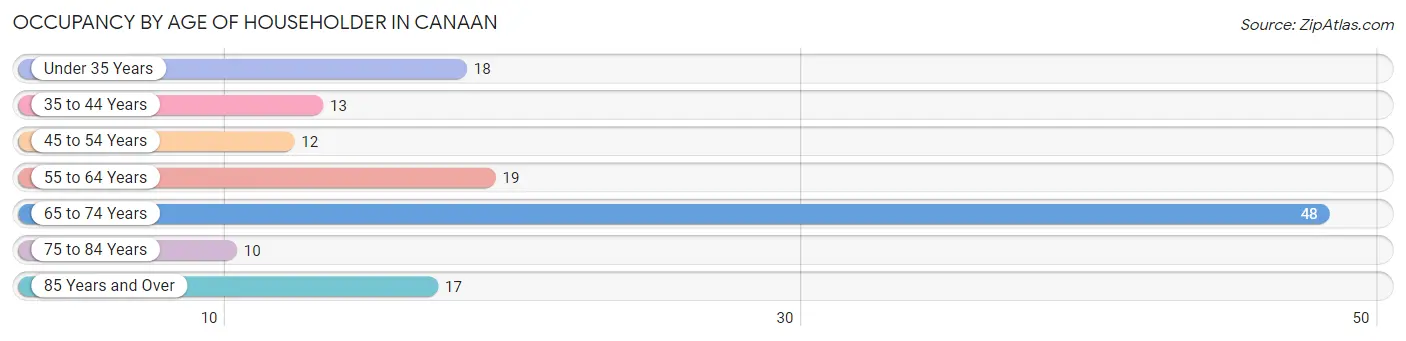
| Age Bracket | # Households | % Households |
| Under 35 Years | 18 | 13.1% |
| 35 to 44 Years | 13 | 9.5% |
| 45 to 54 Years | 12 | 8.8% |
| 55 to 64 Years | 19 | 13.9% |
| 65 to 74 Years | 48 | 35.0% |
| 75 to 84 Years | 10 | 7.3% |
| 85 Years and Over | 17 | 12.4% |
| Total | 137 | 100.0% |
Housing Finances in Canaan
Median Income by Occupancy in Canaan
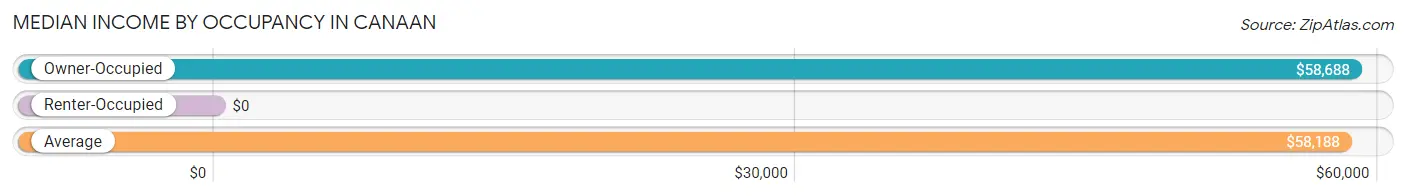
| Occupancy Type | # Households | Median Income |
| Owner-Occupied | 103 (75.2%) | $58,688 |
| Renter-Occupied | 34 (24.8%) | $0 |
| Average | 137 (100.0%) | $58,188 |
Occupancy by Householder Income Bracket in Canaan
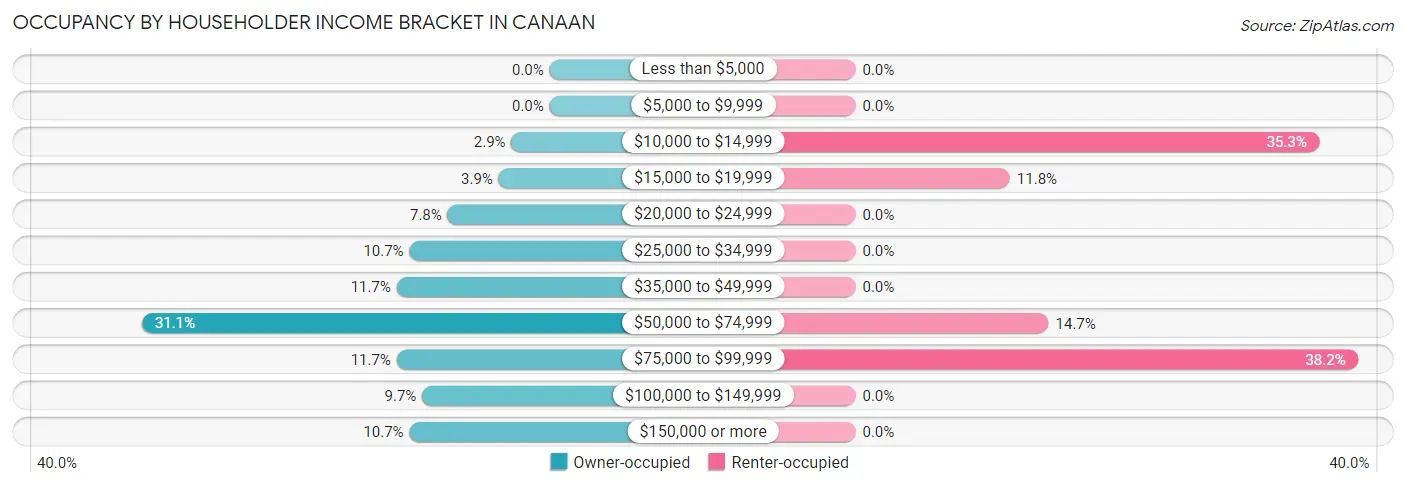
| Income Bracket | Owner-occupied | Renter-occupied |
| Less than $5,000 | 0 (0.0%) | 0 (0.0%) |
| $5,000 to $9,999 | 0 (0.0%) | 0 (0.0%) |
| $10,000 to $14,999 | 3 (2.9%) | 12 (35.3%) |
| $15,000 to $19,999 | 4 (3.9%) | 4 (11.8%) |
| $20,000 to $24,999 | 8 (7.8%) | 0 (0.0%) |
| $25,000 to $34,999 | 11 (10.7%) | 0 (0.0%) |
| $35,000 to $49,999 | 12 (11.7%) | 0 (0.0%) |
| $50,000 to $74,999 | 32 (31.1%) | 5 (14.7%) |
| $75,000 to $99,999 | 12 (11.7%) | 13 (38.2%) |
| $100,000 to $149,999 | 10 (9.7%) | 0 (0.0%) |
| $150,000 or more | 11 (10.7%) | 0 (0.0%) |
| Total | 103 (100.0%) | 34 (100.0%) |
Monthly Housing Cost Tiers in Canaan
| Monthly Cost | Owner-occupied | Renter-occupied |
| Less than $300 | 4 (3.9%) | 7 (20.6%) |
| $300 to $499 | 0 (0.0%) | 0 (0.0%) |
| $500 to $799 | 58 (56.3%) | 4 (11.8%) |
| $800 to $999 | 4 (3.9%) | 3 (8.8%) |
| $1,000 to $1,499 | 28 (27.2%) | 20 (58.8%) |
| $1,500 to $1,999 | 9 (8.7%) | 0 (0.0%) |
| $2,000 to $2,499 | 0 (0.0%) | 0 (0.0%) |
| $2,500 to $2,999 | 0 (0.0%) | 0 (0.0%) |
| $3,000 or more | 0 (0.0%) | 0 (0.0%) |
| Total | 103 (100.0%) | 34 (100.0%) |
Physical Housing Characteristics in Canaan
Housing Structures in Canaan
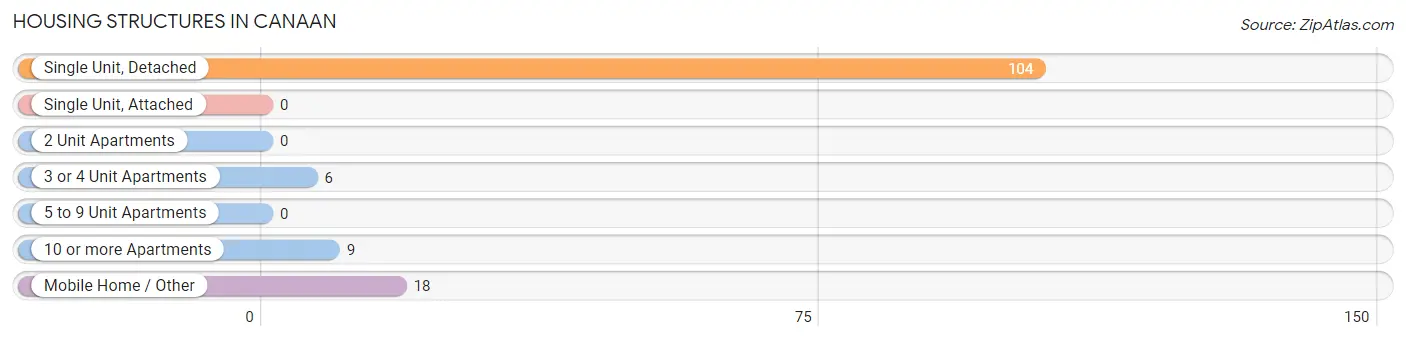
| Structure Type | # Housing Units | % Housing Units |
| Single Unit, Detached | 104 | 75.9% |
| Single Unit, Attached | 0 | 0.0% |
| 2 Unit Apartments | 0 | 0.0% |
| 3 or 4 Unit Apartments | 6 | 4.4% |
| 5 to 9 Unit Apartments | 0 | 0.0% |
| 10 or more Apartments | 9 | 6.6% |
| Mobile Home / Other | 18 | 13.1% |
| Total | 137 | 100.0% |
Housing Structures by Occupancy in Canaan
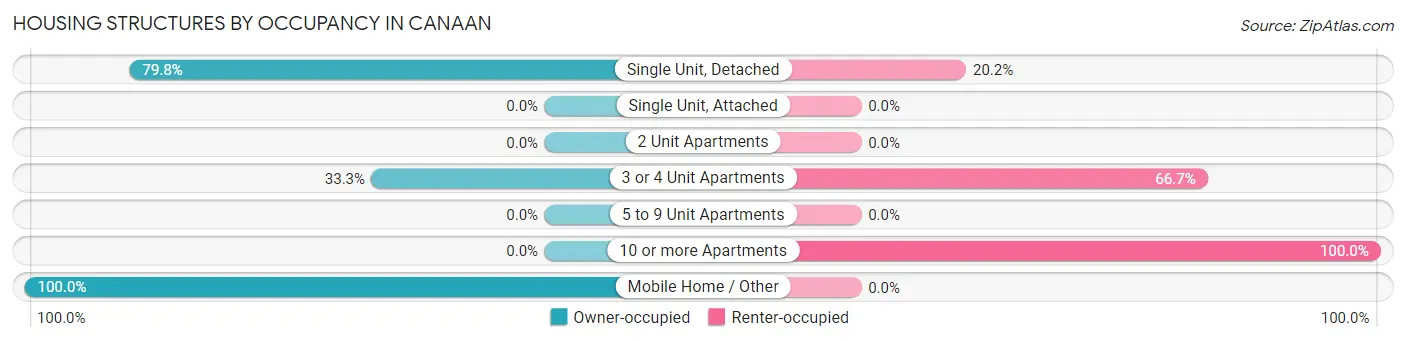
| Structure Type | Owner-occupied | Renter-occupied |
| Single Unit, Detached | 83 (79.8%) | 21 (20.2%) |
| Single Unit, Attached | 0 (0.0%) | 0 (0.0%) |
| 2 Unit Apartments | 0 (0.0%) | 0 (0.0%) |
| 3 or 4 Unit Apartments | 2 (33.3%) | 4 (66.7%) |
| 5 to 9 Unit Apartments | 0 (0.0%) | 0 (0.0%) |
| 10 or more Apartments | 0 (0.0%) | 9 (100.0%) |
| Mobile Home / Other | 18 (100.0%) | 0 (0.0%) |
| Total | 103 (75.2%) | 34 (24.8%) |
Housing Structures by Number of Rooms in Canaan
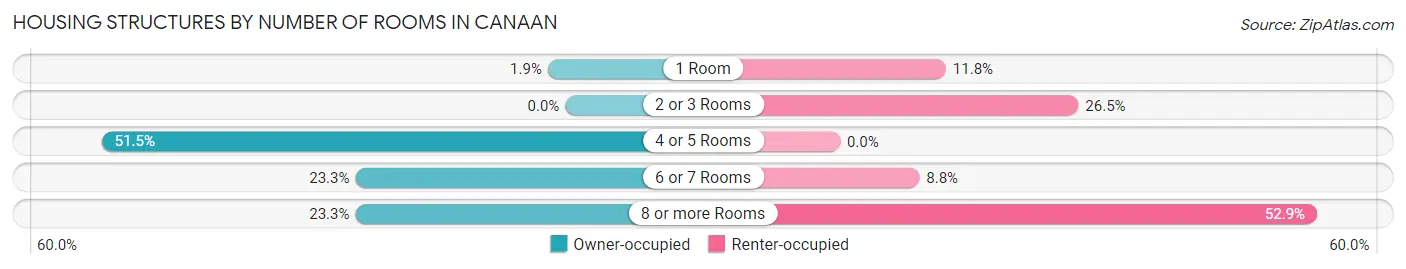
| Number of Rooms | Owner-occupied | Renter-occupied |
| 1 Room | 2 (1.9%) | 4 (11.8%) |
| 2 or 3 Rooms | 0 (0.0%) | 9 (26.5%) |
| 4 or 5 Rooms | 53 (51.5%) | 0 (0.0%) |
| 6 or 7 Rooms | 24 (23.3%) | 3 (8.8%) |
| 8 or more Rooms | 24 (23.3%) | 18 (52.9%) |
| Total | 103 (100.0%) | 34 (100.0%) |
Housing Structure by Heating Type in Canaan
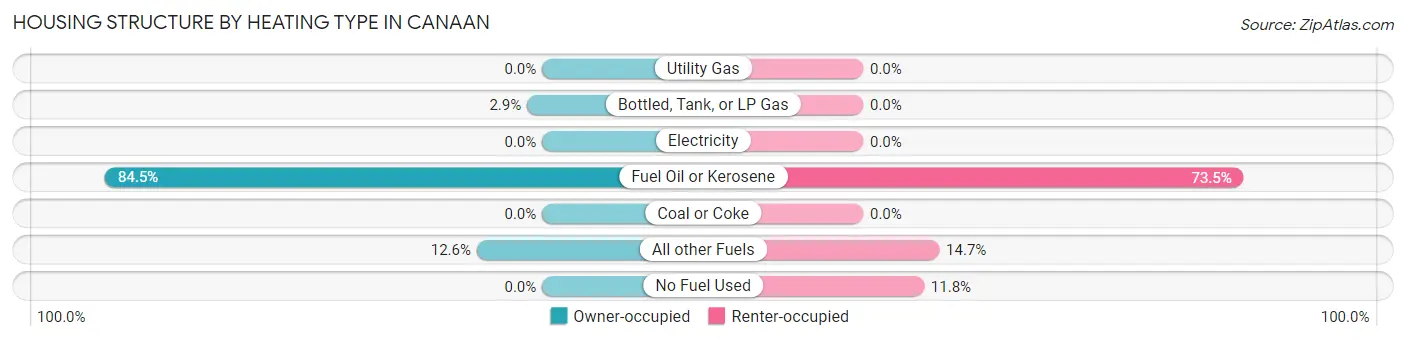
| Heating Type | Owner-occupied | Renter-occupied |
| Utility Gas | 0 (0.0%) | 0 (0.0%) |
| Bottled, Tank, or LP Gas | 3 (2.9%) | 0 (0.0%) |
| Electricity | 0 (0.0%) | 0 (0.0%) |
| Fuel Oil or Kerosene | 87 (84.5%) | 25 (73.5%) |
| Coal or Coke | 0 (0.0%) | 0 (0.0%) |
| All other Fuels | 13 (12.6%) | 5 (14.7%) |
| No Fuel Used | 0 (0.0%) | 4 (11.8%) |
| Total | 103 (100.0%) | 34 (100.0%) |
Household Vehicle Usage in Canaan
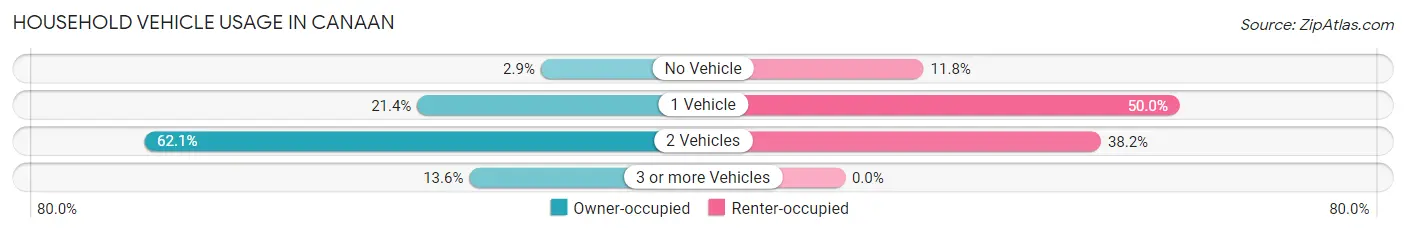
| Vehicles per Household | Owner-occupied | Renter-occupied |
| No Vehicle | 3 (2.9%) | 4 (11.8%) |
| 1 Vehicle | 22 (21.4%) | 17 (50.0%) |
| 2 Vehicles | 64 (62.1%) | 13 (38.2%) |
| 3 or more Vehicles | 14 (13.6%) | 0 (0.0%) |
| Total | 103 (100.0%) | 34 (100.0%) |
Real Estate & Mortgages in Canaan
Real Estate and Mortgage Overview in Canaan
| Characteristic | Without Mortgage | With Mortgage |
| Housing Units | 71 | 32 |
| Median Property Value | $107,100 | $150,000 |
| Median Household Income | $57,938 | $11 |
| Monthly Housing Costs | $585 | $0 |
| Real Estate Taxes | $2,398 | $0 |
Property Value by Mortgage Status in Canaan
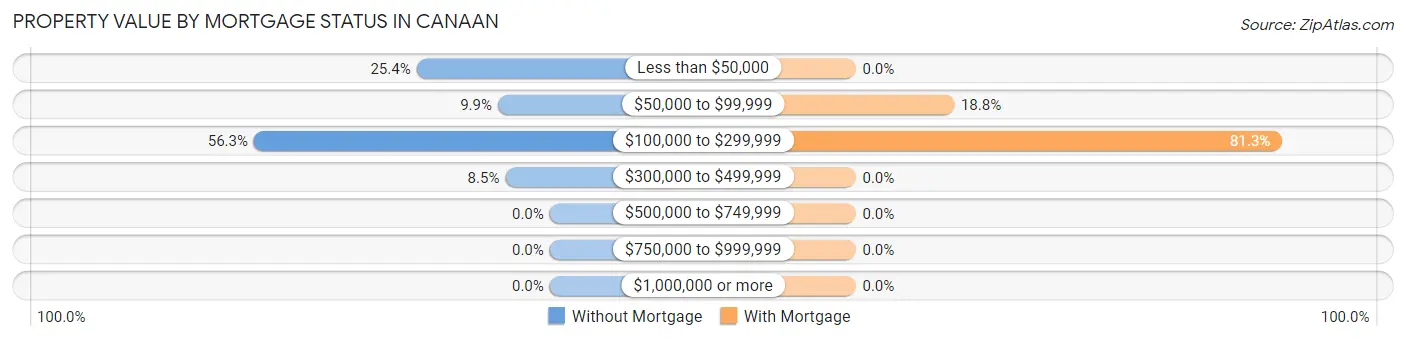
| Property Value | Without Mortgage | With Mortgage |
| Less than $50,000 | 18 (25.4%) | 0 (0.0%) |
| $50,000 to $99,999 | 7 (9.9%) | 6 (18.8%) |
| $100,000 to $299,999 | 40 (56.3%) | 26 (81.2%) |
| $300,000 to $499,999 | 6 (8.5%) | 0 (0.0%) |
| $500,000 to $749,999 | 0 (0.0%) | 0 (0.0%) |
| $750,000 to $999,999 | 0 (0.0%) | 0 (0.0%) |
| $1,000,000 or more | 0 (0.0%) | 0 (0.0%) |
| Total | 71 (100.0%) | 32 (100.0%) |
Household Income by Mortgage Status in Canaan
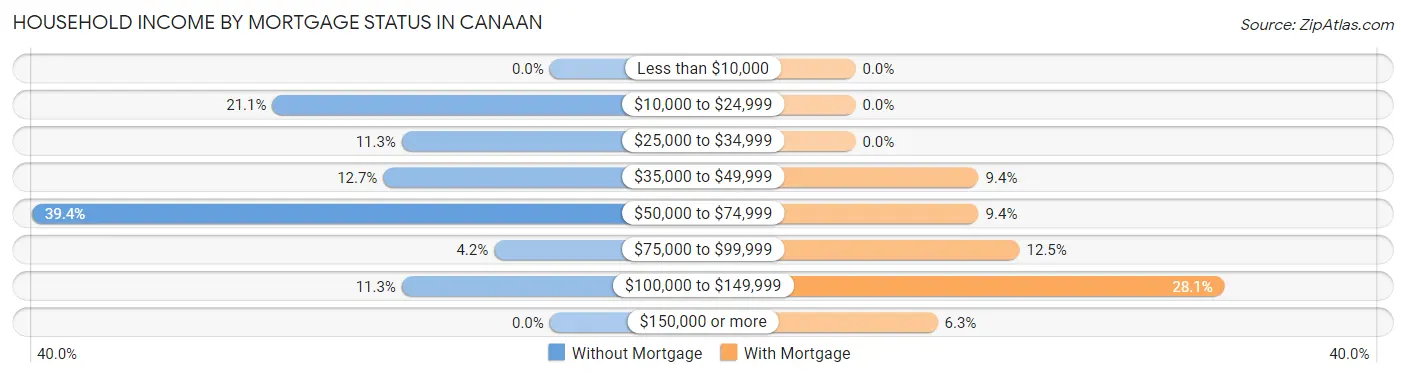
| Household Income | Without Mortgage | With Mortgage |
| Less than $10,000 | 0 (0.0%) | 0 (0.0%) |
| $10,000 to $24,999 | 15 (21.1%) | 0 (0.0%) |
| $25,000 to $34,999 | 8 (11.3%) | 0 (0.0%) |
| $35,000 to $49,999 | 9 (12.7%) | 3 (9.4%) |
| $50,000 to $74,999 | 28 (39.4%) | 3 (9.4%) |
| $75,000 to $99,999 | 3 (4.2%) | 4 (12.5%) |
| $100,000 to $149,999 | 8 (11.3%) | 9 (28.1%) |
| $150,000 or more | 0 (0.0%) | 2 (6.2%) |
| Total | 71 (100.0%) | 32 (100.0%) |
Property Value to Household Income Ratio in Canaan
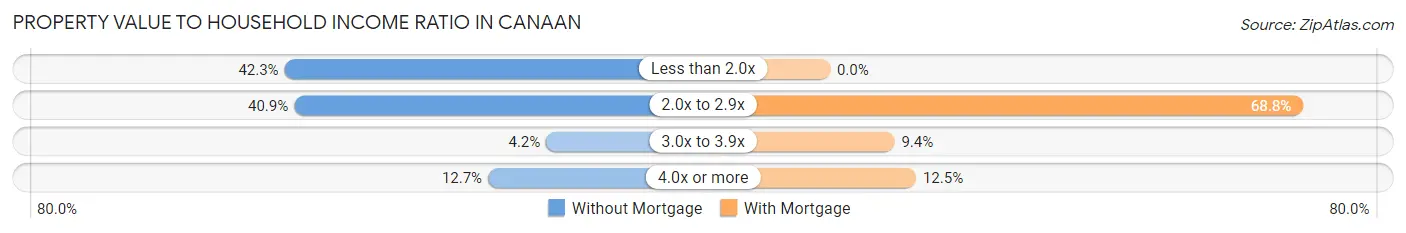
| Value-to-Income Ratio | Without Mortgage | With Mortgage |
| Less than 2.0x | 30 (42.2%) | 0 (0.0%) |
| 2.0x to 2.9x | 29 (40.8%) | 22 (68.8%) |
| 3.0x to 3.9x | 3 (4.2%) | 3 (9.4%) |
| 4.0x or more | 9 (12.7%) | 4 (12.5%) |
| Total | 71 (100.0%) | 32 (100.0%) |
Real Estate Taxes by Mortgage Status in Canaan
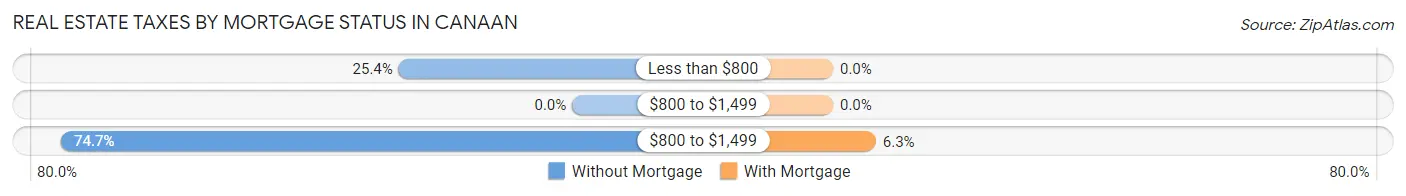
| Property Taxes | Without Mortgage | With Mortgage |
| Less than $800 | 18 (25.4%) | 0 (0.0%) |
| $800 to $1,499 | 0 (0.0%) | 0 (0.0%) |
| $800 to $1,499 | 53 (74.7%) | 2 (6.2%) |
| Total | 71 (100.0%) | 32 (100.0%) |
Health & Disability in Canaan
Health Insurance Coverage by Age in Canaan
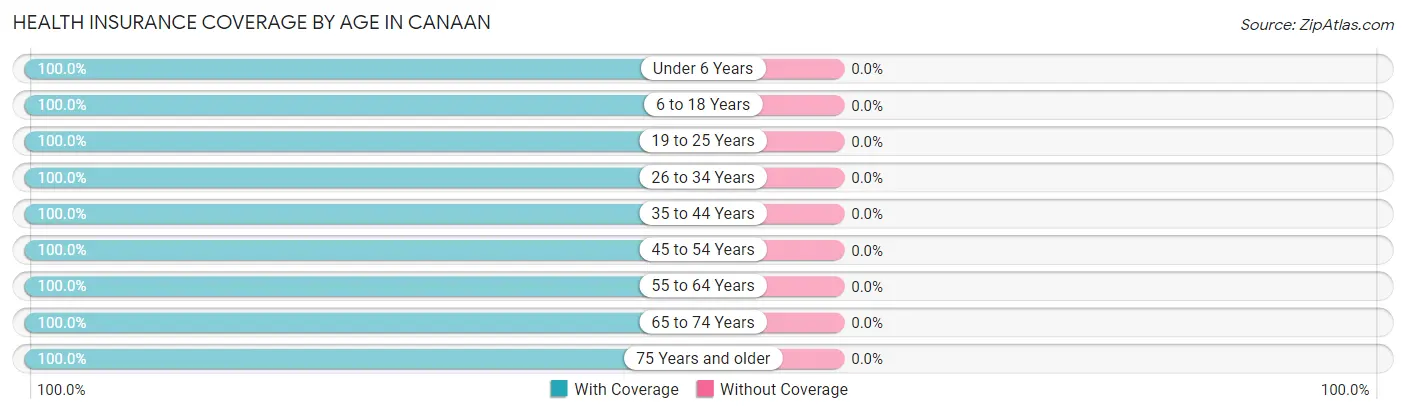
| Age Bracket | With Coverage | Without Coverage |
| Under 6 Years | 14 (100.0%) | 0 (0.0%) |
| 6 to 18 Years | 35 (100.0%) | 0 (0.0%) |
| 19 to 25 Years | 33 (100.0%) | 0 (0.0%) |
| 26 to 34 Years | 8 (100.0%) | 0 (0.0%) |
| 35 to 44 Years | 29 (100.0%) | 0 (0.0%) |
| 45 to 54 Years | 25 (100.0%) | 0 (0.0%) |
| 55 to 64 Years | 31 (100.0%) | 0 (0.0%) |
| 65 to 74 Years | 78 (100.0%) | 0 (0.0%) |
| 75 Years and older | 33 (100.0%) | 0 (0.0%) |
| Total | 286 (100.0%) | 0 (0.0%) |
Health Insurance Coverage by Citizenship Status in Canaan
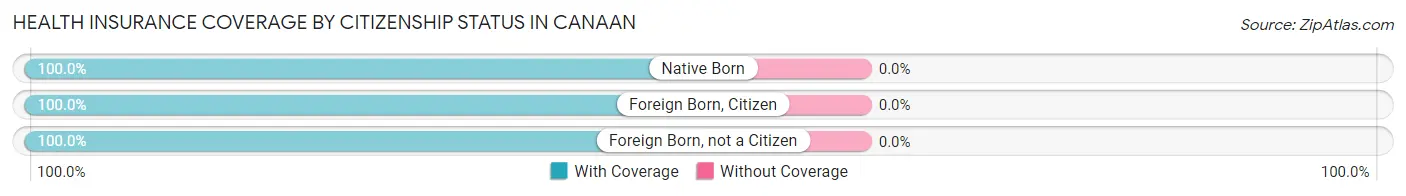
| Citizenship Status | With Coverage | Without Coverage |
| Native Born | 14 (100.0%) | 0 (0.0%) |
| Foreign Born, Citizen | 35 (100.0%) | 0 (0.0%) |
| Foreign Born, not a Citizen | 33 (100.0%) | 0 (0.0%) |
Health Insurance Coverage by Household Income in Canaan
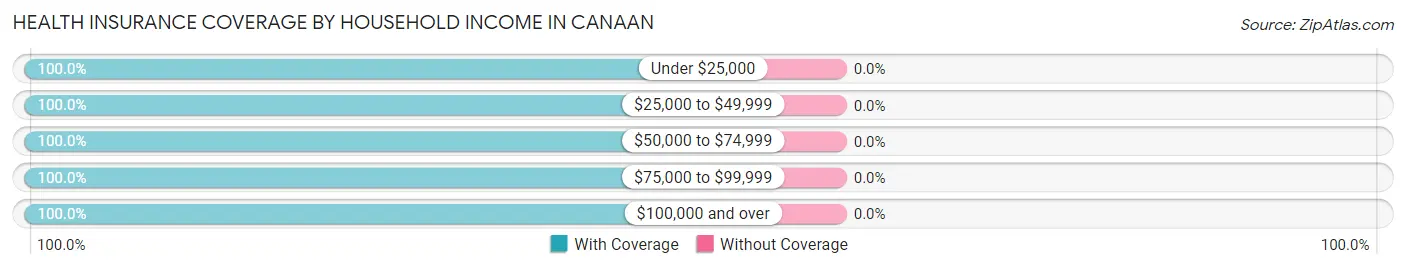
| Household Income | With Coverage | Without Coverage |
| Under $25,000 | 31 (100.0%) | 0 (0.0%) |
| $25,000 to $49,999 | 33 (100.0%) | 0 (0.0%) |
| $50,000 to $74,999 | 90 (100.0%) | 0 (0.0%) |
| $75,000 to $99,999 | 59 (100.0%) | 0 (0.0%) |
| $100,000 and over | 73 (100.0%) | 0 (0.0%) |
Public vs Private Health Insurance Coverage by Age in Canaan
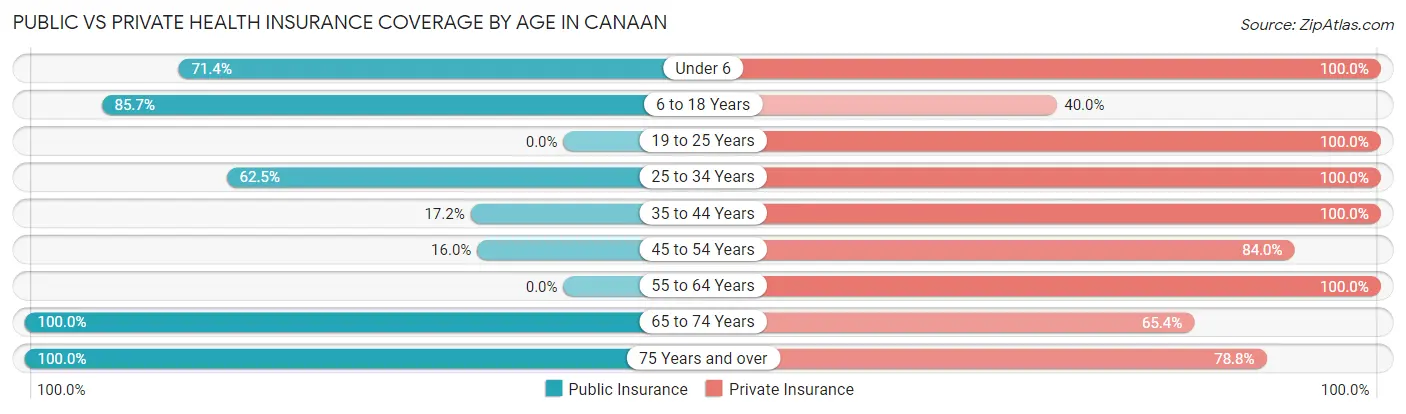
| Age Bracket | Public Insurance | Private Insurance |
| Under 6 | 10 (71.4%) | 14 (100.0%) |
| 6 to 18 Years | 30 (85.7%) | 14 (40.0%) |
| 19 to 25 Years | 0 (0.0%) | 33 (100.0%) |
| 25 to 34 Years | 5 (62.5%) | 8 (100.0%) |
| 35 to 44 Years | 5 (17.2%) | 29 (100.0%) |
| 45 to 54 Years | 4 (16.0%) | 21 (84.0%) |
| 55 to 64 Years | 0 (0.0%) | 31 (100.0%) |
| 65 to 74 Years | 78 (100.0%) | 51 (65.4%) |
| 75 Years and over | 33 (100.0%) | 26 (78.8%) |
| Total | 165 (57.7%) | 227 (79.4%) |
Disability Status by Sex by Age in Canaan
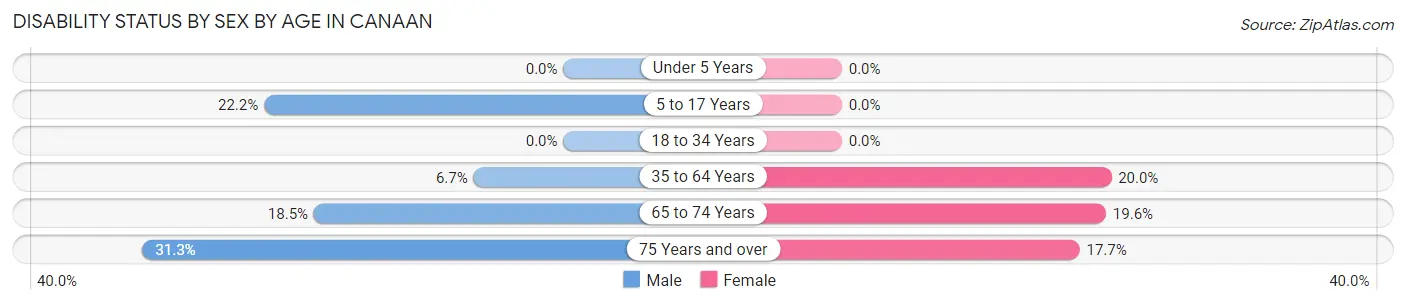
| Age Bracket | Male | Female |
| Under 5 Years | 0 (0.0%) | 0 (0.0%) |
| 5 to 17 Years | 2 (22.2%) | 0 (0.0%) |
| 18 to 34 Years | 0 (0.0%) | 0 (0.0%) |
| 35 to 64 Years | 3 (6.7%) | 8 (20.0%) |
| 65 to 74 Years | 5 (18.5%) | 10 (19.6%) |
| 75 Years and over | 5 (31.2%) | 3 (17.6%) |
Disability Class by Sex by Age in Canaan
Disability Class: Hearing Difficulty
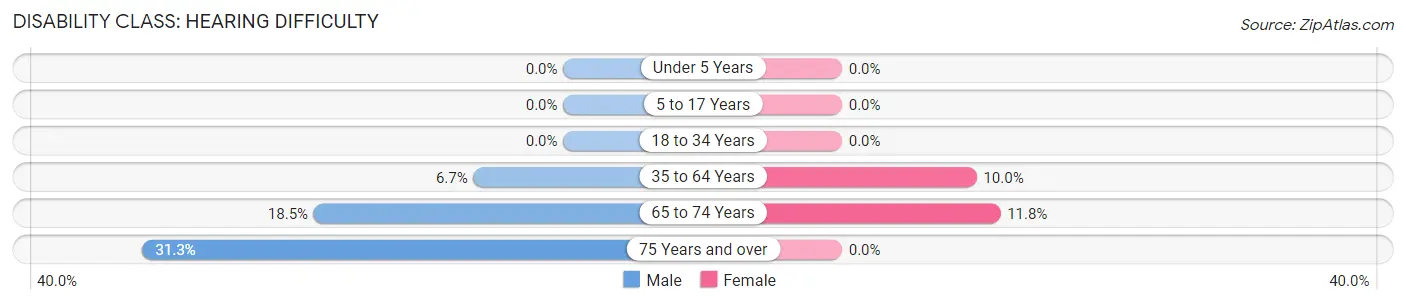
| Age Bracket | Male | Female |
| Under 5 Years | 0 (0.0%) | 0 (0.0%) |
| 5 to 17 Years | 0 (0.0%) | 0 (0.0%) |
| 18 to 34 Years | 0 (0.0%) | 0 (0.0%) |
| 35 to 64 Years | 3 (6.7%) | 4 (10.0%) |
| 65 to 74 Years | 5 (18.5%) | 6 (11.8%) |
| 75 Years and over | 5 (31.2%) | 0 (0.0%) |
Disability Class: Vision Difficulty
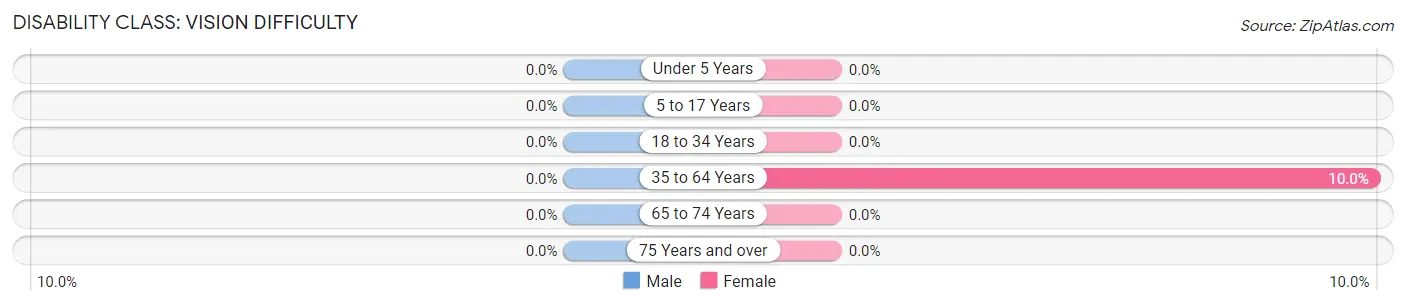
| Age Bracket | Male | Female |
| Under 5 Years | 0 (0.0%) | 0 (0.0%) |
| 5 to 17 Years | 0 (0.0%) | 0 (0.0%) |
| 18 to 34 Years | 0 (0.0%) | 0 (0.0%) |
| 35 to 64 Years | 0 (0.0%) | 4 (10.0%) |
| 65 to 74 Years | 0 (0.0%) | 0 (0.0%) |
| 75 Years and over | 0 (0.0%) | 0 (0.0%) |
Disability Class: Cognitive Difficulty
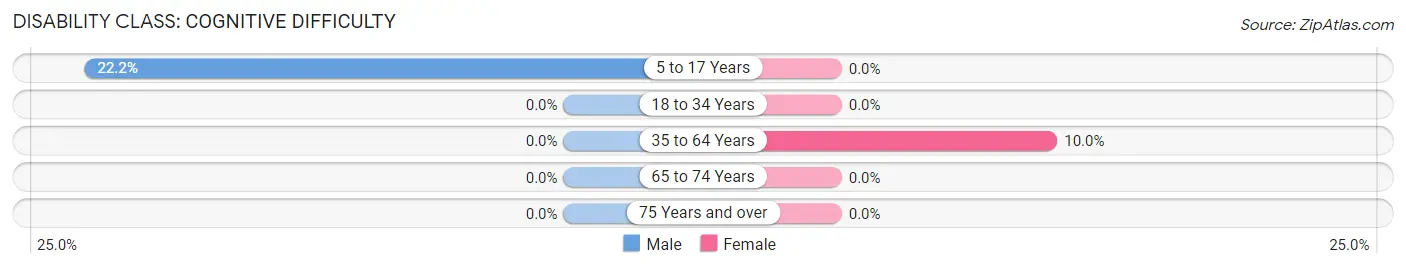
| Age Bracket | Male | Female |
| 5 to 17 Years | 2 (22.2%) | 0 (0.0%) |
| 18 to 34 Years | 0 (0.0%) | 0 (0.0%) |
| 35 to 64 Years | 0 (0.0%) | 4 (10.0%) |
| 65 to 74 Years | 0 (0.0%) | 0 (0.0%) |
| 75 Years and over | 0 (0.0%) | 0 (0.0%) |
Disability Class: Ambulatory Difficulty
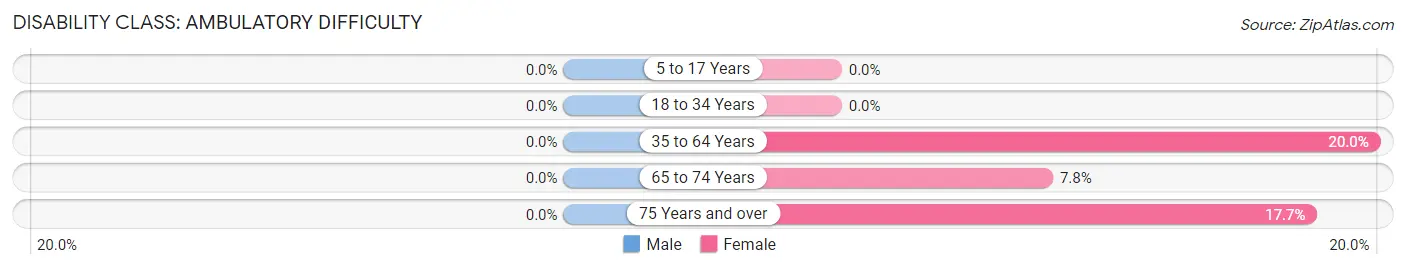
| Age Bracket | Male | Female |
| 5 to 17 Years | 0 (0.0%) | 0 (0.0%) |
| 18 to 34 Years | 0 (0.0%) | 0 (0.0%) |
| 35 to 64 Years | 0 (0.0%) | 8 (20.0%) |
| 65 to 74 Years | 0 (0.0%) | 4 (7.8%) |
| 75 Years and over | 0 (0.0%) | 3 (17.6%) |
Disability Class: Self-Care Difficulty
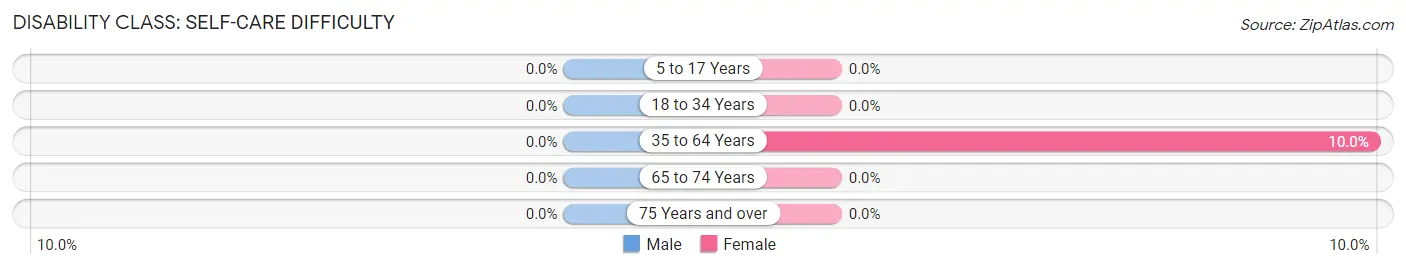
| Age Bracket | Male | Female |
| 5 to 17 Years | 0 (0.0%) | 0 (0.0%) |
| 18 to 34 Years | 0 (0.0%) | 0 (0.0%) |
| 35 to 64 Years | 0 (0.0%) | 4 (10.0%) |
| 65 to 74 Years | 0 (0.0%) | 0 (0.0%) |
| 75 Years and over | 0 (0.0%) | 0 (0.0%) |
Technology Access in Canaan
Computing Device Access in Canaan
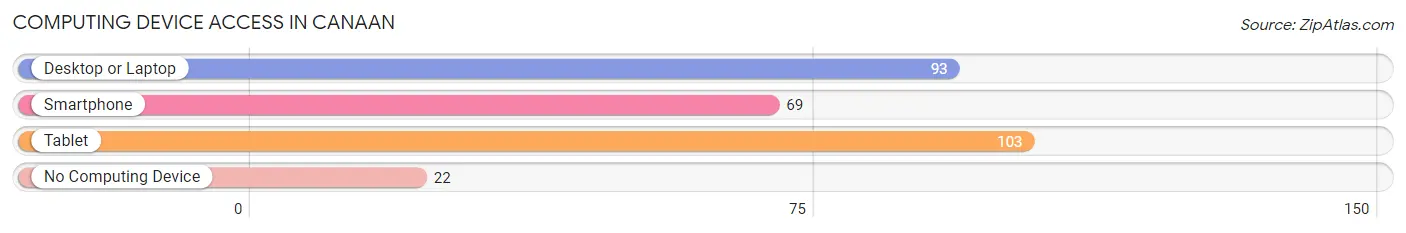
| Device Type | # Households | % Households |
| Desktop or Laptop | 93 | 67.9% |
| Smartphone | 69 | 50.4% |
| Tablet | 103 | 75.2% |
| No Computing Device | 22 | 16.1% |
| Total | 137 | 100.0% |
Internet Access in Canaan
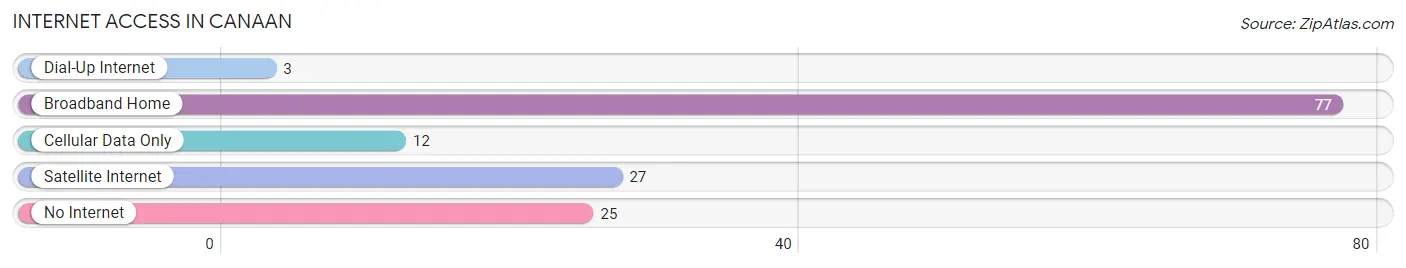
| Internet Type | # Households | % Households |
| Dial-Up Internet | 3 | 2.2% |
| Broadband Home | 77 | 56.2% |
| Cellular Data Only | 12 | 8.8% |
| Satellite Internet | 27 | 19.7% |
| No Internet | 25 | 18.2% |
| Total | 137 | 100.0% |
Canaan Summary
Canaan is a town located in the northeastern corner of Vermont, in the United States. It is part of the Upper Valley region of Vermont and New Hampshire, and is bordered by the towns of Enfield, New Hampshire to the north, and Hanover, New Hampshire to the east. The town is situated in the Connecticut River Valley, and is home to a population of approximately 1,400 people.
History
The area that is now Canaan was first settled in 1763 by a group of settlers from Connecticut. The town was originally known as “New Canaan”, and was incorporated in 1781. The town was named after the biblical land of Canaan, and was one of the first towns in the area to be settled by Europeans.
In the early 19th century, Canaan was a thriving agricultural community, with a population of over 1,000 people. The town was home to a variety of industries, including sawmills, gristmills, and tanneries. The town also had a thriving lumber industry, and was home to several sawmills.
In the late 19th century, the town began to decline in population, as many of its residents moved away in search of better economic opportunities. By the early 20th century, the population had dropped to just over 500 people.
Geography
Canaan is located in the northeastern corner of Vermont, in the Upper Valley region of Vermont and New Hampshire. The town is situated in the Connecticut River Valley, and is bordered by the towns of Enfield, New Hampshire to the north, and Hanover, New Hampshire to the east. The town is located approximately 25 miles north of the city of Lebanon, New Hampshire, and approximately 40 miles south of the city of Montpelier, Vermont.
The town of Canaan covers an area of approximately 24 square miles, and is home to a variety of terrain, including rolling hills, forests, and wetlands. The town is home to several small lakes, including Lake Francis, Lake Morey, and Lake Fairlee.
Economy
The economy of Canaan is largely based on agriculture and tourism. The town is home to several small farms, which produce a variety of crops, including corn, hay, and vegetables. The town is also home to several small businesses, including restaurants, retail stores, and lodging establishments.
The town is also home to several tourist attractions, including the Canaan Valley Resort, which offers skiing, snowboarding, and other winter activities. The town is also home to several historic sites, including the Canaan Historical Society Museum, which houses artifacts from the town’s past.
Demographics
As of the 2010 census, the town of Canaan had a population of 1,400 people. The racial makeup of the town was 97.3% White, 0.6% African American, 0.3% Native American, 0.3% Asian, 0.1% Pacific Islander, 0.3% from other races, and 1.4% from two or more races. Hispanic or Latino of any race were 1.3% of the population.
The median household income in Canaan was $45,000, and the median family income was $50,000. The per capita income for the town was $20,000. Approximately 10.3% of the population was below the poverty line.
Common Questions
What is Per Capita Income in Canaan?
Per Capita income in Canaan is $32,476.
What is the Median Family Income in Canaan?
Median Family Income in Canaan is $63,125.
What is the Median Household income in Canaan?
Median Household Income in Canaan is $58,188.
What is Income or Wage Gap in Canaan?
Income or Wage Gap in Canaan is 23.9%.
Women in Canaan earn 76.1 cents for every dollar earned by a man.
What is Inequality or Gini Index in Canaan?
Inequality or Gini Index in Canaan is 0.40.
What is the Total Population of Canaan?
Total Population of Canaan is 286.
What is the Total Male Population of Canaan?
Total Male Population of Canaan is 121.
What is the Total Female Population of Canaan?
Total Female Population of Canaan is 165.
What is the Ratio of Males per 100 Females in Canaan?
There are 73.33 Males per 100 Females in Canaan.
What is the Ratio of Females per 100 Males in Canaan?
There are 136.36 Females per 100 Males in Canaan.
What is the Median Population Age in Canaan?
Median Population Age in Canaan is 54.8 Years.
What is the Average Family Size in Canaan
Average Family Size in Canaan is 2.6 People.
What is the Average Household Size in Canaan
Average Household Size in Canaan is 2.1 People.
How Large is the Labor Force in Canaan?
There are 164 People in the Labor Forcein in Canaan.
What is the Percentage of People in the Labor Force in Canaan?
65.6% of People are in the Labor Force in Canaan.
What is the Unemployment Rate in Canaan?
Unemployment Rate in Canaan is 12.2%.