Zip Codes with the Highest Percentage of Population Employed in Security & Protection in Vermont
RELATED REPORTS & OPTIONS
Security & Protection
Vermont
Compare Zip Codes
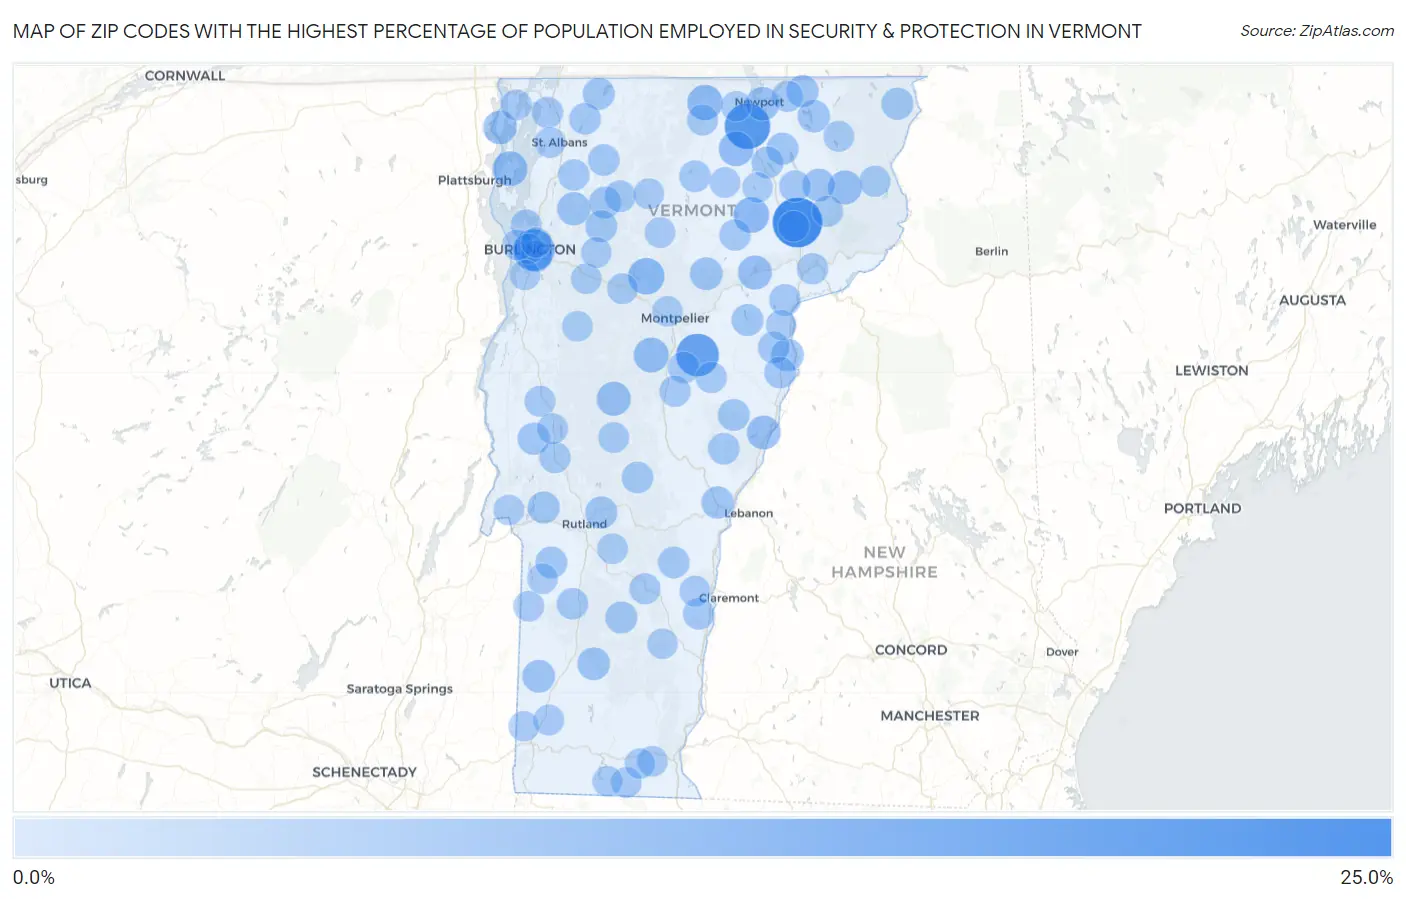
Map of Zip Codes with the Highest Percentage of Population Employed in Security & Protection in Vermont
0.0%
25.0%
Zip Codes with the Highest Percentage of Population Employed in Security & Protection in Vermont
| Zip Code | % Employed | vs State | vs National | |
| 1. | 05850 | 21.7% | 1.4%(+20.4)#1 | 2.1%(+19.6)#174 |
| 2. | 05825 | 17.2% | 1.4%(+15.9)#2 | 2.1%(+15.1)#279 |
| 3. | 05654 | 14.2% | 1.4%(+12.8)#3 | 2.1%(+12.1)#405 |
| 4. | 05405 | 13.1% | 1.4%(+11.7)#4 | 2.1%(+10.9)#473 |
| 5. | 05677 | 7.3% | 1.4%(+5.94)#5 | 2.1%(+5.14)#1,405 |
| 6. | 05842 | 6.6% | 1.4%(+5.22)#6 | 2.1%(+4.43)#1,750 |
| 7. | 05859 | 6.2% | 1.4%(+4.85)#7 | 2.1%(+4.05)#1,954 |
| 8. | 05458 | 5.7% | 1.4%(+4.33)#8 | 2.1%(+3.53)#2,302 |
| 9. | 05663 | 5.7% | 1.4%(+4.31)#9 | 2.1%(+3.51)#2,314 |
| 10. | 05845 | 5.6% | 1.4%(+4.27)#10 | 2.1%(+3.47)#2,361 |
| 11. | 05747 | 4.8% | 1.4%(+3.50)#11 | 2.1%(+2.70)#3,111 |
| 12. | 05873 | 4.8% | 1.4%(+3.49)#12 | 2.1%(+2.69)#3,119 |
| 13. | 05837 | 4.6% | 1.4%(+3.28)#13 | 2.1%(+2.48)#3,392 |
| 14. | 05045 | 4.6% | 1.4%(+3.23)#14 | 2.1%(+2.43)#3,482 |
| 15. | 05463 | 4.3% | 1.4%(+2.92)#15 | 2.1%(+2.12)#3,994 |
| 16. | 05855 | 4.2% | 1.4%(+2.86)#16 | 2.1%(+2.06)#4,110 |
| 17. | 05494 | 3.9% | 1.4%(+2.55)#17 | 2.1%(+1.75)#4,679 |
| 18. | 05650 | 3.4% | 1.4%(+2.04)#18 | 2.1%(+1.24)#5,984 |
| 19. | 05340 | 3.3% | 1.4%(+2.00)#19 | 2.1%(+1.20)#6,093 |
| 20. | 05081 | 3.3% | 1.4%(+2.00)#20 | 2.1%(+1.20)#6,094 |
| 21. | 05250 | 3.3% | 1.4%(+1.96)#21 | 2.1%(+1.17)#6,198 |
| 22. | 05871 | 3.2% | 1.4%(+1.90)#22 | 2.1%(+1.10)#6,402 |
| 23. | 05853 | 3.1% | 1.4%(+1.78)#23 | 2.1%(+0.984)#6,767 |
| 24. | 05830 | 3.1% | 1.4%(+1.73)#24 | 2.1%(+0.934)#6,948 |
| 25. | 05001 | 2.9% | 1.4%(+1.54)#25 | 2.1%(+0.746)#7,670 |
| 26. | 05778 | 2.8% | 1.4%(+1.46)#26 | 2.1%(+0.664)#8,056 |
| 27. | 05701 | 2.7% | 1.4%(+1.40)#27 | 2.1%(+0.598)#8,324 |
| 28. | 05903 | 2.7% | 1.4%(+1.32)#28 | 2.1%(+0.522)#8,667 |
| 29. | 05457 | 2.6% | 1.4%(+1.30)#29 | 2.1%(+0.501)#8,765 |
| 30. | 05735 | 2.6% | 1.4%(+1.28)#30 | 2.1%(+0.483)#8,861 |
| 31. | 05444 | 2.6% | 1.4%(+1.24)#31 | 2.1%(+0.443)#9,047 |
| 32. | 05860 | 2.6% | 1.4%(+1.23)#32 | 2.1%(+0.429)#9,114 |
| 33. | 05046 | 2.6% | 1.4%(+1.22)#33 | 2.1%(+0.419)#9,169 |
| 34. | 05161 | 2.5% | 1.4%(+1.13)#34 | 2.1%(+0.331)#9,622 |
| 35. | 05489 | 2.5% | 1.4%(+1.12)#35 | 2.1%(+0.325)#9,653 |
| 36. | 05822 | 2.5% | 1.4%(+1.12)#36 | 2.1%(+0.321)#9,674 |
| 37. | 05079 | 2.4% | 1.4%(+1.09)#37 | 2.1%(+0.296)#9,823 |
| 38. | 05757 | 2.4% | 1.4%(+1.05)#38 | 2.1%(+0.252)#10,052 |
| 39. | 05069 | 2.4% | 1.4%(+1.01)#39 | 2.1%(+0.211)#10,282 |
| 40. | 05821 | 2.3% | 1.4%(+0.938)#40 | 2.1%(+0.140)#10,715 |
| 41. | 05483 | 2.3% | 1.4%(+0.929)#41 | 2.1%(+0.132)#10,762 |
| 42. | 05062 | 2.3% | 1.4%(+0.922)#42 | 2.1%(+0.124)#10,815 |
| 43. | 05051 | 2.2% | 1.4%(+0.894)#43 | 2.1%(+0.097)#10,976 |
| 44. | 05679 | 2.2% | 1.4%(+0.874)#44 | 2.1%(+0.076)#11,107 |
| 45. | 05653 | 2.2% | 1.4%(+0.853)#45 | 2.1%(+0.055)#11,238 |
| 46. | 05403 | 2.2% | 1.4%(+0.845)#46 | 2.1%(+0.048)#11,278 |
| 47. | 05867 | 2.2% | 1.4%(+0.815)#47 | 2.1%(+0.018)#11,475 |
| 48. | 05448 | 2.2% | 1.4%(+0.813)#48 | 2.1%(+0.015)#11,492 |
| 49. | 05070 | 2.1% | 1.4%(+0.795)#49 | 2.1%(-0.002)#11,599 |
| 50. | 05156 | 2.1% | 1.4%(+0.771)#50 | 2.1%(-0.026)#11,752 |
| 51. | 05464 | 2.1% | 1.4%(+0.770)#51 | 2.1%(-0.027)#11,754 |
| 52. | 05772 | 2.0% | 1.4%(+0.695)#52 | 2.1%(-0.102)#12,272 |
| 53. | 05488 | 2.0% | 1.4%(+0.678)#53 | 2.1%(-0.120)#12,371 |
| 54. | 05739 | 2.0% | 1.4%(+0.668)#54 | 2.1%(-0.130)#12,437 |
| 55. | 05454 | 2.0% | 1.4%(+0.657)#55 | 2.1%(-0.141)#12,506 |
| 56. | 05843 | 1.9% | 1.4%(+0.579)#56 | 2.1%(-0.219)#13,022 |
| 57. | 05733 | 1.9% | 1.4%(+0.560)#57 | 2.1%(-0.237)#13,142 |
| 58. | 05036 | 1.8% | 1.4%(+0.493)#58 | 2.1%(-0.305)#13,612 |
| 59. | 05819 | 1.8% | 1.4%(+0.473)#59 | 2.1%(-0.325)#13,758 |
| 60. | 05832 | 1.8% | 1.4%(+0.412)#60 | 2.1%(-0.386)#14,207 |
| 61. | 05829 | 1.7% | 1.4%(+0.351)#61 | 2.1%(-0.447)#14,677 |
| 62. | 05675 | 1.7% | 1.4%(+0.344)#62 | 2.1%(-0.454)#14,726 |
| 63. | 05149 | 1.6% | 1.4%(+0.293)#63 | 2.1%(-0.504)#15,089 |
| 64. | 05446 | 1.6% | 1.4%(+0.256)#64 | 2.1%(-0.542)#15,365 |
| 65. | 05905 | 1.6% | 1.4%(+0.251)#65 | 2.1%(-0.547)#15,404 |
| 66. | 05753 | 1.6% | 1.4%(+0.218)#66 | 2.1%(-0.580)#15,658 |
| 67. | 05874 | 1.6% | 1.4%(+0.207)#67 | 2.1%(-0.591)#15,746 |
| 68. | 05767 | 1.5% | 1.4%(+0.160)#68 | 2.1%(-0.638)#16,102 |
| 69. | 05440 | 1.5% | 1.4%(+0.152)#69 | 2.1%(-0.645)#16,171 |
| 70. | 05769 | 1.5% | 1.4%(+0.152)#70 | 2.1%(-0.646)#16,179 |
| 71. | 05151 | 1.5% | 1.4%(+0.137)#71 | 2.1%(-0.660)#16,308 |
| 72. | 05676 | 1.4% | 1.4%(+0.094)#72 | 2.1%(-0.704)#16,625 |
| 73. | 05851 | 1.4% | 1.4%(+0.073)#73 | 2.1%(-0.725)#16,782 |
| 74. | 05661 | 1.4% | 1.4%(+0.043)#74 | 2.1%(-0.755)#16,997 |
| 75. | 05408 | 1.4% | 1.4%(+0.037)#75 | 2.1%(-0.761)#17,045 |
| 76. | 05846 | 1.4% | 1.4%(+0.019)#76 | 2.1%(-0.779)#17,182 |
| 77. | 05262 | 1.4% | 1.4%(+0.007)#77 | 2.1%(-0.791)#17,279 |
| 78. | 05775 | 1.4% | 1.4%(+0.001)#78 | 2.1%(-0.797)#17,328 |
| 79. | 05478 | 1.3% | 1.4%(-0.031)#79 | 2.1%(-0.829)#17,588 |
| 80. | 05342 | 1.3% | 1.4%(-0.085)#80 | 2.1%(-0.883)#18,019 |
| 81. | 05656 | 1.3% | 1.4%(-0.092)#81 | 2.1%(-0.889)#18,072 |
| 82. | 05477 | 1.2% | 1.4%(-0.145)#82 | 2.1%(-0.942)#18,465 |
| 83. | 05602 | 1.2% | 1.4%(-0.165)#83 | 2.1%(-0.963)#18,616 |
| 84. | 05827 | 1.2% | 1.4%(-0.183)#84 | 2.1%(-0.981)#18,770 |
| 85. | 05465 | 1.2% | 1.4%(-0.200)#85 | 2.1%(-0.998)#18,888 |
| 86. | 05738 | 1.1% | 1.4%(-0.201)#86 | 2.1%(-0.999)#18,902 |
| 87. | 05487 | 1.1% | 1.4%(-0.212)#87 | 2.1%(-1.01)#19,004 |
| 88. | 05301 | 1.1% | 1.4%(-0.217)#88 | 2.1%(-1.01)#19,039 |
| 89. | 05774 | 1.1% | 1.4%(-0.276)#89 | 2.1%(-1.07)#19,468 |
| 90. | 05401 | 1.1% | 1.4%(-0.292)#90 | 2.1%(-1.09)#19,592 |
| 91. | 05344 | 1.0% | 1.4%(-0.309)#91 | 2.1%(-1.11)#19,727 |
| 92. | 05743 | 1.0% | 1.4%(-0.320)#92 | 2.1%(-1.12)#19,809 |
| 93. | 05361 | 1.0% | 1.4%(-0.333)#93 | 2.1%(-1.13)#19,899 |
| 94. | 05042 | 1.0% | 1.4%(-0.344)#94 | 2.1%(-1.14)#19,984 |
| 95. | 05839 | 1.0% | 1.4%(-0.347)#95 | 2.1%(-1.15)#20,012 |
| 96. | 05143 | 1.0% | 1.4%(-0.350)#96 | 2.1%(-1.15)#20,025 |
| 97. | 05482 | 0.98% | 1.4%(-0.373)#97 | 2.1%(-1.17)#20,224 |
| 98. | 05404 | 0.94% | 1.4%(-0.412)#98 | 2.1%(-1.21)#20,512 |
| 99. | 05257 | 0.93% | 1.4%(-0.424)#99 | 2.1%(-1.22)#20,597 |
| 100. | 05857 | 0.92% | 1.4%(-0.427)#100 | 2.1%(-1.22)#20,620 |
Common Questions
What are the Top 10 Zip Codes with the Highest Percentage of Population Employed in Security & Protection in Vermont?
Top 10 Zip Codes with the Highest Percentage of Population Employed in Security & Protection in Vermont are:
What zip code has the Highest Percentage of Population Employed in Security & Protection in Vermont?
05850 has the Highest Percentage of Population Employed in Security & Protection in Vermont with 21.7%.
What is the Percentage of Population Employed in Security & Protection in the State of Vermont?
Percentage of Population Employed in Security & Protection in Vermont is 1.4%.
What is the Percentage of Population Employed in Security & Protection in the United States?
Percentage of Population Employed in Security & Protection in the United States is 2.1%.