Lake Bridgeport, TX Map & Demographics
Lake Bridgeport Map
Lake Bridgeport Overview
$37,521
PER CAPITA INCOME
$73,750
AVG FAMILY INCOME
$66,875
AVG HOUSEHOLD INCOME
7.9%
WAGE / INCOME GAP [ % ]
92.1¢/ $1
WAGE / INCOME GAP [ $ ]
0.48
INEQUALITY / GINI INDEX
349
TOTAL POPULATION
171
MALE POPULATION
178
FEMALE POPULATION
96.07
MALES / 100 FEMALES
104.09
FEMALES / 100 MALES
48.5
MEDIAN AGE
2.7
AVG FAMILY SIZE
2.4
AVG HOUSEHOLD SIZE
191
LABOR FORCE [ PEOPLE ]
61.0%
PERCENT IN LABOR FORCE
1.0%
UNEMPLOYMENT RATE
Income in Lake Bridgeport
Income Overview in Lake Bridgeport
Per Capita Income in Lake Bridgeport is $37,521, while median incomes of families and households are $73,750 and $66,875 respectively.
| Characteristic | Number | Measure |
| Per Capita Income | 349 | $37,521 |
| Median Family Income | 103 | $73,750 |
| Mean Family Income | 103 | $95,943 |
| Median Household Income | 143 | $66,875 |
| Mean Household Income | 143 | $90,166 |
| Income Deficit | 103 | $0 |
| Wage / Income Gap (%) | 349 | 7.88% |
| Wage / Income Gap ($) | 349 | 92.12¢ per $1 |
| Gini / Inequality Index | 349 | 0.48 |
Earnings by Sex in Lake Bridgeport
Average Earnings in Lake Bridgeport are $33,269, $31,667 for men and $34,375 for women, a difference of 7.9%.
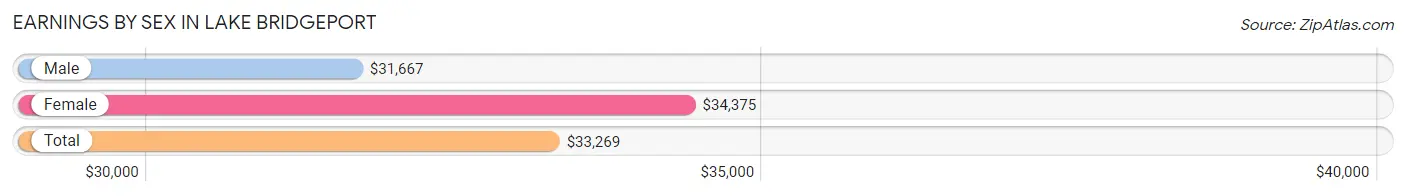
| Sex | Number | Average Earnings |
| Male | 98 (50.5%) | $31,667 |
| Female | 96 (49.5%) | $34,375 |
| Total | 194 (100.0%) | $33,269 |
Earnings by Sex by Income Bracket in Lake Bridgeport
The most common earnings brackets in Lake Bridgeport are $100,000+ for men (13 | 13.3%) and $55,000 to $64,999 for women (20 | 20.8%).
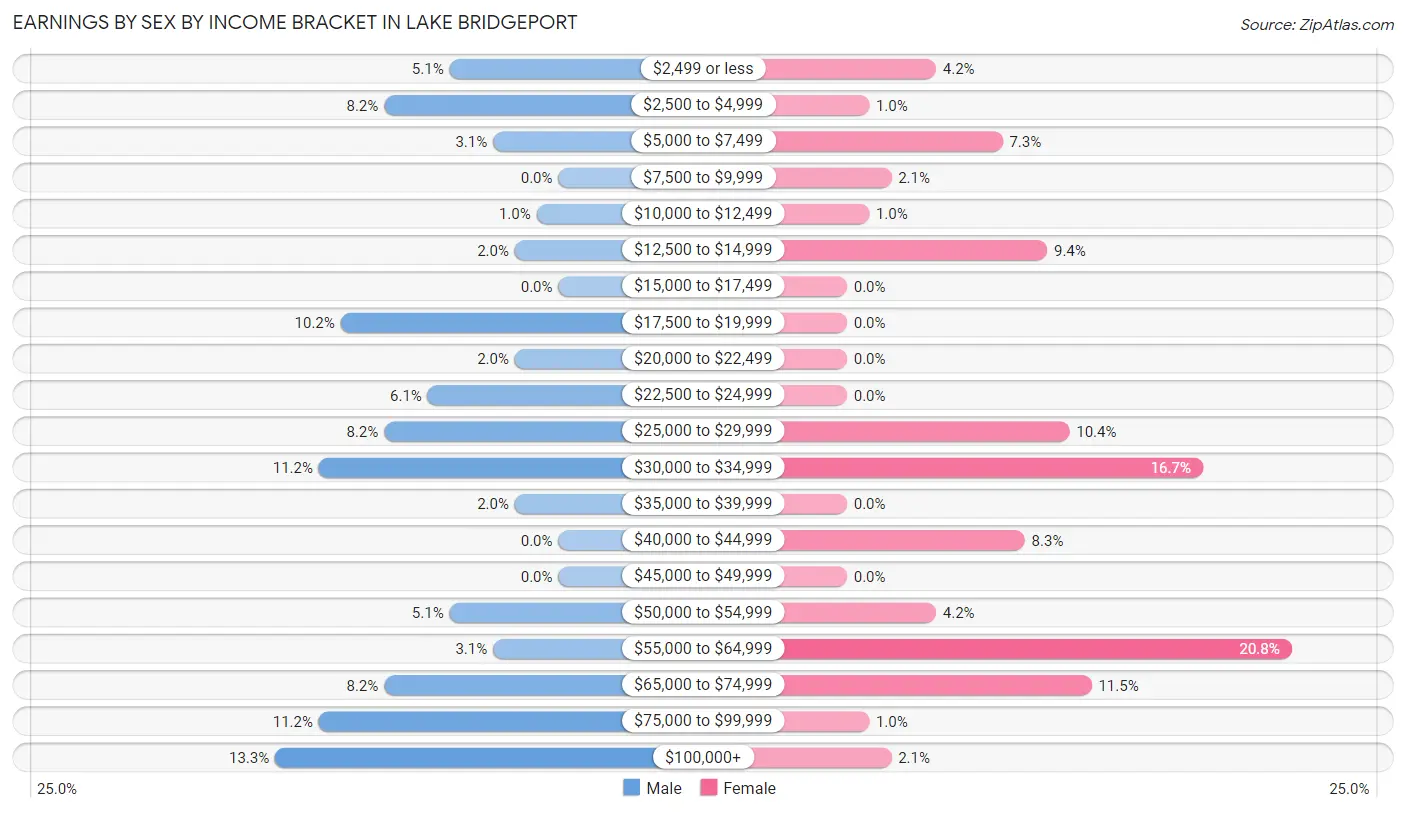
| Income | Male | Female |
| $2,499 or less | 5 (5.1%) | 4 (4.2%) |
| $2,500 to $4,999 | 8 (8.2%) | 1 (1.0%) |
| $5,000 to $7,499 | 3 (3.1%) | 7 (7.3%) |
| $7,500 to $9,999 | 0 (0.0%) | 2 (2.1%) |
| $10,000 to $12,499 | 1 (1.0%) | 1 (1.0%) |
| $12,500 to $14,999 | 2 (2.0%) | 9 (9.4%) |
| $15,000 to $17,499 | 0 (0.0%) | 0 (0.0%) |
| $17,500 to $19,999 | 10 (10.2%) | 0 (0.0%) |
| $20,000 to $22,499 | 2 (2.0%) | 0 (0.0%) |
| $22,500 to $24,999 | 6 (6.1%) | 0 (0.0%) |
| $25,000 to $29,999 | 8 (8.2%) | 10 (10.4%) |
| $30,000 to $34,999 | 11 (11.2%) | 16 (16.7%) |
| $35,000 to $39,999 | 2 (2.0%) | 0 (0.0%) |
| $40,000 to $44,999 | 0 (0.0%) | 8 (8.3%) |
| $45,000 to $49,999 | 0 (0.0%) | 0 (0.0%) |
| $50,000 to $54,999 | 5 (5.1%) | 4 (4.2%) |
| $55,000 to $64,999 | 3 (3.1%) | 20 (20.8%) |
| $65,000 to $74,999 | 8 (8.2%) | 11 (11.5%) |
| $75,000 to $99,999 | 11 (11.2%) | 1 (1.0%) |
| $100,000+ | 13 (13.3%) | 2 (2.1%) |
| Total | 98 (100.0%) | 96 (100.0%) |
Earnings by Sex by Educational Attainment in Lake Bridgeport
Average earnings in Lake Bridgeport are $50,833 for men and $51,875 for women, a difference of 2.0%. Men with an educational attainment of college or associate's degree enjoy the highest average annual earnings of $71,250, while those with high school diploma education earn the least with $33,250. Women with an educational attainment of college or associate's degree earn the most with the average annual earnings of $60,313, while those with high school diploma education have the smallest earnings of $29,375.
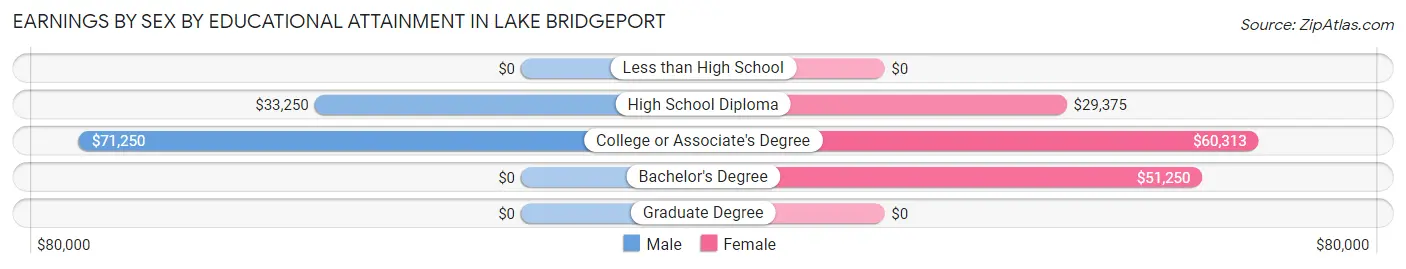
| Educational Attainment | Male Income | Female Income |
| Less than High School | - | - |
| High School Diploma | $33,250 | $29,375 |
| College or Associate's Degree | $71,250 | $60,313 |
| Bachelor's Degree | - | - |
| Graduate Degree | - | - |
| Total | $50,833 | $51,875 |
Family Income in Lake Bridgeport
Family Income Brackets in Lake Bridgeport
According to the Lake Bridgeport family income data, there are 25 families falling into the $50,000 to $74,999 income range, which is the most common income bracket and makes up 24.3% of all families.
| Income Bracket | # Families | % Families |
| Less than $10,000 | 3 | 2.9% |
| $10,000 to $14,999 | 0 | 0.0% |
| $15,000 to $24,999 | 6 | 5.8% |
| $25,000 to $34,999 | 18 | 17.5% |
| $35,000 to $49,999 | 1 | 1.0% |
| $50,000 to $74,999 | 25 | 24.3% |
| $75,000 to $99,999 | 13 | 12.6% |
| $100,000 to $149,999 | 25 | 24.3% |
| $150,000 to $199,999 | 1 | 1.0% |
| $200,000+ | 11 | 10.7% |
Family Income by Famaliy Size in Lake Bridgeport
3-person families (28 | 27.2%) account for the highest median family income in Lake Bridgeport with $133,750 per family, while 3-person families (28 | 27.2%) have the highest median income of $44,583 per family member.
| Income Bracket | # Families | Median Income |
| 2-Person Families | 63 (61.2%) | $73,750 |
| 3-Person Families | 28 (27.2%) | $133,750 |
| 4-Person Families | 9 (8.7%) | $59,250 |
| 5-Person Families | 3 (2.9%) | $0 |
| 6-Person Families | 0 (0.0%) | $0 |
| 7+ Person Families | 0 (0.0%) | $0 |
| Total | 103 (100.0%) | $73,750 |
Family Income by Number of Earners in Lake Bridgeport
| Number of Earners | # Families | Median Income |
| No Earners | 16 (15.5%) | $0 |
| 1 Earner | 31 (30.1%) | $57,750 |
| 2 Earners | 48 (46.6%) | $97,500 |
| 3+ Earners | 8 (7.8%) | $107,500 |
| Total | 103 (100.0%) | $73,750 |
Household Income in Lake Bridgeport
Household Income Brackets in Lake Bridgeport
With 29 households falling in the category, the $50,000 to $74,999 income range is the most frequent in Lake Bridgeport, accounting for 20.3% of all households.
| Income Bracket | # Households | % Households |
| Less than $10,000 | 13 | 9.1% |
| $10,000 to $14,999 | 0 | 0.0% |
| $15,000 to $24,999 | 15 | 10.5% |
| $25,000 to $34,999 | 22 | 15.4% |
| $35,000 to $49,999 | 3 | 2.1% |
| $50,000 to $74,999 | 29 | 20.3% |
| $75,000 to $99,999 | 16 | 11.2% |
| $100,000 to $149,999 | 29 | 20.3% |
| $150,000 to $199,999 | 1 | 0.7% |
| $200,000+ | 15 | 10.5% |
Household Income by Householder Age in Lake Bridgeport
The median household income in Lake Bridgeport is $66,875, with the highest median household income of $76,563 found in the 45 to 64 years age bracket for the primary householder. A total of 52 households (36.4%) fall into this category. Meanwhile, the 15 to 24 years age bracket for the primary householder has the lowest median household income of $2,499, with 7 households (4.9%) in this group.
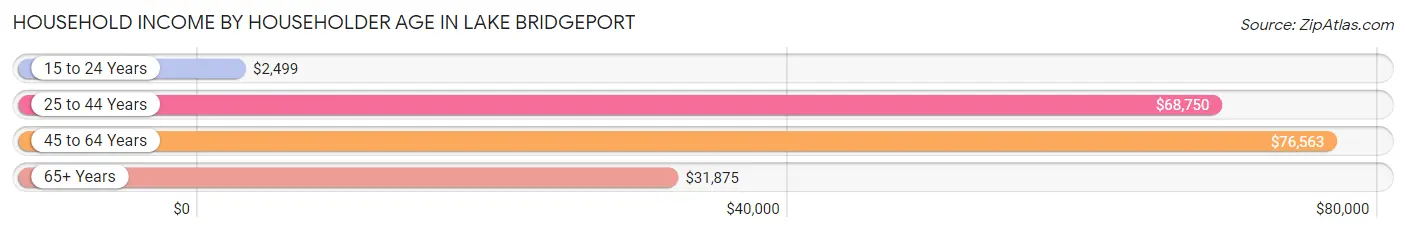
| Income Bracket | # Households | Median Income |
| 15 to 24 Years | 7 (4.9%) | $2,499 |
| 25 to 44 Years | 39 (27.3%) | $68,750 |
| 45 to 64 Years | 52 (36.4%) | $76,563 |
| 65+ Years | 45 (31.5%) | $31,875 |
| Total | 143 (100.0%) | $66,875 |
Poverty in Lake Bridgeport
Income Below Poverty by Sex and Age in Lake Bridgeport
With 13.5% poverty level for males and 9.6% for females among the residents of Lake Bridgeport, 6 to 11 year old males and 25 to 34 year old females are the most vulnerable to poverty, with 4 males (57.1%) and 7 females (41.2%) in their respective age groups living below the poverty level.
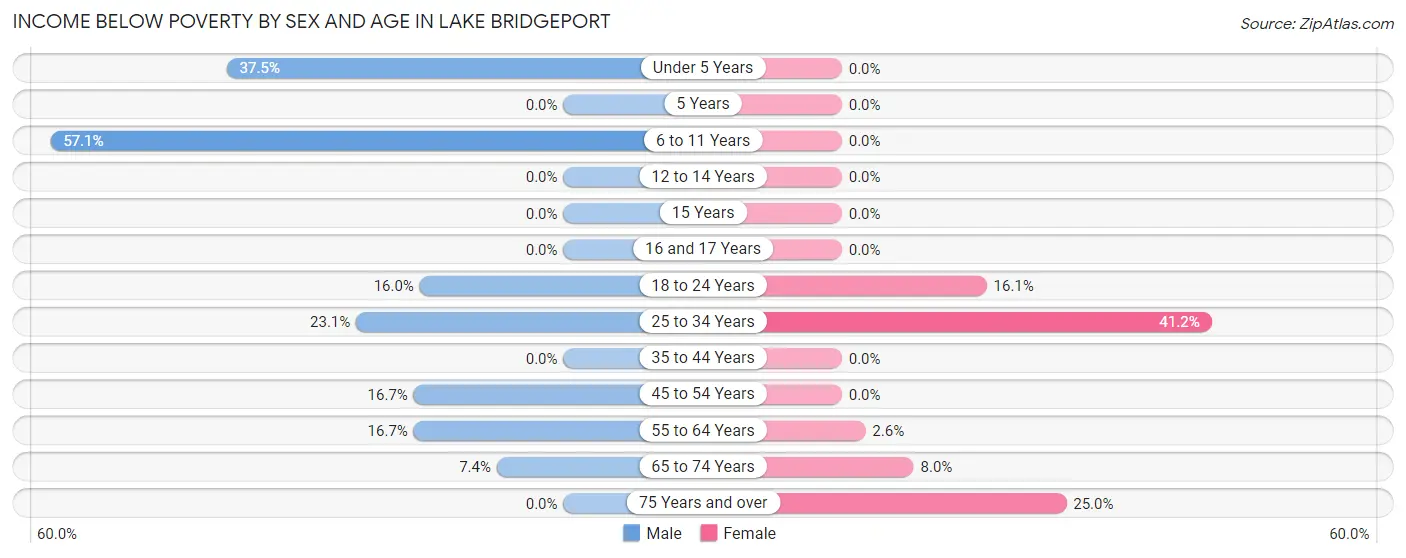
| Age Bracket | Male | Female |
| Under 5 Years | 3 (37.5%) | 0 (0.0%) |
| 5 Years | 0 (0.0%) | 0 (0.0%) |
| 6 to 11 Years | 4 (57.1%) | 0 (0.0%) |
| 12 to 14 Years | 0 (0.0%) | 0 (0.0%) |
| 15 Years | 0 (0.0%) | 0 (0.0%) |
| 16 and 17 Years | 0 (0.0%) | 0 (0.0%) |
| 18 to 24 Years | 4 (16.0%) | 5 (16.1%) |
| 25 to 34 Years | 3 (23.1%) | 7 (41.2%) |
| 35 to 44 Years | 0 (0.0%) | 0 (0.0%) |
| 45 to 54 Years | 3 (16.7%) | 0 (0.0%) |
| 55 to 64 Years | 4 (16.7%) | 1 (2.6%) |
| 65 to 74 Years | 2 (7.4%) | 2 (8.0%) |
| 75 Years and over | 0 (0.0%) | 2 (25.0%) |
| Total | 23 (13.5%) | 17 (9.6%) |
Income Above Poverty by Sex and Age in Lake Bridgeport
According to the poverty statistics in Lake Bridgeport, males aged 12 to 14 years and females aged under 5 years are the age groups that are most secure financially, with 100.0% of males and 100.0% of females in these age groups living above the poverty line.
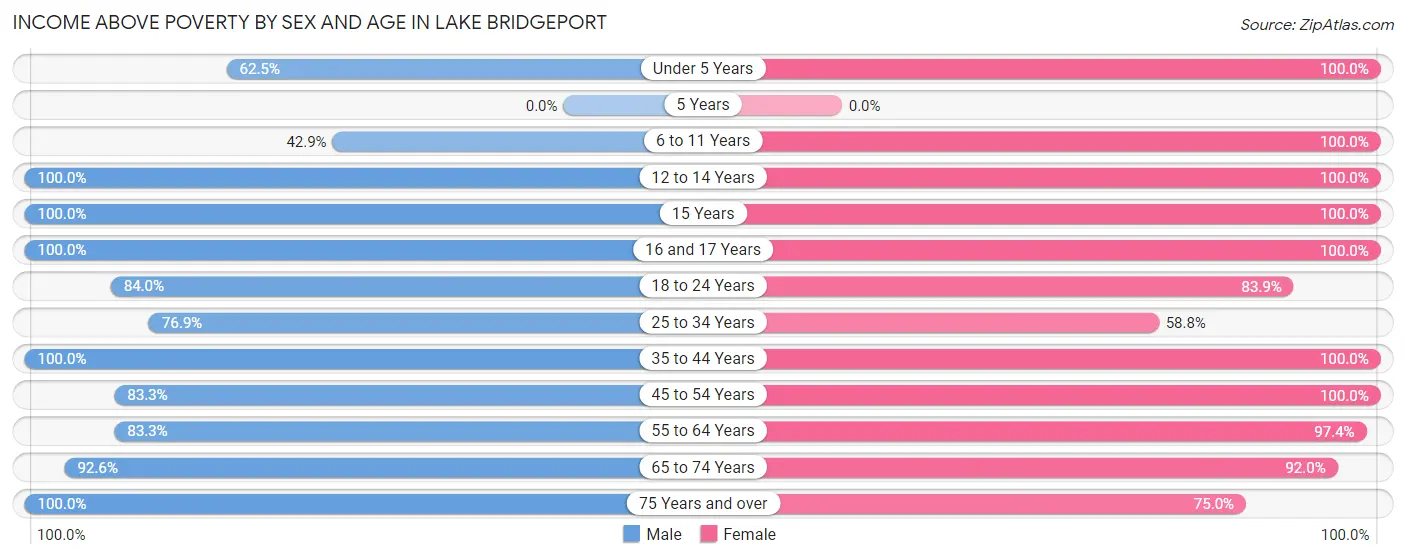
| Age Bracket | Male | Female |
| Under 5 Years | 5 (62.5%) | 1 (100.0%) |
| 5 Years | 0 (0.0%) | 0 (0.0%) |
| 6 to 11 Years | 3 (42.9%) | 6 (100.0%) |
| 12 to 14 Years | 2 (100.0%) | 5 (100.0%) |
| 15 Years | 2 (100.0%) | 5 (100.0%) |
| 16 and 17 Years | 9 (100.0%) | 3 (100.0%) |
| 18 to 24 Years | 21 (84.0%) | 26 (83.9%) |
| 25 to 34 Years | 10 (76.9%) | 10 (58.8%) |
| 35 to 44 Years | 20 (100.0%) | 15 (100.0%) |
| 45 to 54 Years | 15 (83.3%) | 24 (100.0%) |
| 55 to 64 Years | 20 (83.3%) | 37 (97.4%) |
| 65 to 74 Years | 25 (92.6%) | 23 (92.0%) |
| 75 Years and over | 16 (100.0%) | 6 (75.0%) |
| Total | 148 (86.6%) | 161 (90.4%) |
Income Below Poverty Among Married-Couple Families in Lake Bridgeport
The poverty statistics for married-couple families in Lake Bridgeport show that 4.1% or 3 of the total 73 families live below the poverty line. Families with 3 or 4 children have the highest poverty rate of 66.7%, comprising of 2 families. On the other hand, families with 1 or 2 children have the lowest poverty rate of 0.0%, which includes 0 families.
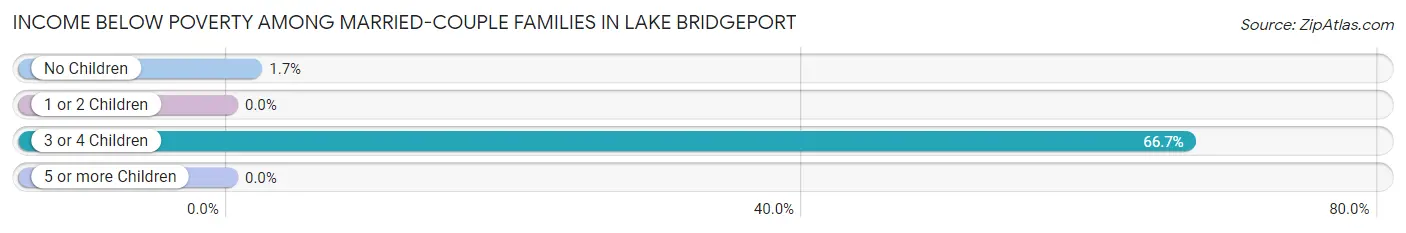
| Children | Above Poverty | Below Poverty |
| No Children | 58 (98.3%) | 1 (1.7%) |
| 1 or 2 Children | 11 (100.0%) | 0 (0.0%) |
| 3 or 4 Children | 1 (33.3%) | 2 (66.7%) |
| 5 or more Children | 0 (0.0%) | 0 (0.0%) |
| Total | 70 (95.9%) | 3 (4.1%) |
Income Below Poverty Among Single-Parent Households in Lake Bridgeport
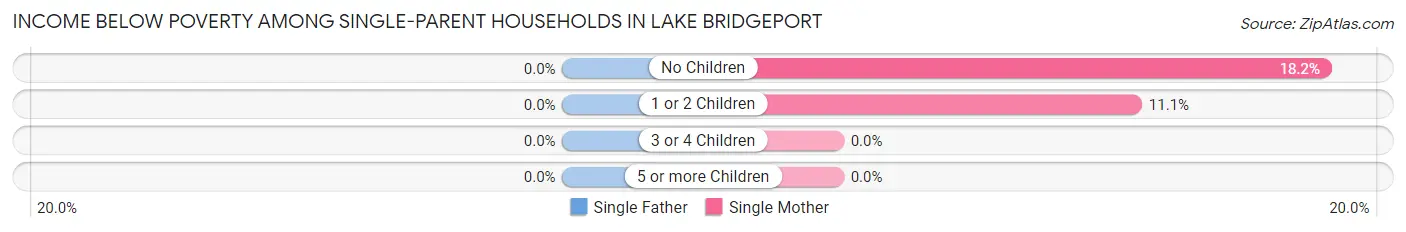
| Children | Single Father | Single Mother |
| No Children | 0 (0.0%) | 2 (18.2%) |
| 1 or 2 Children | 0 (0.0%) | 1 (11.1%) |
| 3 or 4 Children | 0 (0.0%) | 0 (0.0%) |
| 5 or more Children | 0 (0.0%) | 0 (0.0%) |
| Total | 0 (0.0%) | 3 (15.0%) |
Income Below Poverty Among Married-Couple vs Single-Parent Households in Lake Bridgeport
The poverty data for Lake Bridgeport shows that 3 of the married-couple family households (4.1%) and 3 of the single-parent households (10.0%) are living below the poverty level. Within the married-couple family households, those with 3 or 4 children have the highest poverty rate, with 2 households (66.7%) falling below the poverty line. Among the single-parent households, those with no children have the highest poverty rate, with 2 household (10.5%) living below poverty.
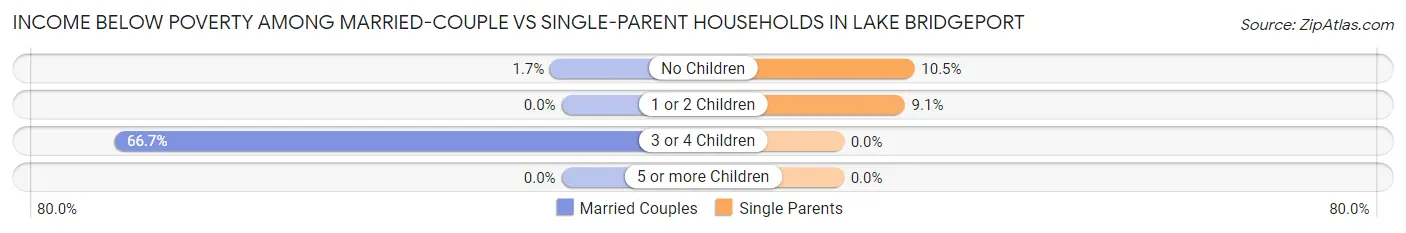
| Children | Married-Couple Families | Single-Parent Households |
| No Children | 1 (1.7%) | 2 (10.5%) |
| 1 or 2 Children | 0 (0.0%) | 1 (9.1%) |
| 3 or 4 Children | 2 (66.7%) | 0 (0.0%) |
| 5 or more Children | 0 (0.0%) | 0 (0.0%) |
| Total | 3 (4.1%) | 3 (10.0%) |
Race in Lake Bridgeport
The most populous races in Lake Bridgeport are White / Caucasian (329 | 94.3%), Hispanic or Latino (23 | 6.6%), and Two or more Races (14 | 4.0%).
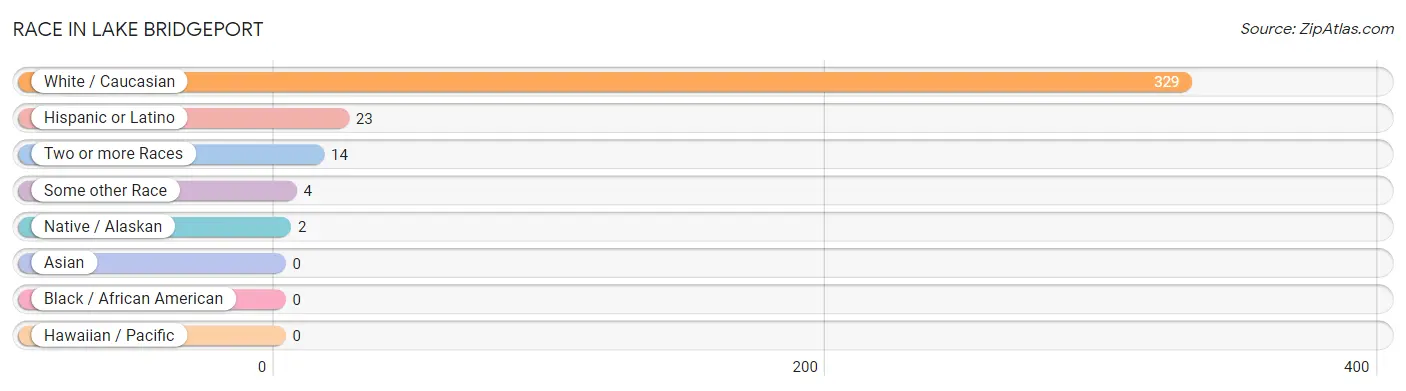
| Race | # Population | % Population |
| Asian | 0 | 0.0% |
| Black / African American | 0 | 0.0% |
| Hawaiian / Pacific | 0 | 0.0% |
| Hispanic or Latino | 23 | 6.6% |
| Native / Alaskan | 2 | 0.6% |
| White / Caucasian | 329 | 94.3% |
| Two or more Races | 14 | 4.0% |
| Some other Race | 4 | 1.1% |
| Total | 349 | 100.0% |
Ancestry in Lake Bridgeport
The most populous ancestries reported in Lake Bridgeport are American (33 | 9.5%), English (32 | 9.2%), Irish (26 | 7.4%), German (22 | 6.3%), and Italian (13 | 3.7%), together accounting for 36.1% of all Lake Bridgeport residents.
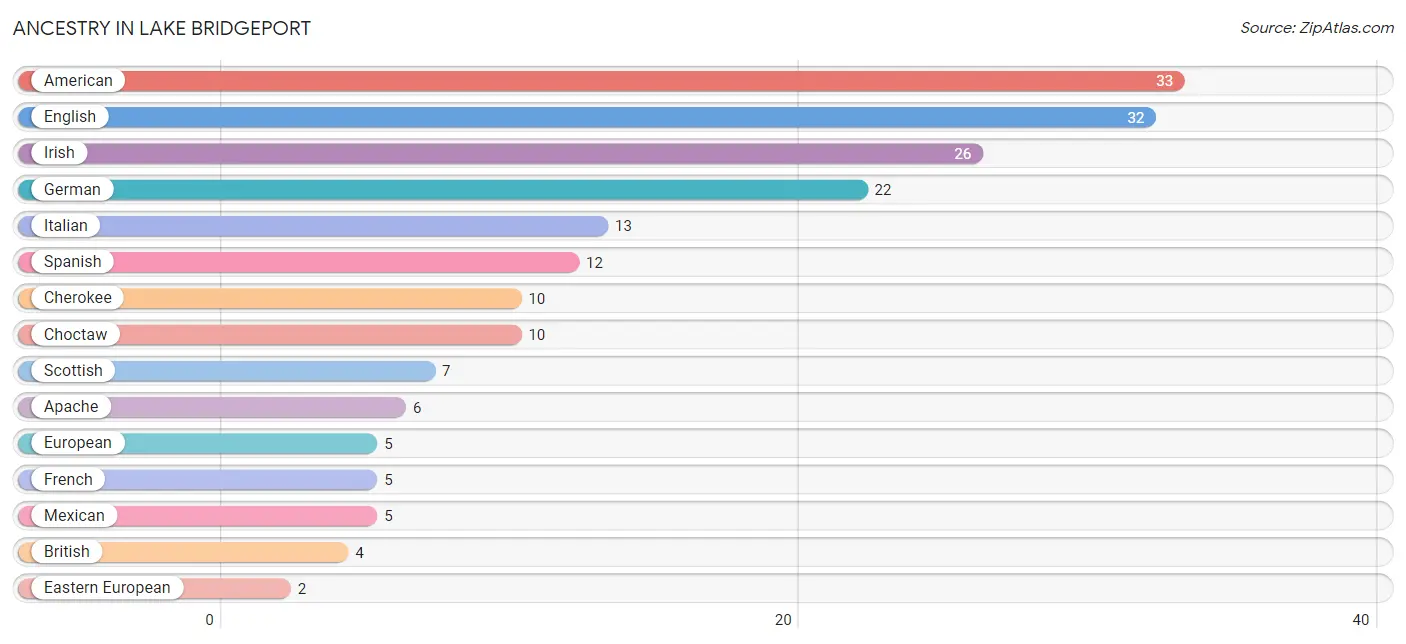
| Ancestry | # Population | % Population |
| American | 33 | 9.5% |
| Apache | 6 | 1.7% |
| British | 4 | 1.1% |
| Cherokee | 10 | 2.9% |
| Choctaw | 10 | 2.9% |
| Eastern European | 2 | 0.6% |
| English | 32 | 9.2% |
| European | 5 | 1.4% |
| French | 5 | 1.4% |
| German | 22 | 6.3% |
| Irish | 26 | 7.4% |
| Italian | 13 | 3.7% |
| Mexican | 5 | 1.4% |
| Polish | 2 | 0.6% |
| Scotch-Irish | 1 | 0.3% |
| Scottish | 7 | 2.0% |
| Spaniard | 1 | 0.3% |
| Spanish | 12 | 3.4% |
| Swedish | 2 | 0.6% |
| Welsh | 2 | 0.6% | View All 20 Rows |
Immigrants in Lake Bridgeport
The most numerous immigrant groups reported in Lake Bridgeport came from Canada (2 | 0.6%), Latin America (2 | 0.6%), Peru (2 | 0.6%), and South America (2 | 0.6%), together accounting for 2.3% of all Lake Bridgeport residents.
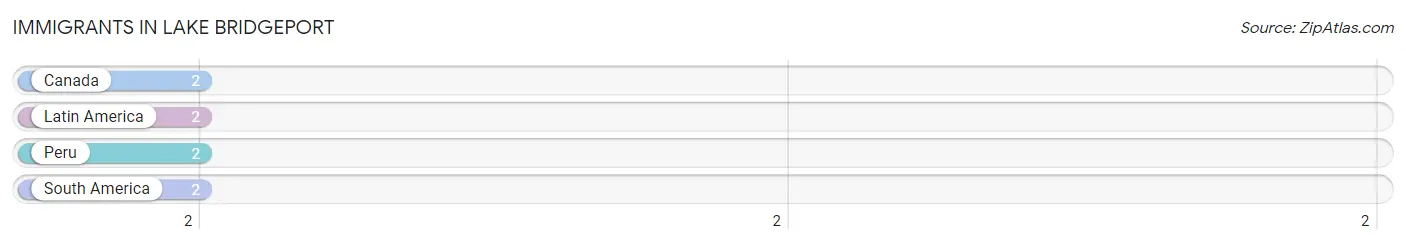
| Immigration Origin | # Population | % Population |
| Canada | 2 | 0.6% |
| Latin America | 2 | 0.6% |
| Peru | 2 | 0.6% |
| South America | 2 | 0.6% | View All 4 Rows |
Sex and Age in Lake Bridgeport
Sex and Age in Lake Bridgeport
The most populous age groups in Lake Bridgeport are 15 to 19 Years (28 | 16.4%) for men and 55 to 59 Years (25 | 14.0%) for women.
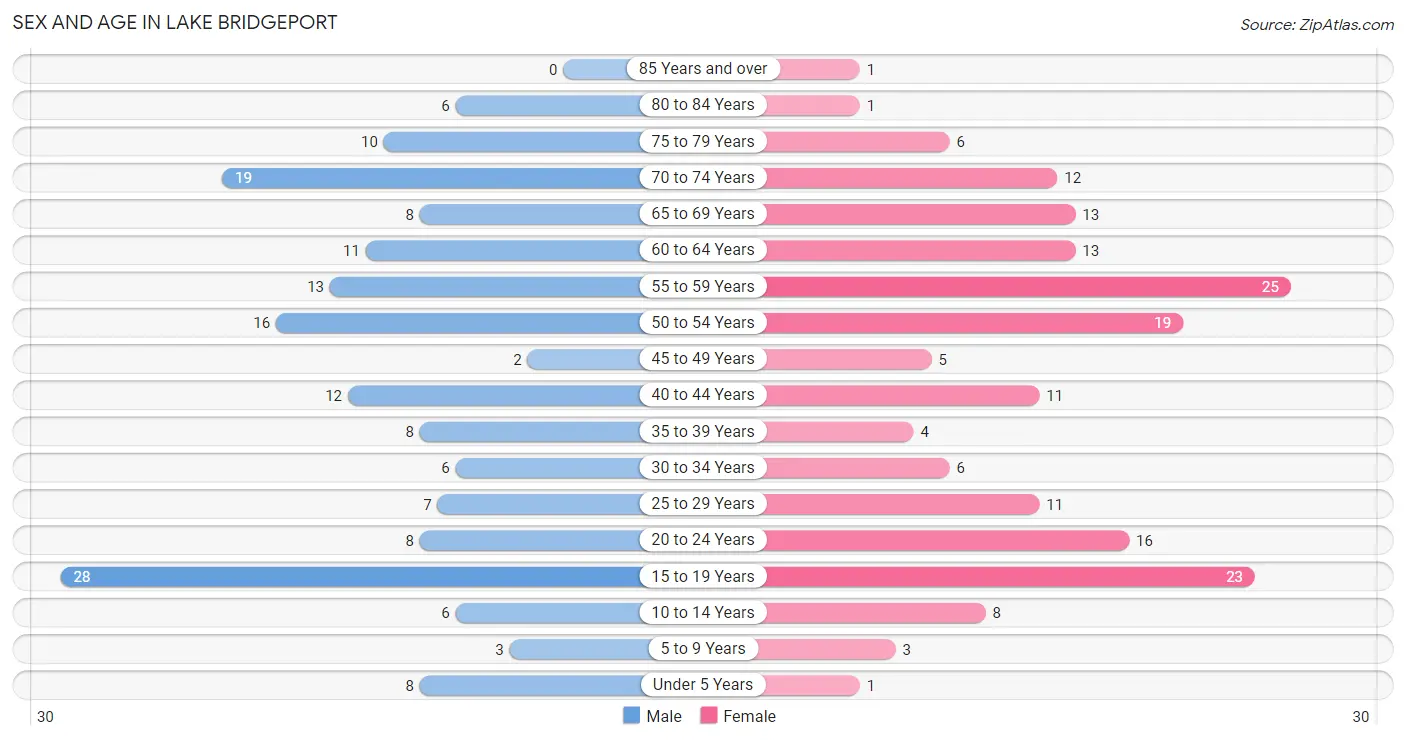
| Age Bracket | Male | Female |
| Under 5 Years | 8 (4.7%) | 1 (0.6%) |
| 5 to 9 Years | 3 (1.8%) | 3 (1.7%) |
| 10 to 14 Years | 6 (3.5%) | 8 (4.5%) |
| 15 to 19 Years | 28 (16.4%) | 23 (12.9%) |
| 20 to 24 Years | 8 (4.7%) | 16 (9.0%) |
| 25 to 29 Years | 7 (4.1%) | 11 (6.2%) |
| 30 to 34 Years | 6 (3.5%) | 6 (3.4%) |
| 35 to 39 Years | 8 (4.7%) | 4 (2.2%) |
| 40 to 44 Years | 12 (7.0%) | 11 (6.2%) |
| 45 to 49 Years | 2 (1.2%) | 5 (2.8%) |
| 50 to 54 Years | 16 (9.4%) | 19 (10.7%) |
| 55 to 59 Years | 13 (7.6%) | 25 (14.0%) |
| 60 to 64 Years | 11 (6.4%) | 13 (7.3%) |
| 65 to 69 Years | 8 (4.7%) | 13 (7.3%) |
| 70 to 74 Years | 19 (11.1%) | 12 (6.7%) |
| 75 to 79 Years | 10 (5.9%) | 6 (3.4%) |
| 80 to 84 Years | 6 (3.5%) | 1 (0.6%) |
| 85 Years and over | 0 (0.0%) | 1 (0.6%) |
| Total | 171 (100.0%) | 178 (100.0%) |
Families and Households in Lake Bridgeport
Median Family Size in Lake Bridgeport
The median family size in Lake Bridgeport is 2.72 persons per family, with married-couple families (73 | 70.9%) accounting for the largest median family size of 2.86 persons per family. On the other hand, single female/mother families (20 | 19.4%) represent the smallest median family size with 2.35 persons per family.
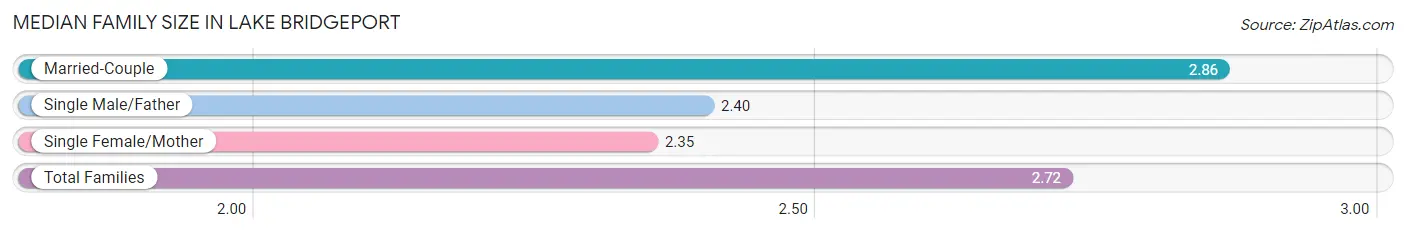
| Family Type | # Families | Family Size |
| Married-Couple | 73 (70.9%) | 2.86 |
| Single Male/Father | 10 (9.7%) | 2.40 |
| Single Female/Mother | 20 (19.4%) | 2.35 |
| Total Families | 103 (100.0%) | 2.72 |
Median Household Size in Lake Bridgeport
The median household size in Lake Bridgeport is 2.44 persons per household, with single male/father households (10 | 7.0%) accounting for the largest median household size of 3.2 persons per household. non-family households (40 | 28.0%) represent the smallest median household size with 1.25 persons per household.
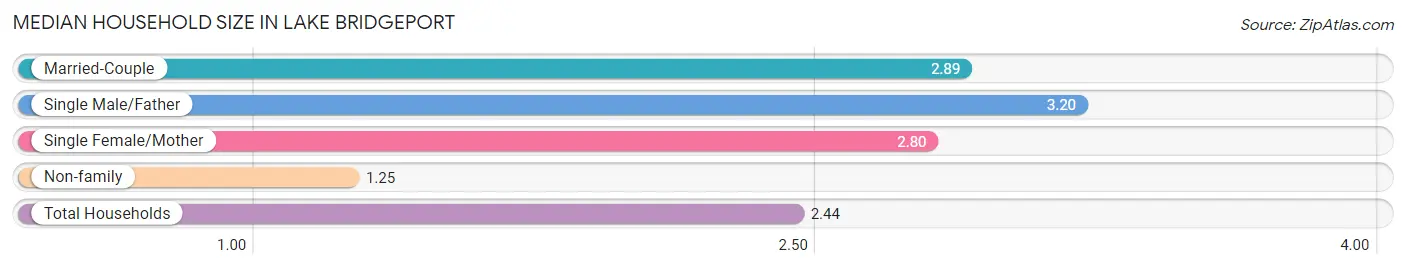
| Household Type | # Households | Household Size |
| Married-Couple | 73 (51.0%) | 2.89 |
| Single Male/Father | 10 (7.0%) | 3.20 |
| Single Female/Mother | 20 (14.0%) | 2.80 |
| Non-family | 40 (28.0%) | 1.25 |
| Total Households | 143 (100.0%) | 2.44 |
Household Size by Marriage Status in Lake Bridgeport
Out of a total of 143 households in Lake Bridgeport, 103 (72.0%) are family households, while 40 (28.0%) are nonfamily households. The most numerous type of family households are 2-person households, comprising 51, and the most common type of nonfamily households are 1-person households, comprising 30.
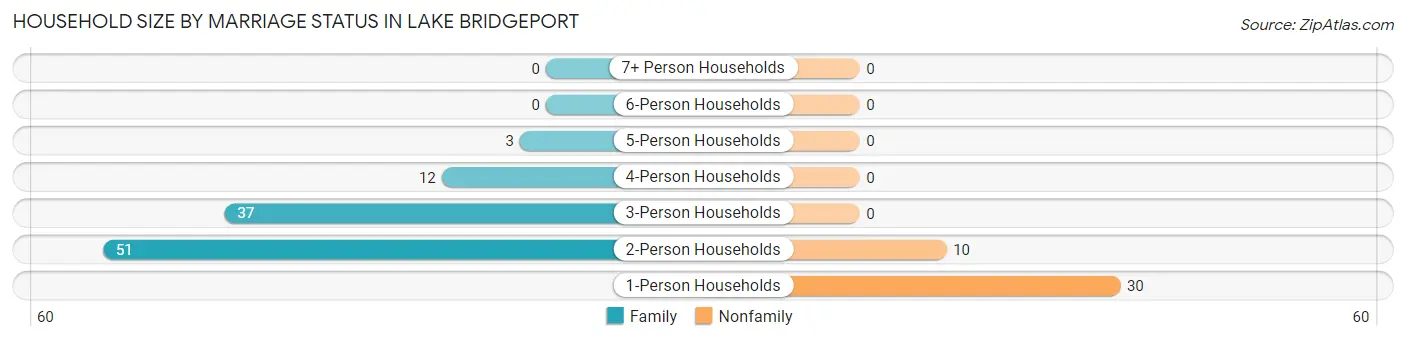
| Household Size | Family Households | Nonfamily Households |
| 1-Person Households | - | 30 (21.0%) |
| 2-Person Households | 51 (35.7%) | 10 (7.0%) |
| 3-Person Households | 37 (25.9%) | 0 (0.0%) |
| 4-Person Households | 12 (8.4%) | 0 (0.0%) |
| 5-Person Households | 3 (2.1%) | 0 (0.0%) |
| 6-Person Households | 0 (0.0%) | 0 (0.0%) |
| 7+ Person Households | 0 (0.0%) | 0 (0.0%) |
| Total | 103 (72.0%) | 40 (28.0%) |
Female Fertility in Lake Bridgeport
Fertility by Age in Lake Bridgeport
Average fertility rate in Lake Bridgeport is 13.0 births per 1,000 women. Women in the age bracket of 20 to 34 years have the highest fertility rate with 30.0 births per 1,000 women. Women in the age bracket of 20 to 34 years acount for 100.0% of all women with births.
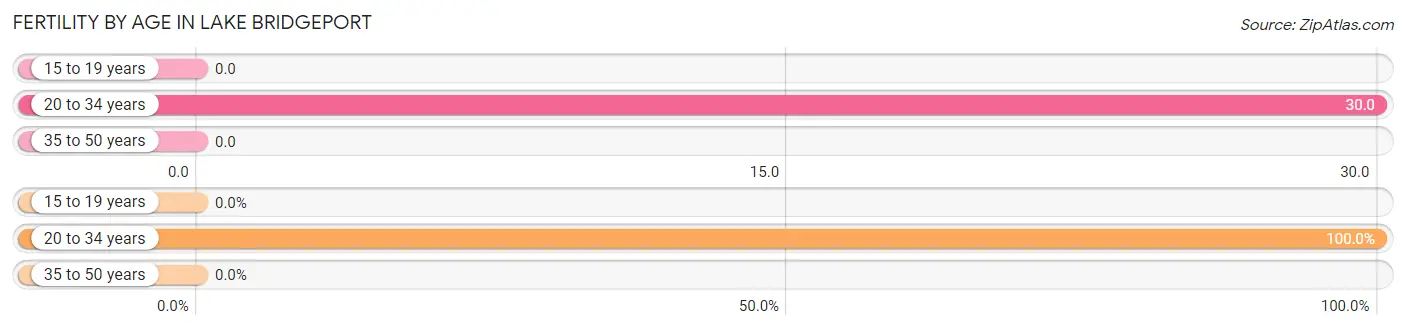
| Age Bracket | Women with Births | Births / 1,000 Women |
| 15 to 19 years | 0 (0.0%) | 0.0 |
| 20 to 34 years | 1 (100.0%) | 30.0 |
| 35 to 50 years | 0 (0.0%) | 0.0 |
| Total | 1 (100.0%) | 13.0 |
Fertility by Age by Marriage Status in Lake Bridgeport
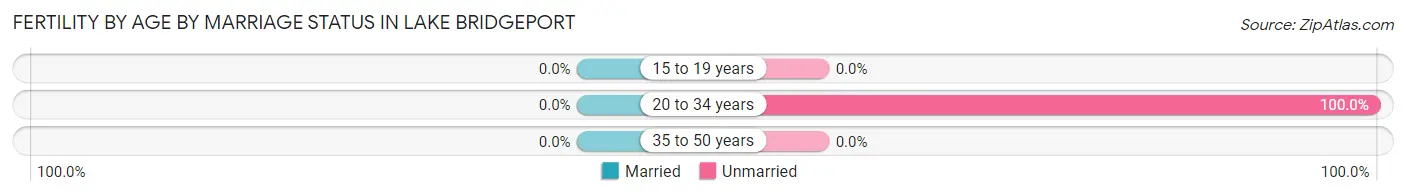
| Age Bracket | Married | Unmarried |
| 15 to 19 years | 0 (0.0%) | 0 (0.0%) |
| 20 to 34 years | 0 (0.0%) | 1 (100.0%) |
| 35 to 50 years | 0 (0.0%) | 0 (0.0%) |
| Total | 0 (0.0%) | 1 (100.0%) |
Fertility by Education in Lake Bridgeport
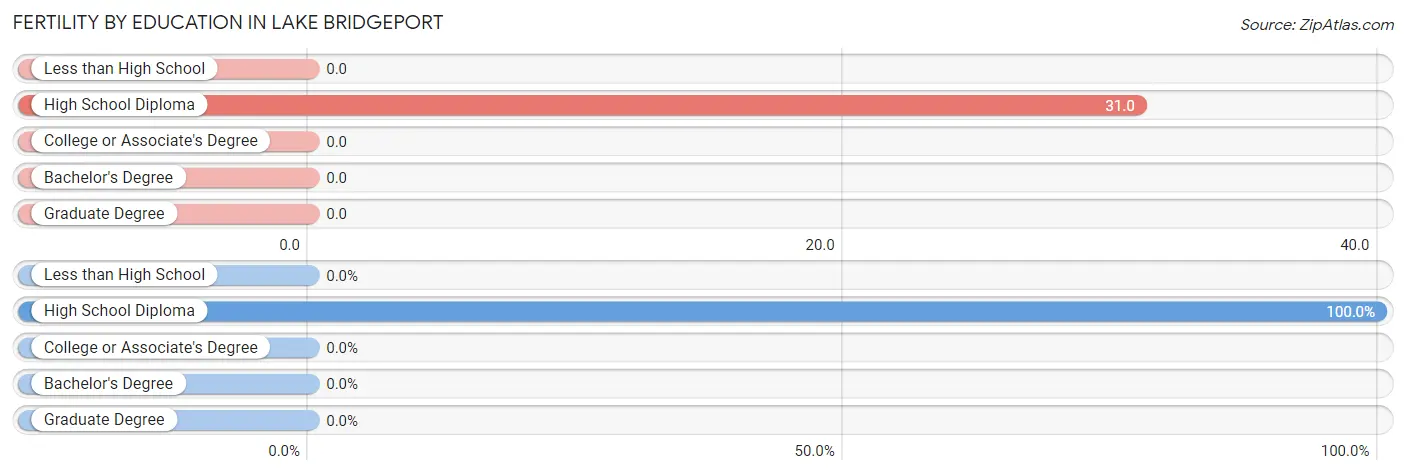
| Educational Attainment | Women with Births | Births / 1,000 Women |
| Less than High School | 0 (0.0%) | 0.0 |
| High School Diploma | 1 (100.0%) | 31.0 |
| College or Associate's Degree | 0 (0.0%) | 0.0 |
| Bachelor's Degree | 0 (0.0%) | 0.0 |
| Graduate Degree | 0 (0.0%) | 0.0 |
| Total | 1 (100.0%) | 13.0 |
Fertility by Education by Marriage Status in Lake Bridgeport
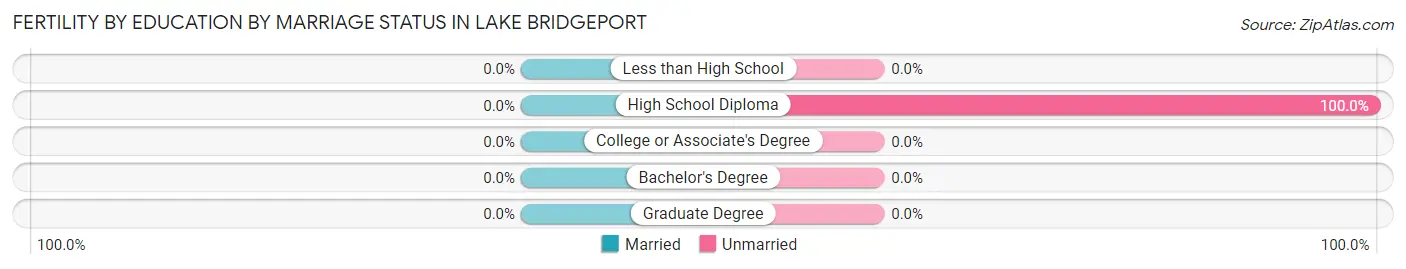
| Educational Attainment | Married | Unmarried |
| Less than High School | 0 (0.0%) | 0 (0.0%) |
| High School Diploma | 0 (0.0%) | 1 (100.0%) |
| College or Associate's Degree | 0 (0.0%) | 0 (0.0%) |
| Bachelor's Degree | 0 (0.0%) | 0 (0.0%) |
| Graduate Degree | 0 (0.0%) | 0 (0.0%) |
| Total | 0 (0.0%) | 1 (100.0%) |
Employment Characteristics in Lake Bridgeport
Employment by Class of Employer in Lake Bridgeport
Among the 189 employed individuals in Lake Bridgeport, private company employees (147 | 77.8%), not-for-profit organizations (14 | 7.4%), and local government employees (12 | 6.4%) make up the most common classes of employment.
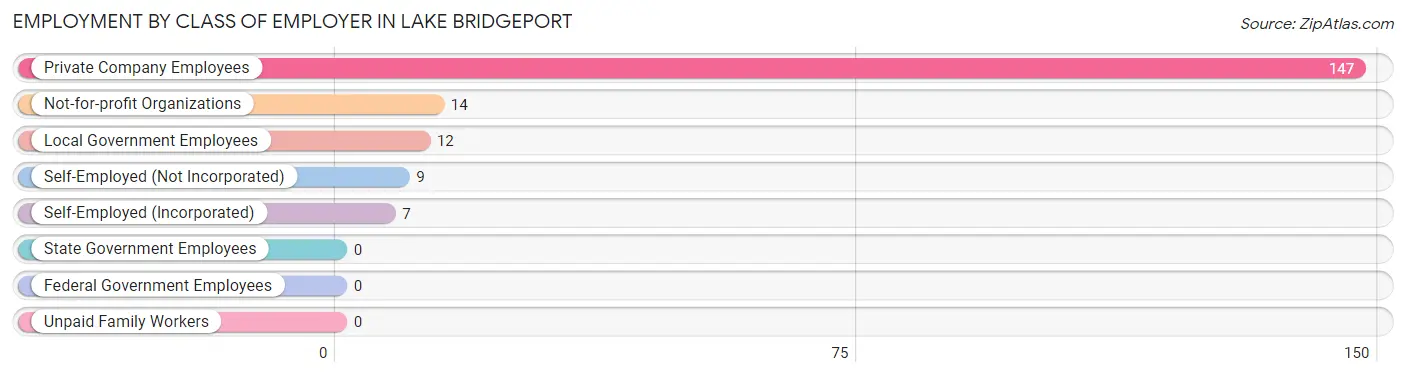
| Employer Class | # Employees | % Employees |
| Private Company Employees | 147 | 77.8% |
| Self-Employed (Incorporated) | 7 | 3.7% |
| Self-Employed (Not Incorporated) | 9 | 4.8% |
| Not-for-profit Organizations | 14 | 7.4% |
| Local Government Employees | 12 | 6.4% |
| State Government Employees | 0 | 0.0% |
| Federal Government Employees | 0 | 0.0% |
| Unpaid Family Workers | 0 | 0.0% |
| Total | 189 | 100.0% |
Employment Status by Age in Lake Bridgeport
According to the labor force statistics for Lake Bridgeport, out of the total population over 16 years of age (313), 61.0% or 191 individuals are in the labor force, with 1.0% or 2 of them unemployed. The age group with the highest labor force participation rate is 20 to 24 years, with 100.0% or 24 individuals in the labor force. Within the labor force, the 55 to 59 years age range has the highest percentage of unemployed individuals, with 6.1% or 2 of them being unemployed.
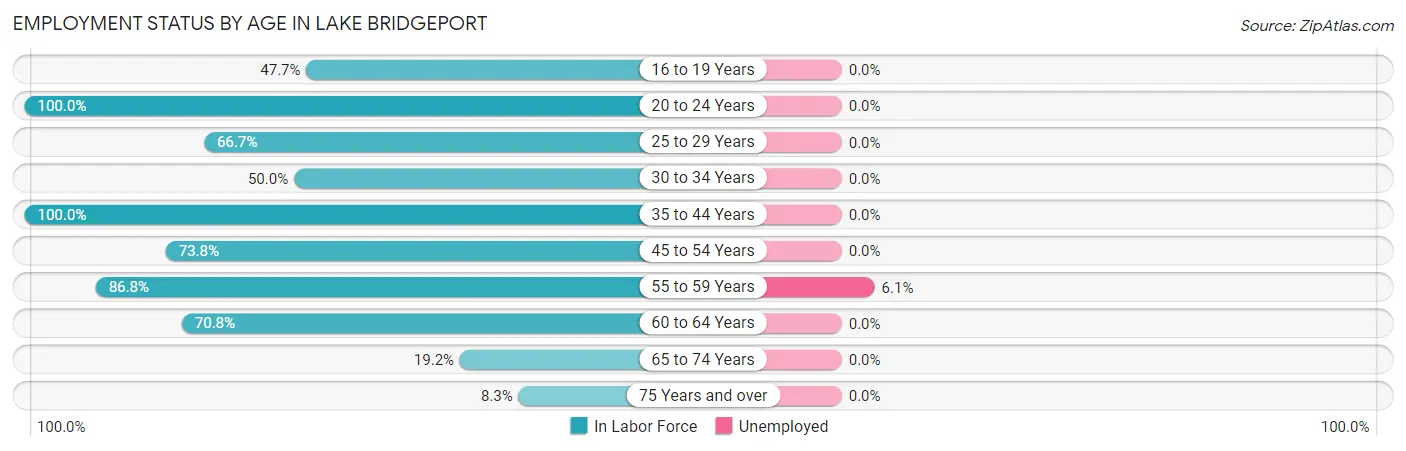
| Age Bracket | In Labor Force | Unemployed |
| 16 to 19 Years | 21 (47.7%) | 0 (0.0%) |
| 20 to 24 Years | 24 (100.0%) | 0 (0.0%) |
| 25 to 29 Years | 12 (66.7%) | 0 (0.0%) |
| 30 to 34 Years | 6 (50.0%) | 0 (0.0%) |
| 35 to 44 Years | 35 (100.0%) | 0 (0.0%) |
| 45 to 54 Years | 31 (73.8%) | 0 (0.0%) |
| 55 to 59 Years | 33 (86.8%) | 2 (6.1%) |
| 60 to 64 Years | 17 (70.8%) | 0 (0.0%) |
| 65 to 74 Years | 10 (19.2%) | 0 (0.0%) |
| 75 Years and over | 2 (8.3%) | 0 (0.0%) |
| Total | 191 (61.0%) | 2 (1.0%) |
Employment Status by Educational Attainment in Lake Bridgeport
According to labor force statistics for Lake Bridgeport, 79.3% of individuals (134) out of the total population between 25 and 64 years of age (169) are in the labor force, with 1.5% or 2 of them being unemployed. The group with the highest labor force participation rate are those with the educational attainment of bachelor's degree or higher, with 100.0% or 40 individuals in the labor force. Within the labor force, individuals with college / associate degree education have the highest percentage of unemployment, with 4.7% or 2 of them being unemployed.
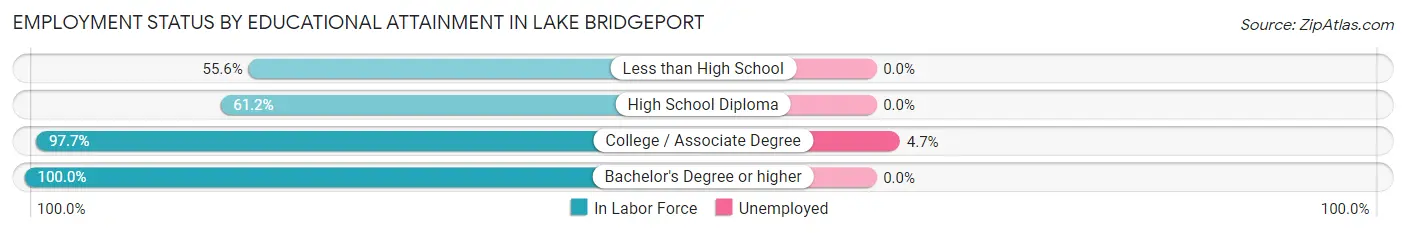
| Educational Attainment | In Labor Force | Unemployed |
| Less than High School | 10 (55.6%) | 0 (0.0%) |
| High School Diploma | 41 (61.2%) | 0 (0.0%) |
| College / Associate Degree | 43 (97.7%) | 2 (4.7%) |
| Bachelor's Degree or higher | 40 (100.0%) | 0 (0.0%) |
| Total | 134 (79.3%) | 3 (1.5%) |
Employment Occupations by Sex in Lake Bridgeport
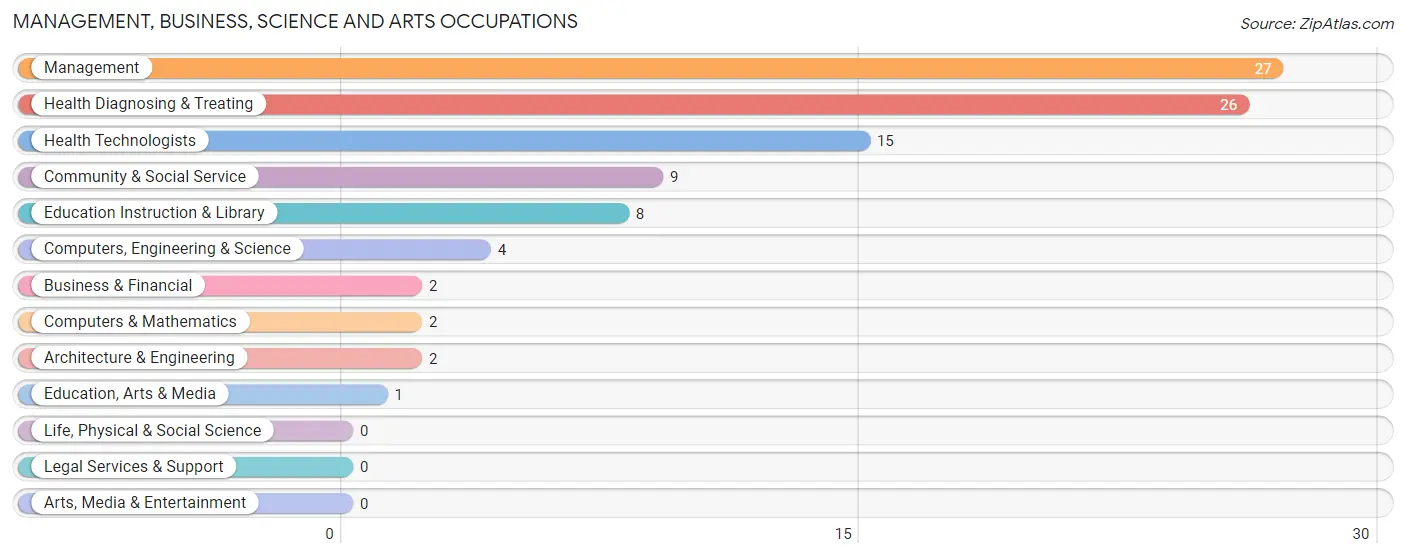
Management, Business, Science and Arts Occupations
The most common Management, Business, Science and Arts occupations in Lake Bridgeport are Management (27 | 14.3%), Health Diagnosing & Treating (26 | 13.8%), Health Technologists (15 | 7.9%), Community & Social Service (9 | 4.8%), and Education Instruction & Library (8 | 4.2%).
Management, Business, Science and Arts Occupations by Sex
Within the Management, Business, Science and Arts occupations in Lake Bridgeport, the most male-oriented occupations are Architecture & Engineering (100.0%), Management (74.1%), and Health Technologists (53.3%), while the most female-oriented occupations are Business & Financial (100.0%), Computers & Mathematics (100.0%), and Community & Social Service (100.0%).
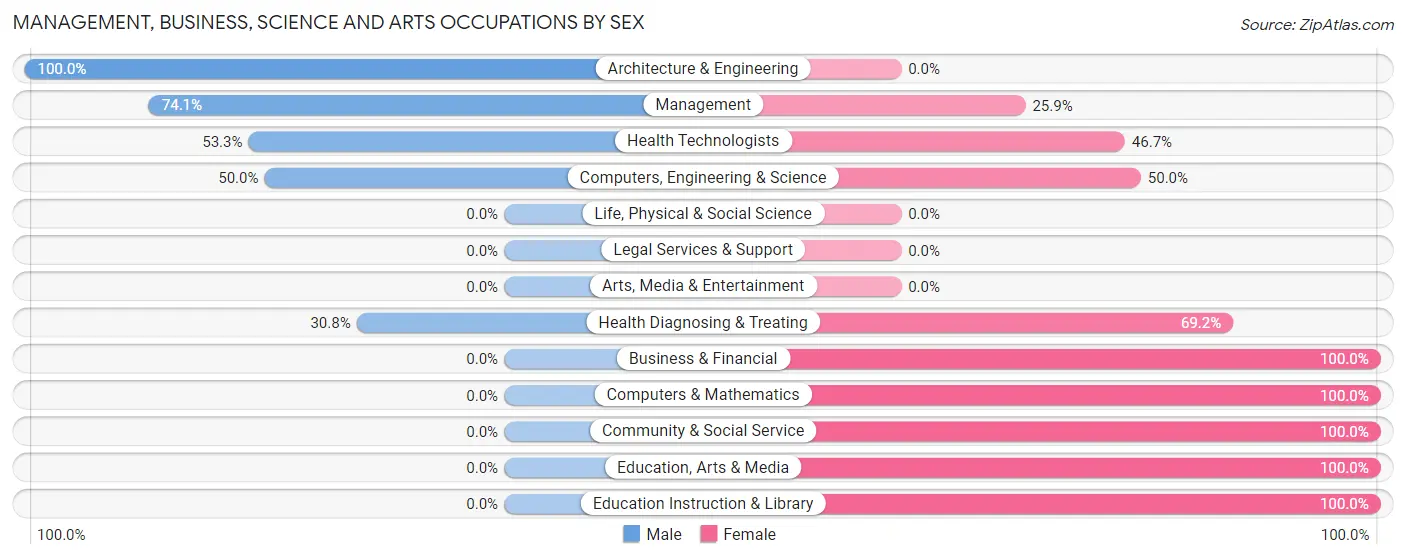
| Occupation | Male | Female |
| Management | 20 (74.1%) | 7 (25.9%) |
| Business & Financial | 0 (0.0%) | 2 (100.0%) |
| Computers, Engineering & Science | 2 (50.0%) | 2 (50.0%) |
| Computers & Mathematics | 0 (0.0%) | 2 (100.0%) |
| Architecture & Engineering | 2 (100.0%) | 0 (0.0%) |
| Life, Physical & Social Science | 0 (0.0%) | 0 (0.0%) |
| Community & Social Service | 0 (0.0%) | 9 (100.0%) |
| Education, Arts & Media | 0 (0.0%) | 1 (100.0%) |
| Legal Services & Support | 0 (0.0%) | 0 (0.0%) |
| Education Instruction & Library | 0 (0.0%) | 8 (100.0%) |
| Arts, Media & Entertainment | 0 (0.0%) | 0 (0.0%) |
| Health Diagnosing & Treating | 8 (30.8%) | 18 (69.2%) |
| Health Technologists | 8 (53.3%) | 7 (46.7%) |
| Total (Category) | 30 (44.1%) | 38 (55.9%) |
| Total (Overall) | 98 (51.8%) | 91 (48.1%) |
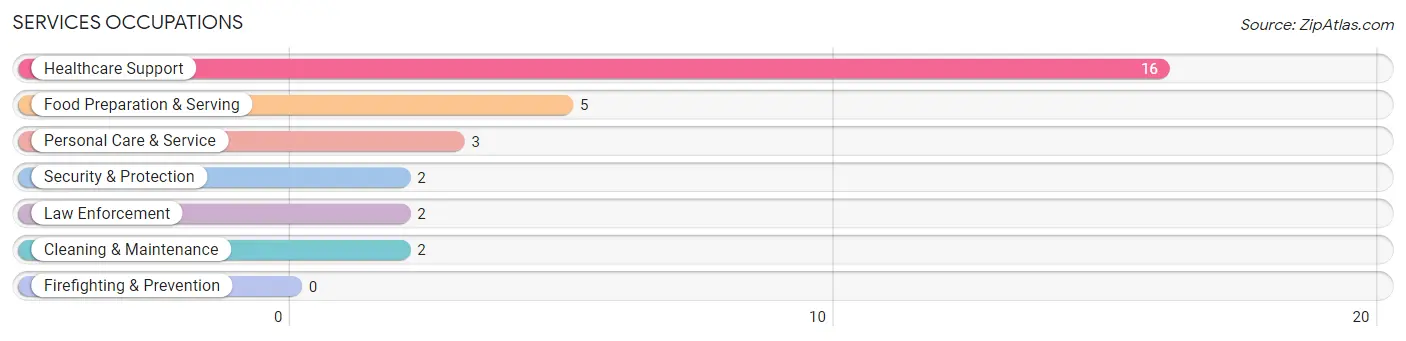
Services Occupations
The most common Services occupations in Lake Bridgeport are Healthcare Support (16 | 8.5%), Food Preparation & Serving (5 | 2.6%), Personal Care & Service (3 | 1.6%), Security & Protection (2 | 1.1%), and Law Enforcement (2 | 1.1%).
Services Occupations by Sex
Within the Services occupations in Lake Bridgeport, the most male-oriented occupations are Security & Protection (100.0%), Law Enforcement (100.0%), and Cleaning & Maintenance (100.0%), while the most female-oriented occupations are Healthcare Support (100.0%), Food Preparation & Serving (100.0%), and Personal Care & Service (100.0%).
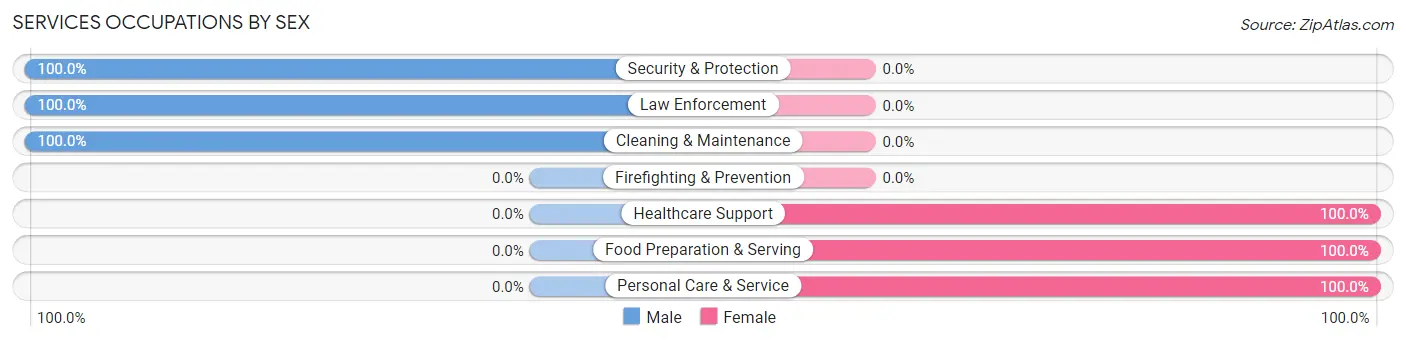
| Occupation | Male | Female |
| Healthcare Support | 0 (0.0%) | 16 (100.0%) |
| Security & Protection | 2 (100.0%) | 0 (0.0%) |
| Firefighting & Prevention | 0 (0.0%) | 0 (0.0%) |
| Law Enforcement | 2 (100.0%) | 0 (0.0%) |
| Food Preparation & Serving | 0 (0.0%) | 5 (100.0%) |
| Cleaning & Maintenance | 2 (100.0%) | 0 (0.0%) |
| Personal Care & Service | 0 (0.0%) | 3 (100.0%) |
| Total (Category) | 4 (14.3%) | 24 (85.7%) |
| Total (Overall) | 98 (51.8%) | 91 (48.1%) |
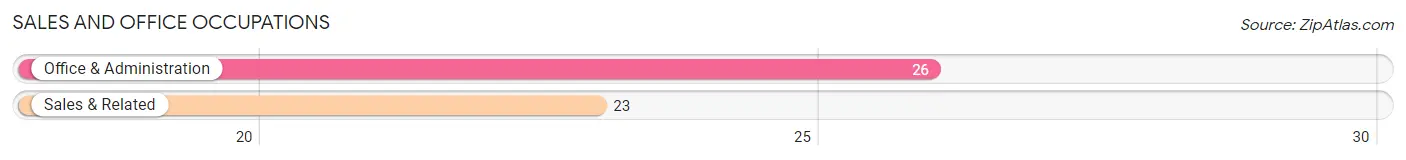
Sales and Office Occupations
The most common Sales and Office occupations in Lake Bridgeport are Office & Administration (26 | 13.8%), and Sales & Related (23 | 12.2%).
Sales and Office Occupations by Sex
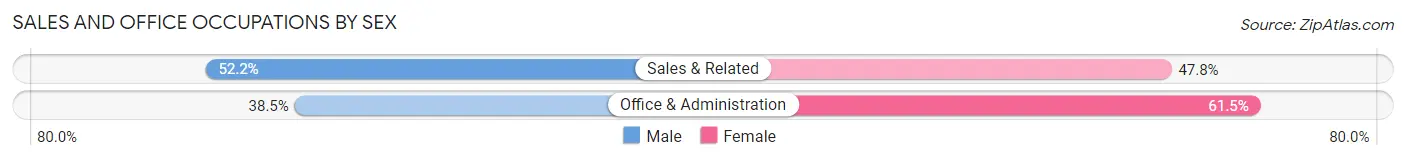
| Occupation | Male | Female |
| Sales & Related | 12 (52.2%) | 11 (47.8%) |
| Office & Administration | 10 (38.5%) | 16 (61.5%) |
| Total (Category) | 22 (44.9%) | 27 (55.1%) |
| Total (Overall) | 98 (51.8%) | 91 (48.1%) |
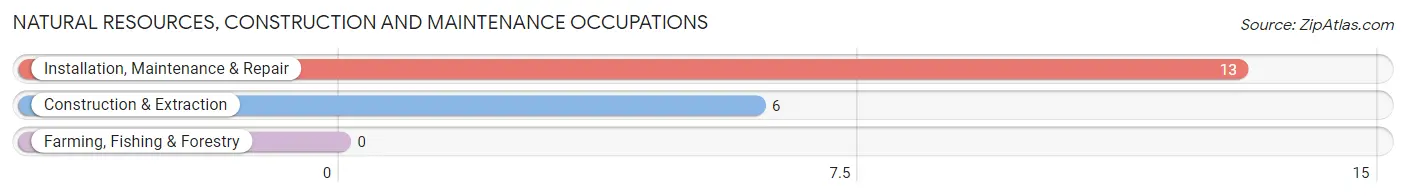
Natural Resources, Construction and Maintenance Occupations
The most common Natural Resources, Construction and Maintenance occupations in Lake Bridgeport are Installation, Maintenance & Repair (13 | 6.9%), and Construction & Extraction (6 | 3.2%).
Natural Resources, Construction and Maintenance Occupations by Sex
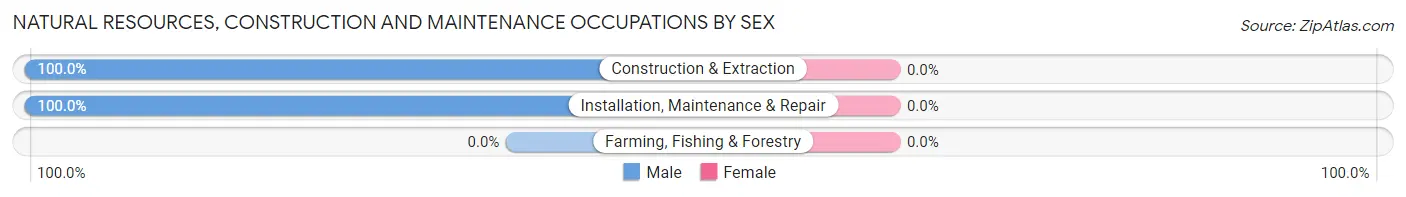
| Occupation | Male | Female |
| Farming, Fishing & Forestry | 0 (0.0%) | 0 (0.0%) |
| Construction & Extraction | 6 (100.0%) | 0 (0.0%) |
| Installation, Maintenance & Repair | 13 (100.0%) | 0 (0.0%) |
| Total (Category) | 19 (100.0%) | 0 (0.0%) |
| Total (Overall) | 98 (51.8%) | 91 (48.1%) |
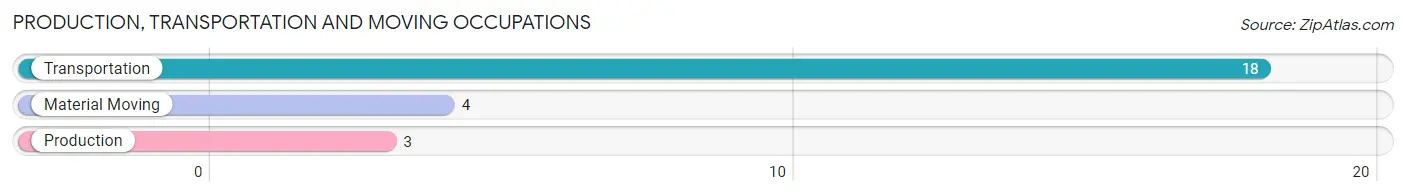
Production, Transportation and Moving Occupations
The most common Production, Transportation and Moving occupations in Lake Bridgeport are Transportation (18 | 9.5%), Material Moving (4 | 2.1%), and Production (3 | 1.6%).
Production, Transportation and Moving Occupations by Sex
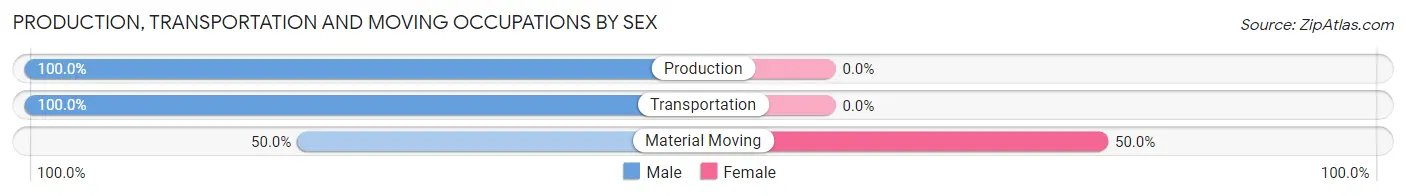
| Occupation | Male | Female |
| Production | 3 (100.0%) | 0 (0.0%) |
| Transportation | 18 (100.0%) | 0 (0.0%) |
| Material Moving | 2 (50.0%) | 2 (50.0%) |
| Total (Category) | 23 (92.0%) | 2 (8.0%) |
| Total (Overall) | 98 (51.8%) | 91 (48.1%) |
Employment Industries by Sex in Lake Bridgeport
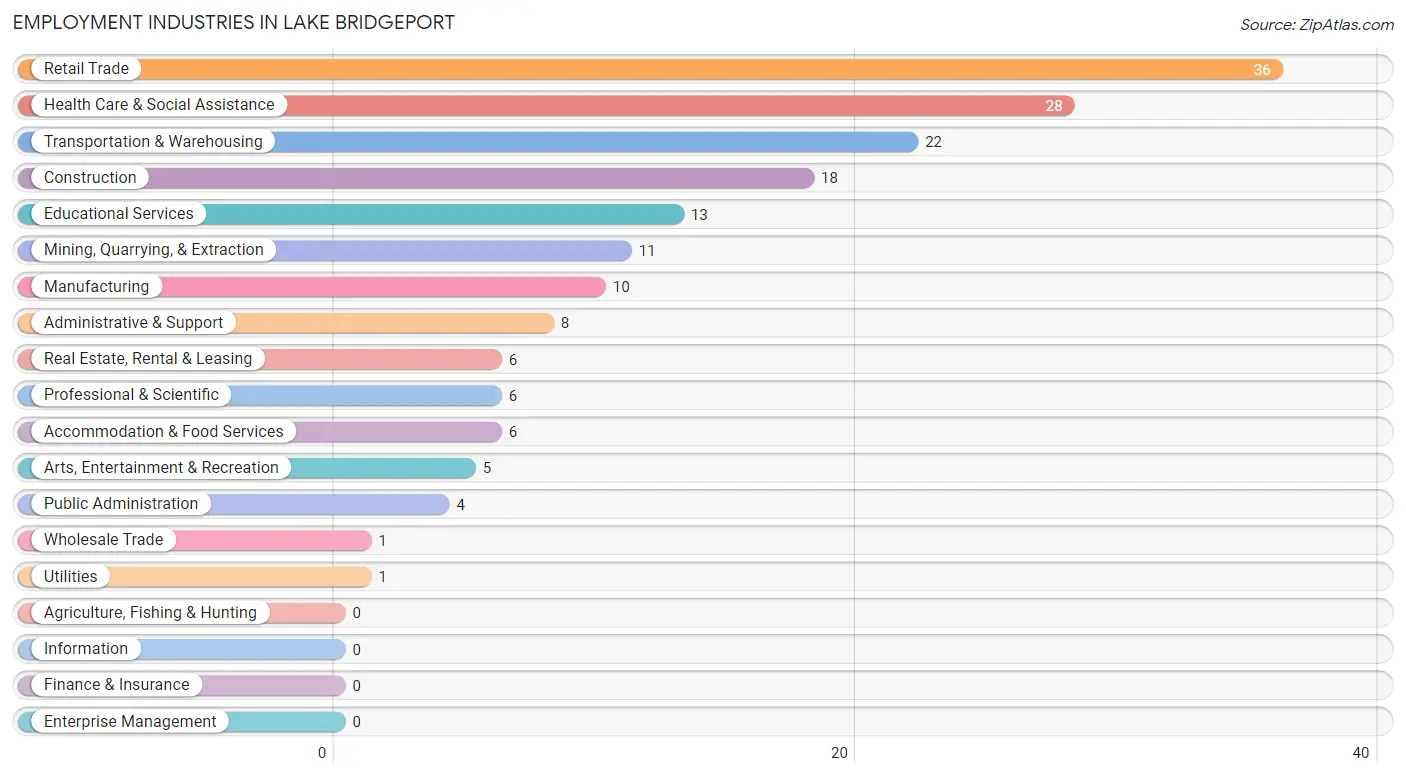
Employment Industries in Lake Bridgeport
The major employment industries in Lake Bridgeport include Retail Trade (36 | 19.1%), Health Care & Social Assistance (28 | 14.8%), Transportation & Warehousing (22 | 11.6%), Construction (18 | 9.5%), and Educational Services (13 | 6.9%).
Employment Industries by Sex in Lake Bridgeport
The Lake Bridgeport industries that see more men than women are Wholesale Trade (100.0%), Transportation & Warehousing (100.0%), and Utilities (100.0%), whereas the industries that tend to have a higher number of women are Educational Services (100.0%), Real Estate, Rental & Leasing (83.3%), and Administrative & Support (75.0%).
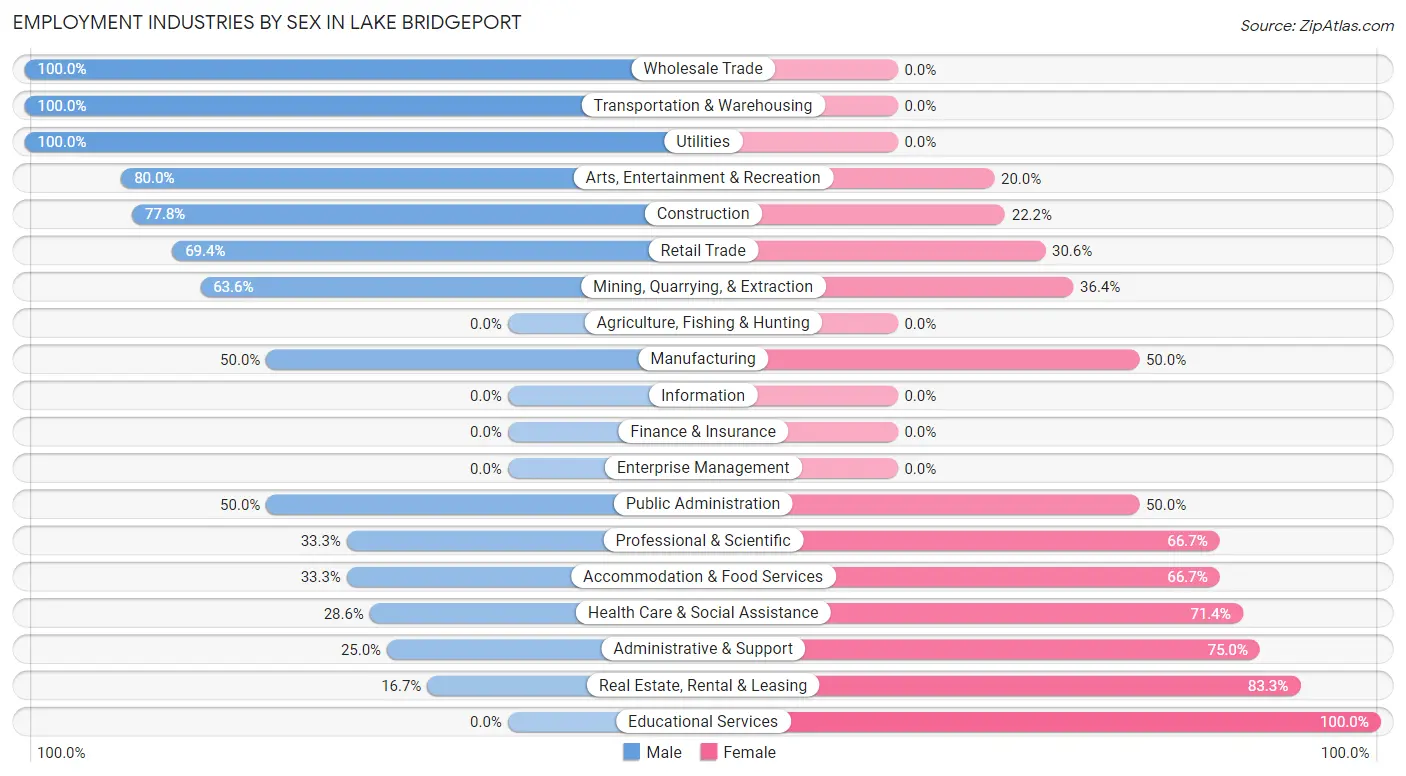
| Industry | Male | Female |
| Agriculture, Fishing & Hunting | 0 (0.0%) | 0 (0.0%) |
| Mining, Quarrying, & Extraction | 7 (63.6%) | 4 (36.4%) |
| Construction | 14 (77.8%) | 4 (22.2%) |
| Manufacturing | 5 (50.0%) | 5 (50.0%) |
| Wholesale Trade | 1 (100.0%) | 0 (0.0%) |
| Retail Trade | 25 (69.4%) | 11 (30.6%) |
| Transportation & Warehousing | 22 (100.0%) | 0 (0.0%) |
| Utilities | 1 (100.0%) | 0 (0.0%) |
| Information | 0 (0.0%) | 0 (0.0%) |
| Finance & Insurance | 0 (0.0%) | 0 (0.0%) |
| Real Estate, Rental & Leasing | 1 (16.7%) | 5 (83.3%) |
| Professional & Scientific | 2 (33.3%) | 4 (66.7%) |
| Enterprise Management | 0 (0.0%) | 0 (0.0%) |
| Administrative & Support | 2 (25.0%) | 6 (75.0%) |
| Educational Services | 0 (0.0%) | 13 (100.0%) |
| Health Care & Social Assistance | 8 (28.6%) | 20 (71.4%) |
| Arts, Entertainment & Recreation | 4 (80.0%) | 1 (20.0%) |
| Accommodation & Food Services | 2 (33.3%) | 4 (66.7%) |
| Public Administration | 2 (50.0%) | 2 (50.0%) |
| Total | 98 (51.8%) | 91 (48.1%) |
Education in Lake Bridgeport
School Enrollment in Lake Bridgeport
The most common levels of schooling among the 52 students in Lake Bridgeport are middle school (17 | 32.7%), high school (14 | 26.9%), and college / undergraduate (10 | 19.2%).
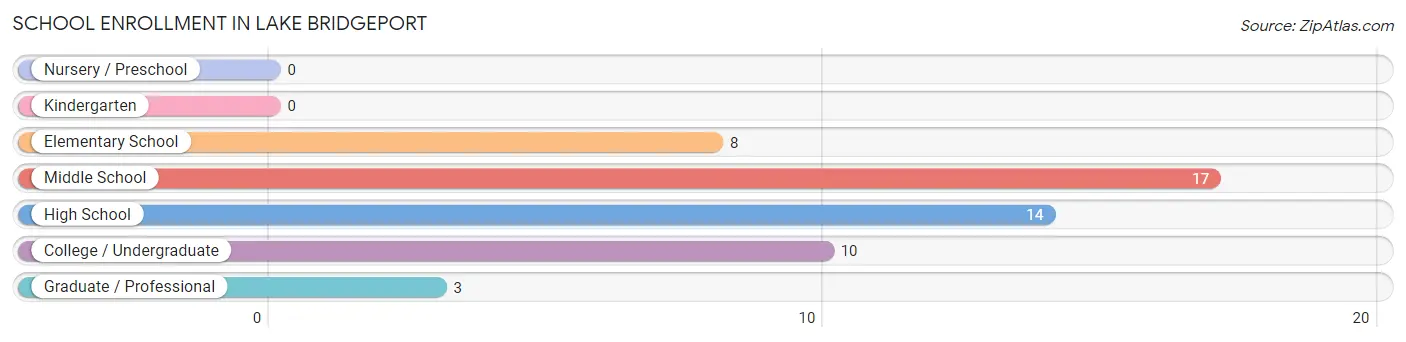
| School Level | # Students | % Students |
| Nursery / Preschool | 0 | 0.0% |
| Kindergarten | 0 | 0.0% |
| Elementary School | 8 | 15.4% |
| Middle School | 17 | 32.7% |
| High School | 14 | 26.9% |
| College / Undergraduate | 10 | 19.2% |
| Graduate / Professional | 3 | 5.8% |
| Total | 52 | 100.0% |
School Enrollment by Age by Funding Source in Lake Bridgeport
Out of a total of 52 students who are enrolled in schools in Lake Bridgeport, 14 (26.9%) attend a private institution, while the remaining 38 (73.1%) are enrolled in public schools. The age group of 15 to 17 year olds has the highest likelihood of being enrolled in private schools, with 11 (64.7% in the age bracket) enrolled. Conversely, the age group of 5 to 9 year old has the lowest likelihood of being enrolled in a private school, with 6 (100.0% in the age bracket) attending a public institution.
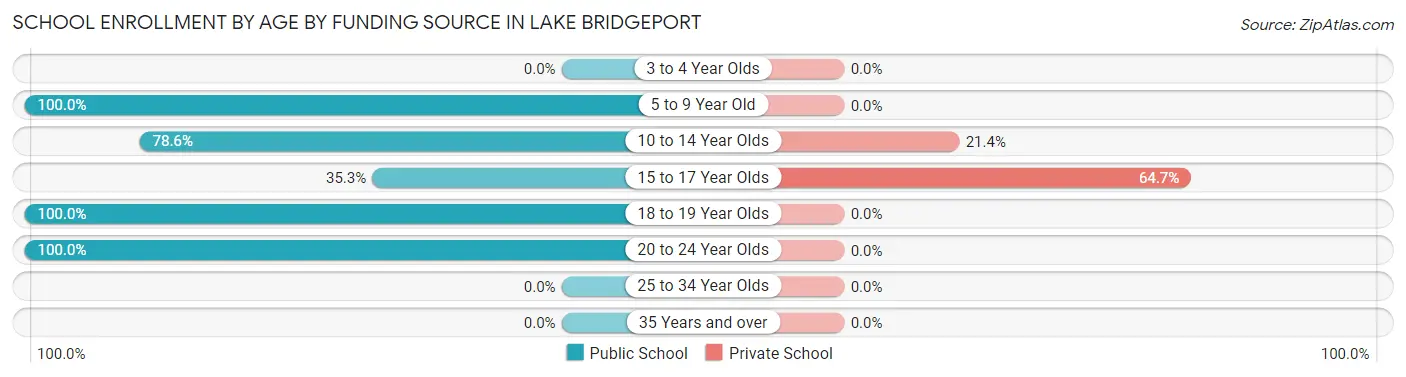
| Age Bracket | Public School | Private School |
| 3 to 4 Year Olds | 0 (0.0%) | 0 (0.0%) |
| 5 to 9 Year Old | 6 (100.0%) | 0 (0.0%) |
| 10 to 14 Year Olds | 11 (78.6%) | 3 (21.4%) |
| 15 to 17 Year Olds | 6 (35.3%) | 11 (64.7%) |
| 18 to 19 Year Olds | 12 (100.0%) | 0 (0.0%) |
| 20 to 24 Year Olds | 3 (100.0%) | 0 (0.0%) |
| 25 to 34 Year Olds | 0 (0.0%) | 0 (0.0%) |
| 35 Years and over | 0 (0.0%) | 0 (0.0%) |
| Total | 38 (73.1%) | 14 (26.9%) |
Educational Attainment by Field of Study in Lake Bridgeport
Bio, nature & agricultural (8 | 16.3%), business (7 | 14.3%), education (7 | 14.3%), arts & humanities (7 | 14.3%), and science & technology (4 | 8.2%) are the most common fields of study among 49 individuals in Lake Bridgeport who have obtained a bachelor's degree or higher.
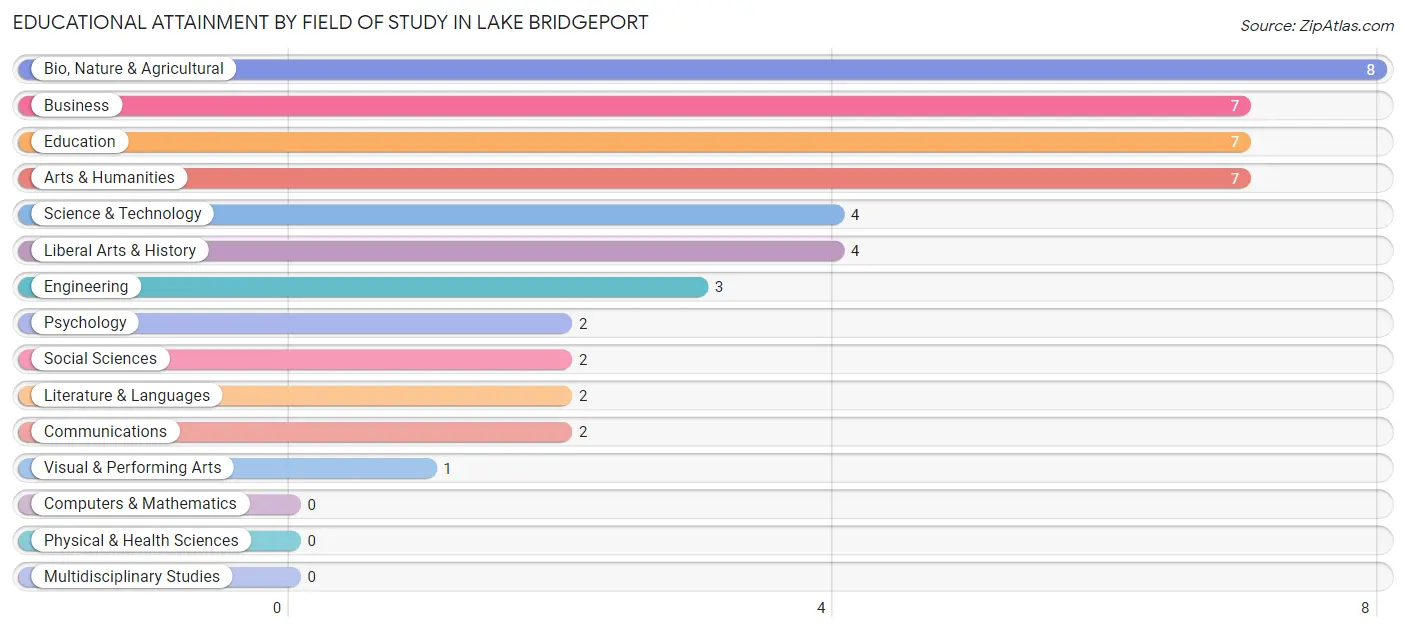
| Field of Study | # Graduates | % Graduates |
| Computers & Mathematics | 0 | 0.0% |
| Bio, Nature & Agricultural | 8 | 16.3% |
| Physical & Health Sciences | 0 | 0.0% |
| Psychology | 2 | 4.1% |
| Social Sciences | 2 | 4.1% |
| Engineering | 3 | 6.1% |
| Multidisciplinary Studies | 0 | 0.0% |
| Science & Technology | 4 | 8.2% |
| Business | 7 | 14.3% |
| Education | 7 | 14.3% |
| Literature & Languages | 2 | 4.1% |
| Liberal Arts & History | 4 | 8.2% |
| Visual & Performing Arts | 1 | 2.0% |
| Communications | 2 | 4.1% |
| Arts & Humanities | 7 | 14.3% |
| Total | 49 | 100.0% |
Transportation & Commute in Lake Bridgeport
Vehicle Availability by Sex in Lake Bridgeport
The most prevalent vehicle ownership categories in Lake Bridgeport are males with 2 vehicles (41, accounting for 41.8%) and females with 2 vehicles (38, making up 45.1%).
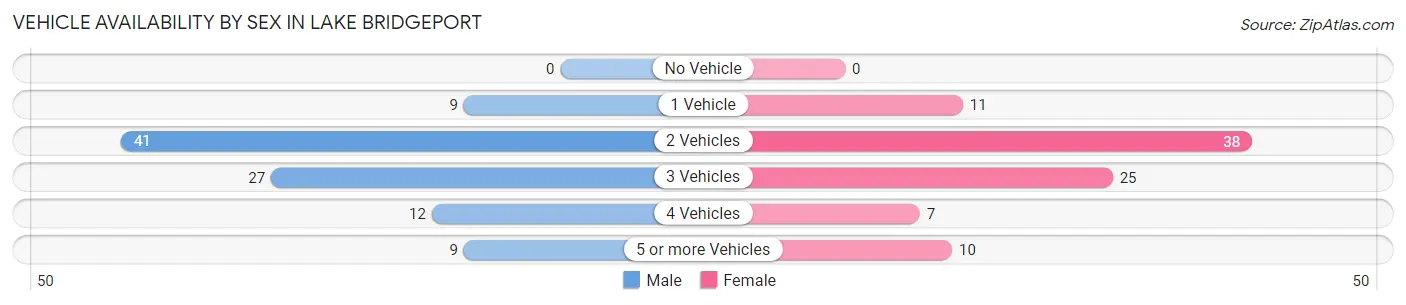
| Vehicles Available | Male | Female |
| No Vehicle | 0 (0.0%) | 0 (0.0%) |
| 1 Vehicle | 9 (9.2%) | 11 (12.1%) |
| 2 Vehicles | 41 (41.8%) | 38 (41.8%) |
| 3 Vehicles | 27 (27.6%) | 25 (27.5%) |
| 4 Vehicles | 12 (12.2%) | 7 (7.7%) |
| 5 or more Vehicles | 9 (9.2%) | 10 (11.0%) |
| Total | 98 (100.0%) | 91 (100.0%) |
Commute Time in Lake Bridgeport
The most frequently occuring commute durations in Lake Bridgeport are 60 to 89 minutes (34 commuters, 19.1%), 10 to 14 minutes (31 commuters, 17.4%), and 15 to 19 minutes (28 commuters, 15.7%).
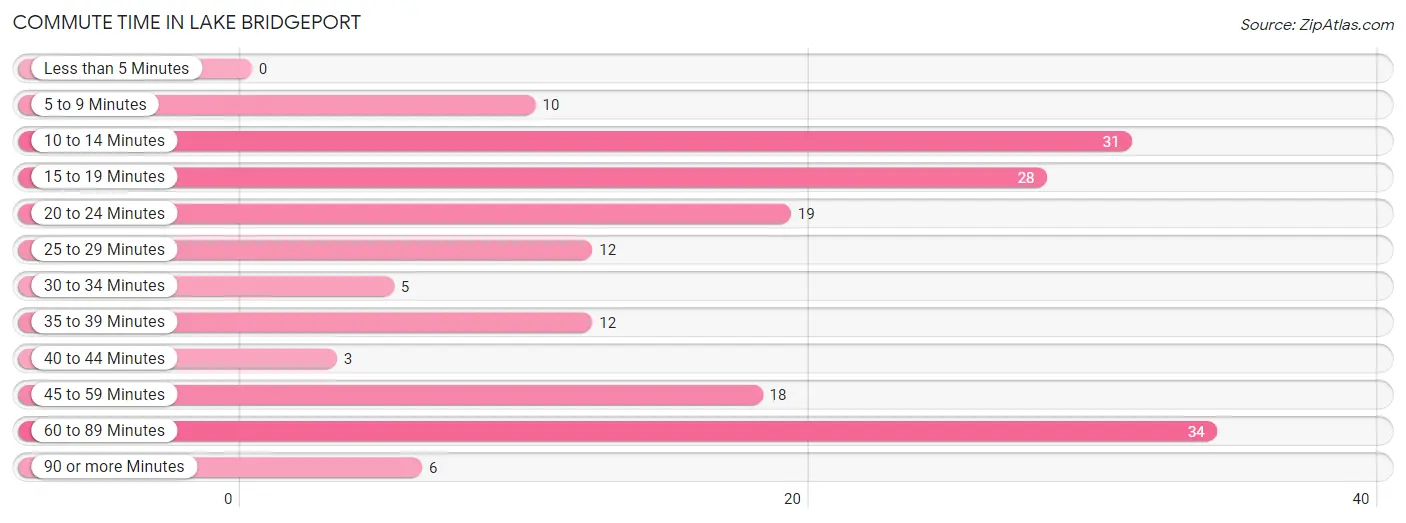
| Commute Time | # Commuters | % Commuters |
| Less than 5 Minutes | 0 | 0.0% |
| 5 to 9 Minutes | 10 | 5.6% |
| 10 to 14 Minutes | 31 | 17.4% |
| 15 to 19 Minutes | 28 | 15.7% |
| 20 to 24 Minutes | 19 | 10.7% |
| 25 to 29 Minutes | 12 | 6.7% |
| 30 to 34 Minutes | 5 | 2.8% |
| 35 to 39 Minutes | 12 | 6.7% |
| 40 to 44 Minutes | 3 | 1.7% |
| 45 to 59 Minutes | 18 | 10.1% |
| 60 to 89 Minutes | 34 | 19.1% |
| 90 or more Minutes | 6 | 3.4% |
Commute Time by Sex in Lake Bridgeport
The most common commute times in Lake Bridgeport are 15 to 19 minutes (26 commuters, 27.1%) for males and 60 to 89 minutes (23 commuters, 28.1%) for females.
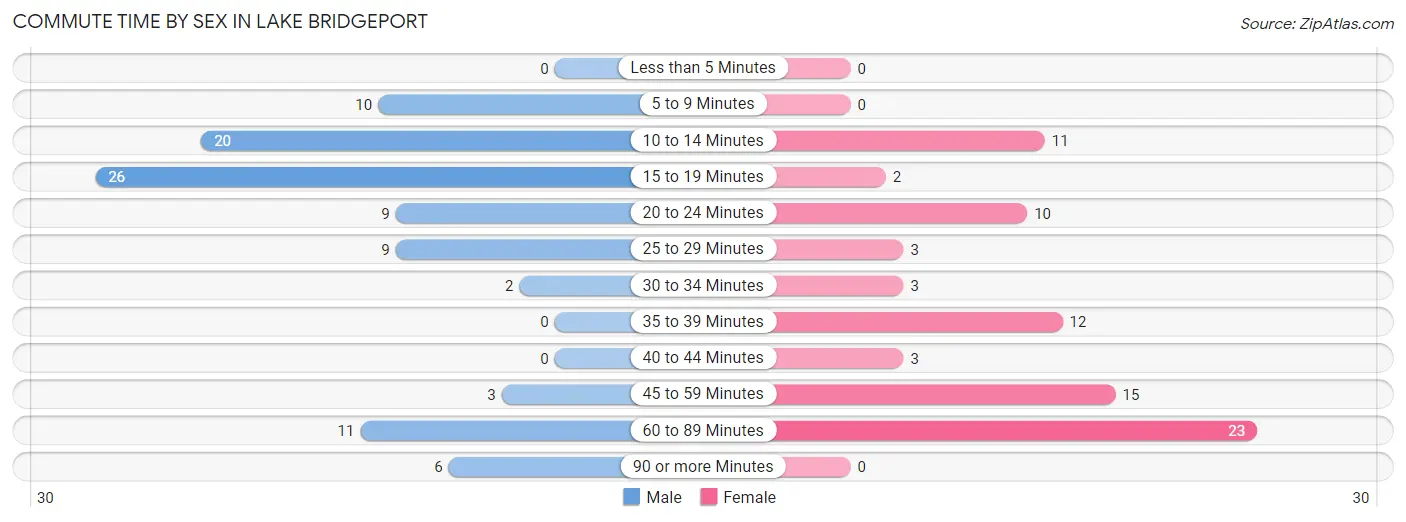
| Commute Time | Male | Female |
| Less than 5 Minutes | 0 (0.0%) | 0 (0.0%) |
| 5 to 9 Minutes | 10 (10.4%) | 0 (0.0%) |
| 10 to 14 Minutes | 20 (20.8%) | 11 (13.4%) |
| 15 to 19 Minutes | 26 (27.1%) | 2 (2.4%) |
| 20 to 24 Minutes | 9 (9.4%) | 10 (12.2%) |
| 25 to 29 Minutes | 9 (9.4%) | 3 (3.7%) |
| 30 to 34 Minutes | 2 (2.1%) | 3 (3.7%) |
| 35 to 39 Minutes | 0 (0.0%) | 12 (14.6%) |
| 40 to 44 Minutes | 0 (0.0%) | 3 (3.7%) |
| 45 to 59 Minutes | 3 (3.1%) | 15 (18.3%) |
| 60 to 89 Minutes | 11 (11.5%) | 23 (28.1%) |
| 90 or more Minutes | 6 (6.2%) | 0 (0.0%) |
Time of Departure to Work by Sex in Lake Bridgeport
The most frequent times of departure to work in Lake Bridgeport are 7:30 AM to 7:59 AM (18, 18.8%) for males and 6:00 AM to 6:29 AM (32, 39.0%) for females.
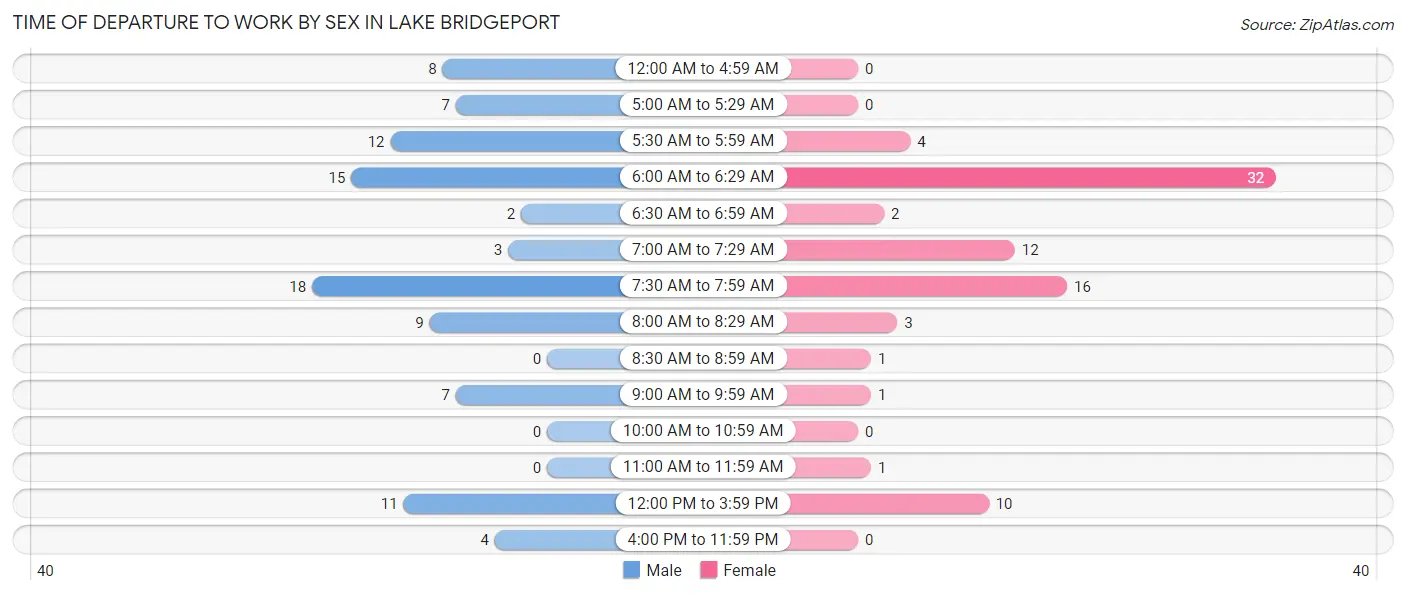
| Time of Departure | Male | Female |
| 12:00 AM to 4:59 AM | 8 (8.3%) | 0 (0.0%) |
| 5:00 AM to 5:29 AM | 7 (7.3%) | 0 (0.0%) |
| 5:30 AM to 5:59 AM | 12 (12.5%) | 4 (4.9%) |
| 6:00 AM to 6:29 AM | 15 (15.6%) | 32 (39.0%) |
| 6:30 AM to 6:59 AM | 2 (2.1%) | 2 (2.4%) |
| 7:00 AM to 7:29 AM | 3 (3.1%) | 12 (14.6%) |
| 7:30 AM to 7:59 AM | 18 (18.8%) | 16 (19.5%) |
| 8:00 AM to 8:29 AM | 9 (9.4%) | 3 (3.7%) |
| 8:30 AM to 8:59 AM | 0 (0.0%) | 1 (1.2%) |
| 9:00 AM to 9:59 AM | 7 (7.3%) | 1 (1.2%) |
| 10:00 AM to 10:59 AM | 0 (0.0%) | 0 (0.0%) |
| 11:00 AM to 11:59 AM | 0 (0.0%) | 1 (1.2%) |
| 12:00 PM to 3:59 PM | 11 (11.5%) | 10 (12.2%) |
| 4:00 PM to 11:59 PM | 4 (4.2%) | 0 (0.0%) |
| Total | 96 (100.0%) | 82 (100.0%) |
Housing Occupancy in Lake Bridgeport
Occupancy by Ownership in Lake Bridgeport
Of the total 143 dwellings in Lake Bridgeport, owner-occupied units account for 89 (62.2%), while renter-occupied units make up 54 (37.8%).
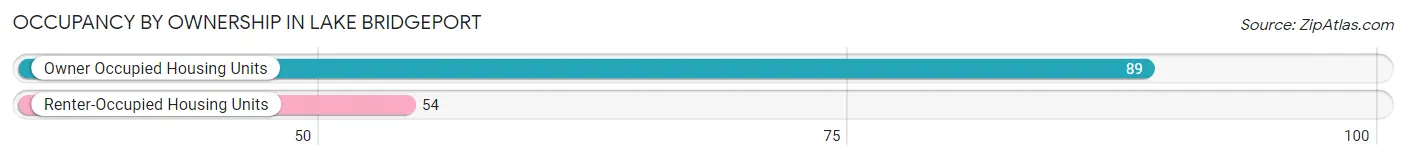
| Occupancy | # Housing Units | % Housing Units |
| Owner Occupied Housing Units | 89 | 62.2% |
| Renter-Occupied Housing Units | 54 | 37.8% |
| Total Occupied Housing Units | 143 | 100.0% |
Occupancy by Household Size in Lake Bridgeport
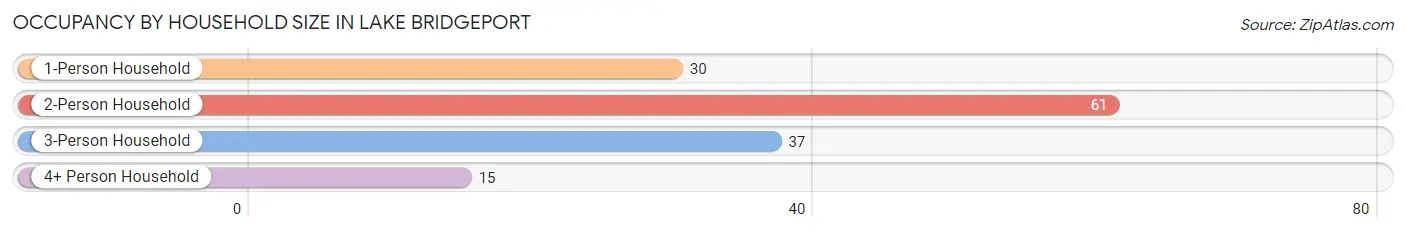
| Household Size | # Housing Units | % Housing Units |
| 1-Person Household | 30 | 21.0% |
| 2-Person Household | 61 | 42.7% |
| 3-Person Household | 37 | 25.9% |
| 4+ Person Household | 15 | 10.5% |
| Total Housing Units | 143 | 100.0% |
Occupancy by Ownership by Household Size in Lake Bridgeport
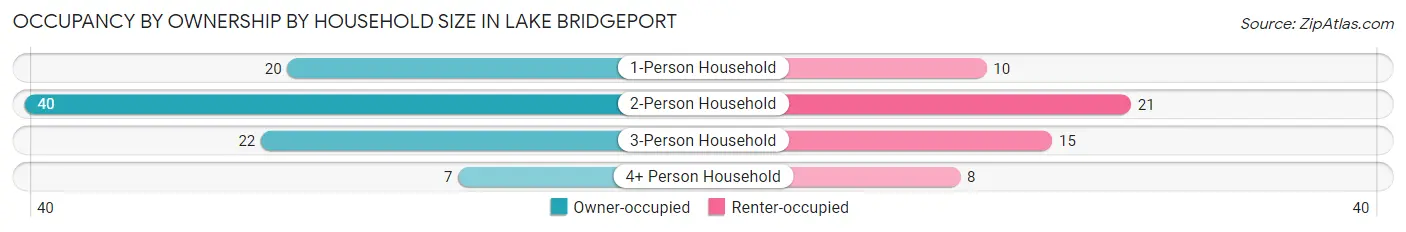
| Household Size | Owner-occupied | Renter-occupied |
| 1-Person Household | 20 (66.7%) | 10 (33.3%) |
| 2-Person Household | 40 (65.6%) | 21 (34.4%) |
| 3-Person Household | 22 (59.5%) | 15 (40.5%) |
| 4+ Person Household | 7 (46.7%) | 8 (53.3%) |
| Total Housing Units | 89 (62.2%) | 54 (37.8%) |
Occupancy by Educational Attainment in Lake Bridgeport
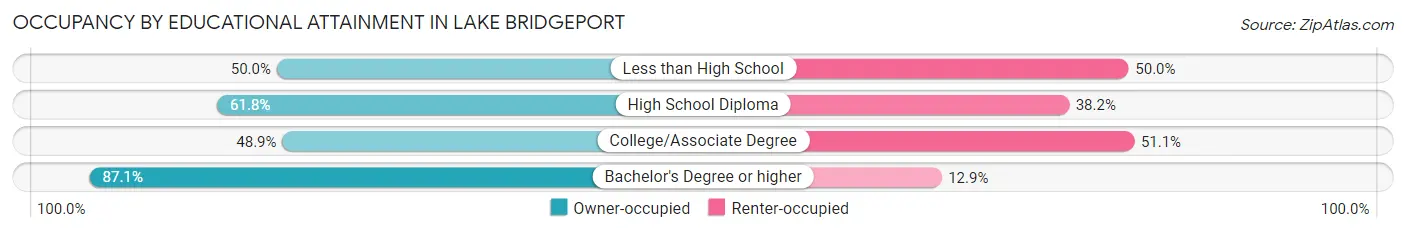
| Household Size | Owner-occupied | Renter-occupied |
| Less than High School | 6 (50.0%) | 6 (50.0%) |
| High School Diploma | 34 (61.8%) | 21 (38.2%) |
| College/Associate Degree | 22 (48.9%) | 23 (51.1%) |
| Bachelor's Degree or higher | 27 (87.1%) | 4 (12.9%) |
Occupancy by Age of Householder in Lake Bridgeport
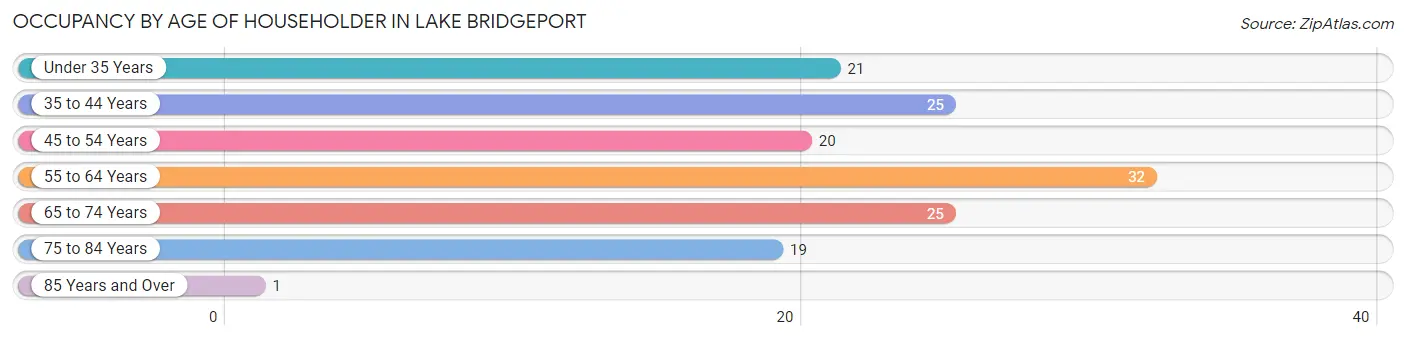
| Age Bracket | # Households | % Households |
| Under 35 Years | 21 | 14.7% |
| 35 to 44 Years | 25 | 17.5% |
| 45 to 54 Years | 20 | 14.0% |
| 55 to 64 Years | 32 | 22.4% |
| 65 to 74 Years | 25 | 17.5% |
| 75 to 84 Years | 19 | 13.3% |
| 85 Years and Over | 1 | 0.7% |
| Total | 143 | 100.0% |
Housing Finances in Lake Bridgeport
Median Income by Occupancy in Lake Bridgeport
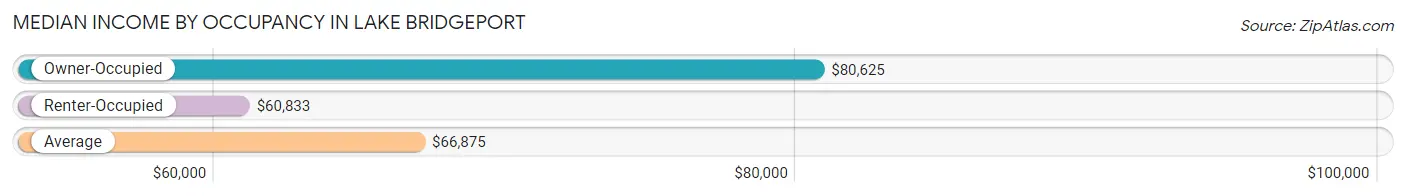
| Occupancy Type | # Households | Median Income |
| Owner-Occupied | 89 (62.2%) | $80,625 |
| Renter-Occupied | 54 (37.8%) | $60,833 |
| Average | 143 (100.0%) | $66,875 |
Occupancy by Householder Income Bracket in Lake Bridgeport
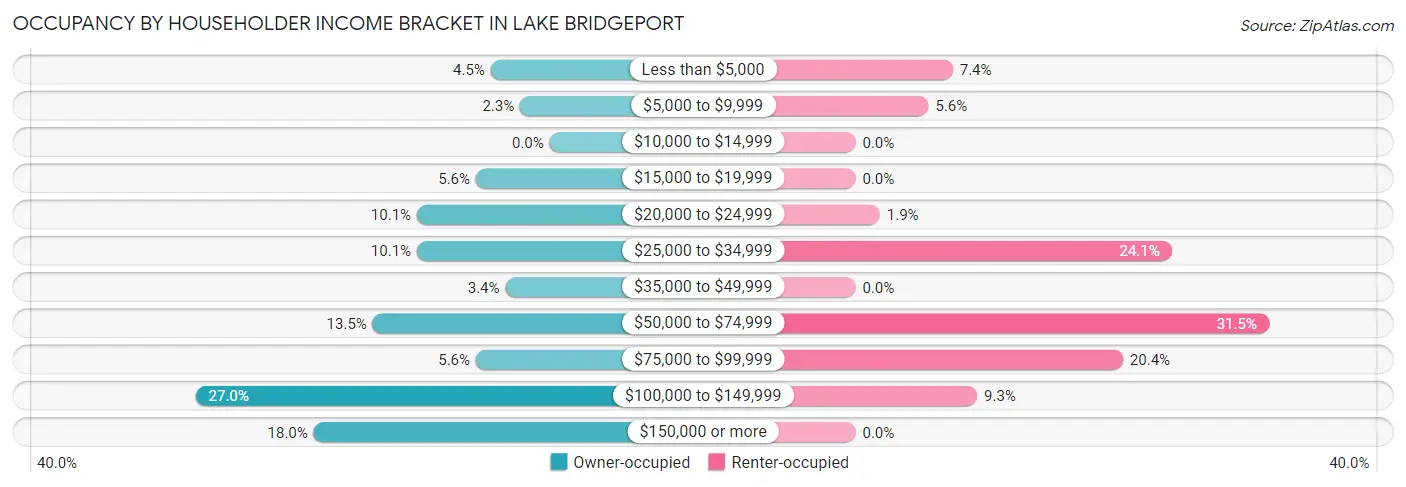
| Income Bracket | Owner-occupied | Renter-occupied |
| Less than $5,000 | 4 (4.5%) | 4 (7.4%) |
| $5,000 to $9,999 | 2 (2.2%) | 3 (5.6%) |
| $10,000 to $14,999 | 0 (0.0%) | 0 (0.0%) |
| $15,000 to $19,999 | 5 (5.6%) | 0 (0.0%) |
| $20,000 to $24,999 | 9 (10.1%) | 1 (1.8%) |
| $25,000 to $34,999 | 9 (10.1%) | 13 (24.1%) |
| $35,000 to $49,999 | 3 (3.4%) | 0 (0.0%) |
| $50,000 to $74,999 | 12 (13.5%) | 17 (31.5%) |
| $75,000 to $99,999 | 5 (5.6%) | 11 (20.4%) |
| $100,000 to $149,999 | 24 (27.0%) | 5 (9.3%) |
| $150,000 or more | 16 (18.0%) | 0 (0.0%) |
| Total | 89 (100.0%) | 54 (100.0%) |
Monthly Housing Cost Tiers in Lake Bridgeport
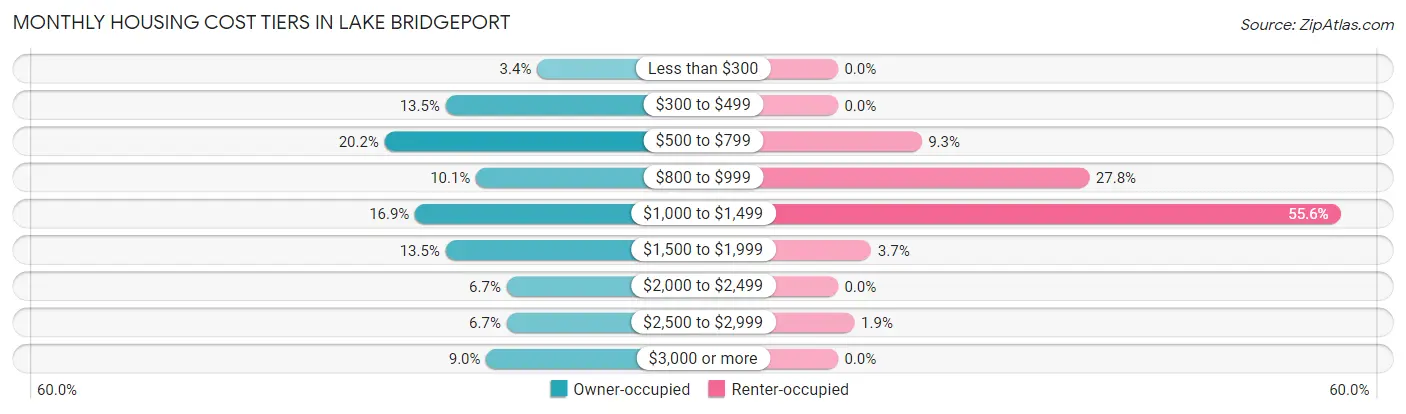
| Monthly Cost | Owner-occupied | Renter-occupied |
| Less than $300 | 3 (3.4%) | 0 (0.0%) |
| $300 to $499 | 12 (13.5%) | 0 (0.0%) |
| $500 to $799 | 18 (20.2%) | 5 (9.3%) |
| $800 to $999 | 9 (10.1%) | 15 (27.8%) |
| $1,000 to $1,499 | 15 (16.9%) | 30 (55.6%) |
| $1,500 to $1,999 | 12 (13.5%) | 2 (3.7%) |
| $2,000 to $2,499 | 6 (6.7%) | 0 (0.0%) |
| $2,500 to $2,999 | 6 (6.7%) | 1 (1.8%) |
| $3,000 or more | 8 (9.0%) | 0 (0.0%) |
| Total | 89 (100.0%) | 54 (100.0%) |
Physical Housing Characteristics in Lake Bridgeport
Housing Structures in Lake Bridgeport
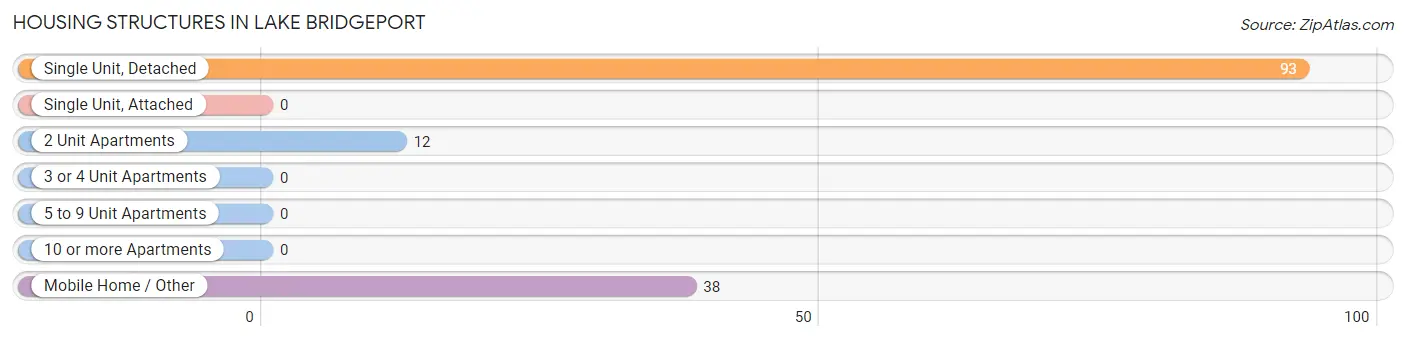
| Structure Type | # Housing Units | % Housing Units |
| Single Unit, Detached | 93 | 65.0% |
| Single Unit, Attached | 0 | 0.0% |
| 2 Unit Apartments | 12 | 8.4% |
| 3 or 4 Unit Apartments | 0 | 0.0% |
| 5 to 9 Unit Apartments | 0 | 0.0% |
| 10 or more Apartments | 0 | 0.0% |
| Mobile Home / Other | 38 | 26.6% |
| Total | 143 | 100.0% |
Housing Structures by Occupancy in Lake Bridgeport
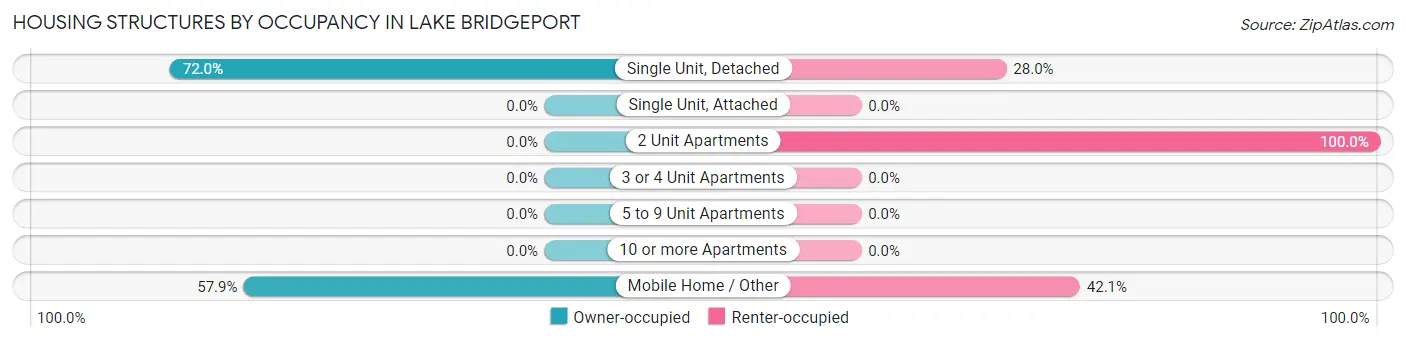
| Structure Type | Owner-occupied | Renter-occupied |
| Single Unit, Detached | 67 (72.0%) | 26 (28.0%) |
| Single Unit, Attached | 0 (0.0%) | 0 (0.0%) |
| 2 Unit Apartments | 0 (0.0%) | 12 (100.0%) |
| 3 or 4 Unit Apartments | 0 (0.0%) | 0 (0.0%) |
| 5 to 9 Unit Apartments | 0 (0.0%) | 0 (0.0%) |
| 10 or more Apartments | 0 (0.0%) | 0 (0.0%) |
| Mobile Home / Other | 22 (57.9%) | 16 (42.1%) |
| Total | 89 (62.2%) | 54 (37.8%) |
Housing Structures by Number of Rooms in Lake Bridgeport
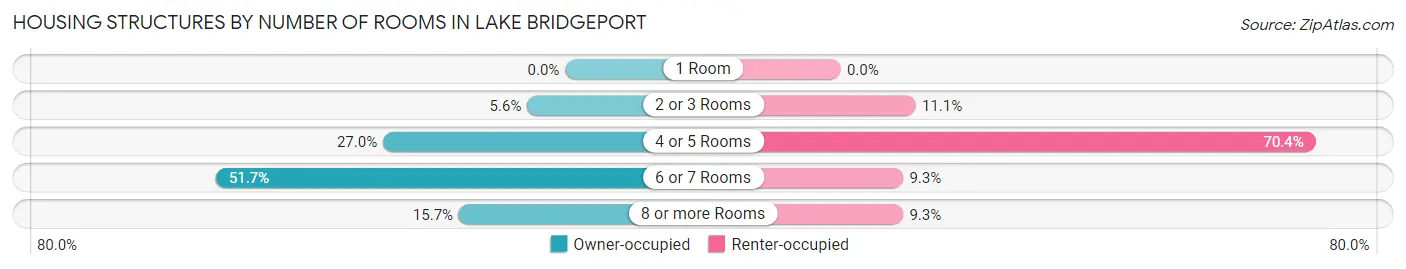
| Number of Rooms | Owner-occupied | Renter-occupied |
| 1 Room | 0 (0.0%) | 0 (0.0%) |
| 2 or 3 Rooms | 5 (5.6%) | 6 (11.1%) |
| 4 or 5 Rooms | 24 (27.0%) | 38 (70.4%) |
| 6 or 7 Rooms | 46 (51.7%) | 5 (9.3%) |
| 8 or more Rooms | 14 (15.7%) | 5 (9.3%) |
| Total | 89 (100.0%) | 54 (100.0%) |
Housing Structure by Heating Type in Lake Bridgeport
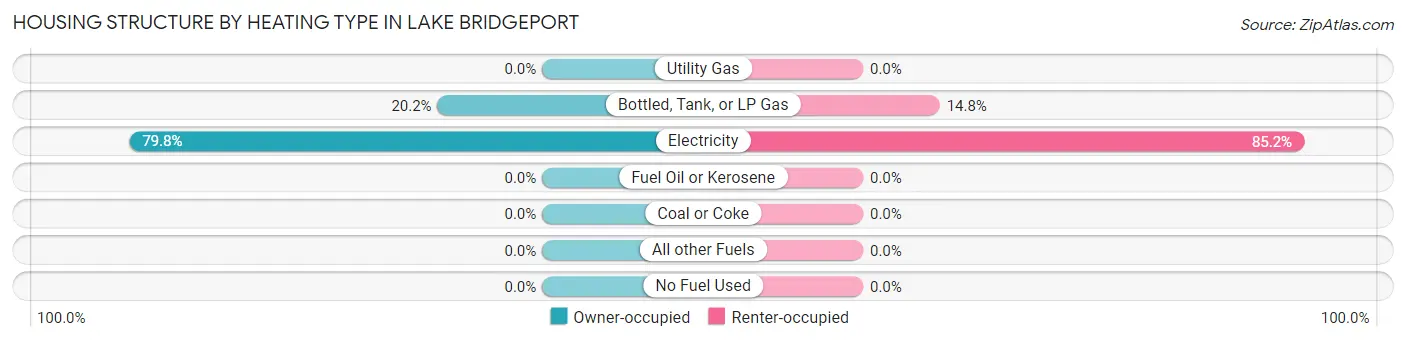
| Heating Type | Owner-occupied | Renter-occupied |
| Utility Gas | 0 (0.0%) | 0 (0.0%) |
| Bottled, Tank, or LP Gas | 18 (20.2%) | 8 (14.8%) |
| Electricity | 71 (79.8%) | 46 (85.2%) |
| Fuel Oil or Kerosene | 0 (0.0%) | 0 (0.0%) |
| Coal or Coke | 0 (0.0%) | 0 (0.0%) |
| All other Fuels | 0 (0.0%) | 0 (0.0%) |
| No Fuel Used | 0 (0.0%) | 0 (0.0%) |
| Total | 89 (100.0%) | 54 (100.0%) |
Household Vehicle Usage in Lake Bridgeport
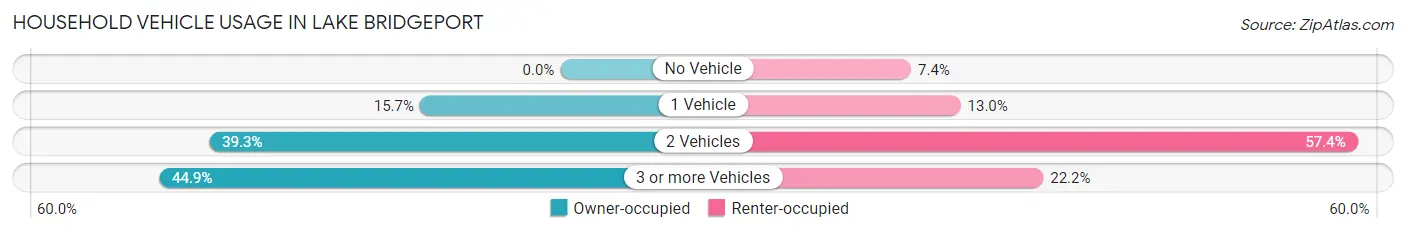
| Vehicles per Household | Owner-occupied | Renter-occupied |
| No Vehicle | 0 (0.0%) | 4 (7.4%) |
| 1 Vehicle | 14 (15.7%) | 7 (13.0%) |
| 2 Vehicles | 35 (39.3%) | 31 (57.4%) |
| 3 or more Vehicles | 40 (44.9%) | 12 (22.2%) |
| Total | 89 (100.0%) | 54 (100.0%) |
Real Estate & Mortgages in Lake Bridgeport
Real Estate and Mortgage Overview in Lake Bridgeport
| Characteristic | Without Mortgage | With Mortgage |
| Housing Units | 49 | 40 |
| Median Property Value | $109,700 | $268,800 |
| Median Household Income | $58,250 | $11 |
| Monthly Housing Costs | $625 | $8 |
| Real Estate Taxes | $1,625 | $0 |
Property Value by Mortgage Status in Lake Bridgeport
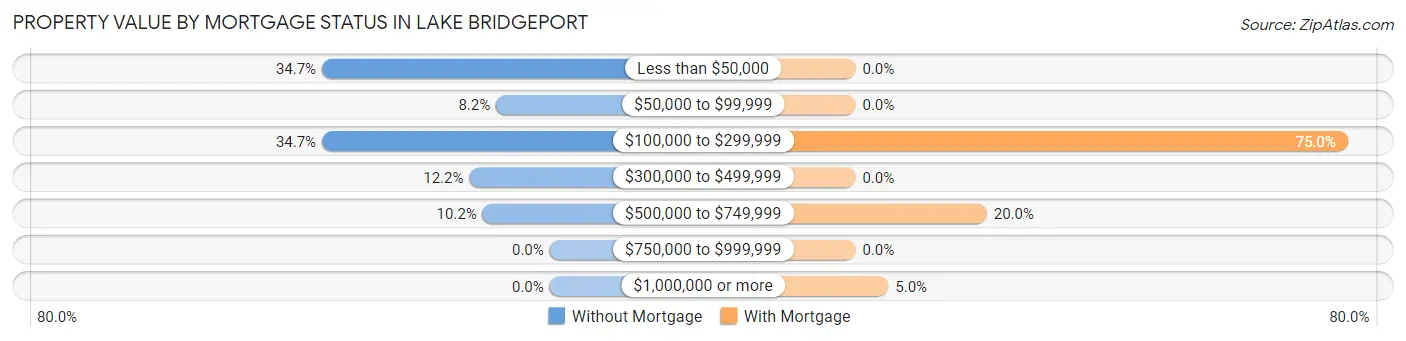
| Property Value | Without Mortgage | With Mortgage |
| Less than $50,000 | 17 (34.7%) | 0 (0.0%) |
| $50,000 to $99,999 | 4 (8.2%) | 0 (0.0%) |
| $100,000 to $299,999 | 17 (34.7%) | 30 (75.0%) |
| $300,000 to $499,999 | 6 (12.2%) | 0 (0.0%) |
| $500,000 to $749,999 | 5 (10.2%) | 8 (20.0%) |
| $750,000 to $999,999 | 0 (0.0%) | 0 (0.0%) |
| $1,000,000 or more | 0 (0.0%) | 2 (5.0%) |
| Total | 49 (100.0%) | 40 (100.0%) |
Household Income by Mortgage Status in Lake Bridgeport
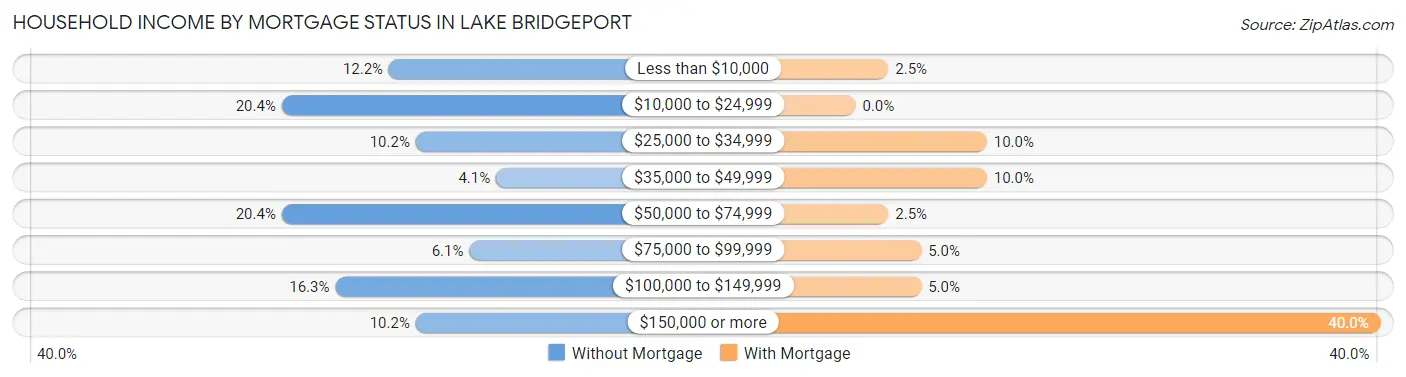
| Household Income | Without Mortgage | With Mortgage |
| Less than $10,000 | 6 (12.2%) | 1 (2.5%) |
| $10,000 to $24,999 | 10 (20.4%) | 0 (0.0%) |
| $25,000 to $34,999 | 5 (10.2%) | 4 (10.0%) |
| $35,000 to $49,999 | 2 (4.1%) | 4 (10.0%) |
| $50,000 to $74,999 | 10 (20.4%) | 1 (2.5%) |
| $75,000 to $99,999 | 3 (6.1%) | 2 (5.0%) |
| $100,000 to $149,999 | 8 (16.3%) | 2 (5.0%) |
| $150,000 or more | 5 (10.2%) | 16 (40.0%) |
| Total | 49 (100.0%) | 40 (100.0%) |
Property Value to Household Income Ratio in Lake Bridgeport
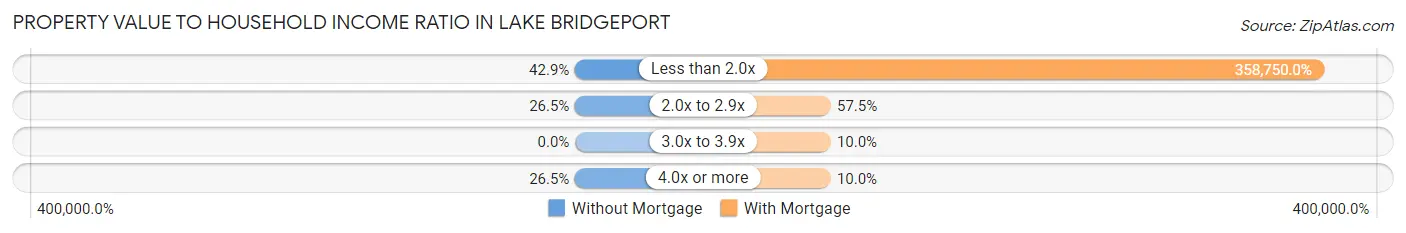
| Value-to-Income Ratio | Without Mortgage | With Mortgage |
| Less than 2.0x | 21 (42.9%) | 143,500 (358,750.0%) |
| 2.0x to 2.9x | 13 (26.5%) | 23 (57.5%) |
| 3.0x to 3.9x | 0 (0.0%) | 4 (10.0%) |
| 4.0x or more | 13 (26.5%) | 4 (10.0%) |
| Total | 49 (100.0%) | 40 (100.0%) |
Real Estate Taxes by Mortgage Status in Lake Bridgeport
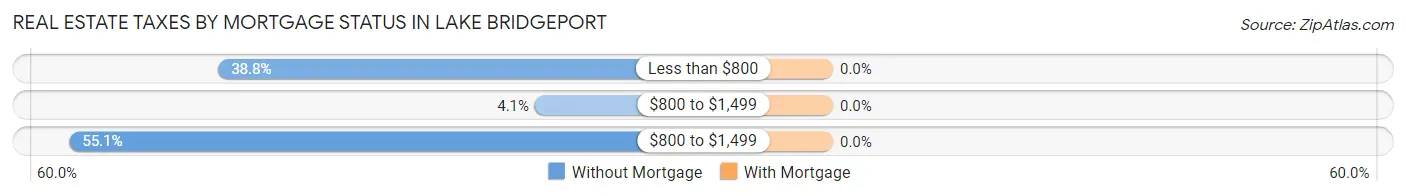
| Property Taxes | Without Mortgage | With Mortgage |
| Less than $800 | 19 (38.8%) | 0 (0.0%) |
| $800 to $1,499 | 2 (4.1%) | 0 (0.0%) |
| $800 to $1,499 | 27 (55.1%) | 0 (0.0%) |
| Total | 49 (100.0%) | 40 (100.0%) |
Health & Disability in Lake Bridgeport
Health Insurance Coverage by Age in Lake Bridgeport
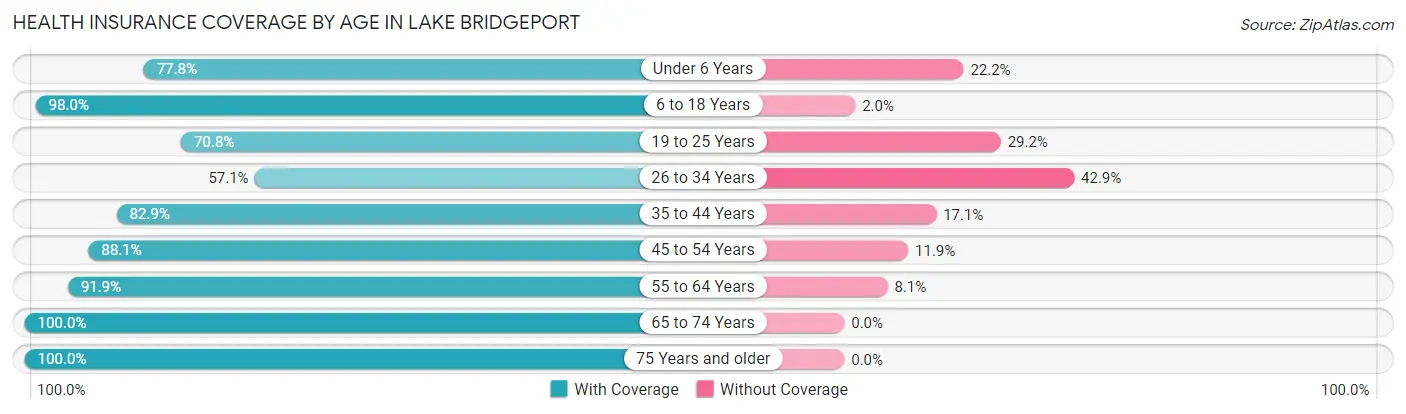
| Age Bracket | With Coverage | Without Coverage |
| Under 6 Years | 7 (77.8%) | 2 (22.2%) |
| 6 to 18 Years | 48 (98.0%) | 1 (2.0%) |
| 19 to 25 Years | 34 (70.8%) | 14 (29.2%) |
| 26 to 34 Years | 16 (57.1%) | 12 (42.9%) |
| 35 to 44 Years | 29 (82.9%) | 6 (17.1%) |
| 45 to 54 Years | 37 (88.1%) | 5 (11.9%) |
| 55 to 64 Years | 57 (91.9%) | 5 (8.1%) |
| 65 to 74 Years | 52 (100.0%) | 0 (0.0%) |
| 75 Years and older | 24 (100.0%) | 0 (0.0%) |
| Total | 304 (87.1%) | 45 (12.9%) |
Health Insurance Coverage by Citizenship Status in Lake Bridgeport
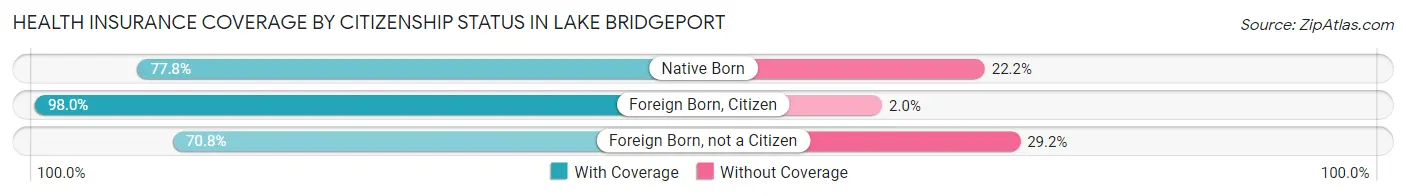
| Citizenship Status | With Coverage | Without Coverage |
| Native Born | 7 (77.8%) | 2 (22.2%) |
| Foreign Born, Citizen | 48 (98.0%) | 1 (2.0%) |
| Foreign Born, not a Citizen | 34 (70.8%) | 14 (29.2%) |
Health Insurance Coverage by Household Income in Lake Bridgeport
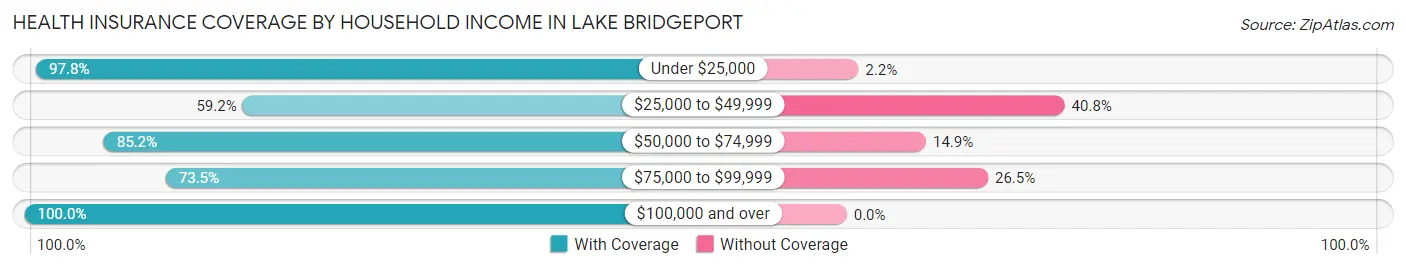
| Household Income | With Coverage | Without Coverage |
| Under $25,000 | 45 (97.8%) | 1 (2.2%) |
| $25,000 to $49,999 | 29 (59.2%) | 20 (40.8%) |
| $50,000 to $74,999 | 86 (85.2%) | 15 (14.8%) |
| $75,000 to $99,999 | 25 (73.5%) | 9 (26.5%) |
| $100,000 and over | 119 (100.0%) | 0 (0.0%) |
Public vs Private Health Insurance Coverage by Age in Lake Bridgeport
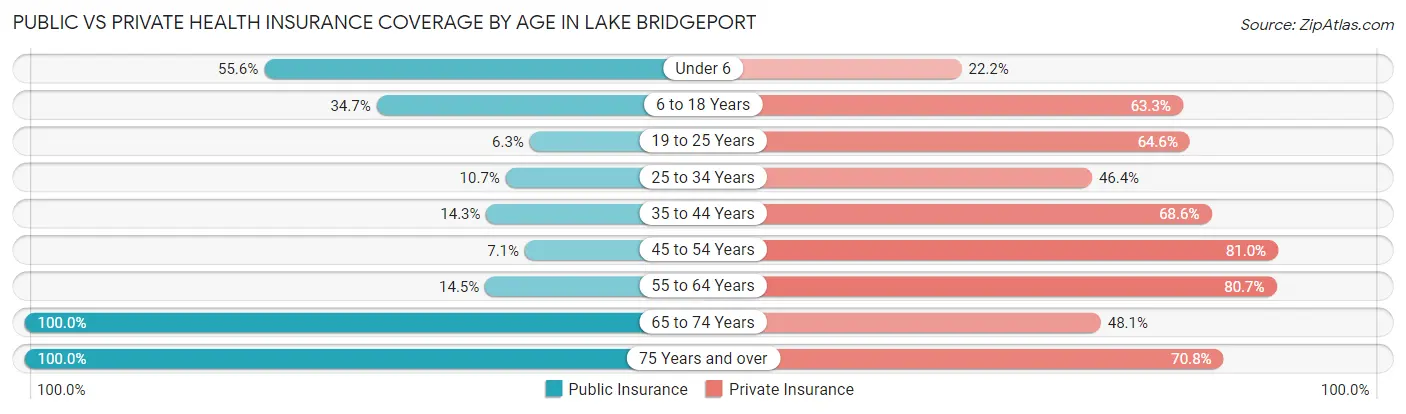
| Age Bracket | Public Insurance | Private Insurance |
| Under 6 | 5 (55.6%) | 2 (22.2%) |
| 6 to 18 Years | 17 (34.7%) | 31 (63.3%) |
| 19 to 25 Years | 3 (6.2%) | 31 (64.6%) |
| 25 to 34 Years | 3 (10.7%) | 13 (46.4%) |
| 35 to 44 Years | 5 (14.3%) | 24 (68.6%) |
| 45 to 54 Years | 3 (7.1%) | 34 (80.9%) |
| 55 to 64 Years | 9 (14.5%) | 50 (80.6%) |
| 65 to 74 Years | 52 (100.0%) | 25 (48.1%) |
| 75 Years and over | 24 (100.0%) | 17 (70.8%) |
| Total | 121 (34.7%) | 227 (65.0%) |
Disability Status by Sex by Age in Lake Bridgeport
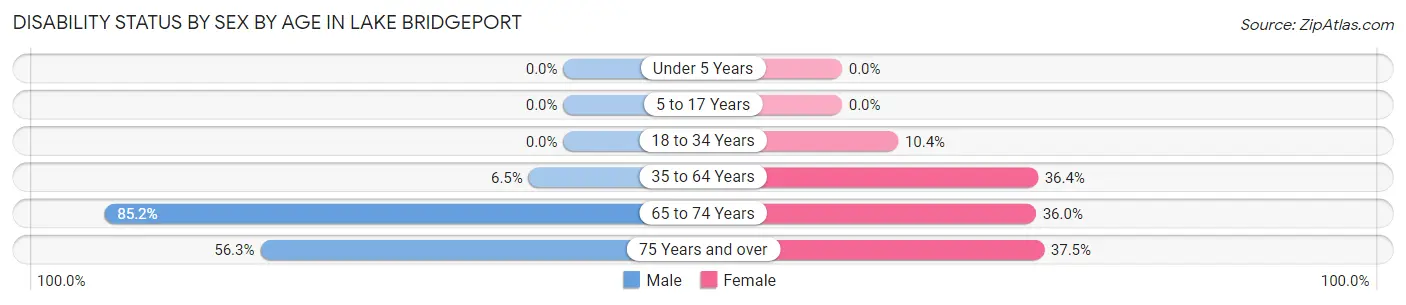
| Age Bracket | Male | Female |
| Under 5 Years | 0 (0.0%) | 0 (0.0%) |
| 5 to 17 Years | 0 (0.0%) | 0 (0.0%) |
| 18 to 34 Years | 0 (0.0%) | 5 (10.4%) |
| 35 to 64 Years | 4 (6.5%) | 28 (36.4%) |
| 65 to 74 Years | 23 (85.2%) | 9 (36.0%) |
| 75 Years and over | 9 (56.2%) | 3 (37.5%) |
Disability Class by Sex by Age in Lake Bridgeport
Disability Class: Hearing Difficulty
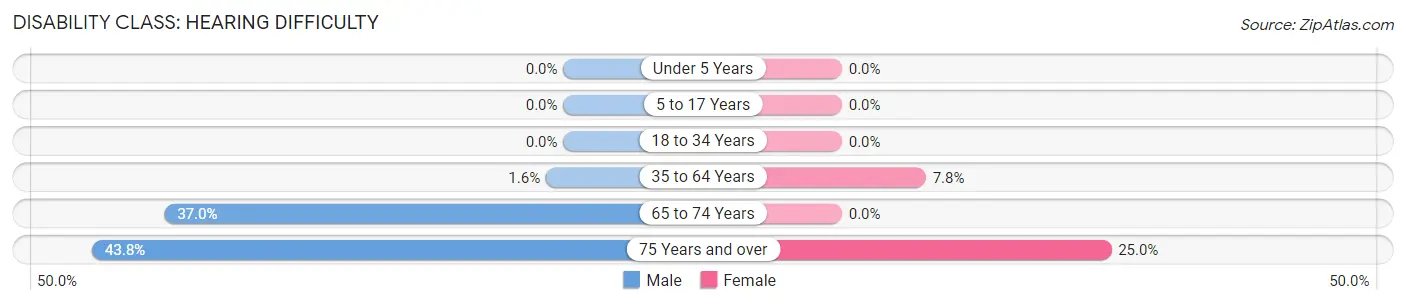
| Age Bracket | Male | Female |
| Under 5 Years | 0 (0.0%) | 0 (0.0%) |
| 5 to 17 Years | 0 (0.0%) | 0 (0.0%) |
| 18 to 34 Years | 0 (0.0%) | 0 (0.0%) |
| 35 to 64 Years | 1 (1.6%) | 6 (7.8%) |
| 65 to 74 Years | 10 (37.0%) | 0 (0.0%) |
| 75 Years and over | 7 (43.8%) | 2 (25.0%) |
Disability Class: Vision Difficulty
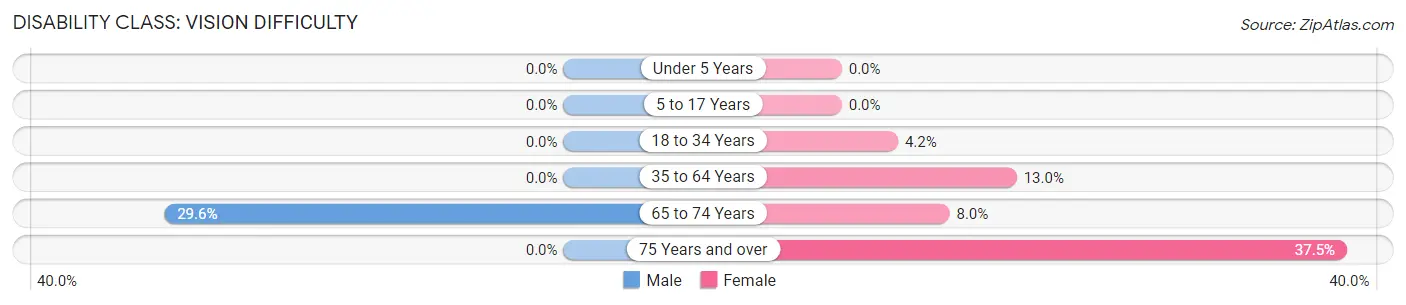
| Age Bracket | Male | Female |
| Under 5 Years | 0 (0.0%) | 0 (0.0%) |
| 5 to 17 Years | 0 (0.0%) | 0 (0.0%) |
| 18 to 34 Years | 0 (0.0%) | 2 (4.2%) |
| 35 to 64 Years | 0 (0.0%) | 10 (13.0%) |
| 65 to 74 Years | 8 (29.6%) | 2 (8.0%) |
| 75 Years and over | 0 (0.0%) | 3 (37.5%) |
Disability Class: Cognitive Difficulty
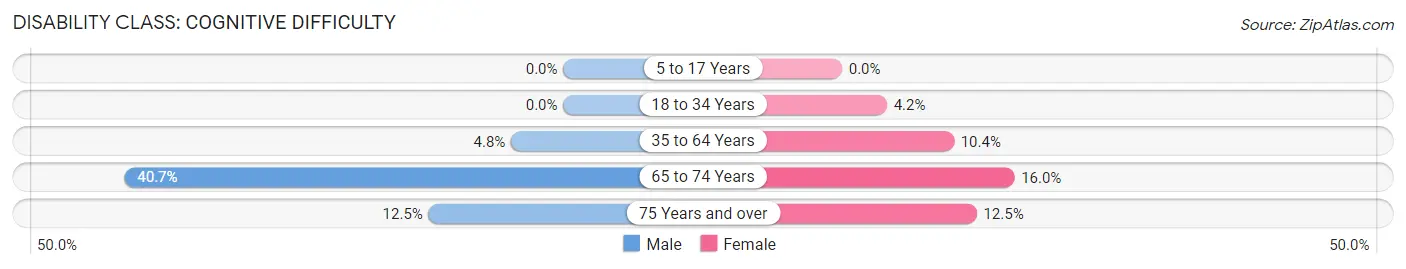
| Age Bracket | Male | Female |
| 5 to 17 Years | 0 (0.0%) | 0 (0.0%) |
| 18 to 34 Years | 0 (0.0%) | 2 (4.2%) |
| 35 to 64 Years | 3 (4.8%) | 8 (10.4%) |
| 65 to 74 Years | 11 (40.7%) | 4 (16.0%) |
| 75 Years and over | 2 (12.5%) | 1 (12.5%) |
Disability Class: Ambulatory Difficulty
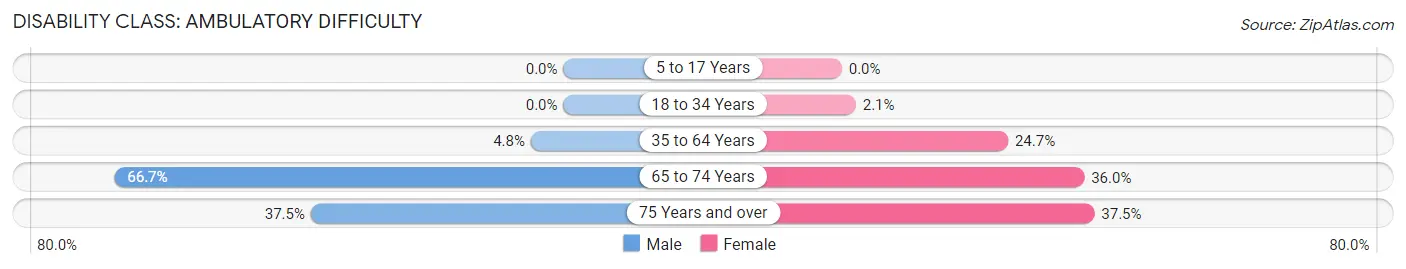
| Age Bracket | Male | Female |
| 5 to 17 Years | 0 (0.0%) | 0 (0.0%) |
| 18 to 34 Years | 0 (0.0%) | 1 (2.1%) |
| 35 to 64 Years | 3 (4.8%) | 19 (24.7%) |
| 65 to 74 Years | 18 (66.7%) | 9 (36.0%) |
| 75 Years and over | 6 (37.5%) | 3 (37.5%) |
Disability Class: Self-Care Difficulty
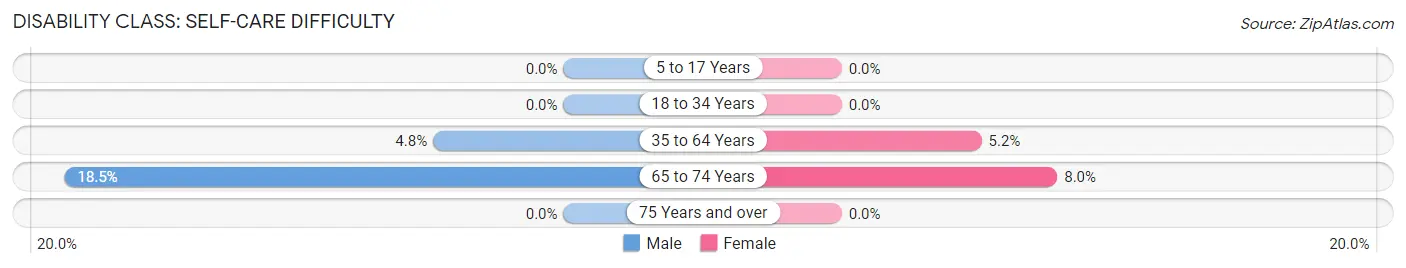
| Age Bracket | Male | Female |
| 5 to 17 Years | 0 (0.0%) | 0 (0.0%) |
| 18 to 34 Years | 0 (0.0%) | 0 (0.0%) |
| 35 to 64 Years | 3 (4.8%) | 4 (5.2%) |
| 65 to 74 Years | 5 (18.5%) | 2 (8.0%) |
| 75 Years and over | 0 (0.0%) | 0 (0.0%) |
Technology Access in Lake Bridgeport
Computing Device Access in Lake Bridgeport
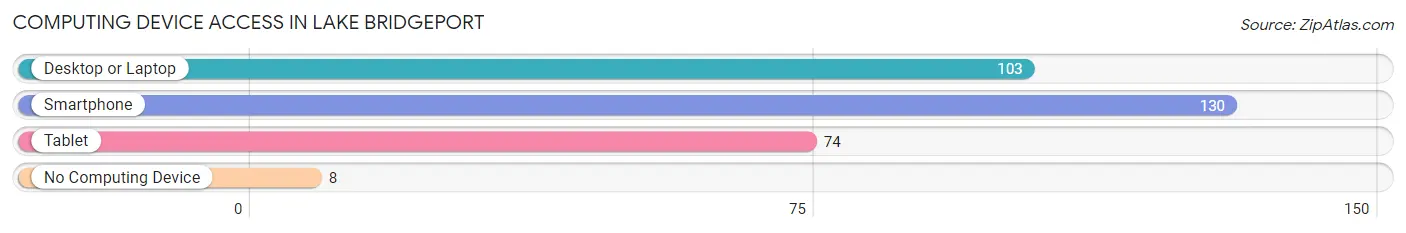
| Device Type | # Households | % Households |
| Desktop or Laptop | 103 | 72.0% |
| Smartphone | 130 | 90.9% |
| Tablet | 74 | 51.7% |
| No Computing Device | 8 | 5.6% |
| Total | 143 | 100.0% |
Internet Access in Lake Bridgeport
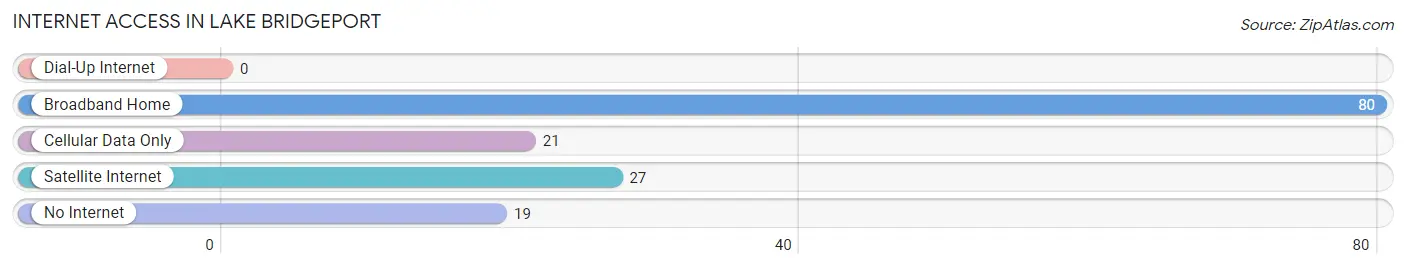
| Internet Type | # Households | % Households |
| Dial-Up Internet | 0 | 0.0% |
| Broadband Home | 80 | 55.9% |
| Cellular Data Only | 21 | 14.7% |
| Satellite Internet | 27 | 18.9% |
| No Internet | 19 | 13.3% |
| Total | 143 | 100.0% |
Lake Bridgeport Summary
Bridgeport, Texas is a small city located in Wise County, Texas, United States. It is situated on the western shore of Lake Bridgeport, a 12,000-acre reservoir created in the 1940s. The city is located approximately 45 miles northwest of Fort Worth and is part of the Dallas-Fort Worth-Arlington metropolitan area. As of the 2010 census, the city had a population of 6,041.
History
The area around Lake Bridgeport was first settled in the late 1800s by ranchers and farmers. The town of Bridgeport was established in 1891 and was named after the nearby bridge over the West Fork of the Trinity River. The town was incorporated in 1909 and was the county seat of Wise County until the county seat was moved to Decatur in 1921.
In the 1940s, the U.S. Army Corps of Engineers began construction of Lake Bridgeport, a 12,000-acre reservoir. The lake was completed in 1945 and provided a source of water for the city and surrounding area.
Geography
Bridgeport is located in Wise County, Texas, at the western edge of Lake Bridgeport. The city is situated at the intersection of U.S. Highway 380 and State Highway 101. The city is approximately 45 miles northwest of Fort Worth and is part of the Dallas-Fort Worth-Arlington metropolitan area.
The city has a total area of 4.2 square miles, of which 4.1 square miles is land and 0.1 square miles is water. The terrain is mostly flat with some rolling hills.
Economy
The economy of Bridgeport is largely based on tourism and recreation. The city is home to several marinas, boat ramps, and campgrounds that attract visitors from around the region. The city is also home to several businesses, including restaurants, retail stores, and service providers.
The city is also home to several manufacturing and industrial businesses, including a plastics plant, a metal fabrication plant, and a food processing plant. The city is also home to several oil and gas companies.
Demographics
As of the 2010 census, the city had a population of 6,041. The racial makeup of the city was 79.3% White, 11.2% African American, 0.7% Native American, 0.7% Asian, 0.1% Pacific Islander, 5.7% from other races, and 2.1% from two or more races. Hispanic or Latino of any race were 13.2% of the population.
The median income for a household in the city was $37,917, and the median income for a family was $45,938. The per capita income for the city was $19,945. About 11.2% of families and 14.2% of the population were below the poverty line, including 19.2% of those under age 18 and 8.2% of those age 65 or over.
Conclusion
Bridgeport, Texas is a small city located in Wise County, Texas, United States. It is situated on the western shore of Lake Bridgeport, a 12,000-acre reservoir created in the 1940s. The city is located approximately 45 miles northwest of Fort Worth and is part of the Dallas-Fort Worth-Arlington metropolitan area. As of the 2010 census, the city had a population of 6,041. The economy of Bridgeport is largely based on tourism and recreation, as well as manufacturing and industrial businesses. The racial makeup of the city was 79.3% White, 11.2% African American, 0.7% Native American, 0.7% Asian, 0.1% Pacific Islander, 5.7% from other races, and 2.1% from two or more races. The median income for a household in the city was $37,917, and the median income for a family was $45,938. Bridgeport is a small city with a rich history and a vibrant economy.
Common Questions
What is Per Capita Income in Lake Bridgeport?
Per Capita income in Lake Bridgeport is $37,521.
What is the Median Family Income in Lake Bridgeport?
Median Family Income in Lake Bridgeport is $73,750.
What is the Median Household income in Lake Bridgeport?
Median Household Income in Lake Bridgeport is $66,875.
What is Income or Wage Gap in Lake Bridgeport?
Income or Wage Gap in Lake Bridgeport is 7.9%.
Women in Lake Bridgeport earn 92.1 cents for every dollar earned by a man.
What is Inequality or Gini Index in Lake Bridgeport?
Inequality or Gini Index in Lake Bridgeport is 0.48.
What is the Total Population of Lake Bridgeport?
Total Population of Lake Bridgeport is 349.
What is the Total Male Population of Lake Bridgeport?
Total Male Population of Lake Bridgeport is 171.
What is the Total Female Population of Lake Bridgeport?
Total Female Population of Lake Bridgeport is 178.
What is the Ratio of Males per 100 Females in Lake Bridgeport?
There are 96.07 Males per 100 Females in Lake Bridgeport.
What is the Ratio of Females per 100 Males in Lake Bridgeport?
There are 104.09 Females per 100 Males in Lake Bridgeport.
What is the Median Population Age in Lake Bridgeport?
Median Population Age in Lake Bridgeport is 48.5 Years.
What is the Average Family Size in Lake Bridgeport
Average Family Size in Lake Bridgeport is 2.7 People.
What is the Average Household Size in Lake Bridgeport
Average Household Size in Lake Bridgeport is 2.4 People.
How Large is the Labor Force in Lake Bridgeport?
There are 191 People in the Labor Forcein in Lake Bridgeport.
What is the Percentage of People in the Labor Force in Lake Bridgeport?
61.0% of People are in the Labor Force in Lake Bridgeport.
What is the Unemployment Rate in Lake Bridgeport?
Unemployment Rate in Lake Bridgeport is 1.0%.