Sunrise Beach Village, TX Map & Demographics
Sunrise Beach Village Map
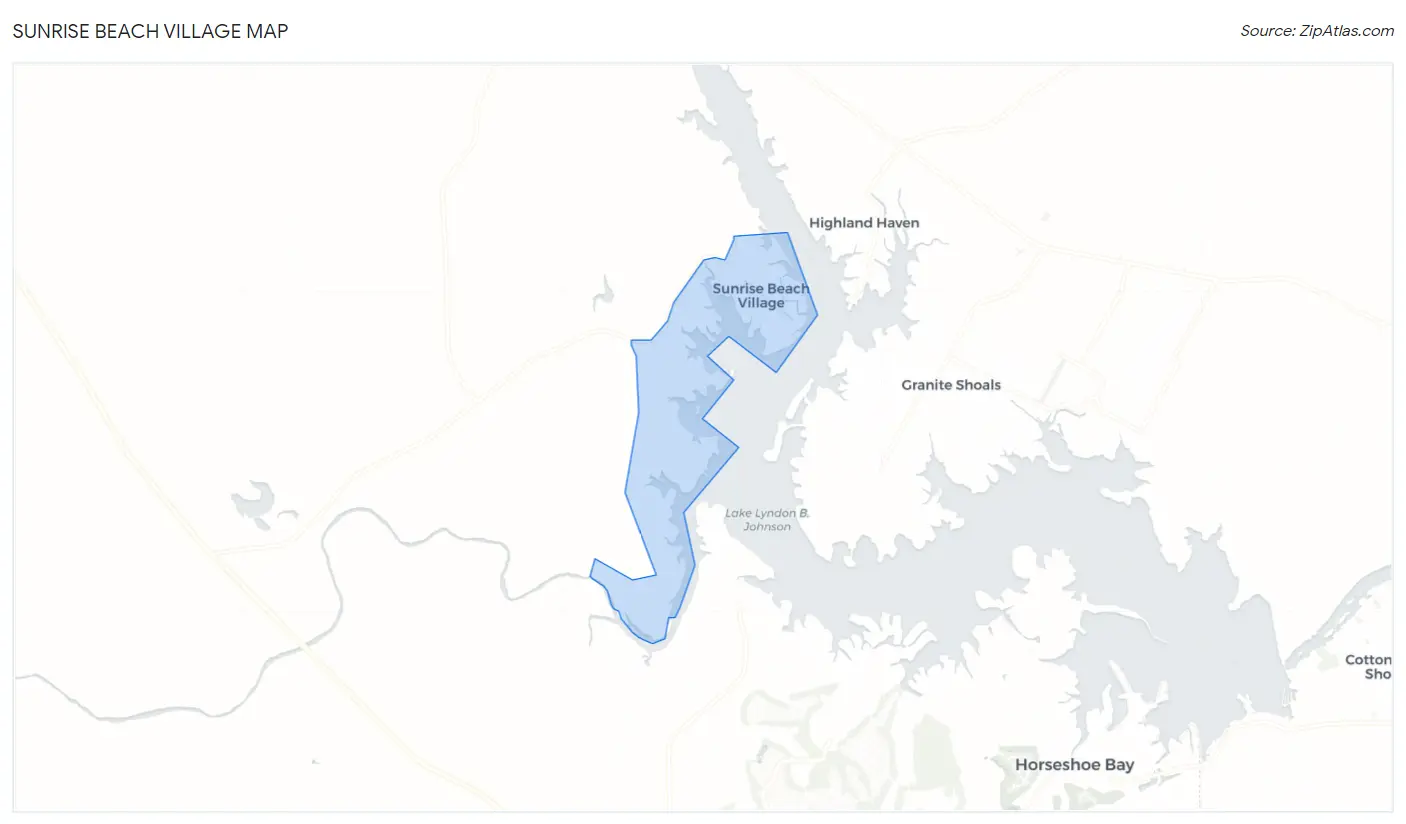
Sunrise Beach Village Overview
$62,831
PER CAPITA INCOME
$107,344
AVG FAMILY INCOME
$78,333
AVG HOUSEHOLD INCOME
42.5%
WAGE / INCOME GAP [ % ]
57.5¢/ $1
WAGE / INCOME GAP [ $ ]
$7,183
FAMILY INCOME DEFICIT
0.49
INEQUALITY / GINI INDEX
905
TOTAL POPULATION
469
MALE POPULATION
436
FEMALE POPULATION
107.57
MALES / 100 FEMALES
92.96
FEMALES / 100 MALES
61.9
MEDIAN AGE
2.3
AVG FAMILY SIZE
1.9
AVG HOUSEHOLD SIZE
400
LABOR FORCE [ PEOPLE ]
46.8%
PERCENT IN LABOR FORCE
0.8%
UNEMPLOYMENT RATE
Income in Sunrise Beach Village
Income Overview in Sunrise Beach Village
Per Capita Income in Sunrise Beach Village is $62,831, while median incomes of families and households are $107,344 and $78,333 respectively.
| Characteristic | Number | Measure |
| Per Capita Income | 905 | $62,831 |
| Median Family Income | 333 | $107,344 |
| Mean Family Income | 333 | $142,003 |
| Median Household Income | 472 | $78,333 |
| Mean Household Income | 472 | $119,845 |
| Income Deficit | 333 | $7,183 |
| Wage / Income Gap (%) | 905 | 42.54% |
| Wage / Income Gap ($) | 905 | 57.46¢ per $1 |
| Gini / Inequality Index | 905 | 0.49 |
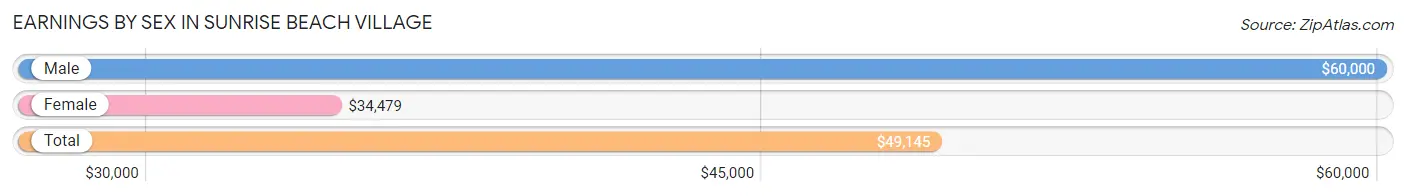
Earnings by Sex in Sunrise Beach Village
Average Earnings in Sunrise Beach Village are $49,145, $60,000 for men and $34,479 for women, a difference of 42.5%.
| Sex | Number | Average Earnings |
| Male | 274 (64.5%) | $60,000 |
| Female | 151 (35.5%) | $34,479 |
| Total | 425 (100.0%) | $49,145 |
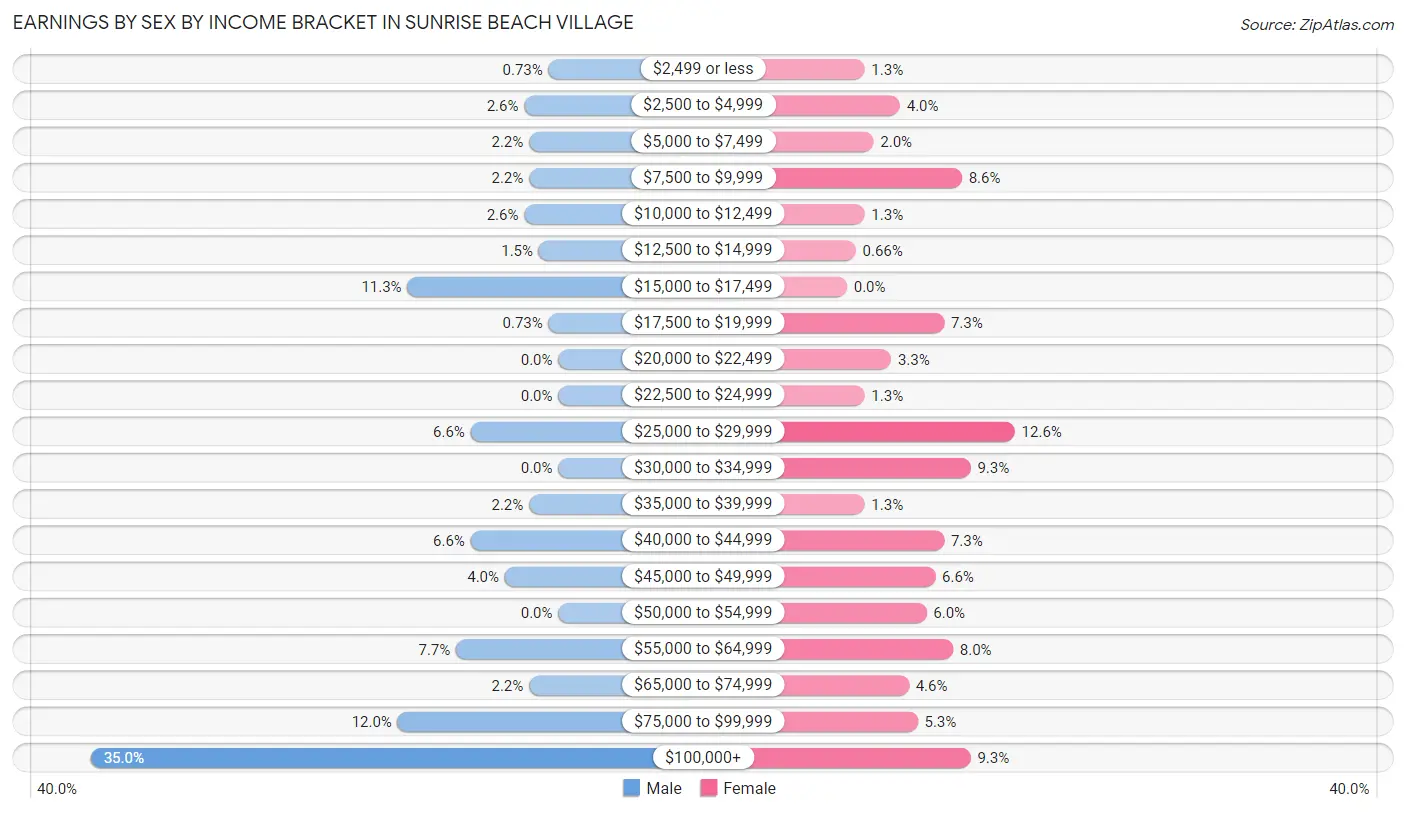
Earnings by Sex by Income Bracket in Sunrise Beach Village
The most common earnings brackets in Sunrise Beach Village are $100,000+ for men (96 | 35.0%) and $25,000 to $29,999 for women (19 | 12.6%).
| Income | Male | Female |
| $2,499 or less | 2 (0.7%) | 2 (1.3%) |
| $2,500 to $4,999 | 7 (2.5%) | 6 (4.0%) |
| $5,000 to $7,499 | 6 (2.2%) | 3 (2.0%) |
| $7,500 to $9,999 | 6 (2.2%) | 13 (8.6%) |
| $10,000 to $12,499 | 7 (2.5%) | 2 (1.3%) |
| $12,500 to $14,999 | 4 (1.5%) | 1 (0.7%) |
| $15,000 to $17,499 | 31 (11.3%) | 0 (0.0%) |
| $17,500 to $19,999 | 2 (0.7%) | 11 (7.3%) |
| $20,000 to $22,499 | 0 (0.0%) | 5 (3.3%) |
| $22,500 to $24,999 | 0 (0.0%) | 2 (1.3%) |
| $25,000 to $29,999 | 18 (6.6%) | 19 (12.6%) |
| $30,000 to $34,999 | 0 (0.0%) | 14 (9.3%) |
| $35,000 to $39,999 | 6 (2.2%) | 2 (1.3%) |
| $40,000 to $44,999 | 18 (6.6%) | 11 (7.3%) |
| $45,000 to $49,999 | 11 (4.0%) | 10 (6.6%) |
| $50,000 to $54,999 | 0 (0.0%) | 9 (6.0%) |
| $55,000 to $64,999 | 21 (7.7%) | 12 (8.0%) |
| $65,000 to $74,999 | 6 (2.2%) | 7 (4.6%) |
| $75,000 to $99,999 | 33 (12.0%) | 8 (5.3%) |
| $100,000+ | 96 (35.0%) | 14 (9.3%) |
| Total | 274 (100.0%) | 151 (100.0%) |
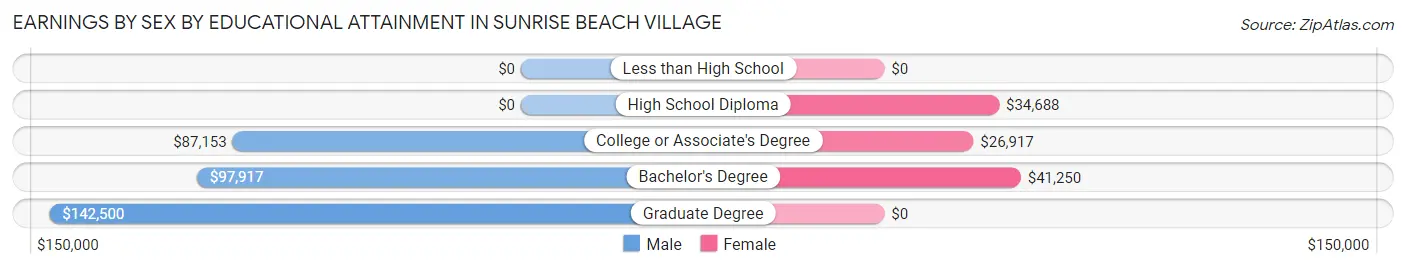
Earnings by Sex by Educational Attainment in Sunrise Beach Village
Average earnings in Sunrise Beach Village are $79,375 for men and $35,000 for women, a difference of 55.9%. Men with an educational attainment of graduate degree enjoy the highest average annual earnings of $142,500, while those with college or associate's degree education earn the least with $87,153. Women with an educational attainment of bachelor's degree earn the most with the average annual earnings of $41,250, while those with college or associate's degree education have the smallest earnings of $26,917.
| Educational Attainment | Male Income | Female Income |
| Less than High School | - | - |
| High School Diploma | - | - |
| College or Associate's Degree | $87,153 | $26,917 |
| Bachelor's Degree | $97,917 | $41,250 |
| Graduate Degree | $142,500 | $0 |
| Total | $79,375 | $35,000 |
Family Income in Sunrise Beach Village
Family Income Brackets in Sunrise Beach Village
According to the Sunrise Beach Village family income data, there are 75 families falling into the $100,000 to $149,999 income range, which is the most common income bracket and makes up 22.5% of all families. Conversely, the $10,000 to $14,999 income bracket is the least frequent group with only 1 families (0.3%) belonging to this category.
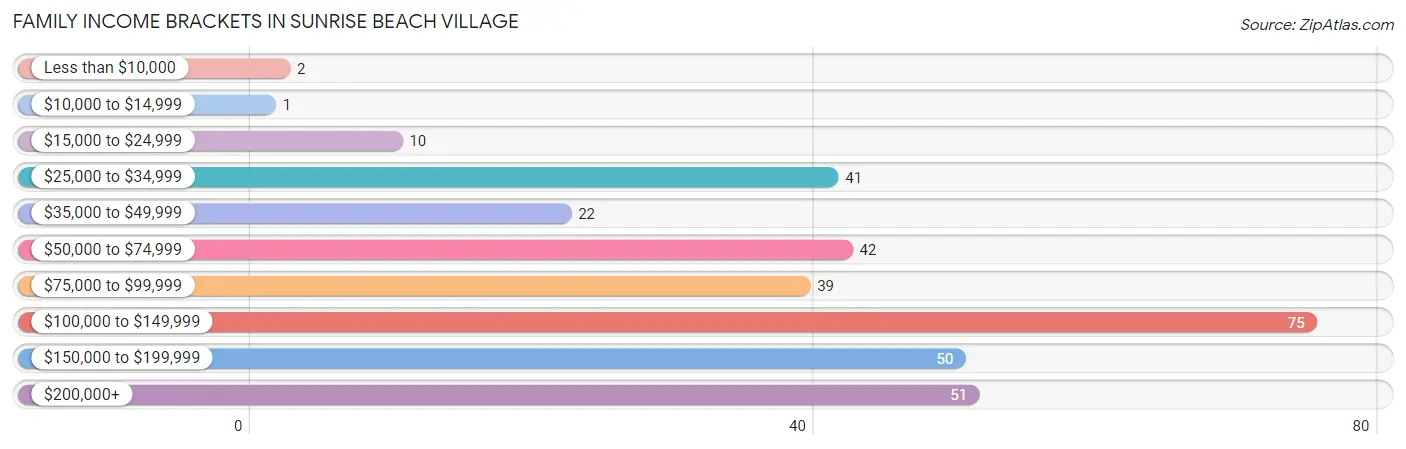
| Income Bracket | # Families | % Families |
| Less than $10,000 | 2 | 0.6% |
| $10,000 to $14,999 | 1 | 0.3% |
| $15,000 to $24,999 | 10 | 3.0% |
| $25,000 to $34,999 | 41 | 12.3% |
| $35,000 to $49,999 | 22 | 6.6% |
| $50,000 to $74,999 | 42 | 12.6% |
| $75,000 to $99,999 | 39 | 11.7% |
| $100,000 to $149,999 | 75 | 22.5% |
| $150,000 to $199,999 | 50 | 15.0% |
| $200,000+ | 51 | 15.3% |
Family Income by Famaliy Size in Sunrise Beach Village
4-person families (8 | 2.4%) account for the highest median family income in Sunrise Beach Village with $196,250 per family, while 4-person families (8 | 2.4%) have the highest median income of $49,062 per family member.
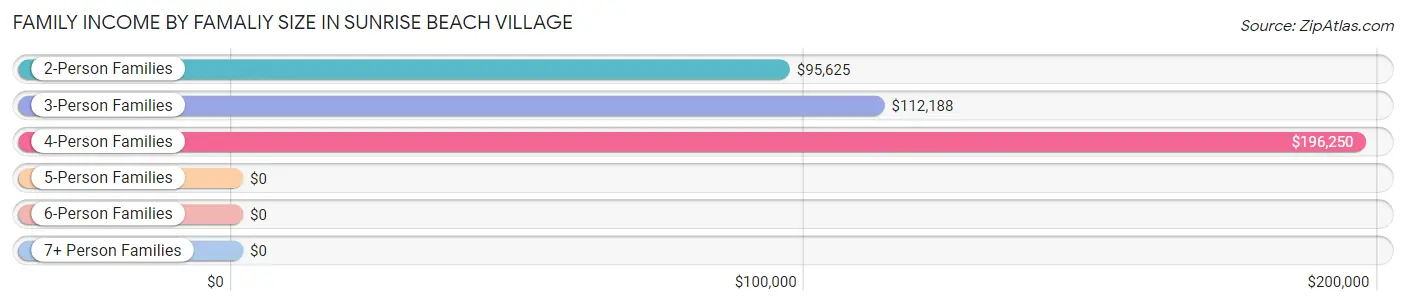
| Income Bracket | # Families | Median Income |
| 2-Person Families | 275 (82.6%) | $95,625 |
| 3-Person Families | 45 (13.5%) | $112,188 |
| 4-Person Families | 8 (2.4%) | $196,250 |
| 5-Person Families | 2 (0.6%) | $0 |
| 6-Person Families | 0 (0.0%) | $0 |
| 7+ Person Families | 3 (0.9%) | $0 |
| Total | 333 (100.0%) | $107,344 |
Family Income by Number of Earners in Sunrise Beach Village
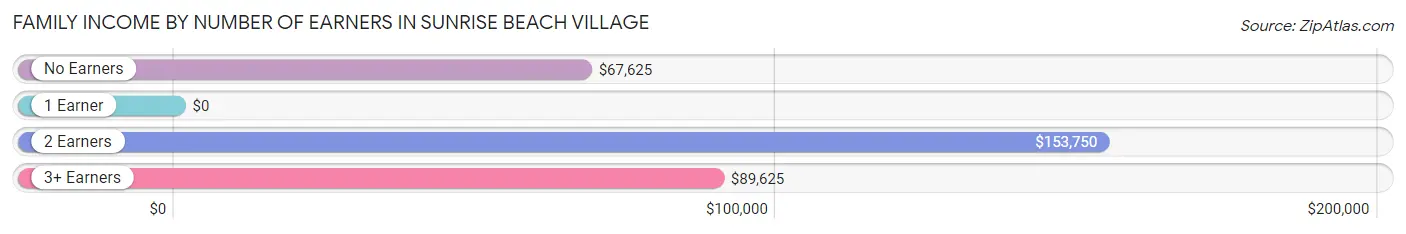
| Number of Earners | # Families | Median Income |
| No Earners | 99 (29.7%) | $67,625 |
| 1 Earner | 128 (38.4%) | $0 |
| 2 Earners | 89 (26.7%) | $153,750 |
| 3+ Earners | 17 (5.1%) | $89,625 |
| Total | 333 (100.0%) | $107,344 |
Household Income in Sunrise Beach Village
Household Income Brackets in Sunrise Beach Village
With 81 households falling in the category, the $100,000 to $149,999 income range is the most frequent in Sunrise Beach Village, accounting for 17.2% of all households. In contrast, only 6 households (1.3%) fall into the $10,000 to $14,999 income bracket, making it the least populous group.
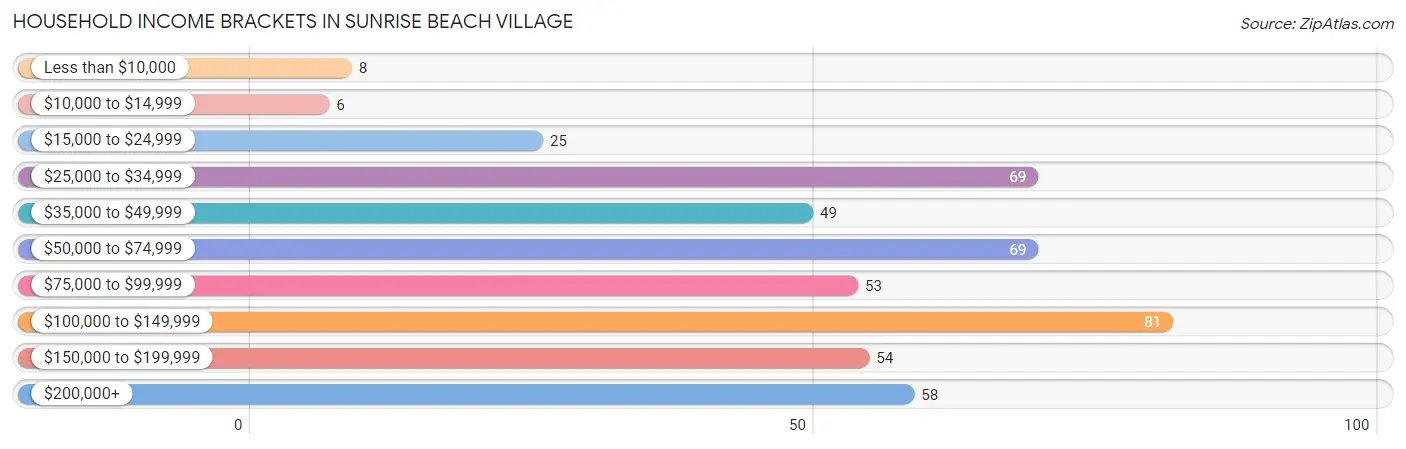
| Income Bracket | # Households | % Households |
| Less than $10,000 | 8 | 1.7% |
| $10,000 to $14,999 | 6 | 1.3% |
| $15,000 to $24,999 | 25 | 5.3% |
| $25,000 to $34,999 | 69 | 14.6% |
| $35,000 to $49,999 | 49 | 10.4% |
| $50,000 to $74,999 | 69 | 14.6% |
| $75,000 to $99,999 | 53 | 11.2% |
| $100,000 to $149,999 | 81 | 17.2% |
| $150,000 to $199,999 | 54 | 11.4% |
| $200,000+ | 58 | 12.3% |
Household Income by Householder Age in Sunrise Beach Village
The median household income in Sunrise Beach Village is $78,333, with the highest median household income of $123,125 found in the 45 to 64 years age bracket for the primary householder. A total of 197 households (41.7%) fall into this category. Meanwhile, the 15 to 24 years age bracket for the primary householder has the lowest median household income of $0, with 3 households (0.6%) in this group.
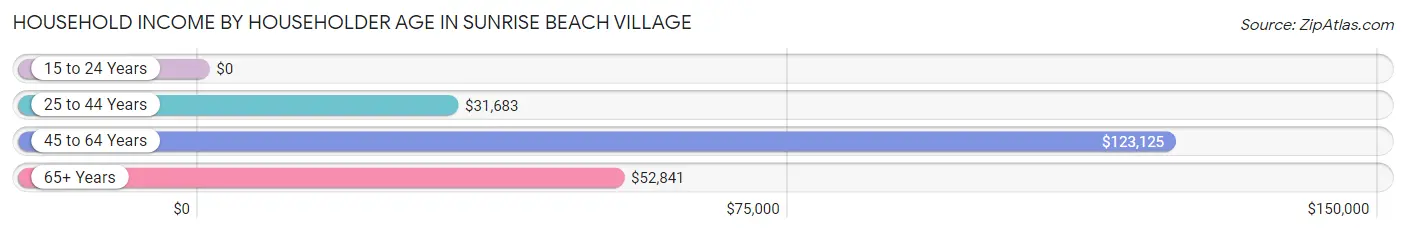
| Income Bracket | # Households | Median Income |
| 15 to 24 Years | 3 (0.6%) | $0 |
| 25 to 44 Years | 41 (8.7%) | $31,683 |
| 45 to 64 Years | 197 (41.7%) | $123,125 |
| 65+ Years | 231 (48.9%) | $52,841 |
| Total | 472 (100.0%) | $78,333 |
Poverty in Sunrise Beach Village
Income Below Poverty by Sex and Age in Sunrise Beach Village
With 1.5% poverty level for males and 3.7% for females among the residents of Sunrise Beach Village, 75 year old and over males and 75 year old and over females are the most vulnerable to poverty, with 3 males (4.1%) and 9 females (11.0%) in their respective age groups living below the poverty level.
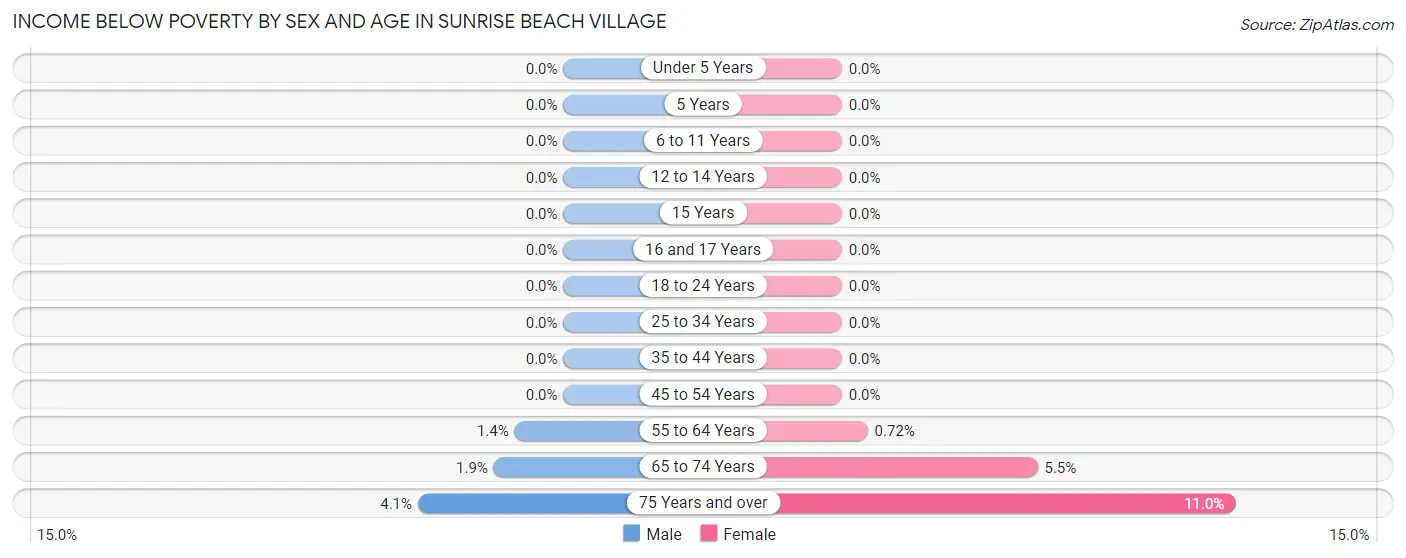
| Age Bracket | Male | Female |
| Under 5 Years | 0 (0.0%) | 0 (0.0%) |
| 5 Years | 0 (0.0%) | 0 (0.0%) |
| 6 to 11 Years | 0 (0.0%) | 0 (0.0%) |
| 12 to 14 Years | 0 (0.0%) | 0 (0.0%) |
| 15 Years | 0 (0.0%) | 0 (0.0%) |
| 16 and 17 Years | 0 (0.0%) | 0 (0.0%) |
| 18 to 24 Years | 0 (0.0%) | 0 (0.0%) |
| 25 to 34 Years | 0 (0.0%) | 0 (0.0%) |
| 35 to 44 Years | 0 (0.0%) | 0 (0.0%) |
| 45 to 54 Years | 0 (0.0%) | 0 (0.0%) |
| 55 to 64 Years | 2 (1.4%) | 1 (0.7%) |
| 65 to 74 Years | 2 (1.9%) | 6 (5.4%) |
| 75 Years and over | 3 (4.1%) | 9 (11.0%) |
| Total | 7 (1.5%) | 16 (3.7%) |
Income Above Poverty by Sex and Age in Sunrise Beach Village
According to the poverty statistics in Sunrise Beach Village, males aged 6 to 11 years and females aged under 5 years are the age groups that are most secure financially, with 100.0% of males and 100.0% of females in these age groups living above the poverty line.
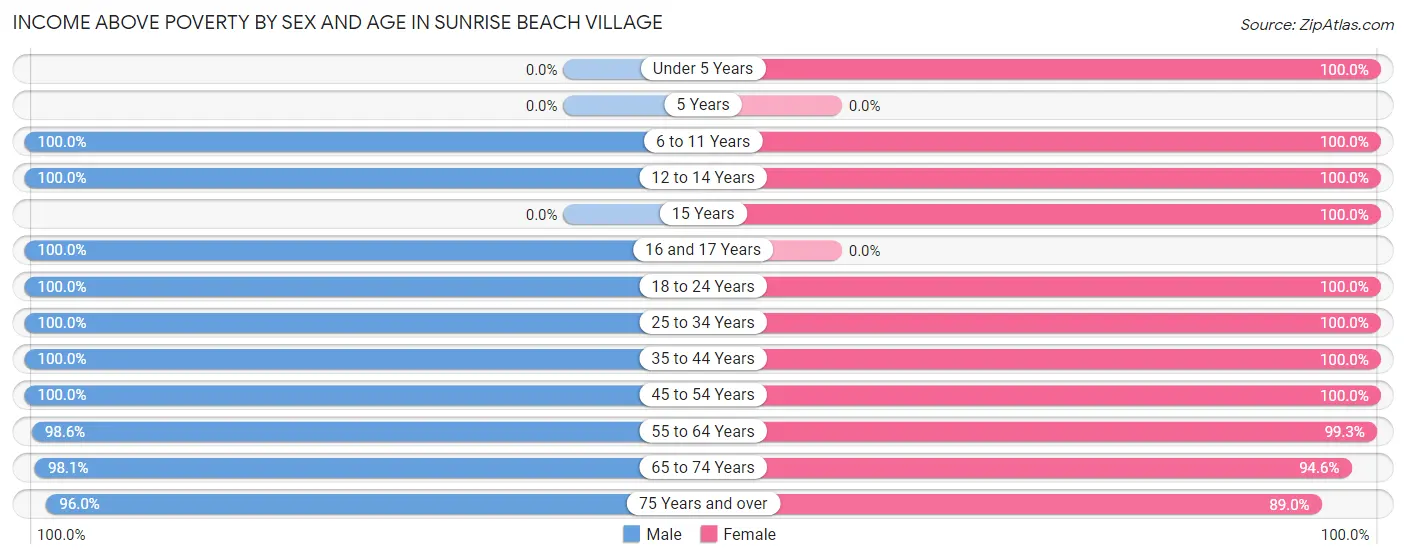
| Age Bracket | Male | Female |
| Under 5 Years | 0 (0.0%) | 11 (100.0%) |
| 5 Years | 0 (0.0%) | 0 (0.0%) |
| 6 to 11 Years | 14 (100.0%) | 4 (100.0%) |
| 12 to 14 Years | 9 (100.0%) | 6 (100.0%) |
| 15 Years | 0 (0.0%) | 7 (100.0%) |
| 16 and 17 Years | 11 (100.0%) | 0 (0.0%) |
| 18 to 24 Years | 19 (100.0%) | 5 (100.0%) |
| 25 to 34 Years | 29 (100.0%) | 24 (100.0%) |
| 35 to 44 Years | 12 (100.0%) | 15 (100.0%) |
| 45 to 54 Years | 51 (100.0%) | 33 (100.0%) |
| 55 to 64 Years | 145 (98.6%) | 138 (99.3%) |
| 65 to 74 Years | 101 (98.1%) | 104 (94.6%) |
| 75 Years and over | 71 (96.0%) | 73 (89.0%) |
| Total | 462 (98.5%) | 420 (96.3%) |
Income Below Poverty Among Married-Couple Families in Sunrise Beach Village
The poverty statistics for married-couple families in Sunrise Beach Village show that 2.1% or 6 of the total 286 families live below the poverty line. Families with no children have the highest poverty rate of 2.3%, comprising of 6 families. On the other hand, families with 1 or 2 children have the lowest poverty rate of 0.0%, which includes 0 families.
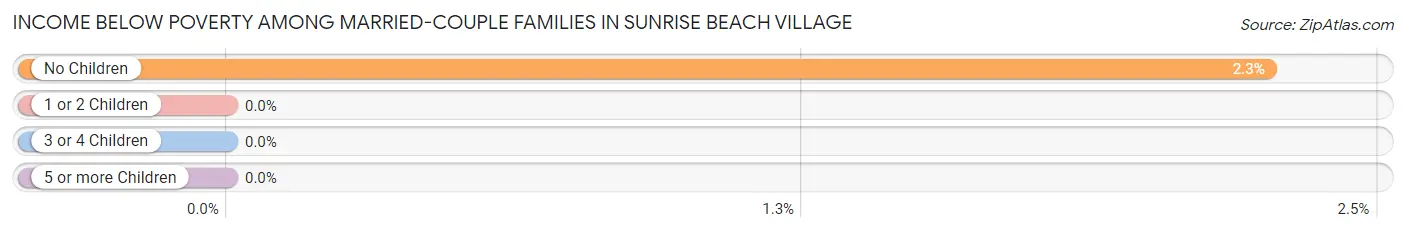
| Children | Above Poverty | Below Poverty |
| No Children | 260 (97.7%) | 6 (2.3%) |
| 1 or 2 Children | 17 (100.0%) | 0 (0.0%) |
| 3 or 4 Children | 0 (0.0%) | 0 (0.0%) |
| 5 or more Children | 3 (100.0%) | 0 (0.0%) |
| Total | 280 (97.9%) | 6 (2.1%) |
Income Below Poverty Among Single-Parent Households in Sunrise Beach Village
| Children | Single Father | Single Mother |
| No Children | 0 (0.0%) | 0 (0.0%) |
| 1 or 2 Children | 0 (0.0%) | 0 (0.0%) |
| 3 or 4 Children | 0 (0.0%) | 0 (0.0%) |
| 5 or more Children | 0 (0.0%) | 0 (0.0%) |
| Total | 0 (0.0%) | 0 (0.0%) |
Income Below Poverty Among Married-Couple vs Single-Parent Households in Sunrise Beach Village
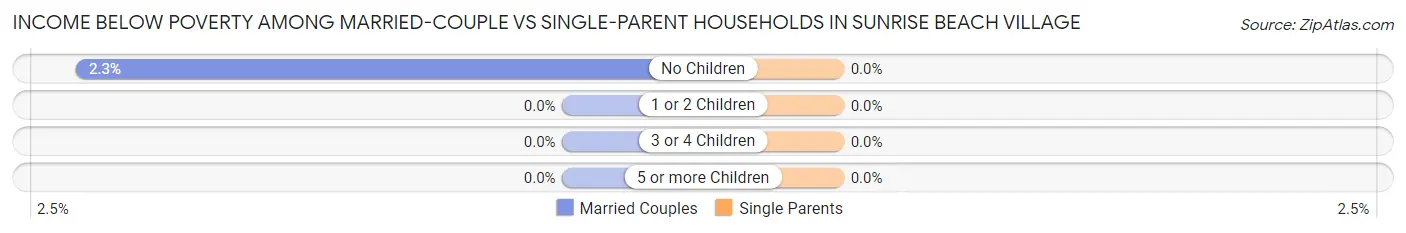
| Children | Married-Couple Families | Single-Parent Households |
| No Children | 6 (2.3%) | 0 (0.0%) |
| 1 or 2 Children | 0 (0.0%) | 0 (0.0%) |
| 3 or 4 Children | 0 (0.0%) | 0 (0.0%) |
| 5 or more Children | 0 (0.0%) | 0 (0.0%) |
| Total | 6 (2.1%) | 0 (0.0%) |
Race in Sunrise Beach Village
The most populous races in Sunrise Beach Village are White / Caucasian (783 | 86.5%), Some other Race (63 | 7.0%), and Black / African American (38 | 4.2%).
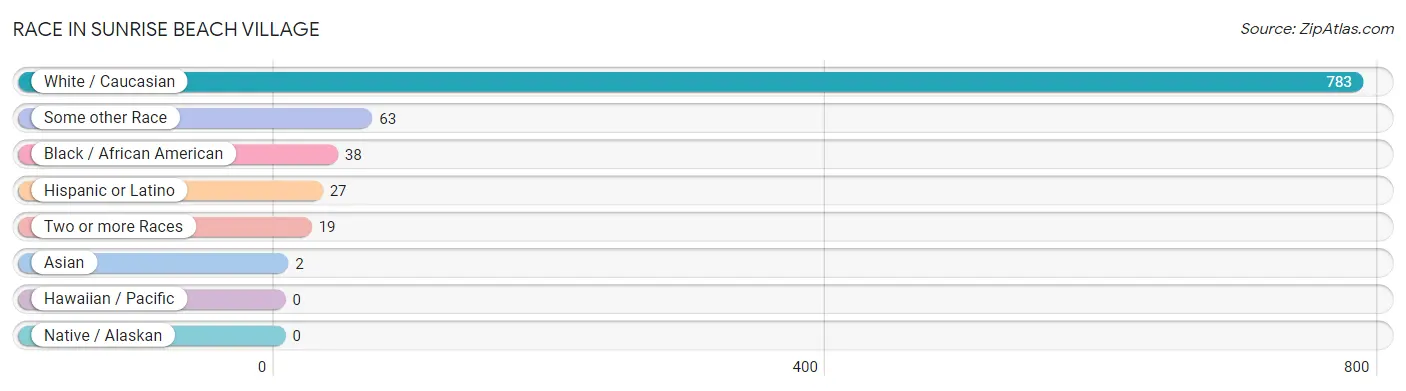
| Race | # Population | % Population |
| Asian | 2 | 0.2% |
| Black / African American | 38 | 4.2% |
| Hawaiian / Pacific | 0 | 0.0% |
| Hispanic or Latino | 27 | 3.0% |
| Native / Alaskan | 0 | 0.0% |
| White / Caucasian | 783 | 86.5% |
| Two or more Races | 19 | 2.1% |
| Some other Race | 63 | 7.0% |
| Total | 905 | 100.0% |
Ancestry in Sunrise Beach Village
The most populous ancestries reported in Sunrise Beach Village are German (164 | 18.1%), English (151 | 16.7%), Irish (92 | 10.2%), American (91 | 10.1%), and European (59 | 6.5%), together accounting for 61.6% of all Sunrise Beach Village residents.
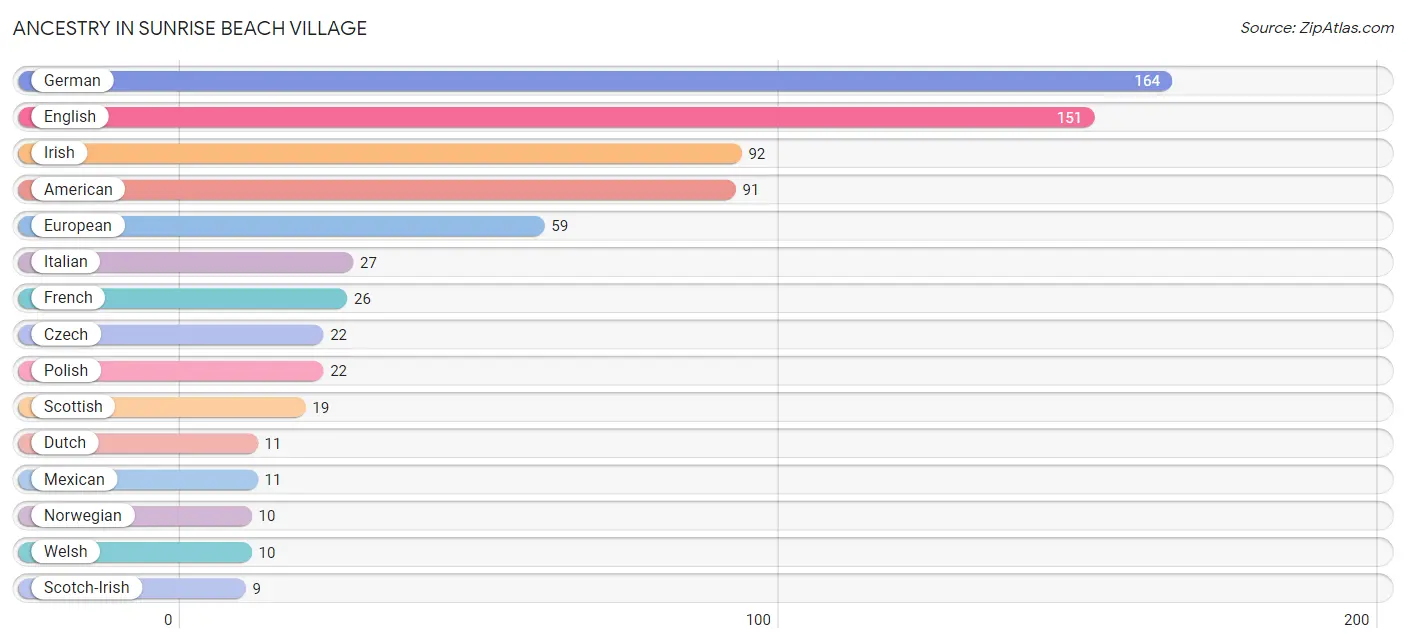
| Ancestry | # Population | % Population |
| American | 91 | 10.1% |
| Arab | 3 | 0.3% |
| Australian | 2 | 0.2% |
| Belgian | 2 | 0.2% |
| British | 5 | 0.5% |
| Burmese | 2 | 0.2% |
| Cherokee | 5 | 0.5% |
| Chickasaw | 1 | 0.1% |
| Czech | 22 | 2.4% |
| Danish | 2 | 0.2% |
| Dutch | 11 | 1.2% |
| Eastern European | 5 | 0.5% |
| English | 151 | 16.7% |
| European | 59 | 6.5% |
| French | 26 | 2.9% |
| French Canadian | 2 | 0.2% |
| German | 164 | 18.1% |
| Greek | 6 | 0.7% |
| Irish | 92 | 10.2% |
| Italian | 27 | 3.0% |
| Lebanese | 3 | 0.3% |
| Lithuanian | 7 | 0.8% |
| Mexican | 11 | 1.2% |
| Nigerian | 4 | 0.4% |
| Northern European | 2 | 0.2% |
| Norwegian | 10 | 1.1% |
| Osage | 1 | 0.1% |
| Polish | 22 | 2.4% |
| Portuguese | 3 | 0.3% |
| Puerto Rican | 7 | 0.8% |
| Russian | 2 | 0.2% |
| Scandinavian | 3 | 0.3% |
| Scotch-Irish | 9 | 1.0% |
| Scottish | 19 | 2.1% |
| Slovak | 3 | 0.3% |
| Spaniard | 2 | 0.2% |
| Spanish | 4 | 0.4% |
| Subsaharan African | 4 | 0.4% |
| Swedish | 9 | 1.0% |
| Swiss | 7 | 0.8% |
| Welsh | 10 | 1.1% | View All 41 Rows |
Immigrants in Sunrise Beach Village
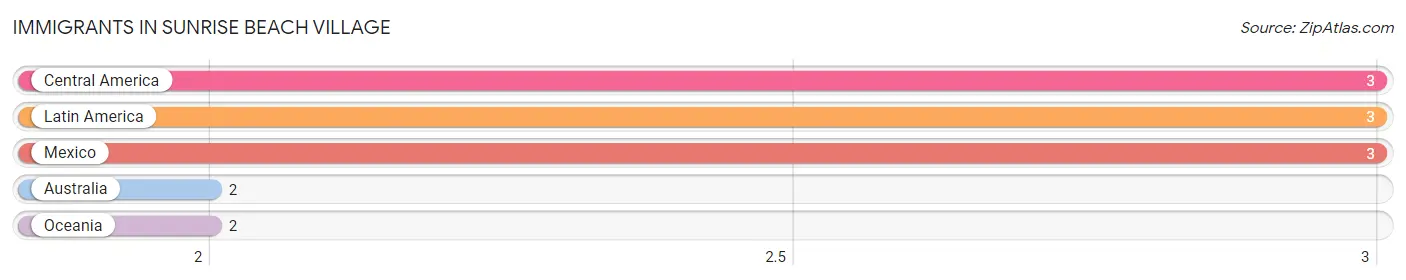
The most numerous immigrant groups reported in Sunrise Beach Village came from Central America (3 | 0.3%), Latin America (3 | 0.3%), Mexico (3 | 0.3%), Australia (2 | 0.2%), and Oceania (2 | 0.2%), together accounting for 1.4% of all Sunrise Beach Village residents.
| Immigration Origin | # Population | % Population |
| Australia | 2 | 0.2% |
| Central America | 3 | 0.3% |
| Latin America | 3 | 0.3% |
| Mexico | 3 | 0.3% |
| Oceania | 2 | 0.2% | View All 5 Rows |
Sex and Age in Sunrise Beach Village
Sex and Age in Sunrise Beach Village
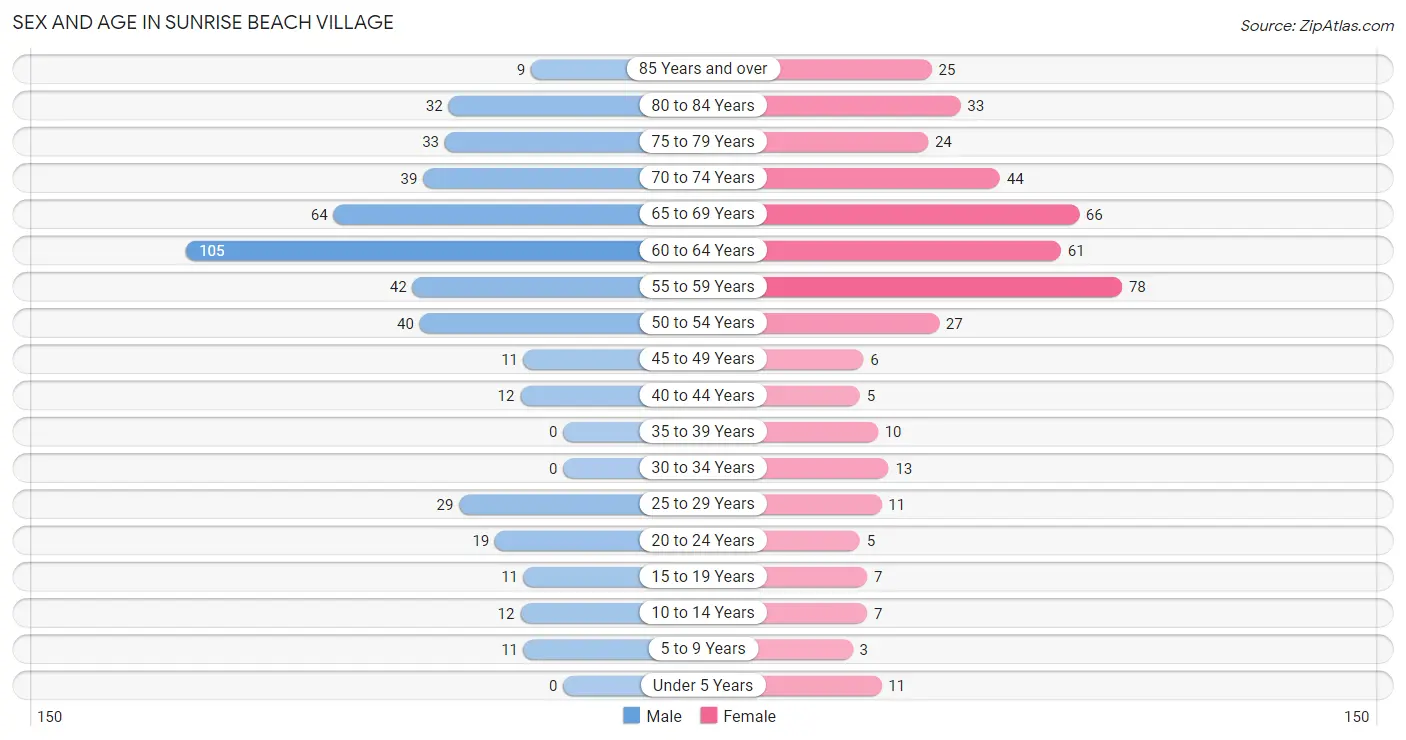
The most populous age groups in Sunrise Beach Village are 60 to 64 Years (105 | 22.4%) for men and 55 to 59 Years (78 | 17.9%) for women.
| Age Bracket | Male | Female |
| Under 5 Years | 0 (0.0%) | 11 (2.5%) |
| 5 to 9 Years | 11 (2.4%) | 3 (0.7%) |
| 10 to 14 Years | 12 (2.6%) | 7 (1.6%) |
| 15 to 19 Years | 11 (2.4%) | 7 (1.6%) |
| 20 to 24 Years | 19 (4.1%) | 5 (1.1%) |
| 25 to 29 Years | 29 (6.2%) | 11 (2.5%) |
| 30 to 34 Years | 0 (0.0%) | 13 (3.0%) |
| 35 to 39 Years | 0 (0.0%) | 10 (2.3%) |
| 40 to 44 Years | 12 (2.6%) | 5 (1.1%) |
| 45 to 49 Years | 11 (2.4%) | 6 (1.4%) |
| 50 to 54 Years | 40 (8.5%) | 27 (6.2%) |
| 55 to 59 Years | 42 (9.0%) | 78 (17.9%) |
| 60 to 64 Years | 105 (22.4%) | 61 (14.0%) |
| 65 to 69 Years | 64 (13.7%) | 66 (15.1%) |
| 70 to 74 Years | 39 (8.3%) | 44 (10.1%) |
| 75 to 79 Years | 33 (7.0%) | 24 (5.5%) |
| 80 to 84 Years | 32 (6.8%) | 33 (7.6%) |
| 85 Years and over | 9 (1.9%) | 25 (5.7%) |
| Total | 469 (100.0%) | 436 (100.0%) |
Families and Households in Sunrise Beach Village
Median Family Size in Sunrise Beach Village
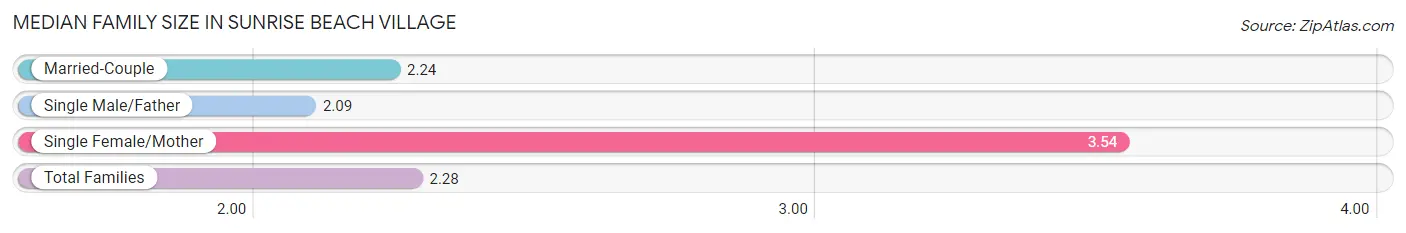
The median family size in Sunrise Beach Village is 2.28 persons per family, with single female/mother families (13 | 3.9%) accounting for the largest median family size of 3.54 persons per family. On the other hand, single male/father families (34 | 10.2%) represent the smallest median family size with 2.09 persons per family.
| Family Type | # Families | Family Size |
| Married-Couple | 286 (85.9%) | 2.24 |
| Single Male/Father | 34 (10.2%) | 2.09 |
| Single Female/Mother | 13 (3.9%) | 3.54 |
| Total Families | 333 (100.0%) | 2.28 |
Median Household Size in Sunrise Beach Village
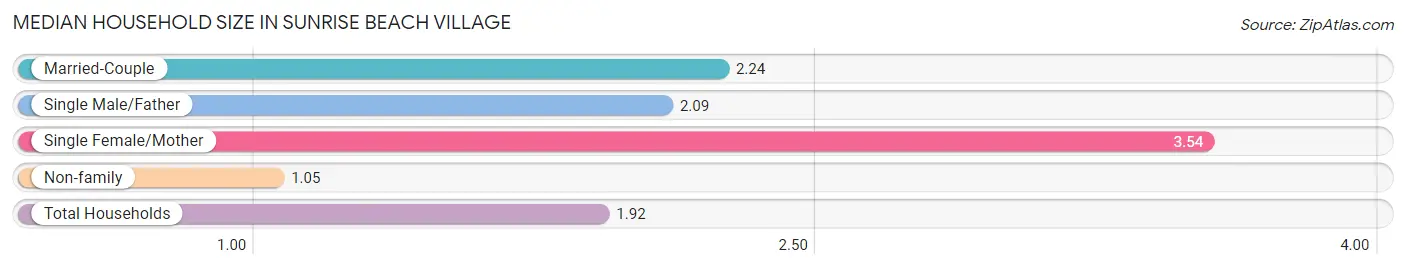
The median household size in Sunrise Beach Village is 1.92 persons per household, with single female/mother households (13 | 2.8%) accounting for the largest median household size of 3.54 persons per household. non-family households (139 | 29.4%) represent the smallest median household size with 1.05 persons per household.
| Household Type | # Households | Household Size |
| Married-Couple | 286 (60.6%) | 2.24 |
| Single Male/Father | 34 (7.2%) | 2.09 |
| Single Female/Mother | 13 (2.8%) | 3.54 |
| Non-family | 139 (29.4%) | 1.05 |
| Total Households | 472 (100.0%) | 1.92 |
Household Size by Marriage Status in Sunrise Beach Village
Out of a total of 472 households in Sunrise Beach Village, 333 (70.6%) are family households, while 139 (29.4%) are nonfamily households. The most numerous type of family households are 2-person households, comprising 275, and the most common type of nonfamily households are 1-person households, comprising 137.
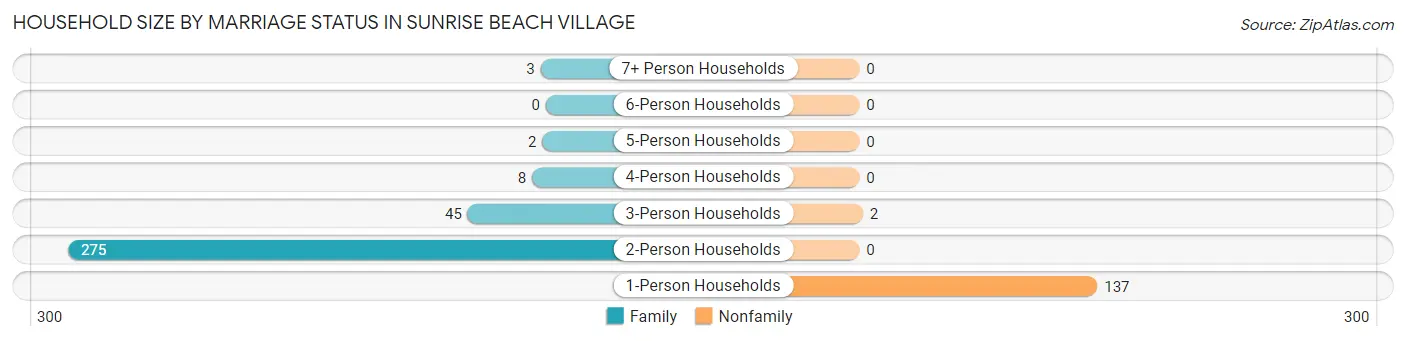
| Household Size | Family Households | Nonfamily Households |
| 1-Person Households | - | 137 (29.0%) |
| 2-Person Households | 275 (58.3%) | 0 (0.0%) |
| 3-Person Households | 45 (9.5%) | 2 (0.4%) |
| 4-Person Households | 8 (1.7%) | 0 (0.0%) |
| 5-Person Households | 2 (0.4%) | 0 (0.0%) |
| 6-Person Households | 0 (0.0%) | 0 (0.0%) |
| 7+ Person Households | 3 (0.6%) | 0 (0.0%) |
| Total | 333 (70.6%) | 139 (29.4%) |
Female Fertility in Sunrise Beach Village
Fertility by Age in Sunrise Beach Village
Average fertility rate in Sunrise Beach Village is 48.0 births per 1,000 women. Women in the age bracket of 35 to 50 years have the highest fertility rate with 115.0 births per 1,000 women. Women in the age bracket of 35 to 50 years acount for 100.0% of all women with births.
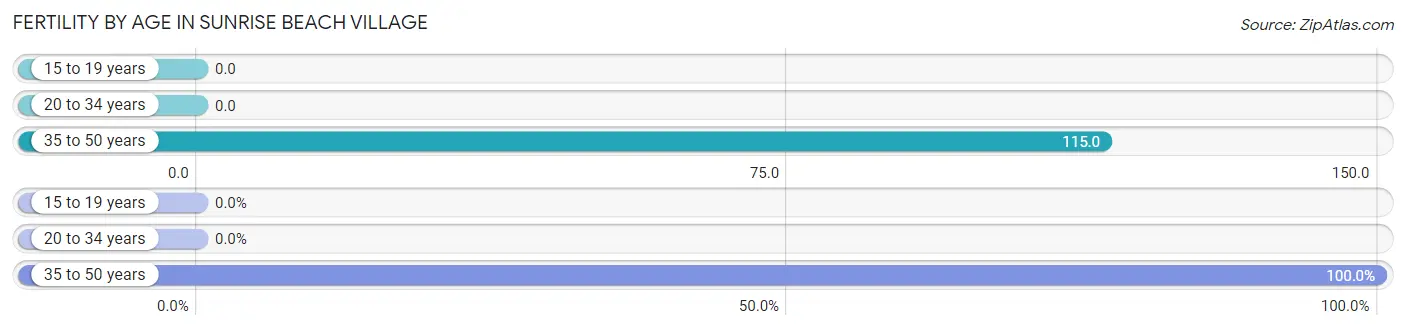
| Age Bracket | Women with Births | Births / 1,000 Women |
| 15 to 19 years | 0 (0.0%) | 0.0 |
| 20 to 34 years | 0 (0.0%) | 0.0 |
| 35 to 50 years | 3 (100.0%) | 115.0 |
| Total | 3 (100.0%) | 48.0 |
Fertility by Age by Marriage Status in Sunrise Beach Village
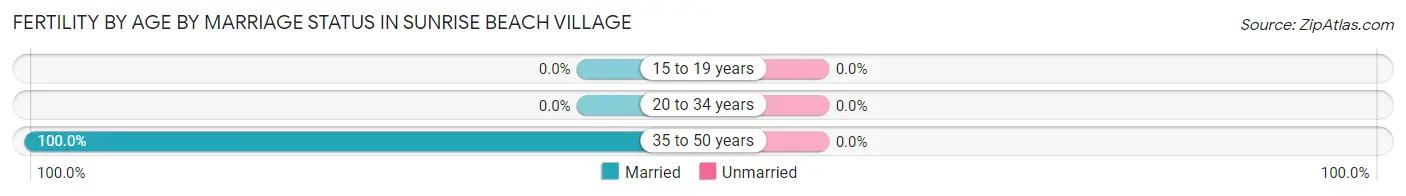
| Age Bracket | Married | Unmarried |
| 15 to 19 years | 0 (0.0%) | 0 (0.0%) |
| 20 to 34 years | 0 (0.0%) | 0 (0.0%) |
| 35 to 50 years | 3 (100.0%) | 0 (0.0%) |
| Total | 3 (100.0%) | 0 (0.0%) |
Fertility by Education in Sunrise Beach Village
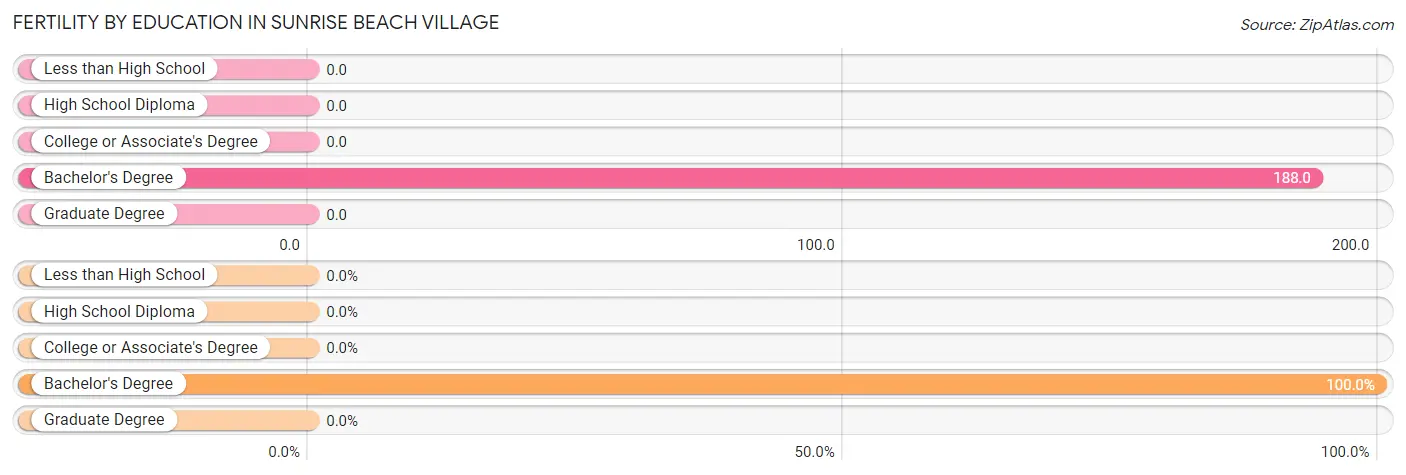
| Educational Attainment | Women with Births | Births / 1,000 Women |
| Less than High School | 0 (0.0%) | 0.0 |
| High School Diploma | 0 (0.0%) | 0.0 |
| College or Associate's Degree | 0 (0.0%) | 0.0 |
| Bachelor's Degree | 3 (100.0%) | 188.0 |
| Graduate Degree | 0 (0.0%) | 0.0 |
| Total | 3 (100.0%) | 48.0 |
Fertility by Education by Marriage Status in Sunrise Beach Village
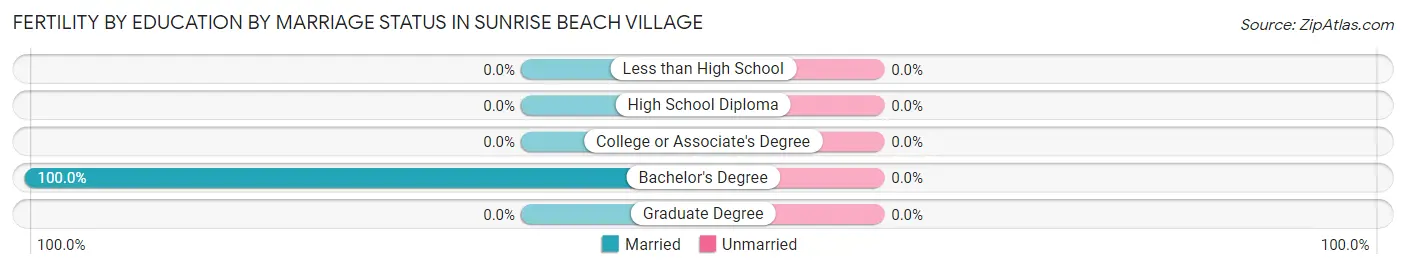
| Educational Attainment | Married | Unmarried |
| Less than High School | 0 (0.0%) | 0 (0.0%) |
| High School Diploma | 0 (0.0%) | 0 (0.0%) |
| College or Associate's Degree | 0 (0.0%) | 0 (0.0%) |
| Bachelor's Degree | 3 (100.0%) | 0 (0.0%) |
| Graduate Degree | 0 (0.0%) | 0 (0.0%) |
| Total | 3 (100.0%) | 0 (0.0%) |
Employment Characteristics in Sunrise Beach Village
Employment by Class of Employer in Sunrise Beach Village
Among the 397 employed individuals in Sunrise Beach Village, private company employees (233 | 58.7%), state government employees (50 | 12.6%), and self-employed (incorporated) (38 | 9.6%) make up the most common classes of employment.
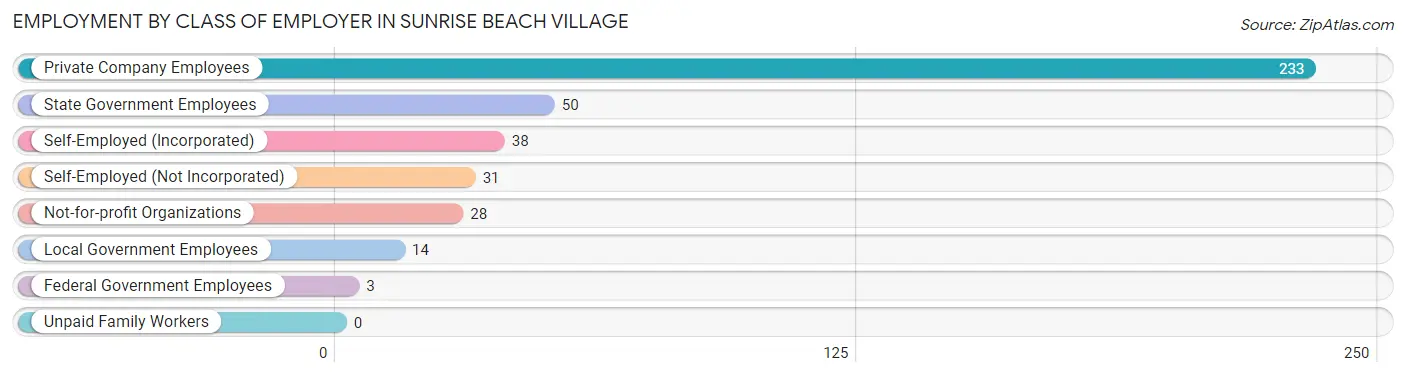
| Employer Class | # Employees | % Employees |
| Private Company Employees | 233 | 58.7% |
| Self-Employed (Incorporated) | 38 | 9.6% |
| Self-Employed (Not Incorporated) | 31 | 7.8% |
| Not-for-profit Organizations | 28 | 7.0% |
| Local Government Employees | 14 | 3.5% |
| State Government Employees | 50 | 12.6% |
| Federal Government Employees | 3 | 0.8% |
| Unpaid Family Workers | 0 | 0.0% |
| Total | 397 | 100.0% |
Employment Status by Age in Sunrise Beach Village
According to the labor force statistics for Sunrise Beach Village, out of the total population over 16 years of age (854), 46.8% or 400 individuals are in the labor force, with 0.8% or 3 of them unemployed. The age group with the highest labor force participation rate is 30 to 34 years, with 100.0% or 13 individuals in the labor force. Within the labor force, the 55 to 59 years age range has the highest percentage of unemployed individuals, with 5.4% or 3 of them being unemployed.
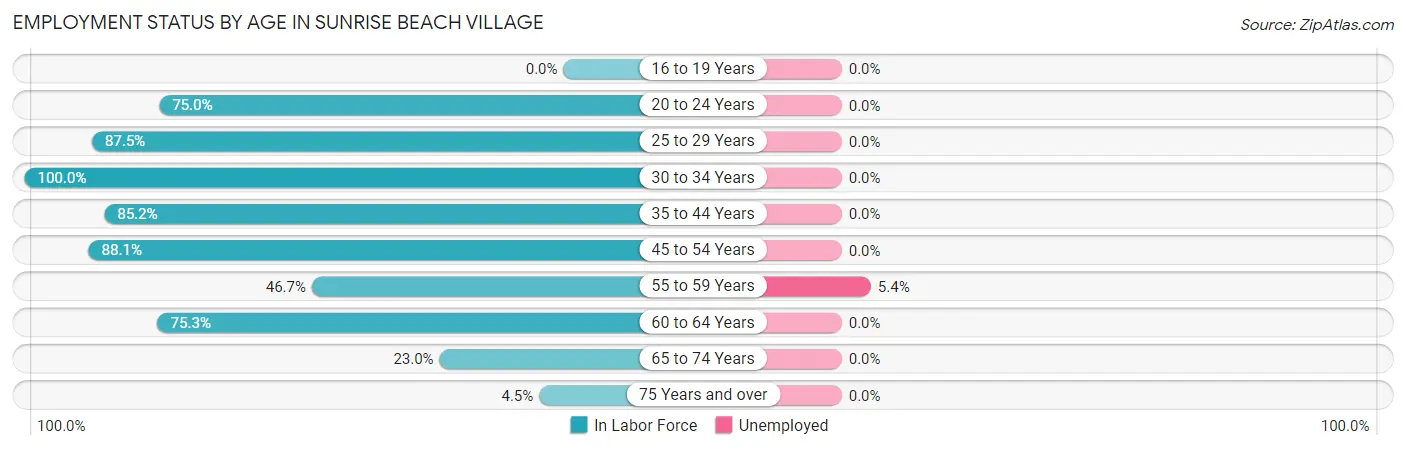
| Age Bracket | In Labor Force | Unemployed |
| 16 to 19 Years | 0 (0.0%) | 0 (0.0%) |
| 20 to 24 Years | 18 (75.0%) | 0 (0.0%) |
| 25 to 29 Years | 35 (87.5%) | 0 (0.0%) |
| 30 to 34 Years | 13 (100.0%) | 0 (0.0%) |
| 35 to 44 Years | 23 (85.2%) | 0 (0.0%) |
| 45 to 54 Years | 74 (88.1%) | 0 (0.0%) |
| 55 to 59 Years | 56 (46.7%) | 3 (5.4%) |
| 60 to 64 Years | 125 (75.3%) | 0 (0.0%) |
| 65 to 74 Years | 49 (23.0%) | 0 (0.0%) |
| 75 Years and over | 7 (4.5%) | 0 (0.0%) |
| Total | 400 (46.8%) | 3 (0.8%) |
Employment Status by Educational Attainment in Sunrise Beach Village
According to labor force statistics for Sunrise Beach Village, 72.4% of individuals (326) out of the total population between 25 and 64 years of age (450) are in the labor force, with 0.9% or 3 of them being unemployed. The group with the highest labor force participation rate are those with the educational attainment of high school diploma, with 89.0% or 105 individuals in the labor force. Within the labor force, individuals with bachelor's degree or higher education have the highest percentage of unemployment, with 2.1% or 2 of them being unemployed.
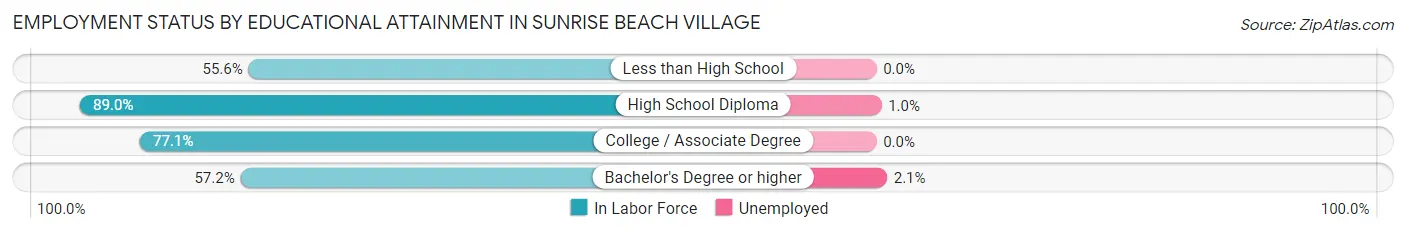
| Educational Attainment | In Labor Force | Unemployed |
| Less than High School | 5 (55.6%) | 0 (0.0%) |
| High School Diploma | 105 (89.0%) | 1 (1.0%) |
| College / Associate Degree | 121 (77.1%) | 0 (0.0%) |
| Bachelor's Degree or higher | 95 (57.2%) | 3 (2.1%) |
| Total | 326 (72.4%) | 4 (0.9%) |
Employment Occupations by Sex in Sunrise Beach Village
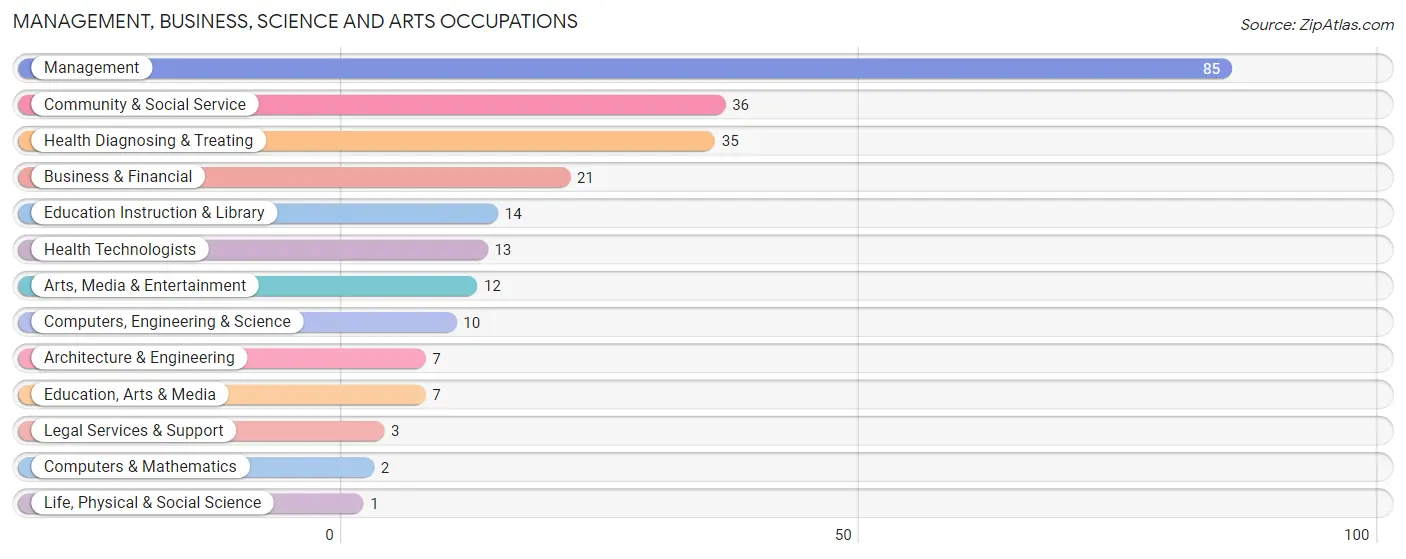
Management, Business, Science and Arts Occupations
The most common Management, Business, Science and Arts occupations in Sunrise Beach Village are Management (85 | 21.4%), Community & Social Service (36 | 9.1%), Health Diagnosing & Treating (35 | 8.8%), Business & Financial (21 | 5.3%), and Education Instruction & Library (14 | 3.5%).
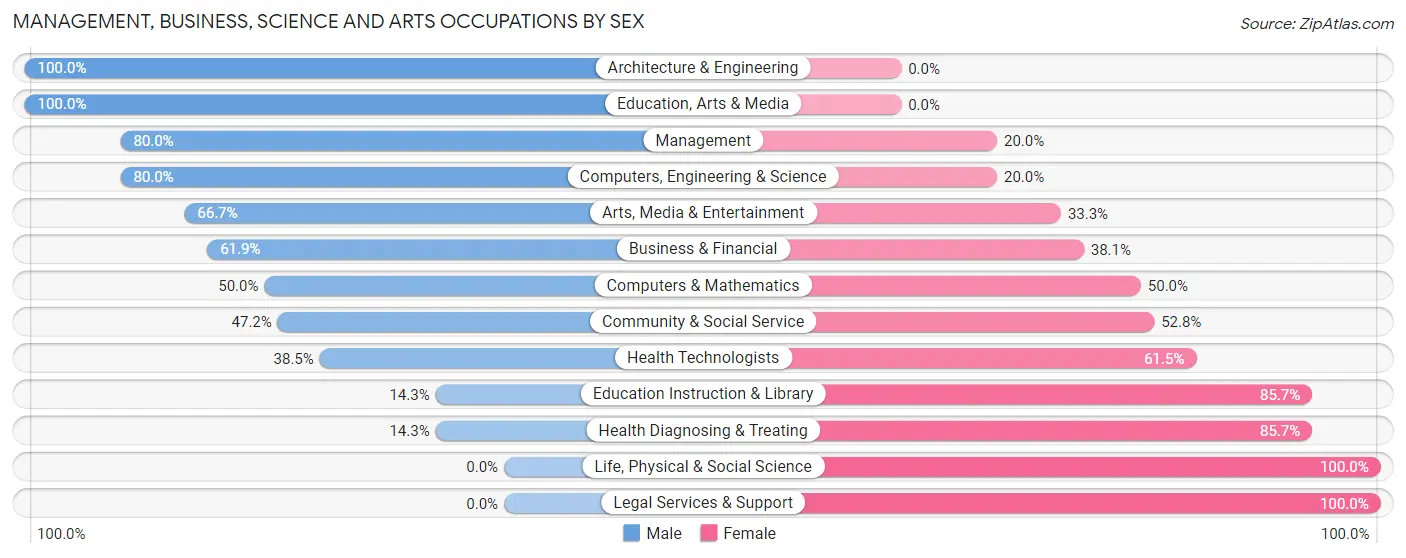
Management, Business, Science and Arts Occupations by Sex
Within the Management, Business, Science and Arts occupations in Sunrise Beach Village, the most male-oriented occupations are Architecture & Engineering (100.0%), Education, Arts & Media (100.0%), and Management (80.0%), while the most female-oriented occupations are Life, Physical & Social Science (100.0%), Legal Services & Support (100.0%), and Education Instruction & Library (85.7%).
| Occupation | Male | Female |
| Management | 68 (80.0%) | 17 (20.0%) |
| Business & Financial | 13 (61.9%) | 8 (38.1%) |
| Computers, Engineering & Science | 8 (80.0%) | 2 (20.0%) |
| Computers & Mathematics | 1 (50.0%) | 1 (50.0%) |
| Architecture & Engineering | 7 (100.0%) | 0 (0.0%) |
| Life, Physical & Social Science | 0 (0.0%) | 1 (100.0%) |
| Community & Social Service | 17 (47.2%) | 19 (52.8%) |
| Education, Arts & Media | 7 (100.0%) | 0 (0.0%) |
| Legal Services & Support | 0 (0.0%) | 3 (100.0%) |
| Education Instruction & Library | 2 (14.3%) | 12 (85.7%) |
| Arts, Media & Entertainment | 8 (66.7%) | 4 (33.3%) |
| Health Diagnosing & Treating | 5 (14.3%) | 30 (85.7%) |
| Health Technologists | 5 (38.5%) | 8 (61.5%) |
| Total (Category) | 111 (59.4%) | 76 (40.6%) |
| Total (Overall) | 264 (66.5%) | 133 (33.5%) |
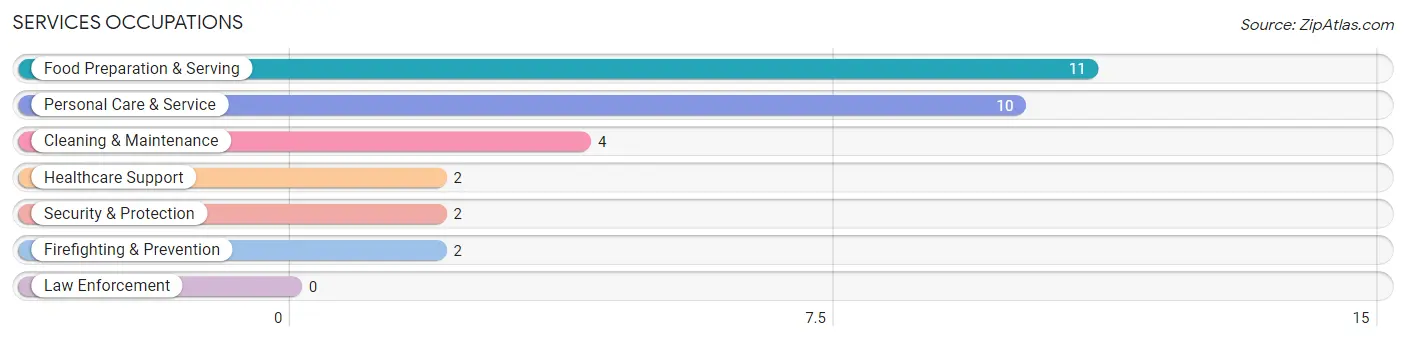
Services Occupations
The most common Services occupations in Sunrise Beach Village are Food Preparation & Serving (11 | 2.8%), Personal Care & Service (10 | 2.5%), Cleaning & Maintenance (4 | 1.0%), Healthcare Support (2 | 0.5%), and Security & Protection (2 | 0.5%).
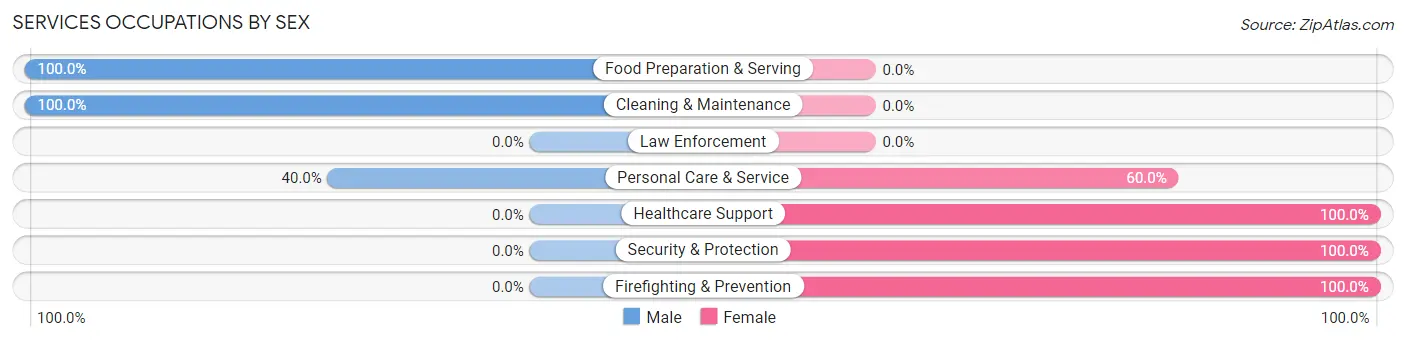
Services Occupations by Sex
Within the Services occupations in Sunrise Beach Village, the most male-oriented occupations are Food Preparation & Serving (100.0%), Cleaning & Maintenance (100.0%), and Personal Care & Service (40.0%), while the most female-oriented occupations are Healthcare Support (100.0%), Security & Protection (100.0%), and Firefighting & Prevention (100.0%).
| Occupation | Male | Female |
| Healthcare Support | 0 (0.0%) | 2 (100.0%) |
| Security & Protection | 0 (0.0%) | 2 (100.0%) |
| Firefighting & Prevention | 0 (0.0%) | 2 (100.0%) |
| Law Enforcement | 0 (0.0%) | 0 (0.0%) |
| Food Preparation & Serving | 11 (100.0%) | 0 (0.0%) |
| Cleaning & Maintenance | 4 (100.0%) | 0 (0.0%) |
| Personal Care & Service | 4 (40.0%) | 6 (60.0%) |
| Total (Category) | 19 (65.5%) | 10 (34.5%) |
| Total (Overall) | 264 (66.5%) | 133 (33.5%) |
Sales and Office Occupations
The most common Sales and Office occupations in Sunrise Beach Village are Sales & Related (42 | 10.6%), and Office & Administration (29 | 7.3%).
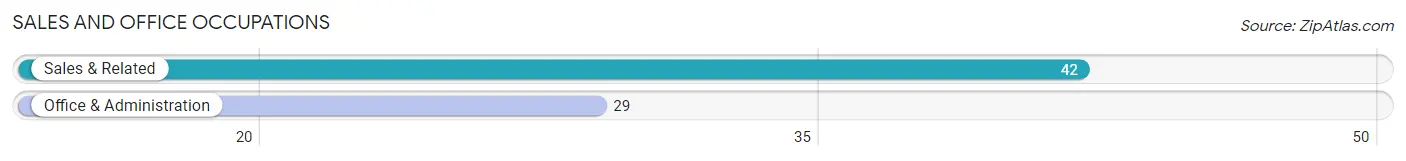
Sales and Office Occupations by Sex
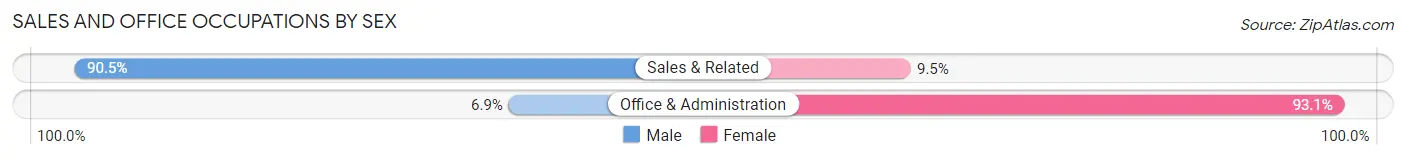
| Occupation | Male | Female |
| Sales & Related | 38 (90.5%) | 4 (9.5%) |
| Office & Administration | 2 (6.9%) | 27 (93.1%) |
| Total (Category) | 40 (56.3%) | 31 (43.7%) |
| Total (Overall) | 264 (66.5%) | 133 (33.5%) |
Natural Resources, Construction and Maintenance Occupations
The most common Natural Resources, Construction and Maintenance occupations in Sunrise Beach Village are Construction & Extraction (46 | 11.6%), Installation, Maintenance & Repair (11 | 2.8%), and Farming, Fishing & Forestry (2 | 0.5%).
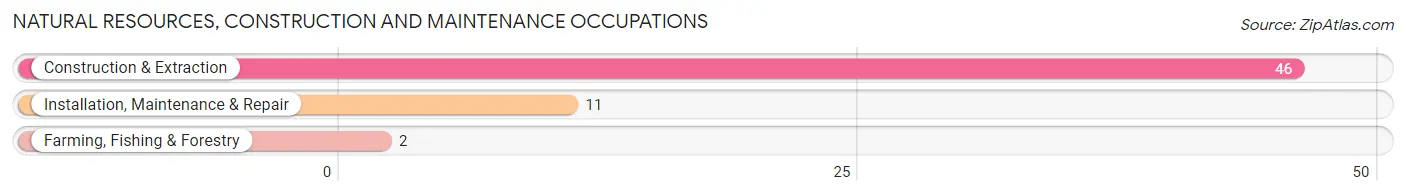
Natural Resources, Construction and Maintenance Occupations by Sex
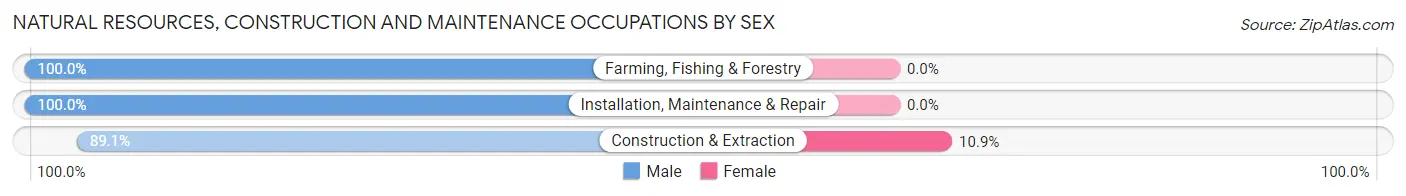
| Occupation | Male | Female |
| Farming, Fishing & Forestry | 2 (100.0%) | 0 (0.0%) |
| Construction & Extraction | 41 (89.1%) | 5 (10.9%) |
| Installation, Maintenance & Repair | 11 (100.0%) | 0 (0.0%) |
| Total (Category) | 54 (91.5%) | 5 (8.5%) |
| Total (Overall) | 264 (66.5%) | 133 (33.5%) |
Production, Transportation and Moving Occupations
The most common Production, Transportation and Moving occupations in Sunrise Beach Village are Transportation (28 | 7.0%), Production (12 | 3.0%), and Material Moving (11 | 2.8%).
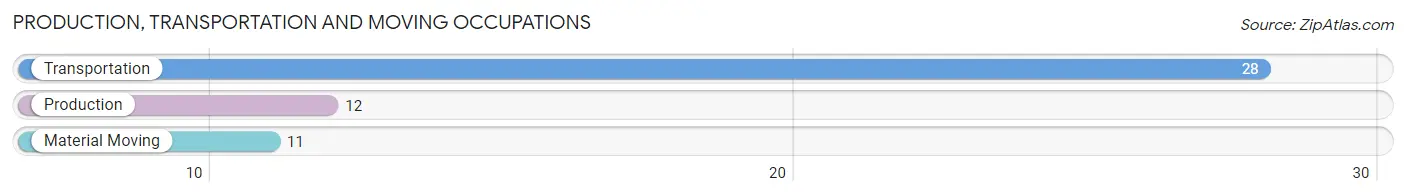
Production, Transportation and Moving Occupations by Sex
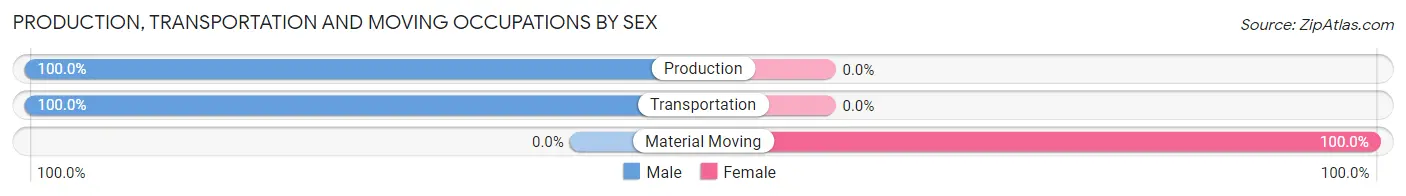
| Occupation | Male | Female |
| Production | 12 (100.0%) | 0 (0.0%) |
| Transportation | 28 (100.0%) | 0 (0.0%) |
| Material Moving | 0 (0.0%) | 11 (100.0%) |
| Total (Category) | 40 (78.4%) | 11 (21.6%) |
| Total (Overall) | 264 (66.5%) | 133 (33.5%) |
Employment Industries by Sex in Sunrise Beach Village
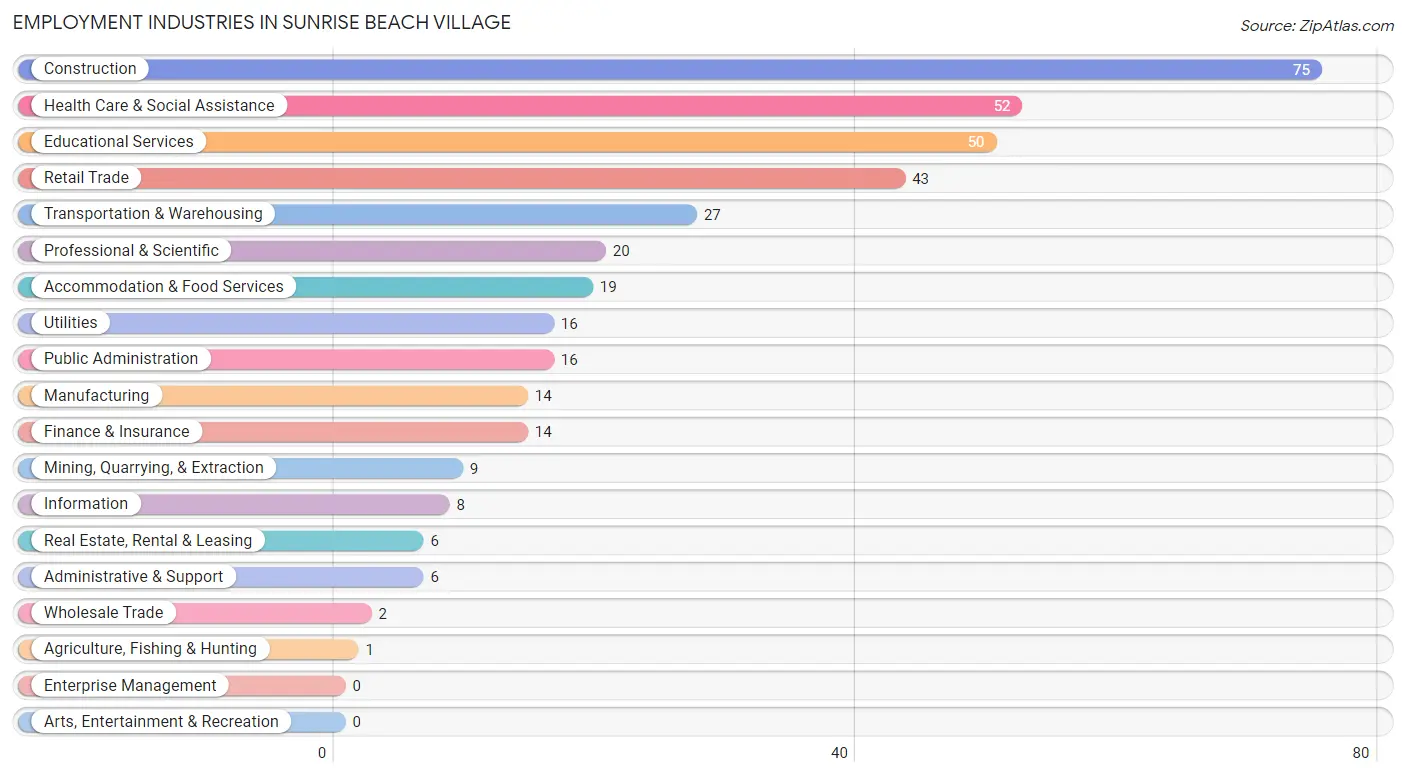
Employment Industries in Sunrise Beach Village
The major employment industries in Sunrise Beach Village include Construction (75 | 18.9%), Health Care & Social Assistance (52 | 13.1%), Educational Services (50 | 12.6%), Retail Trade (43 | 10.8%), and Transportation & Warehousing (27 | 6.8%).
Employment Industries by Sex in Sunrise Beach Village
The Sunrise Beach Village industries that see more men than women are Manufacturing (100.0%), Wholesale Trade (100.0%), and Information (100.0%), whereas the industries that tend to have a higher number of women are Agriculture, Fishing & Hunting (100.0%), Transportation & Warehousing (100.0%), and Health Care & Social Assistance (86.5%).
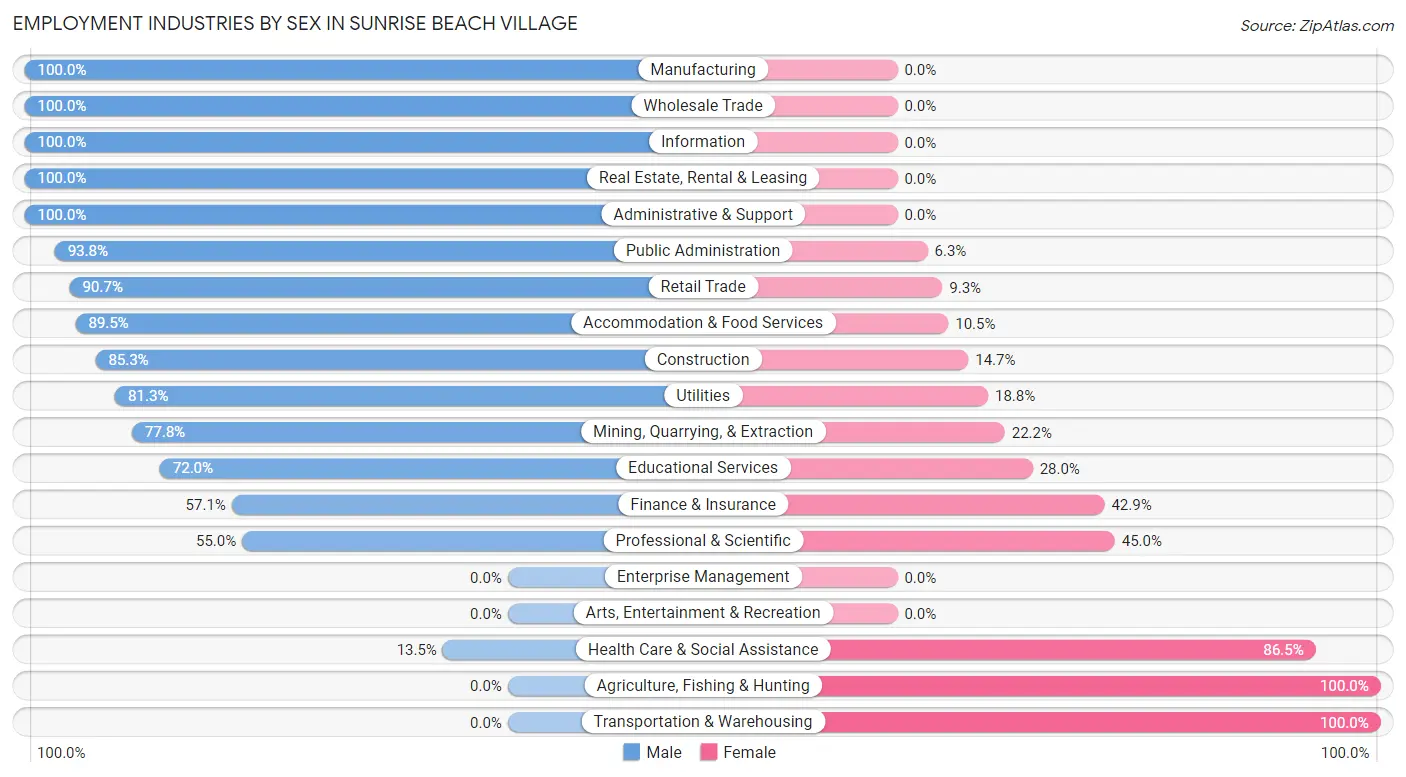
| Industry | Male | Female |
| Agriculture, Fishing & Hunting | 0 (0.0%) | 1 (100.0%) |
| Mining, Quarrying, & Extraction | 7 (77.8%) | 2 (22.2%) |
| Construction | 64 (85.3%) | 11 (14.7%) |
| Manufacturing | 14 (100.0%) | 0 (0.0%) |
| Wholesale Trade | 2 (100.0%) | 0 (0.0%) |
| Retail Trade | 39 (90.7%) | 4 (9.3%) |
| Transportation & Warehousing | 0 (0.0%) | 27 (100.0%) |
| Utilities | 13 (81.2%) | 3 (18.8%) |
| Information | 8 (100.0%) | 0 (0.0%) |
| Finance & Insurance | 8 (57.1%) | 6 (42.9%) |
| Real Estate, Rental & Leasing | 6 (100.0%) | 0 (0.0%) |
| Professional & Scientific | 11 (55.0%) | 9 (45.0%) |
| Enterprise Management | 0 (0.0%) | 0 (0.0%) |
| Administrative & Support | 6 (100.0%) | 0 (0.0%) |
| Educational Services | 36 (72.0%) | 14 (28.0%) |
| Health Care & Social Assistance | 7 (13.5%) | 45 (86.5%) |
| Arts, Entertainment & Recreation | 0 (0.0%) | 0 (0.0%) |
| Accommodation & Food Services | 17 (89.5%) | 2 (10.5%) |
| Public Administration | 15 (93.8%) | 1 (6.2%) |
| Total | 264 (66.5%) | 133 (33.5%) |
Education in Sunrise Beach Village
School Enrollment in Sunrise Beach Village
The most common levels of schooling among the 68 students in Sunrise Beach Village are high school (24 | 35.3%), college / undergraduate (17 | 25.0%), and elementary school (14 | 20.6%).
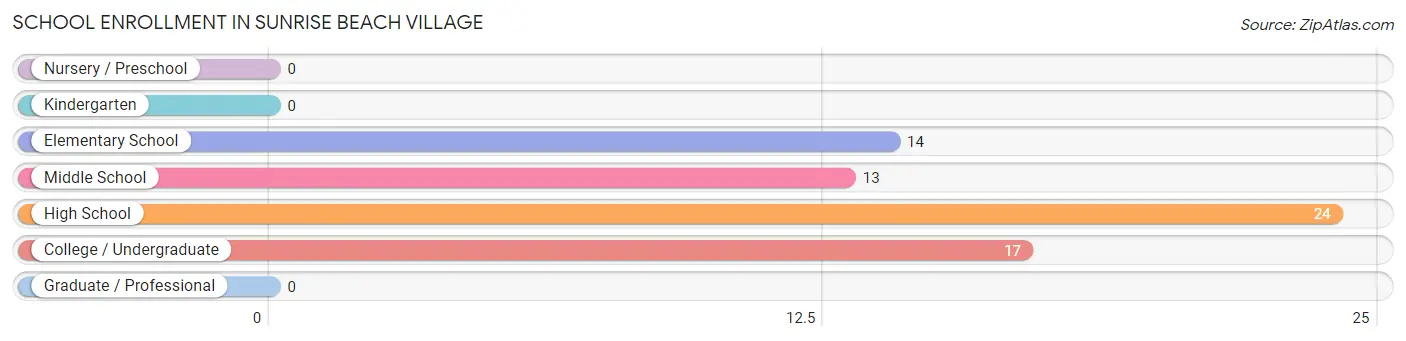
| School Level | # Students | % Students |
| Nursery / Preschool | 0 | 0.0% |
| Kindergarten | 0 | 0.0% |
| Elementary School | 14 | 20.6% |
| Middle School | 13 | 19.1% |
| High School | 24 | 35.3% |
| College / Undergraduate | 17 | 25.0% |
| Graduate / Professional | 0 | 0.0% |
| Total | 68 | 100.0% |
School Enrollment by Age by Funding Source in Sunrise Beach Village
Out of a total of 68 students who are enrolled in schools in Sunrise Beach Village, 11 (16.2%) attend a private institution, while the remaining 57 (83.8%) are enrolled in public schools. The age group of 5 to 9 year old has the highest likelihood of being enrolled in private schools, with 7 (50.0% in the age bracket) enrolled. Conversely, the age group of 10 to 14 year olds has the lowest likelihood of being enrolled in a private school, with 19 (100.0% in the age bracket) attending a public institution.
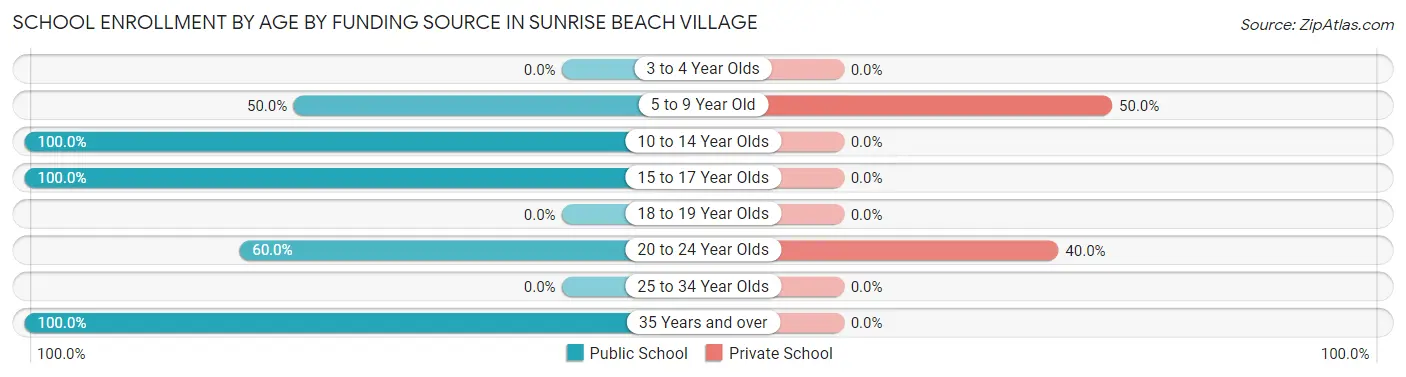
| Age Bracket | Public School | Private School |
| 3 to 4 Year Olds | 0 (0.0%) | 0 (0.0%) |
| 5 to 9 Year Old | 7 (50.0%) | 7 (50.0%) |
| 10 to 14 Year Olds | 19 (100.0%) | 0 (0.0%) |
| 15 to 17 Year Olds | 18 (100.0%) | 0 (0.0%) |
| 18 to 19 Year Olds | 0 (0.0%) | 0 (0.0%) |
| 20 to 24 Year Olds | 6 (60.0%) | 4 (40.0%) |
| 25 to 34 Year Olds | 0 (0.0%) | 0 (0.0%) |
| 35 Years and over | 7 (100.0%) | 0 (0.0%) |
| Total | 57 (83.8%) | 11 (16.2%) |
Educational Attainment by Field of Study in Sunrise Beach Village
Business (83 | 22.6%), education (58 | 15.8%), science & technology (48 | 13.0%), engineering (38 | 10.3%), and computers & mathematics (30 | 8.2%) are the most common fields of study among 368 individuals in Sunrise Beach Village who have obtained a bachelor's degree or higher.
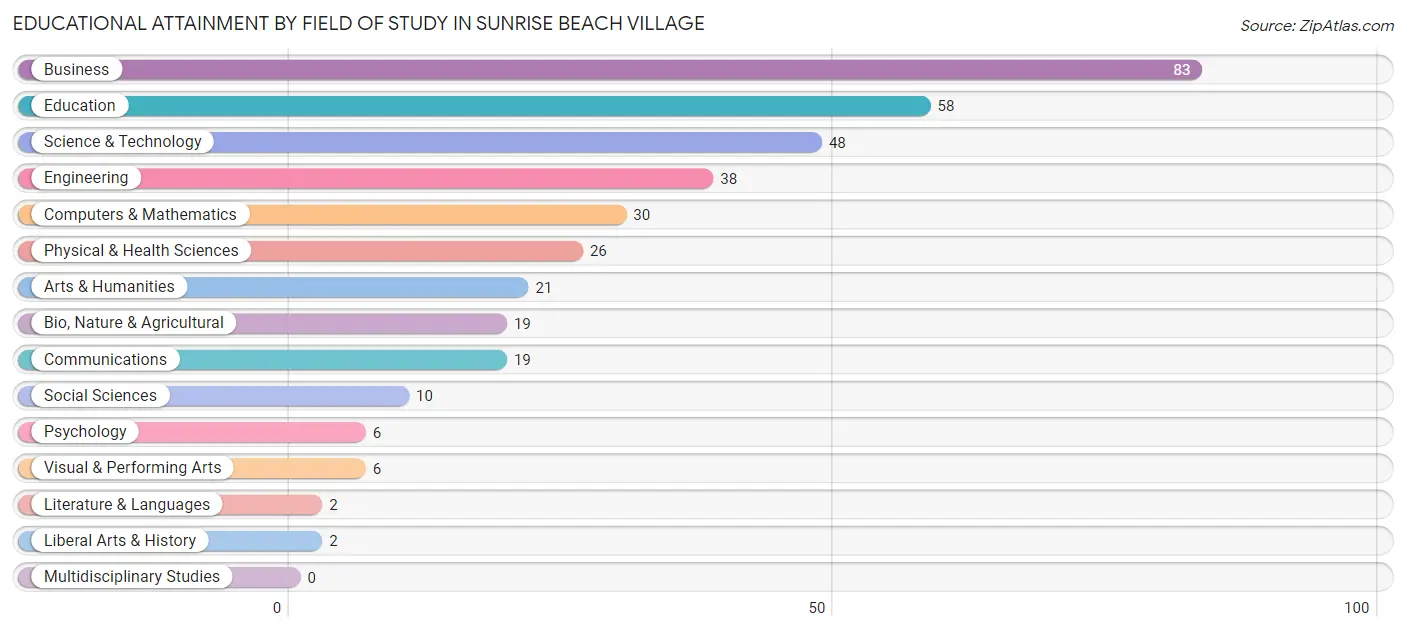
| Field of Study | # Graduates | % Graduates |
| Computers & Mathematics | 30 | 8.2% |
| Bio, Nature & Agricultural | 19 | 5.2% |
| Physical & Health Sciences | 26 | 7.1% |
| Psychology | 6 | 1.6% |
| Social Sciences | 10 | 2.7% |
| Engineering | 38 | 10.3% |
| Multidisciplinary Studies | 0 | 0.0% |
| Science & Technology | 48 | 13.0% |
| Business | 83 | 22.6% |
| Education | 58 | 15.8% |
| Literature & Languages | 2 | 0.5% |
| Liberal Arts & History | 2 | 0.5% |
| Visual & Performing Arts | 6 | 1.6% |
| Communications | 19 | 5.2% |
| Arts & Humanities | 21 | 5.7% |
| Total | 368 | 100.0% |
Transportation & Commute in Sunrise Beach Village
Vehicle Availability by Sex in Sunrise Beach Village
The most prevalent vehicle ownership categories in Sunrise Beach Village are males with 2 vehicles (155, accounting for 58.7%) and females with 2 vehicles (65, making up 116.5%).
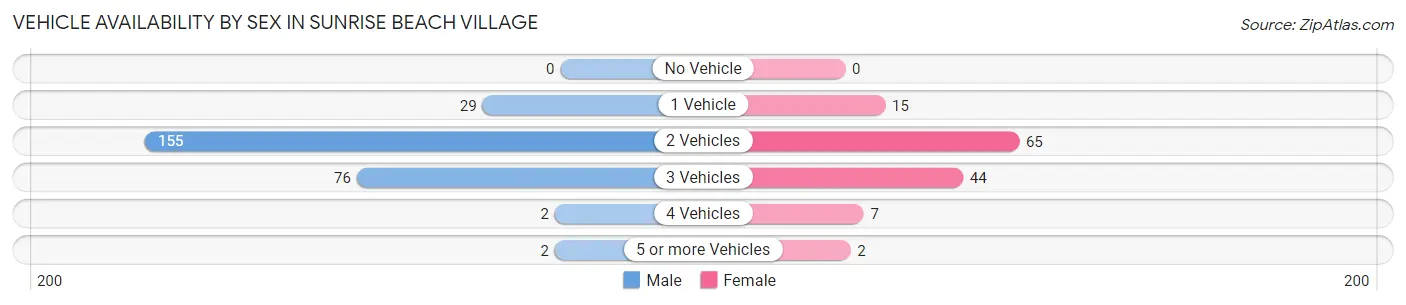
| Vehicles Available | Male | Female |
| No Vehicle | 0 (0.0%) | 0 (0.0%) |
| 1 Vehicle | 29 (11.0%) | 15 (11.3%) |
| 2 Vehicles | 155 (58.7%) | 65 (48.9%) |
| 3 Vehicles | 76 (28.8%) | 44 (33.1%) |
| 4 Vehicles | 2 (0.8%) | 7 (5.3%) |
| 5 or more Vehicles | 2 (0.8%) | 2 (1.5%) |
| Total | 264 (100.0%) | 133 (100.0%) |
Commute Time in Sunrise Beach Village
The most frequently occuring commute durations in Sunrise Beach Village are 60 to 89 minutes (70 commuters, 20.7%), 30 to 34 minutes (57 commuters, 16.9%), and 20 to 24 minutes (39 commuters, 11.5%).
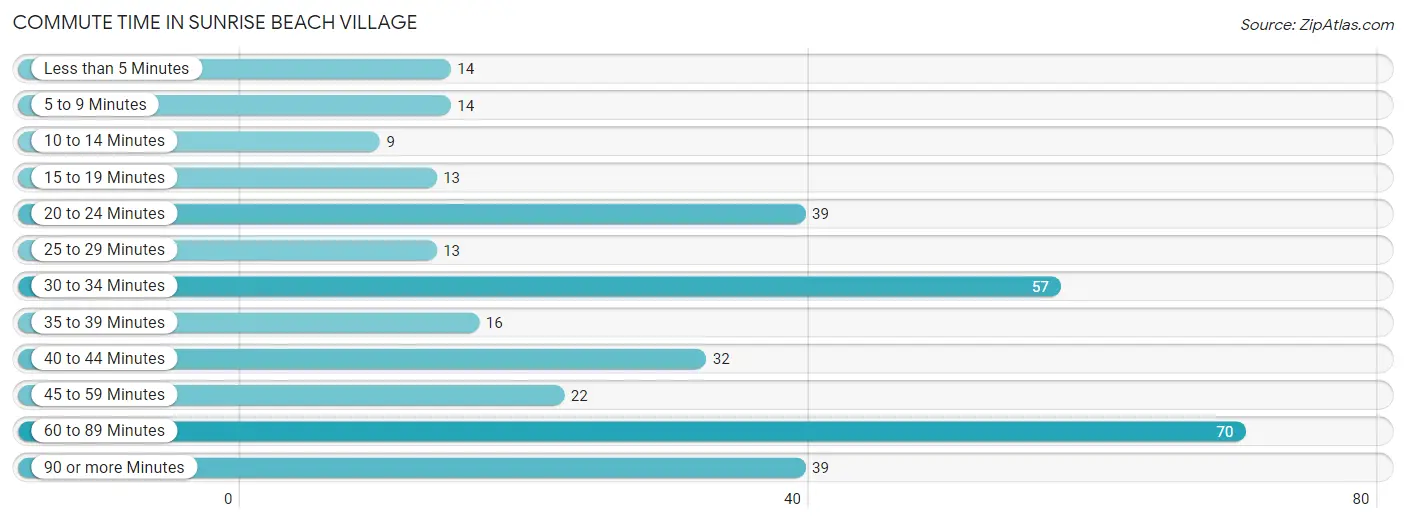
| Commute Time | # Commuters | % Commuters |
| Less than 5 Minutes | 14 | 4.1% |
| 5 to 9 Minutes | 14 | 4.1% |
| 10 to 14 Minutes | 9 | 2.7% |
| 15 to 19 Minutes | 13 | 3.8% |
| 20 to 24 Minutes | 39 | 11.5% |
| 25 to 29 Minutes | 13 | 3.8% |
| 30 to 34 Minutes | 57 | 16.9% |
| 35 to 39 Minutes | 16 | 4.7% |
| 40 to 44 Minutes | 32 | 9.5% |
| 45 to 59 Minutes | 22 | 6.5% |
| 60 to 89 Minutes | 70 | 20.7% |
| 90 or more Minutes | 39 | 11.5% |
Commute Time by Sex in Sunrise Beach Village
The most common commute times in Sunrise Beach Village are 60 to 89 minutes (55 commuters, 24.3%) for males and 30 to 34 minutes (34 commuters, 30.4%) for females.
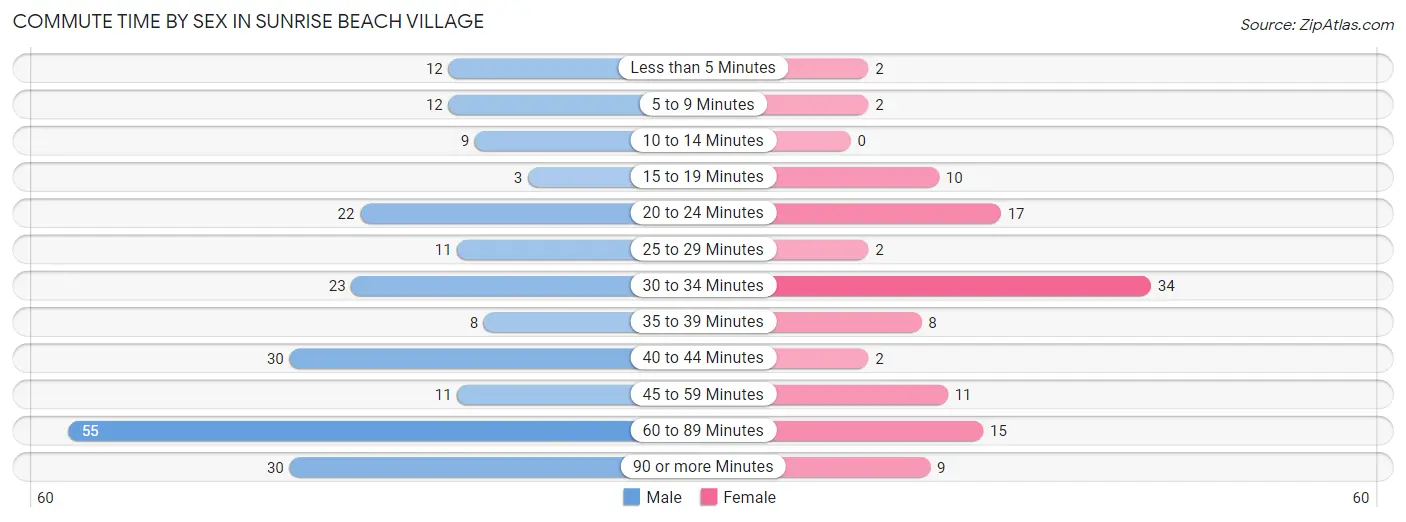
| Commute Time | Male | Female |
| Less than 5 Minutes | 12 (5.3%) | 2 (1.8%) |
| 5 to 9 Minutes | 12 (5.3%) | 2 (1.8%) |
| 10 to 14 Minutes | 9 (4.0%) | 0 (0.0%) |
| 15 to 19 Minutes | 3 (1.3%) | 10 (8.9%) |
| 20 to 24 Minutes | 22 (9.7%) | 17 (15.2%) |
| 25 to 29 Minutes | 11 (4.9%) | 2 (1.8%) |
| 30 to 34 Minutes | 23 (10.2%) | 34 (30.4%) |
| 35 to 39 Minutes | 8 (3.5%) | 8 (7.1%) |
| 40 to 44 Minutes | 30 (13.3%) | 2 (1.8%) |
| 45 to 59 Minutes | 11 (4.9%) | 11 (9.8%) |
| 60 to 89 Minutes | 55 (24.3%) | 15 (13.4%) |
| 90 or more Minutes | 30 (13.3%) | 9 (8.0%) |
Time of Departure to Work by Sex in Sunrise Beach Village
The most frequent times of departure to work in Sunrise Beach Village are 5:30 AM to 5:59 AM (40, 17.7%) for males and 9:00 AM to 9:59 AM (27, 24.1%) for females.
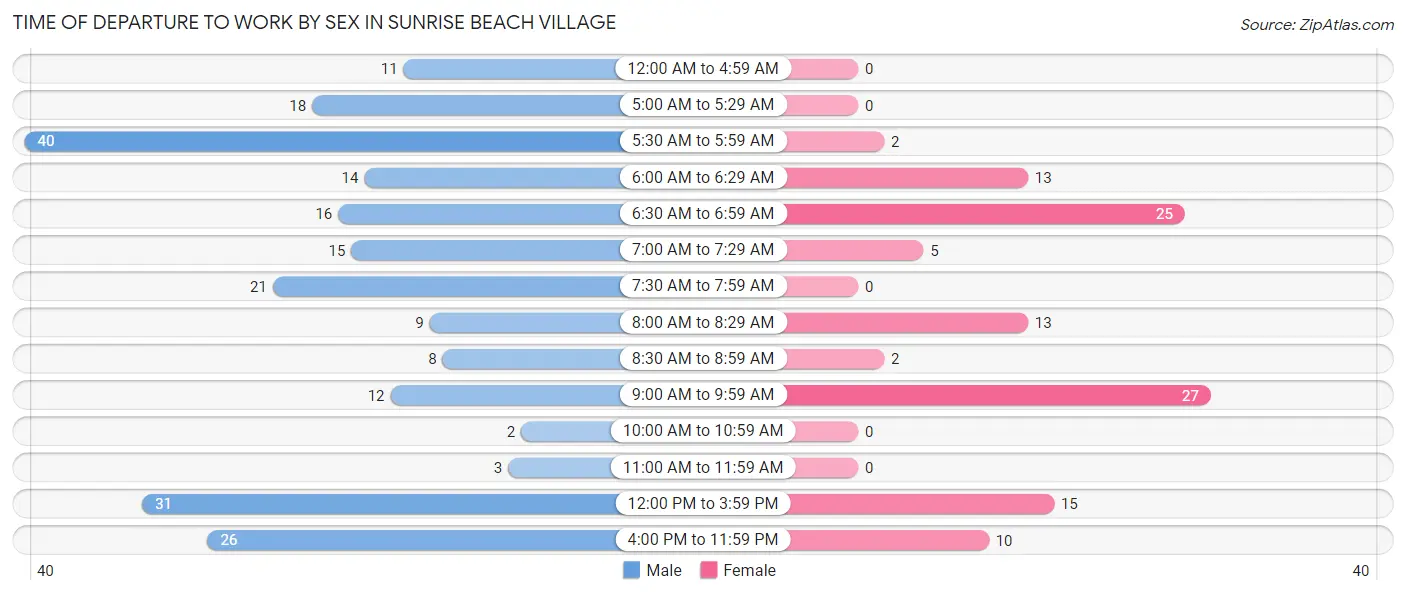
| Time of Departure | Male | Female |
| 12:00 AM to 4:59 AM | 11 (4.9%) | 0 (0.0%) |
| 5:00 AM to 5:29 AM | 18 (8.0%) | 0 (0.0%) |
| 5:30 AM to 5:59 AM | 40 (17.7%) | 2 (1.8%) |
| 6:00 AM to 6:29 AM | 14 (6.2%) | 13 (11.6%) |
| 6:30 AM to 6:59 AM | 16 (7.1%) | 25 (22.3%) |
| 7:00 AM to 7:29 AM | 15 (6.6%) | 5 (4.5%) |
| 7:30 AM to 7:59 AM | 21 (9.3%) | 0 (0.0%) |
| 8:00 AM to 8:29 AM | 9 (4.0%) | 13 (11.6%) |
| 8:30 AM to 8:59 AM | 8 (3.5%) | 2 (1.8%) |
| 9:00 AM to 9:59 AM | 12 (5.3%) | 27 (24.1%) |
| 10:00 AM to 10:59 AM | 2 (0.9%) | 0 (0.0%) |
| 11:00 AM to 11:59 AM | 3 (1.3%) | 0 (0.0%) |
| 12:00 PM to 3:59 PM | 31 (13.7%) | 15 (13.4%) |
| 4:00 PM to 11:59 PM | 26 (11.5%) | 10 (8.9%) |
| Total | 226 (100.0%) | 112 (100.0%) |
Housing Occupancy in Sunrise Beach Village
Occupancy by Ownership in Sunrise Beach Village
Of the total 472 dwellings in Sunrise Beach Village, owner-occupied units account for 407 (86.2%), while renter-occupied units make up 65 (13.8%).
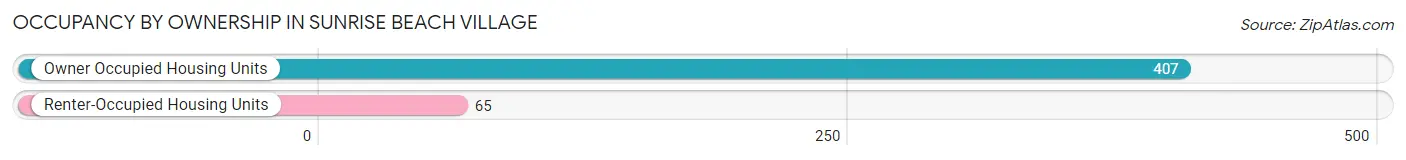
| Occupancy | # Housing Units | % Housing Units |
| Owner Occupied Housing Units | 407 | 86.2% |
| Renter-Occupied Housing Units | 65 | 13.8% |
| Total Occupied Housing Units | 472 | 100.0% |
Occupancy by Household Size in Sunrise Beach Village
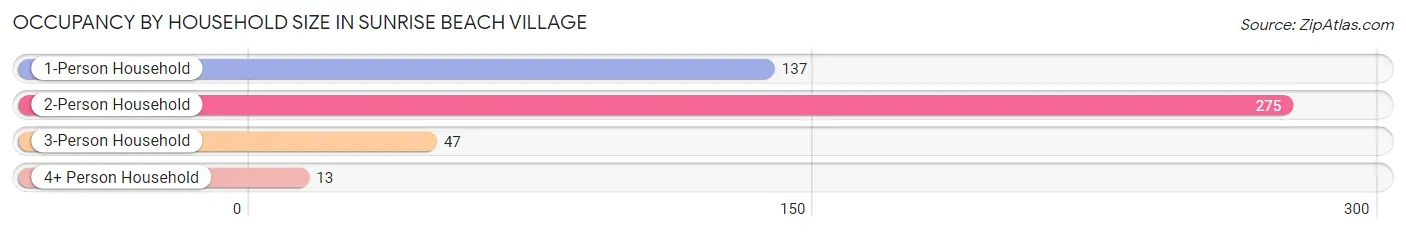
| Household Size | # Housing Units | % Housing Units |
| 1-Person Household | 137 | 29.0% |
| 2-Person Household | 275 | 58.3% |
| 3-Person Household | 47 | 10.0% |
| 4+ Person Household | 13 | 2.8% |
| Total Housing Units | 472 | 100.0% |
Occupancy by Ownership by Household Size in Sunrise Beach Village
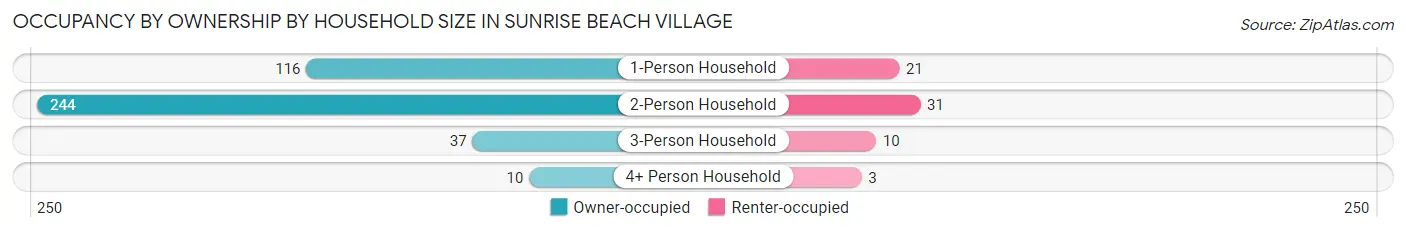
| Household Size | Owner-occupied | Renter-occupied |
| 1-Person Household | 116 (84.7%) | 21 (15.3%) |
| 2-Person Household | 244 (88.7%) | 31 (11.3%) |
| 3-Person Household | 37 (78.7%) | 10 (21.3%) |
| 4+ Person Household | 10 (76.9%) | 3 (23.1%) |
| Total Housing Units | 407 (86.2%) | 65 (13.8%) |
Occupancy by Educational Attainment in Sunrise Beach Village
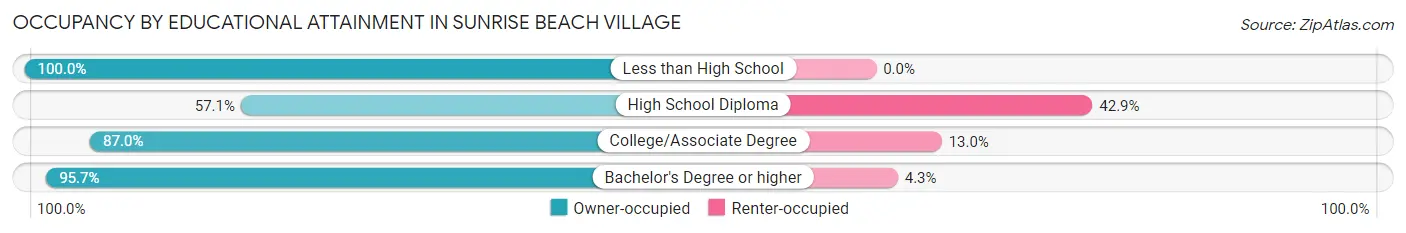
| Household Size | Owner-occupied | Renter-occupied |
| Less than High School | 24 (100.0%) | 0 (0.0%) |
| High School Diploma | 48 (57.1%) | 36 (42.9%) |
| College/Associate Degree | 134 (87.0%) | 20 (13.0%) |
| Bachelor's Degree or higher | 201 (95.7%) | 9 (4.3%) |
Occupancy by Age of Householder in Sunrise Beach Village
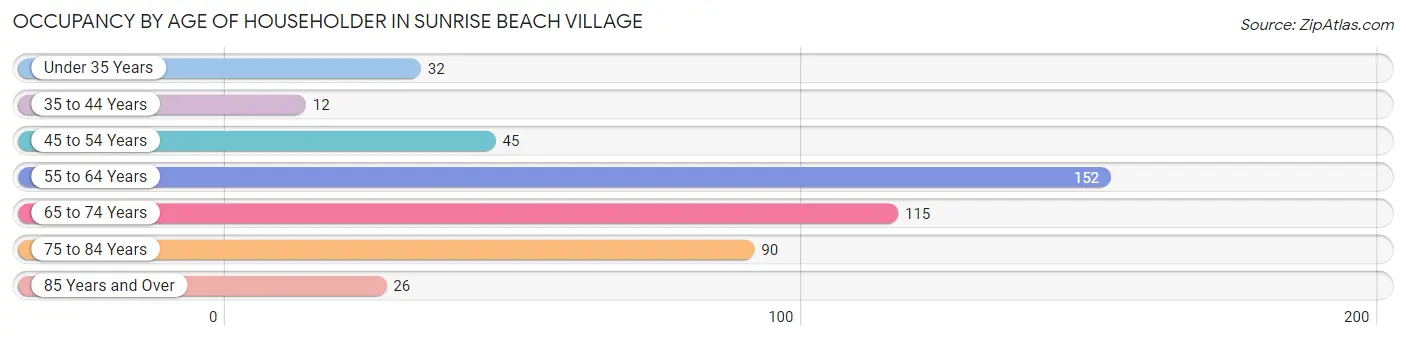
| Age Bracket | # Households | % Households |
| Under 35 Years | 32 | 6.8% |
| 35 to 44 Years | 12 | 2.5% |
| 45 to 54 Years | 45 | 9.5% |
| 55 to 64 Years | 152 | 32.2% |
| 65 to 74 Years | 115 | 24.4% |
| 75 to 84 Years | 90 | 19.1% |
| 85 Years and Over | 26 | 5.5% |
| Total | 472 | 100.0% |
Housing Finances in Sunrise Beach Village
Median Income by Occupancy in Sunrise Beach Village
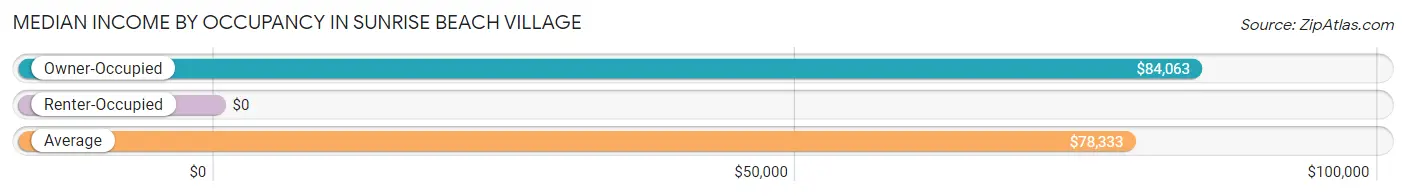
| Occupancy Type | # Households | Median Income |
| Owner-Occupied | 407 (86.2%) | $84,063 |
| Renter-Occupied | 65 (13.8%) | $0 |
| Average | 472 (100.0%) | $78,333 |
Occupancy by Householder Income Bracket in Sunrise Beach Village
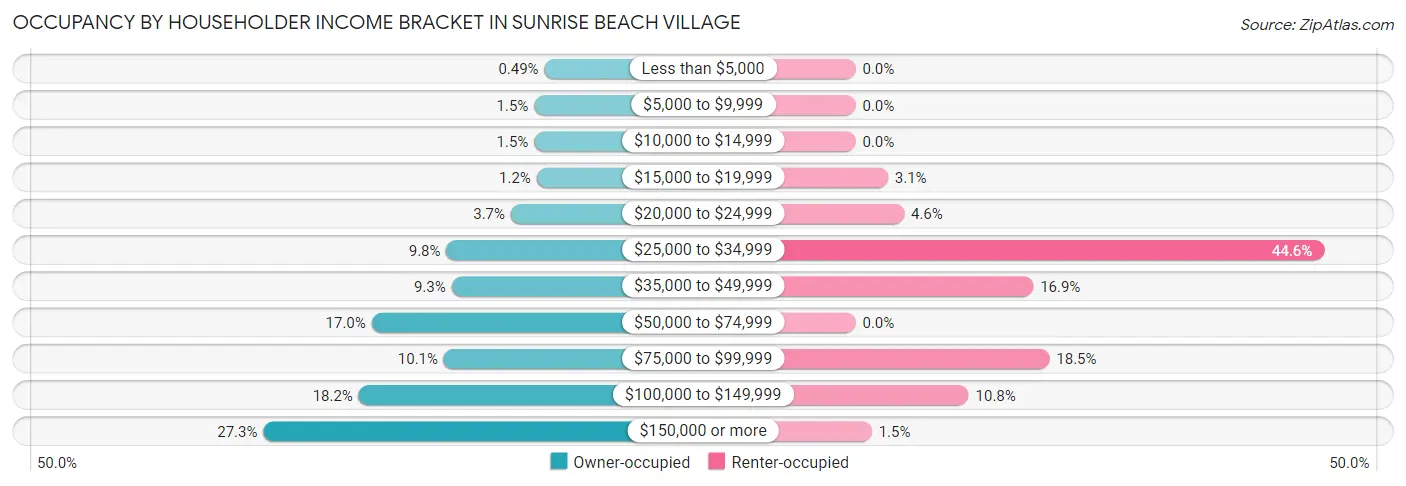
| Income Bracket | Owner-occupied | Renter-occupied |
| Less than $5,000 | 2 (0.5%) | 0 (0.0%) |
| $5,000 to $9,999 | 6 (1.5%) | 0 (0.0%) |
| $10,000 to $14,999 | 6 (1.5%) | 0 (0.0%) |
| $15,000 to $19,999 | 5 (1.2%) | 2 (3.1%) |
| $20,000 to $24,999 | 15 (3.7%) | 3 (4.6%) |
| $25,000 to $34,999 | 40 (9.8%) | 29 (44.6%) |
| $35,000 to $49,999 | 38 (9.3%) | 11 (16.9%) |
| $50,000 to $74,999 | 69 (17.0%) | 0 (0.0%) |
| $75,000 to $99,999 | 41 (10.1%) | 12 (18.5%) |
| $100,000 to $149,999 | 74 (18.2%) | 7 (10.8%) |
| $150,000 or more | 111 (27.3%) | 1 (1.5%) |
| Total | 407 (100.0%) | 65 (100.0%) |
Monthly Housing Cost Tiers in Sunrise Beach Village
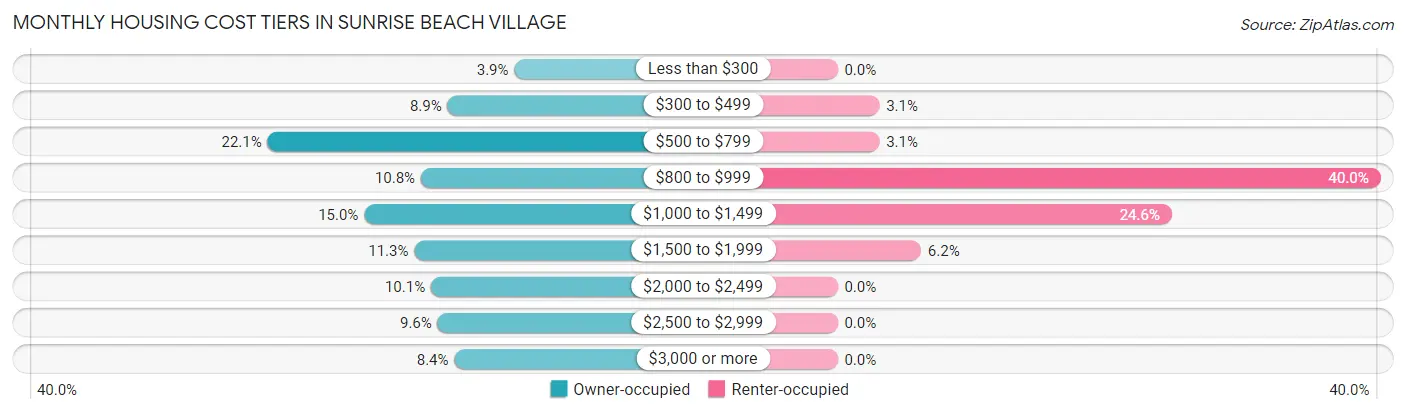
| Monthly Cost | Owner-occupied | Renter-occupied |
| Less than $300 | 16 (3.9%) | 0 (0.0%) |
| $300 to $499 | 36 (8.8%) | 2 (3.1%) |
| $500 to $799 | 90 (22.1%) | 2 (3.1%) |
| $800 to $999 | 44 (10.8%) | 26 (40.0%) |
| $1,000 to $1,499 | 61 (15.0%) | 16 (24.6%) |
| $1,500 to $1,999 | 46 (11.3%) | 4 (6.1%) |
| $2,000 to $2,499 | 41 (10.1%) | 0 (0.0%) |
| $2,500 to $2,999 | 39 (9.6%) | 0 (0.0%) |
| $3,000 or more | 34 (8.4%) | 0 (0.0%) |
| Total | 407 (100.0%) | 65 (100.0%) |
Physical Housing Characteristics in Sunrise Beach Village
Housing Structures in Sunrise Beach Village
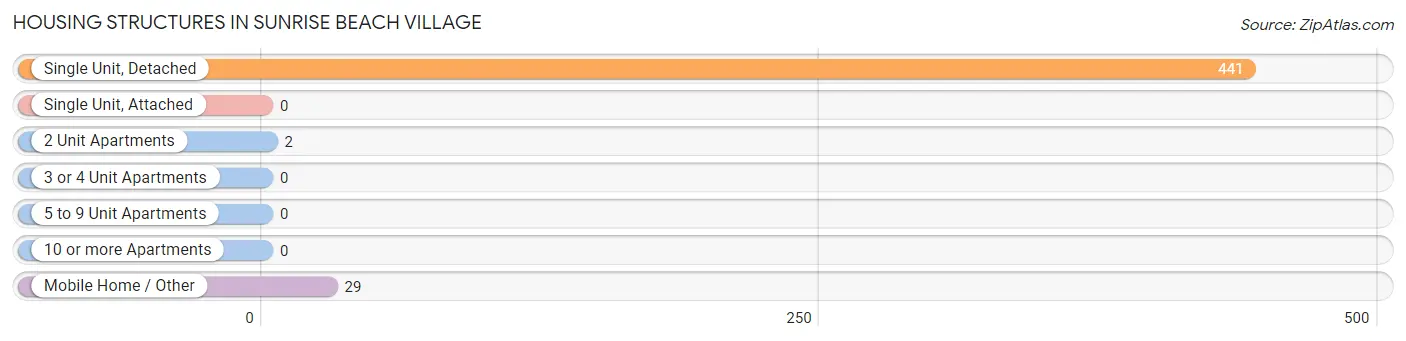
| Structure Type | # Housing Units | % Housing Units |
| Single Unit, Detached | 441 | 93.4% |
| Single Unit, Attached | 0 | 0.0% |
| 2 Unit Apartments | 2 | 0.4% |
| 3 or 4 Unit Apartments | 0 | 0.0% |
| 5 to 9 Unit Apartments | 0 | 0.0% |
| 10 or more Apartments | 0 | 0.0% |
| Mobile Home / Other | 29 | 6.1% |
| Total | 472 | 100.0% |
Housing Structures by Occupancy in Sunrise Beach Village
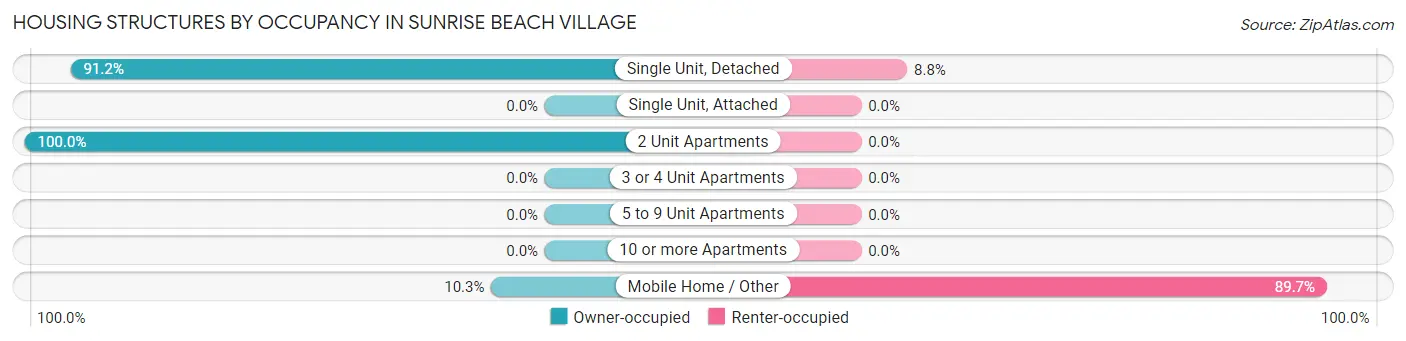
| Structure Type | Owner-occupied | Renter-occupied |
| Single Unit, Detached | 402 (91.2%) | 39 (8.8%) |
| Single Unit, Attached | 0 (0.0%) | 0 (0.0%) |
| 2 Unit Apartments | 2 (100.0%) | 0 (0.0%) |
| 3 or 4 Unit Apartments | 0 (0.0%) | 0 (0.0%) |
| 5 to 9 Unit Apartments | 0 (0.0%) | 0 (0.0%) |
| 10 or more Apartments | 0 (0.0%) | 0 (0.0%) |
| Mobile Home / Other | 3 (10.3%) | 26 (89.7%) |
| Total | 407 (86.2%) | 65 (13.8%) |
Housing Structures by Number of Rooms in Sunrise Beach Village
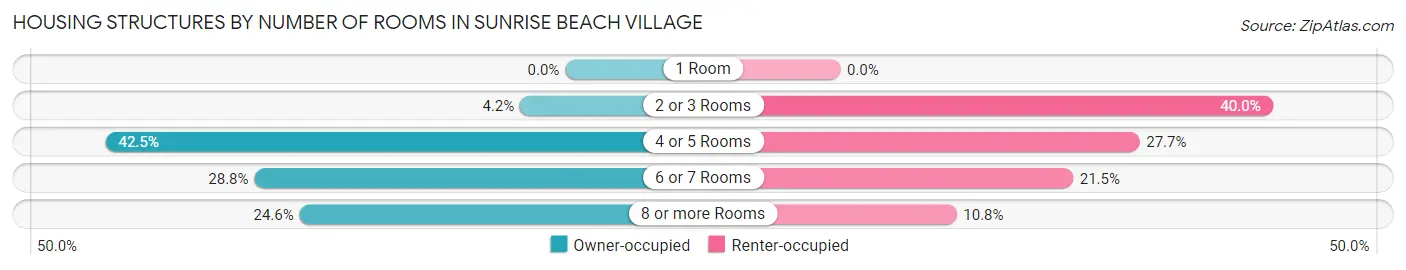
| Number of Rooms | Owner-occupied | Renter-occupied |
| 1 Room | 0 (0.0%) | 0 (0.0%) |
| 2 or 3 Rooms | 17 (4.2%) | 26 (40.0%) |
| 4 or 5 Rooms | 173 (42.5%) | 18 (27.7%) |
| 6 or 7 Rooms | 117 (28.7%) | 14 (21.5%) |
| 8 or more Rooms | 100 (24.6%) | 7 (10.8%) |
| Total | 407 (100.0%) | 65 (100.0%) |
Housing Structure by Heating Type in Sunrise Beach Village
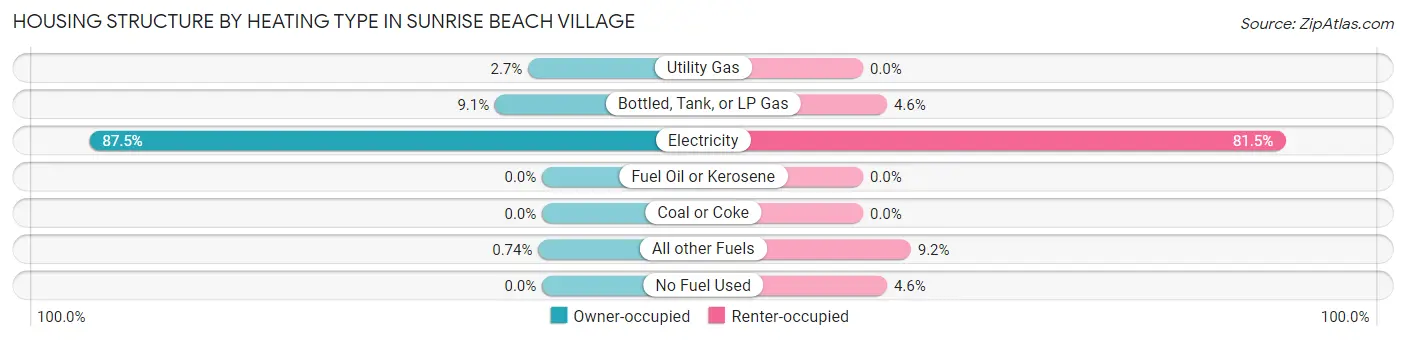
| Heating Type | Owner-occupied | Renter-occupied |
| Utility Gas | 11 (2.7%) | 0 (0.0%) |
| Bottled, Tank, or LP Gas | 37 (9.1%) | 3 (4.6%) |
| Electricity | 356 (87.5%) | 53 (81.5%) |
| Fuel Oil or Kerosene | 0 (0.0%) | 0 (0.0%) |
| Coal or Coke | 0 (0.0%) | 0 (0.0%) |
| All other Fuels | 3 (0.7%) | 6 (9.2%) |
| No Fuel Used | 0 (0.0%) | 3 (4.6%) |
| Total | 407 (100.0%) | 65 (100.0%) |
Household Vehicle Usage in Sunrise Beach Village
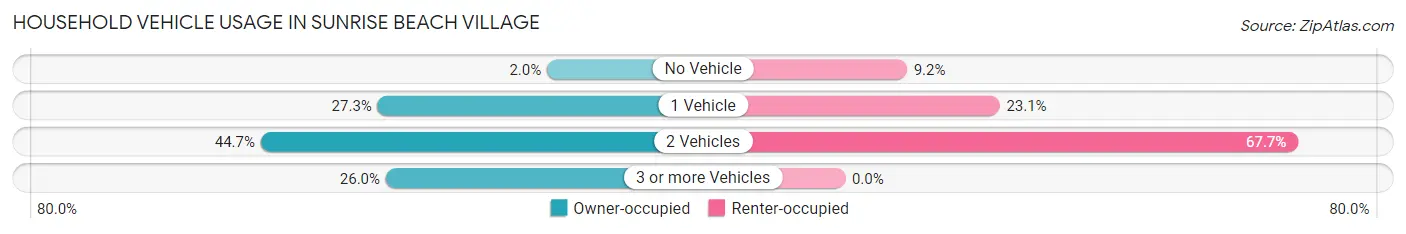
| Vehicles per Household | Owner-occupied | Renter-occupied |
| No Vehicle | 8 (2.0%) | 6 (9.2%) |
| 1 Vehicle | 111 (27.3%) | 15 (23.1%) |
| 2 Vehicles | 182 (44.7%) | 44 (67.7%) |
| 3 or more Vehicles | 106 (26.0%) | 0 (0.0%) |
| Total | 407 (100.0%) | 65 (100.0%) |
Real Estate & Mortgages in Sunrise Beach Village
Real Estate and Mortgage Overview in Sunrise Beach Village
| Characteristic | Without Mortgage | With Mortgage |
| Housing Units | 245 | 162 |
| Median Property Value | $512,000 | $641,900 |
| Median Household Income | $67,625 | $87 |
| Monthly Housing Costs | $764 | $34 |
| Real Estate Taxes | $4,750 | $7 |
Property Value by Mortgage Status in Sunrise Beach Village
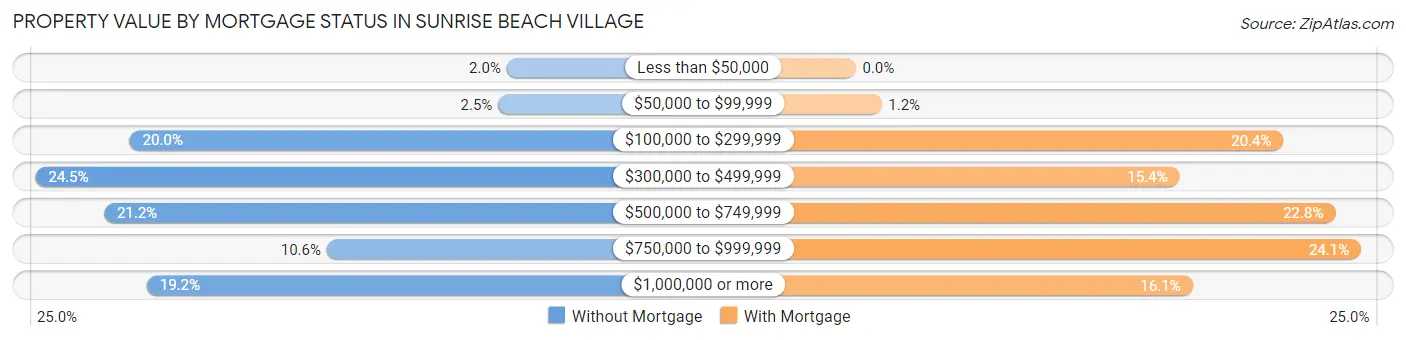
| Property Value | Without Mortgage | With Mortgage |
| Less than $50,000 | 5 (2.0%) | 0 (0.0%) |
| $50,000 to $99,999 | 6 (2.5%) | 2 (1.2%) |
| $100,000 to $299,999 | 49 (20.0%) | 33 (20.4%) |
| $300,000 to $499,999 | 60 (24.5%) | 25 (15.4%) |
| $500,000 to $749,999 | 52 (21.2%) | 37 (22.8%) |
| $750,000 to $999,999 | 26 (10.6%) | 39 (24.1%) |
| $1,000,000 or more | 47 (19.2%) | 26 (16.1%) |
| Total | 245 (100.0%) | 162 (100.0%) |
Household Income by Mortgage Status in Sunrise Beach Village
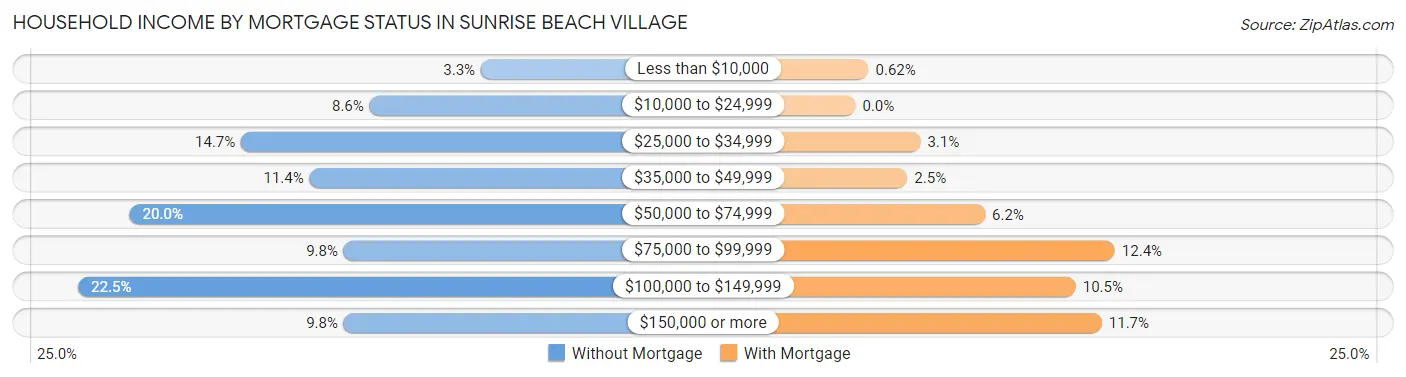
| Household Income | Without Mortgage | With Mortgage |
| Less than $10,000 | 8 (3.3%) | 1 (0.6%) |
| $10,000 to $24,999 | 21 (8.6%) | 0 (0.0%) |
| $25,000 to $34,999 | 36 (14.7%) | 5 (3.1%) |
| $35,000 to $49,999 | 28 (11.4%) | 4 (2.5%) |
| $50,000 to $74,999 | 49 (20.0%) | 10 (6.2%) |
| $75,000 to $99,999 | 24 (9.8%) | 20 (12.3%) |
| $100,000 to $149,999 | 55 (22.5%) | 17 (10.5%) |
| $150,000 or more | 24 (9.8%) | 19 (11.7%) |
| Total | 245 (100.0%) | 162 (100.0%) |
Property Value to Household Income Ratio in Sunrise Beach Village
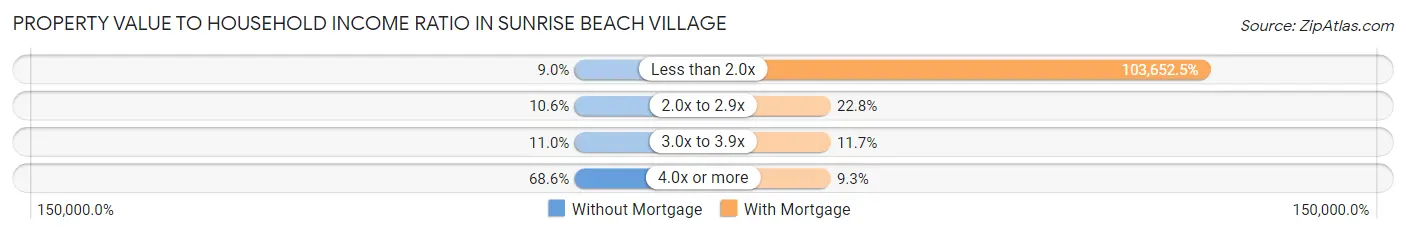
| Value-to-Income Ratio | Without Mortgage | With Mortgage |
| Less than 2.0x | 22 (9.0%) | 167,917 (103,652.5%) |
| 2.0x to 2.9x | 26 (10.6%) | 37 (22.8%) |
| 3.0x to 3.9x | 27 (11.0%) | 19 (11.7%) |
| 4.0x or more | 168 (68.6%) | 15 (9.3%) |
| Total | 245 (100.0%) | 162 (100.0%) |
Real Estate Taxes by Mortgage Status in Sunrise Beach Village
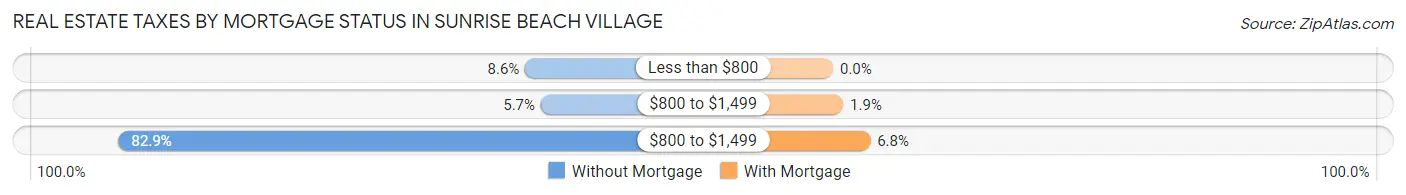
| Property Taxes | Without Mortgage | With Mortgage |
| Less than $800 | 21 (8.6%) | 0 (0.0%) |
| $800 to $1,499 | 14 (5.7%) | 3 (1.8%) |
| $800 to $1,499 | 203 (82.9%) | 11 (6.8%) |
| Total | 245 (100.0%) | 162 (100.0%) |
Health & Disability in Sunrise Beach Village
Health Insurance Coverage by Age in Sunrise Beach Village
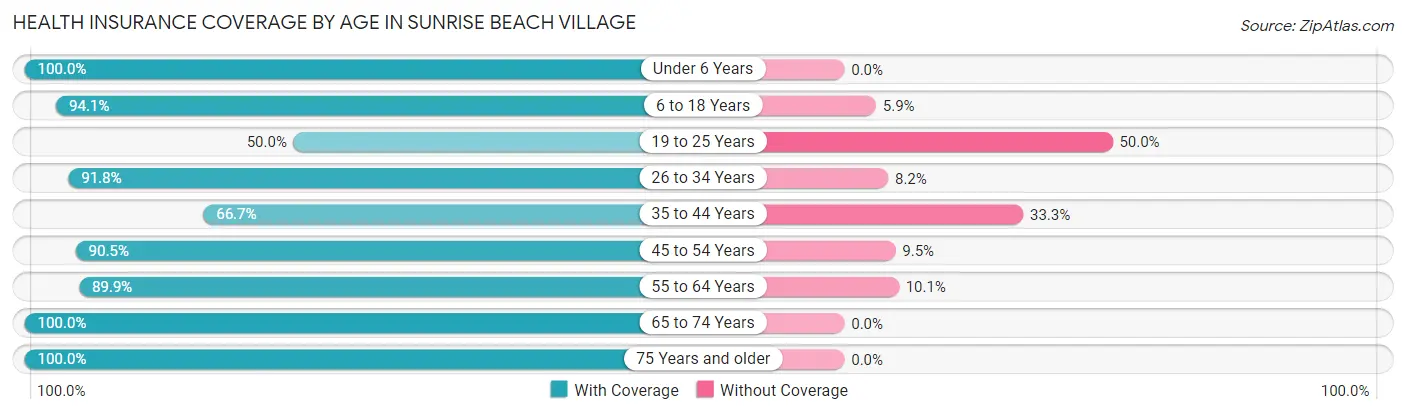
| Age Bracket | With Coverage | Without Coverage |
| Under 6 Years | 11 (100.0%) | 0 (0.0%) |
| 6 to 18 Years | 48 (94.1%) | 3 (5.9%) |
| 19 to 25 Years | 14 (50.0%) | 14 (50.0%) |
| 26 to 34 Years | 45 (91.8%) | 4 (8.2%) |
| 35 to 44 Years | 18 (66.7%) | 9 (33.3%) |
| 45 to 54 Years | 76 (90.5%) | 8 (9.5%) |
| 55 to 64 Years | 257 (89.9%) | 29 (10.1%) |
| 65 to 74 Years | 213 (100.0%) | 0 (0.0%) |
| 75 Years and older | 156 (100.0%) | 0 (0.0%) |
| Total | 838 (92.6%) | 67 (7.4%) |
Health Insurance Coverage by Citizenship Status in Sunrise Beach Village
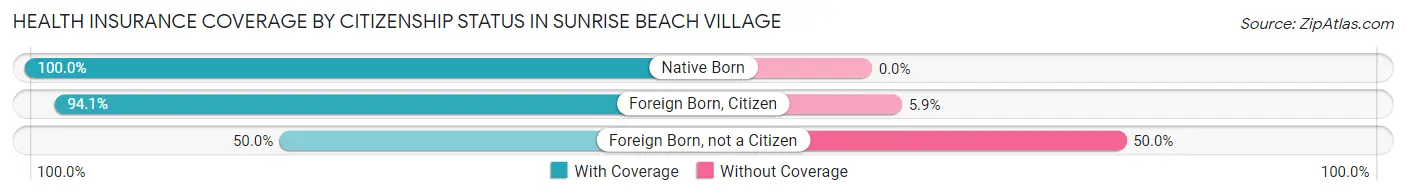
| Citizenship Status | With Coverage | Without Coverage |
| Native Born | 11 (100.0%) | 0 (0.0%) |
| Foreign Born, Citizen | 48 (94.1%) | 3 (5.9%) |
| Foreign Born, not a Citizen | 14 (50.0%) | 14 (50.0%) |
Health Insurance Coverage by Household Income in Sunrise Beach Village
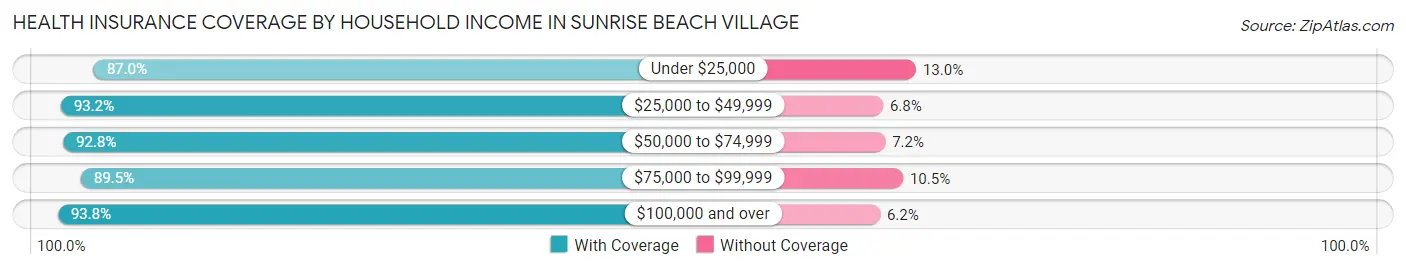
| Household Income | With Coverage | Without Coverage |
| Under $25,000 | 47 (87.0%) | 7 (13.0%) |
| $25,000 to $49,999 | 165 (93.2%) | 12 (6.8%) |
| $50,000 to $74,999 | 116 (92.8%) | 9 (7.2%) |
| $75,000 to $99,999 | 102 (89.5%) | 12 (10.5%) |
| $100,000 and over | 408 (93.8%) | 27 (6.2%) |
Public vs Private Health Insurance Coverage by Age in Sunrise Beach Village
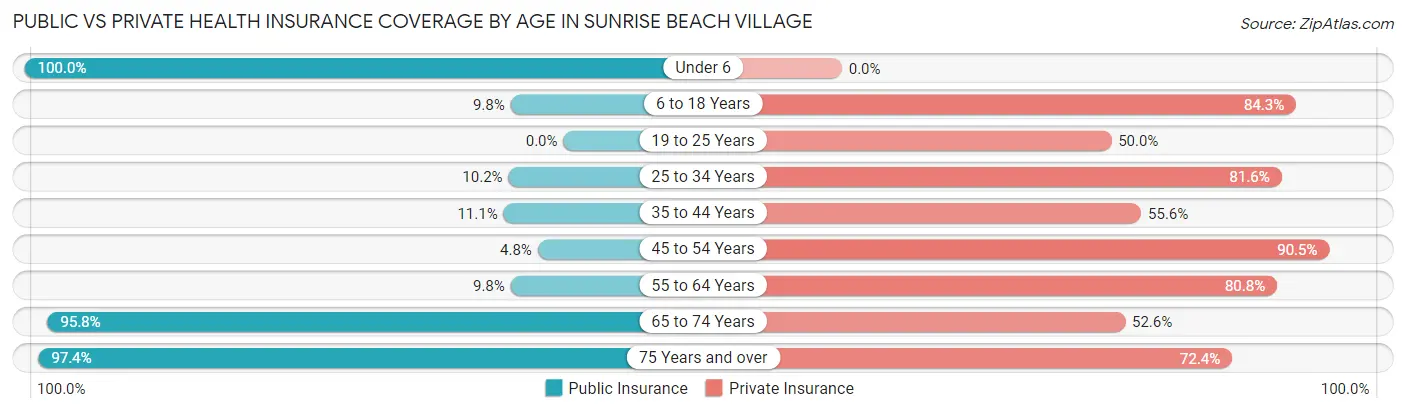
| Age Bracket | Public Insurance | Private Insurance |
| Under 6 | 11 (100.0%) | 0 (0.0%) |
| 6 to 18 Years | 5 (9.8%) | 43 (84.3%) |
| 19 to 25 Years | 0 (0.0%) | 14 (50.0%) |
| 25 to 34 Years | 5 (10.2%) | 40 (81.6%) |
| 35 to 44 Years | 3 (11.1%) | 15 (55.6%) |
| 45 to 54 Years | 4 (4.8%) | 76 (90.5%) |
| 55 to 64 Years | 28 (9.8%) | 231 (80.8%) |
| 65 to 74 Years | 204 (95.8%) | 112 (52.6%) |
| 75 Years and over | 152 (97.4%) | 113 (72.4%) |
| Total | 412 (45.5%) | 644 (71.2%) |
Disability Status by Sex by Age in Sunrise Beach Village
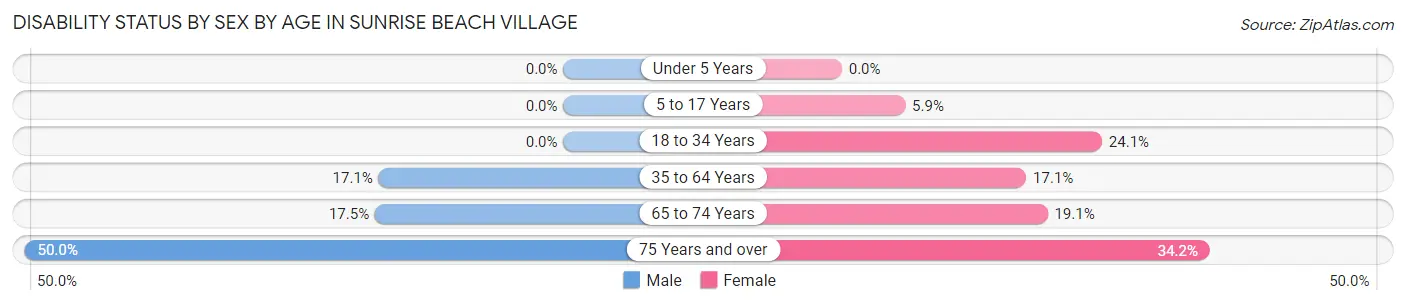
| Age Bracket | Male | Female |
| Under 5 Years | 0 (0.0%) | 0 (0.0%) |
| 5 to 17 Years | 0 (0.0%) | 1 (5.9%) |
| 18 to 34 Years | 0 (0.0%) | 7 (24.1%) |
| 35 to 64 Years | 36 (17.1%) | 32 (17.1%) |
| 65 to 74 Years | 18 (17.5%) | 21 (19.1%) |
| 75 Years and over | 37 (50.0%) | 28 (34.2%) |
Disability Class by Sex by Age in Sunrise Beach Village
Disability Class: Hearing Difficulty
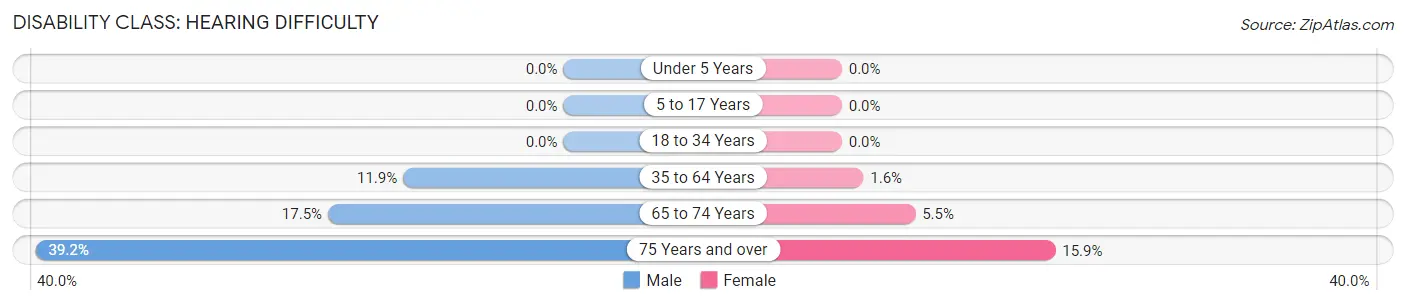
| Age Bracket | Male | Female |
| Under 5 Years | 0 (0.0%) | 0 (0.0%) |
| 5 to 17 Years | 0 (0.0%) | 0 (0.0%) |
| 18 to 34 Years | 0 (0.0%) | 0 (0.0%) |
| 35 to 64 Years | 25 (11.9%) | 3 (1.6%) |
| 65 to 74 Years | 18 (17.5%) | 6 (5.4%) |
| 75 Years and over | 29 (39.2%) | 13 (15.9%) |
Disability Class: Vision Difficulty
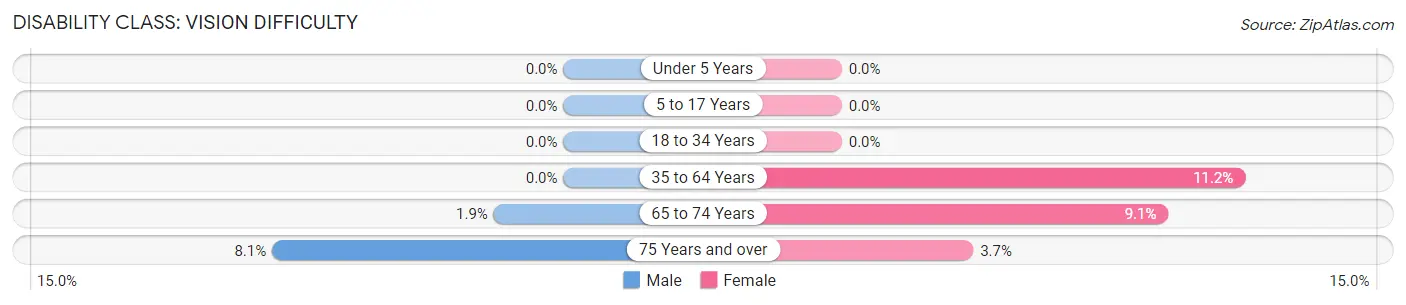
| Age Bracket | Male | Female |
| Under 5 Years | 0 (0.0%) | 0 (0.0%) |
| 5 to 17 Years | 0 (0.0%) | 0 (0.0%) |
| 18 to 34 Years | 0 (0.0%) | 0 (0.0%) |
| 35 to 64 Years | 0 (0.0%) | 21 (11.2%) |
| 65 to 74 Years | 2 (1.9%) | 10 (9.1%) |
| 75 Years and over | 6 (8.1%) | 3 (3.7%) |
Disability Class: Cognitive Difficulty
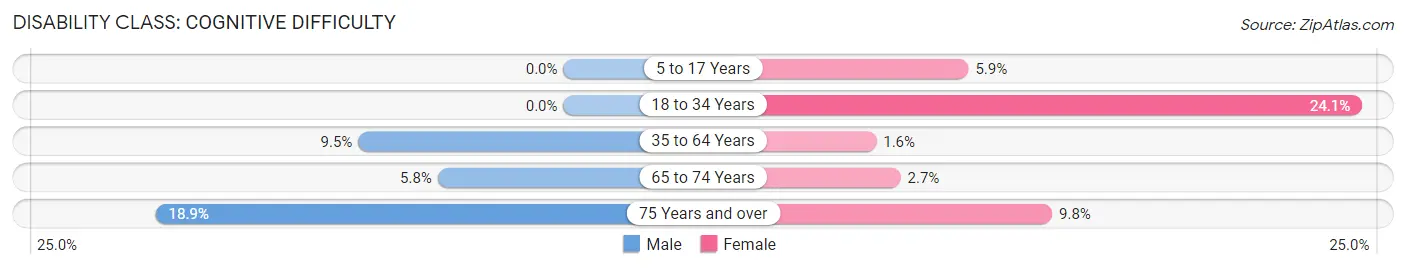
| Age Bracket | Male | Female |
| 5 to 17 Years | 0 (0.0%) | 1 (5.9%) |
| 18 to 34 Years | 0 (0.0%) | 7 (24.1%) |
| 35 to 64 Years | 20 (9.5%) | 3 (1.6%) |
| 65 to 74 Years | 6 (5.8%) | 3 (2.7%) |
| 75 Years and over | 14 (18.9%) | 8 (9.8%) |
Disability Class: Ambulatory Difficulty
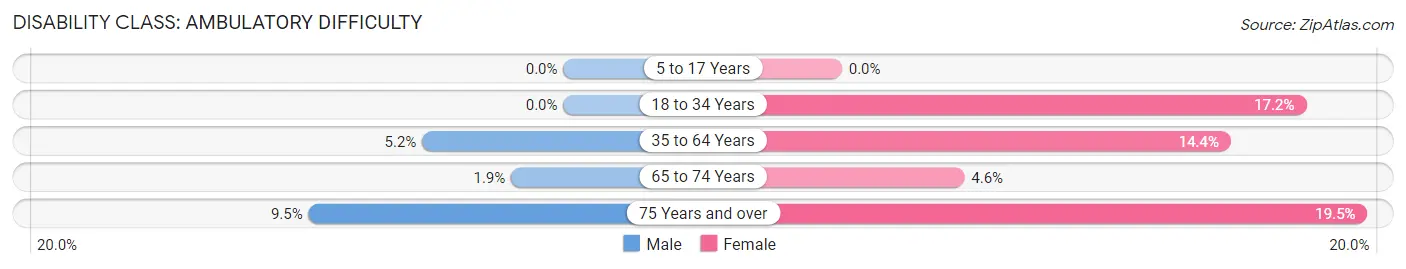
| Age Bracket | Male | Female |
| 5 to 17 Years | 0 (0.0%) | 0 (0.0%) |
| 18 to 34 Years | 0 (0.0%) | 5 (17.2%) |
| 35 to 64 Years | 11 (5.2%) | 27 (14.4%) |
| 65 to 74 Years | 2 (1.9%) | 5 (4.5%) |
| 75 Years and over | 7 (9.5%) | 16 (19.5%) |
Disability Class: Self-Care Difficulty
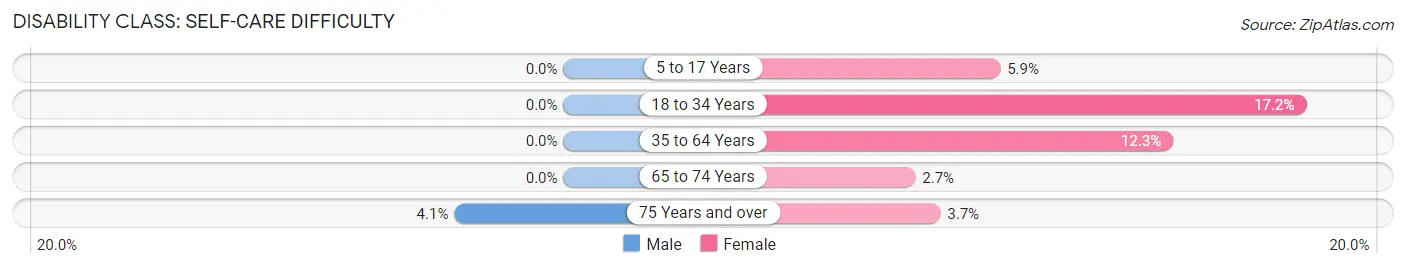
| Age Bracket | Male | Female |
| 5 to 17 Years | 0 (0.0%) | 1 (5.9%) |
| 18 to 34 Years | 0 (0.0%) | 5 (17.2%) |
| 35 to 64 Years | 0 (0.0%) | 23 (12.3%) |
| 65 to 74 Years | 0 (0.0%) | 3 (2.7%) |
| 75 Years and over | 3 (4.1%) | 3 (3.7%) |
Technology Access in Sunrise Beach Village
Computing Device Access in Sunrise Beach Village
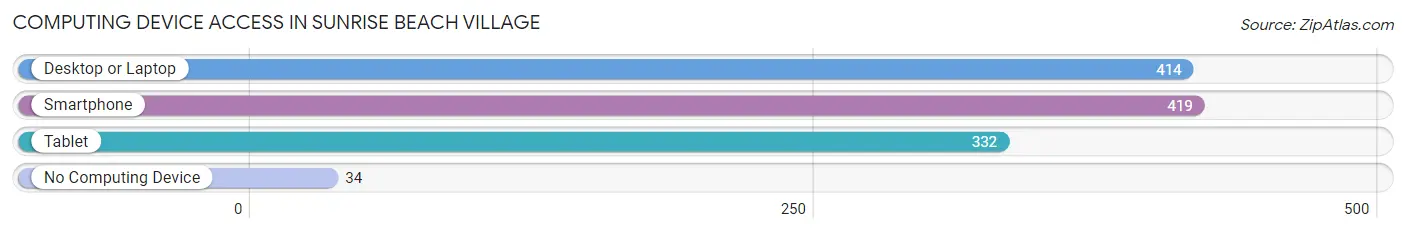
| Device Type | # Households | % Households |
| Desktop or Laptop | 414 | 87.7% |
| Smartphone | 419 | 88.8% |
| Tablet | 332 | 70.3% |
| No Computing Device | 34 | 7.2% |
| Total | 472 | 100.0% |
Internet Access in Sunrise Beach Village
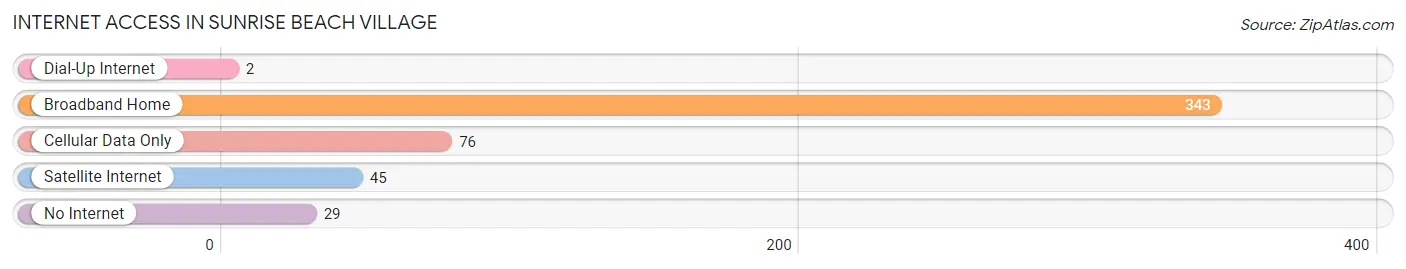
| Internet Type | # Households | % Households |
| Dial-Up Internet | 2 | 0.4% |
| Broadband Home | 343 | 72.7% |
| Cellular Data Only | 76 | 16.1% |
| Satellite Internet | 45 | 9.5% |
| No Internet | 29 | 6.1% |
| Total | 472 | 100.0% |
Sunrise Beach Village Summary
Sunrise Beach Village is a small town located in the heart of the Texas Hill Country, just north of Austin. It is situated on the shores of Lake LBJ, a popular recreational lake. The town has a population of just over 1,000 people and is known for its laid-back atmosphere and friendly locals.
History
Sunrise Beach Village was founded in the late 1800s by a group of settlers from Germany. The settlers were attracted to the area due to its abundance of natural resources, including timber and limestone. The settlers built a small community and named it Sunrise Beach Village after the sunrises they enjoyed on the lake.
The town grew slowly over the years, but it wasn’t until the 1950s that it began to experience a population boom. This was due to the construction of the Buchanan Dam, which created Lake LBJ. The lake provided a great opportunity for recreational activities, such as fishing, boating, and swimming. This influx of visitors helped to spur the growth of the town and its economy.
Geography
Sunrise Beach Village is located in the heart of the Texas Hill Country, just north of Austin. The town is situated on the shores of Lake LBJ, a popular recreational lake. The lake is surrounded by rolling hills and lush vegetation, making it a popular destination for outdoor enthusiasts.
The town is also located close to several other popular attractions, including the Enchanted Rock State Natural Area, the Longhorn Cavern State Park, and the Pedernales Falls State Park.
Economy
The economy of Sunrise Beach Village is largely based on tourism. The town is a popular destination for visitors looking to enjoy the lake and the surrounding natural beauty. The town also has several restaurants, bars, and shops that cater to tourists.
In addition to tourism, the town also has a thriving agricultural sector. The area is known for its production of peaches, pecans, and other fruits and vegetables.
Demographics
As of the 2010 census, the population of Sunrise Beach Village was 1,072. The town is predominantly white, with a small Hispanic population. The median household income is $50,000, and the median age is 44.
Conclusion
Sunrise Beach Village is a small town located in the heart of the Texas Hill Country, just north of Austin. It is situated on the shores of Lake LBJ, a popular recreational lake. The town has a population of just over 1,000 people and is known for its laid-back atmosphere and friendly locals. The economy of Sunrise Beach Village is largely based on tourism, with a thriving agricultural sector as well. The town is predominantly white, with a small Hispanic population.
Common Questions
What is Per Capita Income in Sunrise Beach Village?
Per Capita income in Sunrise Beach Village is $62,831.
What is the Median Family Income in Sunrise Beach Village?
Median Family Income in Sunrise Beach Village is $107,344.
What is the Median Household income in Sunrise Beach Village?
Median Household Income in Sunrise Beach Village is $78,333.
What is Income or Wage Gap in Sunrise Beach Village?
Income or Wage Gap in Sunrise Beach Village is 42.5%.
Women in Sunrise Beach Village earn 57.5 cents for every dollar earned by a man.
What is Family Income Deficit in Sunrise Beach Village?
Family Income Deficit in Sunrise Beach Village is $7,183.
Families that are below poverty line in Sunrise Beach Village earn $7,183 less on average than the poverty threshold level.
What is Inequality or Gini Index in Sunrise Beach Village?
Inequality or Gini Index in Sunrise Beach Village is 0.49.
What is the Total Population of Sunrise Beach Village?
Total Population of Sunrise Beach Village is 905.
What is the Total Male Population of Sunrise Beach Village?
Total Male Population of Sunrise Beach Village is 469.
What is the Total Female Population of Sunrise Beach Village?
Total Female Population of Sunrise Beach Village is 436.
What is the Ratio of Males per 100 Females in Sunrise Beach Village?
There are 107.57 Males per 100 Females in Sunrise Beach Village.
What is the Ratio of Females per 100 Males in Sunrise Beach Village?
There are 92.96 Females per 100 Males in Sunrise Beach Village.
What is the Median Population Age in Sunrise Beach Village?
Median Population Age in Sunrise Beach Village is 61.9 Years.
What is the Average Family Size in Sunrise Beach Village
Average Family Size in Sunrise Beach Village is 2.3 People.
What is the Average Household Size in Sunrise Beach Village
Average Household Size in Sunrise Beach Village is 1.9 People.
How Large is the Labor Force in Sunrise Beach Village?
There are 400 People in the Labor Forcein in Sunrise Beach Village.
What is the Percentage of People in the Labor Force in Sunrise Beach Village?
46.8% of People are in the Labor Force in Sunrise Beach Village.
What is the Unemployment Rate in Sunrise Beach Village?
Unemployment Rate in Sunrise Beach Village is 0.8%.