Redland, TX Map & Demographics
Redland Map
Redland Overview
$17,928
PER CAPITA INCOME
$49,076
AVG FAMILY INCOME
$33,689
AVG HOUSEHOLD INCOME
0.24
INEQUALITY / GINI INDEX
723
TOTAL POPULATION
382
MALE POPULATION
341
FEMALE POPULATION
112.02
MALES / 100 FEMALES
89.27
FEMALES / 100 MALES
52.6
MEDIAN AGE
2.8
AVG FAMILY SIZE
2.2
AVG HOUSEHOLD SIZE
286
LABOR FORCE [ PEOPLE ]
40.7%
PERCENT IN LABOR FORCE
48.6%
UNEMPLOYMENT RATE
Income in Redland
Income Overview in Redland
Per Capita Income in Redland is $17,928, while median incomes of families and households are $49,076 and $33,689 respectively.
| Characteristic | Number | Measure |
| Per Capita Income | 723 | $17,928 |
| Median Family Income | 103 | $49,076 |
| Mean Family Income | 103 | $50,006 |
| Median Household Income | 322 | $33,689 |
| Mean Household Income | 322 | $39,470 |
| Income Deficit | 103 | $0 |
| Wage / Income Gap (%) | 723 | 0.00% |
| Wage / Income Gap ($) | 723 | 100.00¢ per $1 |
| Gini / Inequality Index | 723 | 0.24 |
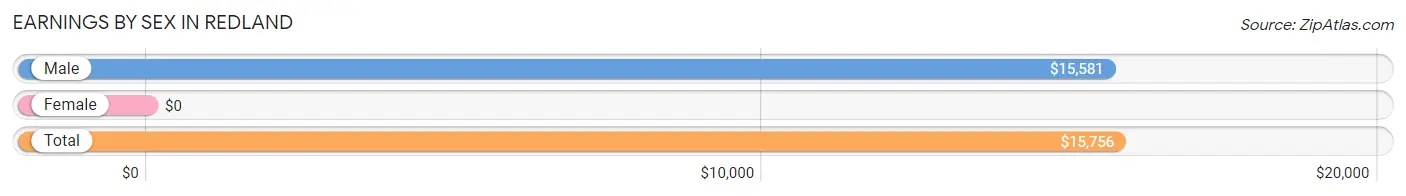
Earnings by Sex in Redland
| Sex | Number | Average Earnings |
| Male | 156 (58.2%) | $15,581 |
| Female | 112 (41.8%) | $0 |
| Total | 268 (100.0%) | $15,756 |
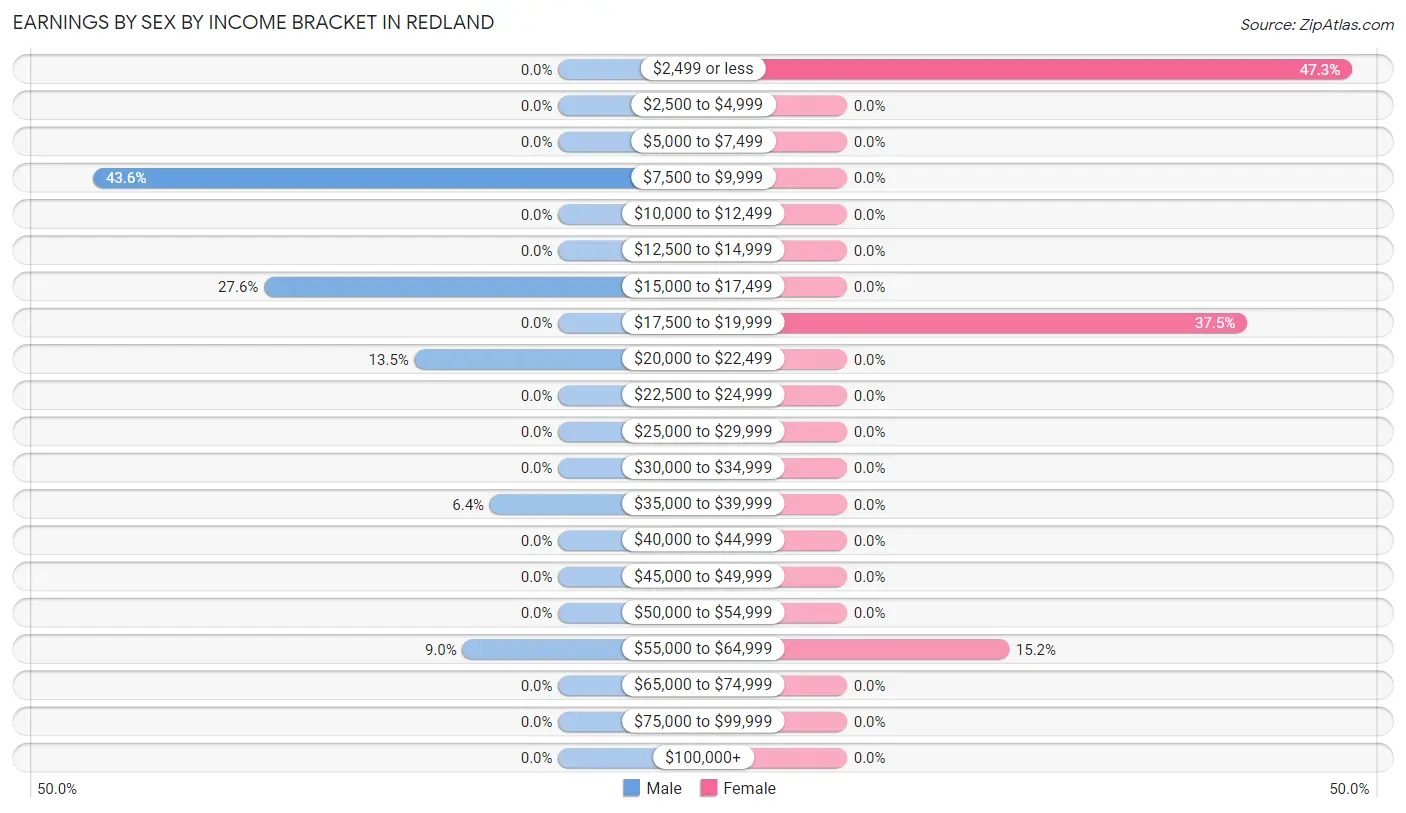
Earnings by Sex by Income Bracket in Redland
The most common earnings brackets in Redland are $7,500 to $9,999 for men (68 | 43.6%) and $2,499 or less for women (53 | 47.3%).
| Income | Male | Female |
| $2,499 or less | 0 (0.0%) | 53 (47.3%) |
| $2,500 to $4,999 | 0 (0.0%) | 0 (0.0%) |
| $5,000 to $7,499 | 0 (0.0%) | 0 (0.0%) |
| $7,500 to $9,999 | 68 (43.6%) | 0 (0.0%) |
| $10,000 to $12,499 | 0 (0.0%) | 0 (0.0%) |
| $12,500 to $14,999 | 0 (0.0%) | 0 (0.0%) |
| $15,000 to $17,499 | 43 (27.6%) | 0 (0.0%) |
| $17,500 to $19,999 | 0 (0.0%) | 42 (37.5%) |
| $20,000 to $22,499 | 21 (13.5%) | 0 (0.0%) |
| $22,500 to $24,999 | 0 (0.0%) | 0 (0.0%) |
| $25,000 to $29,999 | 0 (0.0%) | 0 (0.0%) |
| $30,000 to $34,999 | 0 (0.0%) | 0 (0.0%) |
| $35,000 to $39,999 | 10 (6.4%) | 0 (0.0%) |
| $40,000 to $44,999 | 0 (0.0%) | 0 (0.0%) |
| $45,000 to $49,999 | 0 (0.0%) | 0 (0.0%) |
| $50,000 to $54,999 | 0 (0.0%) | 0 (0.0%) |
| $55,000 to $64,999 | 14 (9.0%) | 17 (15.2%) |
| $65,000 to $74,999 | 0 (0.0%) | 0 (0.0%) |
| $75,000 to $99,999 | 0 (0.0%) | 0 (0.0%) |
| $100,000+ | 0 (0.0%) | 0 (0.0%) |
| Total | 156 (100.0%) | 112 (100.0%) |
Earnings by Sex by Educational Attainment in Redland
| Educational Attainment | Male Income | Female Income |
| Less than High School | - | - |
| High School Diploma | - | - |
| College or Associate's Degree | - | - |
| Bachelor's Degree | - | - |
| Graduate Degree | - | - |
| Total | - | - |
Family Income in Redland
Family Income Brackets in Redland
According to the Redland family income data, there are 43 families falling into the $50,000 to $74,999 income range, which is the most common income bracket and makes up 41.7% of all families.
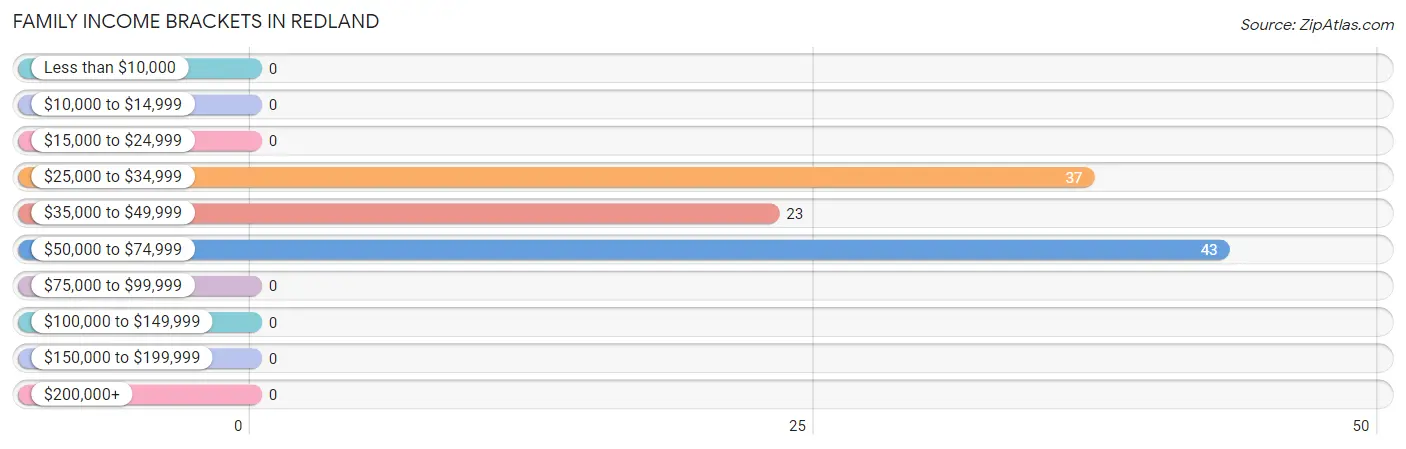
| Income Bracket | # Families | % Families |
| Less than $10,000 | 0 | 0.0% |
| $10,000 to $14,999 | 0 | 0.0% |
| $15,000 to $24,999 | 0 | 0.0% |
| $25,000 to $34,999 | 37 | 35.9% |
| $35,000 to $49,999 | 23 | 22.3% |
| $50,000 to $74,999 | 43 | 41.7% |
| $75,000 to $99,999 | 0 | 0.0% |
| $100,000 to $149,999 | 0 | 0.0% |
| $150,000 to $199,999 | 0 | 0.0% |
| $200,000+ | 0 | 0.0% |
Family Income by Famaliy Size in Redland
2-person families (56 | 54.4%) account for the highest median family income in Redland with $56,136 per family, while 2-person families (56 | 54.4%) have the highest median income of $28,068 per family member.
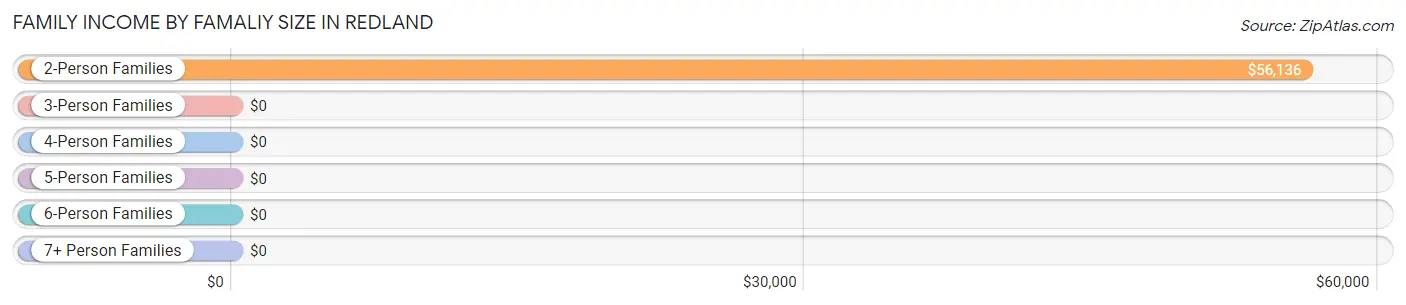
| Income Bracket | # Families | Median Income |
| 2-Person Families | 56 (54.4%) | $56,136 |
| 3-Person Families | 17 (16.5%) | $0 |
| 4-Person Families | 30 (29.1%) | $0 |
| 5-Person Families | 0 (0.0%) | $0 |
| 6-Person Families | 0 (0.0%) | $0 |
| 7+ Person Families | 0 (0.0%) | $0 |
| Total | 103 (100.0%) | $49,076 |
Family Income by Number of Earners in Redland
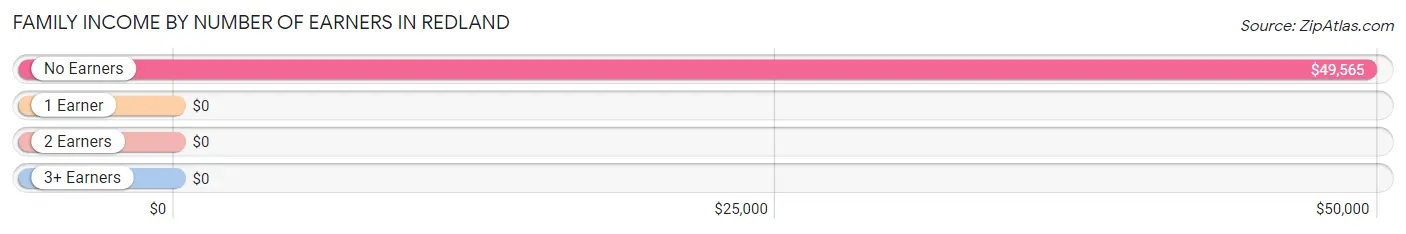
| Number of Earners | # Families | Median Income |
| No Earners | 52 (50.5%) | $49,565 |
| 1 Earner | 11 (10.7%) | $0 |
| 2 Earners | 40 (38.8%) | $0 |
| 3+ Earners | 0 (0.0%) | $0 |
| Total | 103 (100.0%) | $49,076 |
Household Income in Redland
Household Income Brackets in Redland
With 106 households falling in the category, the $50,000 to $74,999 income range is the most frequent in Redland, accounting for 32.9% of all households.
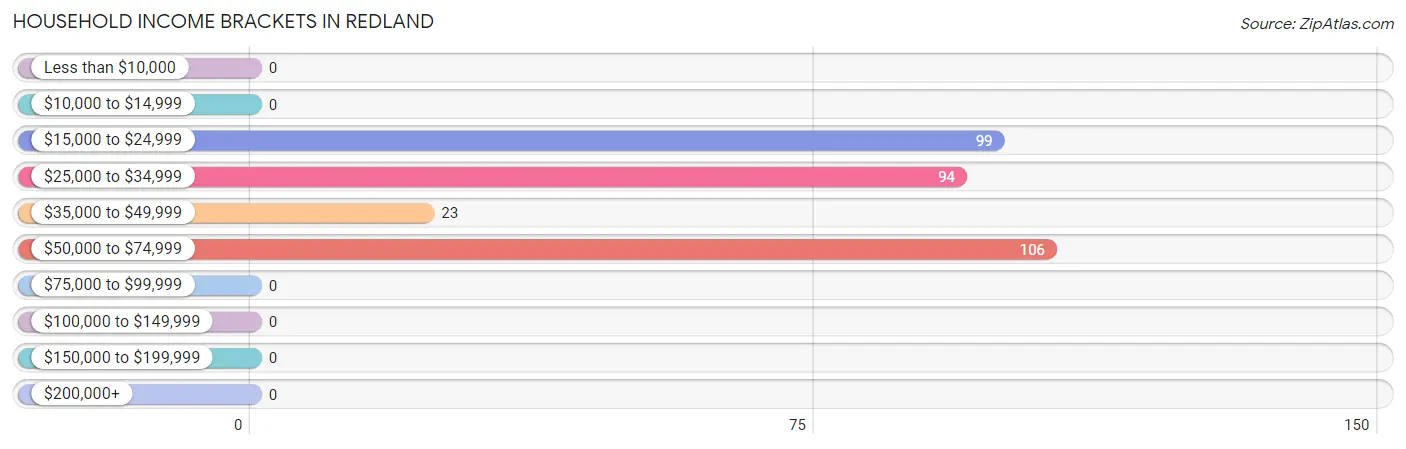
| Income Bracket | # Households | % Households |
| Less than $10,000 | 0 | 0.0% |
| $10,000 to $14,999 | 0 | 0.0% |
| $15,000 to $24,999 | 99 | 30.7% |
| $25,000 to $34,999 | 94 | 29.2% |
| $35,000 to $49,999 | 23 | 7.1% |
| $50,000 to $74,999 | 106 | 32.9% |
| $75,000 to $99,999 | 0 | 0.0% |
| $100,000 to $149,999 | 0 | 0.0% |
| $150,000 to $199,999 | 0 | 0.0% |
| $200,000+ | 0 | 0.0% |
Household Income by Householder Age in Redland
| Income Bracket | # Households | Median Income |
| 15 to 24 Years | 0 (0.0%) | $0 |
| 25 to 44 Years | 64 (19.9%) | $0 |
| 45 to 64 Years | 179 (55.6%) | $0 |
| 65+ Years | 79 (24.5%) | $0 |
| Total | 322 (100.0%) | $33,689 |
Poverty in Redland
Income Below Poverty by Sex and Age in Redland
With 34.3% poverty level for males and 30.8% for females among the residents of Redland, 25 to 34 year old males and 35 to 44 year old females are the most vulnerable to poverty, with 68 males (88.3%) and 105 females (90.5%) in their respective age groups living below the poverty level.
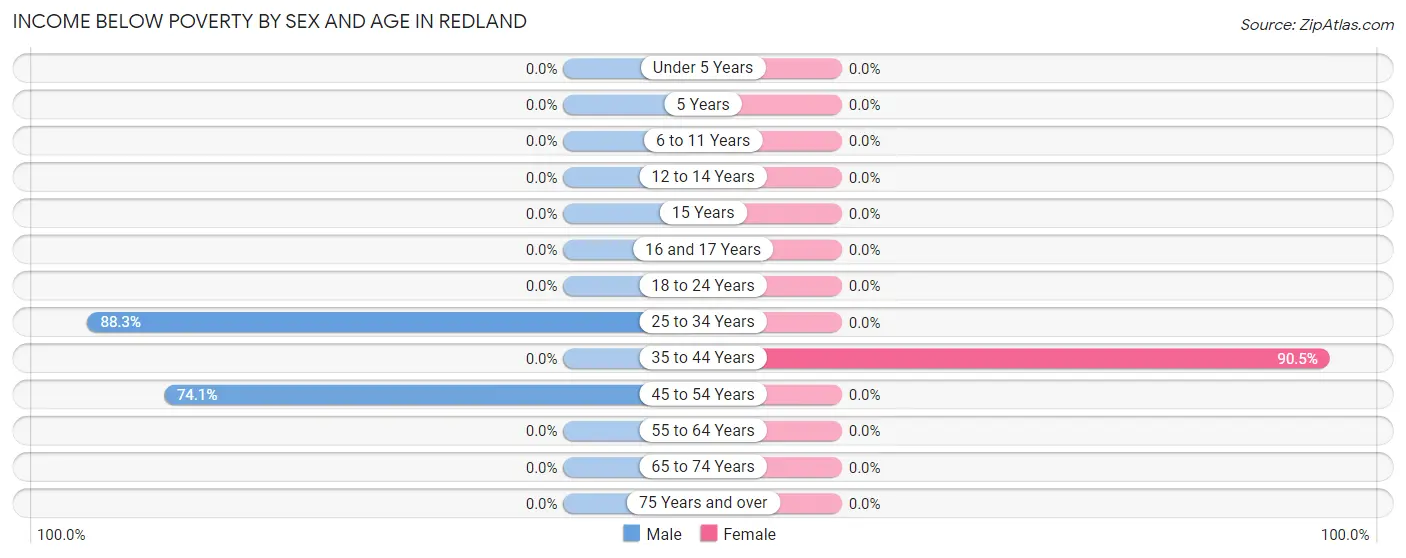
| Age Bracket | Male | Female |
| Under 5 Years | 0 (0.0%) | 0 (0.0%) |
| 5 Years | 0 (0.0%) | 0 (0.0%) |
| 6 to 11 Years | 0 (0.0%) | 0 (0.0%) |
| 12 to 14 Years | 0 (0.0%) | 0 (0.0%) |
| 15 Years | 0 (0.0%) | 0 (0.0%) |
| 16 and 17 Years | 0 (0.0%) | 0 (0.0%) |
| 18 to 24 Years | 0 (0.0%) | 0 (0.0%) |
| 25 to 34 Years | 68 (88.3%) | 0 (0.0%) |
| 35 to 44 Years | 0 (0.0%) | 105 (90.5%) |
| 45 to 54 Years | 63 (74.1%) | 0 (0.0%) |
| 55 to 64 Years | 0 (0.0%) | 0 (0.0%) |
| 65 to 74 Years | 0 (0.0%) | 0 (0.0%) |
| 75 Years and over | 0 (0.0%) | 0 (0.0%) |
| Total | 131 (34.3%) | 105 (30.8%) |
Income Above Poverty by Sex and Age in Redland
According to the poverty statistics in Redland, males aged 6 to 11 years and females aged 18 to 24 years are the age groups that are most secure financially, with 100.0% of males and 100.0% of females in these age groups living above the poverty line.
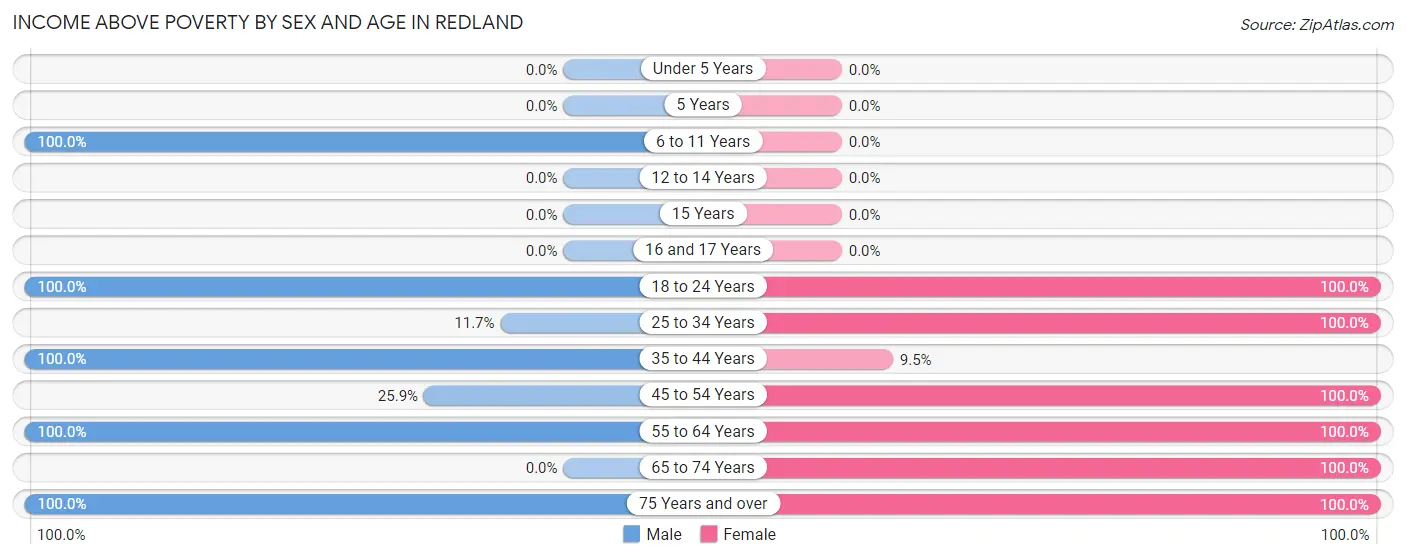
| Age Bracket | Male | Female |
| Under 5 Years | 0 (0.0%) | 0 (0.0%) |
| 5 Years | 0 (0.0%) | 0 (0.0%) |
| 6 to 11 Years | 21 (100.0%) | 0 (0.0%) |
| 12 to 14 Years | 0 (0.0%) | 0 (0.0%) |
| 15 Years | 0 (0.0%) | 0 (0.0%) |
| 16 and 17 Years | 0 (0.0%) | 0 (0.0%) |
| 18 to 24 Years | 43 (100.0%) | 35 (100.0%) |
| 25 to 34 Years | 9 (11.7%) | 12 (100.0%) |
| 35 to 44 Years | 14 (100.0%) | 11 (9.5%) |
| 45 to 54 Years | 22 (25.9%) | 30 (100.0%) |
| 55 to 64 Years | 121 (100.0%) | 52 (100.0%) |
| 65 to 74 Years | 0 (0.0%) | 56 (100.0%) |
| 75 Years and over | 21 (100.0%) | 40 (100.0%) |
| Total | 251 (65.7%) | 236 (69.2%) |
Income Below Poverty Among Married-Couple Families in Redland
| Children | Above Poverty | Below Poverty |
| No Children | 51 (100.0%) | 0 (0.0%) |
| 1 or 2 Children | 0 (0.0%) | 0 (0.0%) |
| 3 or 4 Children | 0 (0.0%) | 0 (0.0%) |
| 5 or more Children | 0 (0.0%) | 0 (0.0%) |
| Total | 51 (100.0%) | 0 (0.0%) |
Income Below Poverty Among Single-Parent Households in Redland
| Children | Single Father | Single Mother |
| No Children | 0 (0.0%) | 0 (0.0%) |
| 1 or 2 Children | 0 (0.0%) | 0 (0.0%) |
| 3 or 4 Children | 0 (0.0%) | 0 (0.0%) |
| 5 or more Children | 0 (0.0%) | 0 (0.0%) |
| Total | 0 (0.0%) | 0 (0.0%) |
Income Below Poverty Among Married-Couple vs Single-Parent Households in Redland
| Children | Married-Couple Families | Single-Parent Households |
| No Children | 0 (0.0%) | 0 (0.0%) |
| 1 or 2 Children | 0 (0.0%) | 0 (0.0%) |
| 3 or 4 Children | 0 (0.0%) | 0 (0.0%) |
| 5 or more Children | 0 (0.0%) | 0 (0.0%) |
| Total | 0 (0.0%) | 0 (0.0%) |
Race in Redland
The most populous races in Redland are White / Caucasian (597 | 82.6%), Hispanic or Latino (176 | 24.3%), and Black / African American (108 | 14.9%).
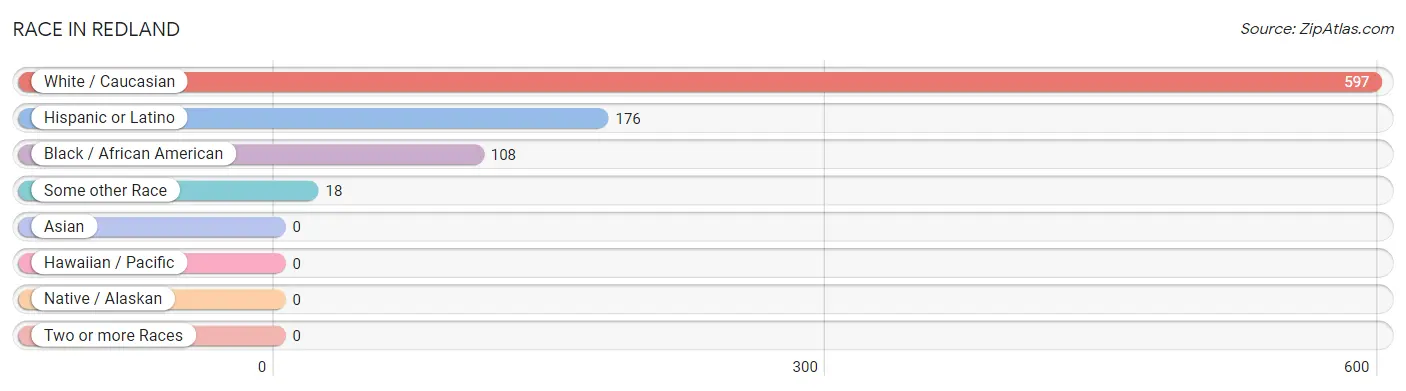
| Race | # Population | % Population |
| Asian | 0 | 0.0% |
| Black / African American | 108 | 14.9% |
| Hawaiian / Pacific | 0 | 0.0% |
| Hispanic or Latino | 176 | 24.3% |
| Native / Alaskan | 0 | 0.0% |
| White / Caucasian | 597 | 82.6% |
| Two or more Races | 0 | 0.0% |
| Some other Race | 18 | 2.5% |
| Total | 723 | 100.0% |
Ancestry in Redland
The most populous ancestries reported in Redland are Mexican (176 | 24.3%), German (149 | 20.6%), Irish (124 | 17.2%), Swiss (68 | 9.4%), and American (56 | 7.7%), together accounting for 79.3% of all Redland residents.
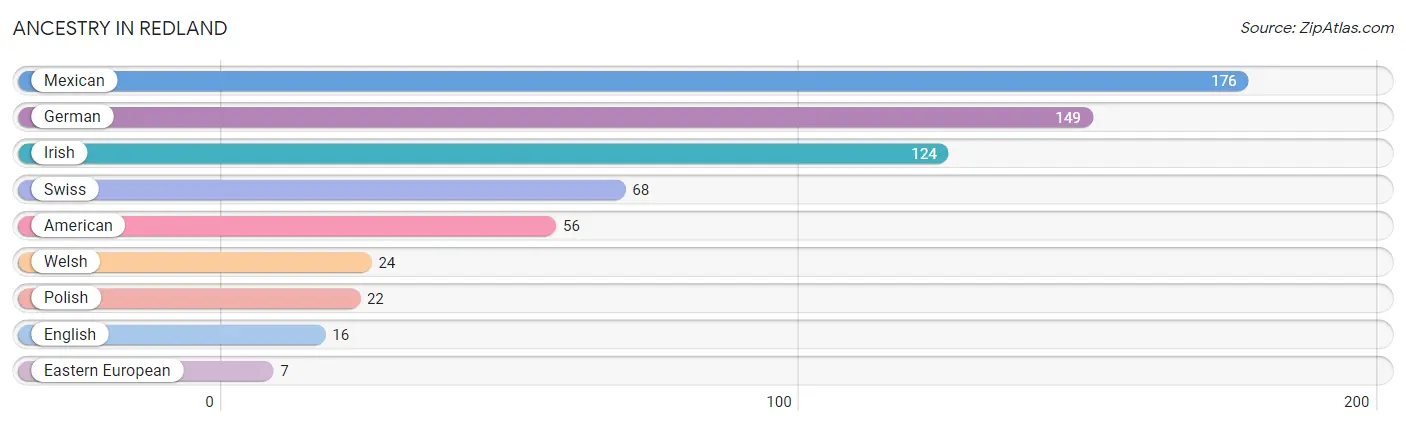
| Ancestry | # Population | % Population |
| American | 56 | 7.7% |
| Eastern European | 7 | 1.0% |
| English | 16 | 2.2% |
| German | 149 | 20.6% |
| Irish | 124 | 17.2% |
| Mexican | 176 | 24.3% |
| Polish | 22 | 3.0% |
| Swiss | 68 | 9.4% |
| Welsh | 24 | 3.3% | View All 9 Rows |
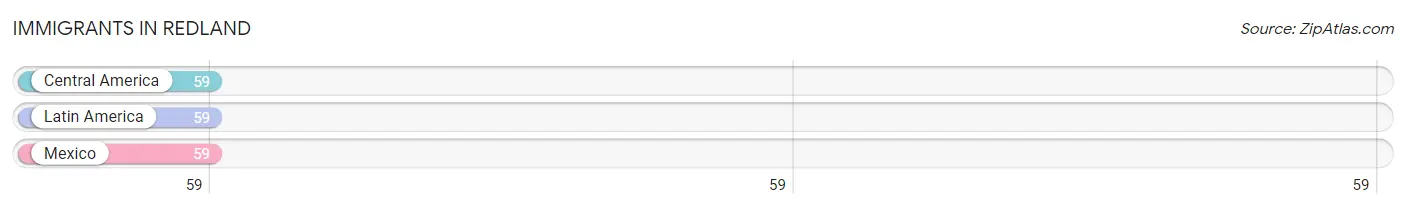
Immigrants in Redland
The most numerous immigrant groups reported in Redland came from Central America (59 | 8.2%), Latin America (59 | 8.2%), and Mexico (59 | 8.2%), together accounting for 24.5% of all Redland residents.
| Immigration Origin | # Population | % Population |
| Central America | 59 | 8.2% |
| Latin America | 59 | 8.2% |
| Mexico | 59 | 8.2% | View All 3 Rows |
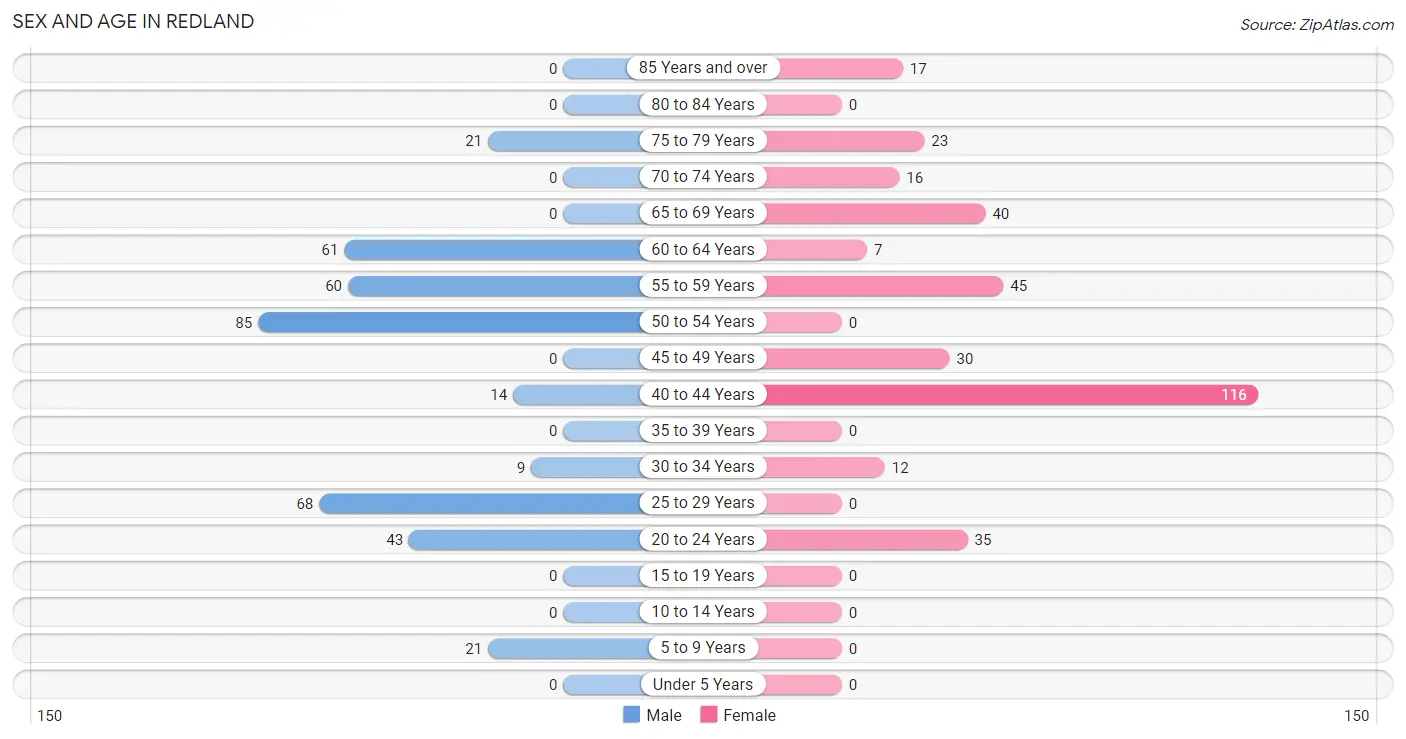
Sex and Age in Redland
Sex and Age in Redland
The most populous age groups in Redland are 50 to 54 Years (85 | 22.3%) for men and 40 to 44 Years (116 | 34.0%) for women.
| Age Bracket | Male | Female |
| Under 5 Years | 0 (0.0%) | 0 (0.0%) |
| 5 to 9 Years | 21 (5.5%) | 0 (0.0%) |
| 10 to 14 Years | 0 (0.0%) | 0 (0.0%) |
| 15 to 19 Years | 0 (0.0%) | 0 (0.0%) |
| 20 to 24 Years | 43 (11.3%) | 35 (10.3%) |
| 25 to 29 Years | 68 (17.8%) | 0 (0.0%) |
| 30 to 34 Years | 9 (2.4%) | 12 (3.5%) |
| 35 to 39 Years | 0 (0.0%) | 0 (0.0%) |
| 40 to 44 Years | 14 (3.7%) | 116 (34.0%) |
| 45 to 49 Years | 0 (0.0%) | 30 (8.8%) |
| 50 to 54 Years | 85 (22.3%) | 0 (0.0%) |
| 55 to 59 Years | 60 (15.7%) | 45 (13.2%) |
| 60 to 64 Years | 61 (16.0%) | 7 (2.1%) |
| 65 to 69 Years | 0 (0.0%) | 40 (11.7%) |
| 70 to 74 Years | 0 (0.0%) | 16 (4.7%) |
| 75 to 79 Years | 21 (5.5%) | 23 (6.7%) |
| 80 to 84 Years | 0 (0.0%) | 0 (0.0%) |
| 85 Years and over | 0 (0.0%) | 17 (5.0%) |
| Total | 382 (100.0%) | 341 (100.0%) |
Families and Households in Redland
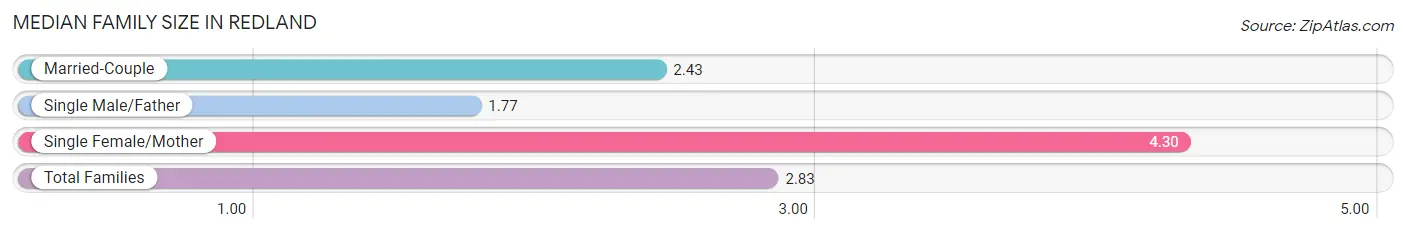
Median Family Size in Redland
The median family size in Redland is 2.83 persons per family, with single female/mother families (30 | 29.1%) accounting for the largest median family size of 4.3 persons per family. On the other hand, single male/father families (22 | 21.4%) represent the smallest median family size with 1.77 persons per family.
| Family Type | # Families | Family Size |
| Married-Couple | 51 (49.5%) | 2.43 |
| Single Male/Father | 22 (21.4%) | 1.77 |
| Single Female/Mother | 30 (29.1%) | 4.30 |
| Total Families | 103 (100.0%) | 2.83 |
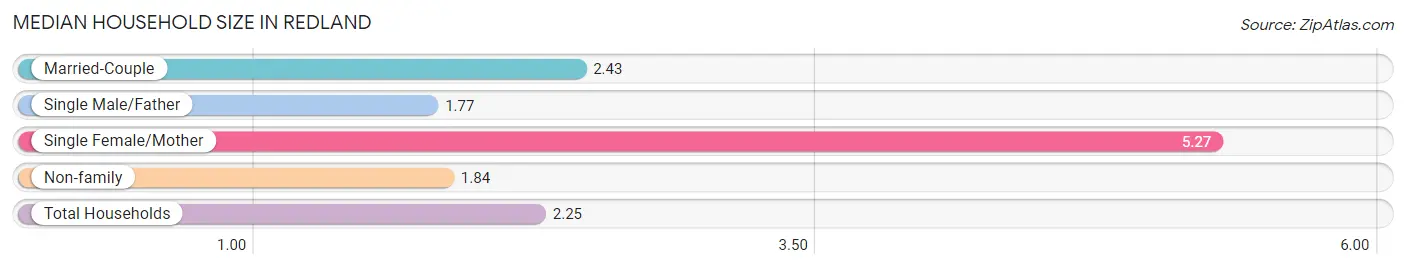
Median Household Size in Redland
The median household size in Redland is 2.25 persons per household, with single female/mother households (30 | 9.3%) accounting for the largest median household size of 5.27 persons per household. single male/father households (22 | 6.8%) represent the smallest median household size with 1.77 persons per household.
| Household Type | # Households | Household Size |
| Married-Couple | 51 (15.8%) | 2.43 |
| Single Male/Father | 22 (6.8%) | 1.77 |
| Single Female/Mother | 30 (9.3%) | 5.27 |
| Non-family | 219 (68.0%) | 1.84 |
| Total Households | 322 (100.0%) | 2.25 |
Household Size by Marriage Status in Redland
Out of a total of 322 households in Redland, 103 (32.0%) are family households, while 219 (68.0%) are nonfamily households. The most numerous type of family households are 2-person households, comprising 56, and the most common type of nonfamily households are 1-person households, comprising 166.
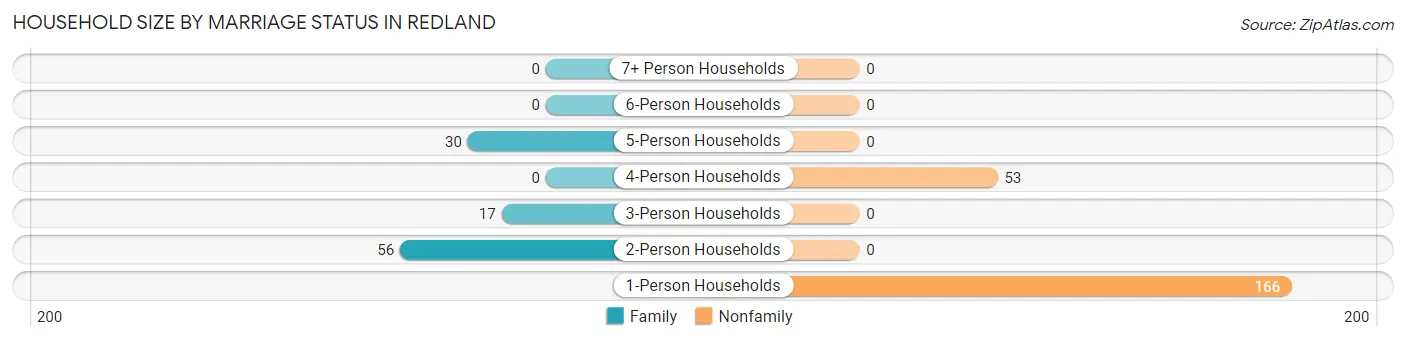
| Household Size | Family Households | Nonfamily Households |
| 1-Person Households | - | 166 (51.5%) |
| 2-Person Households | 56 (17.4%) | 0 (0.0%) |
| 3-Person Households | 17 (5.3%) | 0 (0.0%) |
| 4-Person Households | 0 (0.0%) | 53 (16.5%) |
| 5-Person Households | 30 (9.3%) | 0 (0.0%) |
| 6-Person Households | 0 (0.0%) | 0 (0.0%) |
| 7+ Person Households | 0 (0.0%) | 0 (0.0%) |
| Total | 103 (32.0%) | 219 (68.0%) |
Female Fertility in Redland
Fertility by Age in Redland
| Age Bracket | Women with Births | Births / 1,000 Women |
| 15 to 19 years | 0 (0.0%) | 0.0 |
| 20 to 34 years | 0 (0.0%) | 0.0 |
| 35 to 50 years | 0 (0.0%) | 0.0 |
| Total | 0 (0.0%) | 0.0 |
Fertility by Age by Marriage Status in Redland
| Age Bracket | Married | Unmarried |
| 15 to 19 years | 0 (0.0%) | 0 (0.0%) |
| 20 to 34 years | 0 (0.0%) | 0 (0.0%) |
| 35 to 50 years | 0 (0.0%) | 0 (0.0%) |
| Total | 0 (0.0%) | 0 (0.0%) |
Fertility by Education in Redland
| Educational Attainment | Women with Births | Births / 1,000 Women |
| Less than High School | 0 (0.0%) | 0.0 |
| High School Diploma | 0 (0.0%) | 0.0 |
| College or Associate's Degree | 0 (0.0%) | 0.0 |
| Bachelor's Degree | 0 (0.0%) | 0.0 |
| Graduate Degree | 0 (0.0%) | 0.0 |
| Total | 0 (0.0%) | 0.0 |
Fertility by Education by Marriage Status in Redland
| Educational Attainment | Married | Unmarried |
| Less than High School | 0 (0.0%) | 0 (0.0%) |
| High School Diploma | 0 (0.0%) | 0 (0.0%) |
| College or Associate's Degree | 0 (0.0%) | 0 (0.0%) |
| Bachelor's Degree | 0 (0.0%) | 0 (0.0%) |
| Graduate Degree | 0 (0.0%) | 0 (0.0%) |
| Total | 0 (0.0%) | 0 (0.0%) |
Employment Characteristics in Redland
Employment by Class of Employer in Redland
Among the 147 employed individuals in Redland, , and private company employees (147 | 100.0%) make up the most common classes of employment.
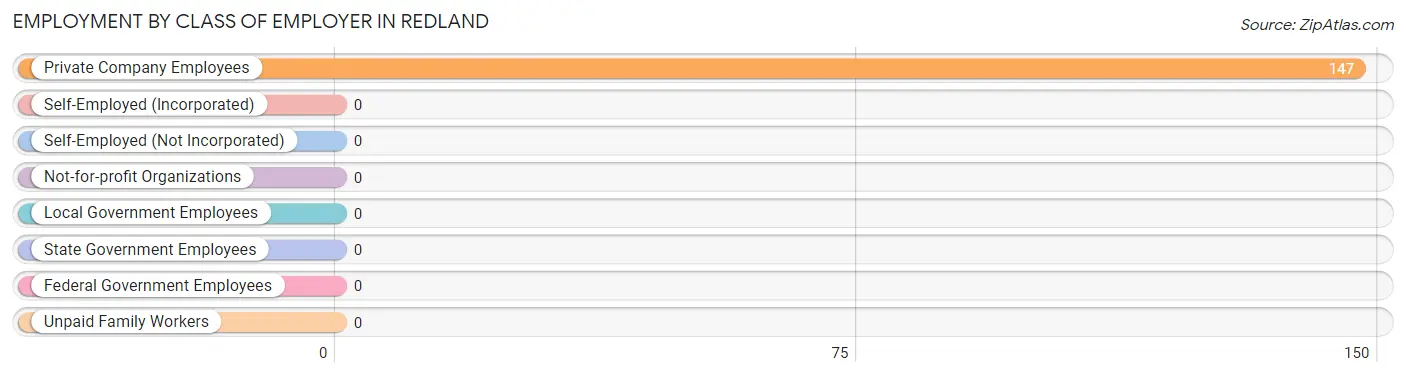
| Employer Class | # Employees | % Employees |
| Private Company Employees | 147 | 100.0% |
| Self-Employed (Incorporated) | 0 | 0.0% |
| Self-Employed (Not Incorporated) | 0 | 0.0% |
| Not-for-profit Organizations | 0 | 0.0% |
| Local Government Employees | 0 | 0.0% |
| State Government Employees | 0 | 0.0% |
| Federal Government Employees | 0 | 0.0% |
| Unpaid Family Workers | 0 | 0.0% |
| Total | 147 | 100.0% |
Employment Status by Age in Redland
According to the labor force statistics for Redland, out of the total population over 16 years of age (702), 40.7% or 286 individuals are in the labor force, with 48.6% or 139 of them unemployed. The age group with the highest labor force participation rate is 25 to 29 years, with 100.0% or 68 individuals in the labor force. Within the labor force, the 25 to 29 years age range has the highest percentage of unemployed individuals, with 100.0% or 68 of them being unemployed.
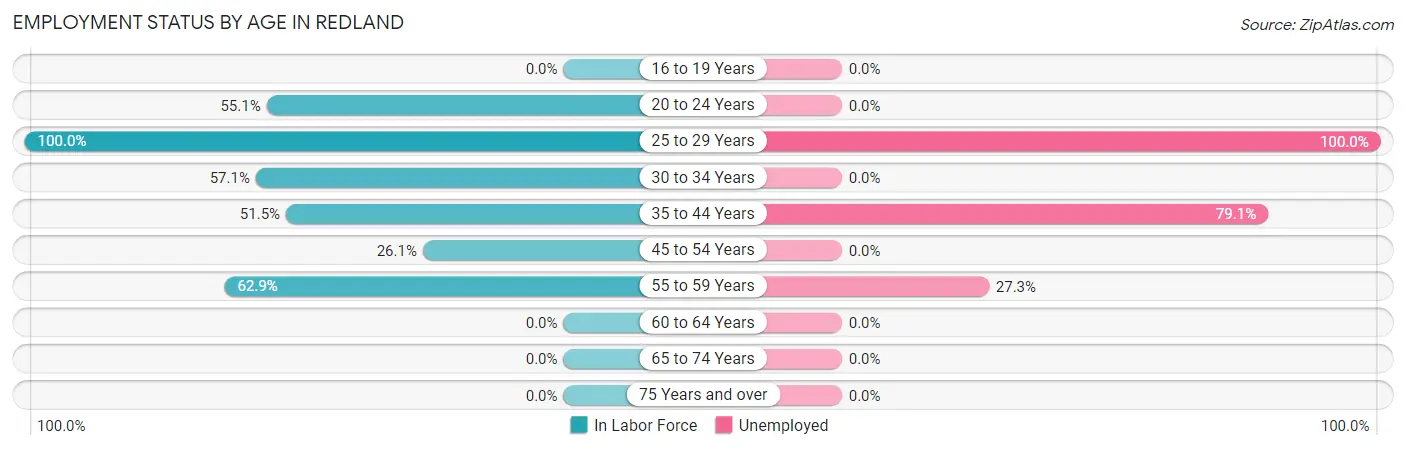
| Age Bracket | In Labor Force | Unemployed |
| 16 to 19 Years | 0 (0.0%) | 0 (0.0%) |
| 20 to 24 Years | 43 (55.1%) | 0 (0.0%) |
| 25 to 29 Years | 68 (100.0%) | 68 (100.0%) |
| 30 to 34 Years | 12 (57.1%) | 0 (0.0%) |
| 35 to 44 Years | 67 (51.5%) | 53 (79.1%) |
| 45 to 54 Years | 30 (26.1%) | 0 (0.0%) |
| 55 to 59 Years | 66 (62.9%) | 18 (27.3%) |
| 60 to 64 Years | 0 (0.0%) | 0 (0.0%) |
| 65 to 74 Years | 0 (0.0%) | 0 (0.0%) |
| 75 Years and over | 0 (0.0%) | 0 (0.0%) |
| Total | 286 (40.7%) | 139 (48.6%) |
Employment Status by Educational Attainment in Redland
According to labor force statistics for Redland, 47.9% of individuals (243) out of the total population between 25 and 64 years of age (507) are in the labor force, with 57.2% or 139 of them being unemployed. The group with the highest labor force participation rate are those with the educational attainment of college / associate degree, with 88.9% or 80 individuals in the labor force. Within the labor force, individuals with college / associate degree education have the highest percentage of unemployment, with 85.0% or 68 of them being unemployed.
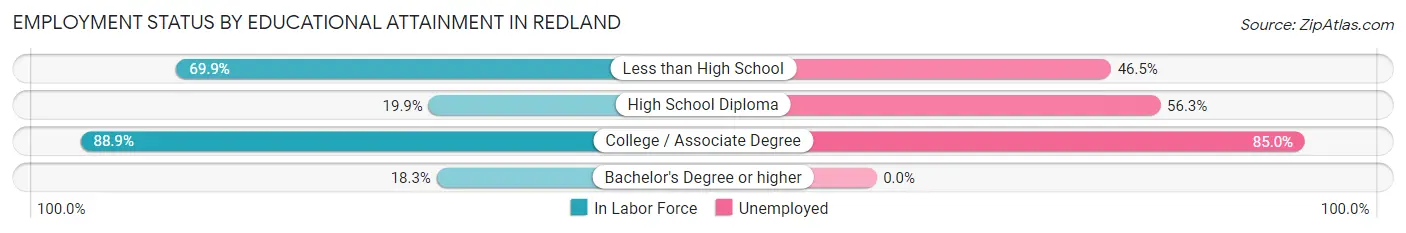
| Educational Attainment | In Labor Force | Unemployed |
| Less than High School | 114 (69.9%) | 76 (46.5%) |
| High School Diploma | 32 (19.9%) | 91 (56.3%) |
| College / Associate Degree | 80 (88.9%) | 76 (85.0%) |
| Bachelor's Degree or higher | 17 (18.3%) | 0 (0.0%) |
| Total | 243 (47.9%) | 290 (57.2%) |
Employment Occupations by Sex in Redland
Management, Business, Science and Arts Occupations
The most common Management, Business, Science and Arts occupations in Redland are , and Business & Financial (12 | 8.2%).
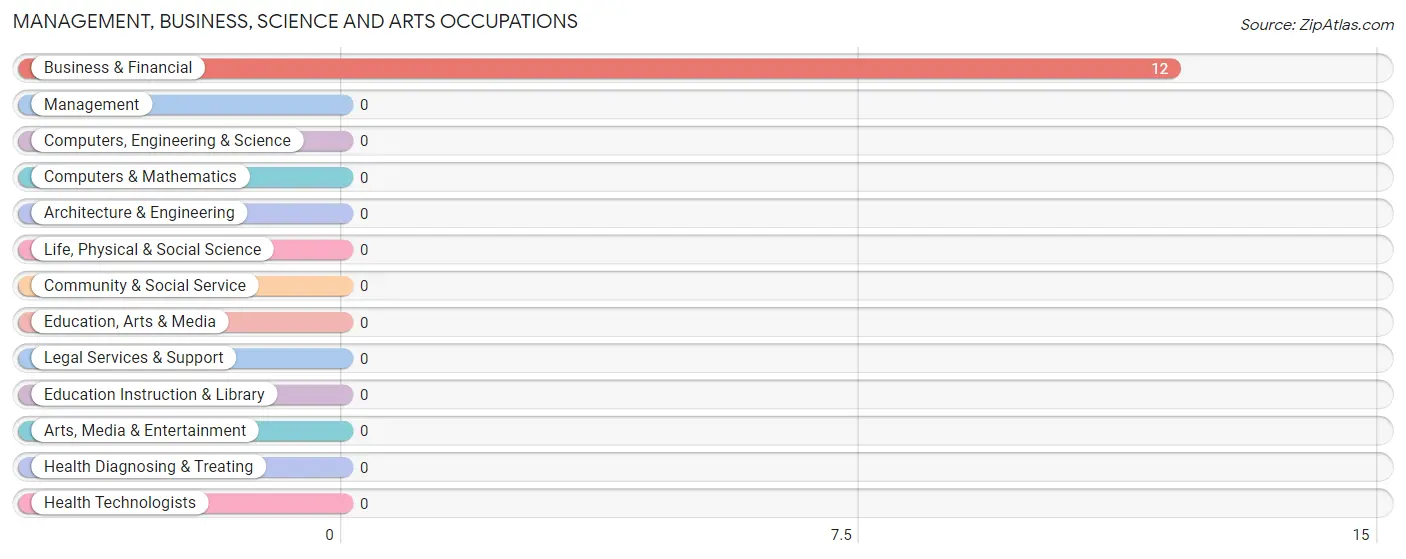
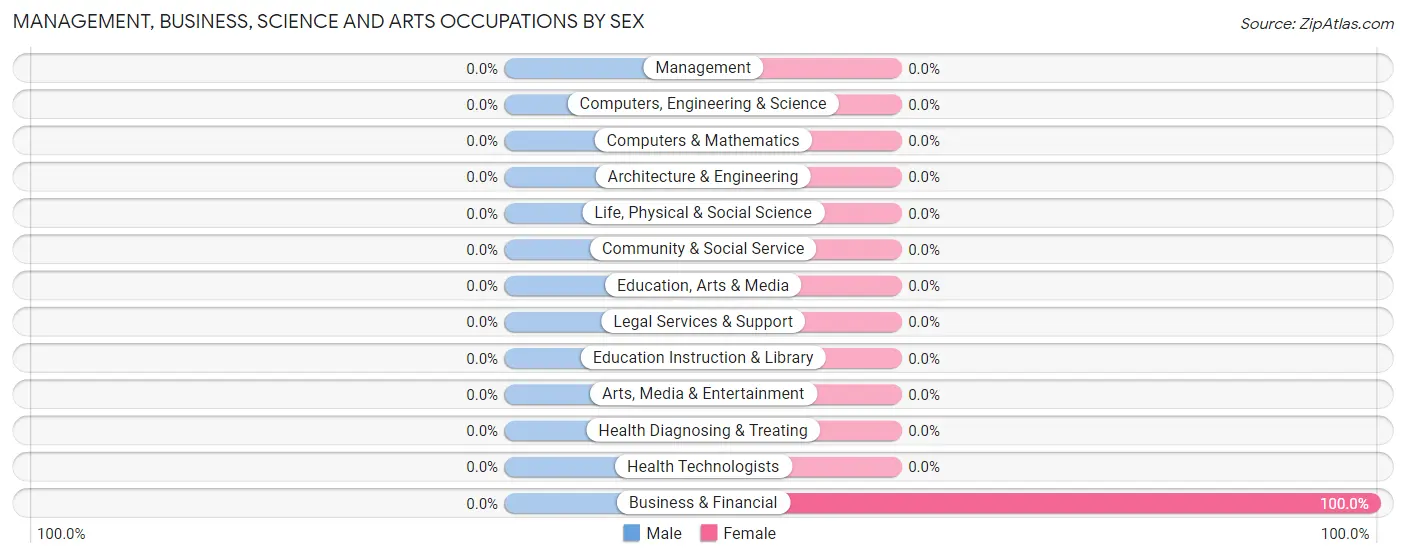
Management, Business, Science and Arts Occupations by Sex
| Occupation | Male | Female |
| Management | 0 (0.0%) | 0 (0.0%) |
| Business & Financial | 0 (0.0%) | 12 (100.0%) |
| Computers, Engineering & Science | 0 (0.0%) | 0 (0.0%) |
| Computers & Mathematics | 0 (0.0%) | 0 (0.0%) |
| Architecture & Engineering | 0 (0.0%) | 0 (0.0%) |
| Life, Physical & Social Science | 0 (0.0%) | 0 (0.0%) |
| Community & Social Service | 0 (0.0%) | 0 (0.0%) |
| Education, Arts & Media | 0 (0.0%) | 0 (0.0%) |
| Legal Services & Support | 0 (0.0%) | 0 (0.0%) |
| Education Instruction & Library | 0 (0.0%) | 0 (0.0%) |
| Arts, Media & Entertainment | 0 (0.0%) | 0 (0.0%) |
| Health Diagnosing & Treating | 0 (0.0%) | 0 (0.0%) |
| Health Technologists | 0 (0.0%) | 0 (0.0%) |
| Total (Category) | 0 (0.0%) | 12 (100.0%) |
| Total (Overall) | 88 (59.9%) | 59 (40.1%) |
Services Occupations
The most common Services occupations in Redland are , and Cleaning & Maintenance (10 | 6.8%).
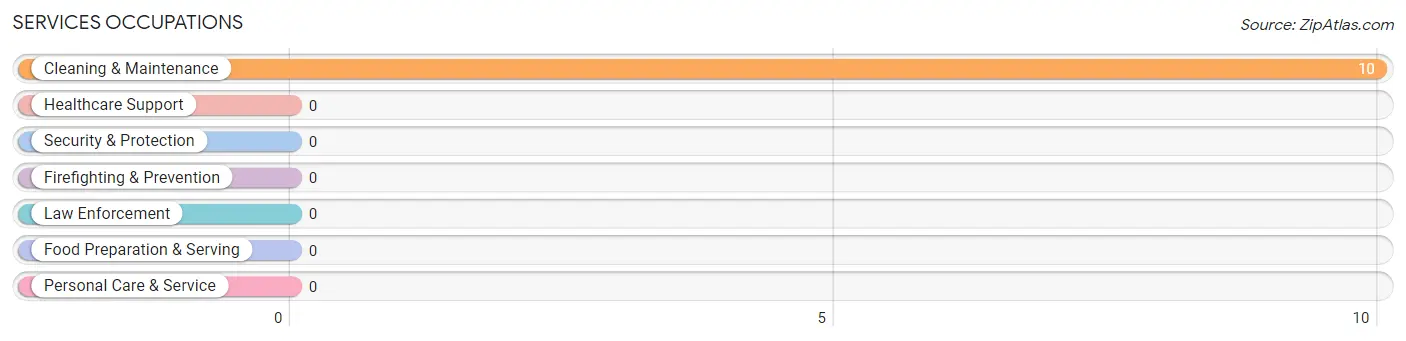
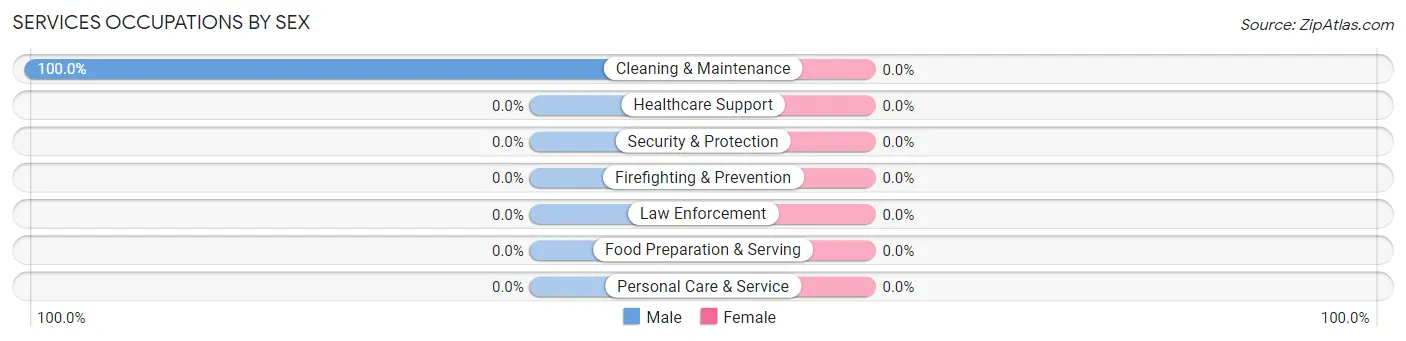
Services Occupations by Sex
| Occupation | Male | Female |
| Healthcare Support | 0 (0.0%) | 0 (0.0%) |
| Security & Protection | 0 (0.0%) | 0 (0.0%) |
| Firefighting & Prevention | 0 (0.0%) | 0 (0.0%) |
| Law Enforcement | 0 (0.0%) | 0 (0.0%) |
| Food Preparation & Serving | 0 (0.0%) | 0 (0.0%) |
| Cleaning & Maintenance | 10 (100.0%) | 0 (0.0%) |
| Personal Care & Service | 0 (0.0%) | 0 (0.0%) |
| Total (Category) | 10 (100.0%) | 0 (0.0%) |
| Total (Overall) | 88 (59.9%) | 59 (40.1%) |
Sales and Office Occupations
Sales and Office Occupations by Sex
| Occupation | Male | Female |
| Sales & Related | 0 (0.0%) | 0 (0.0%) |
| Office & Administration | 0 (0.0%) | 0 (0.0%) |
| Total (Category) | 0 (0.0%) | 0 (0.0%) |
| Total (Overall) | 88 (59.9%) | 59 (40.1%) |
Natural Resources, Construction and Maintenance Occupations
Natural Resources, Construction and Maintenance Occupations by Sex
| Occupation | Male | Female |
| Farming, Fishing & Forestry | 0 (0.0%) | 0 (0.0%) |
| Construction & Extraction | 0 (0.0%) | 0 (0.0%) |
| Installation, Maintenance & Repair | 0 (0.0%) | 0 (0.0%) |
| Total (Category) | 0 (0.0%) | 0 (0.0%) |
| Total (Overall) | 88 (59.9%) | 59 (40.1%) |
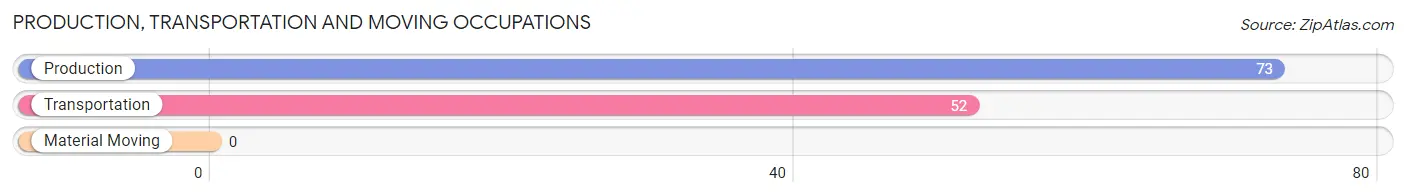
Production, Transportation and Moving Occupations
The most common Production, Transportation and Moving occupations in Redland are Production (73 | 49.7%), and Transportation (52 | 35.4%).
Production, Transportation and Moving Occupations by Sex
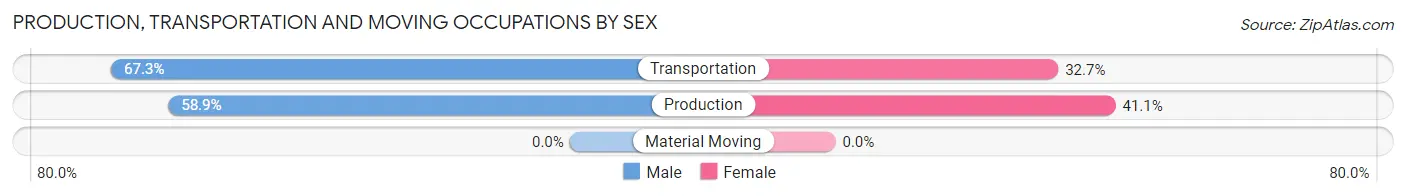
| Occupation | Male | Female |
| Production | 43 (58.9%) | 30 (41.1%) |
| Transportation | 35 (67.3%) | 17 (32.7%) |
| Material Moving | 0 (0.0%) | 0 (0.0%) |
| Total (Category) | 78 (62.4%) | 47 (37.6%) |
| Total (Overall) | 88 (59.9%) | 59 (40.1%) |
Employment Industries by Sex in Redland
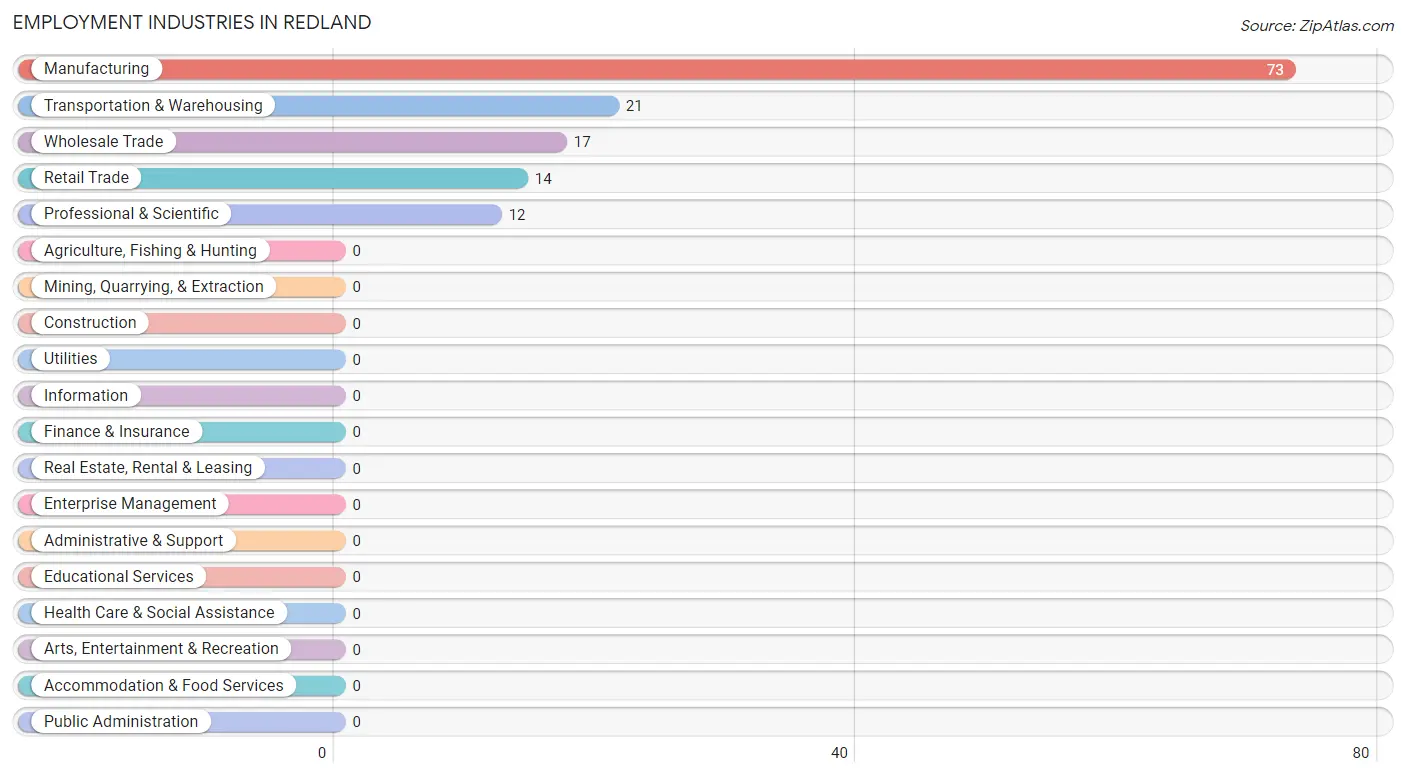
Employment Industries in Redland
The major employment industries in Redland include Manufacturing (73 | 49.7%), Transportation & Warehousing (21 | 14.3%), Wholesale Trade (17 | 11.6%), Retail Trade (14 | 9.5%), and Professional & Scientific (12 | 8.2%).
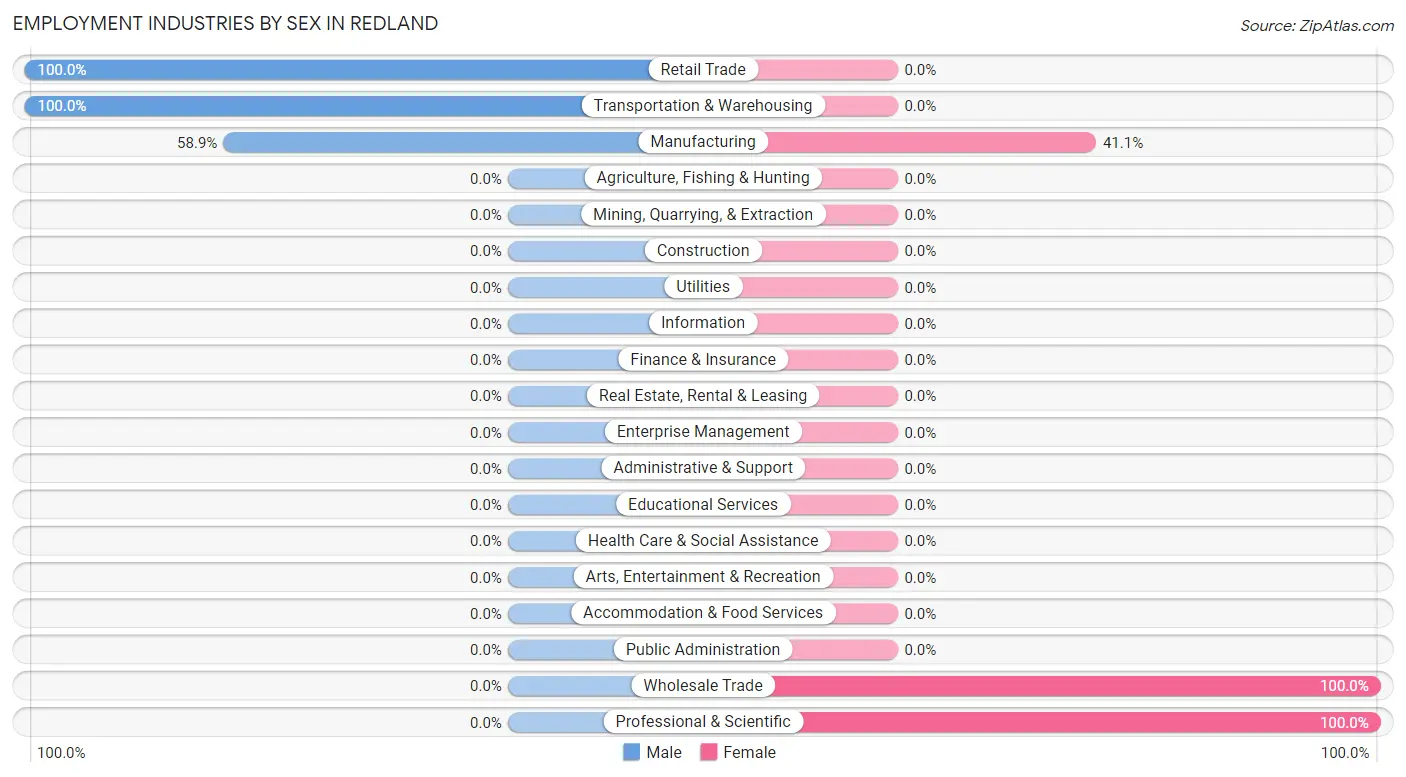
Employment Industries by Sex in Redland
The Redland industries that see more men than women are Retail Trade (100.0%), Transportation & Warehousing (100.0%), and Manufacturing (58.9%), whereas the industries that tend to have a higher number of women are Wholesale Trade (100.0%), Professional & Scientific (100.0%), and Manufacturing (41.1%).
| Industry | Male | Female |
| Agriculture, Fishing & Hunting | 0 (0.0%) | 0 (0.0%) |
| Mining, Quarrying, & Extraction | 0 (0.0%) | 0 (0.0%) |
| Construction | 0 (0.0%) | 0 (0.0%) |
| Manufacturing | 43 (58.9%) | 30 (41.1%) |
| Wholesale Trade | 0 (0.0%) | 17 (100.0%) |
| Retail Trade | 14 (100.0%) | 0 (0.0%) |
| Transportation & Warehousing | 21 (100.0%) | 0 (0.0%) |
| Utilities | 0 (0.0%) | 0 (0.0%) |
| Information | 0 (0.0%) | 0 (0.0%) |
| Finance & Insurance | 0 (0.0%) | 0 (0.0%) |
| Real Estate, Rental & Leasing | 0 (0.0%) | 0 (0.0%) |
| Professional & Scientific | 0 (0.0%) | 12 (100.0%) |
| Enterprise Management | 0 (0.0%) | 0 (0.0%) |
| Administrative & Support | 0 (0.0%) | 0 (0.0%) |
| Educational Services | 0 (0.0%) | 0 (0.0%) |
| Health Care & Social Assistance | 0 (0.0%) | 0 (0.0%) |
| Arts, Entertainment & Recreation | 0 (0.0%) | 0 (0.0%) |
| Accommodation & Food Services | 0 (0.0%) | 0 (0.0%) |
| Public Administration | 0 (0.0%) | 0 (0.0%) |
| Total | 88 (59.9%) | 59 (40.1%) |
Education in Redland
School Enrollment in Redland
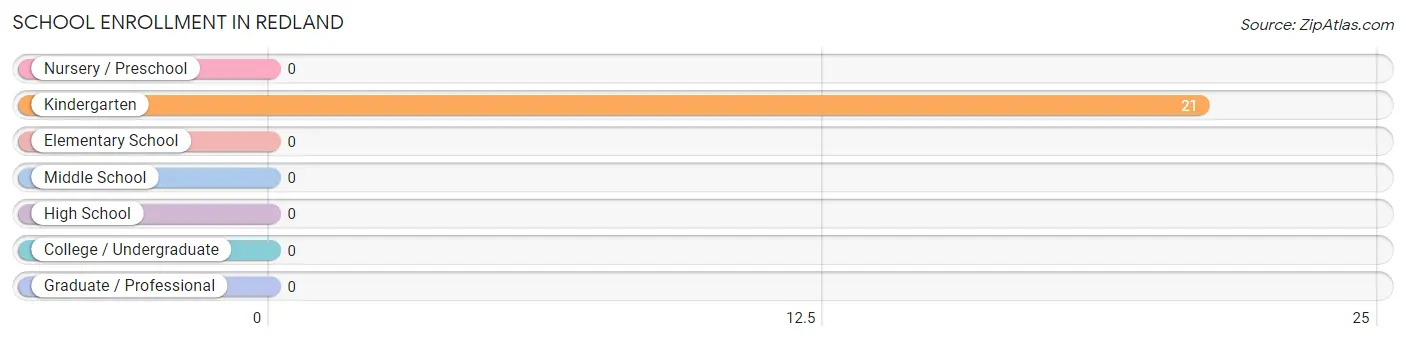
| School Level | # Students | % Students |
| Nursery / Preschool | 0 | 0.0% |
| Kindergarten | 21 | 100.0% |
| Elementary School | 0 | 0.0% |
| Middle School | 0 | 0.0% |
| High School | 0 | 0.0% |
| College / Undergraduate | 0 | 0.0% |
| Graduate / Professional | 0 | 0.0% |
| Total | 21 | 100.0% |
School Enrollment by Age by Funding Source in Redland
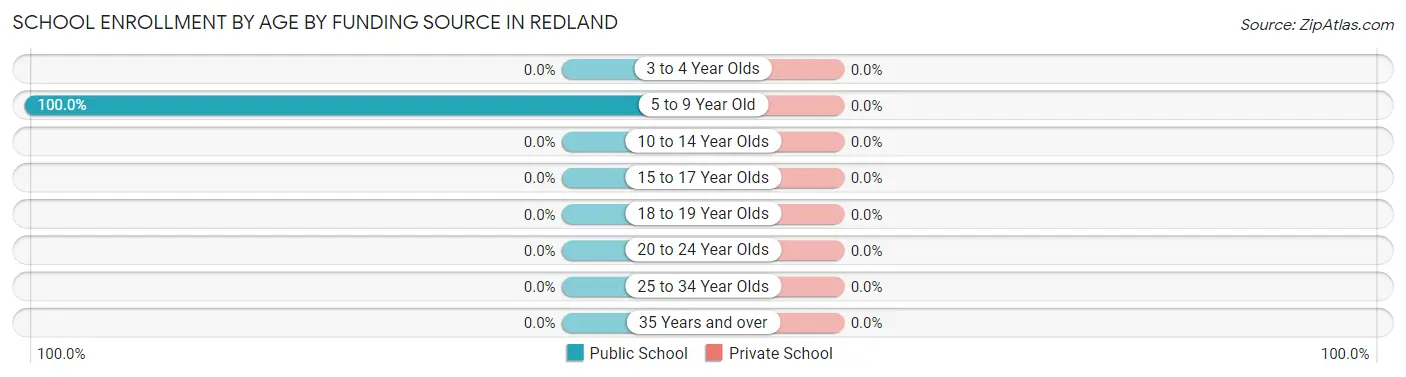
| Age Bracket | Public School | Private School |
| 3 to 4 Year Olds | 0 (0.0%) | 0 (0.0%) |
| 5 to 9 Year Old | 21 (100.0%) | 0 (0.0%) |
| 10 to 14 Year Olds | 0 (0.0%) | 0 (0.0%) |
| 15 to 17 Year Olds | 0 (0.0%) | 0 (0.0%) |
| 18 to 19 Year Olds | 0 (0.0%) | 0 (0.0%) |
| 20 to 24 Year Olds | 0 (0.0%) | 0 (0.0%) |
| 25 to 34 Year Olds | 0 (0.0%) | 0 (0.0%) |
| 35 Years and over | 0 (0.0%) | 0 (0.0%) |
| Total | 21 (100.0%) | 0 (0.0%) |
Educational Attainment by Field of Study in Redland
Engineering (76 | 54.7%), business (39 | 28.1%), education (17 | 12.2%), and science & technology (7 | 5.0%) are the most common fields of study among 139 individuals in Redland who have obtained a bachelor's degree or higher.
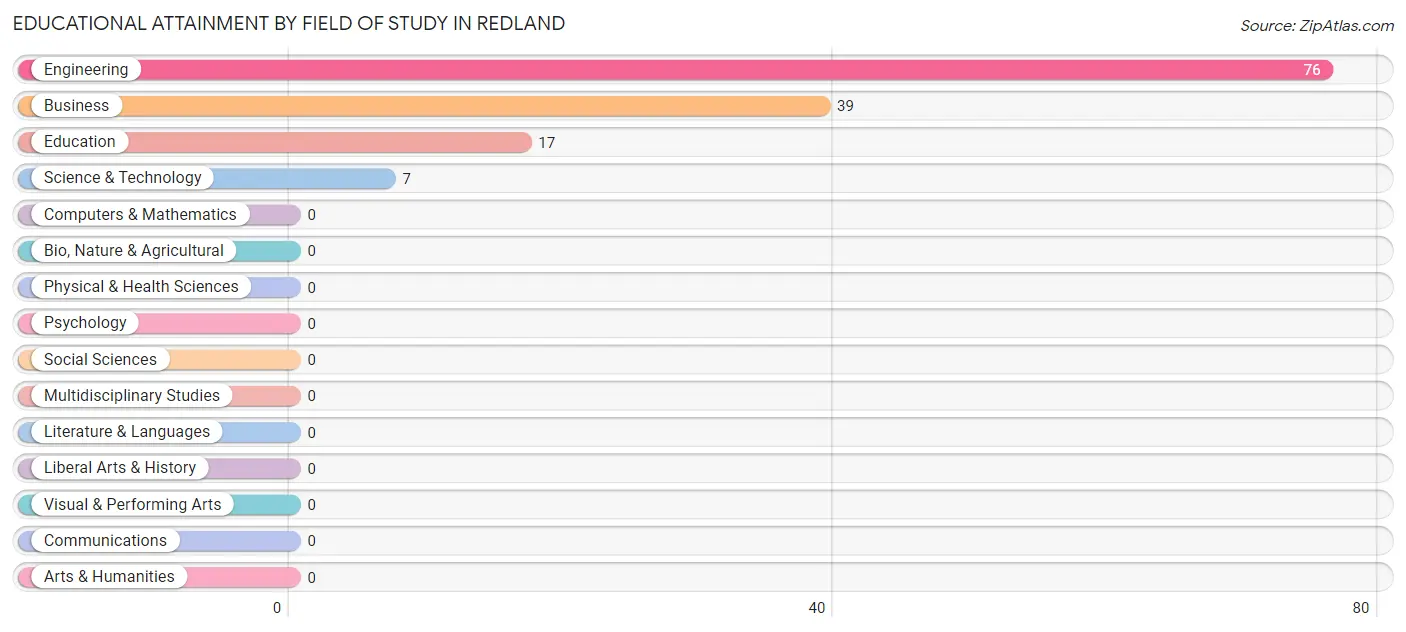
| Field of Study | # Graduates | % Graduates |
| Computers & Mathematics | 0 | 0.0% |
| Bio, Nature & Agricultural | 0 | 0.0% |
| Physical & Health Sciences | 0 | 0.0% |
| Psychology | 0 | 0.0% |
| Social Sciences | 0 | 0.0% |
| Engineering | 76 | 54.7% |
| Multidisciplinary Studies | 0 | 0.0% |
| Science & Technology | 7 | 5.0% |
| Business | 39 | 28.1% |
| Education | 17 | 12.2% |
| Literature & Languages | 0 | 0.0% |
| Liberal Arts & History | 0 | 0.0% |
| Visual & Performing Arts | 0 | 0.0% |
| Communications | 0 | 0.0% |
| Arts & Humanities | 0 | 0.0% |
| Total | 139 | 100.0% |
Transportation & Commute in Redland
Vehicle Availability by Sex in Redland
The most prevalent vehicle ownership categories in Redland are males with 2 vehicles (57, accounting for 64.8%) and females with 2 vehicles (30, making up 96.6%).
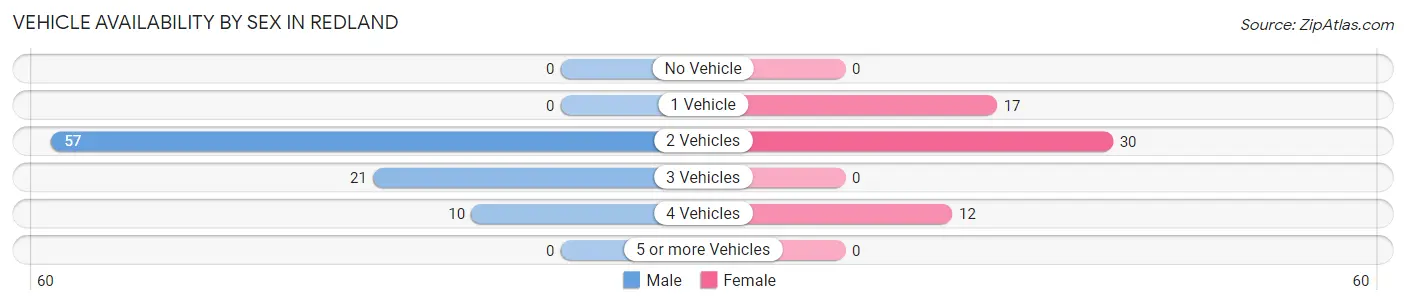
| Vehicles Available | Male | Female |
| No Vehicle | 0 (0.0%) | 0 (0.0%) |
| 1 Vehicle | 0 (0.0%) | 17 (28.8%) |
| 2 Vehicles | 57 (64.8%) | 30 (50.8%) |
| 3 Vehicles | 21 (23.9%) | 0 (0.0%) |
| 4 Vehicles | 10 (11.4%) | 12 (20.3%) |
| 5 or more Vehicles | 0 (0.0%) | 0 (0.0%) |
| Total | 88 (100.0%) | 59 (100.0%) |
Commute Time in Redland
The most frequently occuring commute durations in Redland are 10 to 14 minutes (43 commuters, 29.2%), 60 to 89 minutes (33 commuters, 22.5%), and 15 to 19 minutes (30 commuters, 20.4%).
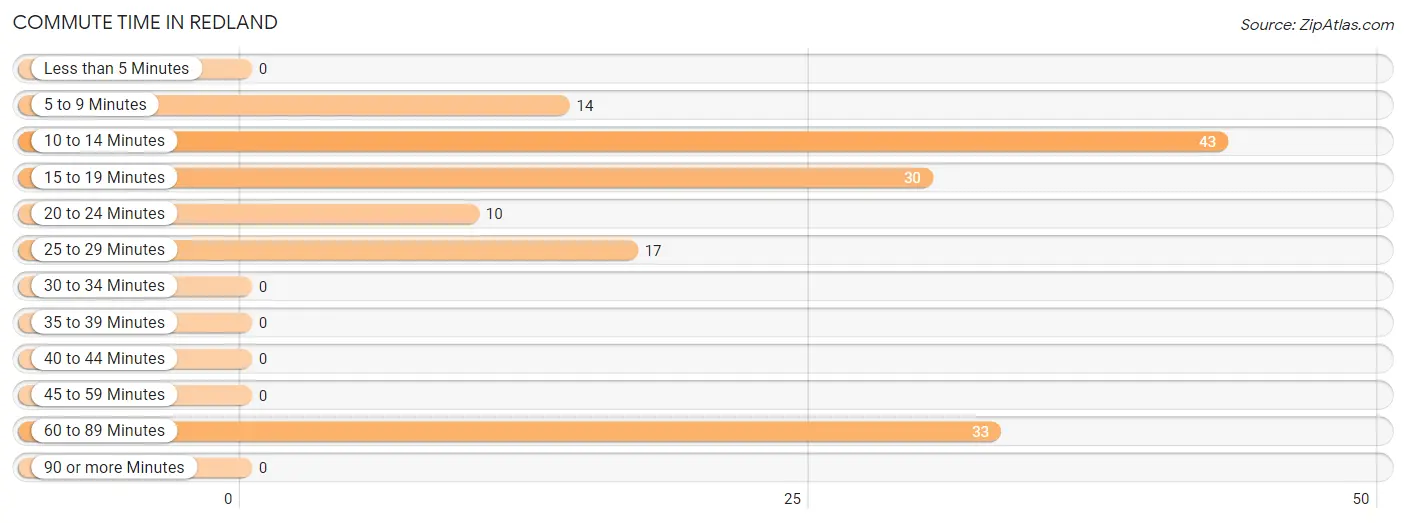
| Commute Time | # Commuters | % Commuters |
| Less than 5 Minutes | 0 | 0.0% |
| 5 to 9 Minutes | 14 | 9.5% |
| 10 to 14 Minutes | 43 | 29.2% |
| 15 to 19 Minutes | 30 | 20.4% |
| 20 to 24 Minutes | 10 | 6.8% |
| 25 to 29 Minutes | 17 | 11.6% |
| 30 to 34 Minutes | 0 | 0.0% |
| 35 to 39 Minutes | 0 | 0.0% |
| 40 to 44 Minutes | 0 | 0.0% |
| 45 to 59 Minutes | 0 | 0.0% |
| 60 to 89 Minutes | 33 | 22.5% |
| 90 or more Minutes | 0 | 0.0% |
Commute Time by Sex in Redland
The most common commute times in Redland are 10 to 14 minutes (43 commuters, 48.9%) for males and 15 to 19 minutes (30 commuters, 50.8%) for females.
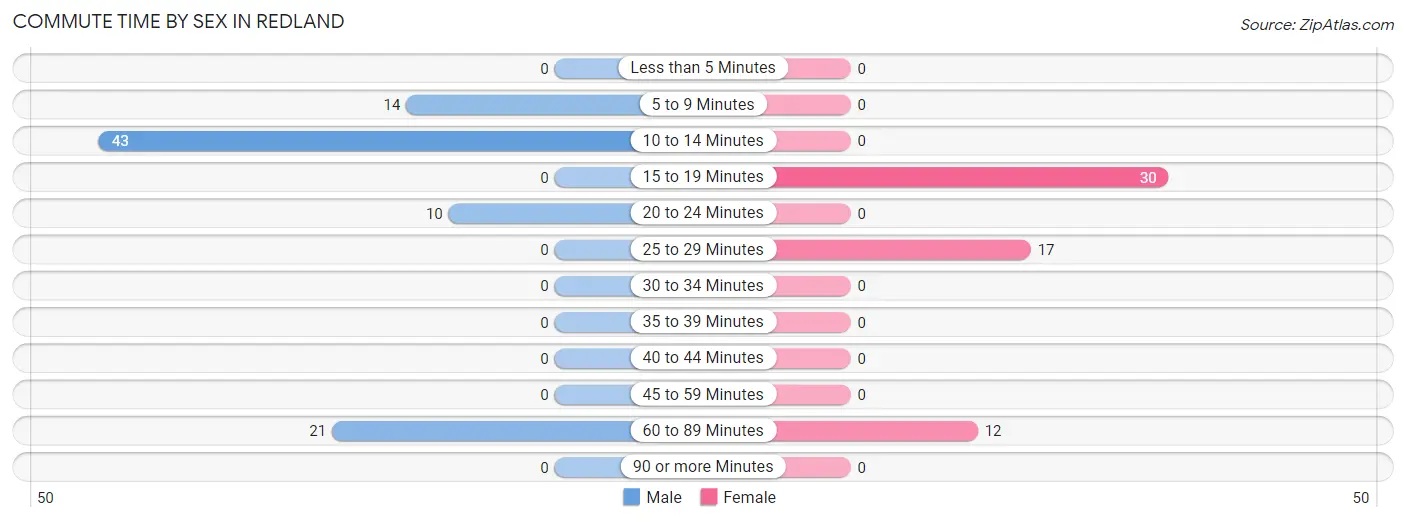
| Commute Time | Male | Female |
| Less than 5 Minutes | 0 (0.0%) | 0 (0.0%) |
| 5 to 9 Minutes | 14 (15.9%) | 0 (0.0%) |
| 10 to 14 Minutes | 43 (48.9%) | 0 (0.0%) |
| 15 to 19 Minutes | 0 (0.0%) | 30 (50.8%) |
| 20 to 24 Minutes | 10 (11.4%) | 0 (0.0%) |
| 25 to 29 Minutes | 0 (0.0%) | 17 (28.8%) |
| 30 to 34 Minutes | 0 (0.0%) | 0 (0.0%) |
| 35 to 39 Minutes | 0 (0.0%) | 0 (0.0%) |
| 40 to 44 Minutes | 0 (0.0%) | 0 (0.0%) |
| 45 to 59 Minutes | 0 (0.0%) | 0 (0.0%) |
| 60 to 89 Minutes | 21 (23.9%) | 12 (20.3%) |
| 90 or more Minutes | 0 (0.0%) | 0 (0.0%) |
Time of Departure to Work by Sex in Redland
The most frequent times of departure to work in Redland are 4:00 PM to 11:59 PM (43, 48.9%) for males and 7:30 AM to 7:59 AM (30, 50.8%) for females.
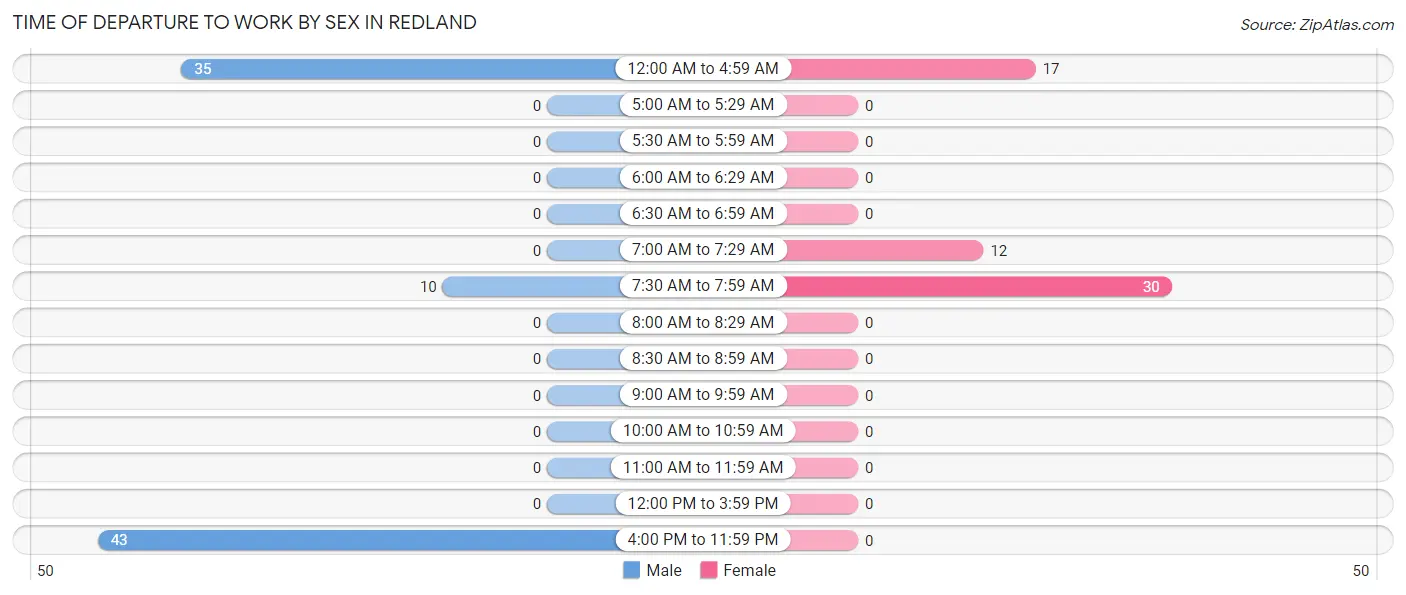
| Time of Departure | Male | Female |
| 12:00 AM to 4:59 AM | 35 (39.8%) | 17 (28.8%) |
| 5:00 AM to 5:29 AM | 0 (0.0%) | 0 (0.0%) |
| 5:30 AM to 5:59 AM | 0 (0.0%) | 0 (0.0%) |
| 6:00 AM to 6:29 AM | 0 (0.0%) | 0 (0.0%) |
| 6:30 AM to 6:59 AM | 0 (0.0%) | 0 (0.0%) |
| 7:00 AM to 7:29 AM | 0 (0.0%) | 12 (20.3%) |
| 7:30 AM to 7:59 AM | 10 (11.4%) | 30 (50.8%) |
| 8:00 AM to 8:29 AM | 0 (0.0%) | 0 (0.0%) |
| 8:30 AM to 8:59 AM | 0 (0.0%) | 0 (0.0%) |
| 9:00 AM to 9:59 AM | 0 (0.0%) | 0 (0.0%) |
| 10:00 AM to 10:59 AM | 0 (0.0%) | 0 (0.0%) |
| 11:00 AM to 11:59 AM | 0 (0.0%) | 0 (0.0%) |
| 12:00 PM to 3:59 PM | 0 (0.0%) | 0 (0.0%) |
| 4:00 PM to 11:59 PM | 43 (48.9%) | 0 (0.0%) |
| Total | 88 (100.0%) | 59 (100.0%) |
Housing Occupancy in Redland
Occupancy by Ownership in Redland
Of the total 322 dwellings in Redland, owner-occupied units account for 235 (73.0%), while renter-occupied units make up 87 (27.0%).

| Occupancy | # Housing Units | % Housing Units |
| Owner Occupied Housing Units | 235 | 73.0% |
| Renter-Occupied Housing Units | 87 | 27.0% |
| Total Occupied Housing Units | 322 | 100.0% |
Occupancy by Household Size in Redland
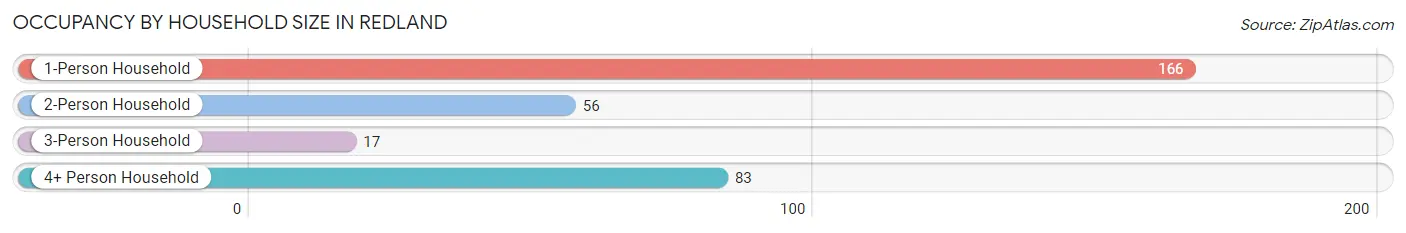
| Household Size | # Housing Units | % Housing Units |
| 1-Person Household | 166 | 51.5% |
| 2-Person Household | 56 | 17.4% |
| 3-Person Household | 17 | 5.3% |
| 4+ Person Household | 83 | 25.8% |
| Total Housing Units | 322 | 100.0% |
Occupancy by Ownership by Household Size in Redland
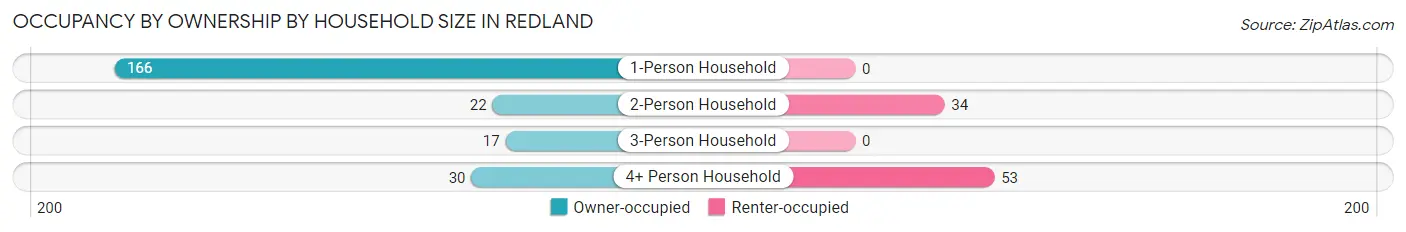
| Household Size | Owner-occupied | Renter-occupied |
| 1-Person Household | 166 (100.0%) | 0 (0.0%) |
| 2-Person Household | 22 (39.3%) | 34 (60.7%) |
| 3-Person Household | 17 (100.0%) | 0 (0.0%) |
| 4+ Person Household | 30 (36.1%) | 53 (63.9%) |
| Total Housing Units | 235 (73.0%) | 87 (27.0%) |
Occupancy by Educational Attainment in Redland
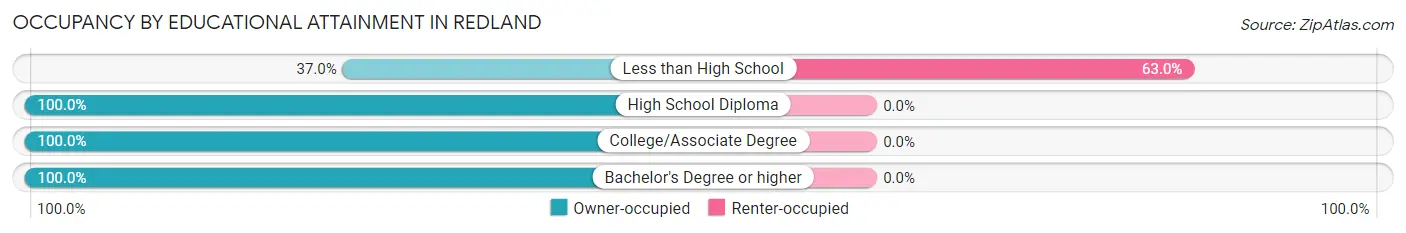
| Household Size | Owner-occupied | Renter-occupied |
| Less than High School | 51 (37.0%) | 87 (63.0%) |
| High School Diploma | 25 (100.0%) | 0 (0.0%) |
| College/Associate Degree | 59 (100.0%) | 0 (0.0%) |
| Bachelor's Degree or higher | 100 (100.0%) | 0 (0.0%) |
Occupancy by Age of Householder in Redland
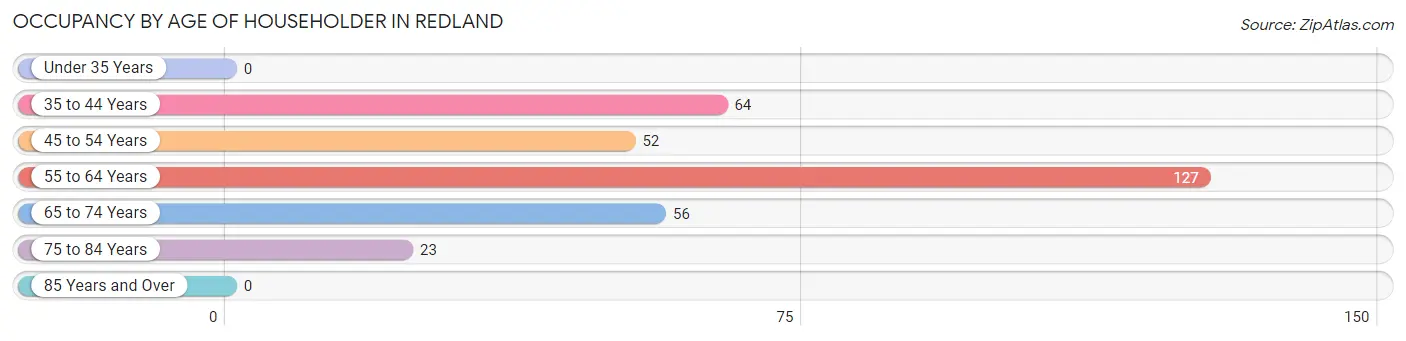
| Age Bracket | # Households | % Households |
| Under 35 Years | 0 | 0.0% |
| 35 to 44 Years | 64 | 19.9% |
| 45 to 54 Years | 52 | 16.2% |
| 55 to 64 Years | 127 | 39.4% |
| 65 to 74 Years | 56 | 17.4% |
| 75 to 84 Years | 23 | 7.1% |
| 85 Years and Over | 0 | 0.0% |
| Total | 322 | 100.0% |
Housing Finances in Redland
Median Income by Occupancy in Redland
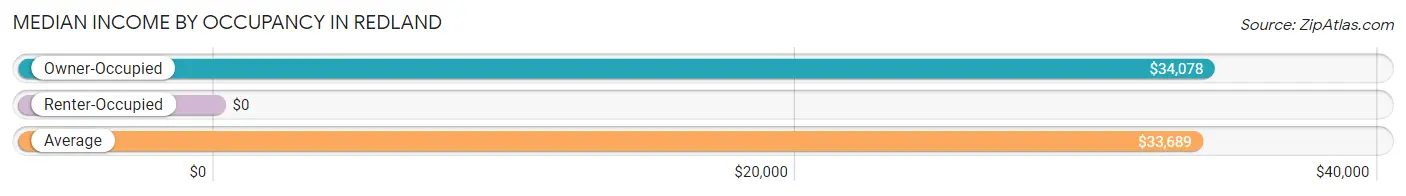
| Occupancy Type | # Households | Median Income |
| Owner-Occupied | 235 (73.0%) | $34,078 |
| Renter-Occupied | 87 (27.0%) | $0 |
| Average | 322 (100.0%) | $33,689 |
Occupancy by Householder Income Bracket in Redland
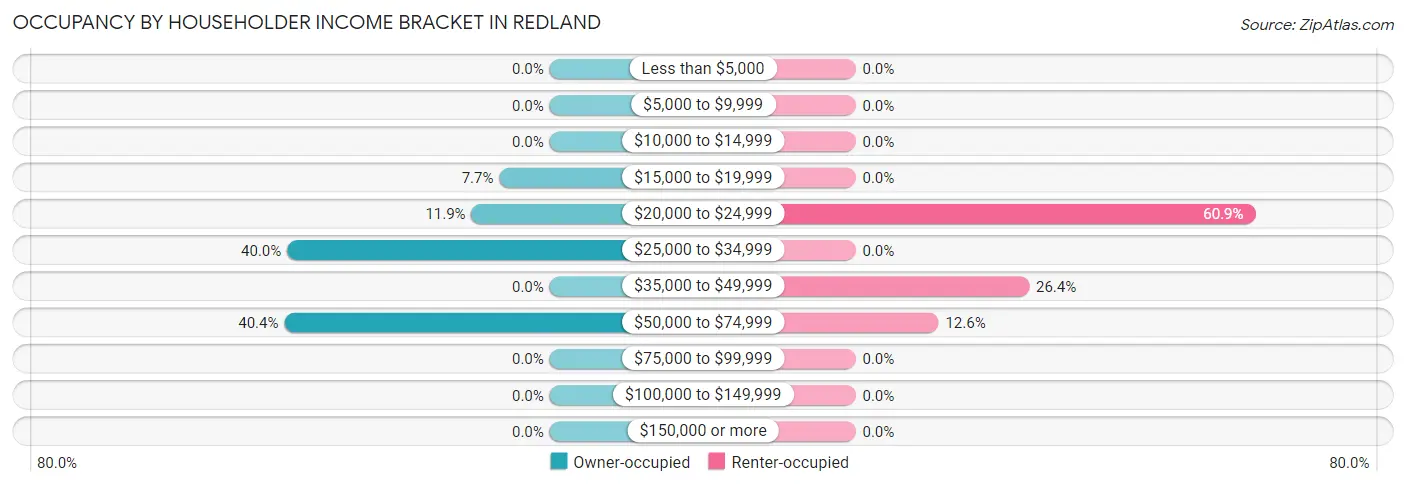
| Income Bracket | Owner-occupied | Renter-occupied |
| Less than $5,000 | 0 (0.0%) | 0 (0.0%) |
| $5,000 to $9,999 | 0 (0.0%) | 0 (0.0%) |
| $10,000 to $14,999 | 0 (0.0%) | 0 (0.0%) |
| $15,000 to $19,999 | 18 (7.7%) | 0 (0.0%) |
| $20,000 to $24,999 | 28 (11.9%) | 53 (60.9%) |
| $25,000 to $34,999 | 94 (40.0%) | 0 (0.0%) |
| $35,000 to $49,999 | 0 (0.0%) | 23 (26.4%) |
| $50,000 to $74,999 | 95 (40.4%) | 11 (12.6%) |
| $75,000 to $99,999 | 0 (0.0%) | 0 (0.0%) |
| $100,000 to $149,999 | 0 (0.0%) | 0 (0.0%) |
| $150,000 or more | 0 (0.0%) | 0 (0.0%) |
| Total | 235 (100.0%) | 87 (100.0%) |
Monthly Housing Cost Tiers in Redland
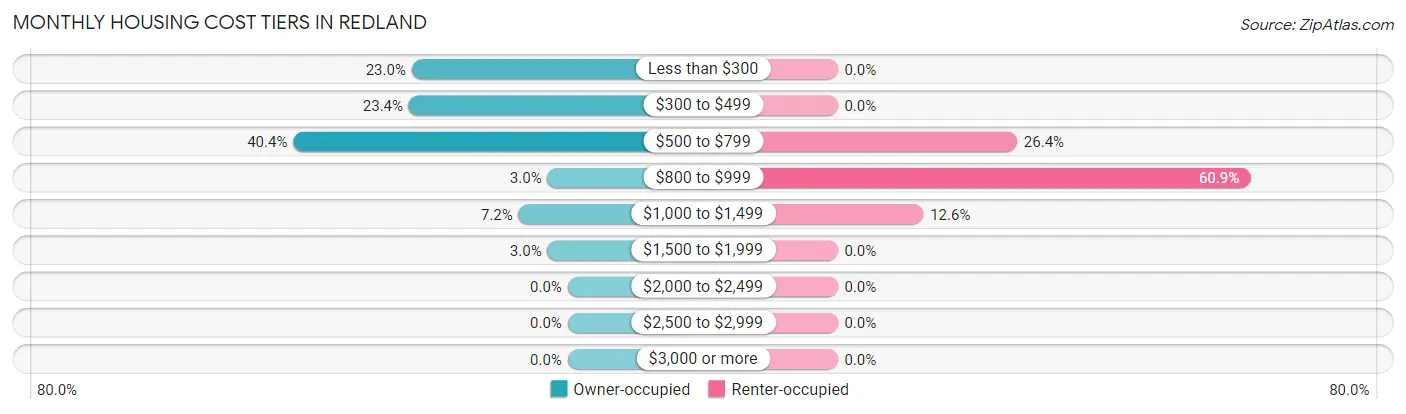
| Monthly Cost | Owner-occupied | Renter-occupied |
| Less than $300 | 54 (23.0%) | 0 (0.0%) |
| $300 to $499 | 55 (23.4%) | 0 (0.0%) |
| $500 to $799 | 95 (40.4%) | 23 (26.4%) |
| $800 to $999 | 7 (3.0%) | 53 (60.9%) |
| $1,000 to $1,499 | 17 (7.2%) | 11 (12.6%) |
| $1,500 to $1,999 | 7 (3.0%) | 0 (0.0%) |
| $2,000 to $2,499 | 0 (0.0%) | 0 (0.0%) |
| $2,500 to $2,999 | 0 (0.0%) | 0 (0.0%) |
| $3,000 or more | 0 (0.0%) | 0 (0.0%) |
| Total | 235 (100.0%) | 87 (100.0%) |
Physical Housing Characteristics in Redland
Housing Structures in Redland
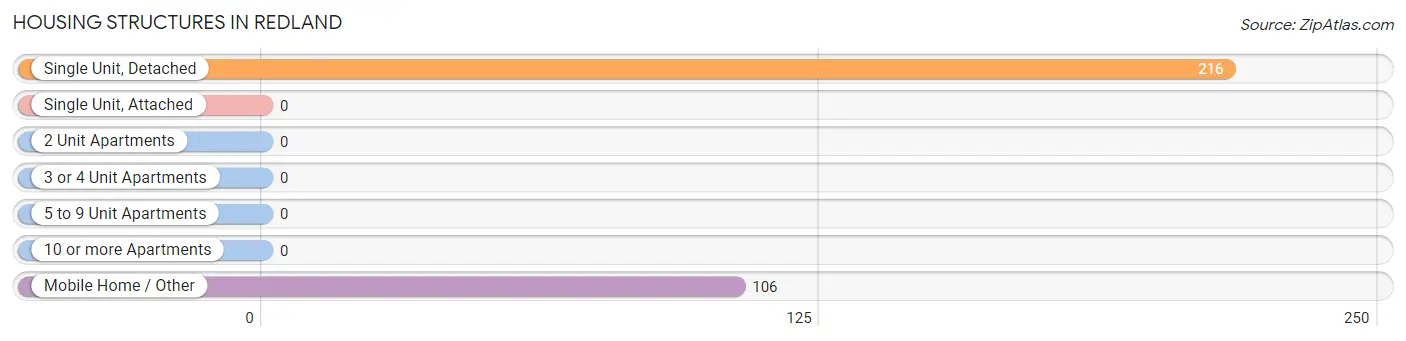
| Structure Type | # Housing Units | % Housing Units |
| Single Unit, Detached | 216 | 67.1% |
| Single Unit, Attached | 0 | 0.0% |
| 2 Unit Apartments | 0 | 0.0% |
| 3 or 4 Unit Apartments | 0 | 0.0% |
| 5 to 9 Unit Apartments | 0 | 0.0% |
| 10 or more Apartments | 0 | 0.0% |
| Mobile Home / Other | 106 | 32.9% |
| Total | 322 | 100.0% |
Housing Structures by Occupancy in Redland
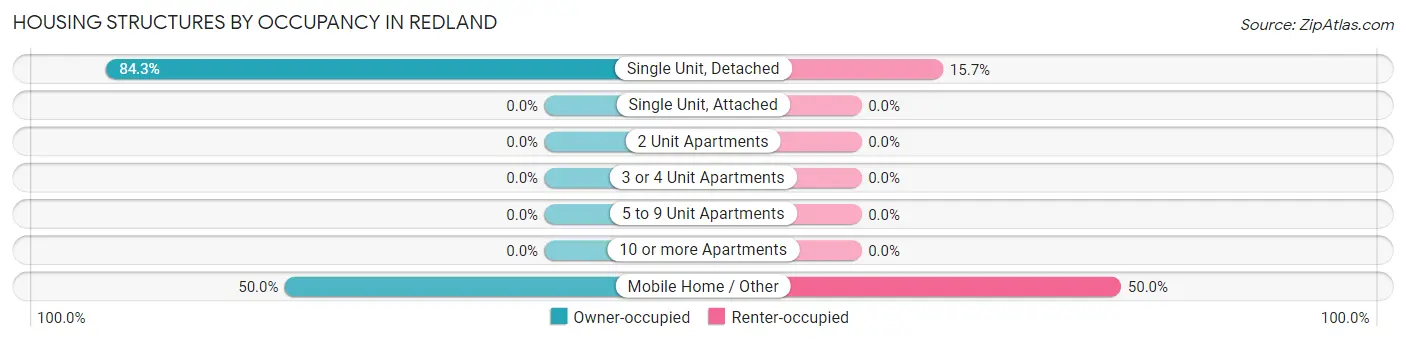
| Structure Type | Owner-occupied | Renter-occupied |
| Single Unit, Detached | 182 (84.3%) | 34 (15.7%) |
| Single Unit, Attached | 0 (0.0%) | 0 (0.0%) |
| 2 Unit Apartments | 0 (0.0%) | 0 (0.0%) |
| 3 or 4 Unit Apartments | 0 (0.0%) | 0 (0.0%) |
| 5 to 9 Unit Apartments | 0 (0.0%) | 0 (0.0%) |
| 10 or more Apartments | 0 (0.0%) | 0 (0.0%) |
| Mobile Home / Other | 53 (50.0%) | 53 (50.0%) |
| Total | 235 (73.0%) | 87 (27.0%) |
Housing Structures by Number of Rooms in Redland
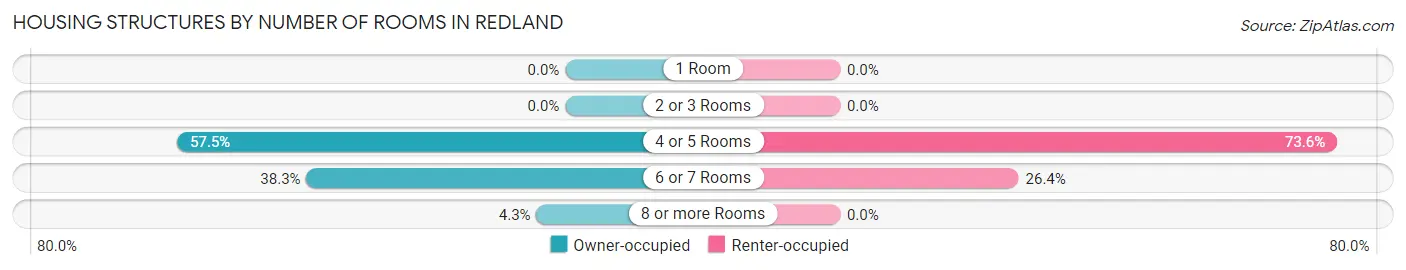
| Number of Rooms | Owner-occupied | Renter-occupied |
| 1 Room | 0 (0.0%) | 0 (0.0%) |
| 2 or 3 Rooms | 0 (0.0%) | 0 (0.0%) |
| 4 or 5 Rooms | 135 (57.5%) | 64 (73.6%) |
| 6 or 7 Rooms | 90 (38.3%) | 23 (26.4%) |
| 8 or more Rooms | 10 (4.3%) | 0 (0.0%) |
| Total | 235 (100.0%) | 87 (100.0%) |
Housing Structure by Heating Type in Redland
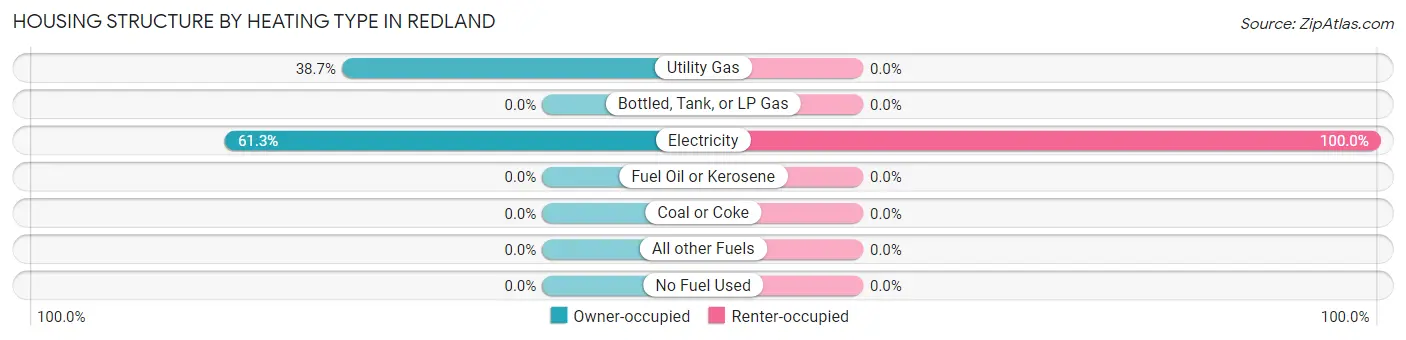
| Heating Type | Owner-occupied | Renter-occupied |
| Utility Gas | 91 (38.7%) | 0 (0.0%) |
| Bottled, Tank, or LP Gas | 0 (0.0%) | 0 (0.0%) |
| Electricity | 144 (61.3%) | 87 (100.0%) |
| Fuel Oil or Kerosene | 0 (0.0%) | 0 (0.0%) |
| Coal or Coke | 0 (0.0%) | 0 (0.0%) |
| All other Fuels | 0 (0.0%) | 0 (0.0%) |
| No Fuel Used | 0 (0.0%) | 0 (0.0%) |
| Total | 235 (100.0%) | 87 (100.0%) |
Household Vehicle Usage in Redland
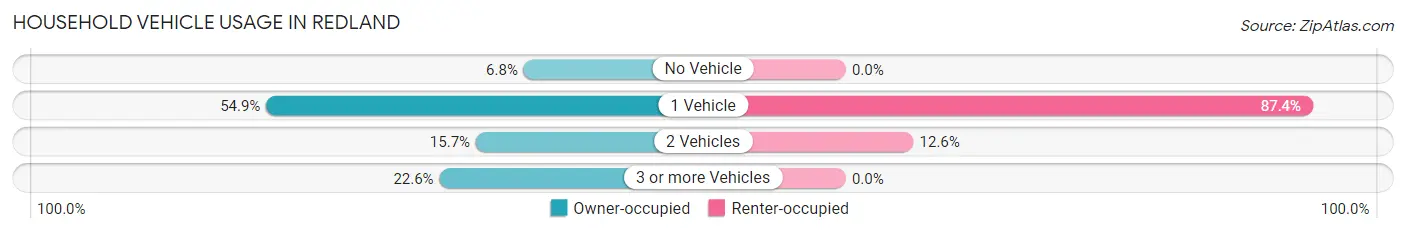
| Vehicles per Household | Owner-occupied | Renter-occupied |
| No Vehicle | 16 (6.8%) | 0 (0.0%) |
| 1 Vehicle | 129 (54.9%) | 76 (87.4%) |
| 2 Vehicles | 37 (15.7%) | 11 (12.6%) |
| 3 or more Vehicles | 53 (22.6%) | 0 (0.0%) |
| Total | 235 (100.0%) | 87 (100.0%) |
Real Estate & Mortgages in Redland
Real Estate and Mortgage Overview in Redland
| Characteristic | Without Mortgage | With Mortgage |
| Housing Units | 181 | 54 |
| Median Property Value | $129,900 | $99,000 |
| Median Household Income | $33,032 | $0 |
| Monthly Housing Costs | $466 | $0 |
| Real Estate Taxes | $1,041 | $0 |
Property Value by Mortgage Status in Redland
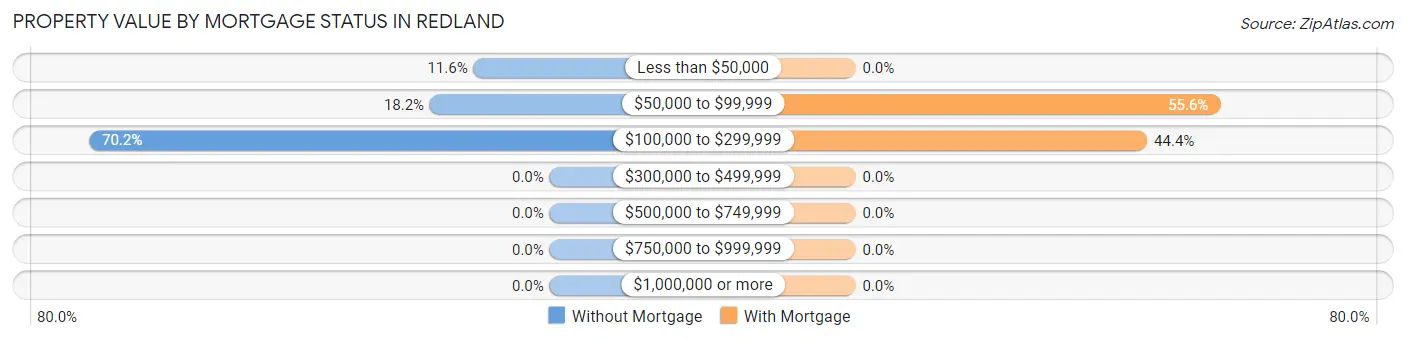
| Property Value | Without Mortgage | With Mortgage |
| Less than $50,000 | 21 (11.6%) | 0 (0.0%) |
| $50,000 to $99,999 | 33 (18.2%) | 30 (55.6%) |
| $100,000 to $299,999 | 127 (70.2%) | 24 (44.4%) |
| $300,000 to $499,999 | 0 (0.0%) | 0 (0.0%) |
| $500,000 to $749,999 | 0 (0.0%) | 0 (0.0%) |
| $750,000 to $999,999 | 0 (0.0%) | 0 (0.0%) |
| $1,000,000 or more | 0 (0.0%) | 0 (0.0%) |
| Total | 181 (100.0%) | 54 (100.0%) |
Household Income by Mortgage Status in Redland
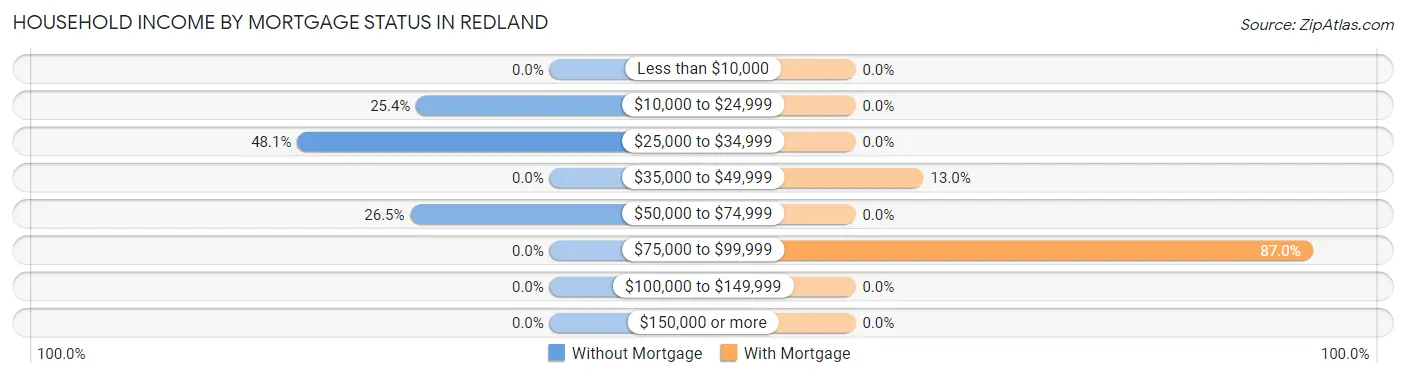
| Household Income | Without Mortgage | With Mortgage |
| Less than $10,000 | 0 (0.0%) | 0 (0.0%) |
| $10,000 to $24,999 | 46 (25.4%) | 0 (0.0%) |
| $25,000 to $34,999 | 87 (48.1%) | 0 (0.0%) |
| $35,000 to $49,999 | 0 (0.0%) | 7 (13.0%) |
| $50,000 to $74,999 | 48 (26.5%) | 0 (0.0%) |
| $75,000 to $99,999 | 0 (0.0%) | 47 (87.0%) |
| $100,000 to $149,999 | 0 (0.0%) | 0 (0.0%) |
| $150,000 or more | 0 (0.0%) | 0 (0.0%) |
| Total | 181 (100.0%) | 54 (100.0%) |
Property Value to Household Income Ratio in Redland
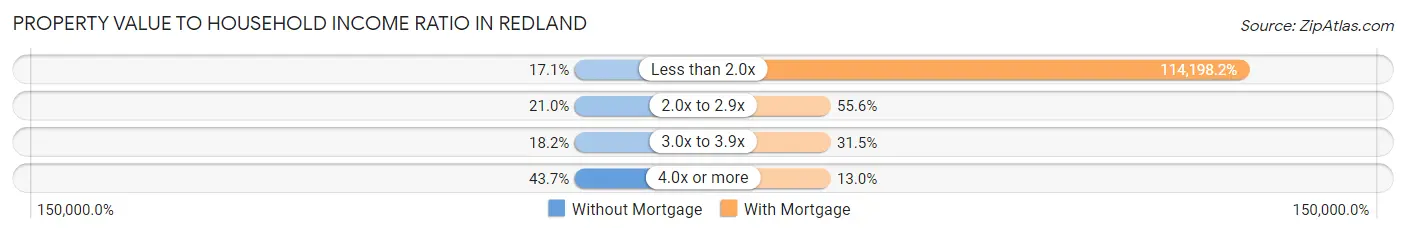
| Value-to-Income Ratio | Without Mortgage | With Mortgage |
| Less than 2.0x | 31 (17.1%) | 61,667 (114,198.2%) |
| 2.0x to 2.9x | 38 (21.0%) | 30 (55.6%) |
| 3.0x to 3.9x | 33 (18.2%) | 17 (31.5%) |
| 4.0x or more | 79 (43.6%) | 7 (13.0%) |
| Total | 181 (100.0%) | 54 (100.0%) |
Real Estate Taxes by Mortgage Status in Redland
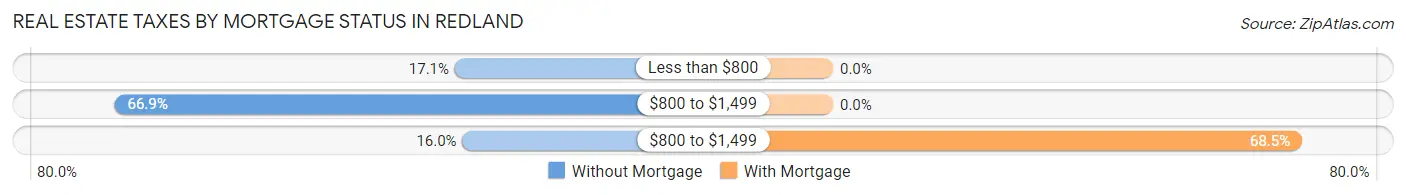
| Property Taxes | Without Mortgage | With Mortgage |
| Less than $800 | 31 (17.1%) | 0 (0.0%) |
| $800 to $1,499 | 121 (66.8%) | 0 (0.0%) |
| $800 to $1,499 | 29 (16.0%) | 37 (68.5%) |
| Total | 181 (100.0%) | 54 (100.0%) |
Health & Disability in Redland
Health Insurance Coverage by Age in Redland
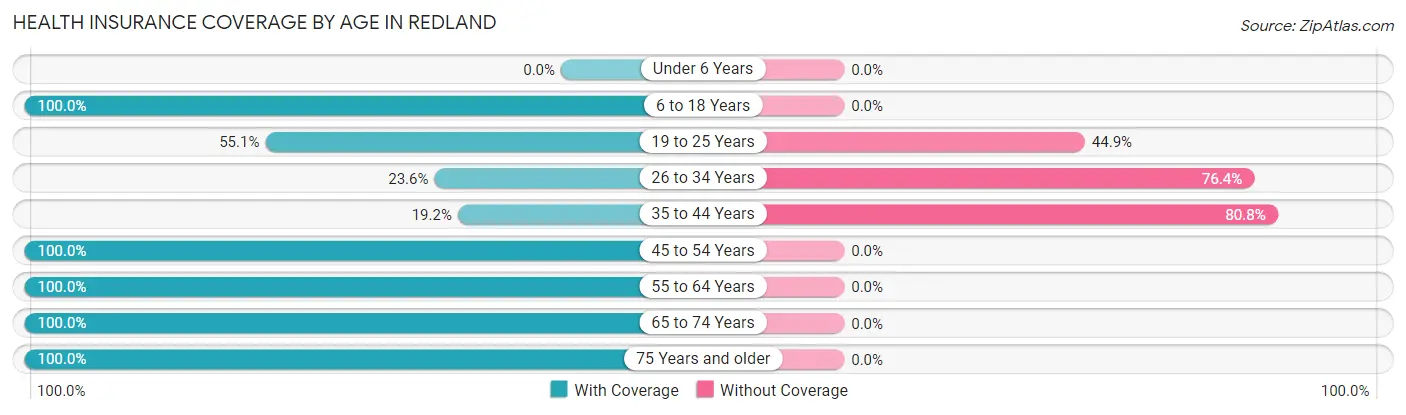
| Age Bracket | With Coverage | Without Coverage |
| Under 6 Years | 0 (0.0%) | 0 (0.0%) |
| 6 to 18 Years | 21 (100.0%) | 0 (0.0%) |
| 19 to 25 Years | 43 (55.1%) | 35 (44.9%) |
| 26 to 34 Years | 21 (23.6%) | 68 (76.4%) |
| 35 to 44 Years | 25 (19.2%) | 105 (80.8%) |
| 45 to 54 Years | 115 (100.0%) | 0 (0.0%) |
| 55 to 64 Years | 173 (100.0%) | 0 (0.0%) |
| 65 to 74 Years | 56 (100.0%) | 0 (0.0%) |
| 75 Years and older | 61 (100.0%) | 0 (0.0%) |
| Total | 515 (71.2%) | 208 (28.8%) |
Health Insurance Coverage by Citizenship Status in Redland
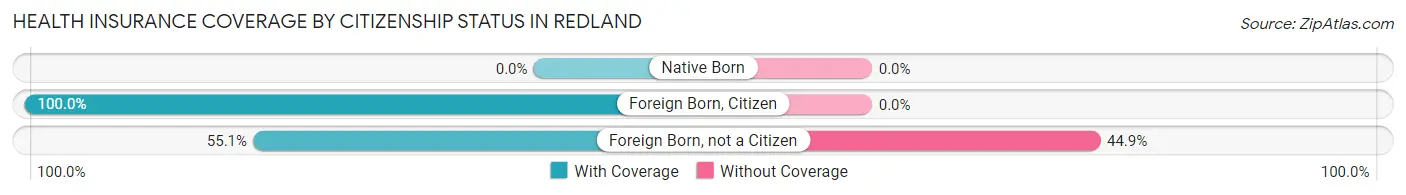
| Citizenship Status | With Coverage | Without Coverage |
| Native Born | 0 (0.0%) | 0 (0.0%) |
| Foreign Born, Citizen | 21 (100.0%) | 0 (0.0%) |
| Foreign Born, not a Citizen | 43 (55.1%) | 35 (44.9%) |
Health Insurance Coverage by Household Income in Redland
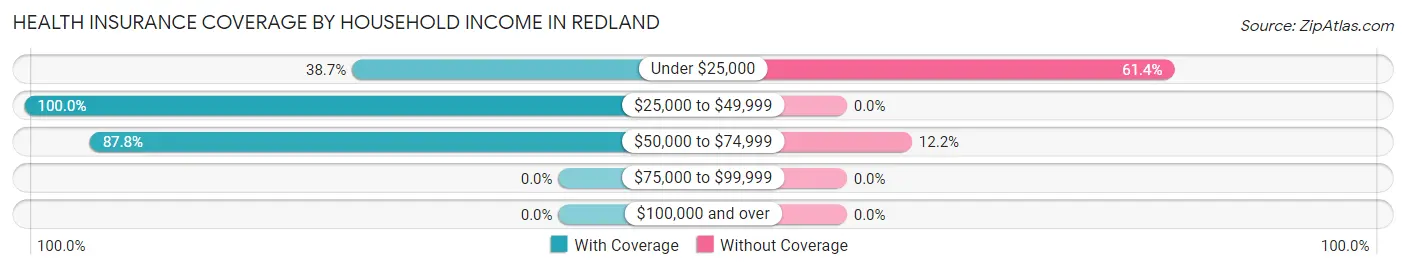
| Household Income | With Coverage | Without Coverage |
| Under $25,000 | 109 (38.7%) | 173 (61.4%) |
| $25,000 to $49,999 | 154 (100.0%) | 0 (0.0%) |
| $50,000 to $74,999 | 252 (87.8%) | 35 (12.2%) |
| $75,000 to $99,999 | 0 (0.0%) | 0 (0.0%) |
| $100,000 and over | 0 (0.0%) | 0 (0.0%) |
Public vs Private Health Insurance Coverage by Age in Redland
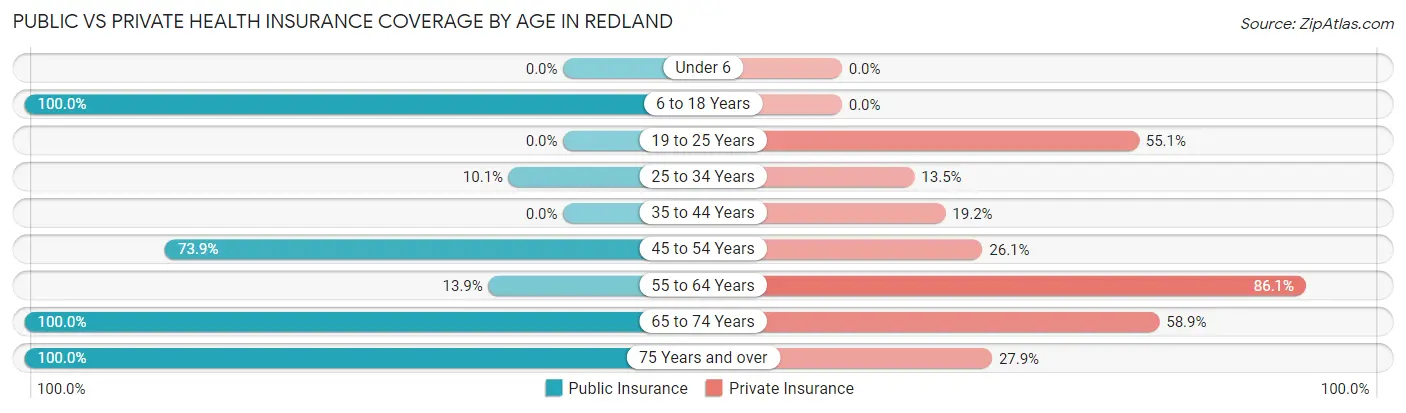
| Age Bracket | Public Insurance | Private Insurance |
| Under 6 | 0 (0.0%) | 0 (0.0%) |
| 6 to 18 Years | 21 (100.0%) | 0 (0.0%) |
| 19 to 25 Years | 0 (0.0%) | 43 (55.1%) |
| 25 to 34 Years | 9 (10.1%) | 12 (13.5%) |
| 35 to 44 Years | 0 (0.0%) | 25 (19.2%) |
| 45 to 54 Years | 85 (73.9%) | 30 (26.1%) |
| 55 to 64 Years | 24 (13.9%) | 149 (86.1%) |
| 65 to 74 Years | 56 (100.0%) | 33 (58.9%) |
| 75 Years and over | 61 (100.0%) | 17 (27.9%) |
| Total | 256 (35.4%) | 309 (42.7%) |
Disability Status by Sex by Age in Redland
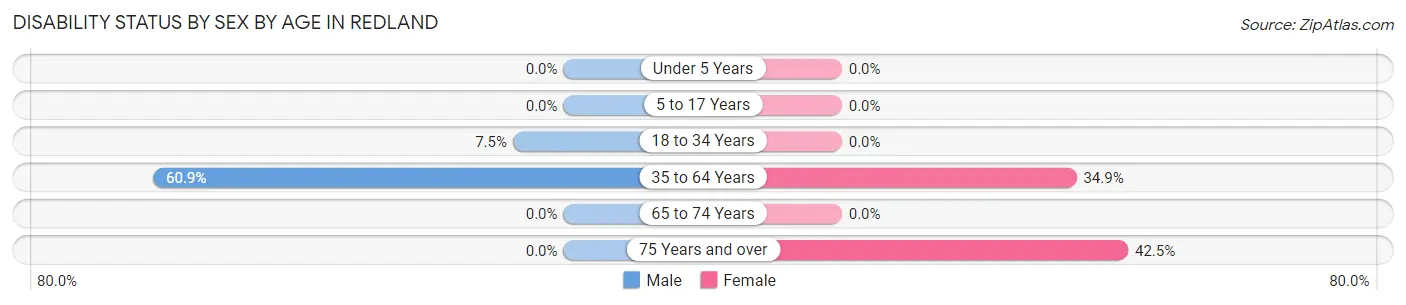
| Age Bracket | Male | Female |
| Under 5 Years | 0 (0.0%) | 0 (0.0%) |
| 5 to 17 Years | 0 (0.0%) | 0 (0.0%) |
| 18 to 34 Years | 9 (7.5%) | 0 (0.0%) |
| 35 to 64 Years | 134 (60.9%) | 69 (34.8%) |
| 65 to 74 Years | 0 (0.0%) | 0 (0.0%) |
| 75 Years and over | 0 (0.0%) | 17 (42.5%) |
Disability Class by Sex by Age in Redland
Disability Class: Hearing Difficulty
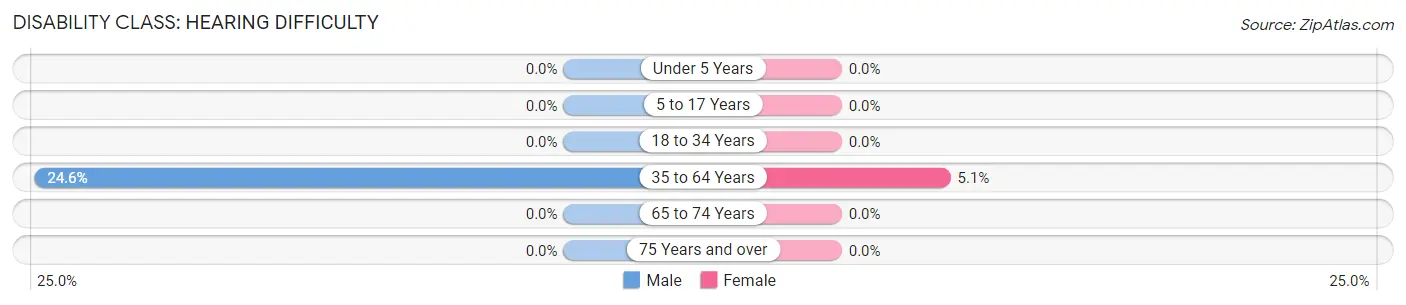
| Age Bracket | Male | Female |
| Under 5 Years | 0 (0.0%) | 0 (0.0%) |
| 5 to 17 Years | 0 (0.0%) | 0 (0.0%) |
| 18 to 34 Years | 0 (0.0%) | 0 (0.0%) |
| 35 to 64 Years | 54 (24.5%) | 10 (5.1%) |
| 65 to 74 Years | 0 (0.0%) | 0 (0.0%) |
| 75 Years and over | 0 (0.0%) | 0 (0.0%) |
Disability Class: Vision Difficulty
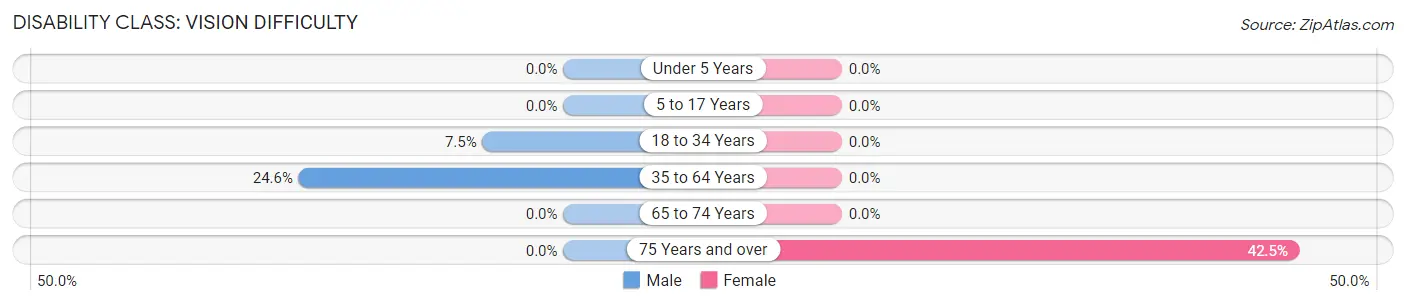
| Age Bracket | Male | Female |
| Under 5 Years | 0 (0.0%) | 0 (0.0%) |
| 5 to 17 Years | 0 (0.0%) | 0 (0.0%) |
| 18 to 34 Years | 9 (7.5%) | 0 (0.0%) |
| 35 to 64 Years | 54 (24.5%) | 0 (0.0%) |
| 65 to 74 Years | 0 (0.0%) | 0 (0.0%) |
| 75 Years and over | 0 (0.0%) | 17 (42.5%) |
Disability Class: Cognitive Difficulty
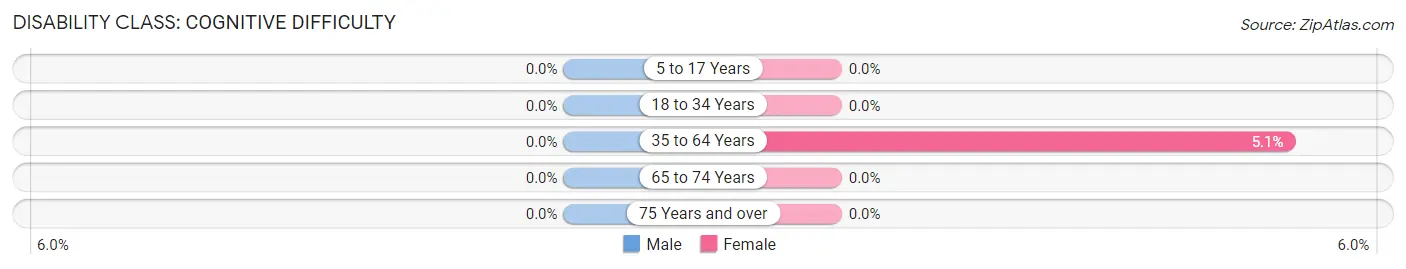
| Age Bracket | Male | Female |
| 5 to 17 Years | 0 (0.0%) | 0 (0.0%) |
| 18 to 34 Years | 0 (0.0%) | 0 (0.0%) |
| 35 to 64 Years | 0 (0.0%) | 10 (5.1%) |
| 65 to 74 Years | 0 (0.0%) | 0 (0.0%) |
| 75 Years and over | 0 (0.0%) | 0 (0.0%) |
Disability Class: Ambulatory Difficulty
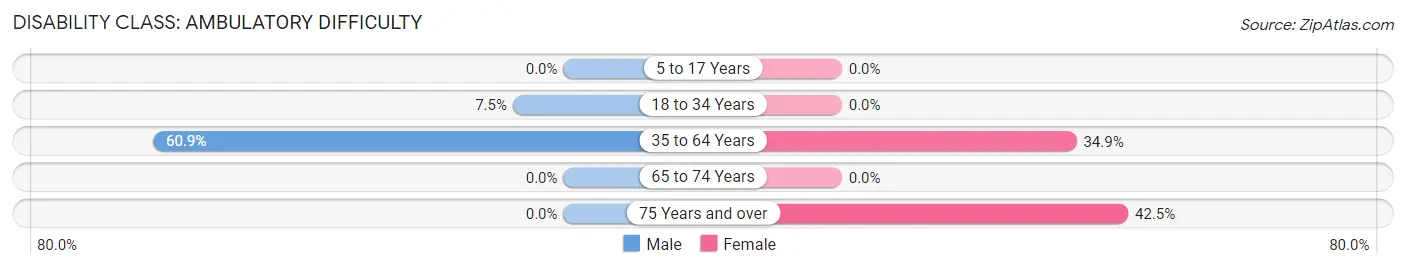
| Age Bracket | Male | Female |
| 5 to 17 Years | 0 (0.0%) | 0 (0.0%) |
| 18 to 34 Years | 9 (7.5%) | 0 (0.0%) |
| 35 to 64 Years | 134 (60.9%) | 69 (34.8%) |
| 65 to 74 Years | 0 (0.0%) | 0 (0.0%) |
| 75 Years and over | 0 (0.0%) | 17 (42.5%) |
Disability Class: Self-Care Difficulty
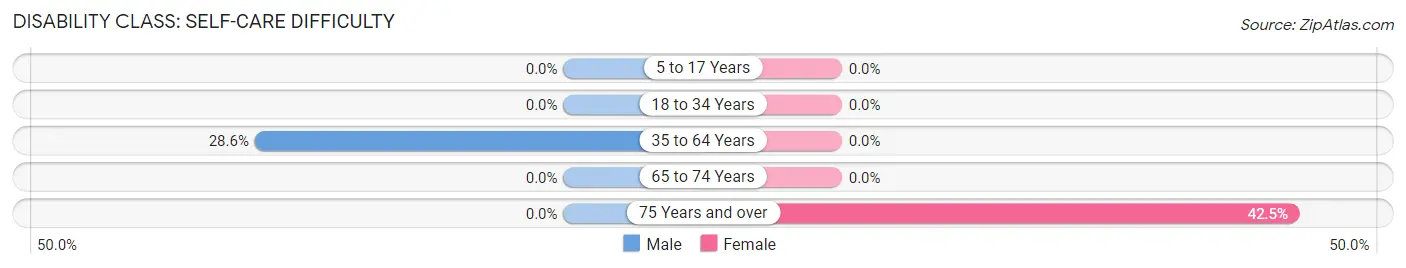
| Age Bracket | Male | Female |
| 5 to 17 Years | 0 (0.0%) | 0 (0.0%) |
| 18 to 34 Years | 0 (0.0%) | 0 (0.0%) |
| 35 to 64 Years | 63 (28.6%) | 0 (0.0%) |
| 65 to 74 Years | 0 (0.0%) | 0 (0.0%) |
| 75 Years and over | 0 (0.0%) | 17 (42.5%) |
Technology Access in Redland
Computing Device Access in Redland
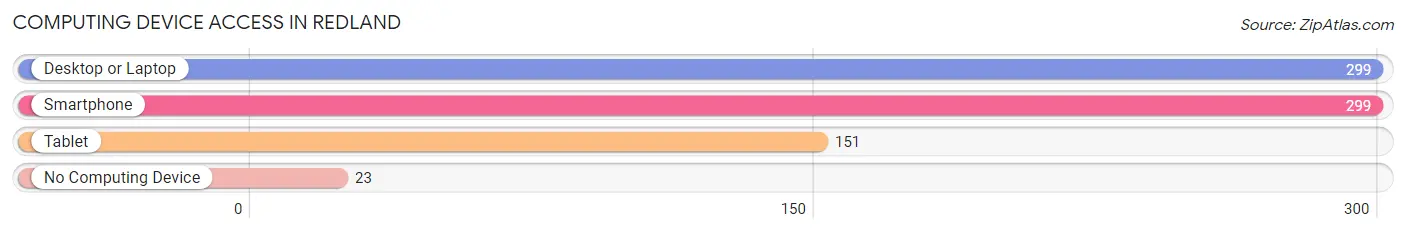
| Device Type | # Households | % Households |
| Desktop or Laptop | 299 | 92.9% |
| Smartphone | 299 | 92.9% |
| Tablet | 151 | 46.9% |
| No Computing Device | 23 | 7.1% |
| Total | 322 | 100.0% |
Internet Access in Redland
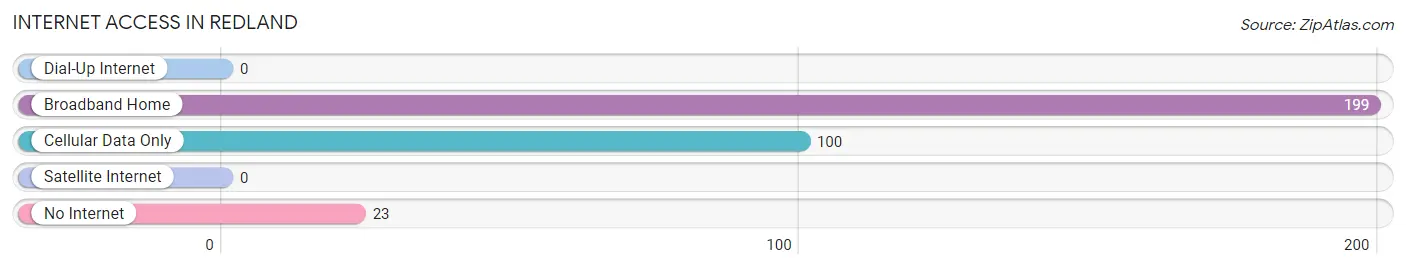
| Internet Type | # Households | % Households |
| Dial-Up Internet | 0 | 0.0% |
| Broadband Home | 199 | 61.8% |
| Cellular Data Only | 100 | 31.1% |
| Satellite Internet | 0 | 0.0% |
| No Internet | 23 | 7.1% |
| Total | 322 | 100.0% |
Redland Summary
Redland, Texas is a small unincorporated community located in the southeastern corner of Texas, in the county of Cameron. It is situated on the banks of the Rio Grande River, and is bordered by the Mexican state of Tamaulipas. Redland is a rural community, with a population of just over 1,000 people.
History
The area that is now Redland was originally inhabited by the Coahuiltecan Indians, who were later displaced by the Spanish in the late 1700s. The area was then settled by Mexican ranchers, who named the area “Rancho de Redland”. The name was derived from the red soil in the area.
In the early 1900s, the area was settled by American ranchers, who established a small community. The town was officially established in 1912, and was named after the red soil in the area.
Geography
Redland is located in the southeastern corner of Texas, in the county of Cameron. It is situated on the banks of the Rio Grande River, and is bordered by the Mexican state of Tamaulipas. The town is located in a semi-arid region, with an average annual rainfall of just over 20 inches. The area is characterized by flat terrain, with some rolling hills in the surrounding area.
Economy
The economy of Redland is largely based on agriculture. The area is known for its citrus production, with oranges, grapefruits, and lemons being the main crops. Other crops grown in the area include cotton, corn, and sorghum.
The town also has a small manufacturing sector, with a few small factories producing furniture, clothing, and other goods.
Demographics
As of the 2010 census, the population of Redland was 1,072. The population is predominantly Hispanic, with over 90% of the population identifying as such. The median household income in Redland is $25,000, and the median age is 33.
Redland is a small, rural community, with a population of just over 1,000 people. The town is largely Hispanic, with over 90% of the population identifying as such. The economy of Redland is largely based on agriculture, with citrus production being the main industry. The town also has a small manufacturing sector, with a few small factories producing furniture, clothing, and other goods.
Common Questions
What is Per Capita Income in Redland?
Per Capita income in Redland is $17,928.
What is the Median Family Income in Redland?
Median Family Income in Redland is $49,076.
What is the Median Household income in Redland?
Median Household Income in Redland is $33,689.
What is Inequality or Gini Index in Redland?
Inequality or Gini Index in Redland is 0.24.
What is the Total Population of Redland?
Total Population of Redland is 723.
What is the Total Male Population of Redland?
Total Male Population of Redland is 382.
What is the Total Female Population of Redland?
Total Female Population of Redland is 341.
What is the Ratio of Males per 100 Females in Redland?
There are 112.02 Males per 100 Females in Redland.
What is the Ratio of Females per 100 Males in Redland?
There are 89.27 Females per 100 Males in Redland.
What is the Median Population Age in Redland?
Median Population Age in Redland is 52.6 Years.
What is the Average Family Size in Redland
Average Family Size in Redland is 2.8 People.
What is the Average Household Size in Redland
Average Household Size in Redland is 2.2 People.
How Large is the Labor Force in Redland?
There are 286 People in the Labor Forcein in Redland.
What is the Percentage of People in the Labor Force in Redland?
40.7% of People are in the Labor Force in Redland.
What is the Unemployment Rate in Redland?
Unemployment Rate in Redland is 48.6%.