Windthorst, TX Map & Demographics
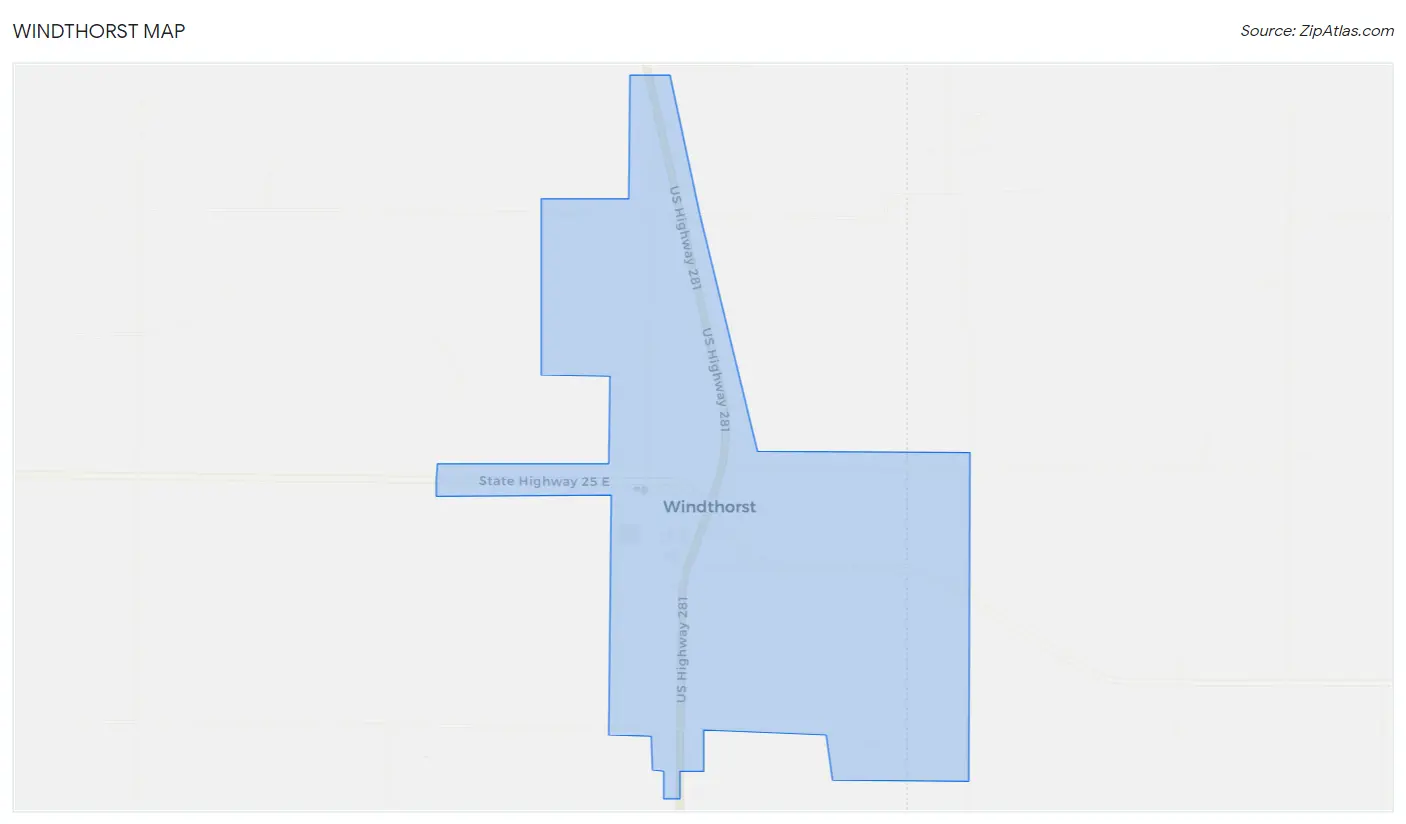
Windthorst Map
Windthorst Overview
$32,433
PER CAPITA INCOME
$34,722
AVG FAMILY INCOME
$34,583
AVG HOUSEHOLD INCOME
36.4%
WAGE / INCOME GAP [ % ]
63.6¢/ $1
WAGE / INCOME GAP [ $ ]
0.52
INEQUALITY / GINI INDEX
334
TOTAL POPULATION
158
MALE POPULATION
176
FEMALE POPULATION
89.77
MALES / 100 FEMALES
111.39
FEMALES / 100 MALES
50.9
MEDIAN AGE
2.9
AVG FAMILY SIZE
2.6
AVG HOUSEHOLD SIZE
138
LABOR FORCE [ PEOPLE ]
47.6%
PERCENT IN LABOR FORCE
Windthorst Zip Codes
Windthorst Area Codes
Income in Windthorst
Income Overview in Windthorst
Per Capita Income in Windthorst is $32,433, while median incomes of families and households are $34,722 and $34,583 respectively.
| Characteristic | Number | Measure |
| Per Capita Income | 334 | $32,433 |
| Median Family Income | 104 | $34,722 |
| Mean Family Income | 104 | $84,194 |
| Median Household Income | 127 | $34,583 |
| Mean Household Income | 127 | $77,332 |
| Income Deficit | 104 | $0 |
| Wage / Income Gap (%) | 334 | 36.39% |
| Wage / Income Gap ($) | 334 | 63.61¢ per $1 |
| Gini / Inequality Index | 334 | 0.52 |
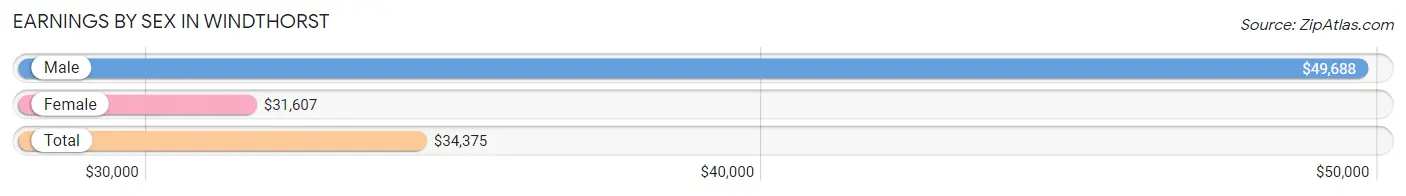
Earnings by Sex in Windthorst
Average Earnings in Windthorst are $34,375, $49,688 for men and $31,607 for women, a difference of 36.4%.
| Sex | Number | Average Earnings |
| Male | 79 (56.4%) | $49,688 |
| Female | 61 (43.6%) | $31,607 |
| Total | 140 (100.0%) | $34,375 |
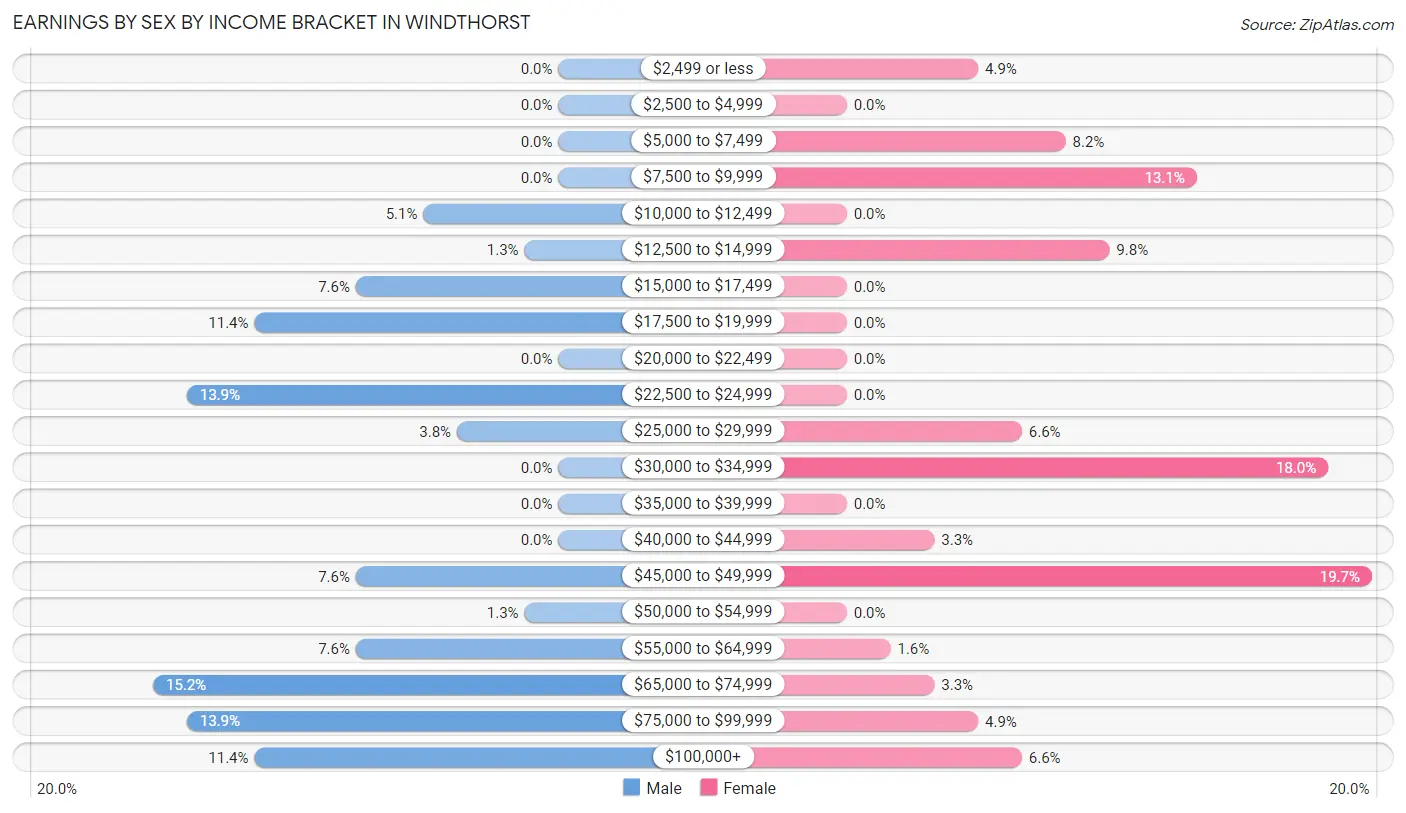
Earnings by Sex by Income Bracket in Windthorst
The most common earnings brackets in Windthorst are $65,000 to $74,999 for men (12 | 15.2%) and $45,000 to $49,999 for women (12 | 19.7%).
| Income | Male | Female |
| $2,499 or less | 0 (0.0%) | 3 (4.9%) |
| $2,500 to $4,999 | 0 (0.0%) | 0 (0.0%) |
| $5,000 to $7,499 | 0 (0.0%) | 5 (8.2%) |
| $7,500 to $9,999 | 0 (0.0%) | 8 (13.1%) |
| $10,000 to $12,499 | 4 (5.1%) | 0 (0.0%) |
| $12,500 to $14,999 | 1 (1.3%) | 6 (9.8%) |
| $15,000 to $17,499 | 6 (7.6%) | 0 (0.0%) |
| $17,500 to $19,999 | 9 (11.4%) | 0 (0.0%) |
| $20,000 to $22,499 | 0 (0.0%) | 0 (0.0%) |
| $22,500 to $24,999 | 11 (13.9%) | 0 (0.0%) |
| $25,000 to $29,999 | 3 (3.8%) | 4 (6.6%) |
| $30,000 to $34,999 | 0 (0.0%) | 11 (18.0%) |
| $35,000 to $39,999 | 0 (0.0%) | 0 (0.0%) |
| $40,000 to $44,999 | 0 (0.0%) | 2 (3.3%) |
| $45,000 to $49,999 | 6 (7.6%) | 12 (19.7%) |
| $50,000 to $54,999 | 1 (1.3%) | 0 (0.0%) |
| $55,000 to $64,999 | 6 (7.6%) | 1 (1.6%) |
| $65,000 to $74,999 | 12 (15.2%) | 2 (3.3%) |
| $75,000 to $99,999 | 11 (13.9%) | 3 (4.9%) |
| $100,000+ | 9 (11.4%) | 4 (6.6%) |
| Total | 79 (100.0%) | 61 (100.0%) |
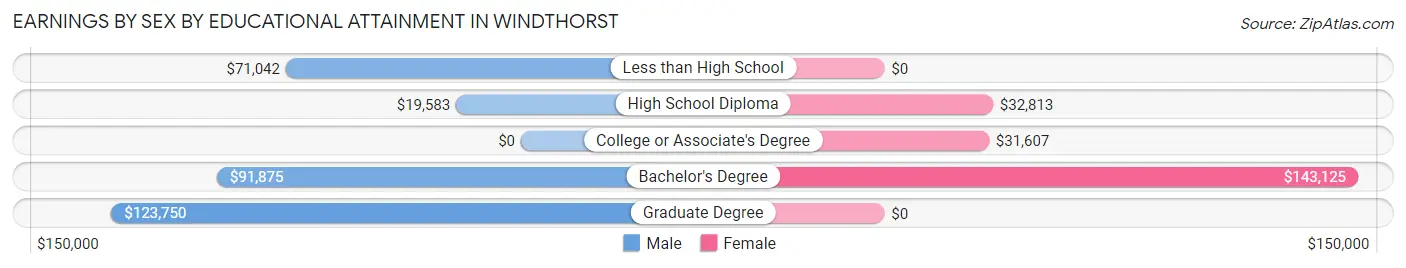
Earnings by Sex by Educational Attainment in Windthorst
Average earnings in Windthorst are $55,000 for men and $33,438 for women, a difference of 39.2%. Men with an educational attainment of graduate degree enjoy the highest average annual earnings of $123,750, while those with high school diploma education earn the least with $19,583. Women with an educational attainment of bachelor's degree earn the most with the average annual earnings of $143,125, while those with college or associate's degree education have the smallest earnings of $31,607.
| Educational Attainment | Male Income | Female Income |
| Less than High School | $71,042 | $0 |
| High School Diploma | $19,583 | $32,813 |
| College or Associate's Degree | - | - |
| Bachelor's Degree | $91,875 | $143,125 |
| Graduate Degree | $123,750 | $0 |
| Total | $55,000 | $33,438 |
Family Income in Windthorst
Family Income Brackets in Windthorst
According to the Windthorst family income data, there are 37 families falling into the $25,000 to $34,999 income range, which is the most common income bracket and makes up 35.6% of all families. Conversely, the $15,000 to $24,999 income bracket is the least frequent group with only 1 families (1.0%) belonging to this category.
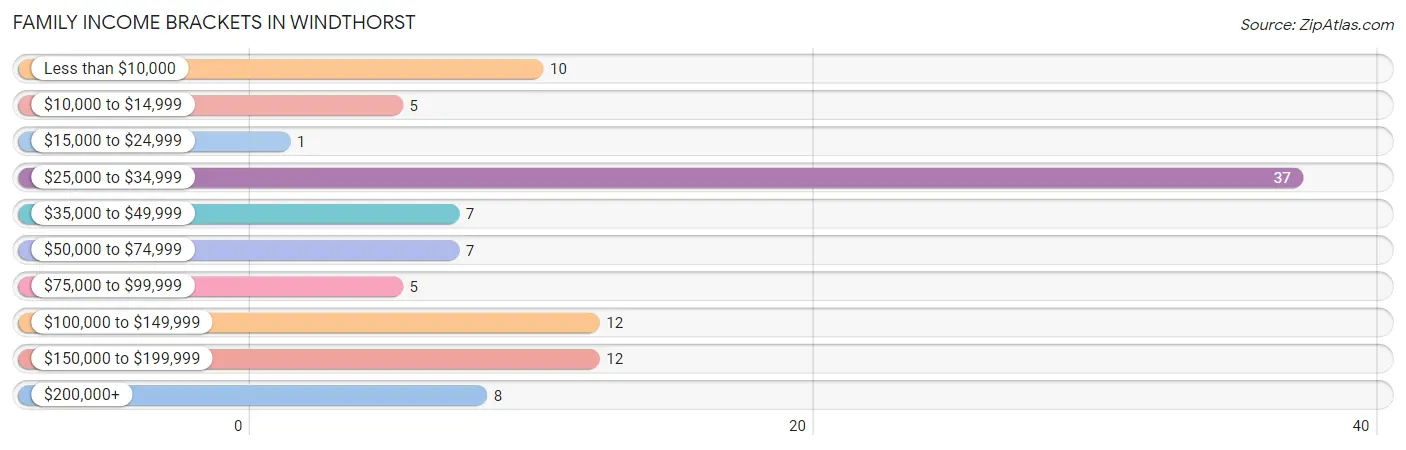
| Income Bracket | # Families | % Families |
| Less than $10,000 | 10 | 9.6% |
| $10,000 to $14,999 | 5 | 4.8% |
| $15,000 to $24,999 | 1 | 1.0% |
| $25,000 to $34,999 | 37 | 35.6% |
| $35,000 to $49,999 | 7 | 6.7% |
| $50,000 to $74,999 | 7 | 6.7% |
| $75,000 to $99,999 | 5 | 4.8% |
| $100,000 to $149,999 | 12 | 11.5% |
| $150,000 to $199,999 | 12 | 11.5% |
| $200,000+ | 8 | 7.7% |
Family Income by Famaliy Size in Windthorst
4-person families (18 | 17.3%) account for the highest median family income in Windthorst with $86,000 per family, while 4-person families (18 | 17.3%) have the highest median income of $21,500 per family member.
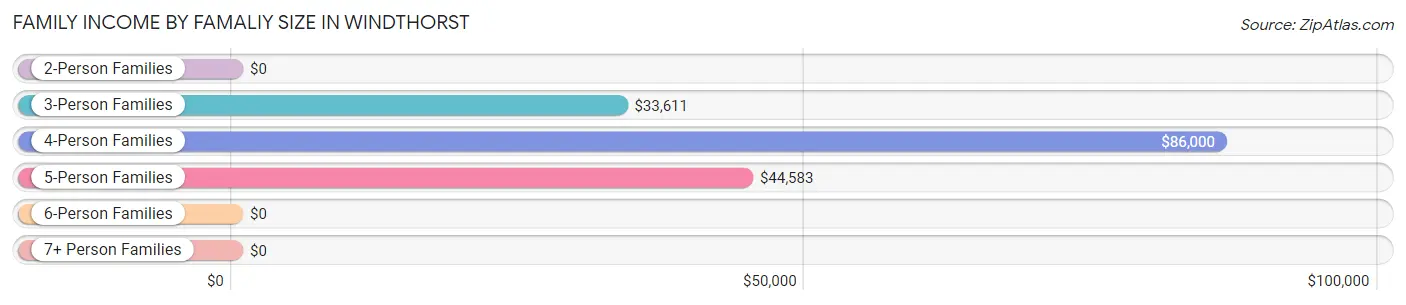
| Income Bracket | # Families | Median Income |
| 2-Person Families | 62 (59.6%) | $0 |
| 3-Person Families | 18 (17.3%) | $33,611 |
| 4-Person Families | 18 (17.3%) | $86,000 |
| 5-Person Families | 5 (4.8%) | $44,583 |
| 6-Person Families | 1 (1.0%) | $0 |
| 7+ Person Families | 0 (0.0%) | $0 |
| Total | 104 (100.0%) | $34,722 |
Family Income by Number of Earners in Windthorst
The median family income in Windthorst is $34,722, with families comprising 2 earners (15) having the highest median family income of $146,250, while families with no earners (48) have the lowest median family income of $31,625, accounting for 14.4% and 46.2% of families, respectively.
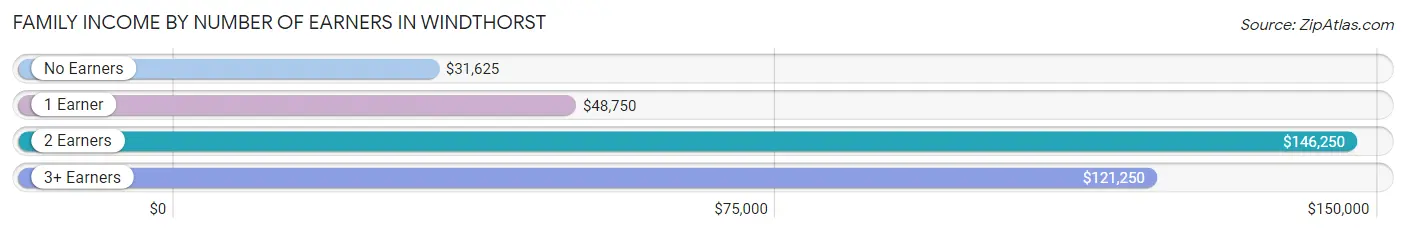
| Number of Earners | # Families | Median Income |
| No Earners | 48 (46.2%) | $31,625 |
| 1 Earner | 28 (26.9%) | $48,750 |
| 2 Earners | 15 (14.4%) | $146,250 |
| 3+ Earners | 13 (12.5%) | $121,250 |
| Total | 104 (100.0%) | $34,722 |
Household Income in Windthorst
Household Income Brackets in Windthorst
With 37 households falling in the category, the $25,000 to $34,999 income range is the most frequent in Windthorst, accounting for 29.1% of all households. In contrast, only 5 households (3.9%) fall into the $10,000 to $14,999 income bracket, making it the least populous group.
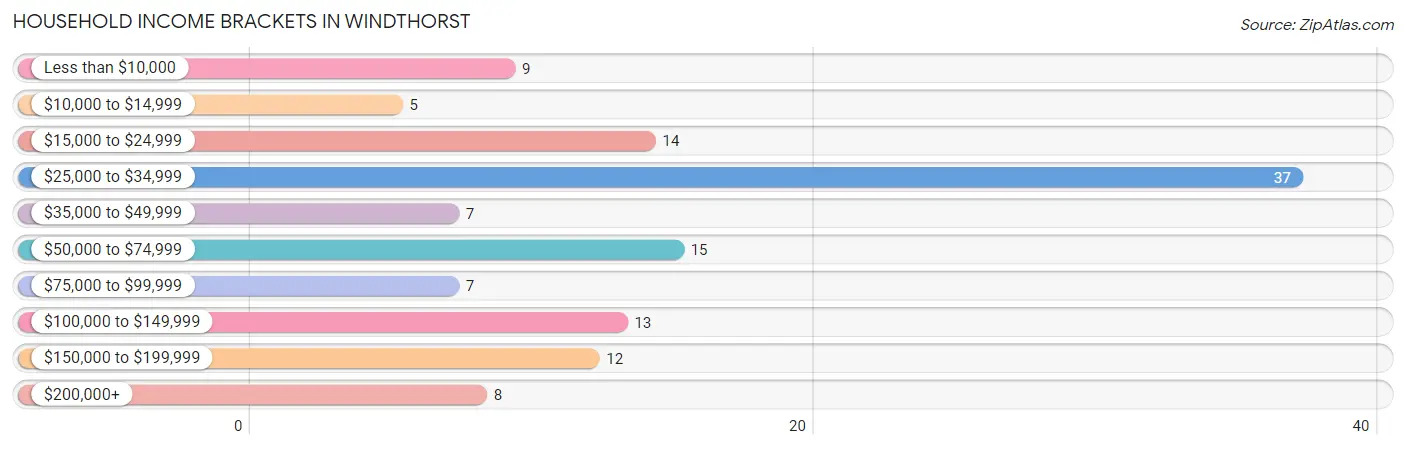
| Income Bracket | # Households | % Households |
| Less than $10,000 | 9 | 7.1% |
| $10,000 to $14,999 | 5 | 3.9% |
| $15,000 to $24,999 | 14 | 11.0% |
| $25,000 to $34,999 | 37 | 29.1% |
| $35,000 to $49,999 | 7 | 5.5% |
| $50,000 to $74,999 | 15 | 11.8% |
| $75,000 to $99,999 | 7 | 5.5% |
| $100,000 to $149,999 | 13 | 10.2% |
| $150,000 to $199,999 | 12 | 9.4% |
| $200,000+ | 8 | 6.3% |
Household Income by Householder Age in Windthorst
The median household income in Windthorst is $34,583, with the highest median household income of $72,500 found in the 25 to 44 years age bracket for the primary householder. A total of 18 households (14.2%) fall into this category. Meanwhile, the 15 to 24 years age bracket for the primary householder has the lowest median household income of $0, with 2 households (1.6%) in this group.
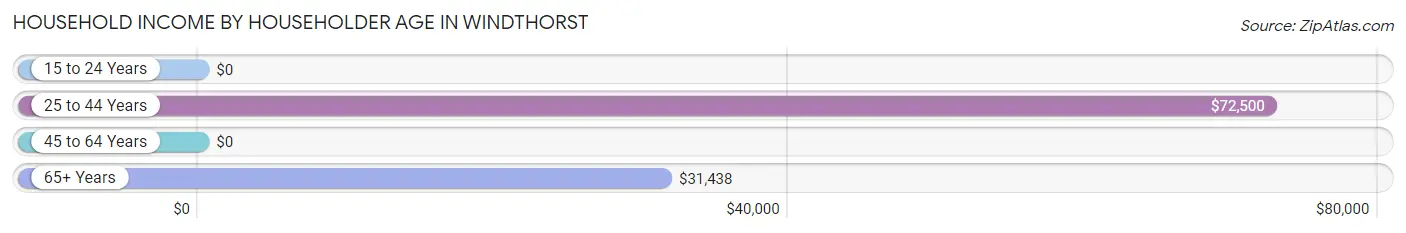
| Income Bracket | # Households | Median Income |
| 15 to 24 Years | 2 (1.6%) | $0 |
| 25 to 44 Years | 18 (14.2%) | $72,500 |
| 45 to 64 Years | 44 (34.6%) | $0 |
| 65+ Years | 63 (49.6%) | $31,438 |
| Total | 127 (100.0%) | $34,583 |
Poverty in Windthorst
Income Below Poverty by Sex and Age in Windthorst
With 17.7% poverty level for males and 22.2% for females among the residents of Windthorst, 12 to 14 year old males and 35 to 44 year old females are the most vulnerable to poverty, with 6 males (100.0%) and 5 females (83.3%) in their respective age groups living below the poverty level.
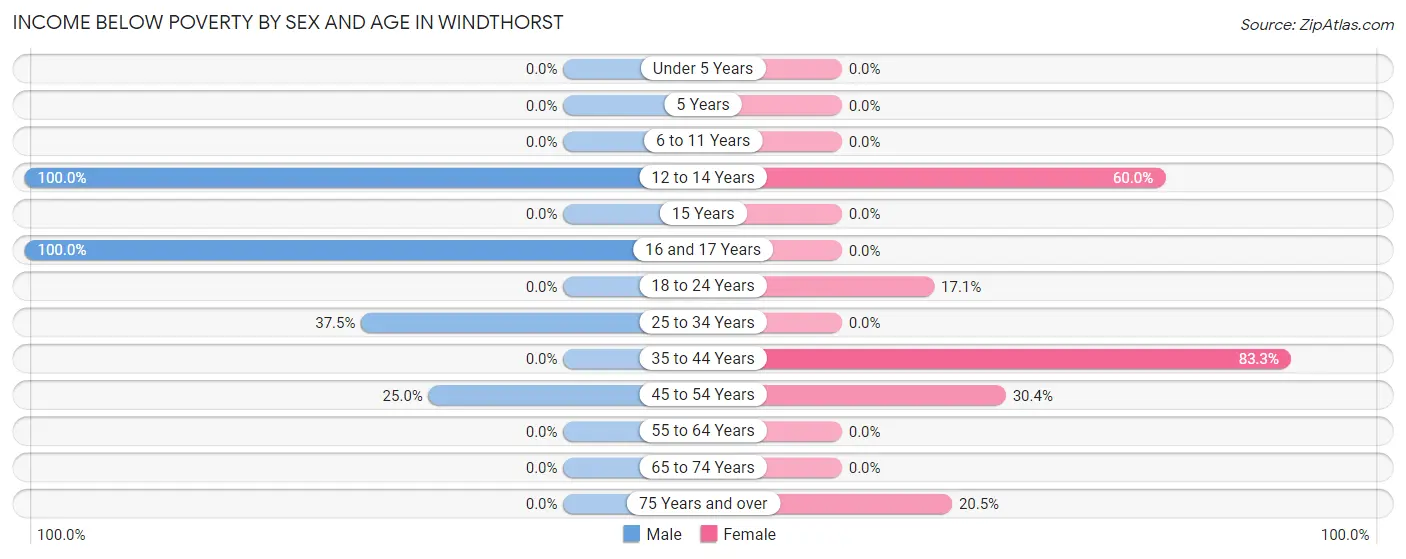
| Age Bracket | Male | Female |
| Under 5 Years | 0 (0.0%) | 0 (0.0%) |
| 5 Years | 0 (0.0%) | 0 (0.0%) |
| 6 to 11 Years | 0 (0.0%) | 0 (0.0%) |
| 12 to 14 Years | 6 (100.0%) | 12 (60.0%) |
| 15 Years | 0 (0.0%) | 0 (0.0%) |
| 16 and 17 Years | 8 (100.0%) | 0 (0.0%) |
| 18 to 24 Years | 0 (0.0%) | 6 (17.1%) |
| 25 to 34 Years | 9 (37.5%) | 0 (0.0%) |
| 35 to 44 Years | 0 (0.0%) | 5 (83.3%) |
| 45 to 54 Years | 5 (25.0%) | 7 (30.4%) |
| 55 to 64 Years | 0 (0.0%) | 0 (0.0%) |
| 65 to 74 Years | 0 (0.0%) | 0 (0.0%) |
| 75 Years and over | 0 (0.0%) | 9 (20.4%) |
| Total | 28 (17.7%) | 39 (22.2%) |
Income Above Poverty by Sex and Age in Windthorst
According to the poverty statistics in Windthorst, males aged 6 to 11 years and females aged 5 years are the age groups that are most secure financially, with 100.0% of males and 100.0% of females in these age groups living above the poverty line.
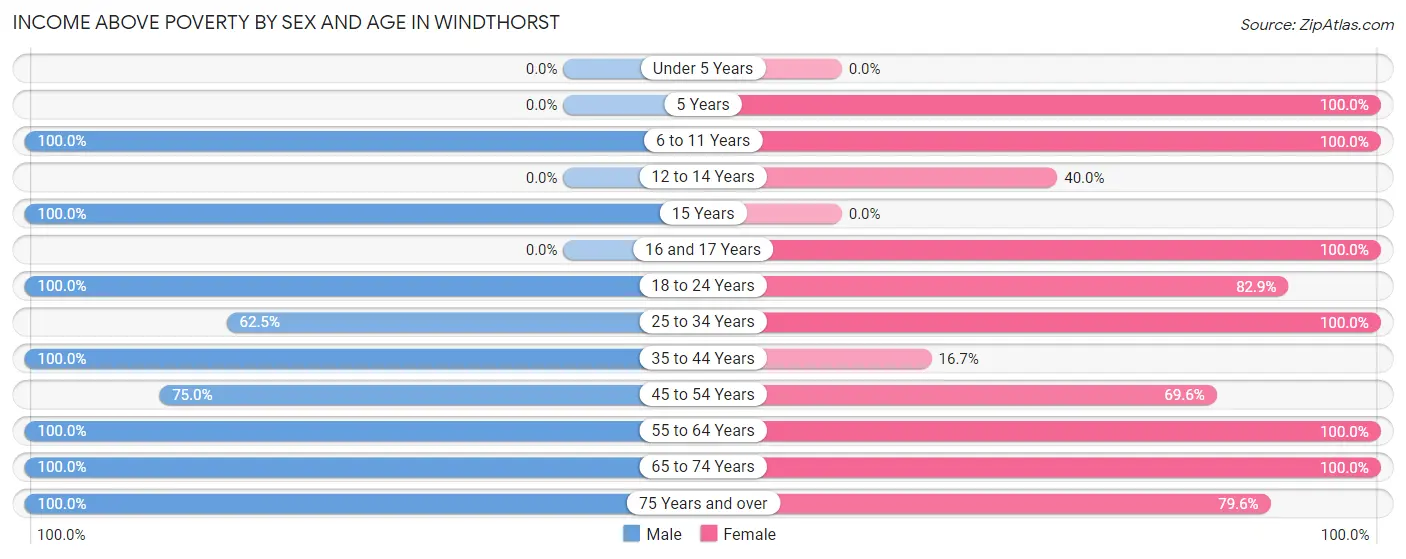
| Age Bracket | Male | Female |
| Under 5 Years | 0 (0.0%) | 0 (0.0%) |
| 5 Years | 0 (0.0%) | 9 (100.0%) |
| 6 to 11 Years | 1 (100.0%) | 5 (100.0%) |
| 12 to 14 Years | 0 (0.0%) | 8 (40.0%) |
| 15 Years | 3 (100.0%) | 0 (0.0%) |
| 16 and 17 Years | 0 (0.0%) | 2 (100.0%) |
| 18 to 24 Years | 8 (100.0%) | 29 (82.9%) |
| 25 to 34 Years | 15 (62.5%) | 10 (100.0%) |
| 35 to 44 Years | 7 (100.0%) | 1 (16.7%) |
| 45 to 54 Years | 15 (75.0%) | 16 (69.6%) |
| 55 to 64 Years | 32 (100.0%) | 9 (100.0%) |
| 65 to 74 Years | 12 (100.0%) | 13 (100.0%) |
| 75 Years and over | 37 (100.0%) | 35 (79.5%) |
| Total | 130 (82.3%) | 137 (77.8%) |
Income Below Poverty Among Married-Couple Families in Windthorst
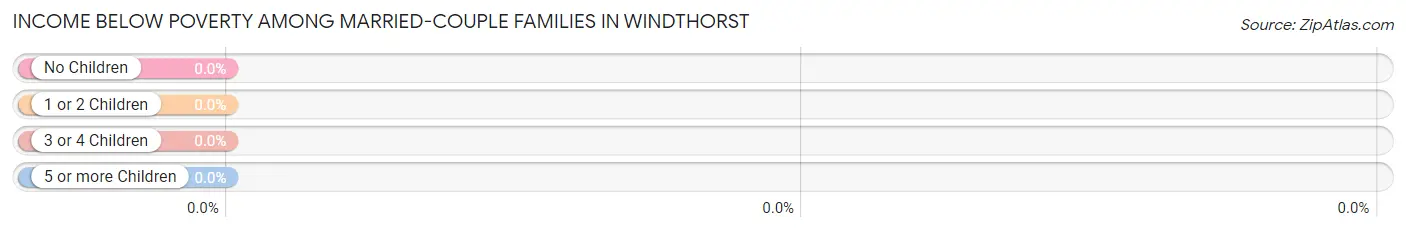
| Children | Above Poverty | Below Poverty |
| No Children | 68 (100.0%) | 0 (0.0%) |
| 1 or 2 Children | 10 (100.0%) | 0 (0.0%) |
| 3 or 4 Children | 3 (100.0%) | 0 (0.0%) |
| 5 or more Children | 0 (0.0%) | 0 (0.0%) |
| Total | 81 (100.0%) | 0 (0.0%) |
Income Below Poverty Among Single-Parent Households in Windthorst
According to the poverty data in Windthorst, 100.0% or 5 single-father households and 94.4% or 17 single-mother households are living below the poverty line. Among single-father households, those with 1 or 2 children have the highest poverty rate, with 5 households (100.0%) experiencing poverty. Likewise, among single-mother households, those with 1 or 2 children have the highest poverty rate, with 17 households (100.0%) falling below the poverty line.
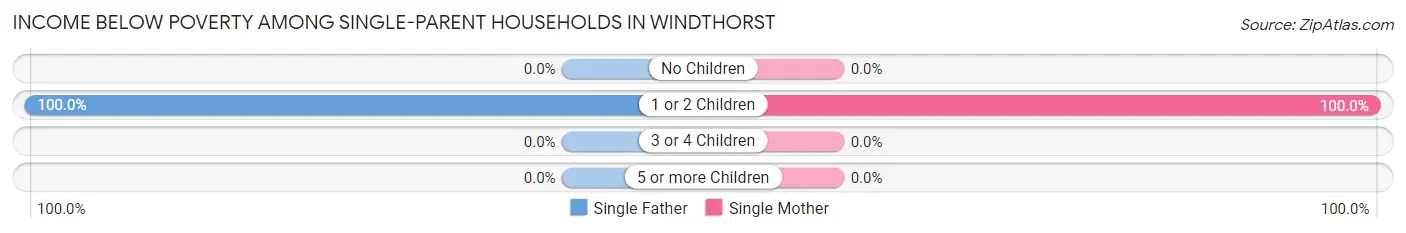
| Children | Single Father | Single Mother |
| No Children | 0 (0.0%) | 0 (0.0%) |
| 1 or 2 Children | 5 (100.0%) | 17 (100.0%) |
| 3 or 4 Children | 0 (0.0%) | 0 (0.0%) |
| 5 or more Children | 0 (0.0%) | 0 (0.0%) |
| Total | 5 (100.0%) | 17 (94.4%) |
Income Below Poverty Among Married-Couple vs Single-Parent Households in Windthorst
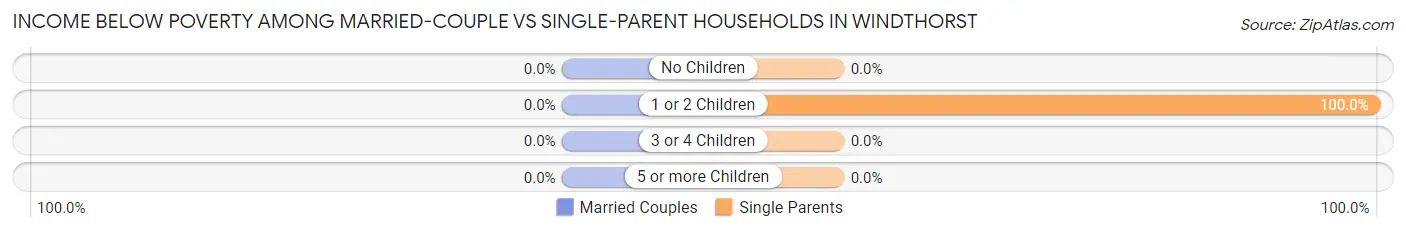
| Children | Married-Couple Families | Single-Parent Households |
| No Children | 0 (0.0%) | 0 (0.0%) |
| 1 or 2 Children | 0 (0.0%) | 22 (100.0%) |
| 3 or 4 Children | 0 (0.0%) | 0 (0.0%) |
| 5 or more Children | 0 (0.0%) | 0 (0.0%) |
| Total | 0 (0.0%) | 22 (95.7%) |
Race in Windthorst
The most populous races in Windthorst are White / Caucasian (254 | 76.0%), Hispanic or Latino (143 | 42.8%), and Two or more Races (75 | 22.5%).
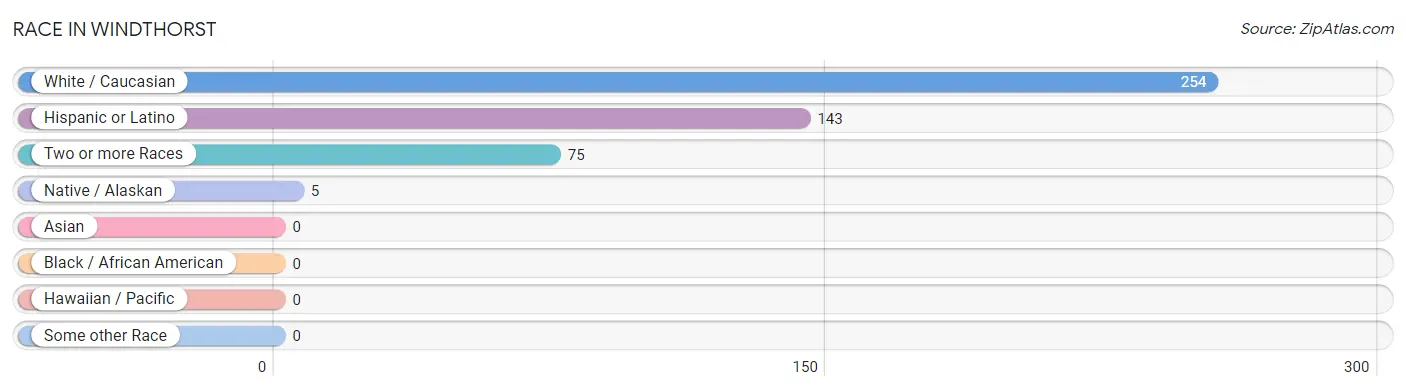
| Race | # Population | % Population |
| Asian | 0 | 0.0% |
| Black / African American | 0 | 0.0% |
| Hawaiian / Pacific | 0 | 0.0% |
| Hispanic or Latino | 143 | 42.8% |
| Native / Alaskan | 5 | 1.5% |
| White / Caucasian | 254 | 76.0% |
| Two or more Races | 75 | 22.5% |
| Some other Race | 0 | 0.0% |
| Total | 334 | 100.0% |
Ancestry in Windthorst
The most populous ancestries reported in Windthorst are Mexican (138 | 41.3%), German (135 | 40.4%), American (39 | 11.7%), English (12 | 3.6%), and Iroquois (11 | 3.3%), together accounting for 100.3% of all Windthorst residents.
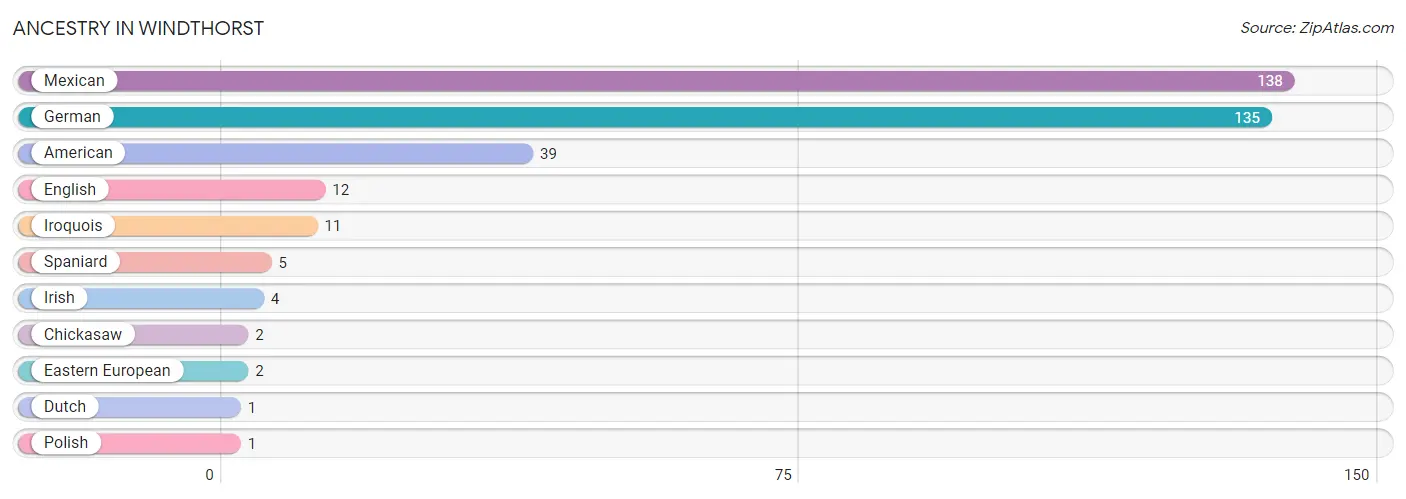
| Ancestry | # Population | % Population |
| American | 39 | 11.7% |
| Chickasaw | 2 | 0.6% |
| Dutch | 1 | 0.3% |
| Eastern European | 2 | 0.6% |
| English | 12 | 3.6% |
| German | 135 | 40.4% |
| Irish | 4 | 1.2% |
| Iroquois | 11 | 3.3% |
| Mexican | 138 | 41.3% |
| Polish | 1 | 0.3% |
| Spaniard | 5 | 1.5% | View All 11 Rows |
Immigrants in Windthorst
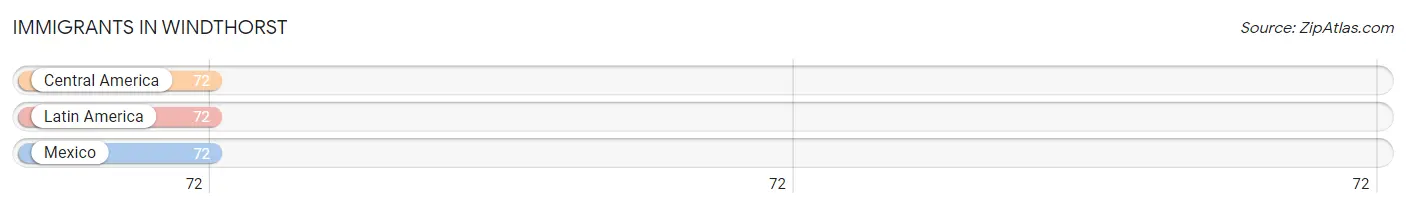
The most numerous immigrant groups reported in Windthorst came from Central America (72 | 21.6%), Latin America (72 | 21.6%), and Mexico (72 | 21.6%), together accounting for 64.7% of all Windthorst residents.
| Immigration Origin | # Population | % Population |
| Central America | 72 | 21.6% |
| Latin America | 72 | 21.6% |
| Mexico | 72 | 21.6% | View All 3 Rows |
Sex and Age in Windthorst
Sex and Age in Windthorst
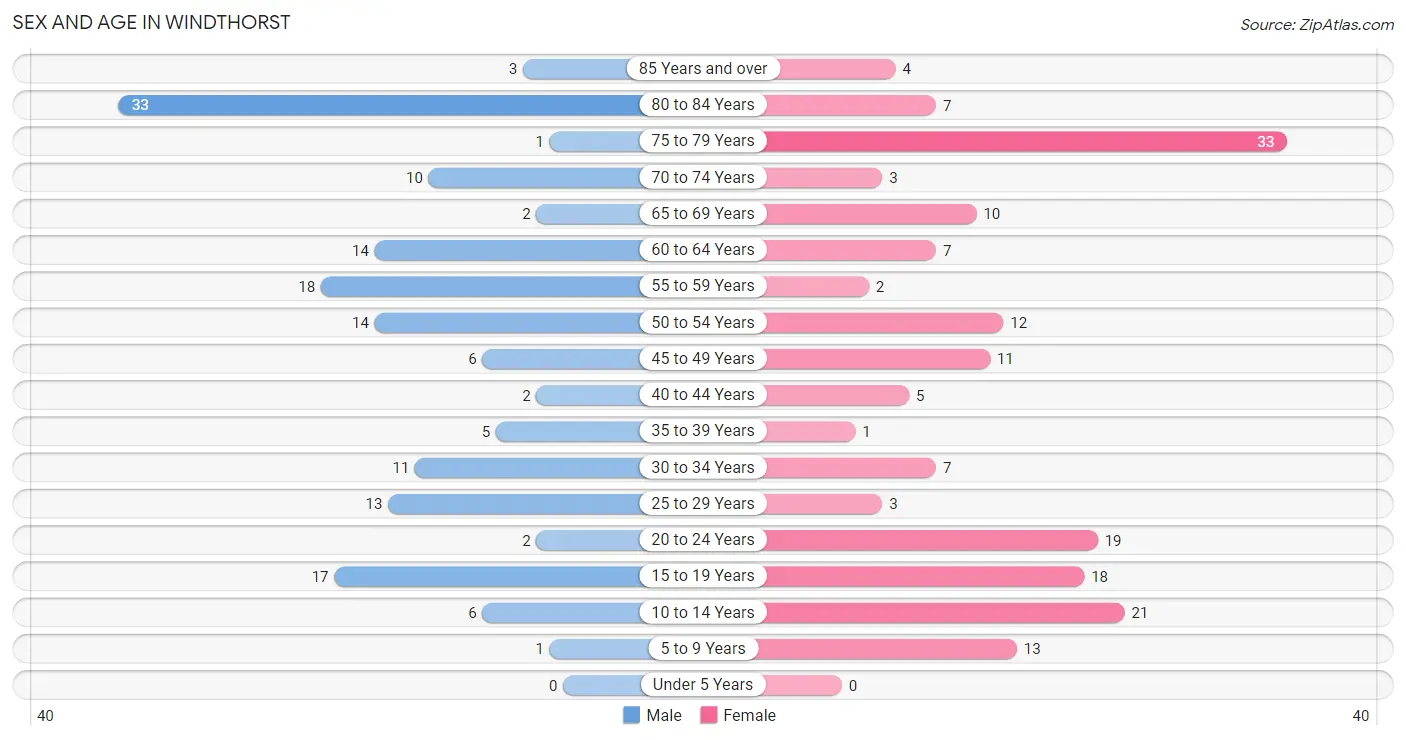
The most populous age groups in Windthorst are 80 to 84 Years (33 | 20.9%) for men and 75 to 79 Years (33 | 18.8%) for women.
| Age Bracket | Male | Female |
| Under 5 Years | 0 (0.0%) | 0 (0.0%) |
| 5 to 9 Years | 1 (0.6%) | 13 (7.4%) |
| 10 to 14 Years | 6 (3.8%) | 21 (11.9%) |
| 15 to 19 Years | 17 (10.8%) | 18 (10.2%) |
| 20 to 24 Years | 2 (1.3%) | 19 (10.8%) |
| 25 to 29 Years | 13 (8.2%) | 3 (1.7%) |
| 30 to 34 Years | 11 (7.0%) | 7 (4.0%) |
| 35 to 39 Years | 5 (3.2%) | 1 (0.6%) |
| 40 to 44 Years | 2 (1.3%) | 5 (2.8%) |
| 45 to 49 Years | 6 (3.8%) | 11 (6.2%) |
| 50 to 54 Years | 14 (8.9%) | 12 (6.8%) |
| 55 to 59 Years | 18 (11.4%) | 2 (1.1%) |
| 60 to 64 Years | 14 (8.9%) | 7 (4.0%) |
| 65 to 69 Years | 2 (1.3%) | 10 (5.7%) |
| 70 to 74 Years | 10 (6.3%) | 3 (1.7%) |
| 75 to 79 Years | 1 (0.6%) | 33 (18.8%) |
| 80 to 84 Years | 33 (20.9%) | 7 (4.0%) |
| 85 Years and over | 3 (1.9%) | 4 (2.3%) |
| Total | 158 (100.0%) | 176 (100.0%) |
Families and Households in Windthorst
Median Family Size in Windthorst
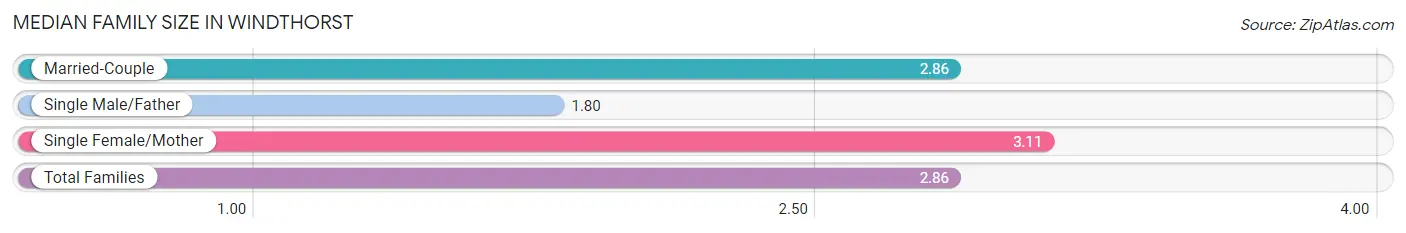
The median family size in Windthorst is 2.86 persons per family, with single female/mother families (18 | 17.3%) accounting for the largest median family size of 3.11 persons per family. On the other hand, single male/father families (5 | 4.8%) represent the smallest median family size with 1.80 persons per family.
| Family Type | # Families | Family Size |
| Married-Couple | 81 (77.9%) | 2.86 |
| Single Male/Father | 5 (4.8%) | 1.80 |
| Single Female/Mother | 18 (17.3%) | 3.11 |
| Total Families | 104 (100.0%) | 2.86 |
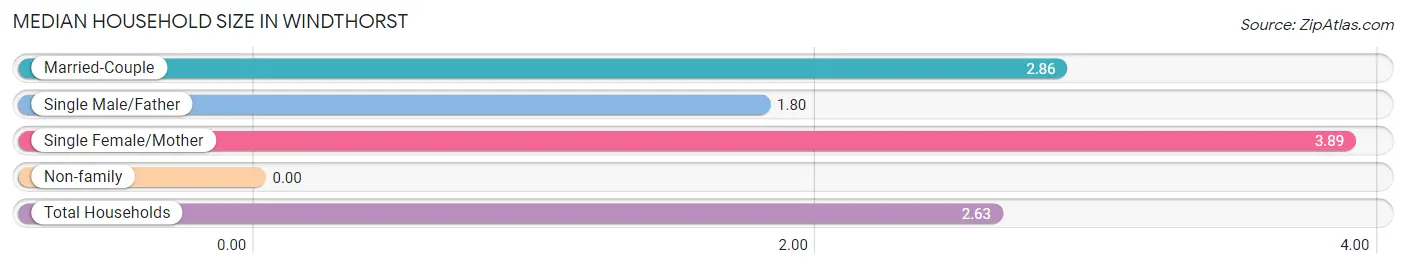
Median Household Size in Windthorst
| Household Type | # Households | Household Size |
| Married-Couple | 81 (63.8%) | 2.86 |
| Single Male/Father | 5 (3.9%) | 1.80 |
| Single Female/Mother | 18 (14.2%) | 3.89 |
| Non-family | 23 (18.1%) | - |
| Total Households | 127 (100.0%) | 2.63 |
Household Size by Marriage Status in Windthorst
Out of a total of 127 households in Windthorst, 104 (81.9%) are family households, while 23 (18.1%) are nonfamily households. The most numerous type of family households are 2-person households, comprising 61, and the most common type of nonfamily households are 1-person households, comprising 23.
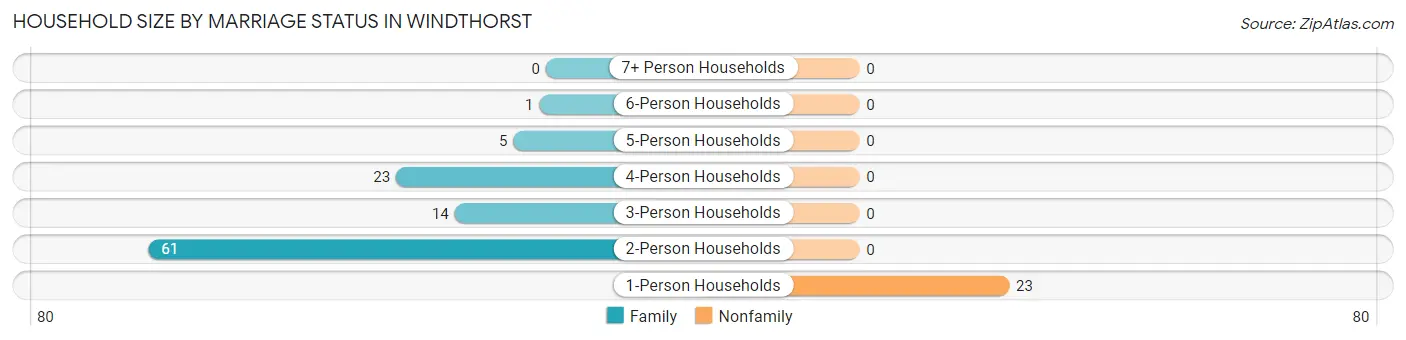
| Household Size | Family Households | Nonfamily Households |
| 1-Person Households | - | 23 (18.1%) |
| 2-Person Households | 61 (48.0%) | 0 (0.0%) |
| 3-Person Households | 14 (11.0%) | 0 (0.0%) |
| 4-Person Households | 23 (18.1%) | 0 (0.0%) |
| 5-Person Households | 5 (3.9%) | 0 (0.0%) |
| 6-Person Households | 1 (0.8%) | 0 (0.0%) |
| 7+ Person Households | 0 (0.0%) | 0 (0.0%) |
| Total | 104 (81.9%) | 23 (18.1%) |
Female Fertility in Windthorst
Fertility by Age in Windthorst
| Age Bracket | Women with Births | Births / 1,000 Women |
| 15 to 19 years | 0 (0.0%) | 0.0 |
| 20 to 34 years | 0 (0.0%) | 0.0 |
| 35 to 50 years | 0 (0.0%) | 0.0 |
| Total | 0 (0.0%) | 0.0 |
Fertility by Age by Marriage Status in Windthorst
| Age Bracket | Married | Unmarried |
| 15 to 19 years | 0 (0.0%) | 0 (0.0%) |
| 20 to 34 years | 0 (0.0%) | 0 (0.0%) |
| 35 to 50 years | 0 (0.0%) | 0 (0.0%) |
| Total | 0 (0.0%) | 0 (0.0%) |
Fertility by Education in Windthorst
| Educational Attainment | Women with Births | Births / 1,000 Women |
| Less than High School | 0 (0.0%) | 0.0 |
| High School Diploma | 0 (0.0%) | 0.0 |
| College or Associate's Degree | 0 (0.0%) | 0.0 |
| Bachelor's Degree | 0 (0.0%) | 0.0 |
| Graduate Degree | 0 (0.0%) | 0.0 |
| Total | 0 (0.0%) | 0.0 |
Fertility by Education by Marriage Status in Windthorst
| Educational Attainment | Married | Unmarried |
| Less than High School | 0 (0.0%) | 0 (0.0%) |
| High School Diploma | 0 (0.0%) | 0 (0.0%) |
| College or Associate's Degree | 0 (0.0%) | 0 (0.0%) |
| Bachelor's Degree | 0 (0.0%) | 0 (0.0%) |
| Graduate Degree | 0 (0.0%) | 0 (0.0%) |
| Total | 0 (0.0%) | 0 (0.0%) |
Employment Characteristics in Windthorst
Employment by Class of Employer in Windthorst
Among the 124 employed individuals in Windthorst, private company employees (93 | 75.0%), local government employees (16 | 12.9%), and self-employed (not incorporated) (10 | 8.1%) make up the most common classes of employment.
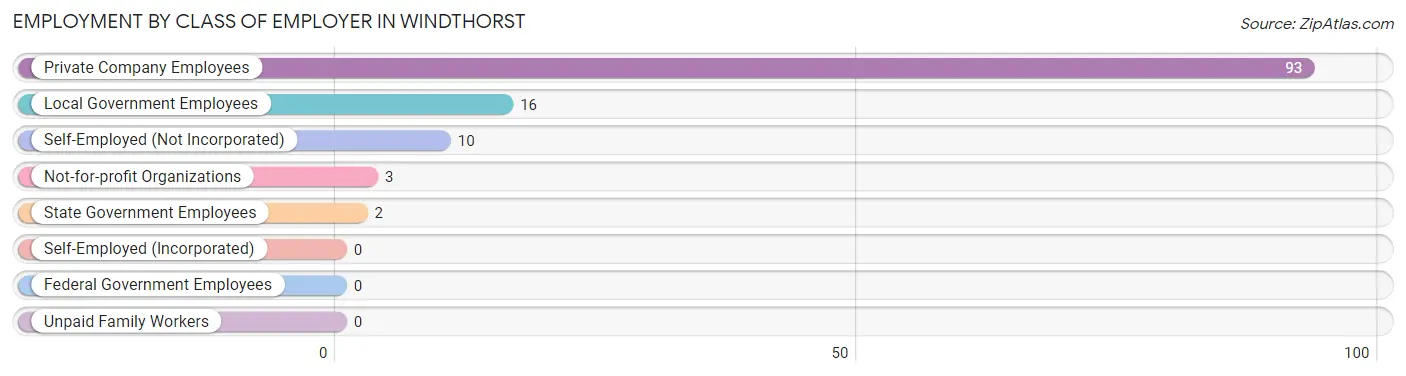
| Employer Class | # Employees | % Employees |
| Private Company Employees | 93 | 75.0% |
| Self-Employed (Incorporated) | 0 | 0.0% |
| Self-Employed (Not Incorporated) | 10 | 8.1% |
| Not-for-profit Organizations | 3 | 2.4% |
| Local Government Employees | 16 | 12.9% |
| State Government Employees | 2 | 1.6% |
| Federal Government Employees | 0 | 0.0% |
| Unpaid Family Workers | 0 | 0.0% |
| Total | 124 | 100.0% |
Employment Status by Age in Windthorst
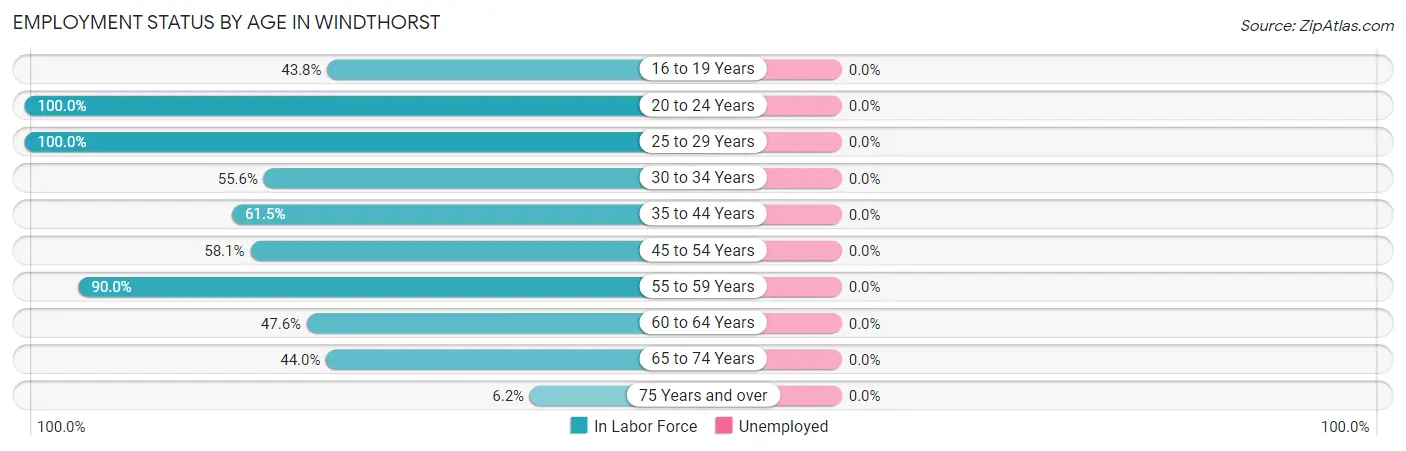
| Age Bracket | In Labor Force | Unemployed |
| 16 to 19 Years | 14 (43.8%) | 0 (0.0%) |
| 20 to 24 Years | 21 (100.0%) | 0 (0.0%) |
| 25 to 29 Years | 16 (100.0%) | 0 (0.0%) |
| 30 to 34 Years | 10 (55.6%) | 0 (0.0%) |
| 35 to 44 Years | 8 (61.5%) | 0 (0.0%) |
| 45 to 54 Years | 25 (58.1%) | 0 (0.0%) |
| 55 to 59 Years | 18 (90.0%) | 0 (0.0%) |
| 60 to 64 Years | 10 (47.6%) | 0 (0.0%) |
| 65 to 74 Years | 11 (44.0%) | 0 (0.0%) |
| 75 Years and over | 5 (6.2%) | 0 (0.0%) |
| Total | 138 (47.6%) | 0 (0.0%) |
Employment Status by Educational Attainment in Windthorst
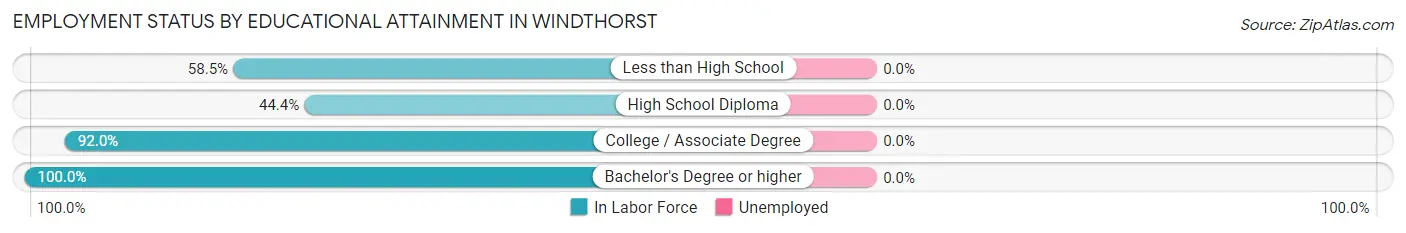
| Educational Attainment | In Labor Force | Unemployed |
| Less than High School | 24 (58.5%) | 0 (0.0%) |
| High School Diploma | 20 (44.4%) | 0 (0.0%) |
| College / Associate Degree | 23 (92.0%) | 0 (0.0%) |
| Bachelor's Degree or higher | 20 (100.0%) | 0 (0.0%) |
| Total | 87 (66.4%) | 0 (0.0%) |
Employment Occupations by Sex in Windthorst
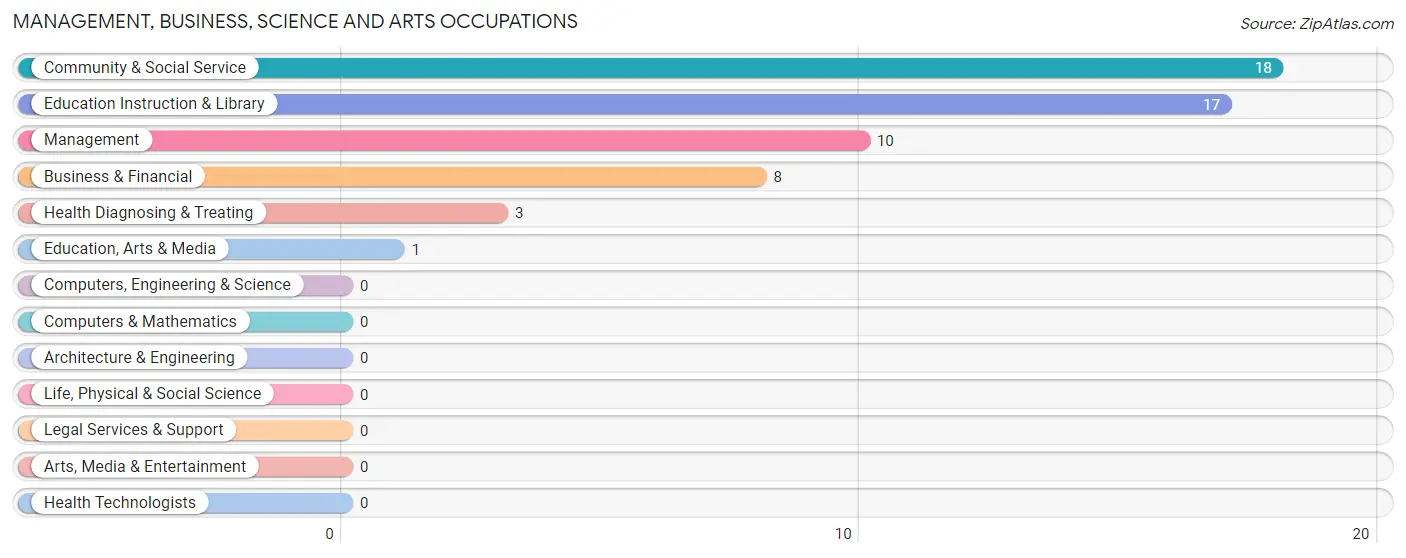
Management, Business, Science and Arts Occupations
The most common Management, Business, Science and Arts occupations in Windthorst are Community & Social Service (18 | 13.0%), Education Instruction & Library (17 | 12.3%), Management (10 | 7.2%), Business & Financial (8 | 5.8%), and Health Diagnosing & Treating (3 | 2.2%).
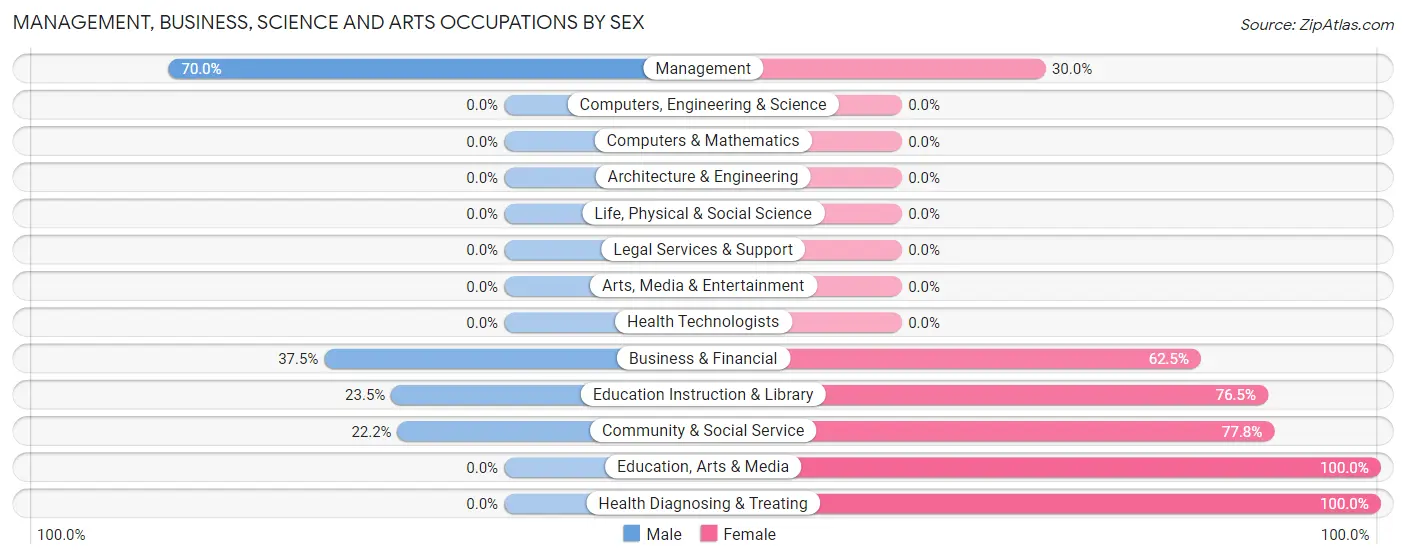
Management, Business, Science and Arts Occupations by Sex
Within the Management, Business, Science and Arts occupations in Windthorst, the most male-oriented occupations are Management (70.0%), Business & Financial (37.5%), and Education Instruction & Library (23.5%), while the most female-oriented occupations are Education, Arts & Media (100.0%), Health Diagnosing & Treating (100.0%), and Community & Social Service (77.8%).
| Occupation | Male | Female |
| Management | 7 (70.0%) | 3 (30.0%) |
| Business & Financial | 3 (37.5%) | 5 (62.5%) |
| Computers, Engineering & Science | 0 (0.0%) | 0 (0.0%) |
| Computers & Mathematics | 0 (0.0%) | 0 (0.0%) |
| Architecture & Engineering | 0 (0.0%) | 0 (0.0%) |
| Life, Physical & Social Science | 0 (0.0%) | 0 (0.0%) |
| Community & Social Service | 4 (22.2%) | 14 (77.8%) |
| Education, Arts & Media | 0 (0.0%) | 1 (100.0%) |
| Legal Services & Support | 0 (0.0%) | 0 (0.0%) |
| Education Instruction & Library | 4 (23.5%) | 13 (76.5%) |
| Arts, Media & Entertainment | 0 (0.0%) | 0 (0.0%) |
| Health Diagnosing & Treating | 0 (0.0%) | 3 (100.0%) |
| Health Technologists | 0 (0.0%) | 0 (0.0%) |
| Total (Category) | 14 (35.9%) | 25 (64.1%) |
| Total (Overall) | 79 (57.3%) | 59 (42.7%) |
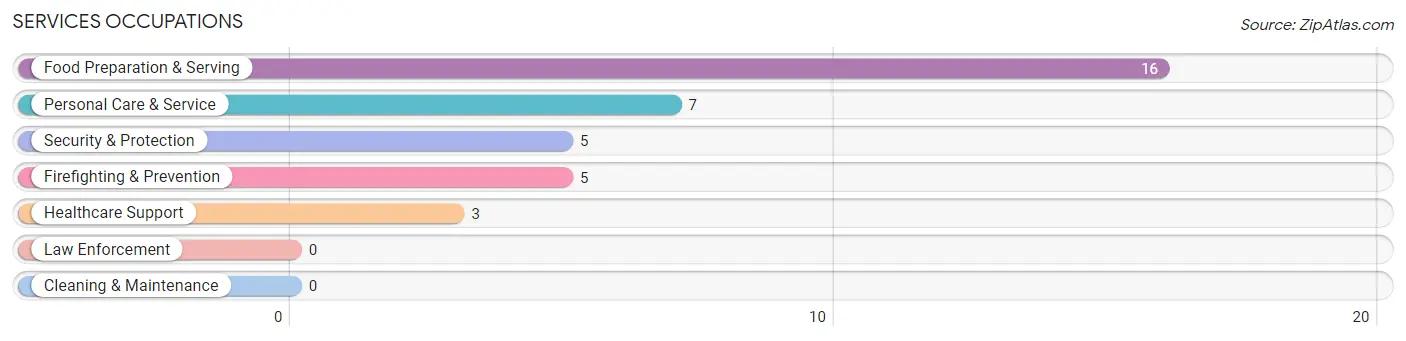
Services Occupations
The most common Services occupations in Windthorst are Food Preparation & Serving (16 | 11.6%), Personal Care & Service (7 | 5.1%), Security & Protection (5 | 3.6%), Firefighting & Prevention (5 | 3.6%), and Healthcare Support (3 | 2.2%).
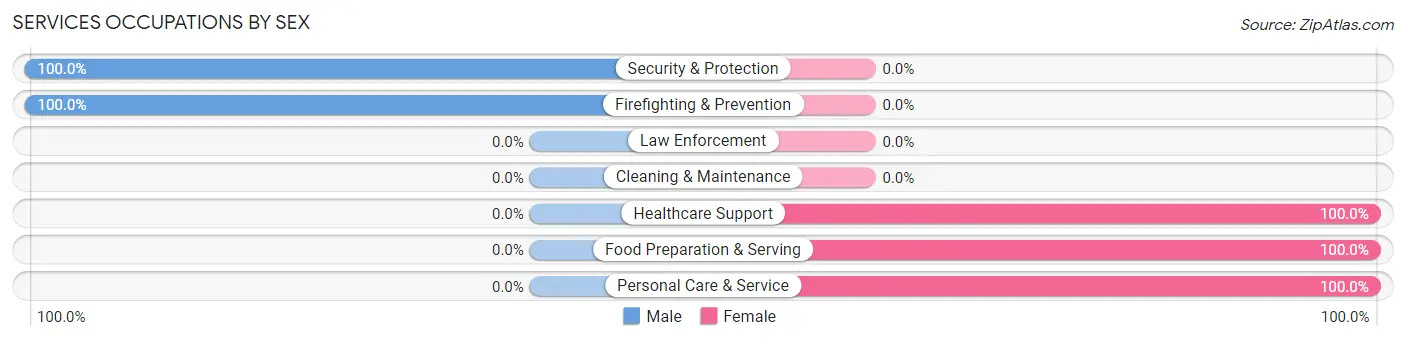
Services Occupations by Sex
Within the Services occupations in Windthorst, the most male-oriented occupations are Security & Protection (100.0%), and Firefighting & Prevention (100.0%), while the most female-oriented occupations are Healthcare Support (100.0%), Food Preparation & Serving (100.0%), and Personal Care & Service (100.0%).
| Occupation | Male | Female |
| Healthcare Support | 0 (0.0%) | 3 (100.0%) |
| Security & Protection | 5 (100.0%) | 0 (0.0%) |
| Firefighting & Prevention | 5 (100.0%) | 0 (0.0%) |
| Law Enforcement | 0 (0.0%) | 0 (0.0%) |
| Food Preparation & Serving | 0 (0.0%) | 16 (100.0%) |
| Cleaning & Maintenance | 0 (0.0%) | 0 (0.0%) |
| Personal Care & Service | 0 (0.0%) | 7 (100.0%) |
| Total (Category) | 5 (16.1%) | 26 (83.9%) |
| Total (Overall) | 79 (57.3%) | 59 (42.7%) |
Sales and Office Occupations
The most common Sales and Office occupations in Windthorst are Office & Administration (8 | 5.8%), and Sales & Related (4 | 2.9%).
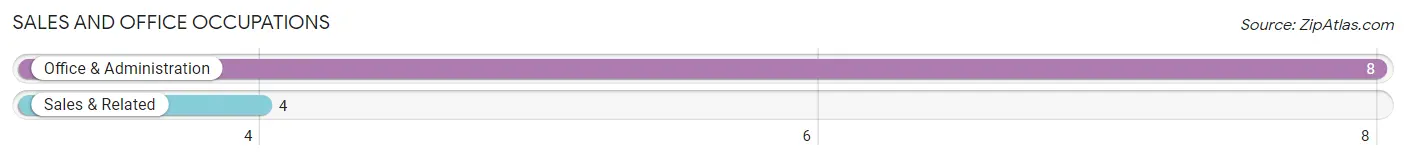
Sales and Office Occupations by Sex
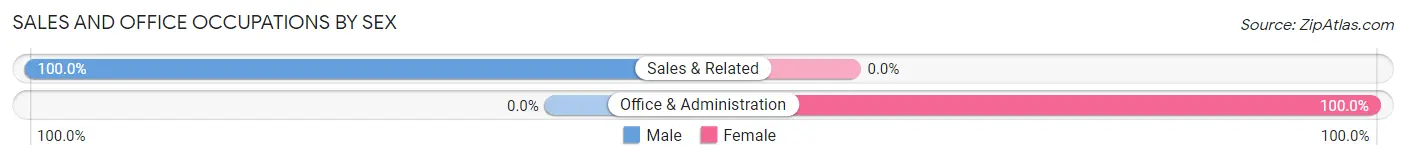
| Occupation | Male | Female |
| Sales & Related | 4 (100.0%) | 0 (0.0%) |
| Office & Administration | 0 (0.0%) | 8 (100.0%) |
| Total (Category) | 4 (33.3%) | 8 (66.7%) |
| Total (Overall) | 79 (57.3%) | 59 (42.7%) |
Natural Resources, Construction and Maintenance Occupations
The most common Natural Resources, Construction and Maintenance occupations in Windthorst are Farming, Fishing & Forestry (11 | 8.0%), Construction & Extraction (5 | 3.6%), and Installation, Maintenance & Repair (2 | 1.5%).
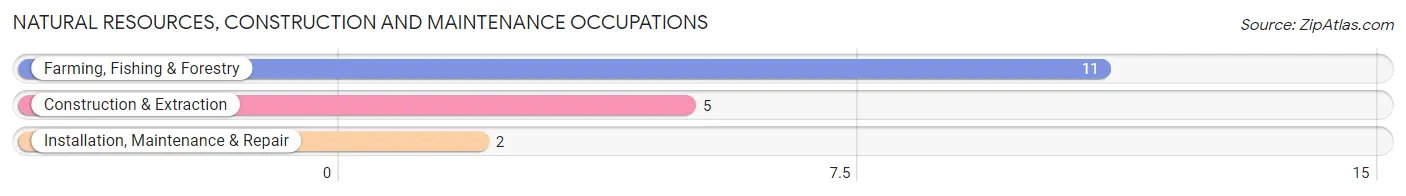
Natural Resources, Construction and Maintenance Occupations by Sex

| Occupation | Male | Female |
| Farming, Fishing & Forestry | 11 (100.0%) | 0 (0.0%) |
| Construction & Extraction | 5 (100.0%) | 0 (0.0%) |
| Installation, Maintenance & Repair | 2 (100.0%) | 0 (0.0%) |
| Total (Category) | 18 (100.0%) | 0 (0.0%) |
| Total (Overall) | 79 (57.3%) | 59 (42.7%) |
Production, Transportation and Moving Occupations
The most common Production, Transportation and Moving occupations in Windthorst are Transportation (22 | 15.9%), Material Moving (11 | 8.0%), and Production (5 | 3.6%).
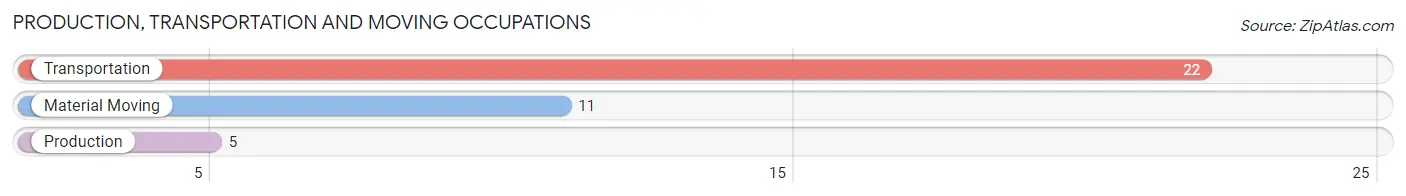
Production, Transportation and Moving Occupations by Sex
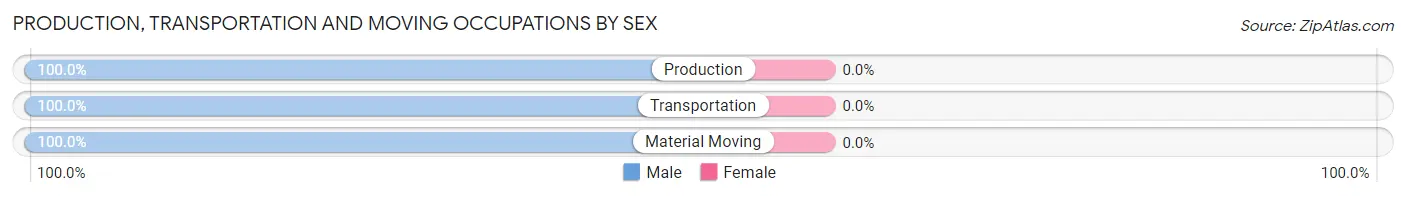
| Occupation | Male | Female |
| Production | 5 (100.0%) | 0 (0.0%) |
| Transportation | 22 (100.0%) | 0 (0.0%) |
| Material Moving | 11 (100.0%) | 0 (0.0%) |
| Total (Category) | 38 (100.0%) | 0 (0.0%) |
| Total (Overall) | 79 (57.3%) | 59 (42.7%) |
Employment Industries by Sex in Windthorst
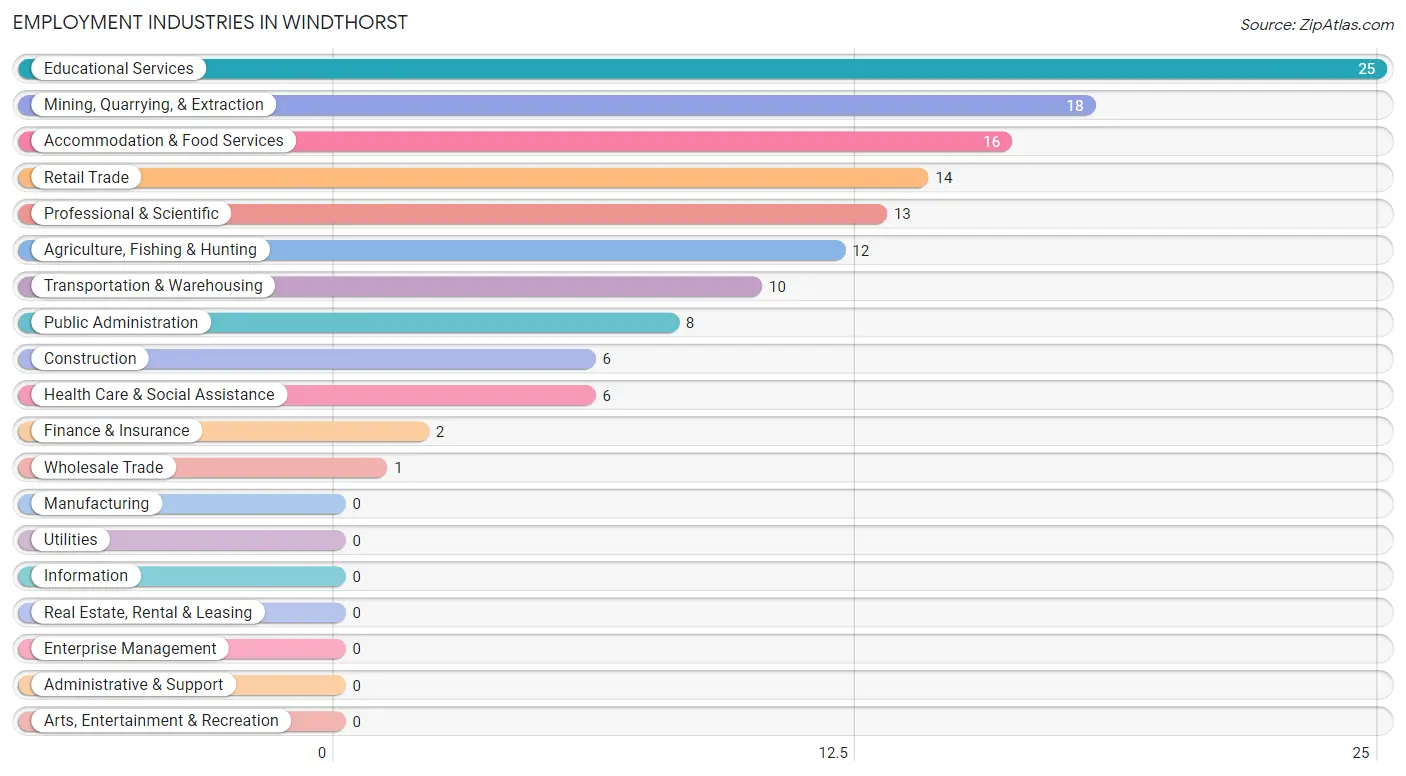
Employment Industries in Windthorst
The major employment industries in Windthorst include Educational Services (25 | 18.1%), Mining, Quarrying, & Extraction (18 | 13.0%), Accommodation & Food Services (16 | 11.6%), Retail Trade (14 | 10.1%), and Professional & Scientific (13 | 9.4%).
Employment Industries by Sex in Windthorst
The Windthorst industries that see more men than women are Agriculture, Fishing & Hunting (100.0%), Mining, Quarrying, & Extraction (100.0%), and Construction (100.0%), whereas the industries that tend to have a higher number of women are Finance & Insurance (100.0%), Health Care & Social Assistance (100.0%), and Accommodation & Food Services (100.0%).
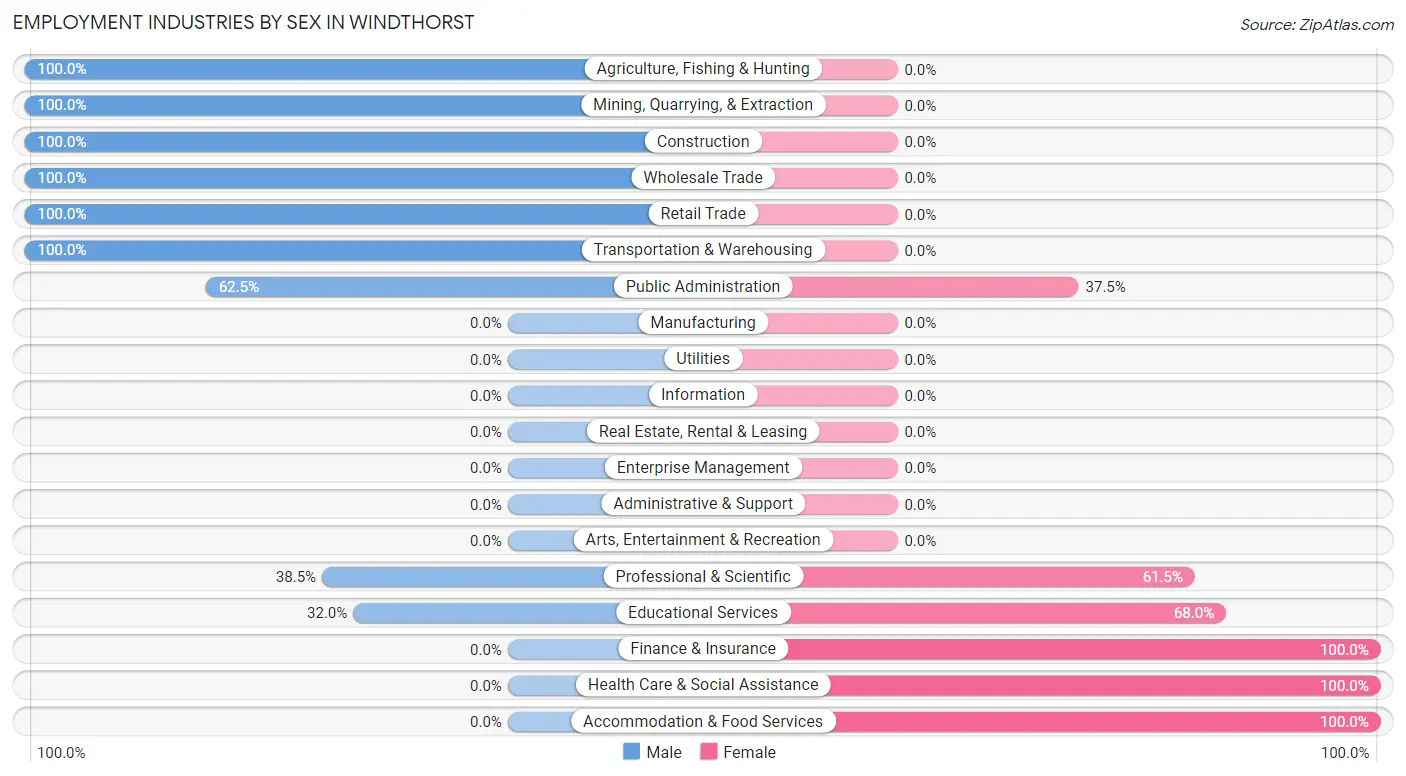
| Industry | Male | Female |
| Agriculture, Fishing & Hunting | 12 (100.0%) | 0 (0.0%) |
| Mining, Quarrying, & Extraction | 18 (100.0%) | 0 (0.0%) |
| Construction | 6 (100.0%) | 0 (0.0%) |
| Manufacturing | 0 (0.0%) | 0 (0.0%) |
| Wholesale Trade | 1 (100.0%) | 0 (0.0%) |
| Retail Trade | 14 (100.0%) | 0 (0.0%) |
| Transportation & Warehousing | 10 (100.0%) | 0 (0.0%) |
| Utilities | 0 (0.0%) | 0 (0.0%) |
| Information | 0 (0.0%) | 0 (0.0%) |
| Finance & Insurance | 0 (0.0%) | 2 (100.0%) |
| Real Estate, Rental & Leasing | 0 (0.0%) | 0 (0.0%) |
| Professional & Scientific | 5 (38.5%) | 8 (61.5%) |
| Enterprise Management | 0 (0.0%) | 0 (0.0%) |
| Administrative & Support | 0 (0.0%) | 0 (0.0%) |
| Educational Services | 8 (32.0%) | 17 (68.0%) |
| Health Care & Social Assistance | 0 (0.0%) | 6 (100.0%) |
| Arts, Entertainment & Recreation | 0 (0.0%) | 0 (0.0%) |
| Accommodation & Food Services | 0 (0.0%) | 16 (100.0%) |
| Public Administration | 5 (62.5%) | 3 (37.5%) |
| Total | 79 (57.3%) | 59 (42.7%) |
Education in Windthorst
School Enrollment in Windthorst
The most common levels of schooling among the 69 students in Windthorst are middle school (26 | 37.7%), high school (23 | 33.3%), and kindergarten (7 | 10.1%).
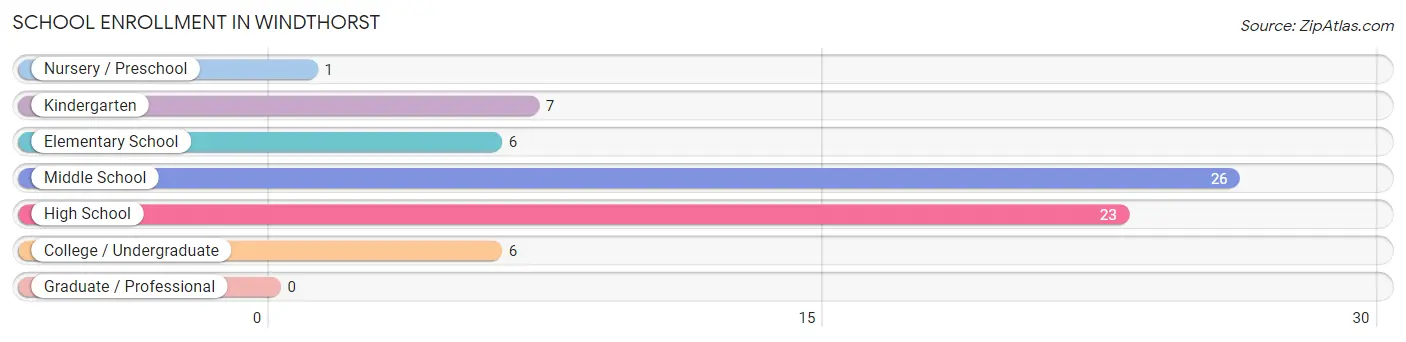
| School Level | # Students | % Students |
| Nursery / Preschool | 1 | 1.5% |
| Kindergarten | 7 | 10.1% |
| Elementary School | 6 | 8.7% |
| Middle School | 26 | 37.7% |
| High School | 23 | 33.3% |
| College / Undergraduate | 6 | 8.7% |
| Graduate / Professional | 0 | 0.0% |
| Total | 69 | 100.0% |
School Enrollment by Age by Funding Source in Windthorst
Out of a total of 69 students who are enrolled in schools in Windthorst, 3 (4.3%) attend a private institution, while the remaining 66 (95.7%) are enrolled in public schools. The age group of 5 to 9 year old has the highest likelihood of being enrolled in private schools, with 2 (15.4% in the age bracket) enrolled. Conversely, the age group of 10 to 14 year olds has the lowest likelihood of being enrolled in a private school, with 27 (100.0% in the age bracket) attending a public institution.
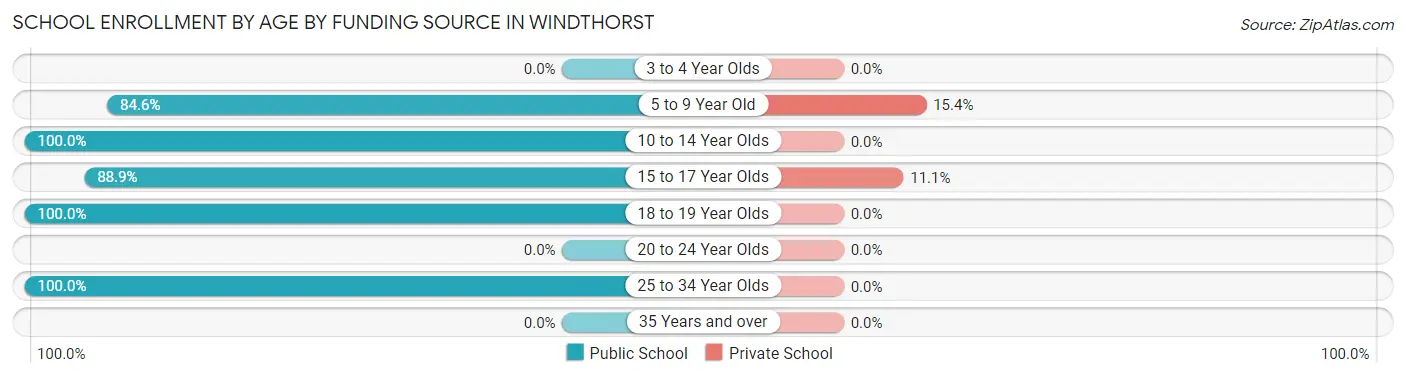
| Age Bracket | Public School | Private School |
| 3 to 4 Year Olds | 0 (0.0%) | 0 (0.0%) |
| 5 to 9 Year Old | 11 (84.6%) | 2 (15.4%) |
| 10 to 14 Year Olds | 27 (100.0%) | 0 (0.0%) |
| 15 to 17 Year Olds | 8 (88.9%) | 1 (11.1%) |
| 18 to 19 Year Olds | 16 (100.0%) | 0 (0.0%) |
| 20 to 24 Year Olds | 0 (0.0%) | 0 (0.0%) |
| 25 to 34 Year Olds | 4 (100.0%) | 0 (0.0%) |
| 35 Years and over | 0 (0.0%) | 0 (0.0%) |
| Total | 66 (95.7%) | 3 (4.3%) |
Educational Attainment by Field of Study in Windthorst
Business (9 | 34.6%), education (5 | 19.2%), social sciences (3 | 11.5%), liberal arts & history (3 | 11.5%), and bio, nature & agricultural (2 | 7.7%) are the most common fields of study among 26 individuals in Windthorst who have obtained a bachelor's degree or higher.
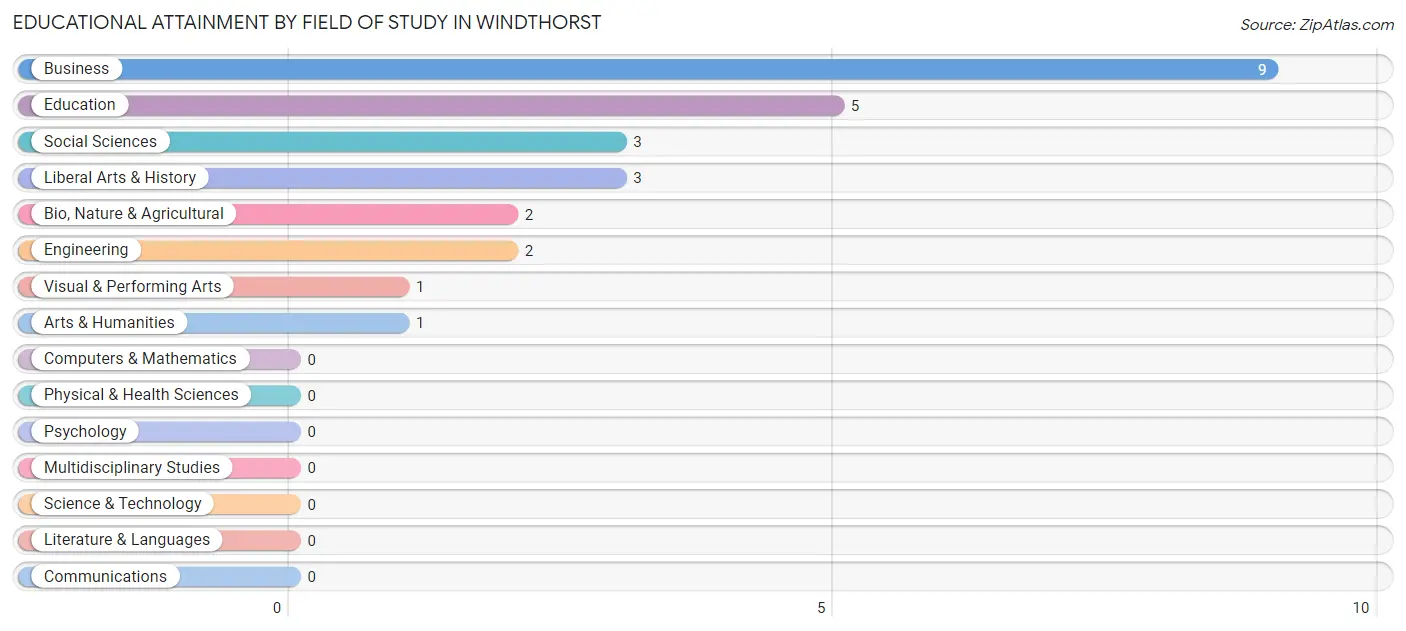
| Field of Study | # Graduates | % Graduates |
| Computers & Mathematics | 0 | 0.0% |
| Bio, Nature & Agricultural | 2 | 7.7% |
| Physical & Health Sciences | 0 | 0.0% |
| Psychology | 0 | 0.0% |
| Social Sciences | 3 | 11.5% |
| Engineering | 2 | 7.7% |
| Multidisciplinary Studies | 0 | 0.0% |
| Science & Technology | 0 | 0.0% |
| Business | 9 | 34.6% |
| Education | 5 | 19.2% |
| Literature & Languages | 0 | 0.0% |
| Liberal Arts & History | 3 | 11.5% |
| Visual & Performing Arts | 1 | 3.8% |
| Communications | 0 | 0.0% |
| Arts & Humanities | 1 | 3.8% |
| Total | 26 | 100.0% |
Transportation & Commute in Windthorst
Vehicle Availability by Sex in Windthorst
The most prevalent vehicle ownership categories in Windthorst are males with 2 vehicles (28, accounting for 36.8%) and females with 2 vehicles (13, making up 58.3%).
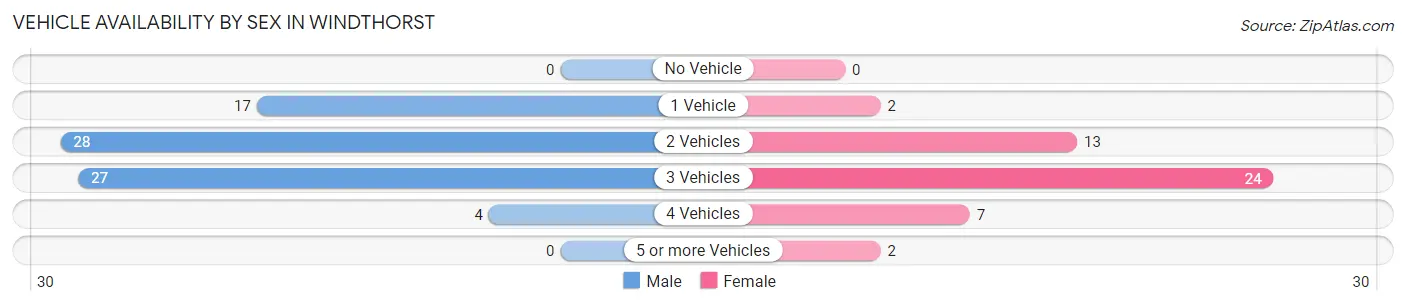
| Vehicles Available | Male | Female |
| No Vehicle | 0 (0.0%) | 0 (0.0%) |
| 1 Vehicle | 17 (22.4%) | 2 (4.2%) |
| 2 Vehicles | 28 (36.8%) | 13 (27.1%) |
| 3 Vehicles | 27 (35.5%) | 24 (50.0%) |
| 4 Vehicles | 4 (5.3%) | 7 (14.6%) |
| 5 or more Vehicles | 0 (0.0%) | 2 (4.2%) |
| Total | 76 (100.0%) | 48 (100.0%) |
Commute Time in Windthorst
The most frequently occuring commute durations in Windthorst are 10 to 14 minutes (32 commuters, 26.0%), 30 to 34 minutes (26 commuters, 21.1%), and less than 5 minutes (25 commuters, 20.3%).
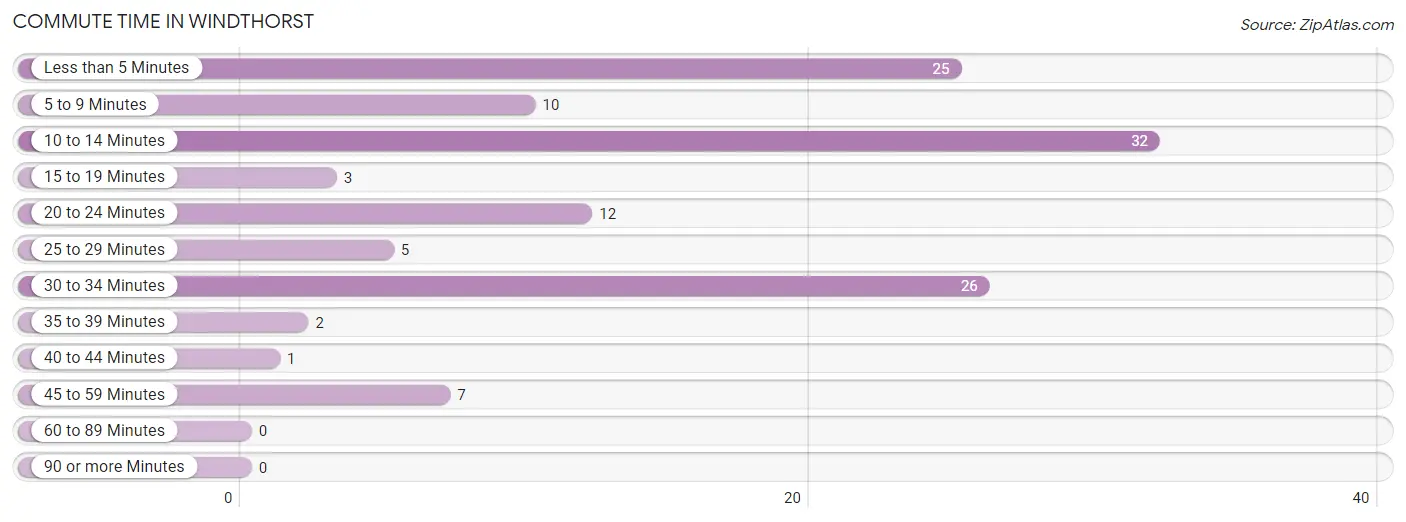
| Commute Time | # Commuters | % Commuters |
| Less than 5 Minutes | 25 | 20.3% |
| 5 to 9 Minutes | 10 | 8.1% |
| 10 to 14 Minutes | 32 | 26.0% |
| 15 to 19 Minutes | 3 | 2.4% |
| 20 to 24 Minutes | 12 | 9.8% |
| 25 to 29 Minutes | 5 | 4.1% |
| 30 to 34 Minutes | 26 | 21.1% |
| 35 to 39 Minutes | 2 | 1.6% |
| 40 to 44 Minutes | 1 | 0.8% |
| 45 to 59 Minutes | 7 | 5.7% |
| 60 to 89 Minutes | 0 | 0.0% |
| 90 or more Minutes | 0 | 0.0% |
Commute Time by Sex in Windthorst
The most common commute times in Windthorst are less than 5 minutes (18 commuters, 23.7%) for males and 10 to 14 minutes (17 commuters, 36.2%) for females.
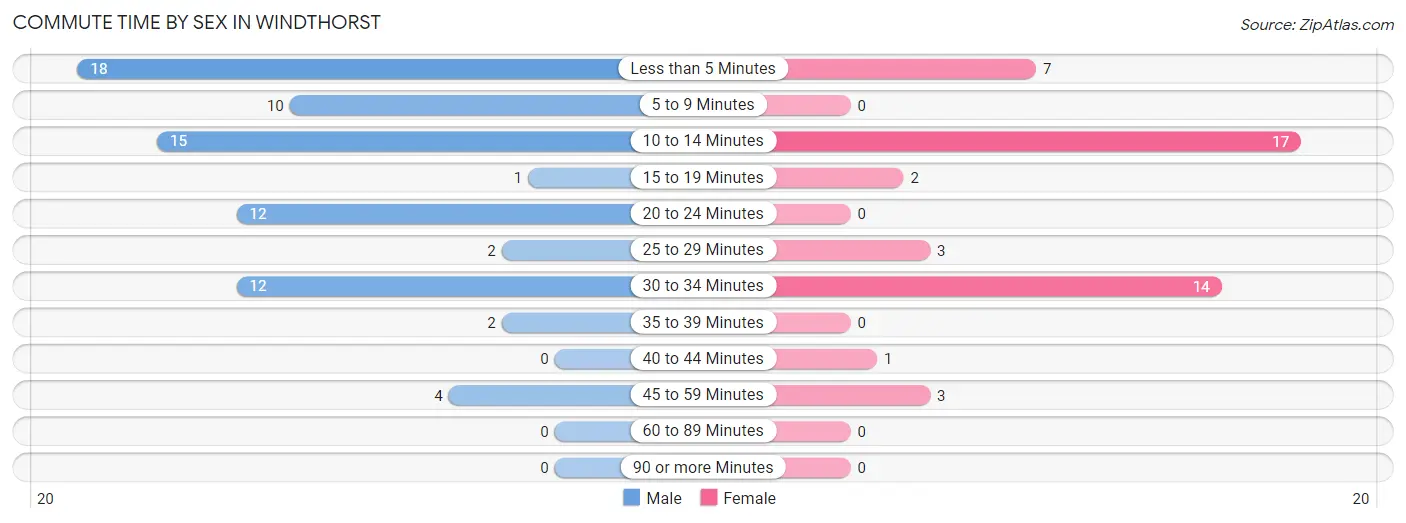
| Commute Time | Male | Female |
| Less than 5 Minutes | 18 (23.7%) | 7 (14.9%) |
| 5 to 9 Minutes | 10 (13.2%) | 0 (0.0%) |
| 10 to 14 Minutes | 15 (19.7%) | 17 (36.2%) |
| 15 to 19 Minutes | 1 (1.3%) | 2 (4.3%) |
| 20 to 24 Minutes | 12 (15.8%) | 0 (0.0%) |
| 25 to 29 Minutes | 2 (2.6%) | 3 (6.4%) |
| 30 to 34 Minutes | 12 (15.8%) | 14 (29.8%) |
| 35 to 39 Minutes | 2 (2.6%) | 0 (0.0%) |
| 40 to 44 Minutes | 0 (0.0%) | 1 (2.1%) |
| 45 to 59 Minutes | 4 (5.3%) | 3 (6.4%) |
| 60 to 89 Minutes | 0 (0.0%) | 0 (0.0%) |
| 90 or more Minutes | 0 (0.0%) | 0 (0.0%) |
Time of Departure to Work by Sex in Windthorst
The most frequent times of departure to work in Windthorst are 6:30 AM to 6:59 AM (21, 27.6%) for males and 10:00 AM to 10:59 AM (12, 25.5%) for females.
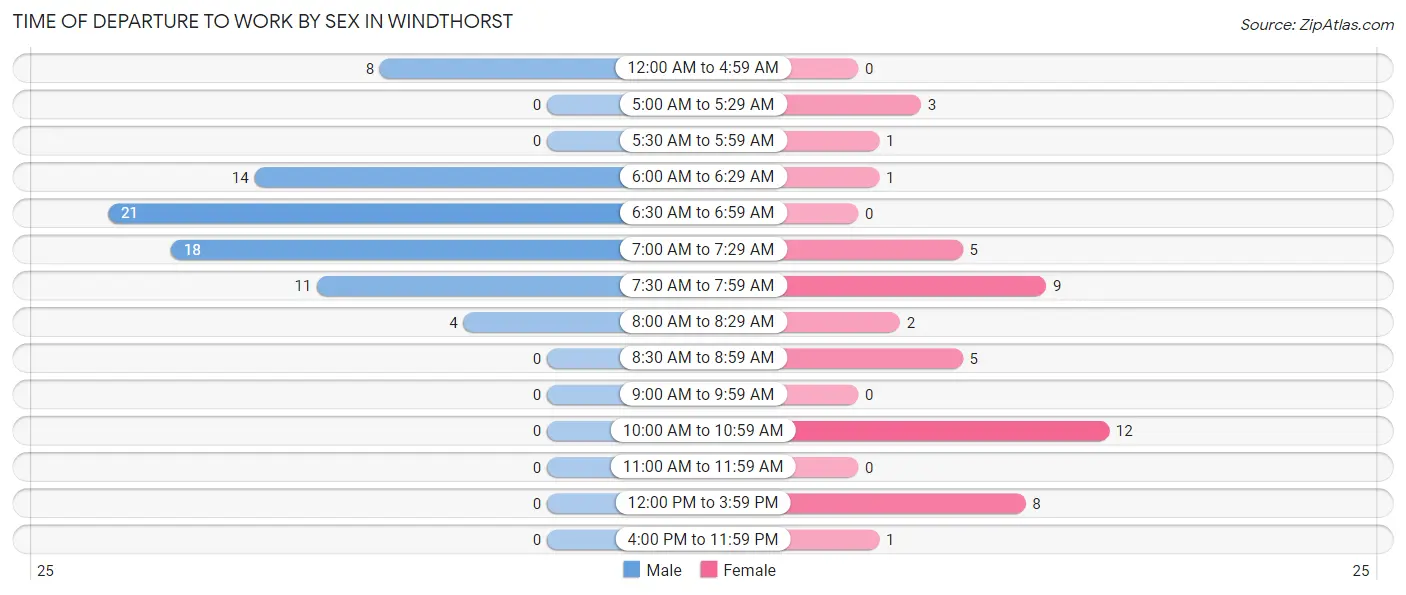
| Time of Departure | Male | Female |
| 12:00 AM to 4:59 AM | 8 (10.5%) | 0 (0.0%) |
| 5:00 AM to 5:29 AM | 0 (0.0%) | 3 (6.4%) |
| 5:30 AM to 5:59 AM | 0 (0.0%) | 1 (2.1%) |
| 6:00 AM to 6:29 AM | 14 (18.4%) | 1 (2.1%) |
| 6:30 AM to 6:59 AM | 21 (27.6%) | 0 (0.0%) |
| 7:00 AM to 7:29 AM | 18 (23.7%) | 5 (10.6%) |
| 7:30 AM to 7:59 AM | 11 (14.5%) | 9 (19.2%) |
| 8:00 AM to 8:29 AM | 4 (5.3%) | 2 (4.3%) |
| 8:30 AM to 8:59 AM | 0 (0.0%) | 5 (10.6%) |
| 9:00 AM to 9:59 AM | 0 (0.0%) | 0 (0.0%) |
| 10:00 AM to 10:59 AM | 0 (0.0%) | 12 (25.5%) |
| 11:00 AM to 11:59 AM | 0 (0.0%) | 0 (0.0%) |
| 12:00 PM to 3:59 PM | 0 (0.0%) | 8 (17.0%) |
| 4:00 PM to 11:59 PM | 0 (0.0%) | 1 (2.1%) |
| Total | 76 (100.0%) | 47 (100.0%) |
Housing Occupancy in Windthorst
Occupancy by Ownership in Windthorst
Of the total 127 dwellings in Windthorst, owner-occupied units account for 109 (85.8%), while renter-occupied units make up 18 (14.2%).
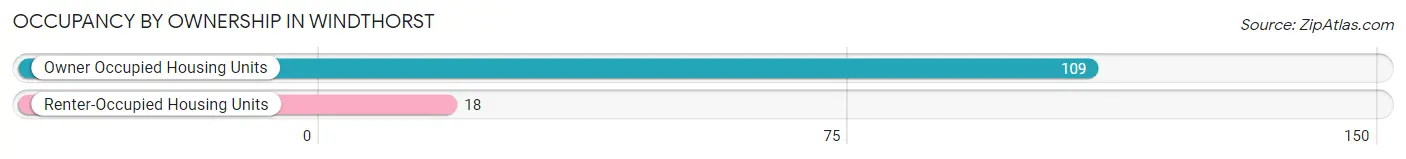
| Occupancy | # Housing Units | % Housing Units |
| Owner Occupied Housing Units | 109 | 85.8% |
| Renter-Occupied Housing Units | 18 | 14.2% |
| Total Occupied Housing Units | 127 | 100.0% |
Occupancy by Household Size in Windthorst
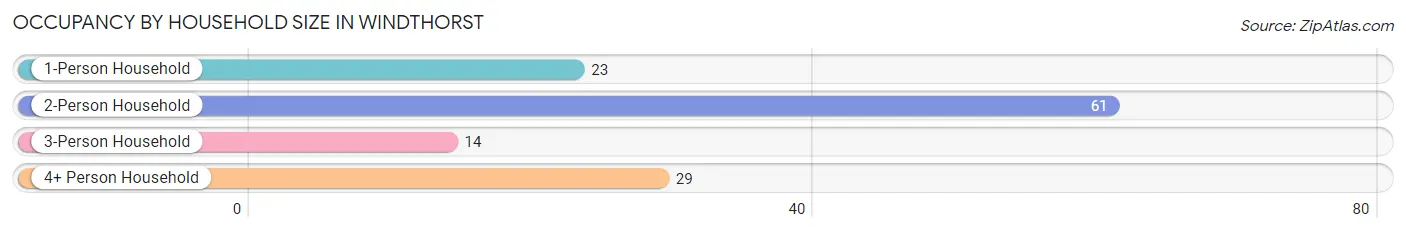
| Household Size | # Housing Units | % Housing Units |
| 1-Person Household | 23 | 18.1% |
| 2-Person Household | 61 | 48.0% |
| 3-Person Household | 14 | 11.0% |
| 4+ Person Household | 29 | 22.8% |
| Total Housing Units | 127 | 100.0% |
Occupancy by Ownership by Household Size in Windthorst
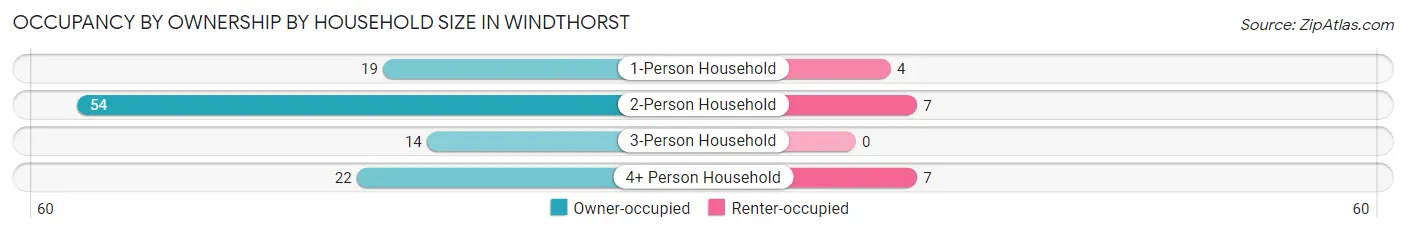
| Household Size | Owner-occupied | Renter-occupied |
| 1-Person Household | 19 (82.6%) | 4 (17.4%) |
| 2-Person Household | 54 (88.5%) | 7 (11.5%) |
| 3-Person Household | 14 (100.0%) | 0 (0.0%) |
| 4+ Person Household | 22 (75.9%) | 7 (24.1%) |
| Total Housing Units | 109 (85.8%) | 18 (14.2%) |
Occupancy by Educational Attainment in Windthorst
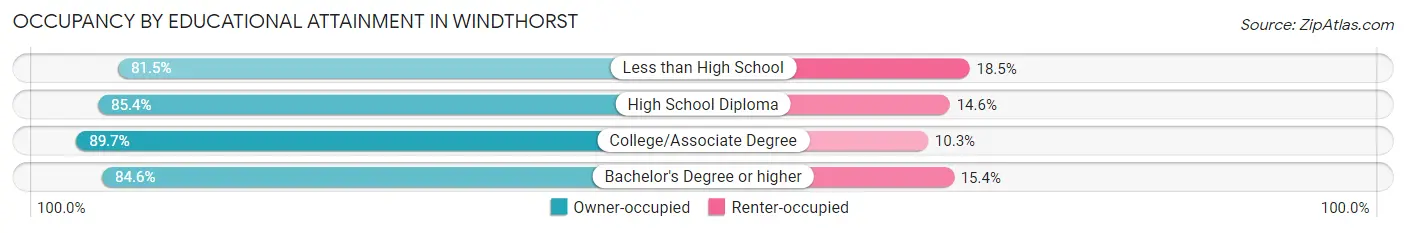
| Household Size | Owner-occupied | Renter-occupied |
| Less than High School | 22 (81.5%) | 5 (18.5%) |
| High School Diploma | 41 (85.4%) | 7 (14.6%) |
| College/Associate Degree | 35 (89.7%) | 4 (10.3%) |
| Bachelor's Degree or higher | 11 (84.6%) | 2 (15.4%) |
Occupancy by Age of Householder in Windthorst
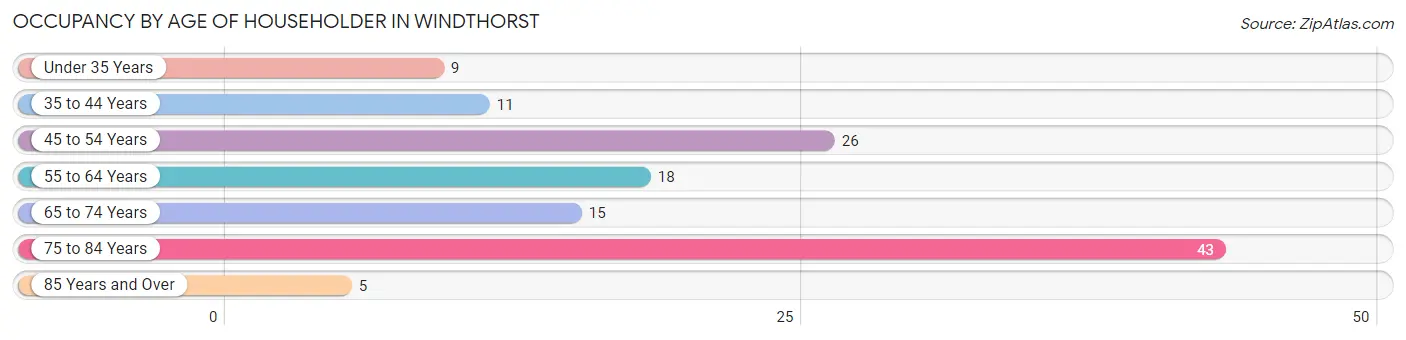
| Age Bracket | # Households | % Households |
| Under 35 Years | 9 | 7.1% |
| 35 to 44 Years | 11 | 8.7% |
| 45 to 54 Years | 26 | 20.5% |
| 55 to 64 Years | 18 | 14.2% |
| 65 to 74 Years | 15 | 11.8% |
| 75 to 84 Years | 43 | 33.9% |
| 85 Years and Over | 5 | 3.9% |
| Total | 127 | 100.0% |
Housing Finances in Windthorst
Median Income by Occupancy in Windthorst
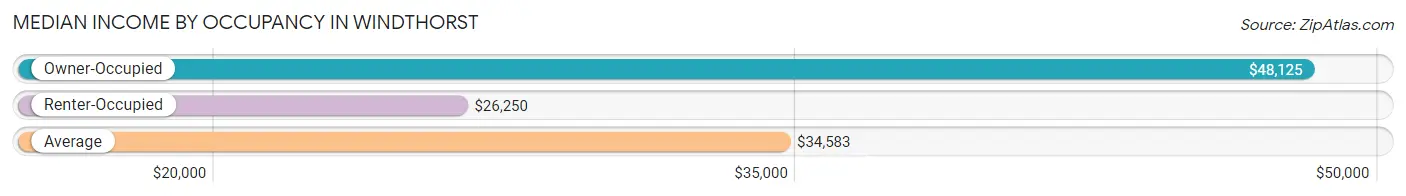
| Occupancy Type | # Households | Median Income |
| Owner-Occupied | 109 (85.8%) | $48,125 |
| Renter-Occupied | 18 (14.2%) | $26,250 |
| Average | 127 (100.0%) | $34,583 |
Occupancy by Householder Income Bracket in Windthorst
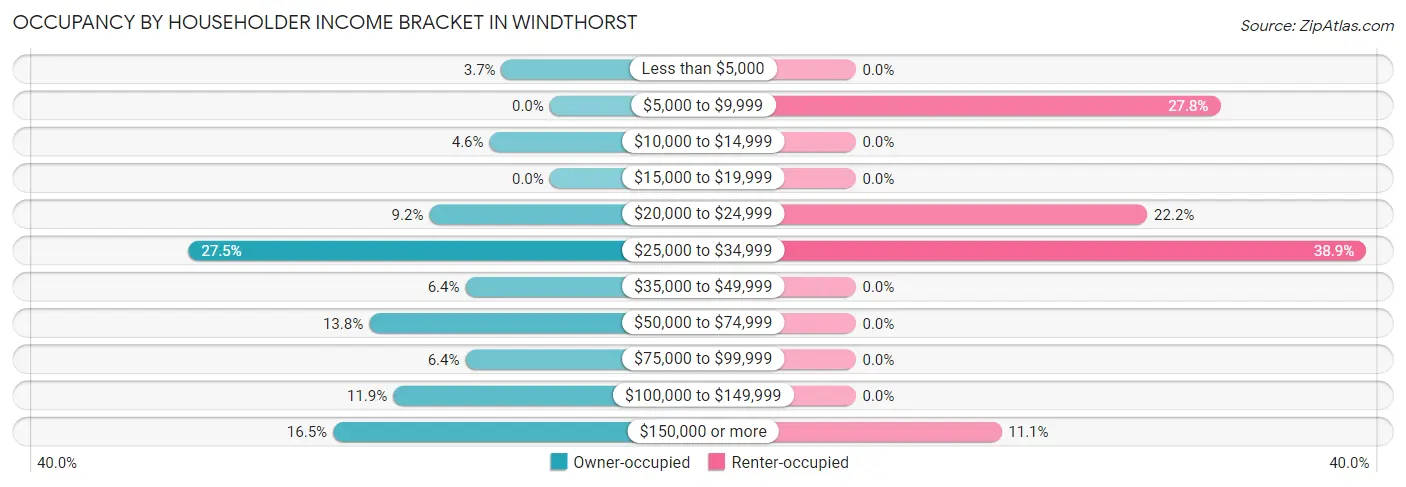
| Income Bracket | Owner-occupied | Renter-occupied |
| Less than $5,000 | 4 (3.7%) | 0 (0.0%) |
| $5,000 to $9,999 | 0 (0.0%) | 5 (27.8%) |
| $10,000 to $14,999 | 5 (4.6%) | 0 (0.0%) |
| $15,000 to $19,999 | 0 (0.0%) | 0 (0.0%) |
| $20,000 to $24,999 | 10 (9.2%) | 4 (22.2%) |
| $25,000 to $34,999 | 30 (27.5%) | 7 (38.9%) |
| $35,000 to $49,999 | 7 (6.4%) | 0 (0.0%) |
| $50,000 to $74,999 | 15 (13.8%) | 0 (0.0%) |
| $75,000 to $99,999 | 7 (6.4%) | 0 (0.0%) |
| $100,000 to $149,999 | 13 (11.9%) | 0 (0.0%) |
| $150,000 or more | 18 (16.5%) | 2 (11.1%) |
| Total | 109 (100.0%) | 18 (100.0%) |
Monthly Housing Cost Tiers in Windthorst
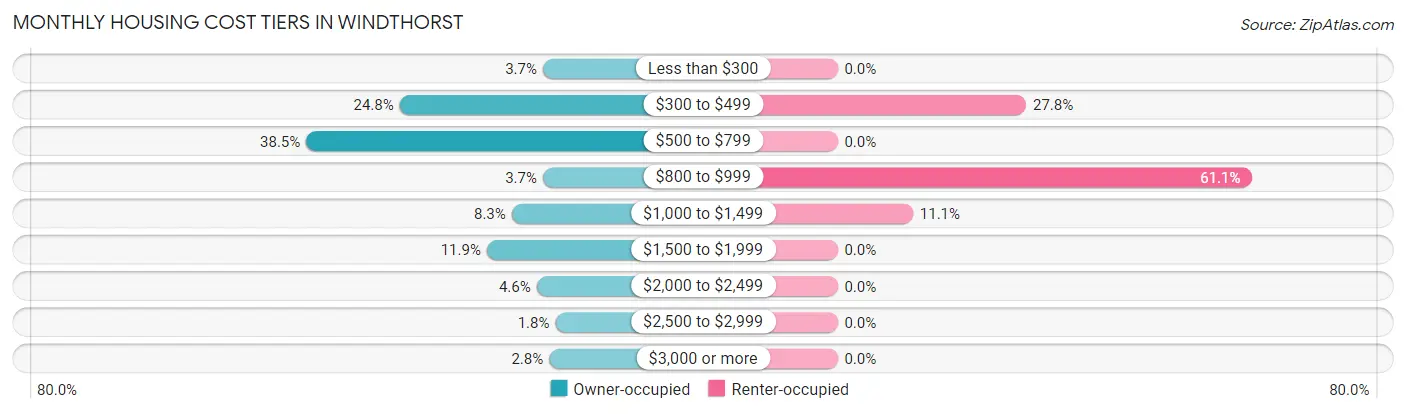
| Monthly Cost | Owner-occupied | Renter-occupied |
| Less than $300 | 4 (3.7%) | 0 (0.0%) |
| $300 to $499 | 27 (24.8%) | 5 (27.8%) |
| $500 to $799 | 42 (38.5%) | 0 (0.0%) |
| $800 to $999 | 4 (3.7%) | 11 (61.1%) |
| $1,000 to $1,499 | 9 (8.3%) | 2 (11.1%) |
| $1,500 to $1,999 | 13 (11.9%) | 0 (0.0%) |
| $2,000 to $2,499 | 5 (4.6%) | 0 (0.0%) |
| $2,500 to $2,999 | 2 (1.8%) | 0 (0.0%) |
| $3,000 or more | 3 (2.8%) | 0 (0.0%) |
| Total | 109 (100.0%) | 18 (100.0%) |
Physical Housing Characteristics in Windthorst
Housing Structures in Windthorst
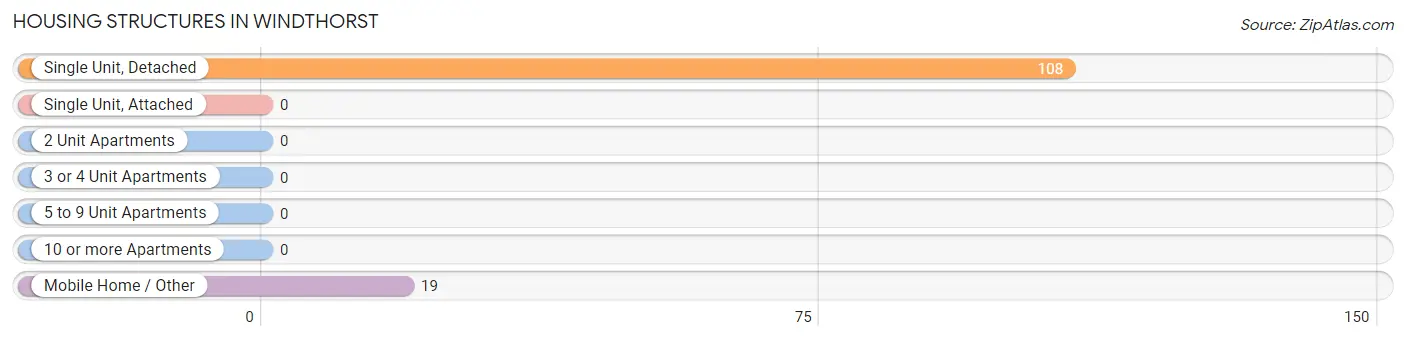
| Structure Type | # Housing Units | % Housing Units |
| Single Unit, Detached | 108 | 85.0% |
| Single Unit, Attached | 0 | 0.0% |
| 2 Unit Apartments | 0 | 0.0% |
| 3 or 4 Unit Apartments | 0 | 0.0% |
| 5 to 9 Unit Apartments | 0 | 0.0% |
| 10 or more Apartments | 0 | 0.0% |
| Mobile Home / Other | 19 | 15.0% |
| Total | 127 | 100.0% |
Housing Structures by Occupancy in Windthorst
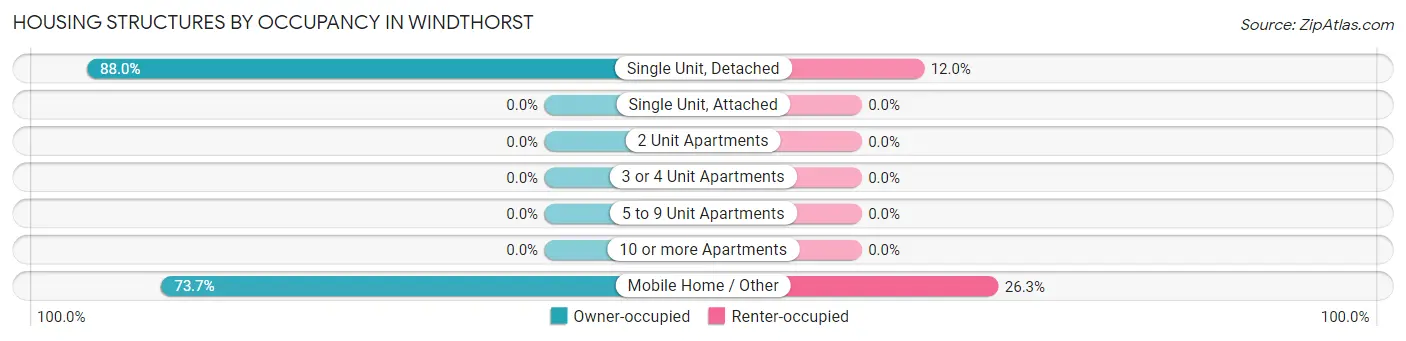
| Structure Type | Owner-occupied | Renter-occupied |
| Single Unit, Detached | 95 (88.0%) | 13 (12.0%) |
| Single Unit, Attached | 0 (0.0%) | 0 (0.0%) |
| 2 Unit Apartments | 0 (0.0%) | 0 (0.0%) |
| 3 or 4 Unit Apartments | 0 (0.0%) | 0 (0.0%) |
| 5 to 9 Unit Apartments | 0 (0.0%) | 0 (0.0%) |
| 10 or more Apartments | 0 (0.0%) | 0 (0.0%) |
| Mobile Home / Other | 14 (73.7%) | 5 (26.3%) |
| Total | 109 (85.8%) | 18 (14.2%) |
Housing Structures by Number of Rooms in Windthorst
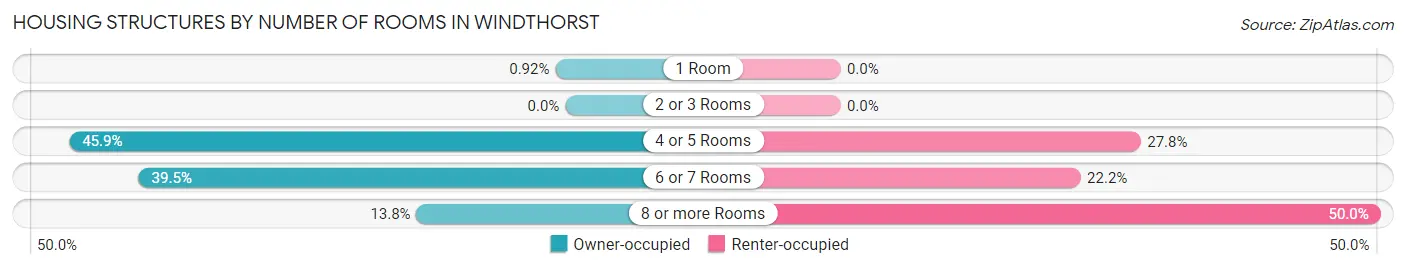
| Number of Rooms | Owner-occupied | Renter-occupied |
| 1 Room | 1 (0.9%) | 0 (0.0%) |
| 2 or 3 Rooms | 0 (0.0%) | 0 (0.0%) |
| 4 or 5 Rooms | 50 (45.9%) | 5 (27.8%) |
| 6 or 7 Rooms | 43 (39.5%) | 4 (22.2%) |
| 8 or more Rooms | 15 (13.8%) | 9 (50.0%) |
| Total | 109 (100.0%) | 18 (100.0%) |
Housing Structure by Heating Type in Windthorst
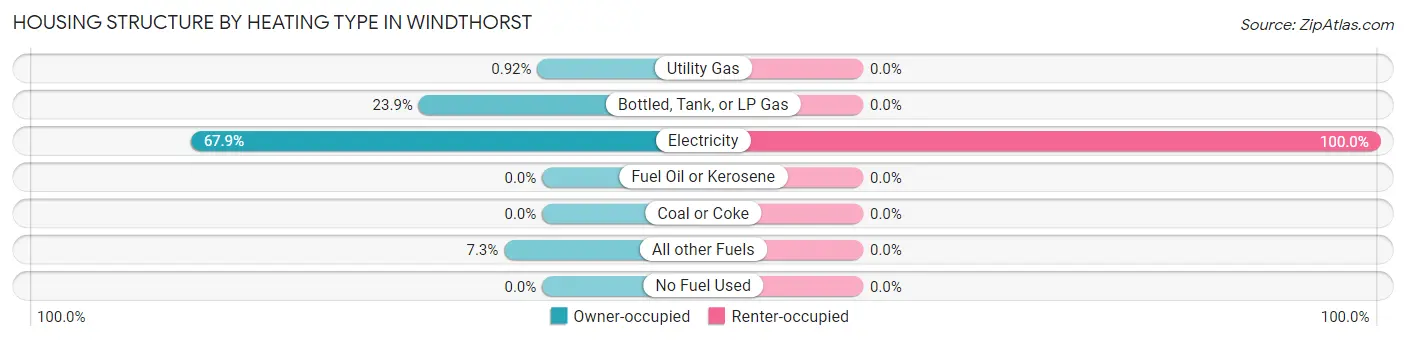
| Heating Type | Owner-occupied | Renter-occupied |
| Utility Gas | 1 (0.9%) | 0 (0.0%) |
| Bottled, Tank, or LP Gas | 26 (23.8%) | 0 (0.0%) |
| Electricity | 74 (67.9%) | 18 (100.0%) |
| Fuel Oil or Kerosene | 0 (0.0%) | 0 (0.0%) |
| Coal or Coke | 0 (0.0%) | 0 (0.0%) |
| All other Fuels | 8 (7.3%) | 0 (0.0%) |
| No Fuel Used | 0 (0.0%) | 0 (0.0%) |
| Total | 109 (100.0%) | 18 (100.0%) |
Household Vehicle Usage in Windthorst
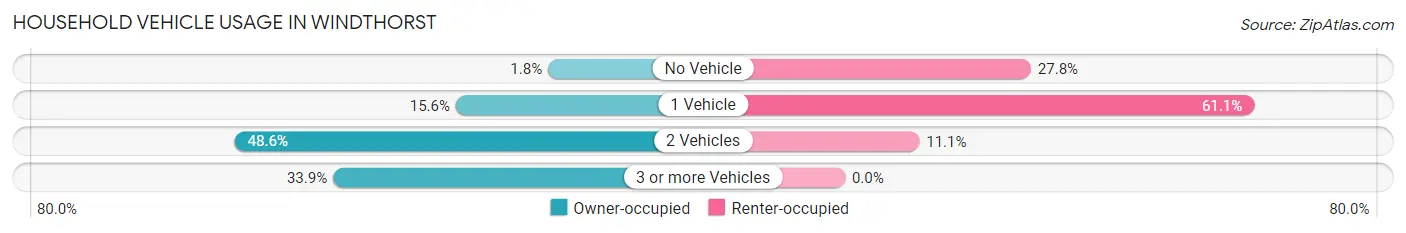
| Vehicles per Household | Owner-occupied | Renter-occupied |
| No Vehicle | 2 (1.8%) | 5 (27.8%) |
| 1 Vehicle | 17 (15.6%) | 11 (61.1%) |
| 2 Vehicles | 53 (48.6%) | 2 (11.1%) |
| 3 or more Vehicles | 37 (33.9%) | 0 (0.0%) |
| Total | 109 (100.0%) | 18 (100.0%) |
Real Estate & Mortgages in Windthorst
Real Estate and Mortgage Overview in Windthorst
| Characteristic | Without Mortgage | With Mortgage |
| Housing Units | 77 | 32 |
| Median Property Value | $185,400 | $162,500 |
| Median Household Income | $32,639 | $11 |
| Monthly Housing Costs | $563 | $3 |
| Real Estate Taxes | - | - |
Property Value by Mortgage Status in Windthorst
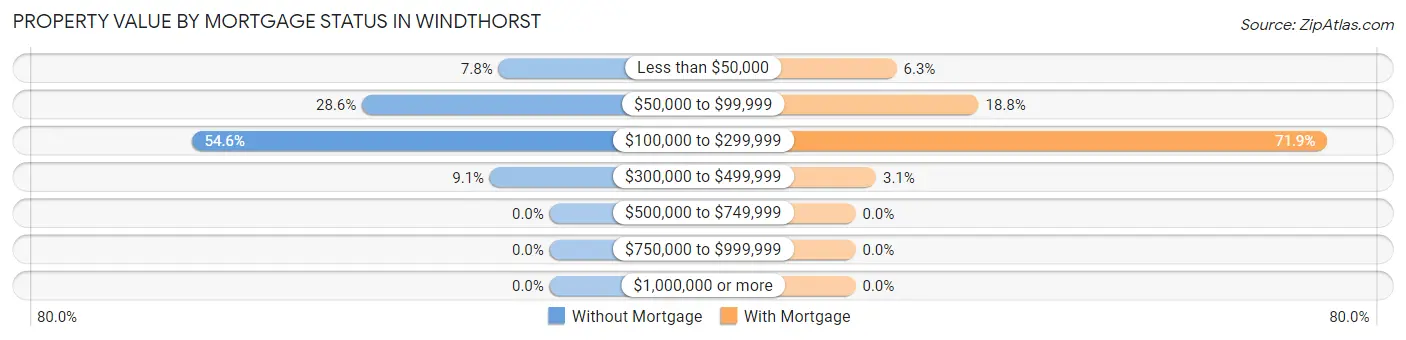
| Property Value | Without Mortgage | With Mortgage |
| Less than $50,000 | 6 (7.8%) | 2 (6.2%) |
| $50,000 to $99,999 | 22 (28.6%) | 6 (18.8%) |
| $100,000 to $299,999 | 42 (54.5%) | 23 (71.9%) |
| $300,000 to $499,999 | 7 (9.1%) | 1 (3.1%) |
| $500,000 to $749,999 | 0 (0.0%) | 0 (0.0%) |
| $750,000 to $999,999 | 0 (0.0%) | 0 (0.0%) |
| $1,000,000 or more | 0 (0.0%) | 0 (0.0%) |
| Total | 77 (100.0%) | 32 (100.0%) |
Household Income by Mortgage Status in Windthorst
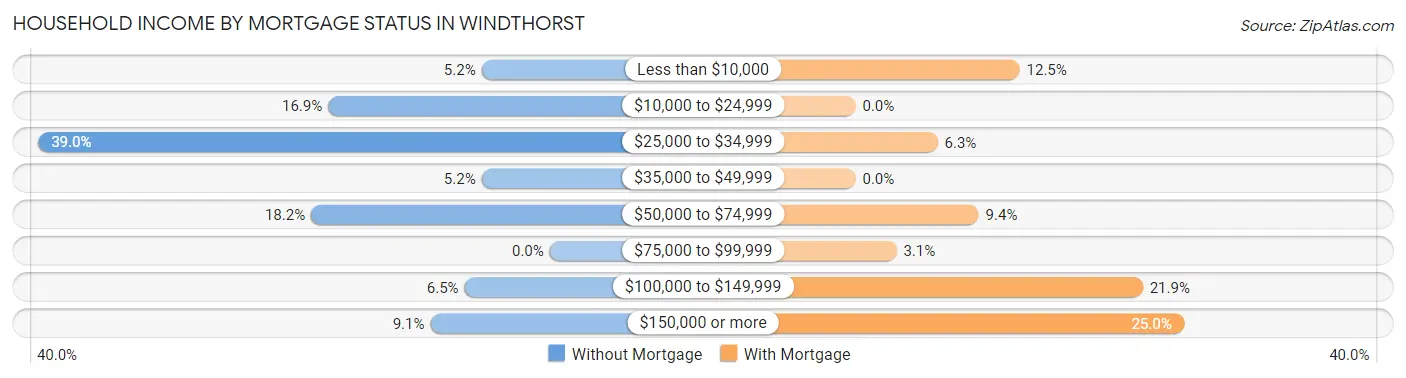
| Household Income | Without Mortgage | With Mortgage |
| Less than $10,000 | 4 (5.2%) | 4 (12.5%) |
| $10,000 to $24,999 | 13 (16.9%) | 0 (0.0%) |
| $25,000 to $34,999 | 30 (39.0%) | 2 (6.2%) |
| $35,000 to $49,999 | 4 (5.2%) | 0 (0.0%) |
| $50,000 to $74,999 | 14 (18.2%) | 3 (9.4%) |
| $75,000 to $99,999 | 0 (0.0%) | 1 (3.1%) |
| $100,000 to $149,999 | 5 (6.5%) | 7 (21.9%) |
| $150,000 or more | 7 (9.1%) | 8 (25.0%) |
| Total | 77 (100.0%) | 32 (100.0%) |
Property Value to Household Income Ratio in Windthorst
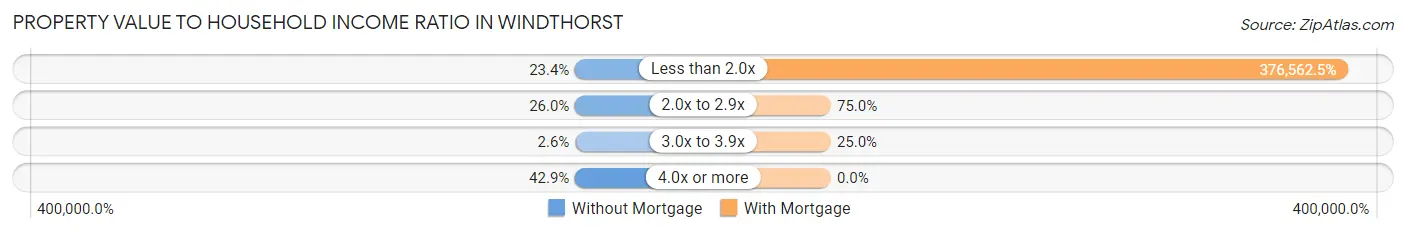
| Value-to-Income Ratio | Without Mortgage | With Mortgage |
| Less than 2.0x | 18 (23.4%) | 120,500 (376,562.5%) |
| 2.0x to 2.9x | 20 (26.0%) | 24 (75.0%) |
| 3.0x to 3.9x | 2 (2.6%) | 8 (25.0%) |
| 4.0x or more | 33 (42.9%) | 0 (0.0%) |
| Total | 77 (100.0%) | 32 (100.0%) |
Real Estate Taxes by Mortgage Status in Windthorst
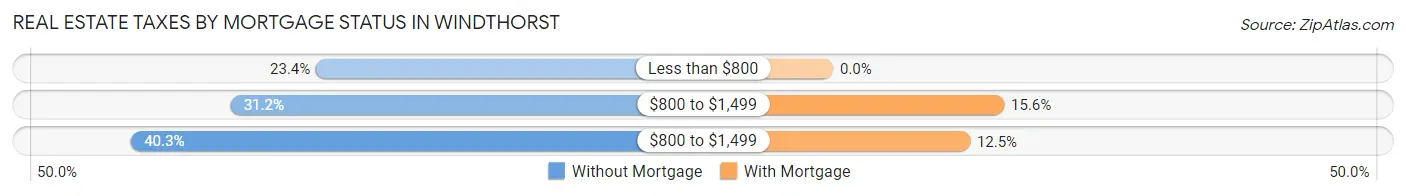
| Property Taxes | Without Mortgage | With Mortgage |
| Less than $800 | 18 (23.4%) | 0 (0.0%) |
| $800 to $1,499 | 24 (31.2%) | 5 (15.6%) |
| $800 to $1,499 | 31 (40.3%) | 4 (12.5%) |
| Total | 77 (100.0%) | 32 (100.0%) |
Health & Disability in Windthorst
Health Insurance Coverage by Age in Windthorst
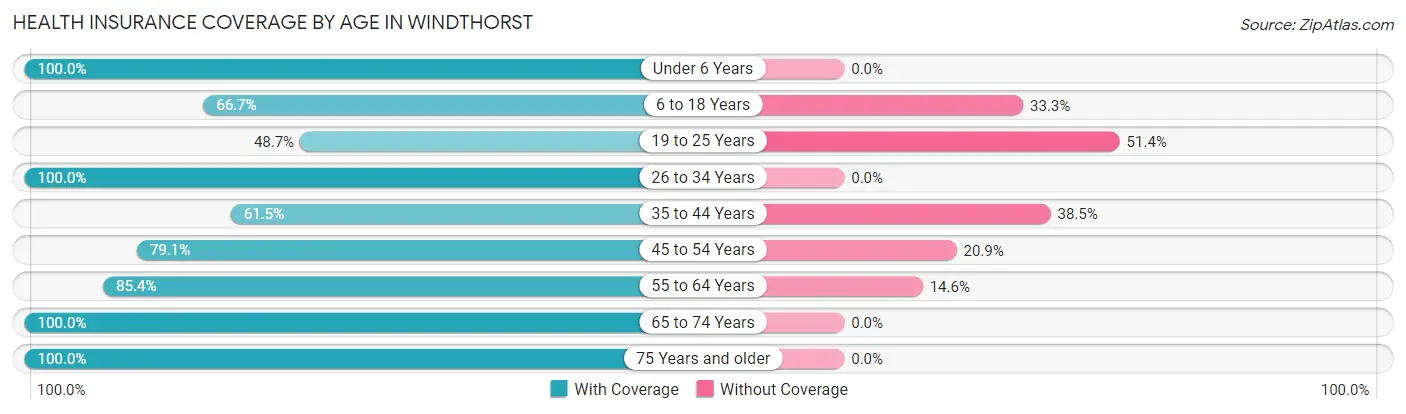
| Age Bracket | With Coverage | Without Coverage |
| Under 6 Years | 9 (100.0%) | 0 (0.0%) |
| 6 to 18 Years | 40 (66.7%) | 20 (33.3%) |
| 19 to 25 Years | 18 (48.6%) | 19 (51.3%) |
| 26 to 34 Years | 25 (100.0%) | 0 (0.0%) |
| 35 to 44 Years | 8 (61.5%) | 5 (38.5%) |
| 45 to 54 Years | 34 (79.1%) | 9 (20.9%) |
| 55 to 64 Years | 35 (85.4%) | 6 (14.6%) |
| 65 to 74 Years | 25 (100.0%) | 0 (0.0%) |
| 75 Years and older | 81 (100.0%) | 0 (0.0%) |
| Total | 275 (82.3%) | 59 (17.7%) |
Health Insurance Coverage by Citizenship Status in Windthorst
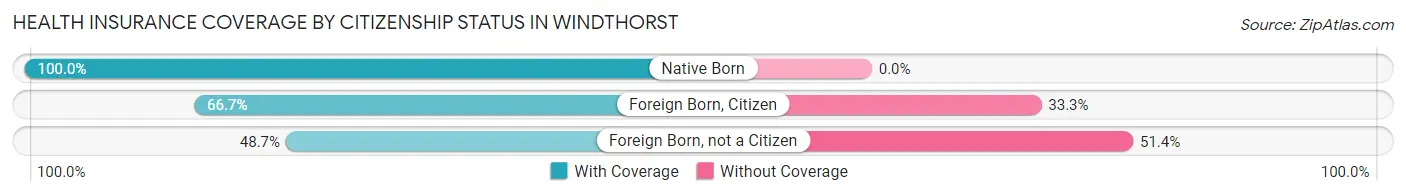
| Citizenship Status | With Coverage | Without Coverage |
| Native Born | 9 (100.0%) | 0 (0.0%) |
| Foreign Born, Citizen | 40 (66.7%) | 20 (33.3%) |
| Foreign Born, not a Citizen | 18 (48.6%) | 19 (51.3%) |
Health Insurance Coverage by Household Income in Windthorst
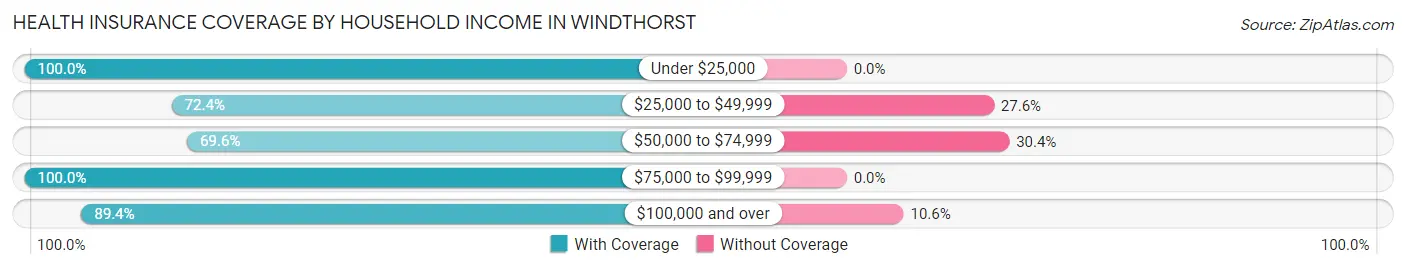
| Household Income | With Coverage | Without Coverage |
| Under $25,000 | 39 (100.0%) | 0 (0.0%) |
| $25,000 to $49,999 | 92 (72.4%) | 35 (27.6%) |
| $50,000 to $74,999 | 32 (69.6%) | 14 (30.4%) |
| $75,000 to $99,999 | 28 (100.0%) | 0 (0.0%) |
| $100,000 and over | 84 (89.4%) | 10 (10.6%) |
Public vs Private Health Insurance Coverage by Age in Windthorst
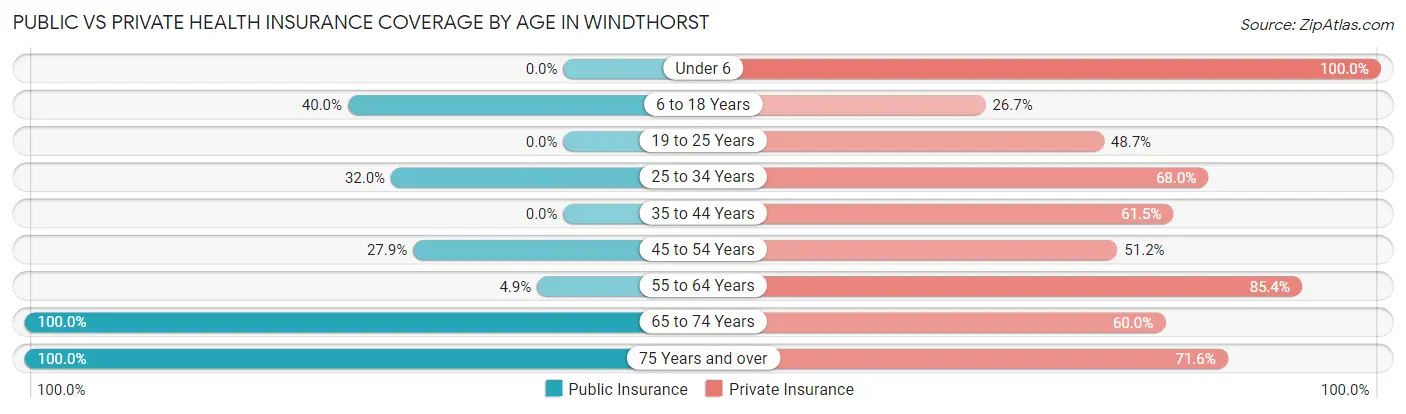
| Age Bracket | Public Insurance | Private Insurance |
| Under 6 | 0 (0.0%) | 9 (100.0%) |
| 6 to 18 Years | 24 (40.0%) | 16 (26.7%) |
| 19 to 25 Years | 0 (0.0%) | 18 (48.6%) |
| 25 to 34 Years | 8 (32.0%) | 17 (68.0%) |
| 35 to 44 Years | 0 (0.0%) | 8 (61.5%) |
| 45 to 54 Years | 12 (27.9%) | 22 (51.2%) |
| 55 to 64 Years | 2 (4.9%) | 35 (85.4%) |
| 65 to 74 Years | 25 (100.0%) | 15 (60.0%) |
| 75 Years and over | 81 (100.0%) | 58 (71.6%) |
| Total | 152 (45.5%) | 198 (59.3%) |
Disability Status by Sex by Age in Windthorst
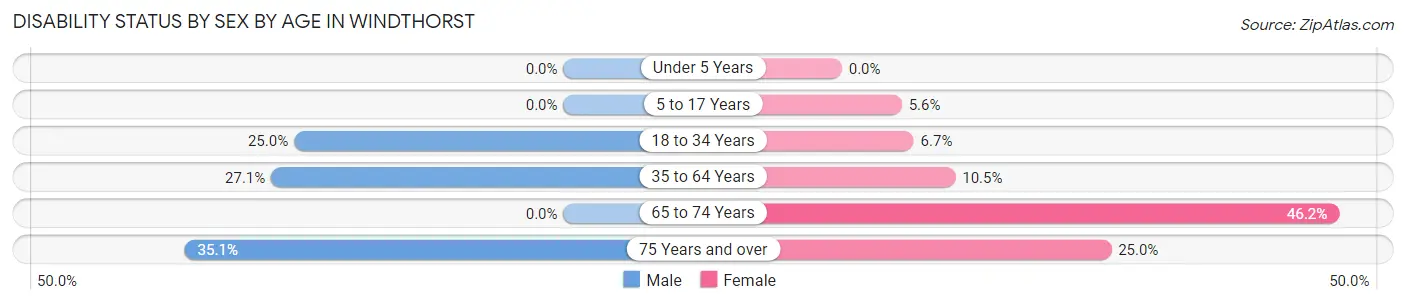
| Age Bracket | Male | Female |
| Under 5 Years | 0 (0.0%) | 0 (0.0%) |
| 5 to 17 Years | 0 (0.0%) | 2 (5.6%) |
| 18 to 34 Years | 8 (25.0%) | 3 (6.7%) |
| 35 to 64 Years | 16 (27.1%) | 4 (10.5%) |
| 65 to 74 Years | 0 (0.0%) | 6 (46.2%) |
| 75 Years and over | 13 (35.1%) | 11 (25.0%) |
Disability Class by Sex by Age in Windthorst
Disability Class: Hearing Difficulty
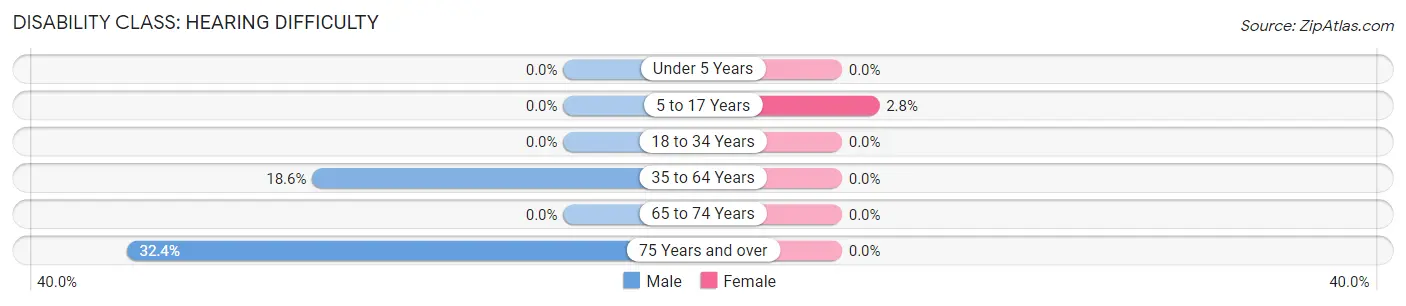
| Age Bracket | Male | Female |
| Under 5 Years | 0 (0.0%) | 0 (0.0%) |
| 5 to 17 Years | 0 (0.0%) | 1 (2.8%) |
| 18 to 34 Years | 0 (0.0%) | 0 (0.0%) |
| 35 to 64 Years | 11 (18.6%) | 0 (0.0%) |
| 65 to 74 Years | 0 (0.0%) | 0 (0.0%) |
| 75 Years and over | 12 (32.4%) | 0 (0.0%) |
Disability Class: Vision Difficulty
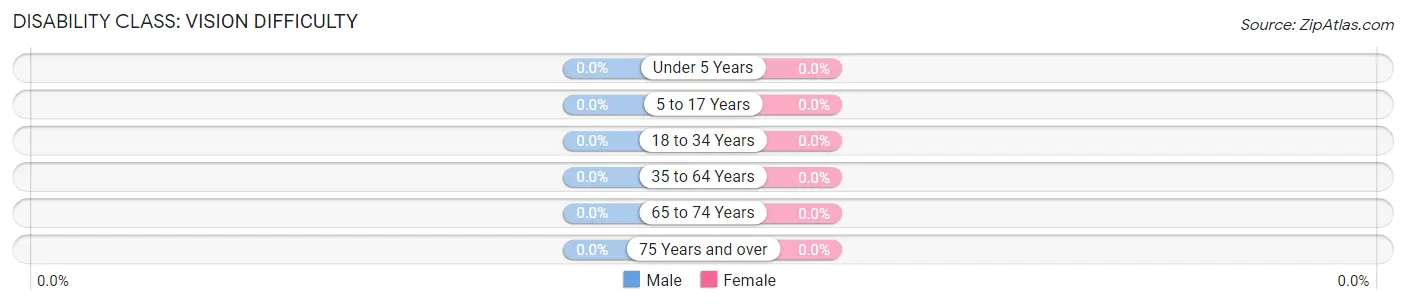
| Age Bracket | Male | Female |
| Under 5 Years | 0 (0.0%) | 0 (0.0%) |
| 5 to 17 Years | 0 (0.0%) | 0 (0.0%) |
| 18 to 34 Years | 0 (0.0%) | 0 (0.0%) |
| 35 to 64 Years | 0 (0.0%) | 0 (0.0%) |
| 65 to 74 Years | 0 (0.0%) | 0 (0.0%) |
| 75 Years and over | 0 (0.0%) | 0 (0.0%) |
Disability Class: Cognitive Difficulty
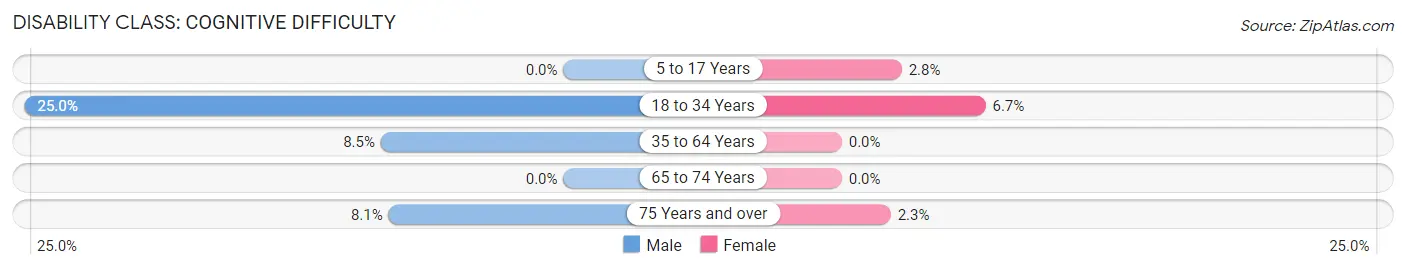
| Age Bracket | Male | Female |
| 5 to 17 Years | 0 (0.0%) | 1 (2.8%) |
| 18 to 34 Years | 8 (25.0%) | 3 (6.7%) |
| 35 to 64 Years | 5 (8.5%) | 0 (0.0%) |
| 65 to 74 Years | 0 (0.0%) | 0 (0.0%) |
| 75 Years and over | 3 (8.1%) | 1 (2.3%) |
Disability Class: Ambulatory Difficulty
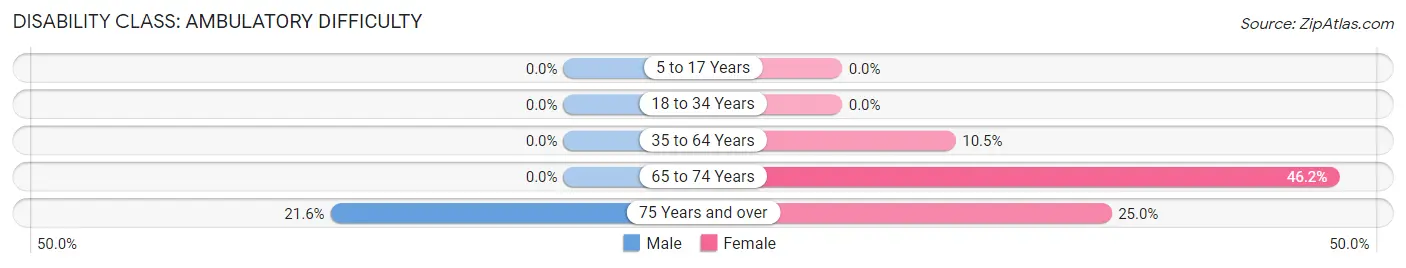
| Age Bracket | Male | Female |
| 5 to 17 Years | 0 (0.0%) | 0 (0.0%) |
| 18 to 34 Years | 0 (0.0%) | 0 (0.0%) |
| 35 to 64 Years | 0 (0.0%) | 4 (10.5%) |
| 65 to 74 Years | 0 (0.0%) | 6 (46.2%) |
| 75 Years and over | 8 (21.6%) | 11 (25.0%) |
Disability Class: Self-Care Difficulty
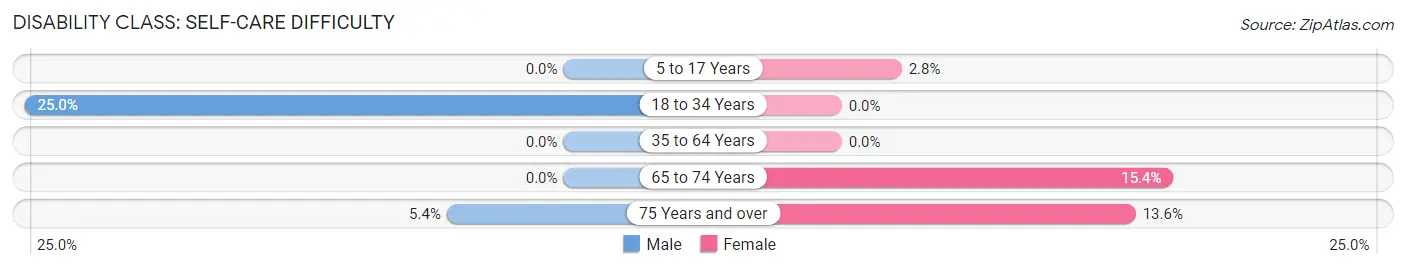
| Age Bracket | Male | Female |
| 5 to 17 Years | 0 (0.0%) | 1 (2.8%) |
| 18 to 34 Years | 8 (25.0%) | 0 (0.0%) |
| 35 to 64 Years | 0 (0.0%) | 0 (0.0%) |
| 65 to 74 Years | 0 (0.0%) | 2 (15.4%) |
| 75 Years and over | 2 (5.4%) | 6 (13.6%) |
Technology Access in Windthorst
Computing Device Access in Windthorst
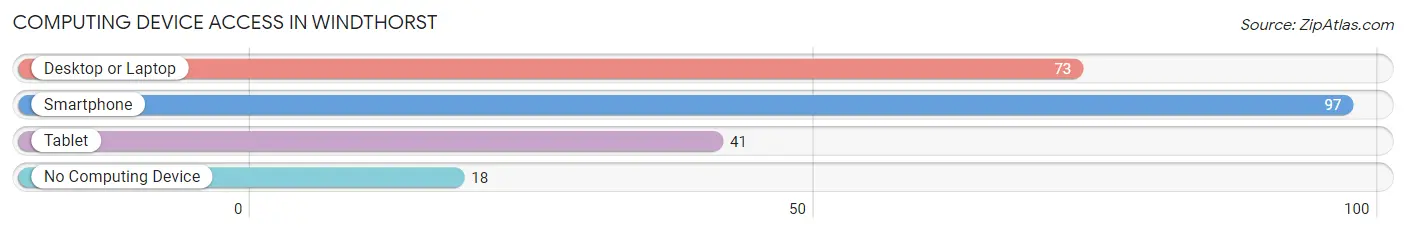
| Device Type | # Households | % Households |
| Desktop or Laptop | 73 | 57.5% |
| Smartphone | 97 | 76.4% |
| Tablet | 41 | 32.3% |
| No Computing Device | 18 | 14.2% |
| Total | 127 | 100.0% |
Internet Access in Windthorst
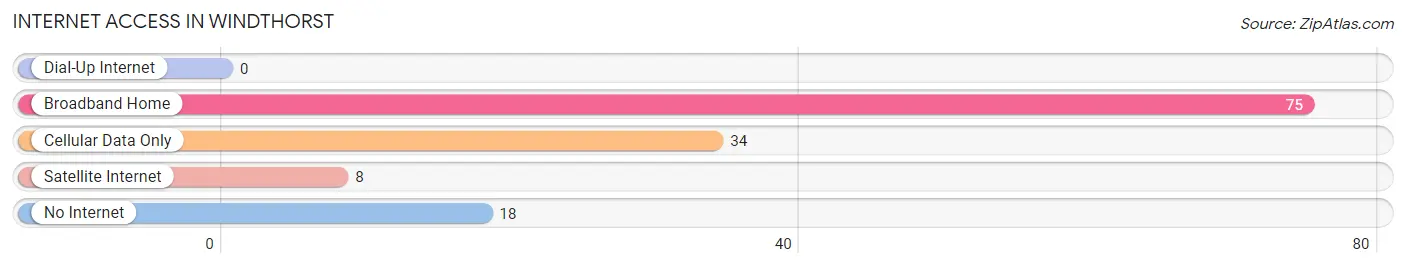
| Internet Type | # Households | % Households |
| Dial-Up Internet | 0 | 0.0% |
| Broadband Home | 75 | 59.1% |
| Cellular Data Only | 34 | 26.8% |
| Satellite Internet | 8 | 6.3% |
| No Internet | 18 | 14.2% |
| Total | 127 | 100.0% |
Windthorst Summary
Windthorst, Texas is a small town located in Archer County, Texas. It is situated about 15 miles northwest of Wichita Falls and is part of the Wichita Falls Metropolitan Statistical Area. The town was founded in 1891 by German immigrants and is named after a German Catholic priest, Father Joseph Windthorst. The town has a population of approximately 500 people and is known for its strong German heritage.
Geography
Windthorst is located in the rolling hills of North Central Texas. The town is situated on the banks of the Wichita River and is surrounded by farmland. The town is located at an elevation of 890 feet and has a total area of 0.7 square miles. The climate in Windthorst is characterized by hot, humid summers and mild winters.
Economy
The economy of Windthorst is largely based on agriculture. The town is home to several farms and ranches that produce a variety of crops, including cotton, corn, wheat, and hay. The town also has a few small businesses, including a grocery store, a hardware store, and a few restaurants.
Demographics
As of the 2010 census, Windthorst had a population of 498 people. The racial makeup of the town was 97.2% White, 0.2% African American, 0.2% Native American, 0.2% Asian, 0.2% from other races, and 1.8% from two or more races. Hispanic or Latino of any race were 1.2% of the population.
The median income for a household in Windthorst was $41,250, and the median income for a family was $45,000. The per capita income for the town was $17,845. About 11.2% of families and 13.2% of the population were below the poverty line, including 16.7% of those under age 18 and none of those age 65 or over.
History
Windthorst was founded in 1891 by German immigrants who were seeking religious freedom. The town was named after Father Joseph Windthorst, a German Catholic priest who was a leader in the Catholic Church in Germany. The town was incorporated in 1895 and has remained a small, rural community ever since.
Windthorst has a strong German heritage and is home to several German-style buildings, including the Windthorst Museum, which houses artifacts from the town's early days. The town is also home to the Windthorst Germanfest, which is held every year in October and celebrates the town's German heritage.
Windthorst is a small, rural town with a strong sense of community. The town is known for its friendly people and its strong German heritage. The town is a great place to live and work, and it is a great place to raise a family.
Common Questions
What is Per Capita Income in Windthorst?
Per Capita income in Windthorst is $32,433.
What is the Median Family Income in Windthorst?
Median Family Income in Windthorst is $34,722.
What is the Median Household income in Windthorst?
Median Household Income in Windthorst is $34,583.
What is Income or Wage Gap in Windthorst?
Income or Wage Gap in Windthorst is 36.4%.
Women in Windthorst earn 63.6 cents for every dollar earned by a man.
What is Inequality or Gini Index in Windthorst?
Inequality or Gini Index in Windthorst is 0.52.
What is the Total Population of Windthorst?
Total Population of Windthorst is 334.
What is the Total Male Population of Windthorst?
Total Male Population of Windthorst is 158.
What is the Total Female Population of Windthorst?
Total Female Population of Windthorst is 176.
What is the Ratio of Males per 100 Females in Windthorst?
There are 89.77 Males per 100 Females in Windthorst.
What is the Ratio of Females per 100 Males in Windthorst?
There are 111.39 Females per 100 Males in Windthorst.
What is the Median Population Age in Windthorst?
Median Population Age in Windthorst is 50.9 Years.
What is the Average Family Size in Windthorst
Average Family Size in Windthorst is 2.9 People.
What is the Average Household Size in Windthorst
Average Household Size in Windthorst is 2.6 People.
How Large is the Labor Force in Windthorst?
There are 138 People in the Labor Forcein in Windthorst.
What is the Percentage of People in the Labor Force in Windthorst?
47.6% of People are in the Labor Force in Windthorst.