Jonestown, TX Map & Demographics
Jonestown Map
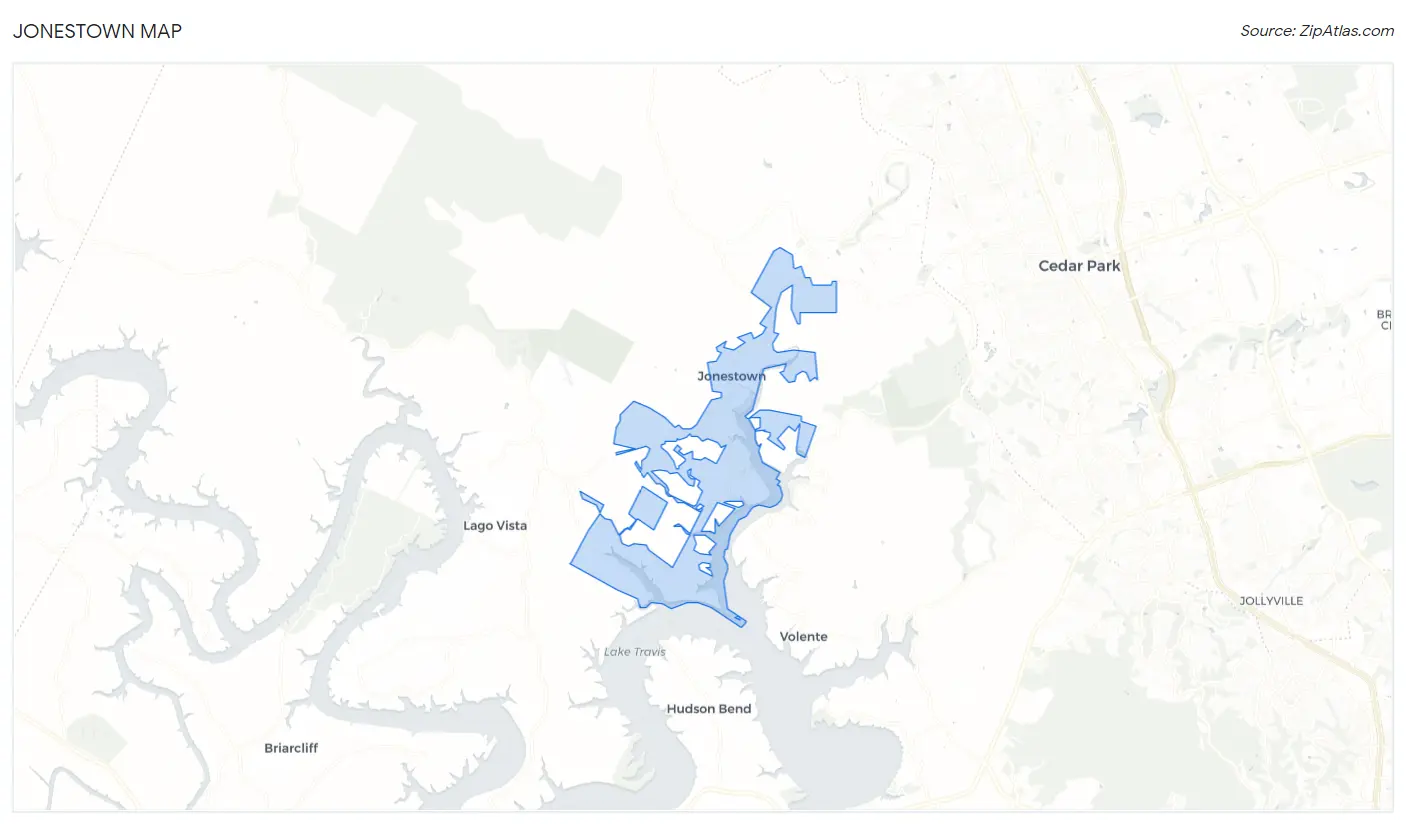
Jonestown Overview
$73,287
PER CAPITA INCOME
$144,167
AVG FAMILY INCOME
$112,841
AVG HOUSEHOLD INCOME
43.7%
WAGE / INCOME GAP [ % ]
56.3¢/ $1
WAGE / INCOME GAP [ $ ]
$18,400
FAMILY INCOME DEFICIT
0.49
INEQUALITY / GINI INDEX
2,395
TOTAL POPULATION
1,271
MALE POPULATION
1,124
FEMALE POPULATION
113.08
MALES / 100 FEMALES
88.43
FEMALES / 100 MALES
52.0
MEDIAN AGE
2.6
AVG FAMILY SIZE
2.3
AVG HOUSEHOLD SIZE
1,221
LABOR FORCE [ PEOPLE ]
59.4%
PERCENT IN LABOR FORCE
4.0%
UNEMPLOYMENT RATE
Income in Jonestown
Income Overview in Jonestown
Per Capita Income in Jonestown is $73,287, while median incomes of families and households are $144,167 and $112,841 respectively.
| Characteristic | Number | Measure |
| Per Capita Income | 2,395 | $73,287 |
| Median Family Income | 790 | $144,167 |
| Mean Family Income | 790 | $196,487 |
| Median Household Income | 1,035 | $112,841 |
| Mean Household Income | 1,035 | $177,683 |
| Income Deficit | 790 | $18,400 |
| Wage / Income Gap (%) | 2,395 | 43.73% |
| Wage / Income Gap ($) | 2,395 | 56.27¢ per $1 |
| Gini / Inequality Index | 2,395 | 0.49 |
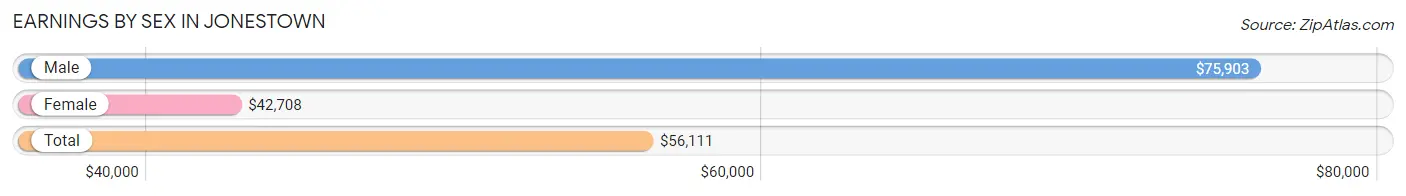
Earnings by Sex in Jonestown
Average Earnings in Jonestown are $56,111, $75,903 for men and $42,708 for women, a difference of 43.7%.
| Sex | Number | Average Earnings |
| Male | 743 (56.2%) | $75,903 |
| Female | 579 (43.8%) | $42,708 |
| Total | 1,322 (100.0%) | $56,111 |
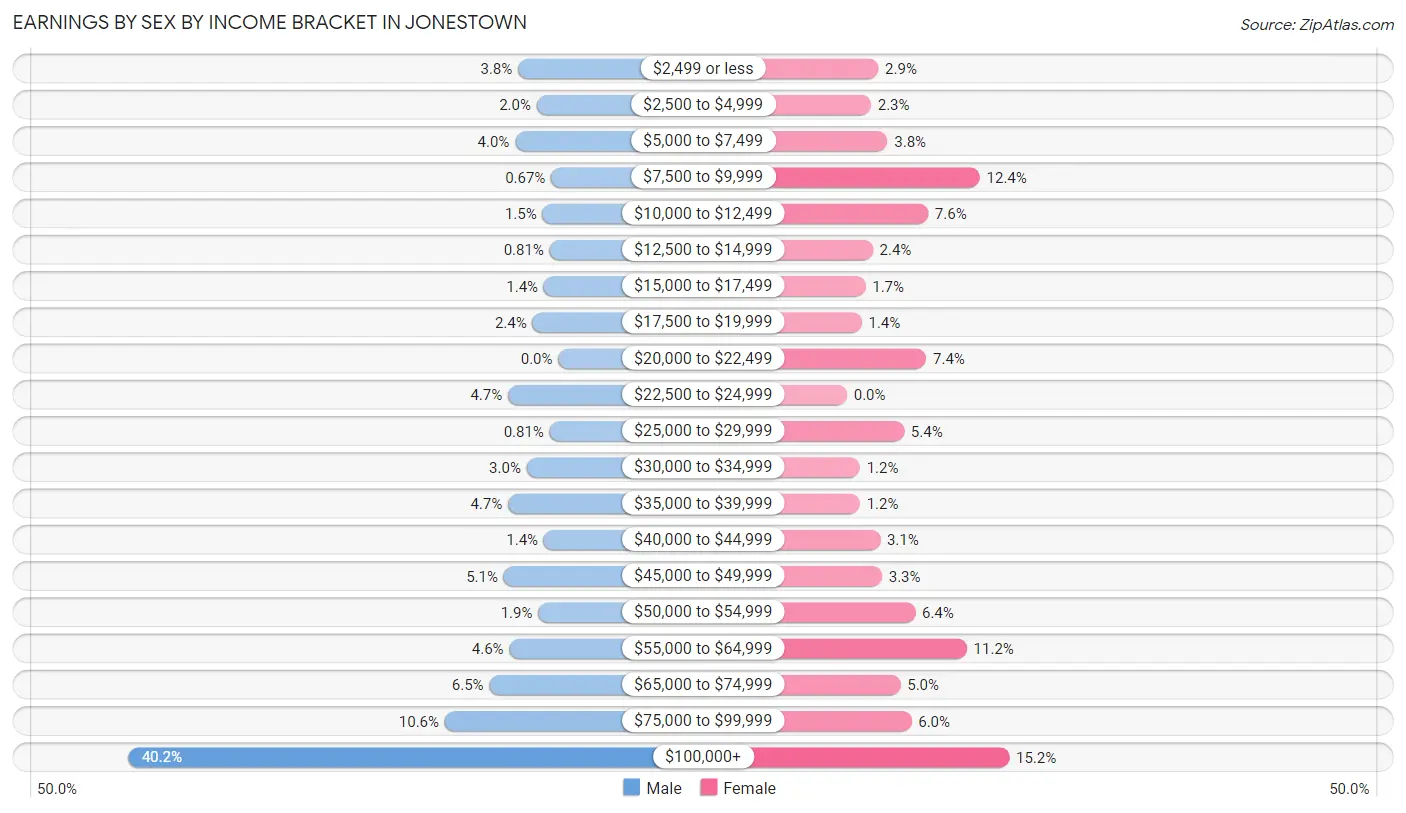
Earnings by Sex by Income Bracket in Jonestown
The most common earnings brackets in Jonestown are $100,000+ for men (299 | 40.2%) and $100,000+ for women (88 | 15.2%).
| Income | Male | Female |
| $2,499 or less | 28 (3.8%) | 17 (2.9%) |
| $2,500 to $4,999 | 15 (2.0%) | 13 (2.2%) |
| $5,000 to $7,499 | 30 (4.0%) | 22 (3.8%) |
| $7,500 to $9,999 | 5 (0.7%) | 72 (12.4%) |
| $10,000 to $12,499 | 11 (1.5%) | 44 (7.6%) |
| $12,500 to $14,999 | 6 (0.8%) | 14 (2.4%) |
| $15,000 to $17,499 | 10 (1.3%) | 10 (1.7%) |
| $17,500 to $19,999 | 18 (2.4%) | 8 (1.4%) |
| $20,000 to $22,499 | 0 (0.0%) | 43 (7.4%) |
| $22,500 to $24,999 | 35 (4.7%) | 0 (0.0%) |
| $25,000 to $29,999 | 6 (0.8%) | 31 (5.3%) |
| $30,000 to $34,999 | 22 (3.0%) | 7 (1.2%) |
| $35,000 to $39,999 | 35 (4.7%) | 7 (1.2%) |
| $40,000 to $44,999 | 10 (1.3%) | 18 (3.1%) |
| $45,000 to $49,999 | 38 (5.1%) | 19 (3.3%) |
| $50,000 to $54,999 | 14 (1.9%) | 37 (6.4%) |
| $55,000 to $64,999 | 34 (4.6%) | 65 (11.2%) |
| $65,000 to $74,999 | 48 (6.5%) | 29 (5.0%) |
| $75,000 to $99,999 | 79 (10.6%) | 35 (6.0%) |
| $100,000+ | 299 (40.2%) | 88 (15.2%) |
| Total | 743 (100.0%) | 579 (100.0%) |
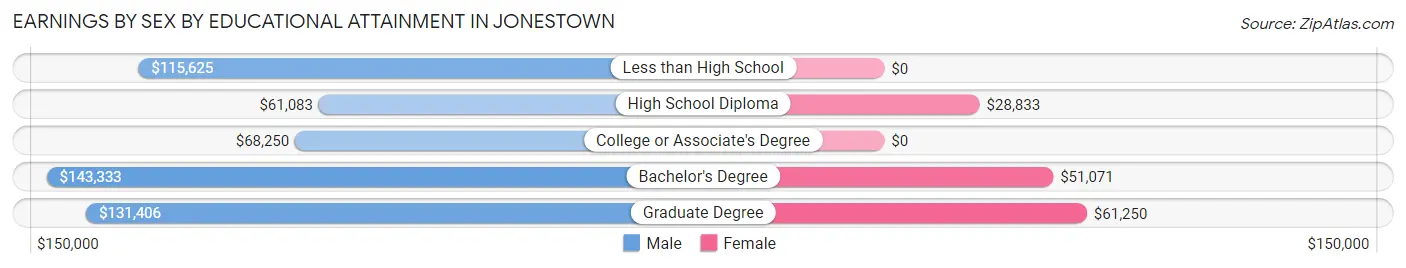
Earnings by Sex by Educational Attainment in Jonestown
Average earnings in Jonestown are $86,250 for men and $44,167 for women, a difference of 48.8%. Men with an educational attainment of bachelor's degree enjoy the highest average annual earnings of $143,333, while those with high school diploma education earn the least with $61,083. Women with an educational attainment of graduate degree earn the most with the average annual earnings of $61,250, while those with high school diploma education have the smallest earnings of $28,833.
| Educational Attainment | Male Income | Female Income |
| Less than High School | $115,625 | $0 |
| High School Diploma | $61,083 | $28,833 |
| College or Associate's Degree | $68,250 | $0 |
| Bachelor's Degree | $143,333 | $51,071 |
| Graduate Degree | $131,406 | $61,250 |
| Total | $86,250 | $44,167 |
Family Income in Jonestown
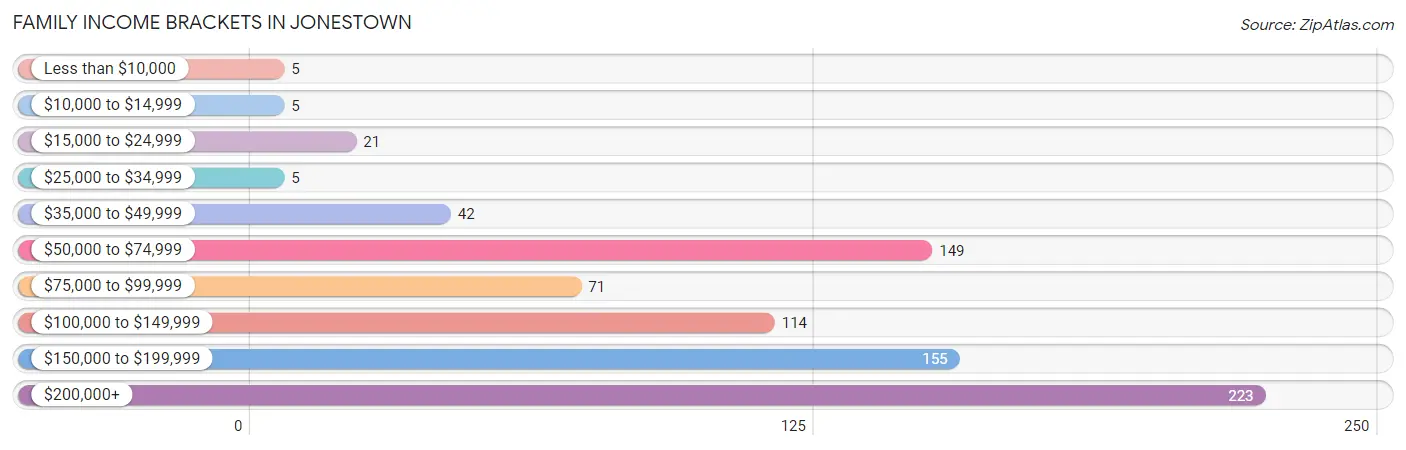
Family Income Brackets in Jonestown
According to the Jonestown family income data, there are 223 families falling into the $200,000+ income range, which is the most common income bracket and makes up 28.2% of all families. Conversely, the less than $10,000 income bracket is the least frequent group with only 5 families (0.6%) belonging to this category.
| Income Bracket | # Families | % Families |
| Less than $10,000 | 5 | 0.6% |
| $10,000 to $14,999 | 5 | 0.6% |
| $15,000 to $24,999 | 21 | 2.7% |
| $25,000 to $34,999 | 5 | 0.6% |
| $35,000 to $49,999 | 42 | 5.3% |
| $50,000 to $74,999 | 149 | 18.9% |
| $75,000 to $99,999 | 71 | 9.0% |
| $100,000 to $149,999 | 114 | 14.4% |
| $150,000 to $199,999 | 155 | 19.6% |
| $200,000+ | 223 | 28.2% |
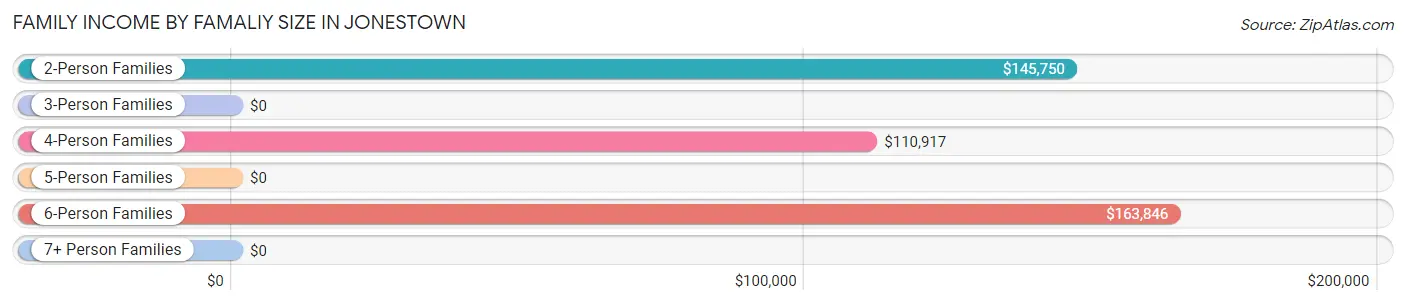
Family Income by Famaliy Size in Jonestown
6-person families (24 | 3.0%) account for the highest median family income in Jonestown with $163,846 per family, while 2-person families (501 | 63.4%) have the highest median income of $72,875 per family member.
| Income Bracket | # Families | Median Income |
| 2-Person Families | 501 (63.4%) | $145,750 |
| 3-Person Families | 134 (17.0%) | $0 |
| 4-Person Families | 75 (9.5%) | $110,917 |
| 5-Person Families | 56 (7.1%) | $0 |
| 6-Person Families | 24 (3.0%) | $163,846 |
| 7+ Person Families | 0 (0.0%) | $0 |
| Total | 790 (100.0%) | $144,167 |
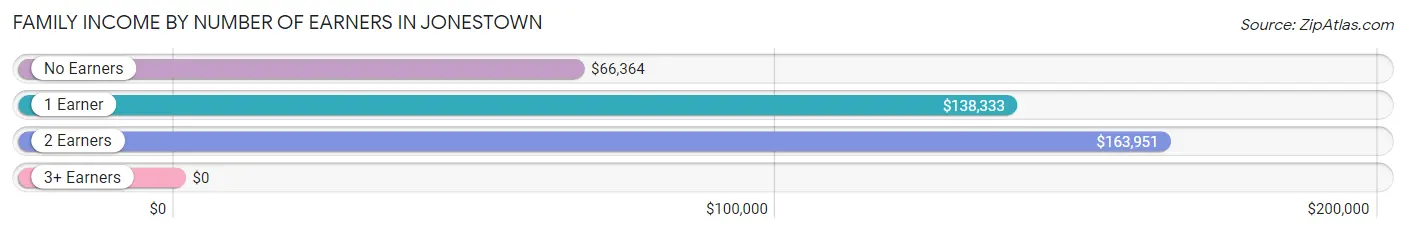
Family Income by Number of Earners in Jonestown
| Number of Earners | # Families | Median Income |
| No Earners | 158 (20.0%) | $66,364 |
| 1 Earner | 224 (28.3%) | $138,333 |
| 2 Earners | 355 (44.9%) | $163,951 |
| 3+ Earners | 53 (6.7%) | $0 |
| Total | 790 (100.0%) | $144,167 |
Household Income in Jonestown
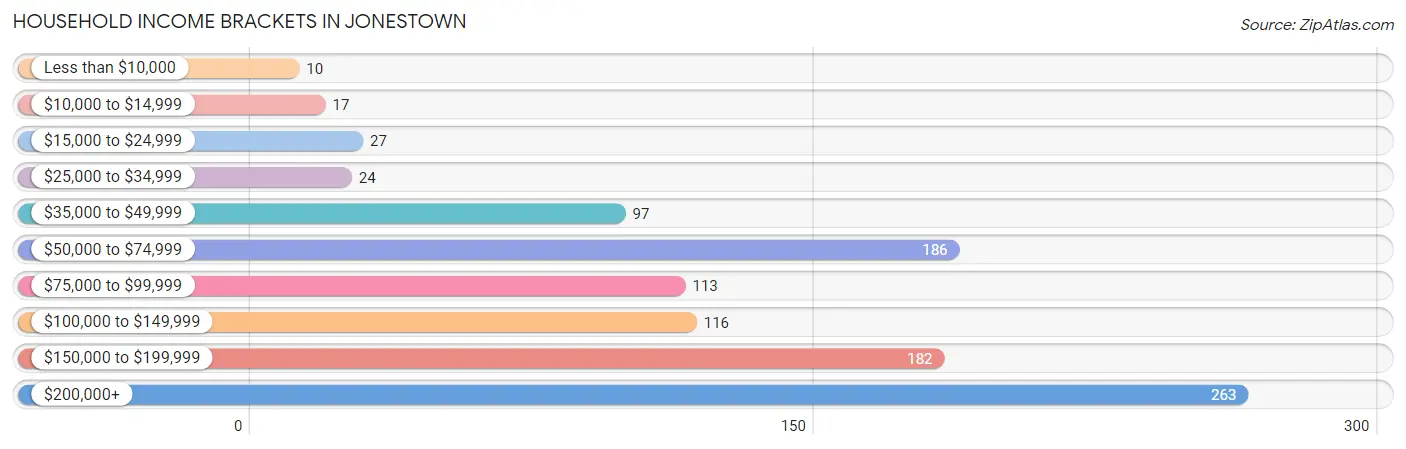
Household Income Brackets in Jonestown
With 263 households falling in the category, the $200,000+ income range is the most frequent in Jonestown, accounting for 25.4% of all households. In contrast, only 10 households (1.0%) fall into the less than $10,000 income bracket, making it the least populous group.
| Income Bracket | # Households | % Households |
| Less than $10,000 | 10 | 1.0% |
| $10,000 to $14,999 | 17 | 1.6% |
| $15,000 to $24,999 | 27 | 2.6% |
| $25,000 to $34,999 | 24 | 2.3% |
| $35,000 to $49,999 | 97 | 9.4% |
| $50,000 to $74,999 | 186 | 18.0% |
| $75,000 to $99,999 | 113 | 10.9% |
| $100,000 to $149,999 | 116 | 11.2% |
| $150,000 to $199,999 | 182 | 17.6% |
| $200,000+ | 263 | 25.4% |
Household Income by Householder Age in Jonestown
The median household income in Jonestown is $112,841, with the highest median household income of $164,018 found in the 45 to 64 years age bracket for the primary householder. A total of 518 households (50.0%) fall into this category. Meanwhile, the 15 to 24 years age bracket for the primary householder has the lowest median household income of $0, with 19 households (1.8%) in this group.
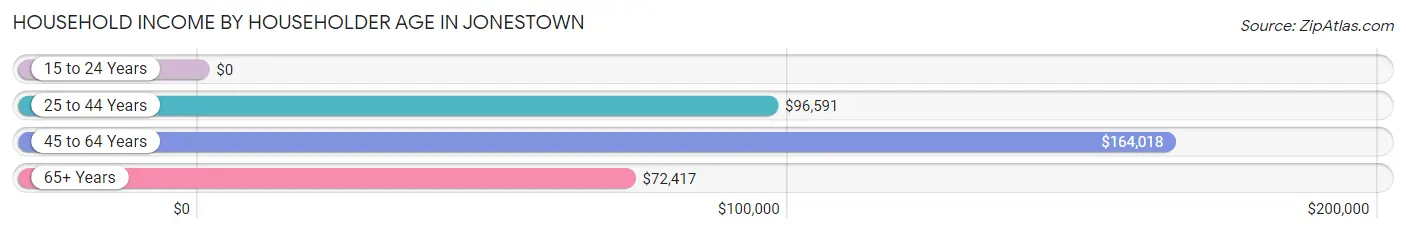
| Income Bracket | # Households | Median Income |
| 15 to 24 Years | 19 (1.8%) | $0 |
| 25 to 44 Years | 200 (19.3%) | $96,591 |
| 45 to 64 Years | 518 (50.0%) | $164,018 |
| 65+ Years | 298 (28.8%) | $72,417 |
| Total | 1,035 (100.0%) | $112,841 |
Poverty in Jonestown
Income Below Poverty by Sex and Age in Jonestown
With 7.2% poverty level for males and 7.0% for females among the residents of Jonestown, 6 to 11 year old males and 15 year old females are the most vulnerable to poverty, with 39 males (38.6%) and 15 females (51.7%) in their respective age groups living below the poverty level.
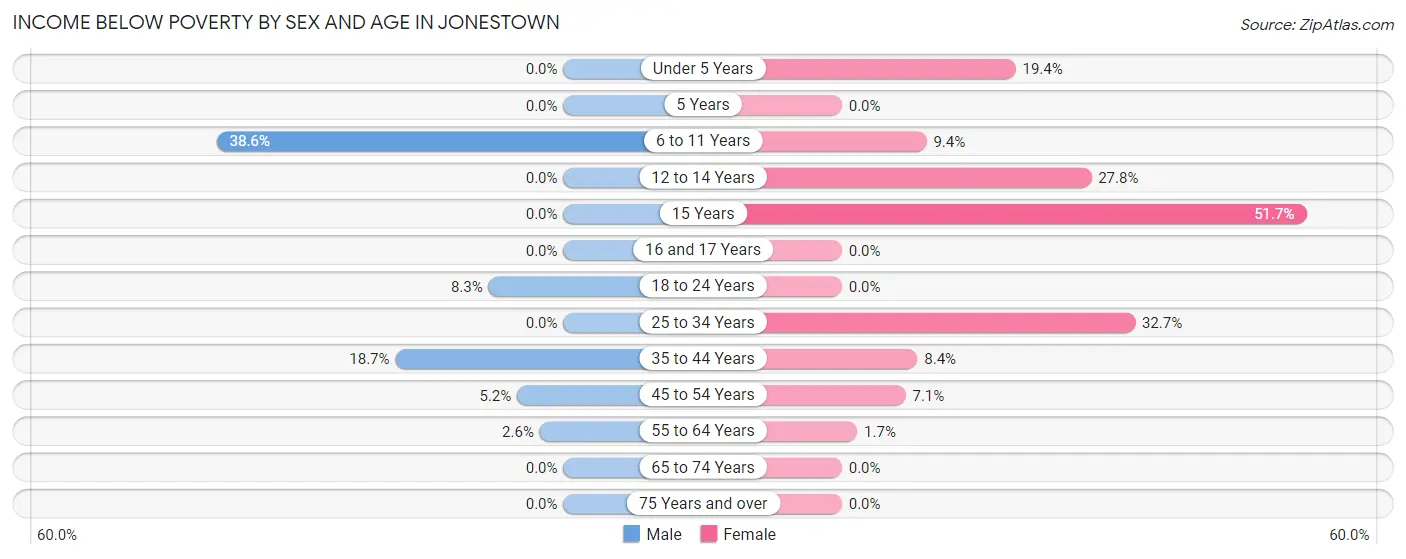
| Age Bracket | Male | Female |
| Under 5 Years | 0 (0.0%) | 6 (19.4%) |
| 5 Years | 0 (0.0%) | 0 (0.0%) |
| 6 to 11 Years | 39 (38.6%) | 5 (9.4%) |
| 12 to 14 Years | 0 (0.0%) | 10 (27.8%) |
| 15 Years | 0 (0.0%) | 15 (51.7%) |
| 16 and 17 Years | 0 (0.0%) | 0 (0.0%) |
| 18 to 24 Years | 6 (8.3%) | 0 (0.0%) |
| 25 to 34 Years | 0 (0.0%) | 16 (32.7%) |
| 35 to 44 Years | 29 (18.7%) | 9 (8.4%) |
| 45 to 54 Years | 12 (5.1%) | 13 (7.1%) |
| 55 to 64 Years | 5 (2.6%) | 5 (1.7%) |
| 65 to 74 Years | 0 (0.0%) | 0 (0.0%) |
| 75 Years and over | 0 (0.0%) | 0 (0.0%) |
| Total | 91 (7.2%) | 79 (7.0%) |
Income Above Poverty by Sex and Age in Jonestown
According to the poverty statistics in Jonestown, males aged under 5 years and females aged 16 and 17 years are the age groups that are most secure financially, with 100.0% of males and 100.0% of females in these age groups living above the poverty line.
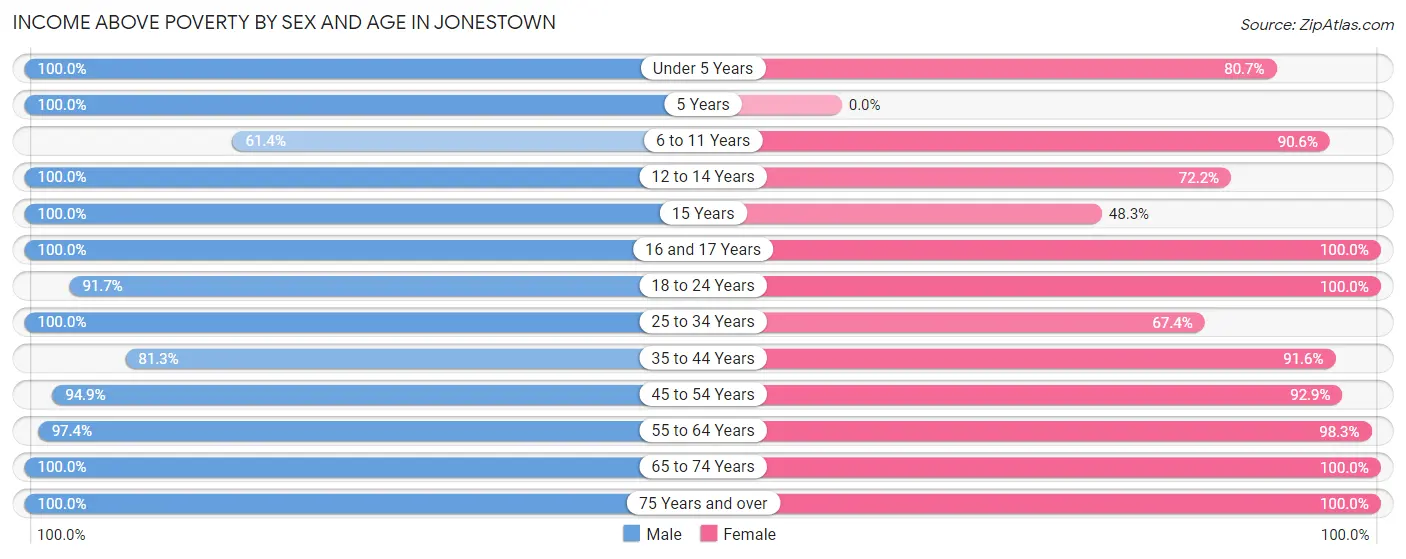
| Age Bracket | Male | Female |
| Under 5 Years | 25 (100.0%) | 25 (80.6%) |
| 5 Years | 6 (100.0%) | 0 (0.0%) |
| 6 to 11 Years | 62 (61.4%) | 48 (90.6%) |
| 12 to 14 Years | 53 (100.0%) | 26 (72.2%) |
| 15 Years | 6 (100.0%) | 14 (48.3%) |
| 16 and 17 Years | 22 (100.0%) | 29 (100.0%) |
| 18 to 24 Years | 66 (91.7%) | 66 (100.0%) |
| 25 to 34 Years | 80 (100.0%) | 33 (67.3%) |
| 35 to 44 Years | 126 (81.3%) | 98 (91.6%) |
| 45 to 54 Years | 221 (94.9%) | 170 (92.9%) |
| 55 to 64 Years | 185 (97.4%) | 288 (98.3%) |
| 65 to 74 Years | 209 (100.0%) | 142 (100.0%) |
| 75 Years and over | 119 (100.0%) | 106 (100.0%) |
| Total | 1,180 (92.8%) | 1,045 (93.0%) |
Income Below Poverty Among Married-Couple Families in Jonestown
The poverty statistics for married-couple families in Jonestown show that 3.6% or 26 of the total 716 families live below the poverty line. Families with 3 or 4 children have the highest poverty rate of 52.0%, comprising of 26 families. On the other hand, families with no children have the lowest poverty rate of 0.0%, which includes 0 families.
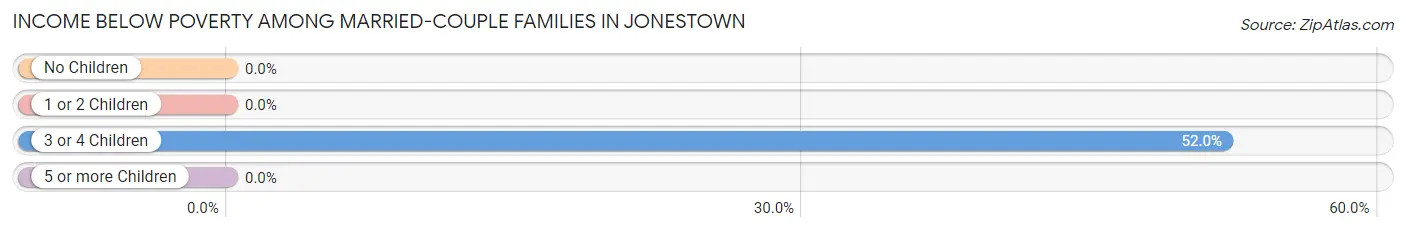
| Children | Above Poverty | Below Poverty |
| No Children | 521 (100.0%) | 0 (0.0%) |
| 1 or 2 Children | 145 (100.0%) | 0 (0.0%) |
| 3 or 4 Children | 24 (48.0%) | 26 (52.0%) |
| 5 or more Children | 0 (0.0%) | 0 (0.0%) |
| Total | 690 (96.4%) | 26 (3.6%) |
Income Below Poverty Among Single-Parent Households in Jonestown
| Children | Single Father | Single Mother |
| No Children | 0 (0.0%) | 0 (0.0%) |
| 1 or 2 Children | 0 (0.0%) | 0 (0.0%) |
| 3 or 4 Children | 0 (0.0%) | 0 (0.0%) |
| 5 or more Children | 0 (0.0%) | 0 (0.0%) |
| Total | 0 (0.0%) | 0 (0.0%) |
Income Below Poverty Among Married-Couple vs Single-Parent Households in Jonestown
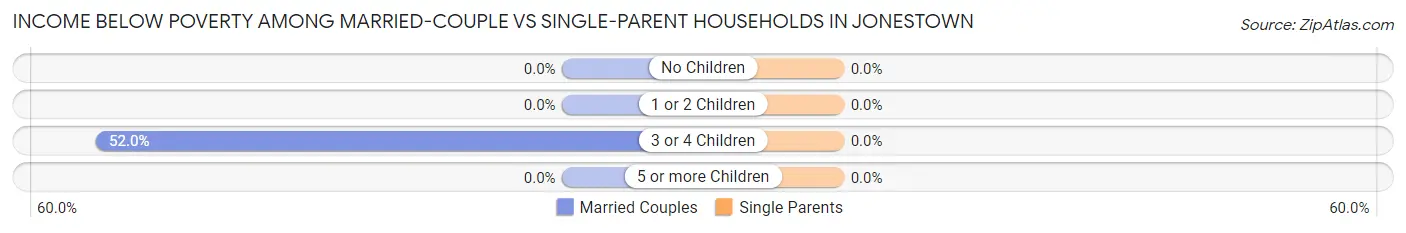
| Children | Married-Couple Families | Single-Parent Households |
| No Children | 0 (0.0%) | 0 (0.0%) |
| 1 or 2 Children | 0 (0.0%) | 0 (0.0%) |
| 3 or 4 Children | 26 (52.0%) | 0 (0.0%) |
| 5 or more Children | 0 (0.0%) | 0 (0.0%) |
| Total | 26 (3.6%) | 0 (0.0%) |
Race in Jonestown
The most populous races in Jonestown are White / Caucasian (2,256 | 94.2%), Hispanic or Latino (341 | 14.2%), and Two or more Races (81 | 3.4%).
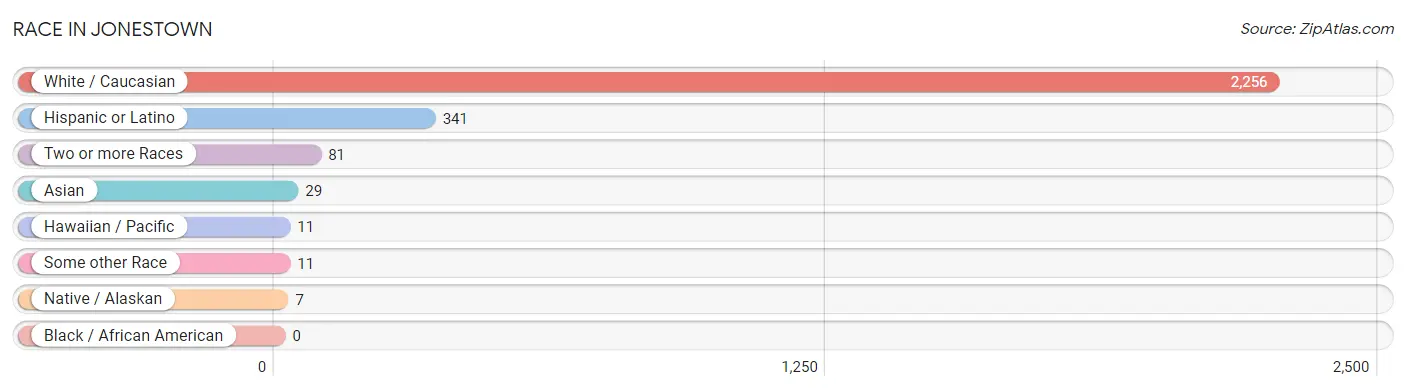
| Race | # Population | % Population |
| Asian | 29 | 1.2% |
| Black / African American | 0 | 0.0% |
| Hawaiian / Pacific | 11 | 0.5% |
| Hispanic or Latino | 341 | 14.2% |
| Native / Alaskan | 7 | 0.3% |
| White / Caucasian | 2,256 | 94.2% |
| Two or more Races | 81 | 3.4% |
| Some other Race | 11 | 0.5% |
| Total | 2,395 | 100.0% |
Ancestry in Jonestown
The most populous ancestries reported in Jonestown are English (505 | 21.1%), German (378 | 15.8%), Mexican (291 | 12.1%), Irish (252 | 10.5%), and European (220 | 9.2%), together accounting for 68.7% of all Jonestown residents.
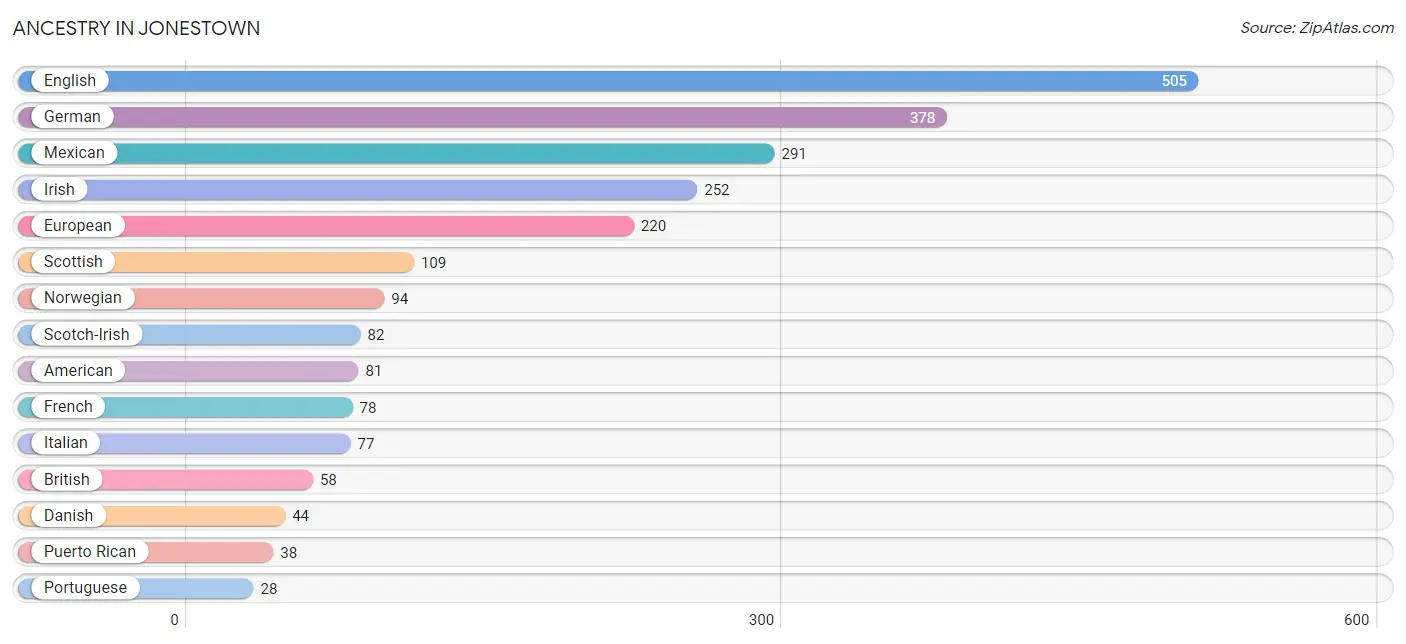
| Ancestry | # Population | % Population |
| American | 81 | 3.4% |
| Arab | 5 | 0.2% |
| Austrian | 4 | 0.2% |
| British | 58 | 2.4% |
| Canadian | 5 | 0.2% |
| Celtic | 5 | 0.2% |
| Choctaw | 3 | 0.1% |
| Danish | 44 | 1.8% |
| Dutch | 26 | 1.1% |
| Dutch West Indian | 5 | 0.2% |
| Eastern European | 12 | 0.5% |
| English | 505 | 21.1% |
| European | 220 | 9.2% |
| French | 78 | 3.3% |
| German | 378 | 15.8% |
| Indian (Asian) | 25 | 1.0% |
| Iranian | 13 | 0.5% |
| Irish | 252 | 10.5% |
| Italian | 77 | 3.2% |
| Korean | 11 | 0.5% |
| Latvian | 10 | 0.4% |
| Lebanese | 5 | 0.2% |
| Lithuanian | 8 | 0.3% |
| Mexican | 291 | 12.1% |
| Northern European | 10 | 0.4% |
| Norwegian | 94 | 3.9% |
| Polish | 12 | 0.5% |
| Portuguese | 28 | 1.2% |
| Puerto Rican | 38 | 1.6% |
| Russian | 23 | 1.0% |
| Samoan | 6 | 0.3% |
| Scandinavian | 5 | 0.2% |
| Scotch-Irish | 82 | 3.4% |
| Scottish | 109 | 4.5% |
| Spaniard | 12 | 0.5% |
| Sri Lankan | 7 | 0.3% |
| Swedish | 16 | 0.7% |
| Swiss | 5 | 0.2% |
| Ukrainian | 7 | 0.3% |
| Yaqui | 4 | 0.2% | View All 40 Rows |
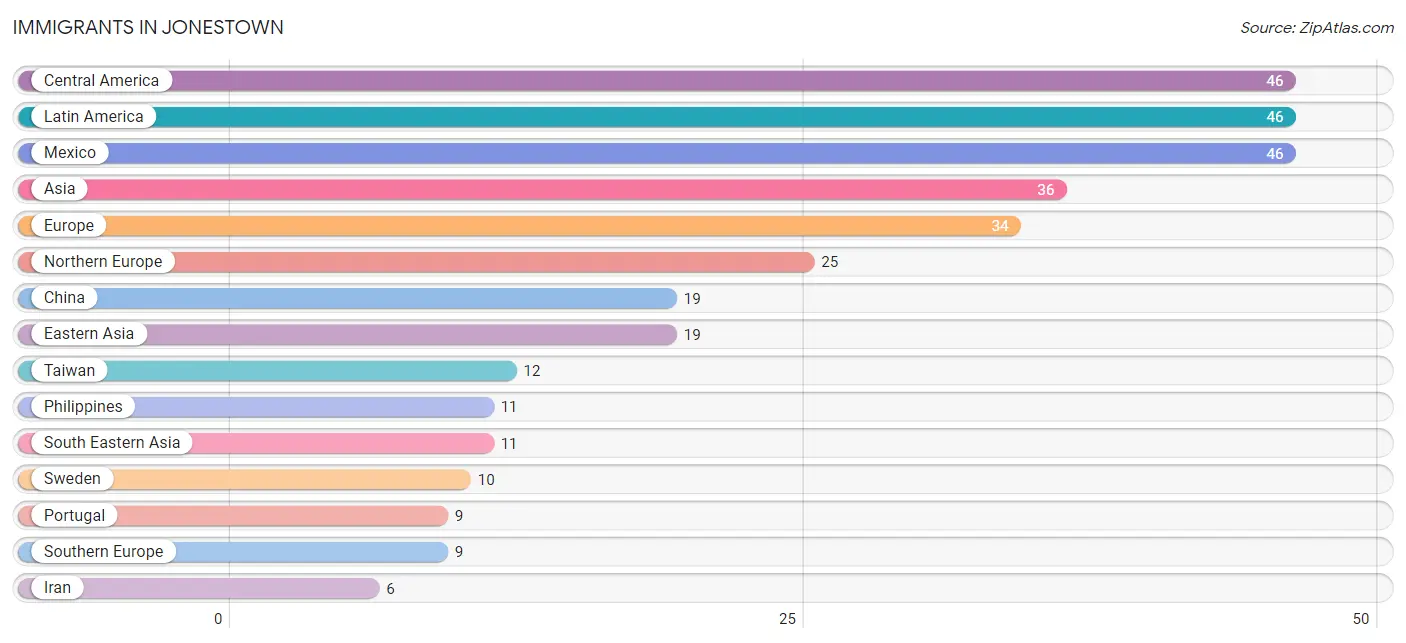
Immigrants in Jonestown
The most numerous immigrant groups reported in Jonestown came from Central America (46 | 1.9%), Latin America (46 | 1.9%), Mexico (46 | 1.9%), Asia (36 | 1.5%), and Europe (34 | 1.4%), together accounting for 8.7% of all Jonestown residents.
| Immigration Origin | # Population | % Population |
| Asia | 36 | 1.5% |
| Canada | 5 | 0.2% |
| Central America | 46 | 1.9% |
| China | 19 | 0.8% |
| Eastern Asia | 19 | 0.8% |
| Europe | 34 | 1.4% |
| Iran | 6 | 0.3% |
| Latin America | 46 | 1.9% |
| Mexico | 46 | 1.9% |
| Northern Europe | 25 | 1.0% |
| Philippines | 11 | 0.5% |
| Portugal | 9 | 0.4% |
| South Central Asia | 6 | 0.3% |
| South Eastern Asia | 11 | 0.5% |
| Southern Europe | 9 | 0.4% |
| Sweden | 10 | 0.4% |
| Taiwan | 12 | 0.5% | View All 17 Rows |
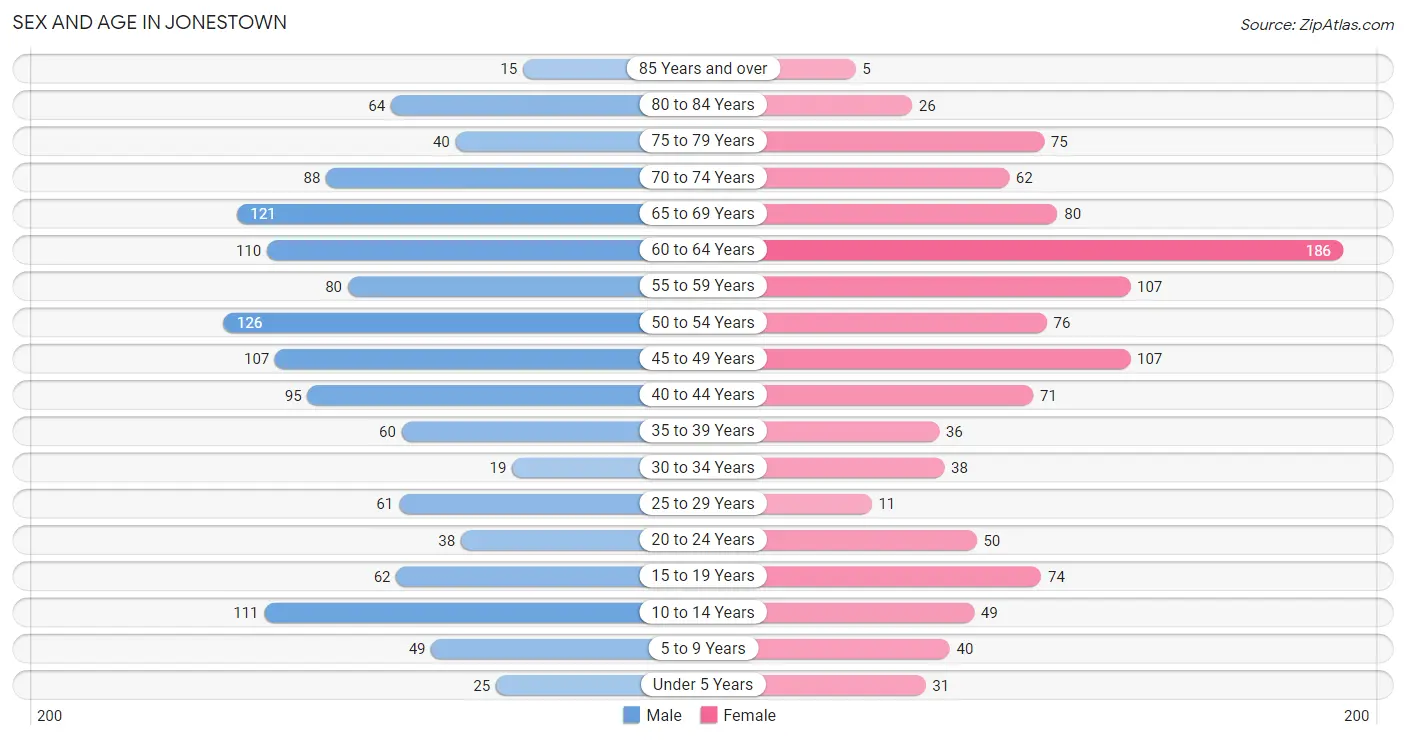
Sex and Age in Jonestown
Sex and Age in Jonestown
The most populous age groups in Jonestown are 50 to 54 Years (126 | 9.9%) for men and 60 to 64 Years (186 | 16.6%) for women.
| Age Bracket | Male | Female |
| Under 5 Years | 25 (2.0%) | 31 (2.8%) |
| 5 to 9 Years | 49 (3.9%) | 40 (3.6%) |
| 10 to 14 Years | 111 (8.7%) | 49 (4.4%) |
| 15 to 19 Years | 62 (4.9%) | 74 (6.6%) |
| 20 to 24 Years | 38 (3.0%) | 50 (4.4%) |
| 25 to 29 Years | 61 (4.8%) | 11 (1.0%) |
| 30 to 34 Years | 19 (1.5%) | 38 (3.4%) |
| 35 to 39 Years | 60 (4.7%) | 36 (3.2%) |
| 40 to 44 Years | 95 (7.5%) | 71 (6.3%) |
| 45 to 49 Years | 107 (8.4%) | 107 (9.5%) |
| 50 to 54 Years | 126 (9.9%) | 76 (6.8%) |
| 55 to 59 Years | 80 (6.3%) | 107 (9.5%) |
| 60 to 64 Years | 110 (8.6%) | 186 (16.6%) |
| 65 to 69 Years | 121 (9.5%) | 80 (7.1%) |
| 70 to 74 Years | 88 (6.9%) | 62 (5.5%) |
| 75 to 79 Years | 40 (3.2%) | 75 (6.7%) |
| 80 to 84 Years | 64 (5.0%) | 26 (2.3%) |
| 85 Years and over | 15 (1.2%) | 5 (0.4%) |
| Total | 1,271 (100.0%) | 1,124 (100.0%) |
Families and Households in Jonestown
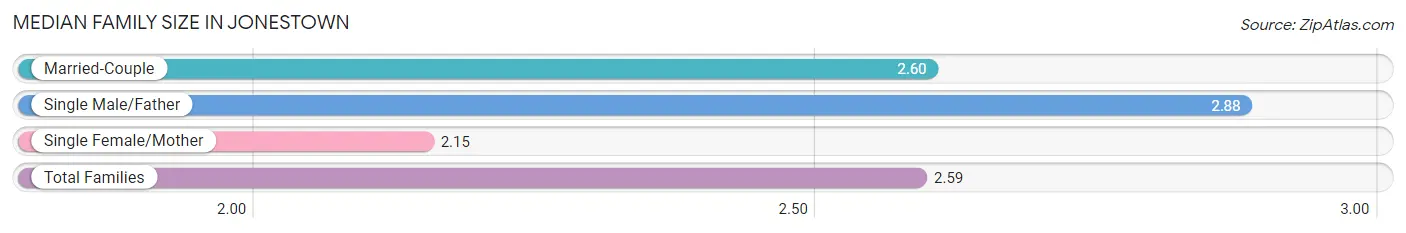
Median Family Size in Jonestown
The median family size in Jonestown is 2.59 persons per family, with single male/father families (34 | 4.3%) accounting for the largest median family size of 2.88 persons per family. On the other hand, single female/mother families (40 | 5.1%) represent the smallest median family size with 2.15 persons per family.
| Family Type | # Families | Family Size |
| Married-Couple | 716 (90.6%) | 2.60 |
| Single Male/Father | 34 (4.3%) | 2.88 |
| Single Female/Mother | 40 (5.1%) | 2.15 |
| Total Families | 790 (100.0%) | 2.59 |
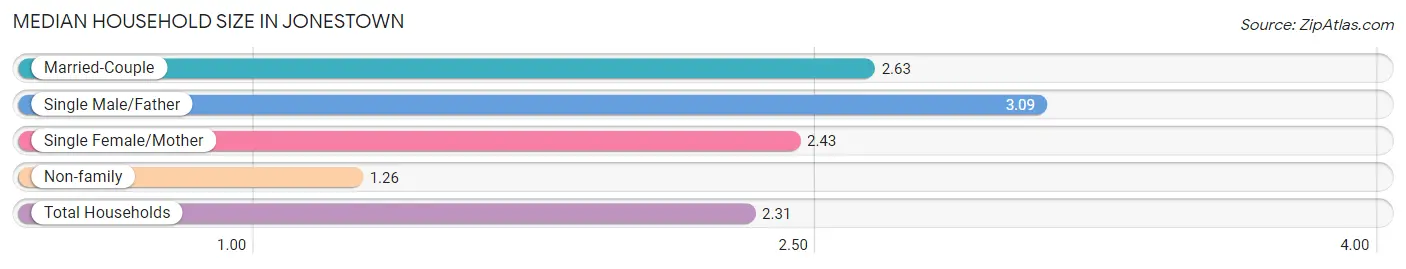
Median Household Size in Jonestown
The median household size in Jonestown is 2.31 persons per household, with single male/father households (34 | 3.3%) accounting for the largest median household size of 3.09 persons per household. non-family households (245 | 23.7%) represent the smallest median household size with 1.26 persons per household.
| Household Type | # Households | Household Size |
| Married-Couple | 716 (69.2%) | 2.63 |
| Single Male/Father | 34 (3.3%) | 3.09 |
| Single Female/Mother | 40 (3.9%) | 2.43 |
| Non-family | 245 (23.7%) | 1.26 |
| Total Households | 1,035 (100.0%) | 2.31 |
Household Size by Marriage Status in Jonestown
Out of a total of 1,035 households in Jonestown, 790 (76.3%) are family households, while 245 (23.7%) are nonfamily households. The most numerous type of family households are 2-person households, comprising 468, and the most common type of nonfamily households are 1-person households, comprising 197.
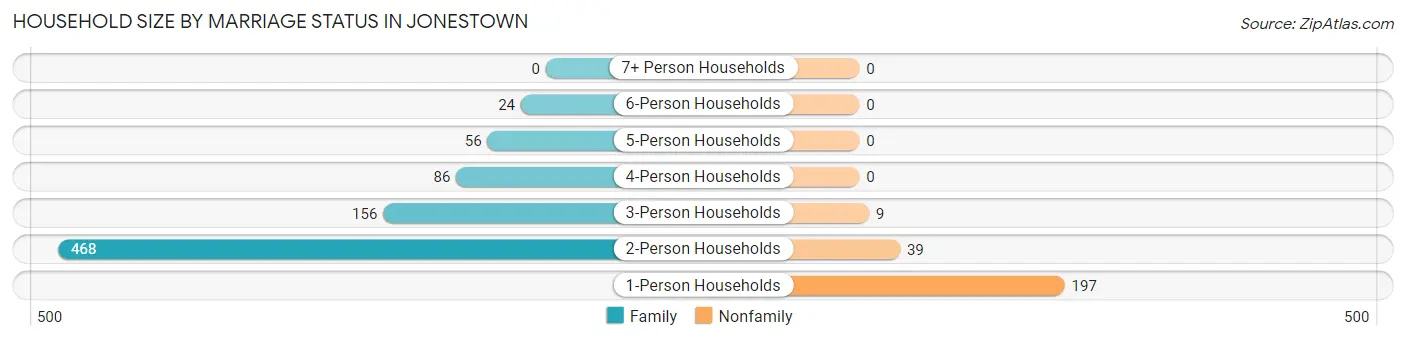
| Household Size | Family Households | Nonfamily Households |
| 1-Person Households | - | 197 (19.0%) |
| 2-Person Households | 468 (45.2%) | 39 (3.8%) |
| 3-Person Households | 156 (15.1%) | 9 (0.9%) |
| 4-Person Households | 86 (8.3%) | 0 (0.0%) |
| 5-Person Households | 56 (5.4%) | 0 (0.0%) |
| 6-Person Households | 24 (2.3%) | 0 (0.0%) |
| 7+ Person Households | 0 (0.0%) | 0 (0.0%) |
| Total | 790 (76.3%) | 245 (23.7%) |
Female Fertility in Jonestown
Fertility by Age in Jonestown
Average fertility rate in Jonestown is 56.0 births per 1,000 women. Women in the age bracket of 15 to 19 years have the highest fertility rate with 149.0 births per 1,000 women. Women in the age bracket of 15 to 19 years acount for 50.0% of all women with births.
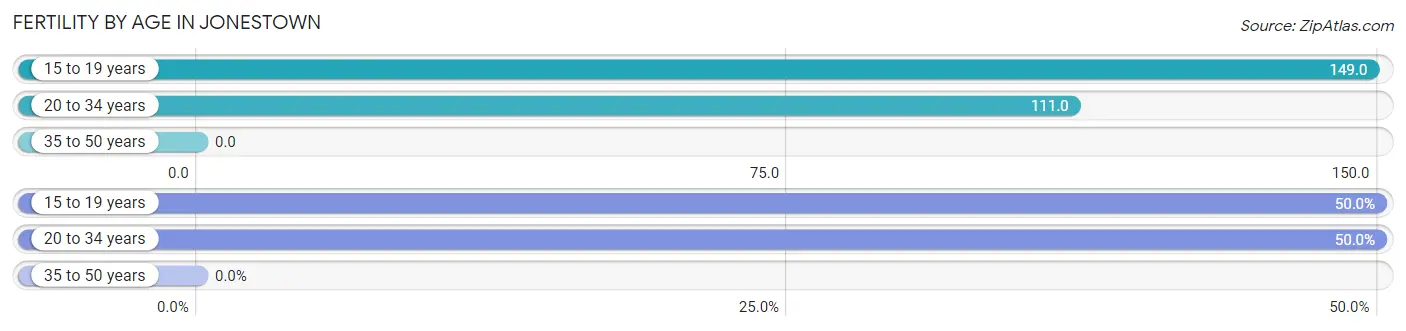
| Age Bracket | Women with Births | Births / 1,000 Women |
| 15 to 19 years | 11 (50.0%) | 149.0 |
| 20 to 34 years | 11 (50.0%) | 111.0 |
| 35 to 50 years | 0 (0.0%) | 0.0 |
| Total | 22 (100.0%) | 56.0 |
Fertility by Age by Marriage Status in Jonestown
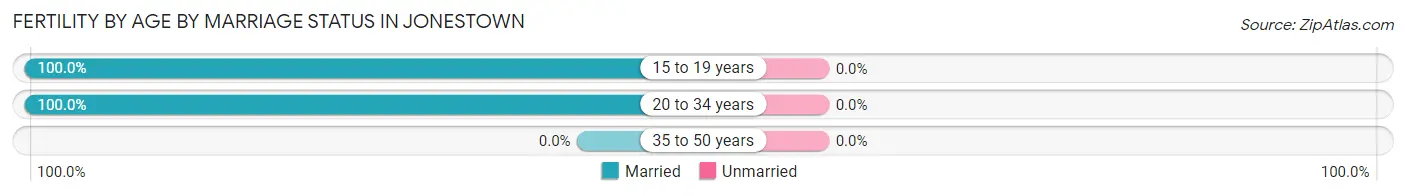
| Age Bracket | Married | Unmarried |
| 15 to 19 years | 11 (100.0%) | 0 (0.0%) |
| 20 to 34 years | 11 (100.0%) | 0 (0.0%) |
| 35 to 50 years | 0 (0.0%) | 0 (0.0%) |
| Total | 22 (100.0%) | 0 (0.0%) |
Fertility by Education in Jonestown
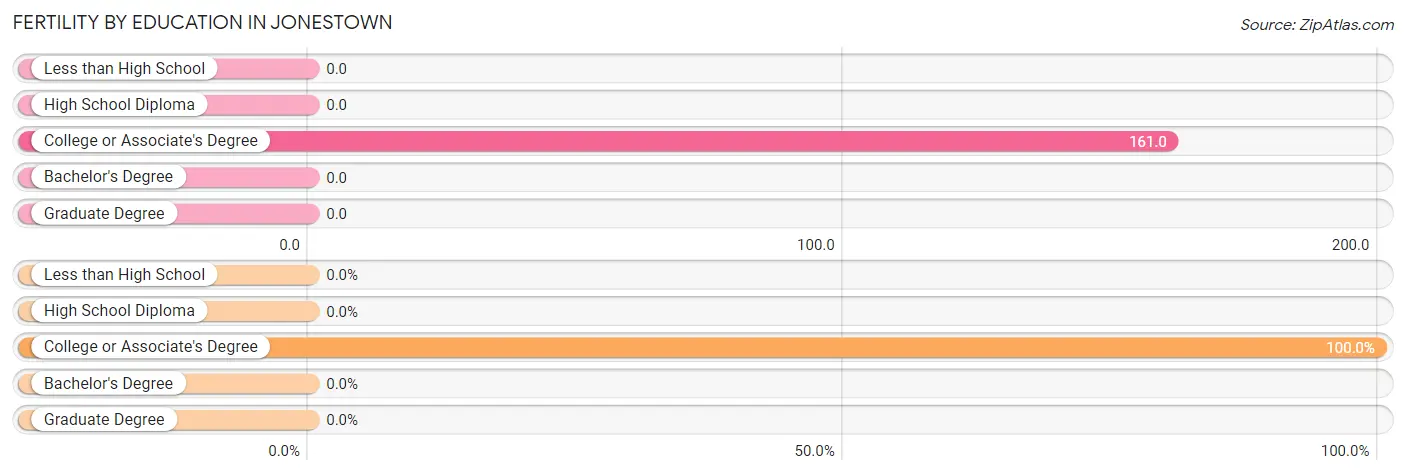
| Educational Attainment | Women with Births | Births / 1,000 Women |
| Less than High School | 0 (0.0%) | 0.0 |
| High School Diploma | 0 (0.0%) | 0.0 |
| College or Associate's Degree | 22 (100.0%) | 161.0 |
| Bachelor's Degree | 0 (0.0%) | 0.0 |
| Graduate Degree | 0 (0.0%) | 0.0 |
| Total | 22 (100.0%) | 56.0 |
Fertility by Education by Marriage Status in Jonestown
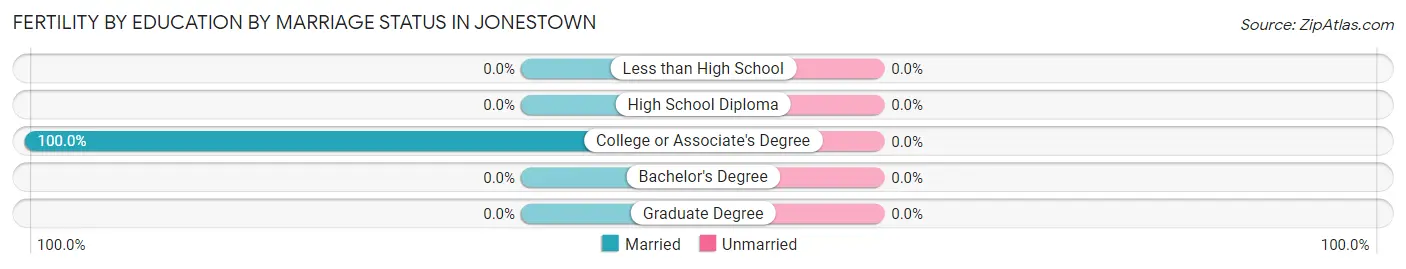
| Educational Attainment | Married | Unmarried |
| Less than High School | 0 (0.0%) | 0 (0.0%) |
| High School Diploma | 0 (0.0%) | 0 (0.0%) |
| College or Associate's Degree | 22 (100.0%) | 0 (0.0%) |
| Bachelor's Degree | 0 (0.0%) | 0 (0.0%) |
| Graduate Degree | 0 (0.0%) | 0 (0.0%) |
| Total | 22 (100.0%) | 0 (0.0%) |
Employment Characteristics in Jonestown
Employment by Class of Employer in Jonestown
Among the 1,131 employed individuals in Jonestown, private company employees (706 | 62.4%), self-employed (not incorporated) (149 | 13.2%), and self-employed (incorporated) (120 | 10.6%) make up the most common classes of employment.
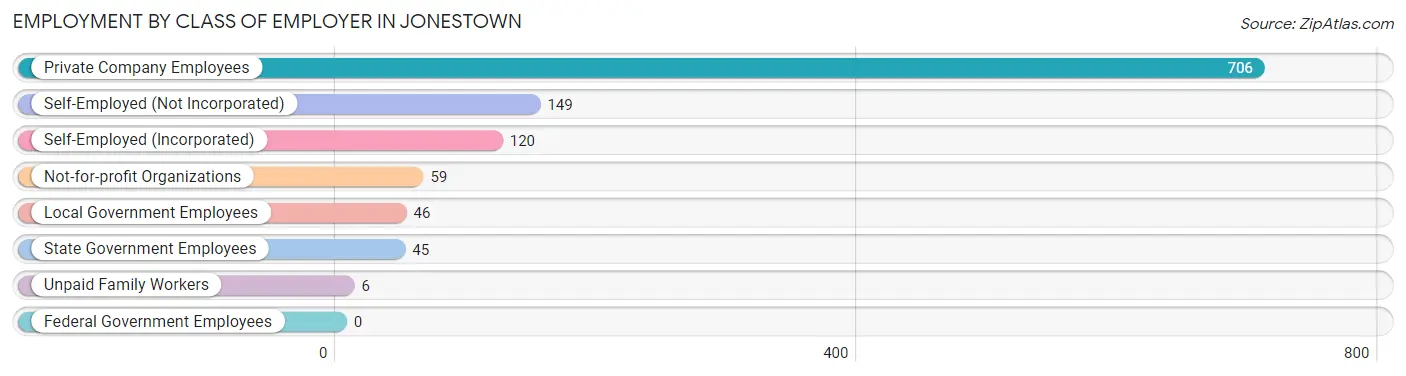
| Employer Class | # Employees | % Employees |
| Private Company Employees | 706 | 62.4% |
| Self-Employed (Incorporated) | 120 | 10.6% |
| Self-Employed (Not Incorporated) | 149 | 13.2% |
| Not-for-profit Organizations | 59 | 5.2% |
| Local Government Employees | 46 | 4.1% |
| State Government Employees | 45 | 4.0% |
| Federal Government Employees | 0 | 0.0% |
| Unpaid Family Workers | 6 | 0.5% |
| Total | 1,131 | 100.0% |
Employment Status by Age in Jonestown
According to the labor force statistics for Jonestown, out of the total population over 16 years of age (2,055), 59.4% or 1,221 individuals are in the labor force, with 4.0% or 49 of them unemployed. The age group with the highest labor force participation rate is 30 to 34 years, with 89.5% or 51 individuals in the labor force. Within the labor force, the 30 to 34 years age range has the highest percentage of unemployed individuals, with 31.4% or 16 of them being unemployed.
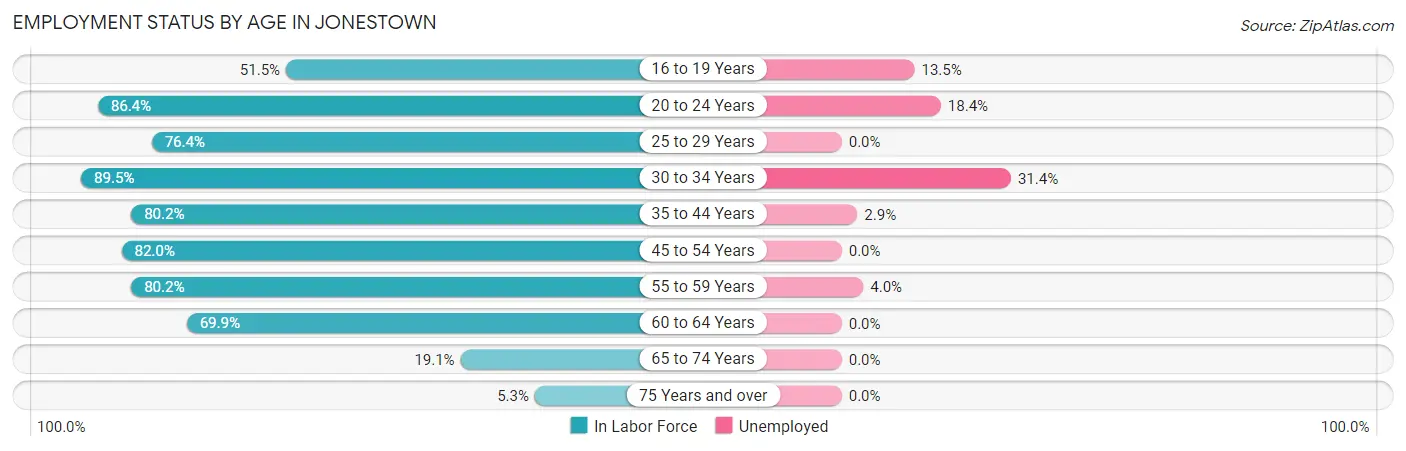
| Age Bracket | In Labor Force | Unemployed |
| 16 to 19 Years | 52 (51.5%) | 7 (13.5%) |
| 20 to 24 Years | 76 (86.4%) | 14 (18.4%) |
| 25 to 29 Years | 55 (76.4%) | 0 (0.0%) |
| 30 to 34 Years | 51 (89.5%) | 16 (31.4%) |
| 35 to 44 Years | 210 (80.2%) | 6 (2.9%) |
| 45 to 54 Years | 341 (82.0%) | 0 (0.0%) |
| 55 to 59 Years | 150 (80.2%) | 6 (4.0%) |
| 60 to 64 Years | 207 (69.9%) | 0 (0.0%) |
| 65 to 74 Years | 67 (19.1%) | 0 (0.0%) |
| 75 Years and over | 12 (5.3%) | 0 (0.0%) |
| Total | 1,221 (59.4%) | 49 (4.0%) |
Employment Status by Educational Attainment in Jonestown
According to labor force statistics for Jonestown, 78.6% of individuals (1,014) out of the total population between 25 and 64 years of age (1,290) are in the labor force, with 2.8% or 28 of them being unemployed. The group with the highest labor force participation rate are those with the educational attainment of bachelor's degree or higher, with 85.8% or 491 individuals in the labor force. Within the labor force, individuals with bachelor's degree or higher education have the highest percentage of unemployment, with 4.5% or 22 of them being unemployed.
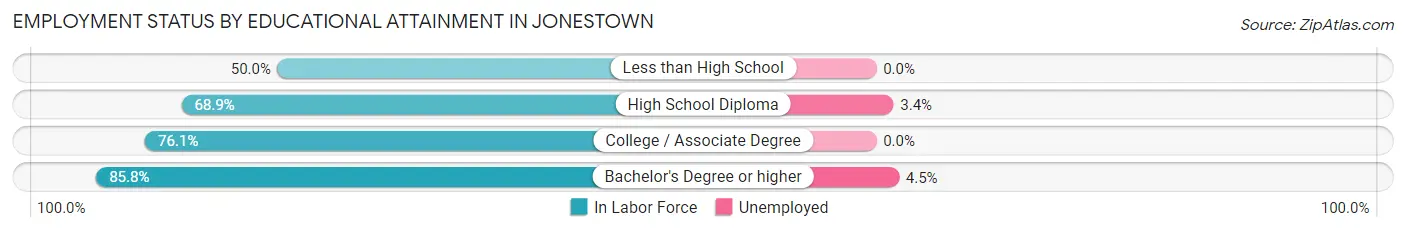
| Educational Attainment | In Labor Force | Unemployed |
| Less than High School | 10 (50.0%) | 0 (0.0%) |
| High School Diploma | 175 (68.9%) | 9 (3.4%) |
| College / Associate Degree | 338 (76.1%) | 0 (0.0%) |
| Bachelor's Degree or higher | 491 (85.8%) | 26 (4.5%) |
| Total | 1,014 (78.6%) | 36 (2.8%) |
Employment Occupations by Sex in Jonestown
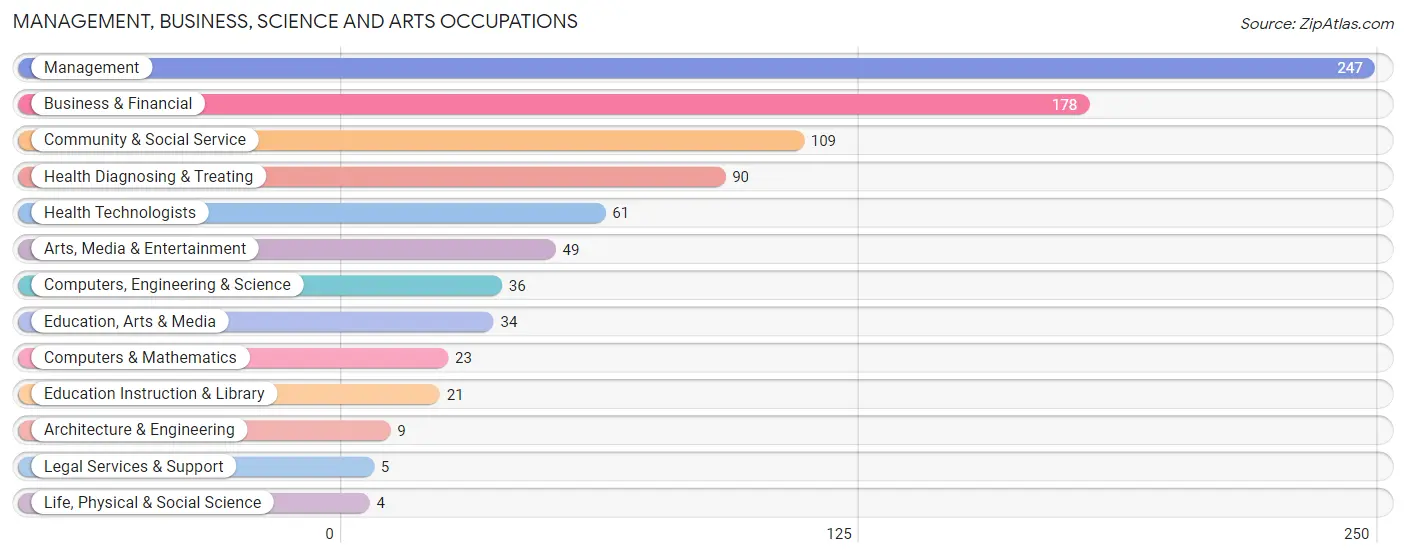
Management, Business, Science and Arts Occupations
The most common Management, Business, Science and Arts occupations in Jonestown are Management (247 | 21.1%), Business & Financial (178 | 15.2%), Community & Social Service (109 | 9.3%), Health Diagnosing & Treating (90 | 7.7%), and Health Technologists (61 | 5.2%).
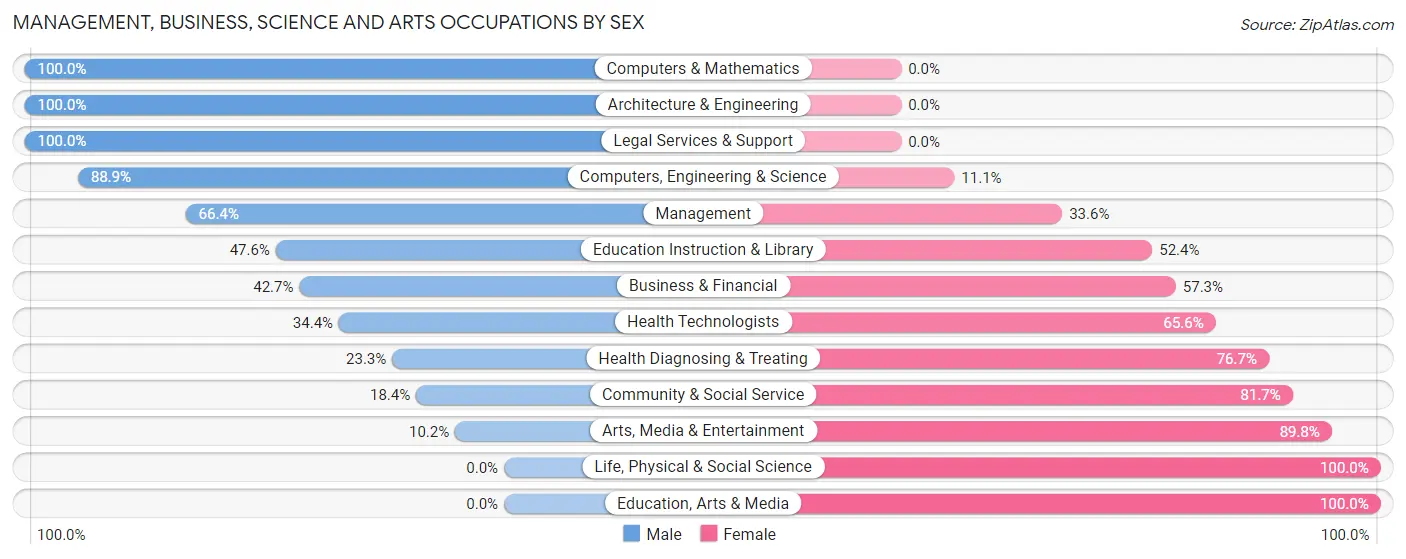
Management, Business, Science and Arts Occupations by Sex
Within the Management, Business, Science and Arts occupations in Jonestown, the most male-oriented occupations are Computers & Mathematics (100.0%), Architecture & Engineering (100.0%), and Legal Services & Support (100.0%), while the most female-oriented occupations are Life, Physical & Social Science (100.0%), Education, Arts & Media (100.0%), and Arts, Media & Entertainment (89.8%).
| Occupation | Male | Female |
| Management | 164 (66.4%) | 83 (33.6%) |
| Business & Financial | 76 (42.7%) | 102 (57.3%) |
| Computers, Engineering & Science | 32 (88.9%) | 4 (11.1%) |
| Computers & Mathematics | 23 (100.0%) | 0 (0.0%) |
| Architecture & Engineering | 9 (100.0%) | 0 (0.0%) |
| Life, Physical & Social Science | 0 (0.0%) | 4 (100.0%) |
| Community & Social Service | 20 (18.3%) | 89 (81.7%) |
| Education, Arts & Media | 0 (0.0%) | 34 (100.0%) |
| Legal Services & Support | 5 (100.0%) | 0 (0.0%) |
| Education Instruction & Library | 10 (47.6%) | 11 (52.4%) |
| Arts, Media & Entertainment | 5 (10.2%) | 44 (89.8%) |
| Health Diagnosing & Treating | 21 (23.3%) | 69 (76.7%) |
| Health Technologists | 21 (34.4%) | 40 (65.6%) |
| Total (Category) | 313 (47.4%) | 347 (52.6%) |
| Total (Overall) | 677 (57.8%) | 495 (42.2%) |
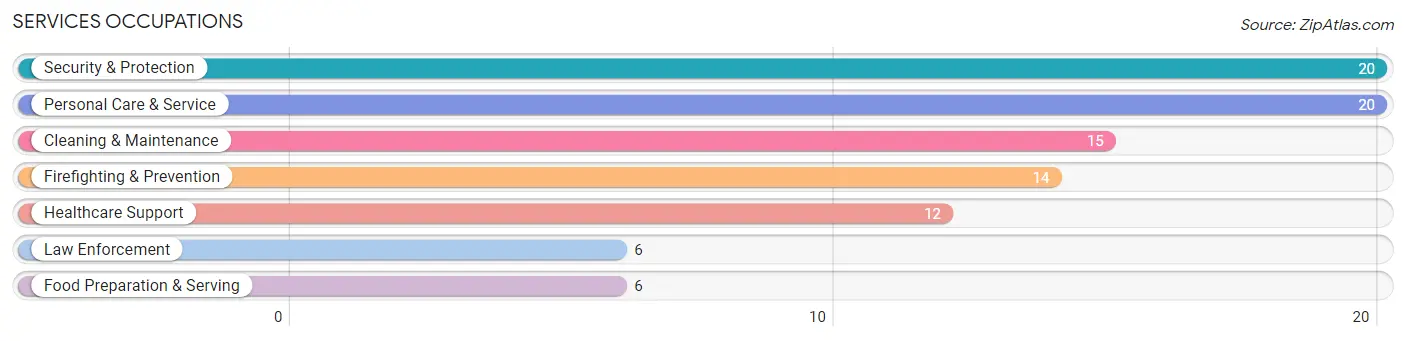
Services Occupations
The most common Services occupations in Jonestown are Security & Protection (20 | 1.7%), Personal Care & Service (20 | 1.7%), Cleaning & Maintenance (15 | 1.3%), Firefighting & Prevention (14 | 1.2%), and Healthcare Support (12 | 1.0%).
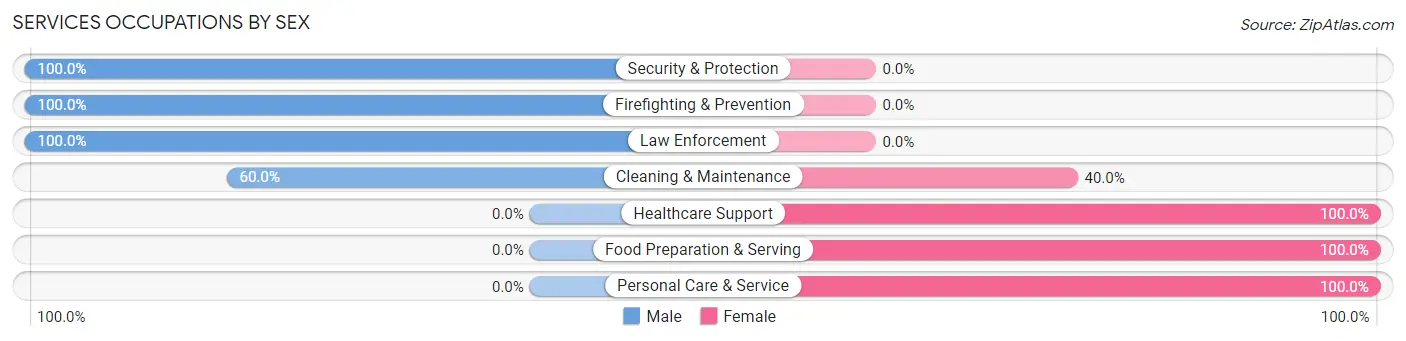
Services Occupations by Sex
Within the Services occupations in Jonestown, the most male-oriented occupations are Security & Protection (100.0%), Firefighting & Prevention (100.0%), and Law Enforcement (100.0%), while the most female-oriented occupations are Healthcare Support (100.0%), Food Preparation & Serving (100.0%), and Personal Care & Service (100.0%).
| Occupation | Male | Female |
| Healthcare Support | 0 (0.0%) | 12 (100.0%) |
| Security & Protection | 20 (100.0%) | 0 (0.0%) |
| Firefighting & Prevention | 14 (100.0%) | 0 (0.0%) |
| Law Enforcement | 6 (100.0%) | 0 (0.0%) |
| Food Preparation & Serving | 0 (0.0%) | 6 (100.0%) |
| Cleaning & Maintenance | 9 (60.0%) | 6 (40.0%) |
| Personal Care & Service | 0 (0.0%) | 20 (100.0%) |
| Total (Category) | 29 (39.7%) | 44 (60.3%) |
| Total (Overall) | 677 (57.8%) | 495 (42.2%) |
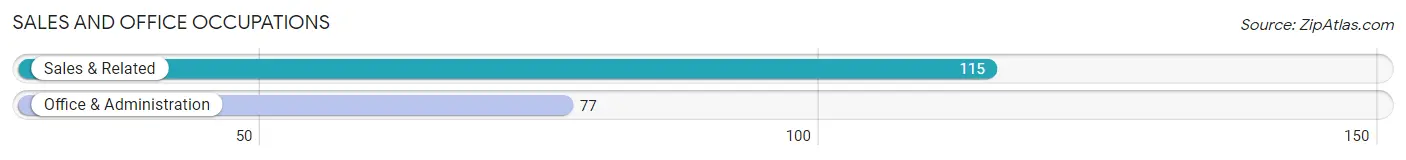
Sales and Office Occupations
The most common Sales and Office occupations in Jonestown are Sales & Related (115 | 9.8%), and Office & Administration (77 | 6.6%).
Sales and Office Occupations by Sex
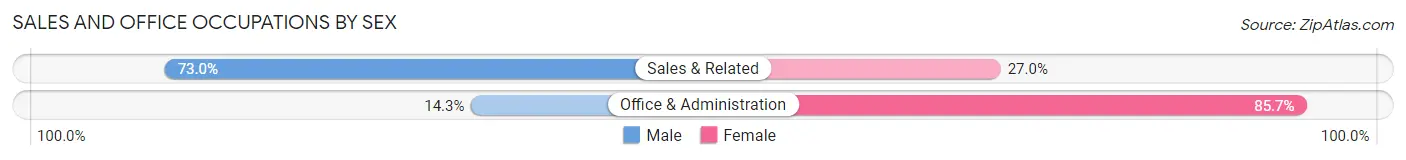
| Occupation | Male | Female |
| Sales & Related | 84 (73.0%) | 31 (27.0%) |
| Office & Administration | 11 (14.3%) | 66 (85.7%) |
| Total (Category) | 95 (49.5%) | 97 (50.5%) |
| Total (Overall) | 677 (57.8%) | 495 (42.2%) |
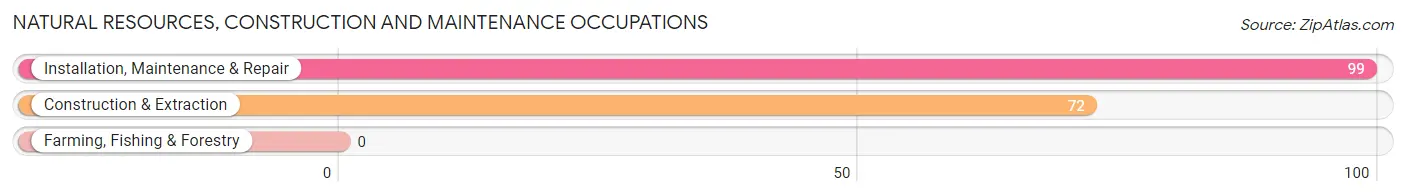
Natural Resources, Construction and Maintenance Occupations
The most common Natural Resources, Construction and Maintenance occupations in Jonestown are Installation, Maintenance & Repair (99 | 8.5%), and Construction & Extraction (72 | 6.1%).
Natural Resources, Construction and Maintenance Occupations by Sex
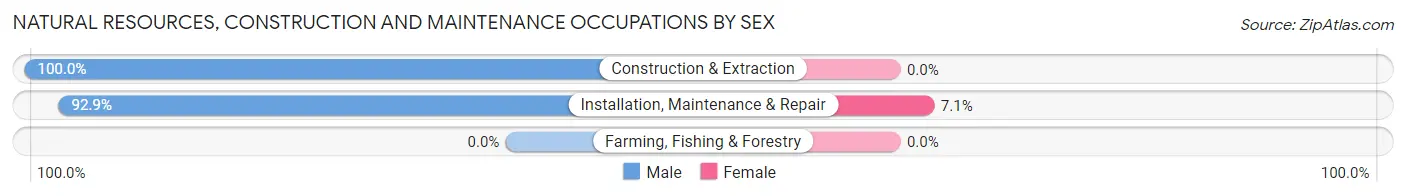
| Occupation | Male | Female |
| Farming, Fishing & Forestry | 0 (0.0%) | 0 (0.0%) |
| Construction & Extraction | 72 (100.0%) | 0 (0.0%) |
| Installation, Maintenance & Repair | 92 (92.9%) | 7 (7.1%) |
| Total (Category) | 164 (95.9%) | 7 (4.1%) |
| Total (Overall) | 677 (57.8%) | 495 (42.2%) |
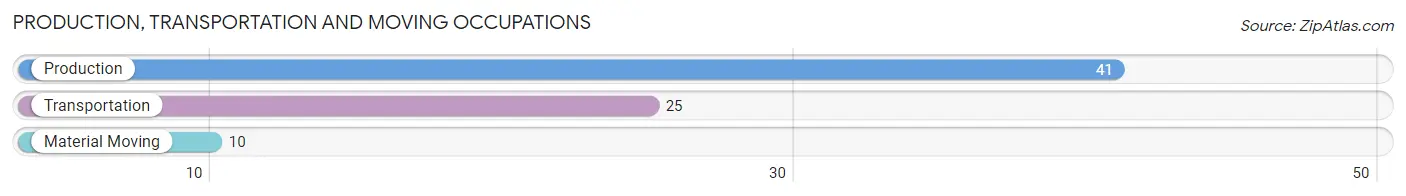
Production, Transportation and Moving Occupations
The most common Production, Transportation and Moving occupations in Jonestown are Production (41 | 3.5%), Transportation (25 | 2.1%), and Material Moving (10 | 0.9%).
Production, Transportation and Moving Occupations by Sex
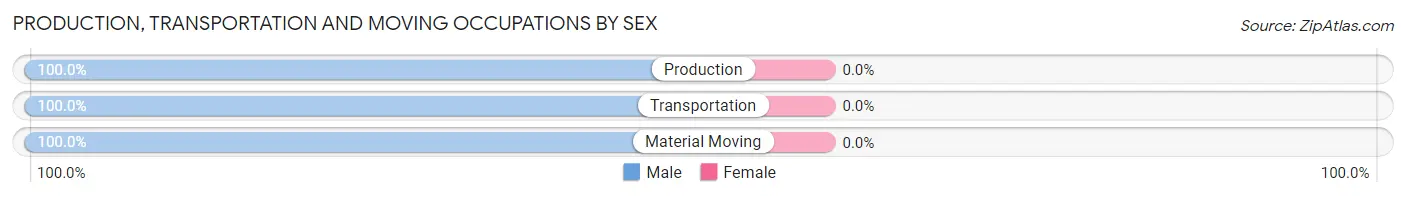
| Occupation | Male | Female |
| Production | 41 (100.0%) | 0 (0.0%) |
| Transportation | 25 (100.0%) | 0 (0.0%) |
| Material Moving | 10 (100.0%) | 0 (0.0%) |
| Total (Category) | 76 (100.0%) | 0 (0.0%) |
| Total (Overall) | 677 (57.8%) | 495 (42.2%) |
Employment Industries by Sex in Jonestown
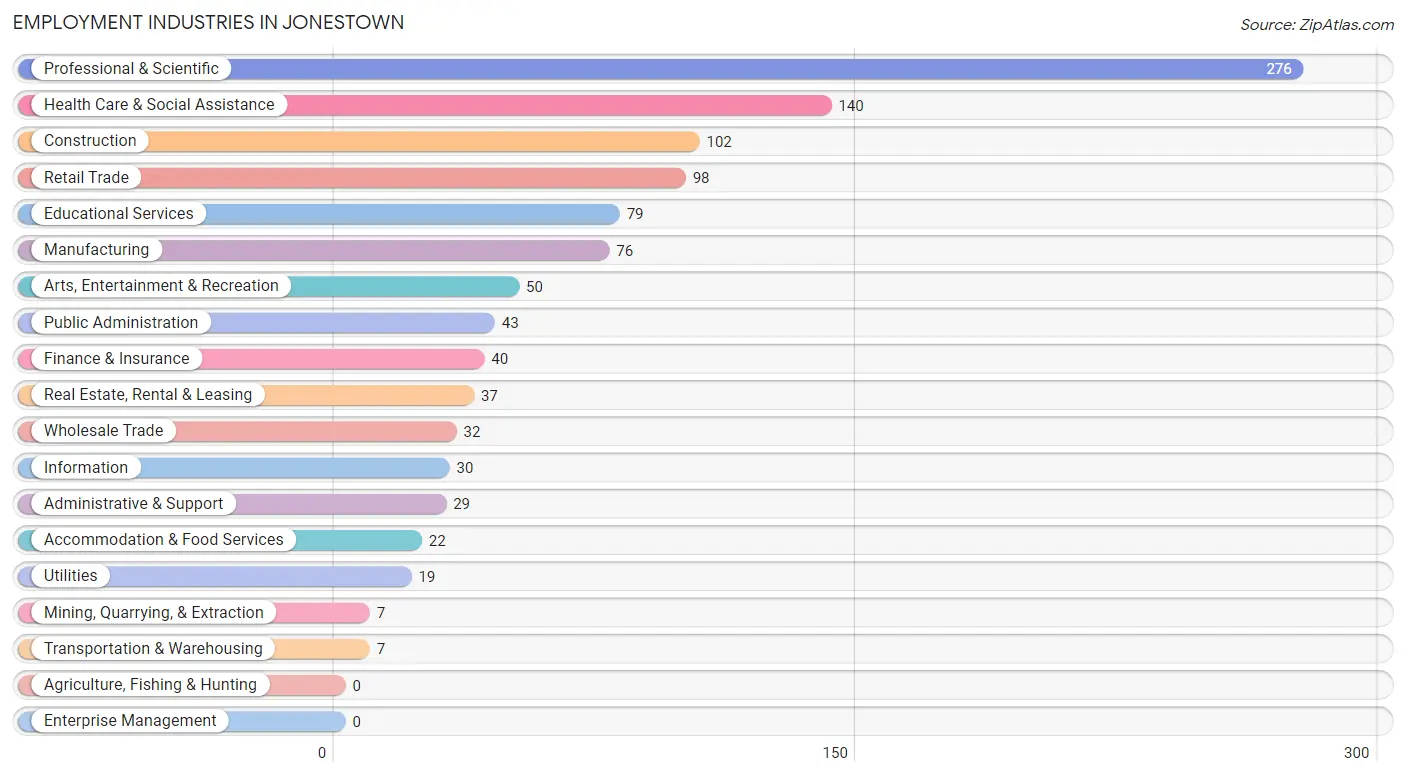
Employment Industries in Jonestown
The major employment industries in Jonestown include Professional & Scientific (276 | 23.5%), Health Care & Social Assistance (140 | 11.9%), Construction (102 | 8.7%), Retail Trade (98 | 8.4%), and Educational Services (79 | 6.7%).
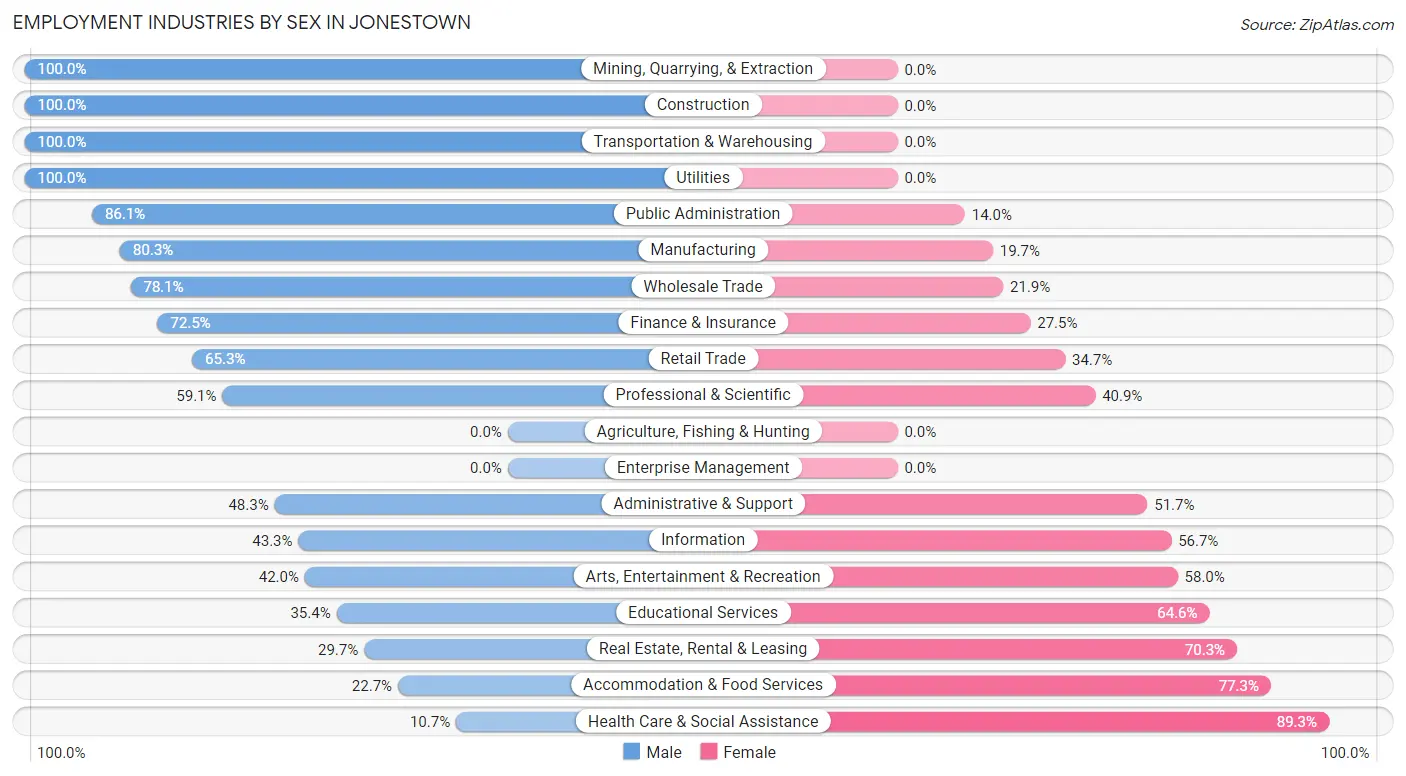
Employment Industries by Sex in Jonestown
The Jonestown industries that see more men than women are Mining, Quarrying, & Extraction (100.0%), Construction (100.0%), and Transportation & Warehousing (100.0%), whereas the industries that tend to have a higher number of women are Health Care & Social Assistance (89.3%), Accommodation & Food Services (77.3%), and Real Estate, Rental & Leasing (70.3%).
| Industry | Male | Female |
| Agriculture, Fishing & Hunting | 0 (0.0%) | 0 (0.0%) |
| Mining, Quarrying, & Extraction | 7 (100.0%) | 0 (0.0%) |
| Construction | 102 (100.0%) | 0 (0.0%) |
| Manufacturing | 61 (80.3%) | 15 (19.7%) |
| Wholesale Trade | 25 (78.1%) | 7 (21.9%) |
| Retail Trade | 64 (65.3%) | 34 (34.7%) |
| Transportation & Warehousing | 7 (100.0%) | 0 (0.0%) |
| Utilities | 19 (100.0%) | 0 (0.0%) |
| Information | 13 (43.3%) | 17 (56.7%) |
| Finance & Insurance | 29 (72.5%) | 11 (27.5%) |
| Real Estate, Rental & Leasing | 11 (29.7%) | 26 (70.3%) |
| Professional & Scientific | 163 (59.1%) | 113 (40.9%) |
| Enterprise Management | 0 (0.0%) | 0 (0.0%) |
| Administrative & Support | 14 (48.3%) | 15 (51.7%) |
| Educational Services | 28 (35.4%) | 51 (64.6%) |
| Health Care & Social Assistance | 15 (10.7%) | 125 (89.3%) |
| Arts, Entertainment & Recreation | 21 (42.0%) | 29 (58.0%) |
| Accommodation & Food Services | 5 (22.7%) | 17 (77.3%) |
| Public Administration | 37 (86.1%) | 6 (14.0%) |
| Total | 677 (57.8%) | 495 (42.2%) |
Education in Jonestown
School Enrollment in Jonestown
The most common levels of schooling among the 390 students in Jonestown are middle school (136 | 34.9%), high school (111 | 28.5%), and elementary school (89 | 22.8%).
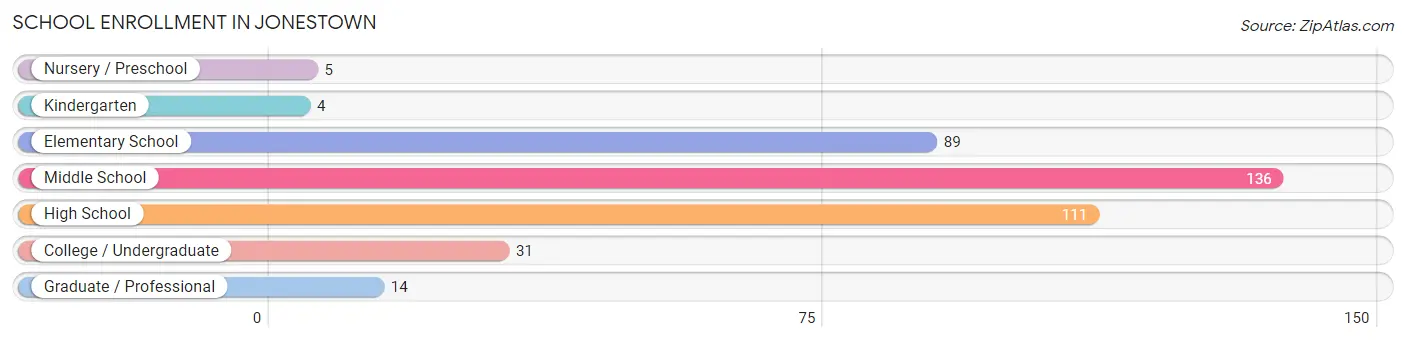
| School Level | # Students | % Students |
| Nursery / Preschool | 5 | 1.3% |
| Kindergarten | 4 | 1.0% |
| Elementary School | 89 | 22.8% |
| Middle School | 136 | 34.9% |
| High School | 111 | 28.5% |
| College / Undergraduate | 31 | 8.0% |
| Graduate / Professional | 14 | 3.6% |
| Total | 390 | 100.0% |
School Enrollment by Age by Funding Source in Jonestown
Out of a total of 390 students who are enrolled in schools in Jonestown, 42 (10.8%) attend a private institution, while the remaining 348 (89.2%) are enrolled in public schools. The age group of 3 to 4 year olds has the highest likelihood of being enrolled in private schools, with 5 (100.0% in the age bracket) enrolled. Conversely, the age group of 18 to 19 year olds has the lowest likelihood of being enrolled in a private school, with 11 (100.0% in the age bracket) attending a public institution.
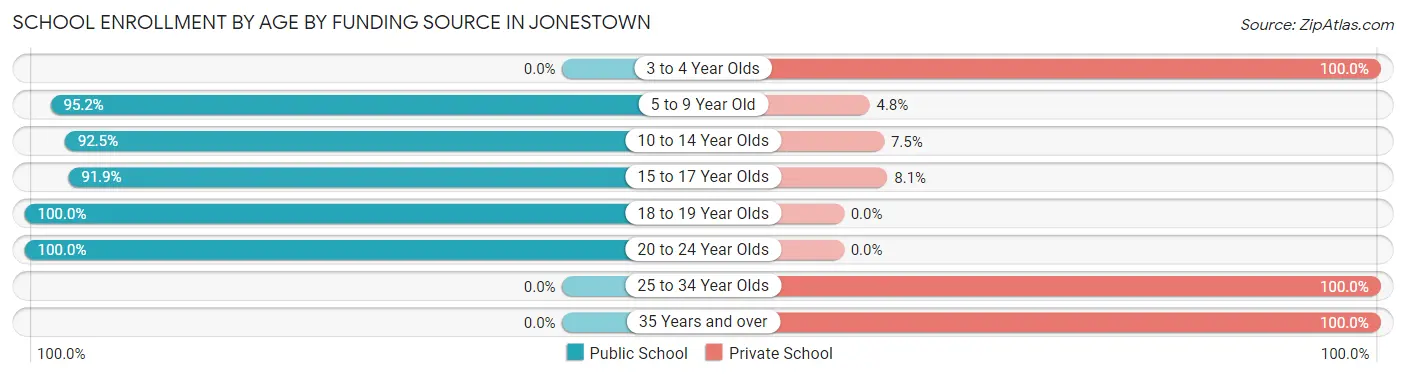
| Age Bracket | Public School | Private School |
| 3 to 4 Year Olds | 0 (0.0%) | 5 (100.0%) |
| 5 to 9 Year Old | 79 (95.2%) | 4 (4.8%) |
| 10 to 14 Year Olds | 148 (92.5%) | 12 (7.5%) |
| 15 to 17 Year Olds | 79 (91.9%) | 7 (8.1%) |
| 18 to 19 Year Olds | 11 (100.0%) | 0 (0.0%) |
| 20 to 24 Year Olds | 31 (100.0%) | 0 (0.0%) |
| 25 to 34 Year Olds | 0 (0.0%) | 5 (100.0%) |
| 35 Years and over | 0 (0.0%) | 9 (100.0%) |
| Total | 348 (89.2%) | 42 (10.8%) |
Educational Attainment by Field of Study in Jonestown
Business (302 | 36.1%), education (91 | 10.9%), computers & mathematics (67 | 8.0%), social sciences (55 | 6.6%), and literature & languages (50 | 6.0%) are the most common fields of study among 837 individuals in Jonestown who have obtained a bachelor's degree or higher.
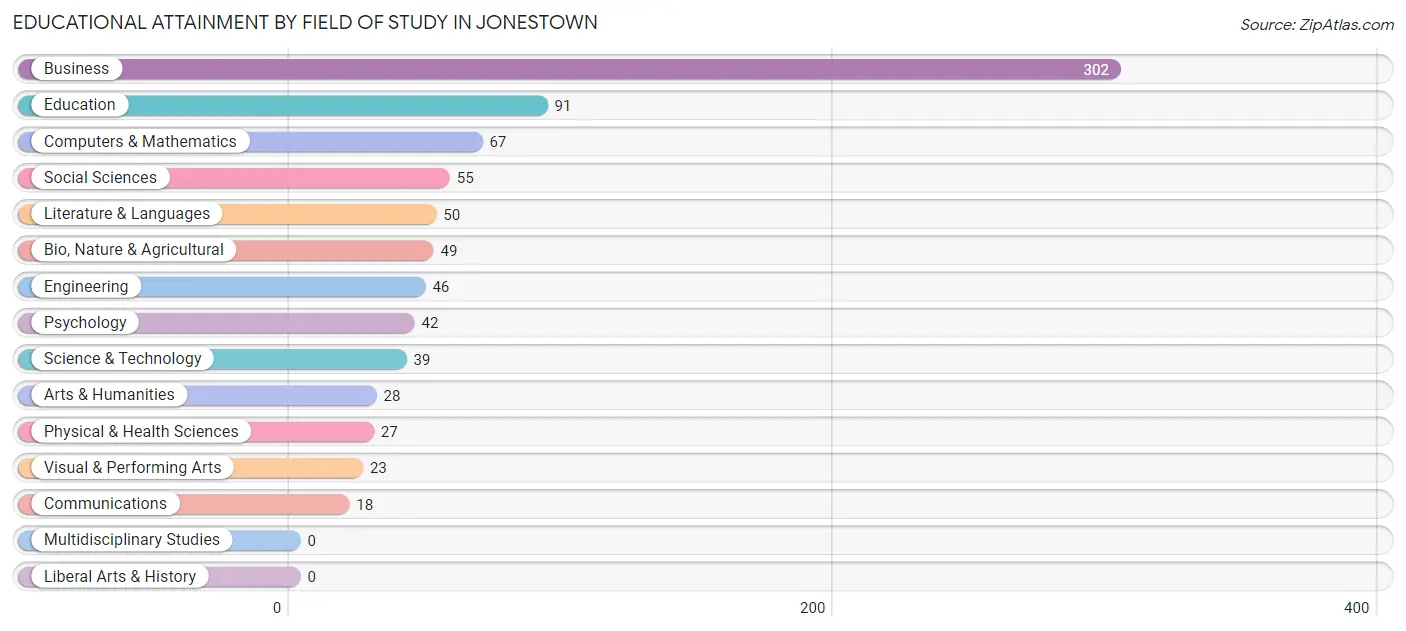
| Field of Study | # Graduates | % Graduates |
| Computers & Mathematics | 67 | 8.0% |
| Bio, Nature & Agricultural | 49 | 5.9% |
| Physical & Health Sciences | 27 | 3.2% |
| Psychology | 42 | 5.0% |
| Social Sciences | 55 | 6.6% |
| Engineering | 46 | 5.5% |
| Multidisciplinary Studies | 0 | 0.0% |
| Science & Technology | 39 | 4.7% |
| Business | 302 | 36.1% |
| Education | 91 | 10.9% |
| Literature & Languages | 50 | 6.0% |
| Liberal Arts & History | 0 | 0.0% |
| Visual & Performing Arts | 23 | 2.8% |
| Communications | 18 | 2.1% |
| Arts & Humanities | 28 | 3.4% |
| Total | 837 | 100.0% |
Transportation & Commute in Jonestown
Vehicle Availability by Sex in Jonestown
The most prevalent vehicle ownership categories in Jonestown are males with 2 vehicles (264, accounting for 39.9%) and females with 2 vehicles (169, making up 56.2%).
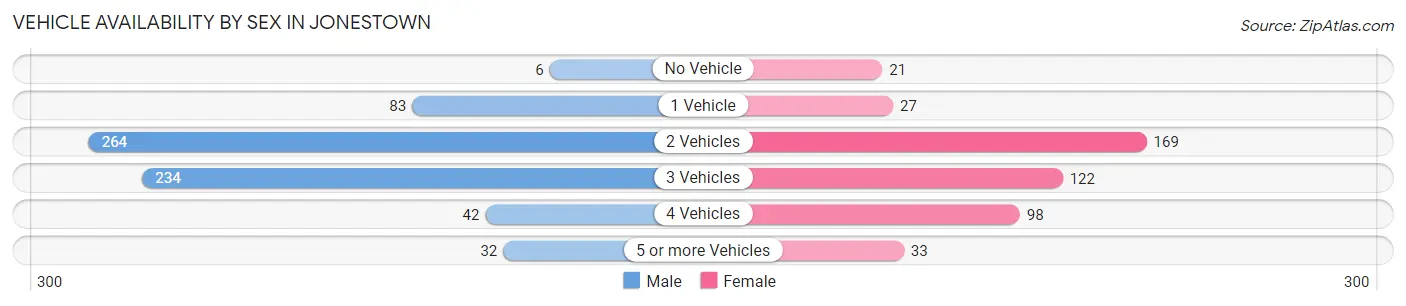
| Vehicles Available | Male | Female |
| No Vehicle | 6 (0.9%) | 21 (4.5%) |
| 1 Vehicle | 83 (12.6%) | 27 (5.7%) |
| 2 Vehicles | 264 (39.9%) | 169 (36.0%) |
| 3 Vehicles | 234 (35.4%) | 122 (26.0%) |
| 4 Vehicles | 42 (6.4%) | 98 (20.8%) |
| 5 or more Vehicles | 32 (4.8%) | 33 (7.0%) |
| Total | 661 (100.0%) | 470 (100.0%) |
Commute Time in Jonestown
The most frequently occuring commute durations in Jonestown are 20 to 24 minutes (124 commuters, 15.4%), 45 to 59 minutes (119 commuters, 14.8%), and 30 to 34 minutes (98 commuters, 12.2%).
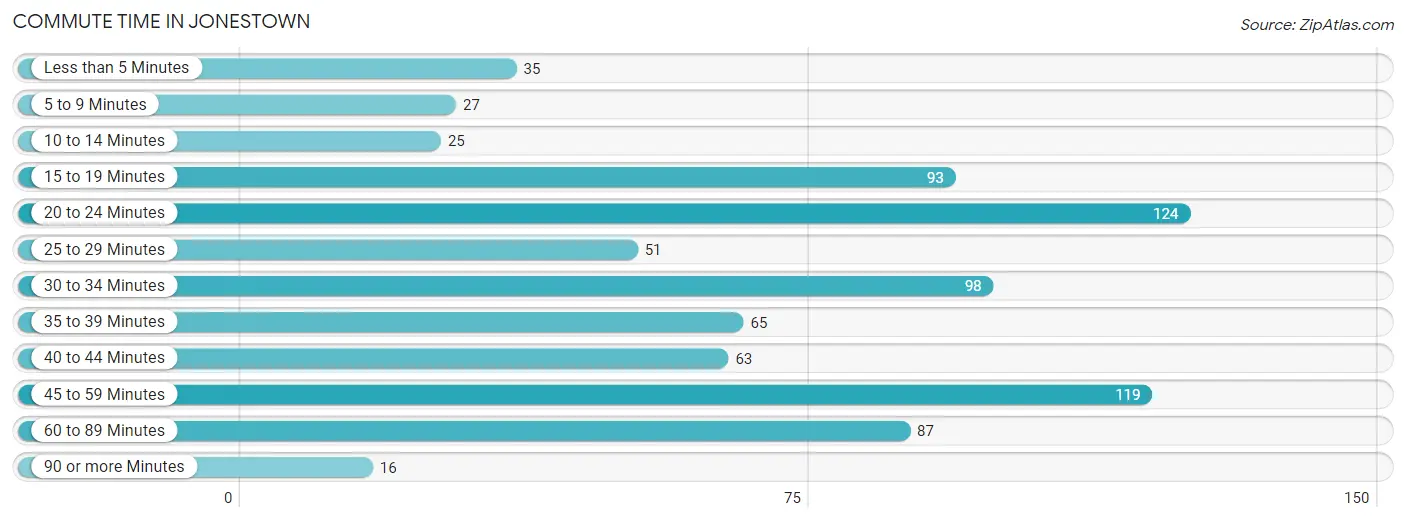
| Commute Time | # Commuters | % Commuters |
| Less than 5 Minutes | 35 | 4.4% |
| 5 to 9 Minutes | 27 | 3.4% |
| 10 to 14 Minutes | 25 | 3.1% |
| 15 to 19 Minutes | 93 | 11.6% |
| 20 to 24 Minutes | 124 | 15.4% |
| 25 to 29 Minutes | 51 | 6.4% |
| 30 to 34 Minutes | 98 | 12.2% |
| 35 to 39 Minutes | 65 | 8.1% |
| 40 to 44 Minutes | 63 | 7.9% |
| 45 to 59 Minutes | 119 | 14.8% |
| 60 to 89 Minutes | 87 | 10.8% |
| 90 or more Minutes | 16 | 2.0% |
Commute Time by Sex in Jonestown
The most common commute times in Jonestown are 45 to 59 minutes (84 commuters, 17.0%) for males and 20 to 24 minutes (105 commuters, 34.0%) for females.
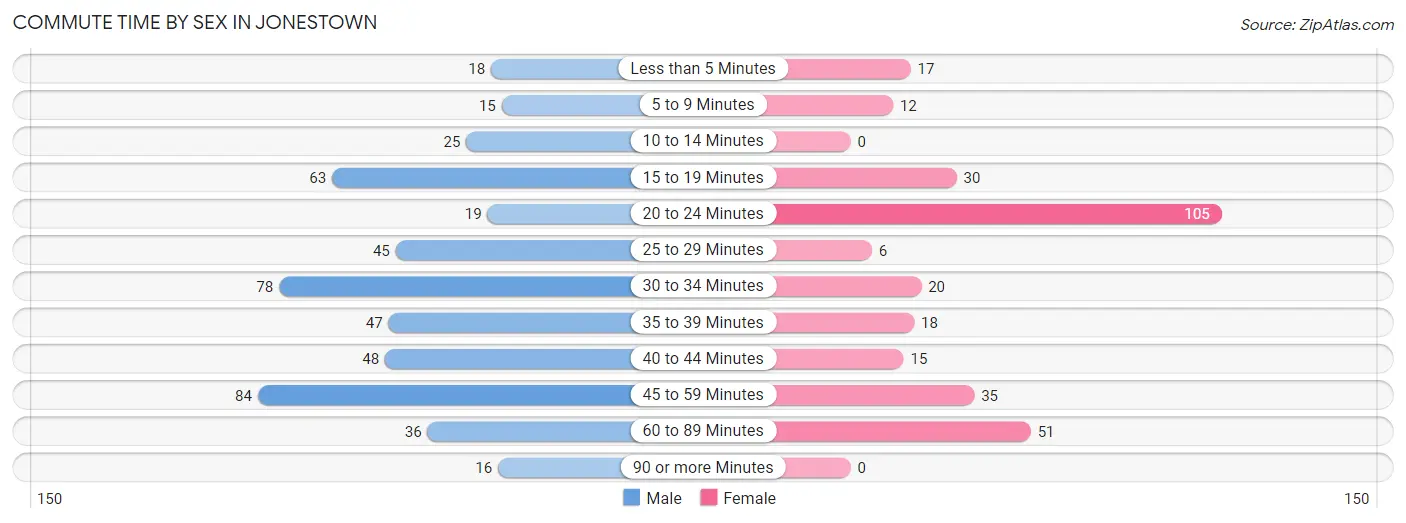
| Commute Time | Male | Female |
| Less than 5 Minutes | 18 (3.6%) | 17 (5.5%) |
| 5 to 9 Minutes | 15 (3.0%) | 12 (3.9%) |
| 10 to 14 Minutes | 25 (5.1%) | 0 (0.0%) |
| 15 to 19 Minutes | 63 (12.8%) | 30 (9.7%) |
| 20 to 24 Minutes | 19 (3.8%) | 105 (34.0%) |
| 25 to 29 Minutes | 45 (9.1%) | 6 (1.9%) |
| 30 to 34 Minutes | 78 (15.8%) | 20 (6.5%) |
| 35 to 39 Minutes | 47 (9.5%) | 18 (5.8%) |
| 40 to 44 Minutes | 48 (9.7%) | 15 (4.9%) |
| 45 to 59 Minutes | 84 (17.0%) | 35 (11.3%) |
| 60 to 89 Minutes | 36 (7.3%) | 51 (16.5%) |
| 90 or more Minutes | 16 (3.2%) | 0 (0.0%) |
Time of Departure to Work by Sex in Jonestown
The most frequent times of departure to work in Jonestown are 7:00 AM to 7:29 AM (147, 29.8%) for males and 7:00 AM to 7:29 AM (82, 26.5%) for females.
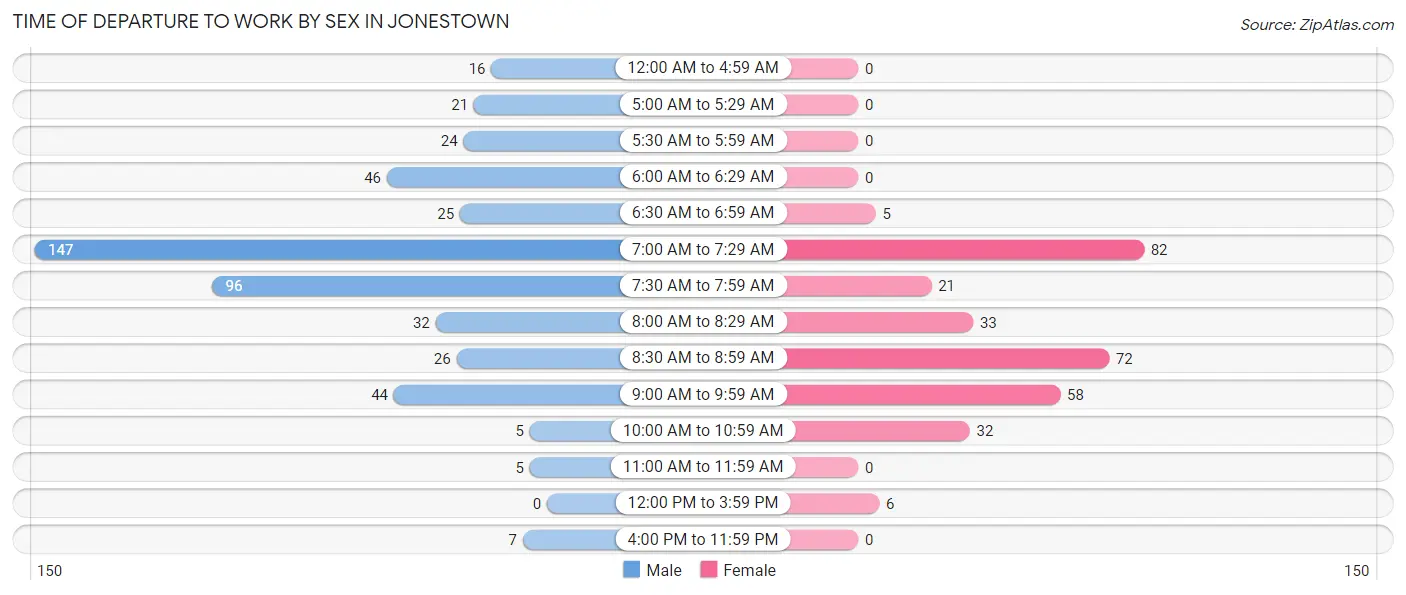
| Time of Departure | Male | Female |
| 12:00 AM to 4:59 AM | 16 (3.2%) | 0 (0.0%) |
| 5:00 AM to 5:29 AM | 21 (4.3%) | 0 (0.0%) |
| 5:30 AM to 5:59 AM | 24 (4.9%) | 0 (0.0%) |
| 6:00 AM to 6:29 AM | 46 (9.3%) | 0 (0.0%) |
| 6:30 AM to 6:59 AM | 25 (5.1%) | 5 (1.6%) |
| 7:00 AM to 7:29 AM | 147 (29.8%) | 82 (26.5%) |
| 7:30 AM to 7:59 AM | 96 (19.4%) | 21 (6.8%) |
| 8:00 AM to 8:29 AM | 32 (6.5%) | 33 (10.7%) |
| 8:30 AM to 8:59 AM | 26 (5.3%) | 72 (23.3%) |
| 9:00 AM to 9:59 AM | 44 (8.9%) | 58 (18.8%) |
| 10:00 AM to 10:59 AM | 5 (1.0%) | 32 (10.4%) |
| 11:00 AM to 11:59 AM | 5 (1.0%) | 0 (0.0%) |
| 12:00 PM to 3:59 PM | 0 (0.0%) | 6 (1.9%) |
| 4:00 PM to 11:59 PM | 7 (1.4%) | 0 (0.0%) |
| Total | 494 (100.0%) | 309 (100.0%) |
Housing Occupancy in Jonestown
Occupancy by Ownership in Jonestown
Of the total 1,035 dwellings in Jonestown, owner-occupied units account for 931 (89.9%), while renter-occupied units make up 104 (10.1%).
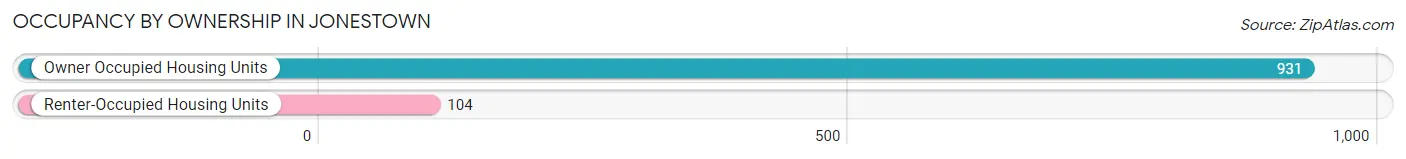
| Occupancy | # Housing Units | % Housing Units |
| Owner Occupied Housing Units | 931 | 89.9% |
| Renter-Occupied Housing Units | 104 | 10.1% |
| Total Occupied Housing Units | 1,035 | 100.0% |
Occupancy by Household Size in Jonestown
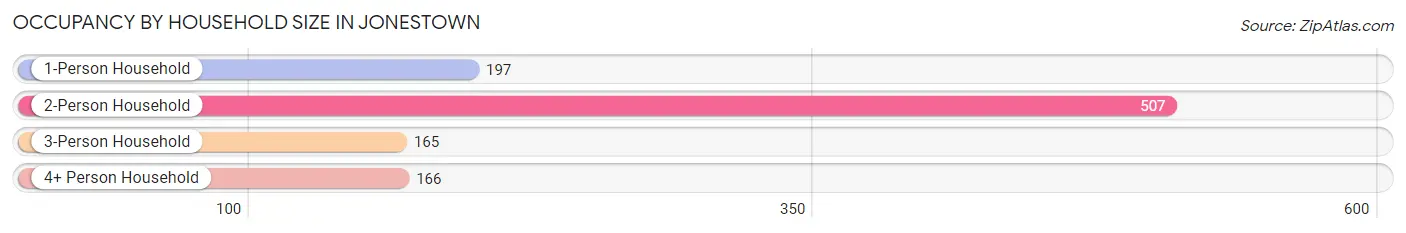
| Household Size | # Housing Units | % Housing Units |
| 1-Person Household | 197 | 19.0% |
| 2-Person Household | 507 | 49.0% |
| 3-Person Household | 165 | 15.9% |
| 4+ Person Household | 166 | 16.0% |
| Total Housing Units | 1,035 | 100.0% |
Occupancy by Ownership by Household Size in Jonestown
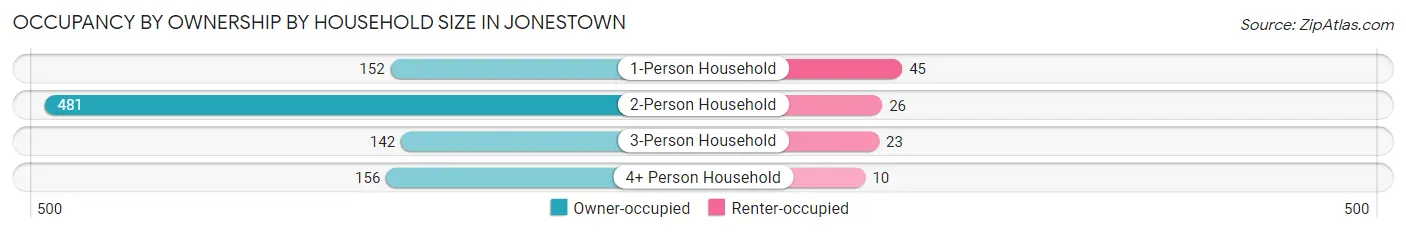
| Household Size | Owner-occupied | Renter-occupied |
| 1-Person Household | 152 (77.2%) | 45 (22.8%) |
| 2-Person Household | 481 (94.9%) | 26 (5.1%) |
| 3-Person Household | 142 (86.1%) | 23 (13.9%) |
| 4+ Person Household | 156 (94.0%) | 10 (6.0%) |
| Total Housing Units | 931 (89.9%) | 104 (10.1%) |
Occupancy by Educational Attainment in Jonestown
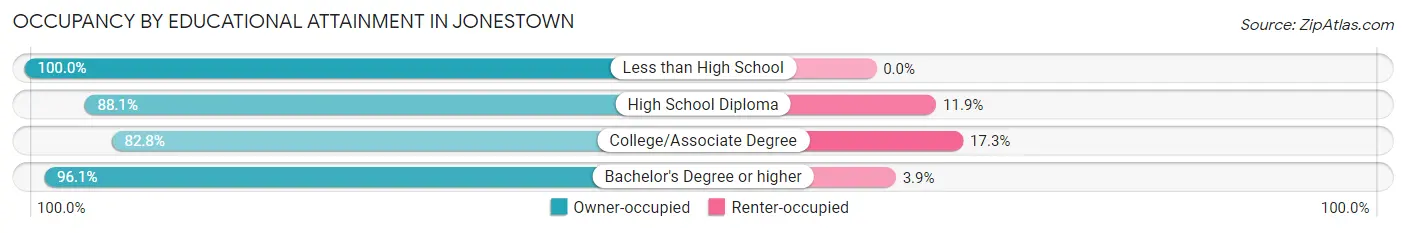
| Household Size | Owner-occupied | Renter-occupied |
| Less than High School | 15 (100.0%) | 0 (0.0%) |
| High School Diploma | 163 (88.1%) | 22 (11.9%) |
| College/Associate Degree | 307 (82.8%) | 64 (17.2%) |
| Bachelor's Degree or higher | 446 (96.1%) | 18 (3.9%) |
Occupancy by Age of Householder in Jonestown
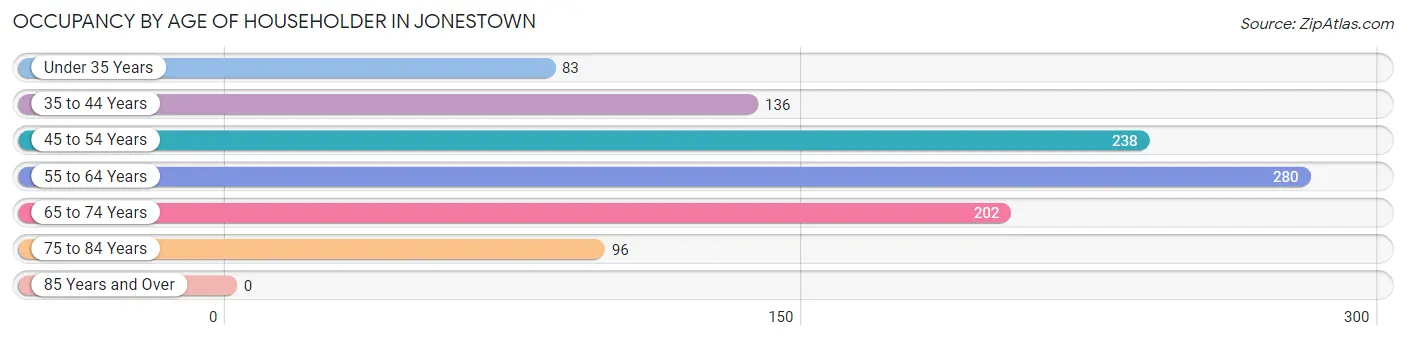
| Age Bracket | # Households | % Households |
| Under 35 Years | 83 | 8.0% |
| 35 to 44 Years | 136 | 13.1% |
| 45 to 54 Years | 238 | 23.0% |
| 55 to 64 Years | 280 | 27.1% |
| 65 to 74 Years | 202 | 19.5% |
| 75 to 84 Years | 96 | 9.3% |
| 85 Years and Over | 0 | 0.0% |
| Total | 1,035 | 100.0% |
Housing Finances in Jonestown
Median Income by Occupancy in Jonestown
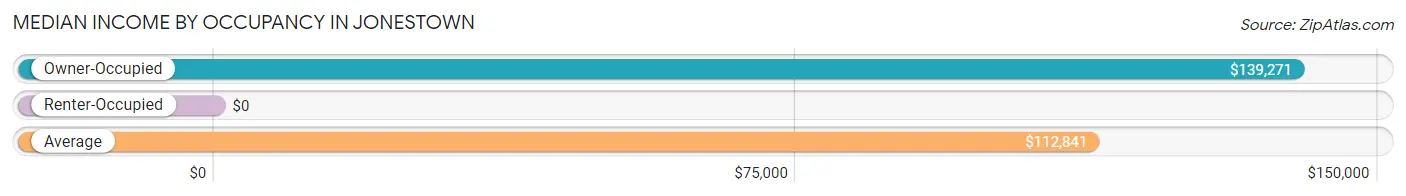
| Occupancy Type | # Households | Median Income |
| Owner-Occupied | 931 (89.9%) | $139,271 |
| Renter-Occupied | 104 (10.1%) | $0 |
| Average | 1,035 (100.0%) | $112,841 |
Occupancy by Householder Income Bracket in Jonestown
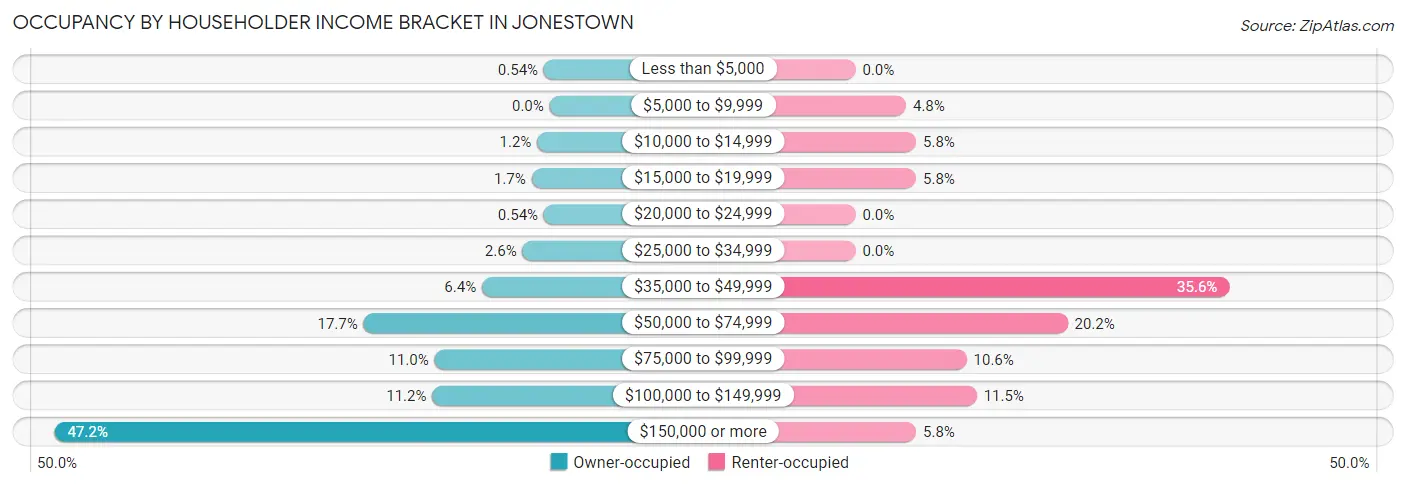
| Income Bracket | Owner-occupied | Renter-occupied |
| Less than $5,000 | 5 (0.5%) | 0 (0.0%) |
| $5,000 to $9,999 | 0 (0.0%) | 5 (4.8%) |
| $10,000 to $14,999 | 11 (1.2%) | 6 (5.8%) |
| $15,000 to $19,999 | 16 (1.7%) | 6 (5.8%) |
| $20,000 to $24,999 | 5 (0.5%) | 0 (0.0%) |
| $25,000 to $34,999 | 24 (2.6%) | 0 (0.0%) |
| $35,000 to $49,999 | 60 (6.4%) | 37 (35.6%) |
| $50,000 to $74,999 | 165 (17.7%) | 21 (20.2%) |
| $75,000 to $99,999 | 102 (11.0%) | 11 (10.6%) |
| $100,000 to $149,999 | 104 (11.2%) | 12 (11.5%) |
| $150,000 or more | 439 (47.1%) | 6 (5.8%) |
| Total | 931 (100.0%) | 104 (100.0%) |
Monthly Housing Cost Tiers in Jonestown
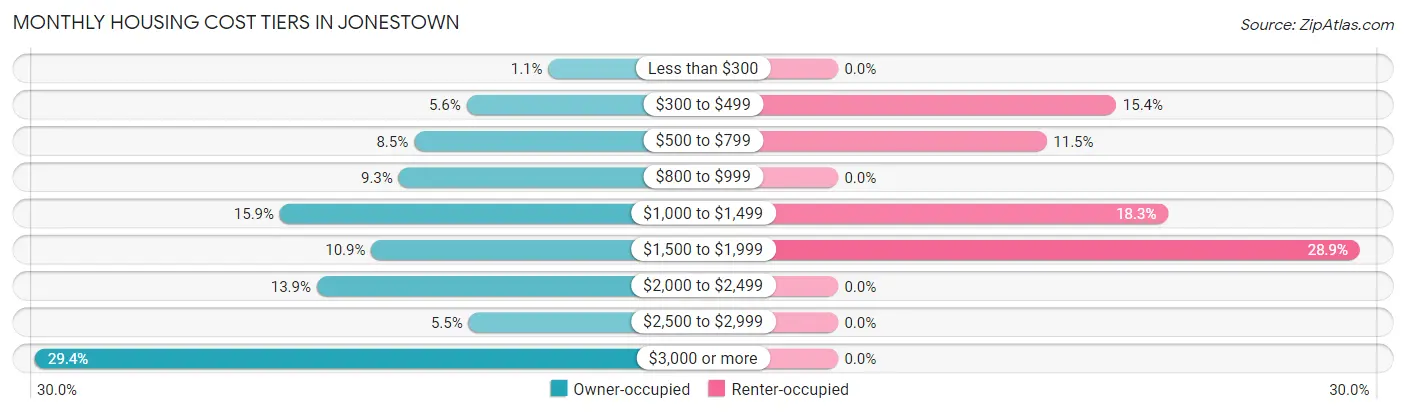
| Monthly Cost | Owner-occupied | Renter-occupied |
| Less than $300 | 10 (1.1%) | 0 (0.0%) |
| $300 to $499 | 52 (5.6%) | 16 (15.4%) |
| $500 to $799 | 79 (8.5%) | 12 (11.5%) |
| $800 to $999 | 87 (9.3%) | 0 (0.0%) |
| $1,000 to $1,499 | 148 (15.9%) | 19 (18.3%) |
| $1,500 to $1,999 | 101 (10.8%) | 30 (28.8%) |
| $2,000 to $2,499 | 129 (13.9%) | 0 (0.0%) |
| $2,500 to $2,999 | 51 (5.5%) | 0 (0.0%) |
| $3,000 or more | 274 (29.4%) | 0 (0.0%) |
| Total | 931 (100.0%) | 104 (100.0%) |
Physical Housing Characteristics in Jonestown
Housing Structures in Jonestown
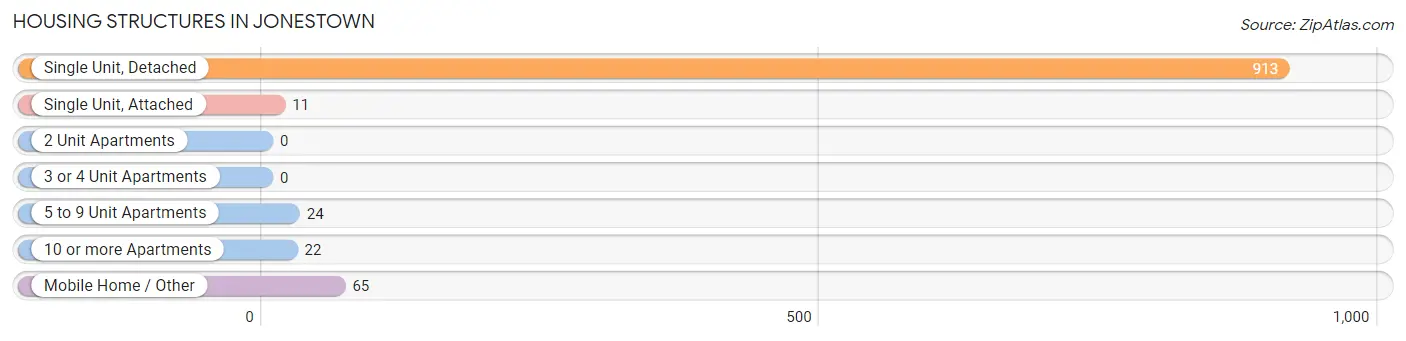
| Structure Type | # Housing Units | % Housing Units |
| Single Unit, Detached | 913 | 88.2% |
| Single Unit, Attached | 11 | 1.1% |
| 2 Unit Apartments | 0 | 0.0% |
| 3 or 4 Unit Apartments | 0 | 0.0% |
| 5 to 9 Unit Apartments | 24 | 2.3% |
| 10 or more Apartments | 22 | 2.1% |
| Mobile Home / Other | 65 | 6.3% |
| Total | 1,035 | 100.0% |
Housing Structures by Occupancy in Jonestown
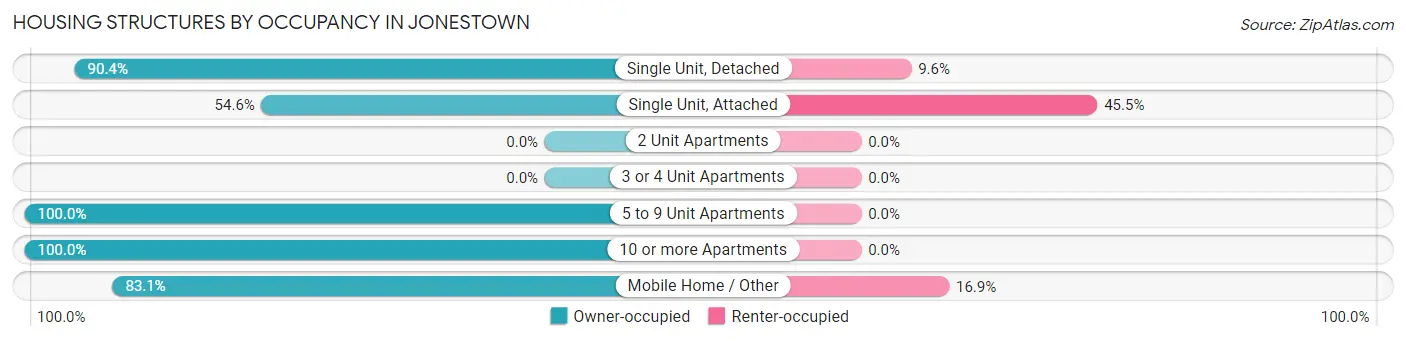
| Structure Type | Owner-occupied | Renter-occupied |
| Single Unit, Detached | 825 (90.4%) | 88 (9.6%) |
| Single Unit, Attached | 6 (54.5%) | 5 (45.5%) |
| 2 Unit Apartments | 0 (0.0%) | 0 (0.0%) |
| 3 or 4 Unit Apartments | 0 (0.0%) | 0 (0.0%) |
| 5 to 9 Unit Apartments | 24 (100.0%) | 0 (0.0%) |
| 10 or more Apartments | 22 (100.0%) | 0 (0.0%) |
| Mobile Home / Other | 54 (83.1%) | 11 (16.9%) |
| Total | 931 (89.9%) | 104 (10.1%) |
Housing Structures by Number of Rooms in Jonestown
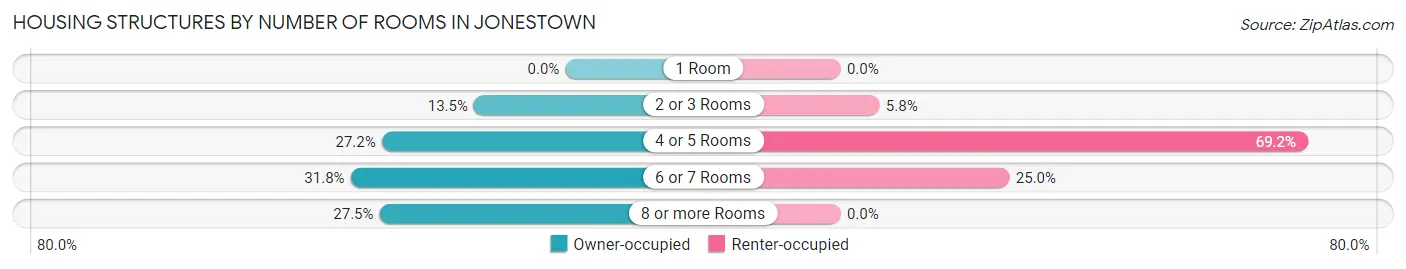
| Number of Rooms | Owner-occupied | Renter-occupied |
| 1 Room | 0 (0.0%) | 0 (0.0%) |
| 2 or 3 Rooms | 126 (13.5%) | 6 (5.8%) |
| 4 or 5 Rooms | 253 (27.2%) | 72 (69.2%) |
| 6 or 7 Rooms | 296 (31.8%) | 26 (25.0%) |
| 8 or more Rooms | 256 (27.5%) | 0 (0.0%) |
| Total | 931 (100.0%) | 104 (100.0%) |
Housing Structure by Heating Type in Jonestown
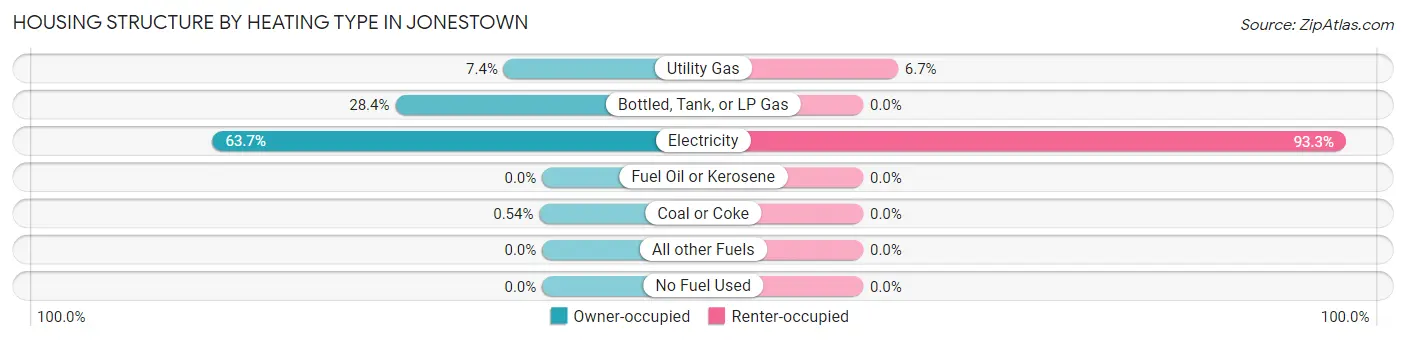
| Heating Type | Owner-occupied | Renter-occupied |
| Utility Gas | 69 (7.4%) | 7 (6.7%) |
| Bottled, Tank, or LP Gas | 264 (28.4%) | 0 (0.0%) |
| Electricity | 593 (63.7%) | 97 (93.3%) |
| Fuel Oil or Kerosene | 0 (0.0%) | 0 (0.0%) |
| Coal or Coke | 5 (0.5%) | 0 (0.0%) |
| All other Fuels | 0 (0.0%) | 0 (0.0%) |
| No Fuel Used | 0 (0.0%) | 0 (0.0%) |
| Total | 931 (100.0%) | 104 (100.0%) |
Household Vehicle Usage in Jonestown
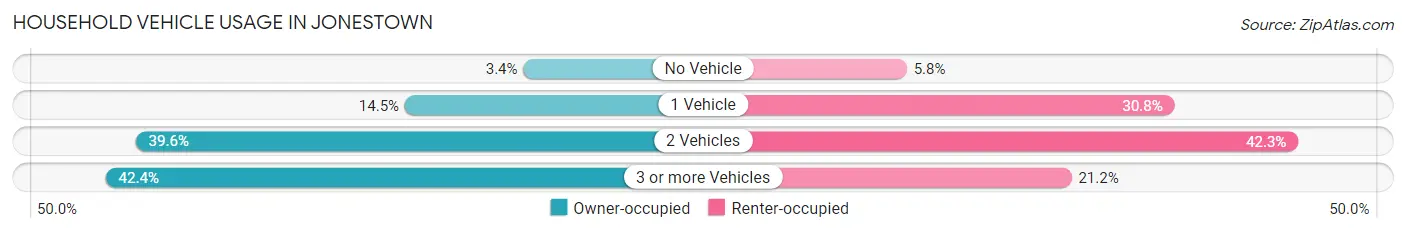
| Vehicles per Household | Owner-occupied | Renter-occupied |
| No Vehicle | 32 (3.4%) | 6 (5.8%) |
| 1 Vehicle | 135 (14.5%) | 32 (30.8%) |
| 2 Vehicles | 369 (39.6%) | 44 (42.3%) |
| 3 or more Vehicles | 395 (42.4%) | 22 (21.1%) |
| Total | 931 (100.0%) | 104 (100.0%) |
Real Estate & Mortgages in Jonestown
Real Estate and Mortgage Overview in Jonestown
| Characteristic | Without Mortgage | With Mortgage |
| Housing Units | 318 | 613 |
| Median Property Value | $292,500 | $473,200 |
| Median Household Income | $94,500 | $330 |
| Monthly Housing Costs | $923 | $265 |
| Real Estate Taxes | $5,674 | $6 |
Property Value by Mortgage Status in Jonestown
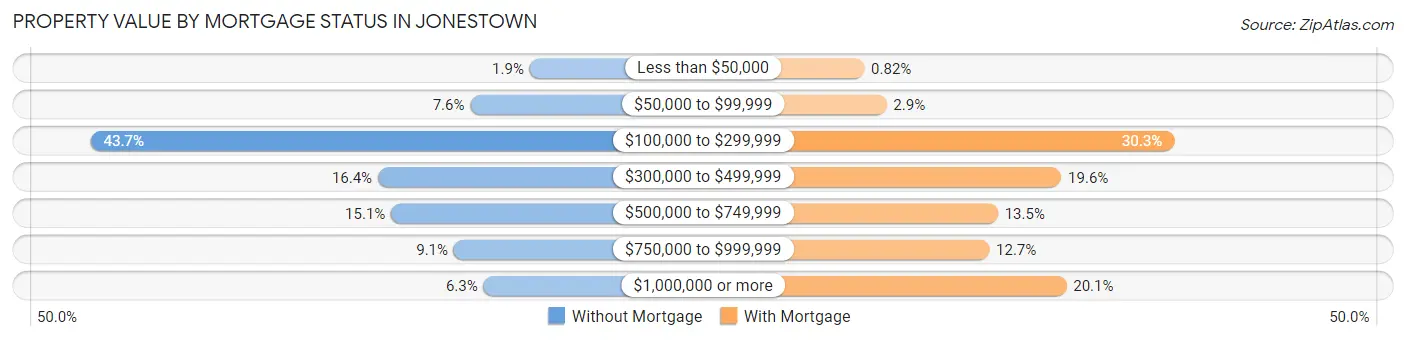
| Property Value | Without Mortgage | With Mortgage |
| Less than $50,000 | 6 (1.9%) | 5 (0.8%) |
| $50,000 to $99,999 | 24 (7.5%) | 18 (2.9%) |
| $100,000 to $299,999 | 139 (43.7%) | 186 (30.3%) |
| $300,000 to $499,999 | 52 (16.4%) | 120 (19.6%) |
| $500,000 to $749,999 | 48 (15.1%) | 83 (13.5%) |
| $750,000 to $999,999 | 29 (9.1%) | 78 (12.7%) |
| $1,000,000 or more | 20 (6.3%) | 123 (20.1%) |
| Total | 318 (100.0%) | 613 (100.0%) |
Household Income by Mortgage Status in Jonestown
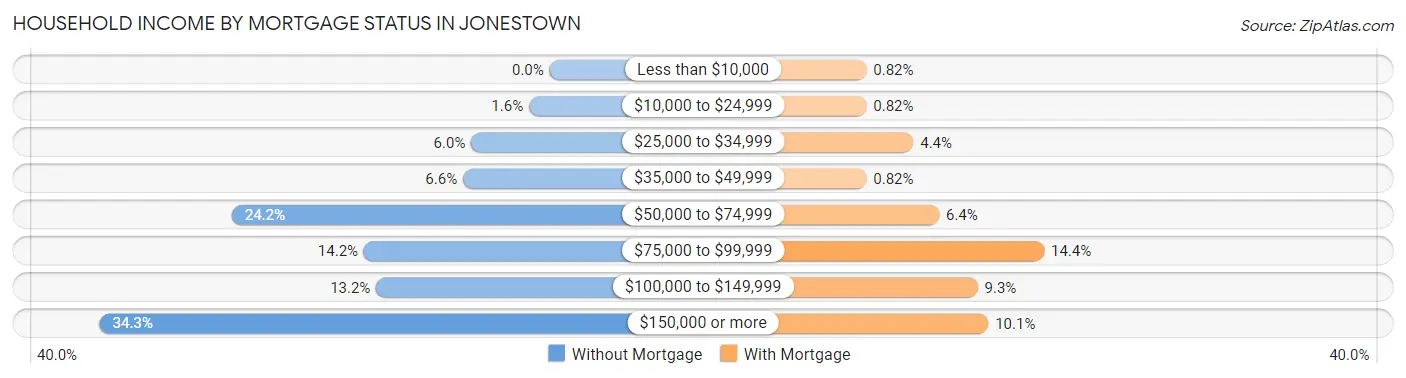
| Household Income | Without Mortgage | With Mortgage |
| Less than $10,000 | 0 (0.0%) | 5 (0.8%) |
| $10,000 to $24,999 | 5 (1.6%) | 5 (0.8%) |
| $25,000 to $34,999 | 19 (6.0%) | 27 (4.4%) |
| $35,000 to $49,999 | 21 (6.6%) | 5 (0.8%) |
| $50,000 to $74,999 | 77 (24.2%) | 39 (6.4%) |
| $75,000 to $99,999 | 45 (14.1%) | 88 (14.4%) |
| $100,000 to $149,999 | 42 (13.2%) | 57 (9.3%) |
| $150,000 or more | 109 (34.3%) | 62 (10.1%) |
| Total | 318 (100.0%) | 613 (100.0%) |
Property Value to Household Income Ratio in Jonestown
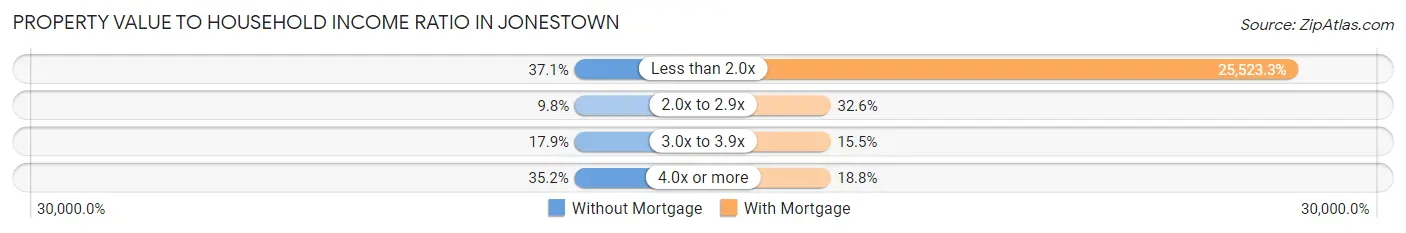
| Value-to-Income Ratio | Without Mortgage | With Mortgage |
| Less than 2.0x | 118 (37.1%) | 156,458 (25,523.3%) |
| 2.0x to 2.9x | 31 (9.8%) | 200 (32.6%) |
| 3.0x to 3.9x | 57 (17.9%) | 95 (15.5%) |
| 4.0x or more | 112 (35.2%) | 115 (18.8%) |
| Total | 318 (100.0%) | 613 (100.0%) |
Real Estate Taxes by Mortgage Status in Jonestown
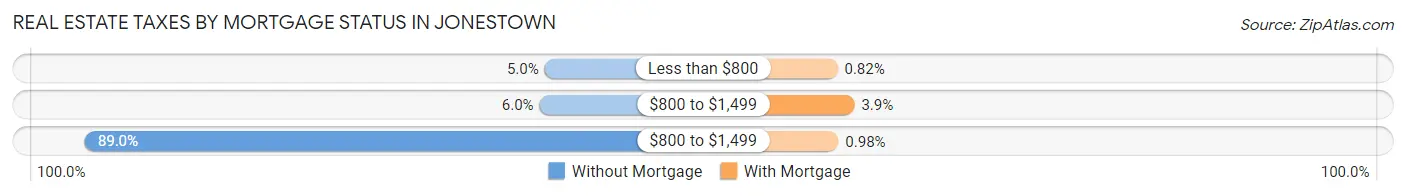
| Property Taxes | Without Mortgage | With Mortgage |
| Less than $800 | 16 (5.0%) | 5 (0.8%) |
| $800 to $1,499 | 19 (6.0%) | 24 (3.9%) |
| $800 to $1,499 | 283 (89.0%) | 6 (1.0%) |
| Total | 318 (100.0%) | 613 (100.0%) |
Health & Disability in Jonestown
Health Insurance Coverage by Age in Jonestown
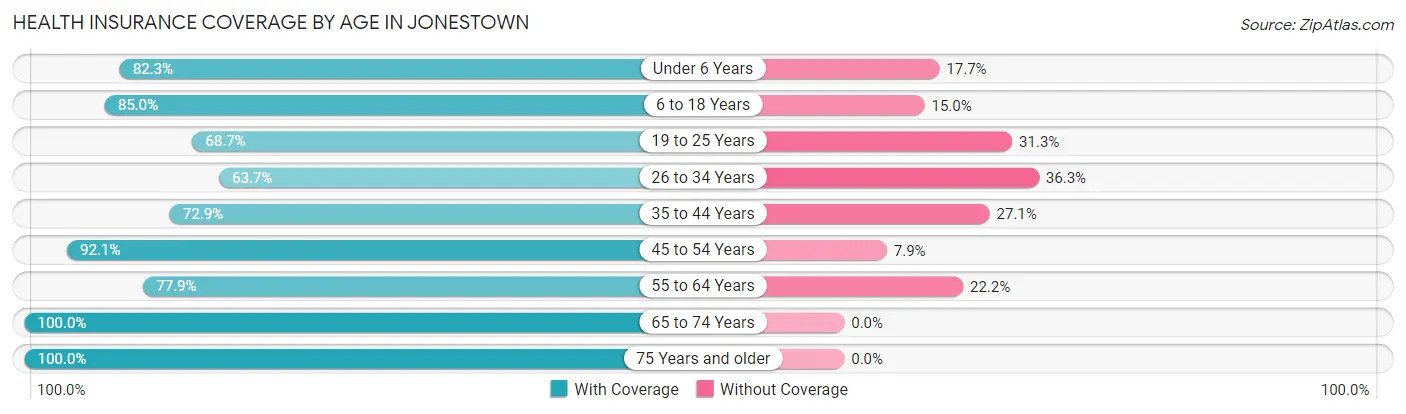
| Age Bracket | With Coverage | Without Coverage |
| Under 6 Years | 51 (82.3%) | 11 (17.7%) |
| 6 to 18 Years | 290 (85.0%) | 51 (15.0%) |
| 19 to 25 Years | 90 (68.7%) | 41 (31.3%) |
| 26 to 34 Years | 79 (63.7%) | 45 (36.3%) |
| 35 to 44 Years | 191 (72.9%) | 71 (27.1%) |
| 45 to 54 Years | 383 (92.1%) | 33 (7.9%) |
| 55 to 64 Years | 376 (77.8%) | 107 (22.2%) |
| 65 to 74 Years | 351 (100.0%) | 0 (0.0%) |
| 75 Years and older | 225 (100.0%) | 0 (0.0%) |
| Total | 2,036 (85.0%) | 359 (15.0%) |
Health Insurance Coverage by Citizenship Status in Jonestown
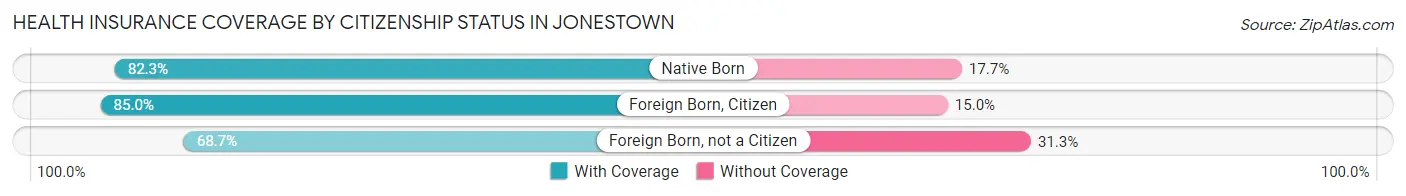
| Citizenship Status | With Coverage | Without Coverage |
| Native Born | 51 (82.3%) | 11 (17.7%) |
| Foreign Born, Citizen | 290 (85.0%) | 51 (15.0%) |
| Foreign Born, not a Citizen | 90 (68.7%) | 41 (31.3%) |
Health Insurance Coverage by Household Income in Jonestown
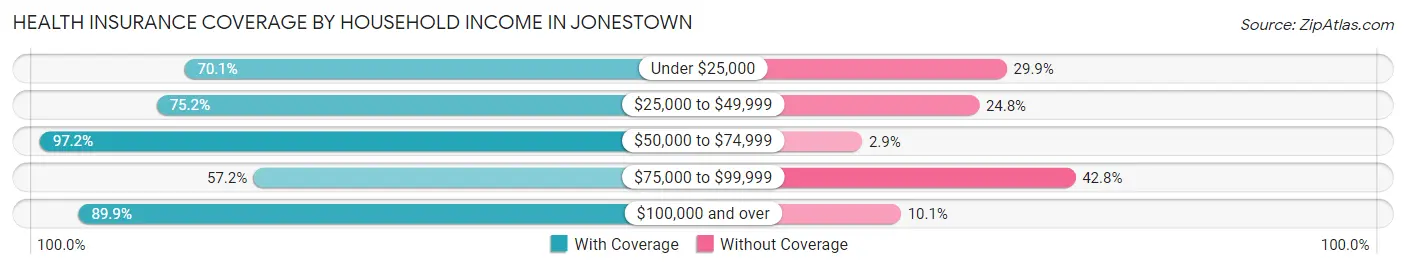
| Household Income | With Coverage | Without Coverage |
| Under $25,000 | 117 (70.1%) | 50 (29.9%) |
| $25,000 to $49,999 | 155 (75.2%) | 51 (24.8%) |
| $50,000 to $74,999 | 375 (97.2%) | 11 (2.9%) |
| $75,000 to $99,999 | 143 (57.2%) | 107 (42.8%) |
| $100,000 and over | 1,246 (89.9%) | 140 (10.1%) |
Public vs Private Health Insurance Coverage by Age in Jonestown
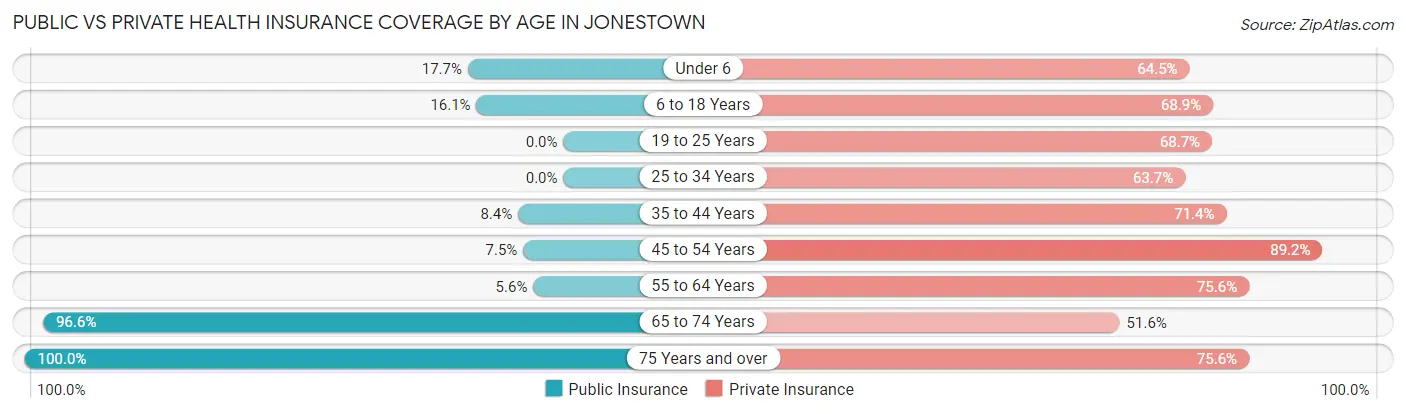
| Age Bracket | Public Insurance | Private Insurance |
| Under 6 | 11 (17.7%) | 40 (64.5%) |
| 6 to 18 Years | 55 (16.1%) | 235 (68.9%) |
| 19 to 25 Years | 0 (0.0%) | 90 (68.7%) |
| 25 to 34 Years | 0 (0.0%) | 79 (63.7%) |
| 35 to 44 Years | 22 (8.4%) | 187 (71.4%) |
| 45 to 54 Years | 31 (7.4%) | 371 (89.2%) |
| 55 to 64 Years | 27 (5.6%) | 365 (75.6%) |
| 65 to 74 Years | 339 (96.6%) | 181 (51.6%) |
| 75 Years and over | 225 (100.0%) | 170 (75.6%) |
| Total | 710 (29.6%) | 1,718 (71.7%) |
Disability Status by Sex by Age in Jonestown
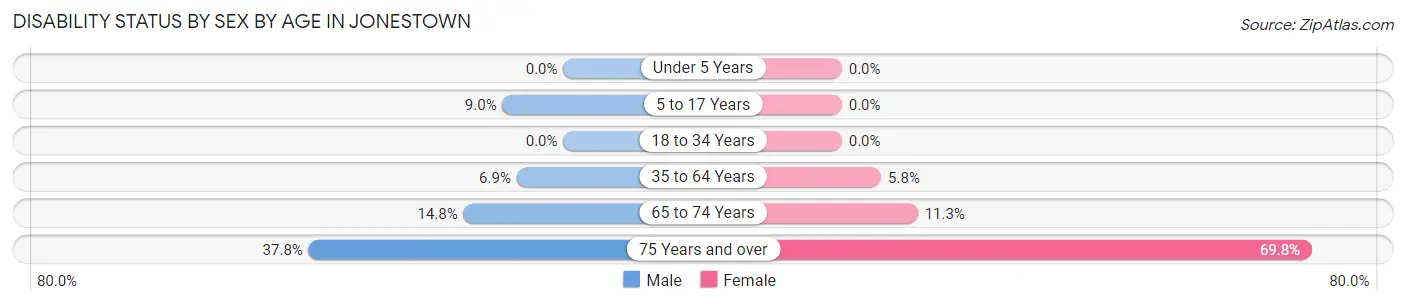
| Age Bracket | Male | Female |
| Under 5 Years | 0 (0.0%) | 0 (0.0%) |
| 5 to 17 Years | 17 (9.0%) | 0 (0.0%) |
| 18 to 34 Years | 0 (0.0%) | 0 (0.0%) |
| 35 to 64 Years | 40 (6.9%) | 34 (5.8%) |
| 65 to 74 Years | 31 (14.8%) | 16 (11.3%) |
| 75 Years and over | 45 (37.8%) | 74 (69.8%) |
Disability Class by Sex by Age in Jonestown
Disability Class: Hearing Difficulty
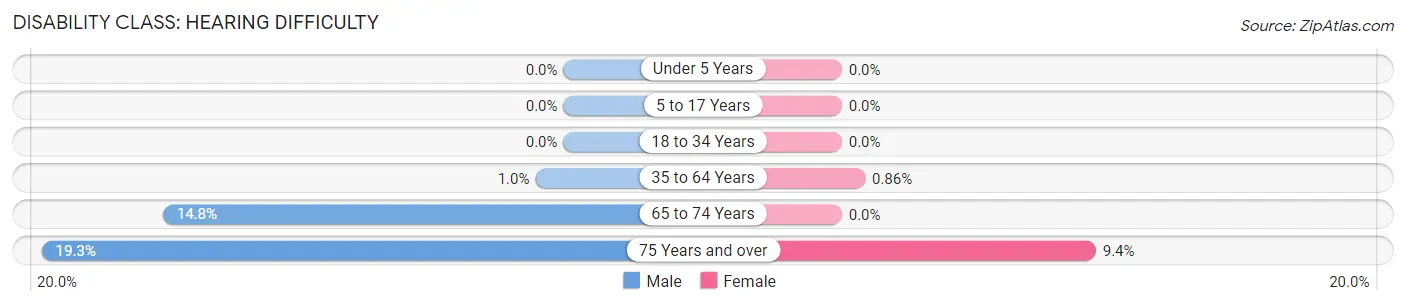
| Age Bracket | Male | Female |
| Under 5 Years | 0 (0.0%) | 0 (0.0%) |
| 5 to 17 Years | 0 (0.0%) | 0 (0.0%) |
| 18 to 34 Years | 0 (0.0%) | 0 (0.0%) |
| 35 to 64 Years | 6 (1.0%) | 5 (0.9%) |
| 65 to 74 Years | 31 (14.8%) | 0 (0.0%) |
| 75 Years and over | 23 (19.3%) | 10 (9.4%) |
Disability Class: Vision Difficulty
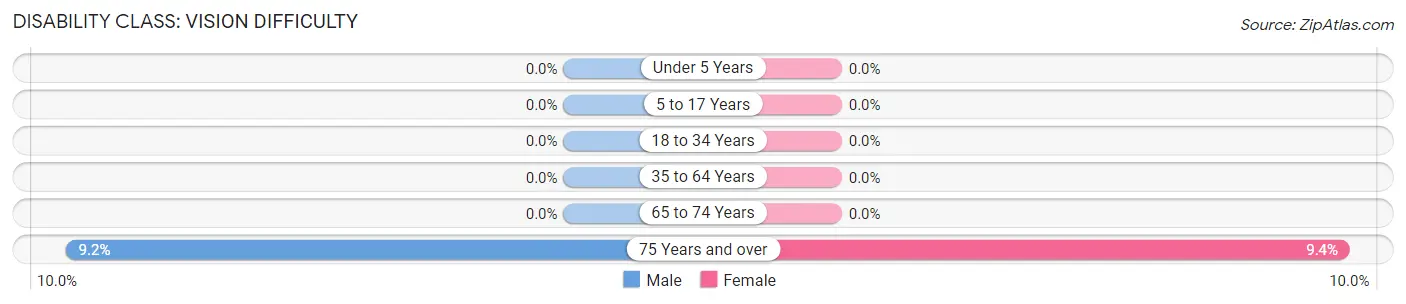
| Age Bracket | Male | Female |
| Under 5 Years | 0 (0.0%) | 0 (0.0%) |
| 5 to 17 Years | 0 (0.0%) | 0 (0.0%) |
| 18 to 34 Years | 0 (0.0%) | 0 (0.0%) |
| 35 to 64 Years | 0 (0.0%) | 0 (0.0%) |
| 65 to 74 Years | 0 (0.0%) | 0 (0.0%) |
| 75 Years and over | 11 (9.2%) | 10 (9.4%) |
Disability Class: Cognitive Difficulty
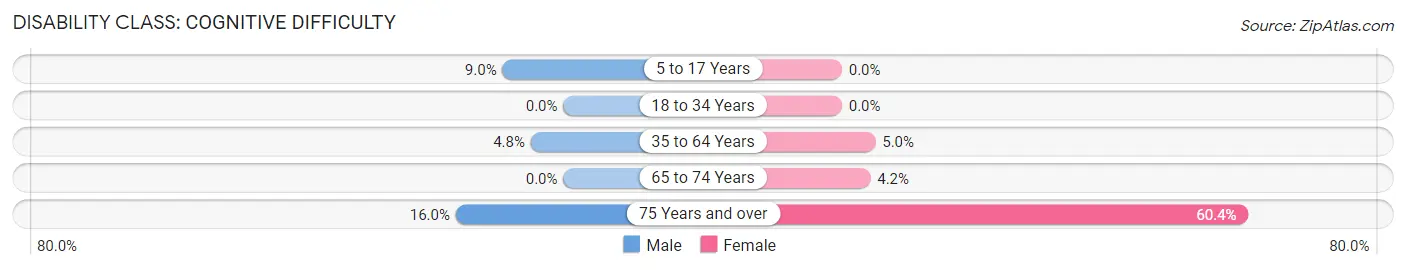
| Age Bracket | Male | Female |
| 5 to 17 Years | 17 (9.0%) | 0 (0.0%) |
| 18 to 34 Years | 0 (0.0%) | 0 (0.0%) |
| 35 to 64 Years | 28 (4.8%) | 29 (5.0%) |
| 65 to 74 Years | 0 (0.0%) | 6 (4.2%) |
| 75 Years and over | 19 (16.0%) | 64 (60.4%) |
Disability Class: Ambulatory Difficulty
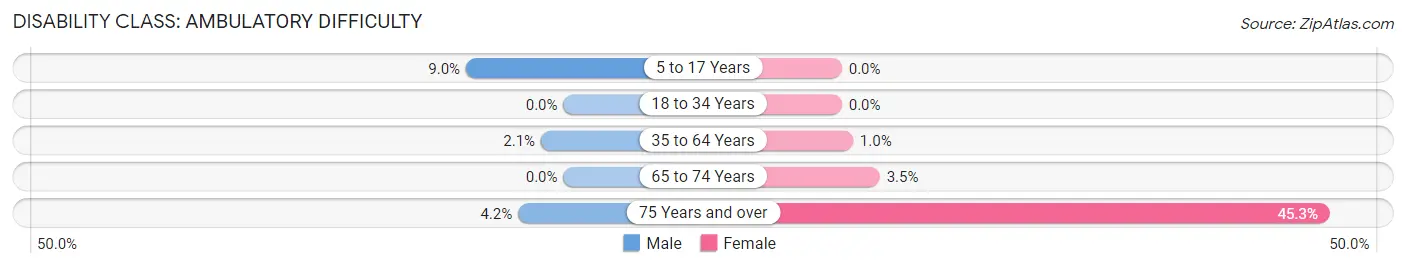
| Age Bracket | Male | Female |
| 5 to 17 Years | 17 (9.0%) | 0 (0.0%) |
| 18 to 34 Years | 0 (0.0%) | 0 (0.0%) |
| 35 to 64 Years | 12 (2.1%) | 6 (1.0%) |
| 65 to 74 Years | 0 (0.0%) | 5 (3.5%) |
| 75 Years and over | 5 (4.2%) | 48 (45.3%) |
Disability Class: Self-Care Difficulty
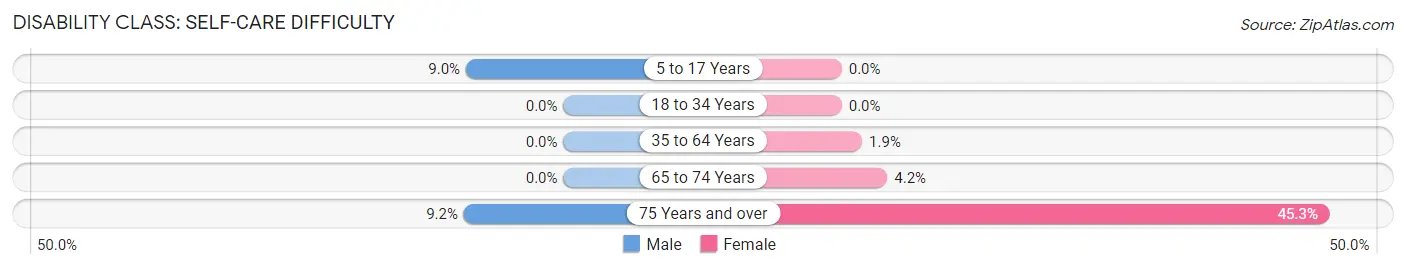
| Age Bracket | Male | Female |
| 5 to 17 Years | 17 (9.0%) | 0 (0.0%) |
| 18 to 34 Years | 0 (0.0%) | 0 (0.0%) |
| 35 to 64 Years | 0 (0.0%) | 11 (1.9%) |
| 65 to 74 Years | 0 (0.0%) | 6 (4.2%) |
| 75 Years and over | 11 (9.2%) | 48 (45.3%) |
Technology Access in Jonestown
Computing Device Access in Jonestown
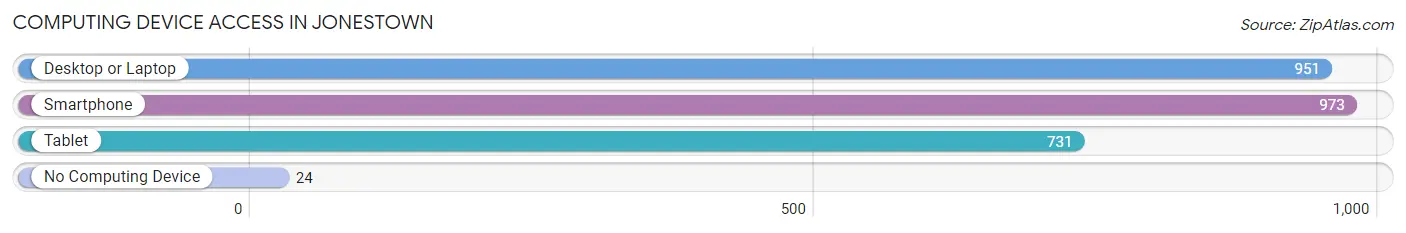
| Device Type | # Households | % Households |
| Desktop or Laptop | 951 | 91.9% |
| Smartphone | 973 | 94.0% |
| Tablet | 731 | 70.6% |
| No Computing Device | 24 | 2.3% |
| Total | 1,035 | 100.0% |
Internet Access in Jonestown
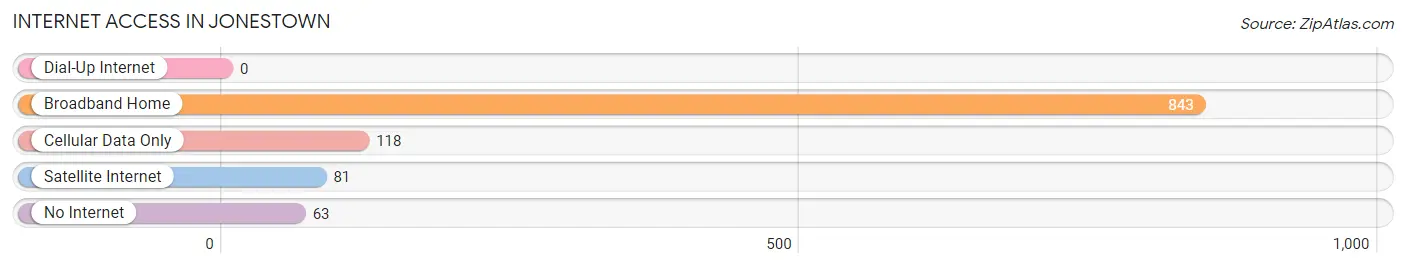
| Internet Type | # Households | % Households |
| Dial-Up Internet | 0 | 0.0% |
| Broadband Home | 843 | 81.5% |
| Cellular Data Only | 118 | 11.4% |
| Satellite Internet | 81 | 7.8% |
| No Internet | 63 | 6.1% |
| Total | 1,035 | 100.0% |
Jonestown Summary
Jonestown, Texas is a small town located in Travis County, Texas, United States. It is situated on the north shore of Lake Travis, about 25 miles northwest of Austin. The population of Jonestown was 1,256 at the 2010 census.
History
Jonestown was founded in 1854 by John Jones, a settler from Tennessee. He named the town after himself and it quickly became a popular destination for settlers. The town was incorporated in 1876 and was the first town in Travis County to have a post office.
In the early 1900s, the town was a popular tourist destination due to its proximity to Lake Travis. The lake was a popular spot for swimming, fishing, and boating. The town also had a number of businesses, including a hotel, a general store, and a blacksmith shop.
In the 1950s, the town began to decline as the population shifted to larger cities. The town was almost abandoned by the 1970s, but it was revitalized in the 1980s when the population began to grow again.
Geography
Jonestown is located at 30°32'25" North, 97°56'45" West (30.540278, -97.945556). It is situated on the north shore of Lake Travis, about 25 miles northwest of Austin. The town is located in the Hill Country region of Texas and is surrounded by rolling hills and wooded areas.
The climate in Jonestown is generally mild, with hot summers and cool winters. The average temperature in the summer is around 90°F and the average temperature in the winter is around 50°F.
Economy
The economy of Jonestown is largely based on tourism. The town is a popular destination for visitors who come to enjoy the lake and the surrounding area. There are a number of businesses in the town, including restaurants, hotels, and shops.
The town is also home to a number of small businesses, including a winery, a brewery, and a distillery. The town is also home to a number of artists and artisans who sell their work in the local shops.
Demographics
As of the 2010 census, the population of Jonestown was 1,256. The racial makeup of the town was 94.3% White, 0.8% African American, 0.2% Native American, 0.7% Asian, 0.1% Pacific Islander, 2.2% from other races, and 1.7% from two or more races. Hispanic or Latino of any race were 5.2% of the population.
The median income for a household in the town was $50,000 and the median income for a family was $54,000. The per capita income for the town was $22,000. About 8.3% of families and 10.2% of the population were below the poverty line, including 14.3% of those under age 18 and 6.3% of those age 65 or over.
Common Questions
What is Per Capita Income in Jonestown?
Per Capita income in Jonestown is $73,287.
What is the Median Family Income in Jonestown?
Median Family Income in Jonestown is $144,167.
What is the Median Household income in Jonestown?
Median Household Income in Jonestown is $112,841.
What is Income or Wage Gap in Jonestown?
Income or Wage Gap in Jonestown is 43.7%.
Women in Jonestown earn 56.3 cents for every dollar earned by a man.
What is Family Income Deficit in Jonestown?
Family Income Deficit in Jonestown is $18,400.
Families that are below poverty line in Jonestown earn $18,400 less on average than the poverty threshold level.
What is Inequality or Gini Index in Jonestown?
Inequality or Gini Index in Jonestown is 0.49.
What is the Total Population of Jonestown?
Total Population of Jonestown is 2,395.
What is the Total Male Population of Jonestown?
Total Male Population of Jonestown is 1,271.
What is the Total Female Population of Jonestown?
Total Female Population of Jonestown is 1,124.
What is the Ratio of Males per 100 Females in Jonestown?
There are 113.08 Males per 100 Females in Jonestown.
What is the Ratio of Females per 100 Males in Jonestown?
There are 88.43 Females per 100 Males in Jonestown.
What is the Median Population Age in Jonestown?
Median Population Age in Jonestown is 52.0 Years.
What is the Average Family Size in Jonestown
Average Family Size in Jonestown is 2.6 People.
What is the Average Household Size in Jonestown
Average Household Size in Jonestown is 2.3 People.
How Large is the Labor Force in Jonestown?
There are 1,221 People in the Labor Forcein in Jonestown.
What is the Percentage of People in the Labor Force in Jonestown?
59.4% of People are in the Labor Force in Jonestown.
What is the Unemployment Rate in Jonestown?
Unemployment Rate in Jonestown is 4.0%.