Ingleside, TX Map & Demographics
Ingleside Map
Ingleside Overview
$32,271
PER CAPITA INCOME
$77,706
AVG FAMILY INCOME
$73,191
AVG HOUSEHOLD INCOME
35.6%
WAGE / INCOME GAP [ % ]
64.4¢/ $1
WAGE / INCOME GAP [ $ ]
0.39
INEQUALITY / GINI INDEX
9,713
TOTAL POPULATION
5,050
MALE POPULATION
4,663
FEMALE POPULATION
108.30
MALES / 100 FEMALES
92.34
FEMALES / 100 MALES
36.9
MEDIAN AGE
3.3
AVG FAMILY SIZE
2.8
AVG HOUSEHOLD SIZE
4,916
LABOR FORCE [ PEOPLE ]
66.2%
PERCENT IN LABOR FORCE
1.7%
UNEMPLOYMENT RATE
Ingleside Zip Codes
Ingleside Area Codes
Income in Ingleside
Income Overview in Ingleside
Per Capita Income in Ingleside is $32,271, while median incomes of families and households are $77,706 and $73,191 respectively.
| Characteristic | Number | Measure |
| Per Capita Income | 9,713 | $32,271 |
| Median Family Income | 2,345 | $77,706 |
| Mean Family Income | 2,345 | $91,118 |
| Median Household Income | 3,480 | $73,191 |
| Mean Household Income | 3,480 | $87,274 |
| Income Deficit | 2,345 | $0 |
| Wage / Income Gap (%) | 9,713 | 35.61% |
| Wage / Income Gap ($) | 9,713 | 64.39¢ per $1 |
| Gini / Inequality Index | 9,713 | 0.39 |
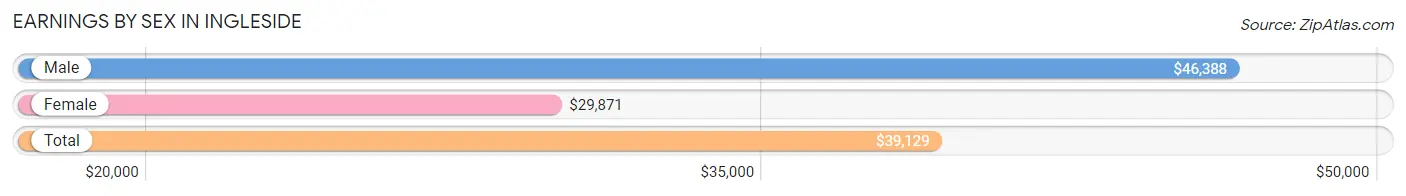
Earnings by Sex in Ingleside
Average Earnings in Ingleside are $39,129, $46,388 for men and $29,871 for women, a difference of 35.6%.
| Sex | Number | Average Earnings |
| Male | 2,887 (57.0%) | $46,388 |
| Female | 2,174 (43.0%) | $29,871 |
| Total | 5,061 (100.0%) | $39,129 |
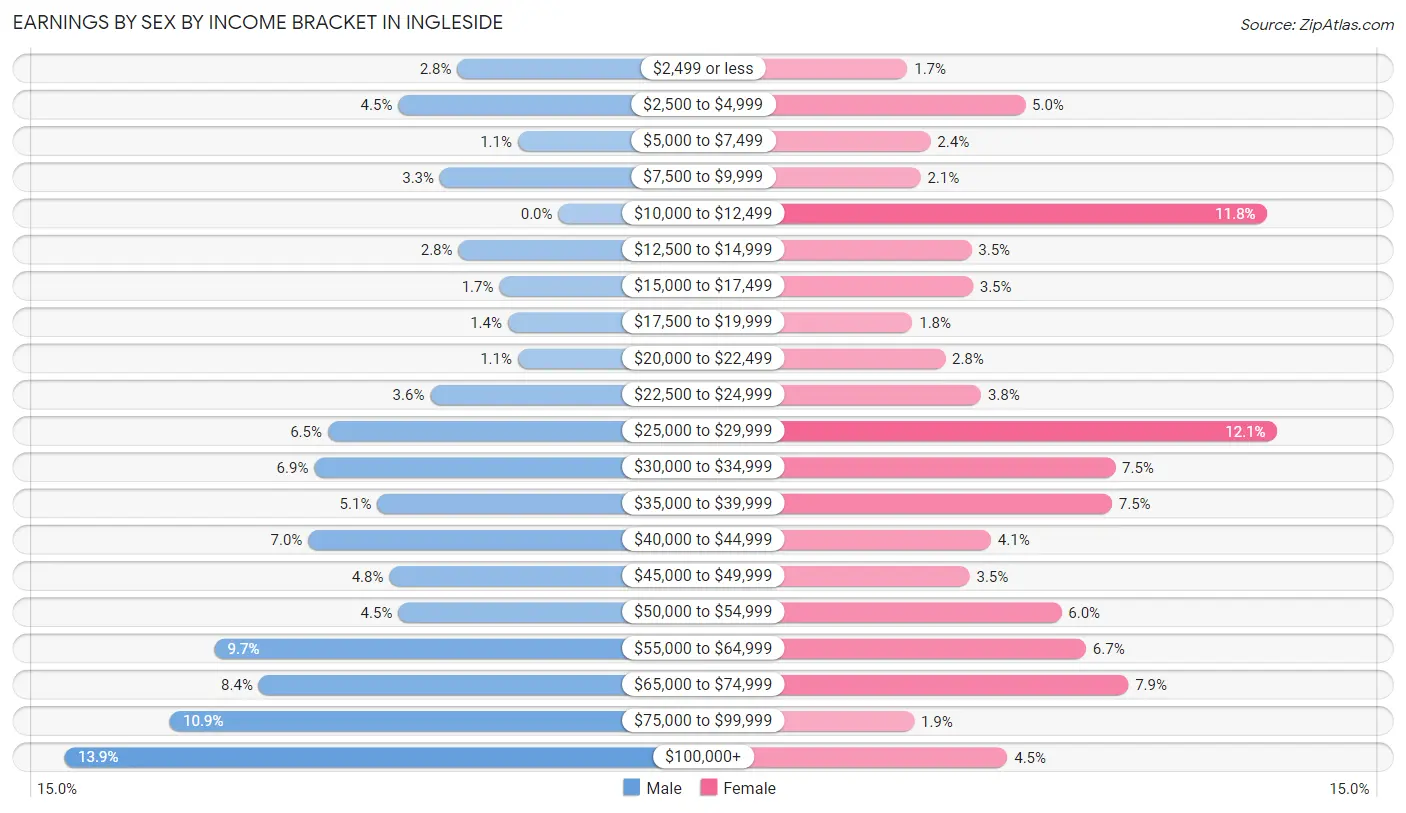
Earnings by Sex by Income Bracket in Ingleside
The most common earnings brackets in Ingleside are $100,000+ for men (400 | 13.9%) and $25,000 to $29,999 for women (263 | 12.1%).
| Income | Male | Female |
| $2,499 or less | 82 (2.8%) | 37 (1.7%) |
| $2,500 to $4,999 | 130 (4.5%) | 109 (5.0%) |
| $5,000 to $7,499 | 33 (1.1%) | 51 (2.4%) |
| $7,500 to $9,999 | 96 (3.3%) | 45 (2.1%) |
| $10,000 to $12,499 | 0 (0.0%) | 257 (11.8%) |
| $12,500 to $14,999 | 81 (2.8%) | 76 (3.5%) |
| $15,000 to $17,499 | 48 (1.7%) | 77 (3.5%) |
| $17,500 to $19,999 | 41 (1.4%) | 40 (1.8%) |
| $20,000 to $22,499 | 33 (1.1%) | 60 (2.8%) |
| $22,500 to $24,999 | 104 (3.6%) | 82 (3.8%) |
| $25,000 to $29,999 | 187 (6.5%) | 263 (12.1%) |
| $30,000 to $34,999 | 198 (6.9%) | 164 (7.5%) |
| $35,000 to $39,999 | 147 (5.1%) | 162 (7.4%) |
| $40,000 to $44,999 | 203 (7.0%) | 88 (4.1%) |
| $45,000 to $49,999 | 137 (4.8%) | 75 (3.5%) |
| $50,000 to $54,999 | 130 (4.5%) | 131 (6.0%) |
| $55,000 to $64,999 | 279 (9.7%) | 146 (6.7%) |
| $65,000 to $74,999 | 243 (8.4%) | 172 (7.9%) |
| $75,000 to $99,999 | 315 (10.9%) | 41 (1.9%) |
| $100,000+ | 400 (13.9%) | 98 (4.5%) |
| Total | 2,887 (100.0%) | 2,174 (100.0%) |
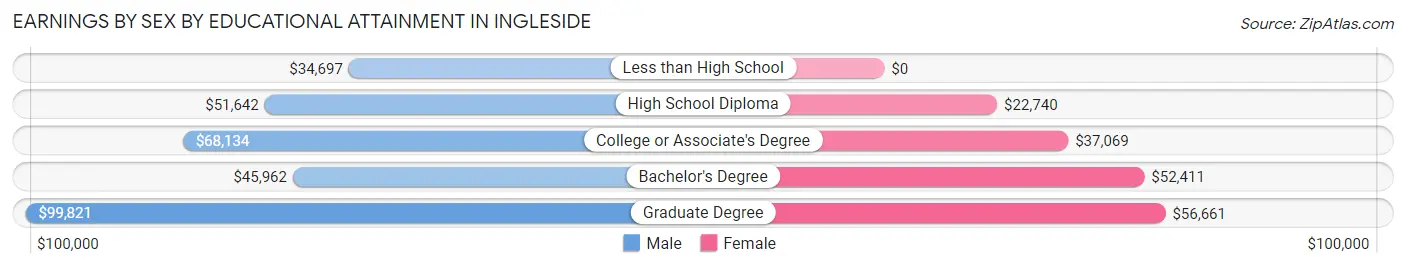
Earnings by Sex by Educational Attainment in Ingleside
Average earnings in Ingleside are $52,975 for men and $32,917 for women, a difference of 37.9%. Men with an educational attainment of graduate degree enjoy the highest average annual earnings of $99,821, while those with less than high school education earn the least with $34,697. Women with an educational attainment of graduate degree earn the most with the average annual earnings of $56,661, while those with high school diploma education have the smallest earnings of $22,740.
| Educational Attainment | Male Income | Female Income |
| Less than High School | $34,697 | $0 |
| High School Diploma | $51,642 | $22,740 |
| College or Associate's Degree | $68,134 | $37,069 |
| Bachelor's Degree | $45,962 | $52,411 |
| Graduate Degree | $99,821 | $56,661 |
| Total | $52,975 | $32,917 |
Family Income in Ingleside
Family Income Brackets in Ingleside
According to the Ingleside family income data, there are 509 families falling into the $100,000 to $149,999 income range, which is the most common income bracket and makes up 21.7% of all families.
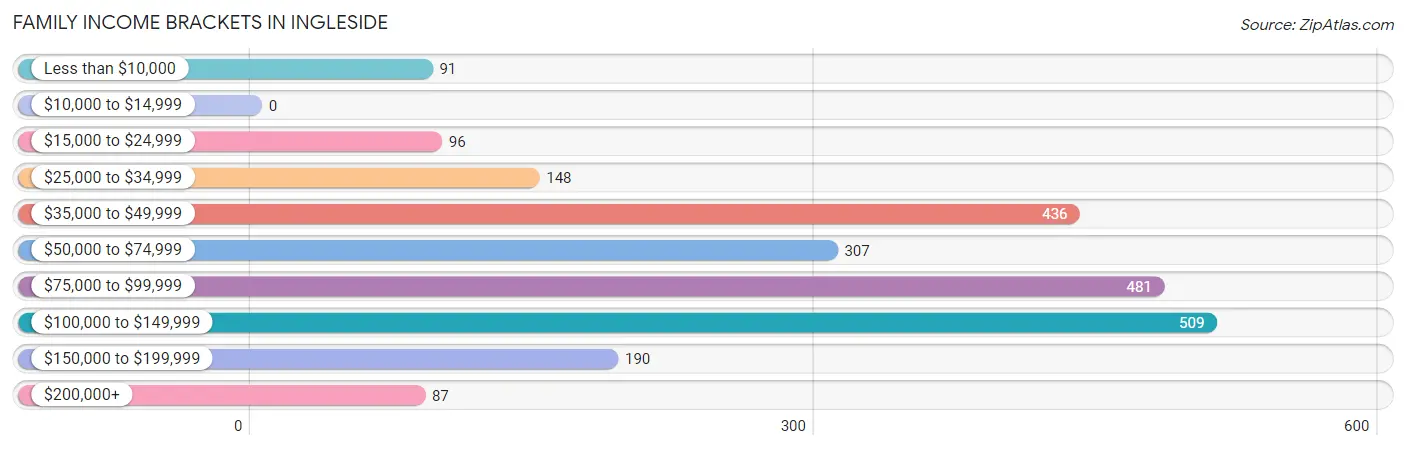
| Income Bracket | # Families | % Families |
| Less than $10,000 | 91 | 3.9% |
| $10,000 to $14,999 | 0 | 0.0% |
| $15,000 to $24,999 | 96 | 4.1% |
| $25,000 to $34,999 | 148 | 6.3% |
| $35,000 to $49,999 | 436 | 18.6% |
| $50,000 to $74,999 | 307 | 13.1% |
| $75,000 to $99,999 | 481 | 20.5% |
| $100,000 to $149,999 | 509 | 21.7% |
| $150,000 to $199,999 | 190 | 8.1% |
| $200,000+ | 87 | 3.7% |
Family Income by Famaliy Size in Ingleside
3-person families (355 | 15.1%) account for the highest median family income in Ingleside with $98,675 per family, while 2-person families (1,037 | 44.2%) have the highest median income of $39,872 per family member.
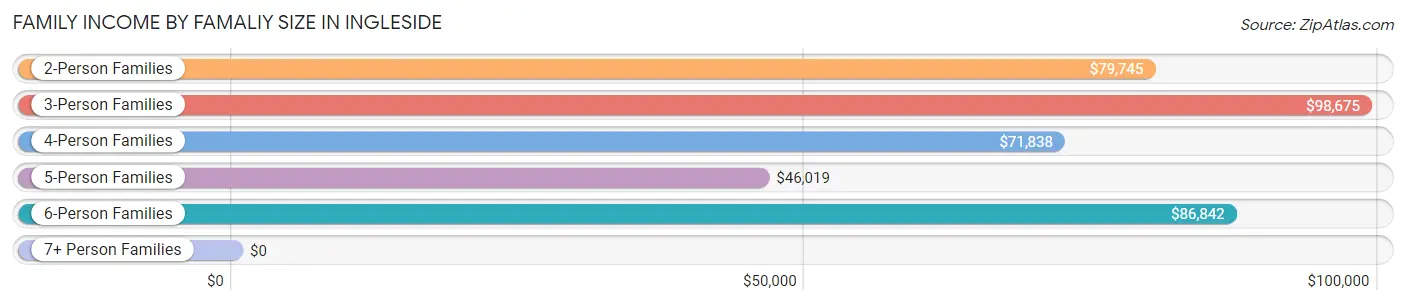
| Income Bracket | # Families | Median Income |
| 2-Person Families | 1,037 (44.2%) | $79,745 |
| 3-Person Families | 355 (15.1%) | $98,675 |
| 4-Person Families | 601 (25.6%) | $71,838 |
| 5-Person Families | 184 (7.9%) | $46,019 |
| 6-Person Families | 100 (4.3%) | $86,842 |
| 7+ Person Families | 68 (2.9%) | $0 |
| Total | 2,345 (100.0%) | $77,706 |
Family Income by Number of Earners in Ingleside
The median family income in Ingleside is $77,706, with families comprising 2 earners (1,138) having the highest median family income of $99,150, while families with no earners (168) have the lowest median family income of $41,538, accounting for 48.5% and 7.2% of families, respectively.
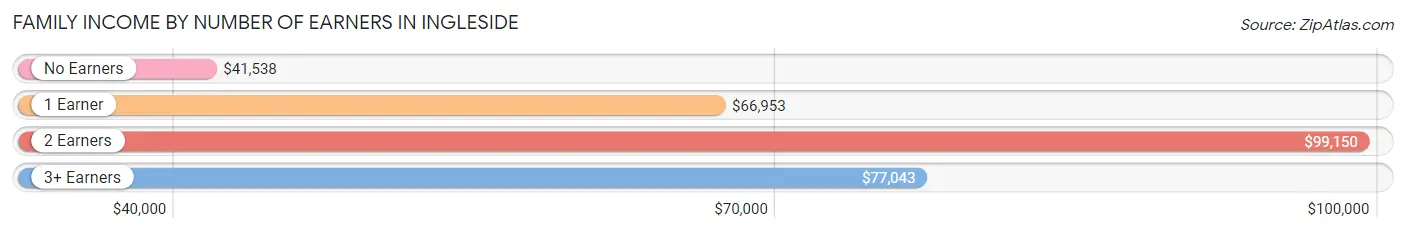
| Number of Earners | # Families | Median Income |
| No Earners | 168 (7.2%) | $41,538 |
| 1 Earner | 860 (36.7%) | $66,953 |
| 2 Earners | 1,138 (48.5%) | $99,150 |
| 3+ Earners | 179 (7.6%) | $77,043 |
| Total | 2,345 (100.0%) | $77,706 |
Household Income in Ingleside
Household Income Brackets in Ingleside
With 727 households falling in the category, the $100,000 to $149,999 income range is the most frequent in Ingleside, accounting for 20.9% of all households. In contrast, only 56 households (1.6%) fall into the $10,000 to $14,999 income bracket, making it the least populous group.
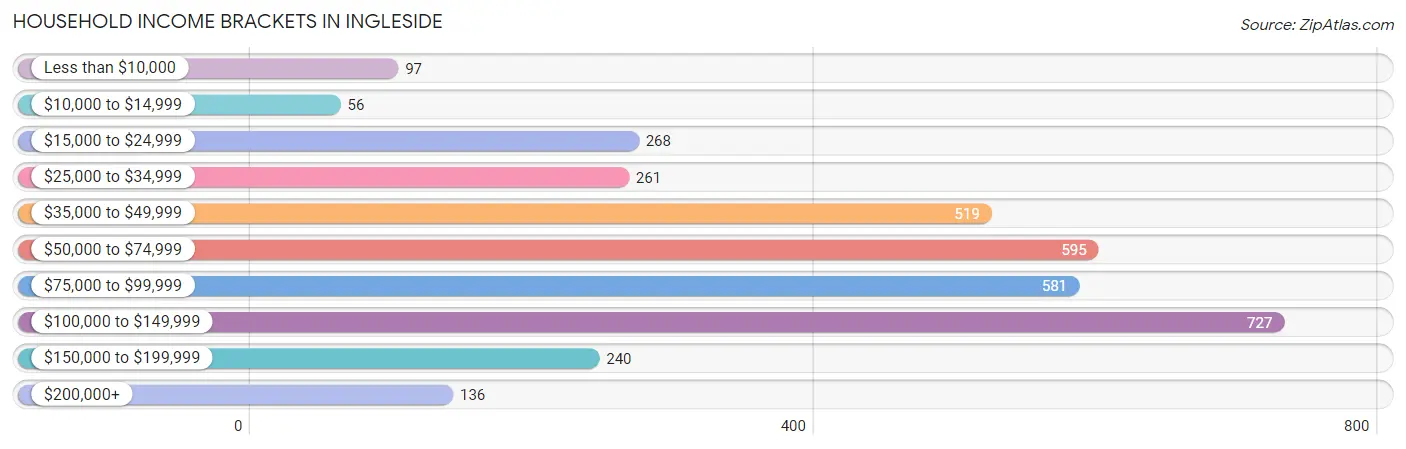
| Income Bracket | # Households | % Households |
| Less than $10,000 | 97 | 2.8% |
| $10,000 to $14,999 | 56 | 1.6% |
| $15,000 to $24,999 | 268 | 7.7% |
| $25,000 to $34,999 | 261 | 7.5% |
| $35,000 to $49,999 | 519 | 14.9% |
| $50,000 to $74,999 | 595 | 17.1% |
| $75,000 to $99,999 | 581 | 16.7% |
| $100,000 to $149,999 | 727 | 20.9% |
| $150,000 to $199,999 | 240 | 6.9% |
| $200,000+ | 136 | 3.9% |
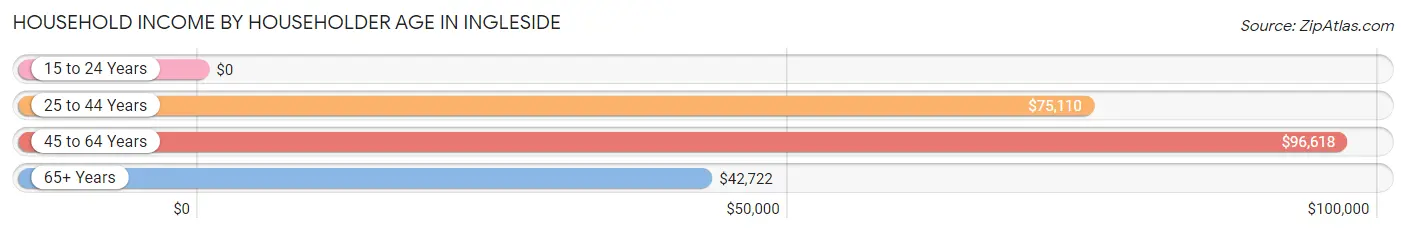
Household Income by Householder Age in Ingleside
The median household income in Ingleside is $73,191, with the highest median household income of $96,618 found in the 45 to 64 years age bracket for the primary householder. A total of 1,258 households (36.1%) fall into this category. Meanwhile, the 15 to 24 years age bracket for the primary householder has the lowest median household income of $0, with 110 households (3.2%) in this group.
| Income Bracket | # Households | Median Income |
| 15 to 24 Years | 110 (3.2%) | $0 |
| 25 to 44 Years | 1,350 (38.8%) | $75,110 |
| 45 to 64 Years | 1,258 (36.1%) | $96,618 |
| 65+ Years | 762 (21.9%) | $42,722 |
| Total | 3,480 (100.0%) | $73,191 |
Poverty in Ingleside
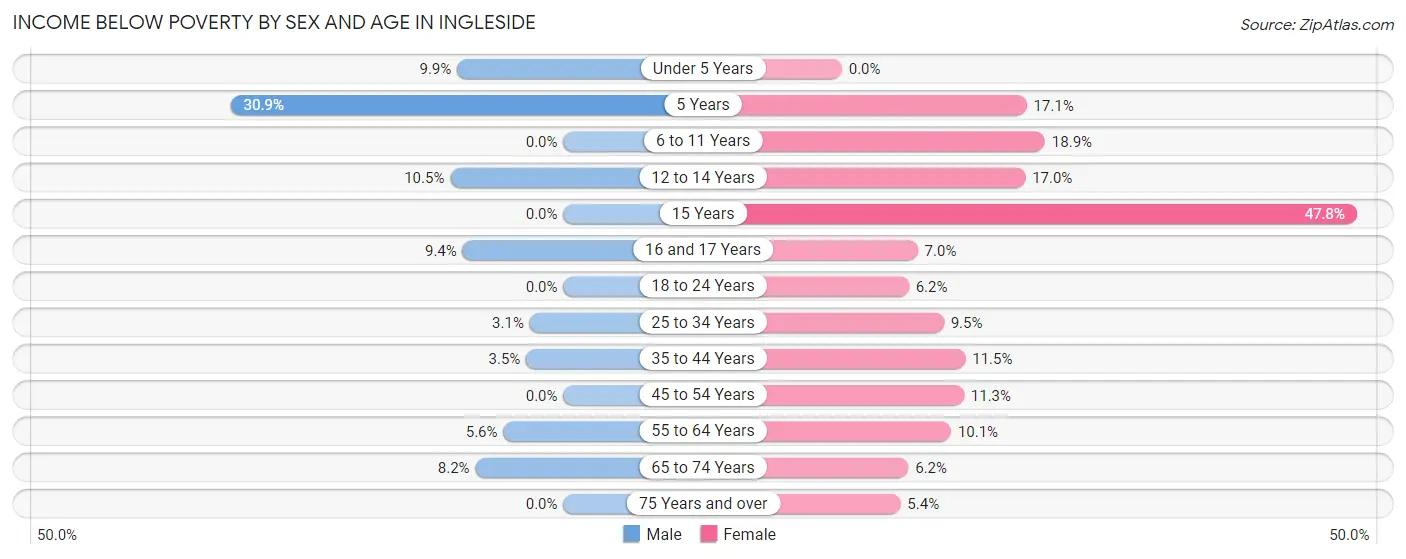
Income Below Poverty by Sex and Age in Ingleside
With 4.1% poverty level for males and 11.6% for females among the residents of Ingleside, 5 year old males and 15 year old females are the most vulnerable to poverty, with 21 males (30.9%) and 54 females (47.8%) in their respective age groups living below the poverty level.
| Age Bracket | Male | Female |
| Under 5 Years | 28 (9.9%) | 0 (0.0%) |
| 5 Years | 21 (30.9%) | 12 (17.1%) |
| 6 to 11 Years | 0 (0.0%) | 69 (18.9%) |
| 12 to 14 Years | 38 (10.5%) | 80 (17.0%) |
| 15 Years | 0 (0.0%) | 54 (47.8%) |
| 16 and 17 Years | 13 (9.3%) | 10 (7.0%) |
| 18 to 24 Years | 0 (0.0%) | 19 (6.2%) |
| 25 to 34 Years | 17 (3.1%) | 60 (9.5%) |
| 35 to 44 Years | 30 (3.5%) | 81 (11.5%) |
| 45 to 54 Years | 0 (0.0%) | 69 (11.3%) |
| 55 to 64 Years | 34 (5.6%) | 40 (10.1%) |
| 65 to 74 Years | 24 (8.2%) | 32 (6.2%) |
| 75 Years and over | 0 (0.0%) | 8 (5.4%) |
| Total | 205 (4.1%) | 534 (11.6%) |
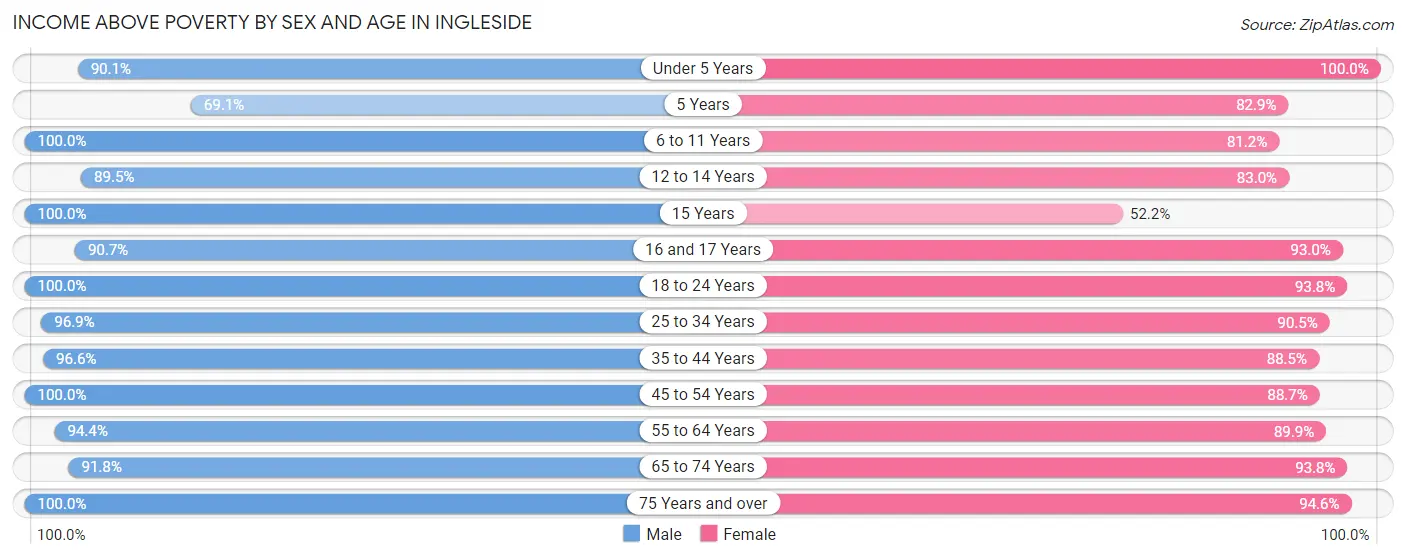
Income Above Poverty by Sex and Age in Ingleside
According to the poverty statistics in Ingleside, males aged 6 to 11 years and females aged under 5 years are the age groups that are most secure financially, with 100.0% of males and 100.0% of females in these age groups living above the poverty line.
| Age Bracket | Male | Female |
| Under 5 Years | 256 (90.1%) | 133 (100.0%) |
| 5 Years | 47 (69.1%) | 58 (82.9%) |
| 6 to 11 Years | 334 (100.0%) | 297 (81.1%) |
| 12 to 14 Years | 324 (89.5%) | 390 (83.0%) |
| 15 Years | 72 (100.0%) | 59 (52.2%) |
| 16 and 17 Years | 126 (90.6%) | 132 (93.0%) |
| 18 to 24 Years | 489 (100.0%) | 287 (93.8%) |
| 25 to 34 Years | 528 (96.9%) | 574 (90.5%) |
| 35 to 44 Years | 839 (96.6%) | 626 (88.5%) |
| 45 to 54 Years | 638 (100.0%) | 540 (88.7%) |
| 55 to 64 Years | 576 (94.4%) | 355 (89.9%) |
| 65 to 74 Years | 270 (91.8%) | 487 (93.8%) |
| 75 Years and over | 270 (100.0%) | 139 (94.6%) |
| Total | 4,769 (95.9%) | 4,077 (88.4%) |
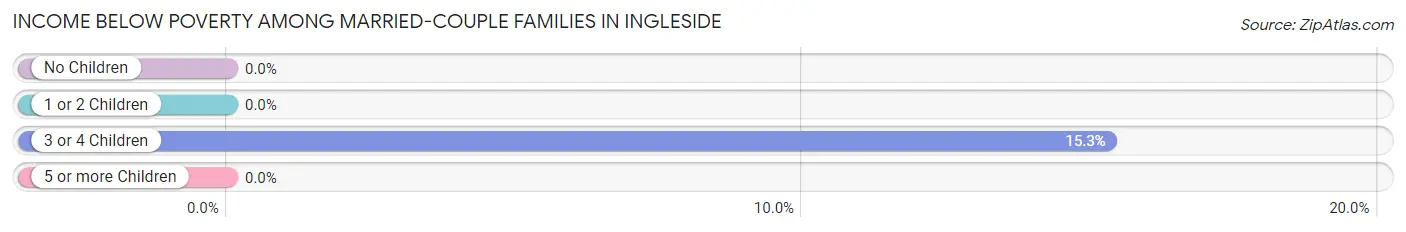
Income Below Poverty Among Married-Couple Families in Ingleside
The poverty statistics for married-couple families in Ingleside show that 1.8% or 30 of the total 1,685 families live below the poverty line. Families with 3 or 4 children have the highest poverty rate of 15.3%, comprising of 30 families. On the other hand, families with no children have the lowest poverty rate of 0.0%, which includes 0 families.
| Children | Above Poverty | Below Poverty |
| No Children | 875 (100.0%) | 0 (0.0%) |
| 1 or 2 Children | 572 (100.0%) | 0 (0.0%) |
| 3 or 4 Children | 166 (84.7%) | 30 (15.3%) |
| 5 or more Children | 42 (100.0%) | 0 (0.0%) |
| Total | 1,655 (98.2%) | 30 (1.8%) |
Income Below Poverty Among Single-Parent Households in Ingleside
According to the poverty data in Ingleside, 8.5% or 17 single-father households and 21.9% or 101 single-mother households are living below the poverty line. Among single-father households, those with 1 or 2 children have the highest poverty rate, with 17 households (18.7%) experiencing poverty. Likewise, among single-mother households, those with 3 or 4 children have the highest poverty rate, with 39 households (75.0%) falling below the poverty line.
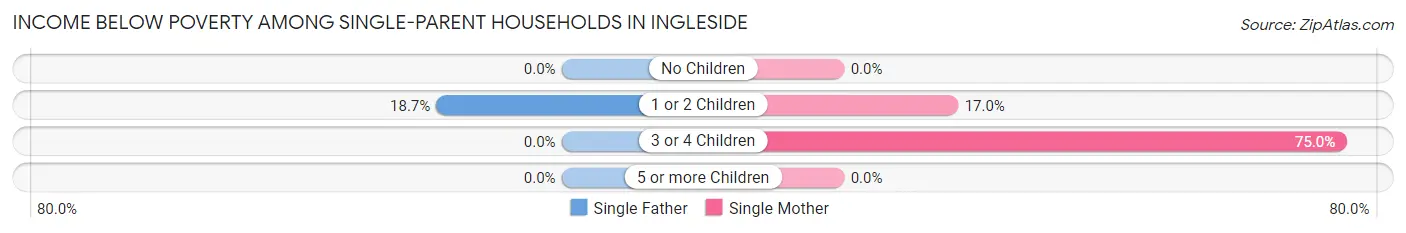
| Children | Single Father | Single Mother |
| No Children | 0 (0.0%) | 0 (0.0%) |
| 1 or 2 Children | 17 (18.7%) | 62 (17.0%) |
| 3 or 4 Children | 0 (0.0%) | 39 (75.0%) |
| 5 or more Children | 0 (0.0%) | 0 (0.0%) |
| Total | 17 (8.5%) | 101 (21.9%) |
Income Below Poverty Among Married-Couple vs Single-Parent Households in Ingleside
The poverty data for Ingleside shows that 30 of the married-couple family households (1.8%) and 118 of the single-parent households (17.9%) are living below the poverty level. Within the married-couple family households, those with 3 or 4 children have the highest poverty rate, with 30 households (15.3%) falling below the poverty line. Among the single-parent households, those with 3 or 4 children have the highest poverty rate, with 39 household (75.0%) living below poverty.
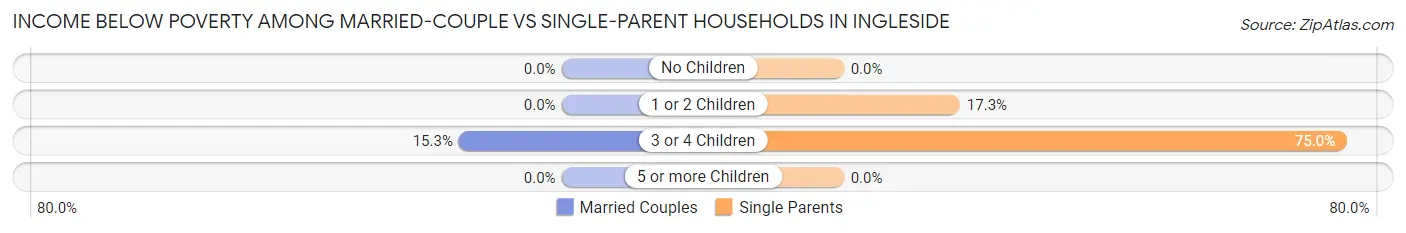
| Children | Married-Couple Families | Single-Parent Households |
| No Children | 0 (0.0%) | 0 (0.0%) |
| 1 or 2 Children | 0 (0.0%) | 79 (17.3%) |
| 3 or 4 Children | 30 (15.3%) | 39 (75.0%) |
| 5 or more Children | 0 (0.0%) | 0 (0.0%) |
| Total | 30 (1.8%) | 118 (17.9%) |
Race in Ingleside
The most populous races in Ingleside are White / Caucasian (7,958 | 81.9%), Hispanic or Latino (4,396 | 45.3%), and Two or more Races (1,248 | 12.9%).
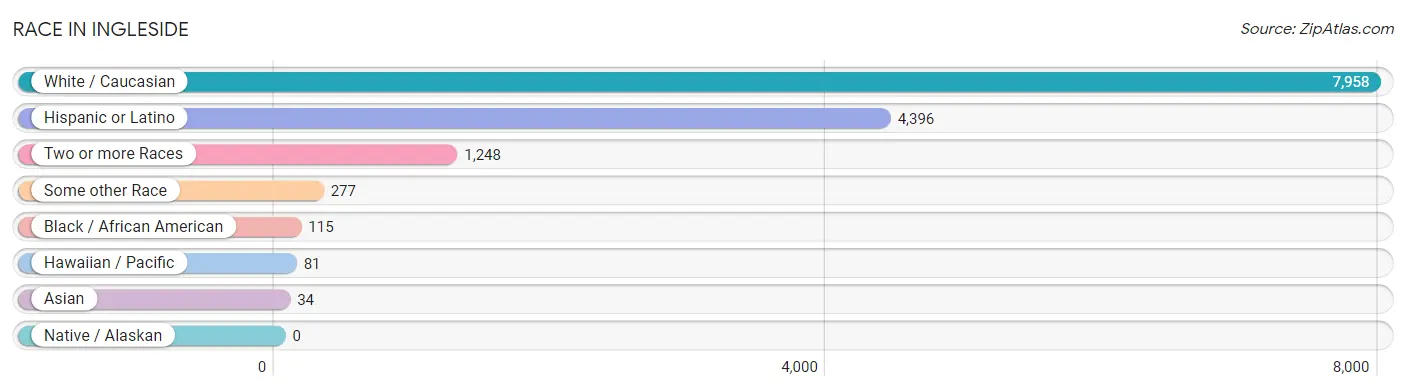
| Race | # Population | % Population |
| Asian | 34 | 0.4% |
| Black / African American | 115 | 1.2% |
| Hawaiian / Pacific | 81 | 0.8% |
| Hispanic or Latino | 4,396 | 45.3% |
| Native / Alaskan | 0 | 0.0% |
| White / Caucasian | 7,958 | 81.9% |
| Two or more Races | 1,248 | 12.9% |
| Some other Race | 277 | 2.9% |
| Total | 9,713 | 100.0% |
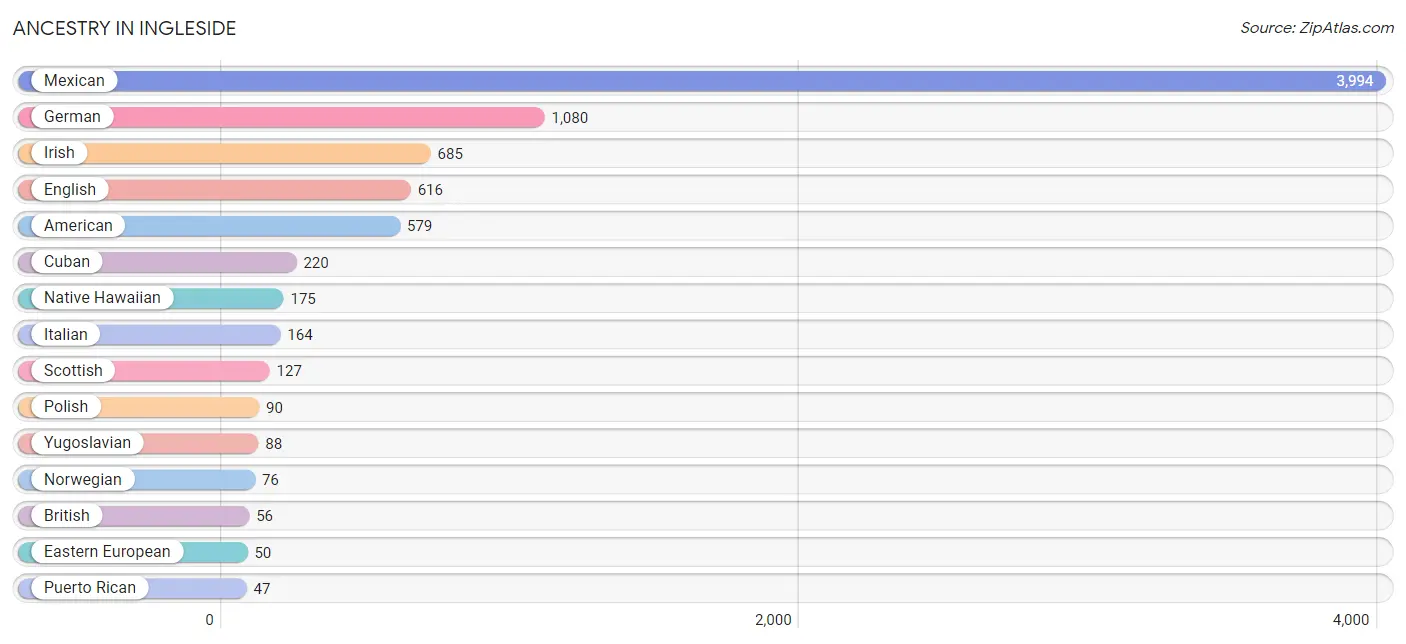
Ancestry in Ingleside
The most populous ancestries reported in Ingleside are Mexican (3,994 | 41.1%), German (1,080 | 11.1%), Irish (685 | 7.0%), English (616 | 6.3%), and American (579 | 6.0%), together accounting for 71.6% of all Ingleside residents.
| Ancestry | # Population | % Population |
| American | 579 | 6.0% |
| Arab | 21 | 0.2% |
| Austrian | 6 | 0.1% |
| Belgian | 11 | 0.1% |
| British | 56 | 0.6% |
| Burmese | 17 | 0.2% |
| Cherokee | 14 | 0.1% |
| Creek | 4 | 0.0% |
| Croatian | 13 | 0.1% |
| Cuban | 220 | 2.3% |
| Czech | 27 | 0.3% |
| Danish | 7 | 0.1% |
| Dutch | 8 | 0.1% |
| Eastern European | 50 | 0.5% |
| English | 616 | 6.3% |
| European | 2 | 0.0% |
| Finnish | 8 | 0.1% |
| French | 30 | 0.3% |
| French Canadian | 7 | 0.1% |
| German | 1,080 | 11.1% |
| Hungarian | 7 | 0.1% |
| Indian (Asian) | 18 | 0.2% |
| Irish | 685 | 7.0% |
| Italian | 164 | 1.7% |
| Korean | 13 | 0.1% |
| Lebanese | 21 | 0.2% |
| Mexican | 3,994 | 41.1% |
| Native Hawaiian | 175 | 1.8% |
| Norwegian | 76 | 0.8% |
| Pakistani | 9 | 0.1% |
| Polish | 90 | 0.9% |
| Puerto Rican | 47 | 0.5% |
| Romanian | 31 | 0.3% |
| Russian | 20 | 0.2% |
| Scandinavian | 8 | 0.1% |
| Scotch-Irish | 42 | 0.4% |
| Scottish | 127 | 1.3% |
| Spaniard | 42 | 0.4% |
| Spanish | 13 | 0.1% |
| Yugoslavian | 88 | 0.9% | View All 40 Rows |
Immigrants in Ingleside
The most numerous immigrant groups reported in Ingleside came from Latin America (687 | 7.1%), Central America (547 | 5.6%), Mexico (547 | 5.6%), Caribbean (140 | 1.4%), and Cuba (140 | 1.4%), together accounting for 21.2% of all Ingleside residents.
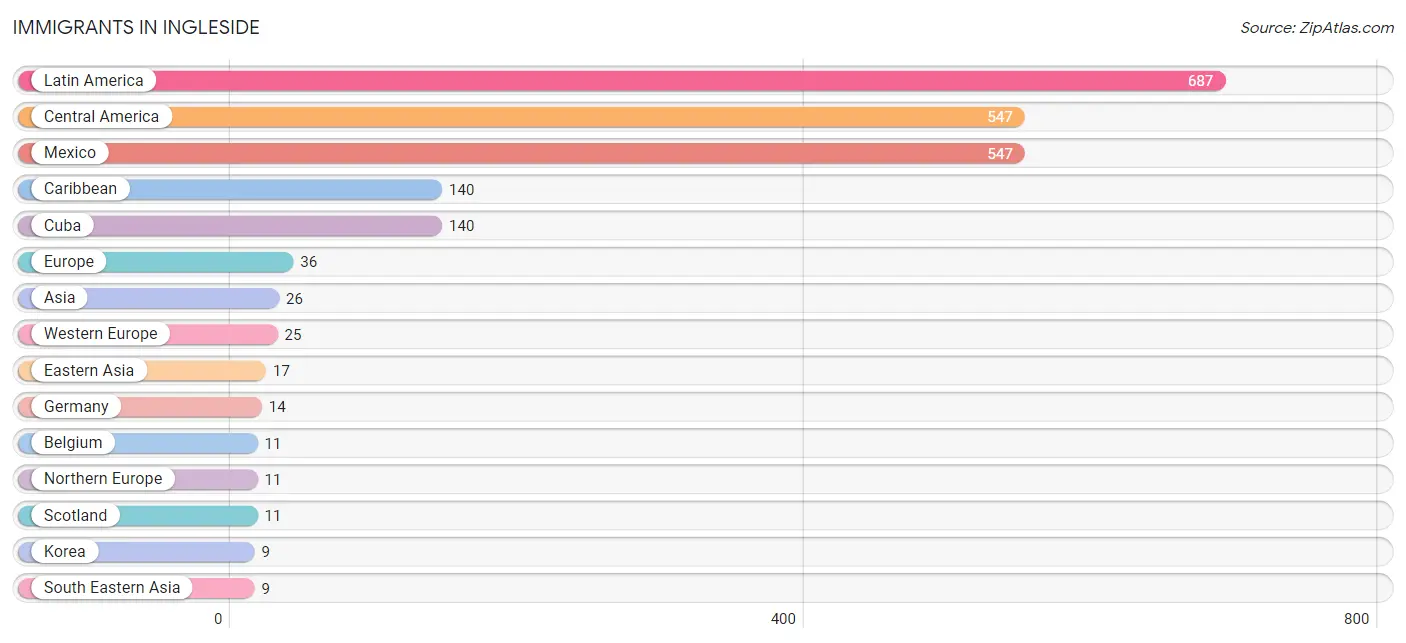
| Immigration Origin | # Population | % Population |
| Asia | 26 | 0.3% |
| Belgium | 11 | 0.1% |
| Caribbean | 140 | 1.4% |
| Central America | 547 | 5.6% |
| China | 8 | 0.1% |
| Cuba | 140 | 1.4% |
| Eastern Asia | 17 | 0.2% |
| Europe | 36 | 0.4% |
| Germany | 14 | 0.1% |
| Korea | 9 | 0.1% |
| Latin America | 687 | 7.1% |
| Mexico | 547 | 5.6% |
| Northern Europe | 11 | 0.1% |
| Scotland | 11 | 0.1% |
| South Eastern Asia | 9 | 0.1% |
| Thailand | 9 | 0.1% |
| Western Europe | 25 | 0.3% | View All 17 Rows |
Sex and Age in Ingleside
Sex and Age in Ingleside
The most populous age groups in Ingleside are 40 to 44 Years (647 | 12.8%) for men and 10 to 14 Years (638 | 13.7%) for women.
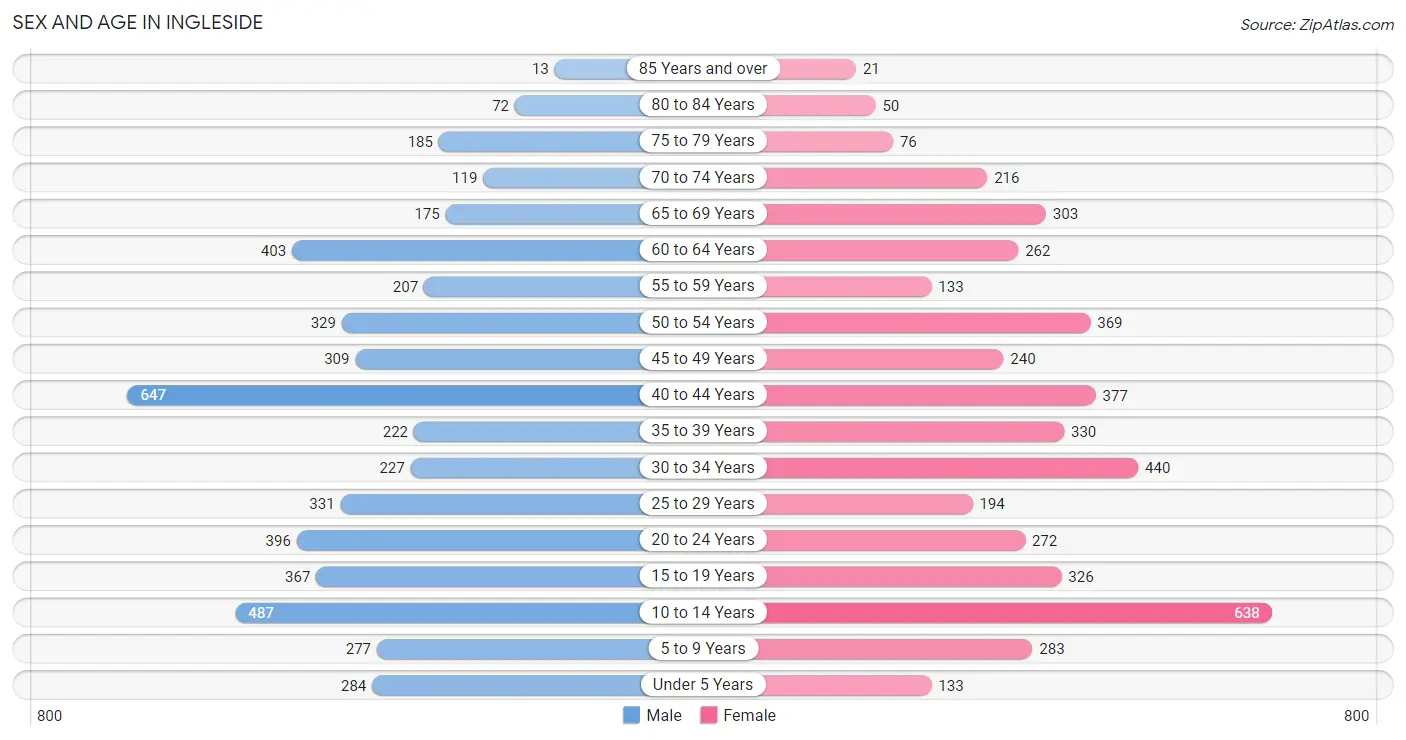
| Age Bracket | Male | Female |
| Under 5 Years | 284 (5.6%) | 133 (2.9%) |
| 5 to 9 Years | 277 (5.5%) | 283 (6.1%) |
| 10 to 14 Years | 487 (9.6%) | 638 (13.7%) |
| 15 to 19 Years | 367 (7.3%) | 326 (7.0%) |
| 20 to 24 Years | 396 (7.8%) | 272 (5.8%) |
| 25 to 29 Years | 331 (6.6%) | 194 (4.2%) |
| 30 to 34 Years | 227 (4.5%) | 440 (9.4%) |
| 35 to 39 Years | 222 (4.4%) | 330 (7.1%) |
| 40 to 44 Years | 647 (12.8%) | 377 (8.1%) |
| 45 to 49 Years | 309 (6.1%) | 240 (5.1%) |
| 50 to 54 Years | 329 (6.5%) | 369 (7.9%) |
| 55 to 59 Years | 207 (4.1%) | 133 (2.9%) |
| 60 to 64 Years | 403 (8.0%) | 262 (5.6%) |
| 65 to 69 Years | 175 (3.5%) | 303 (6.5%) |
| 70 to 74 Years | 119 (2.4%) | 216 (4.6%) |
| 75 to 79 Years | 185 (3.7%) | 76 (1.6%) |
| 80 to 84 Years | 72 (1.4%) | 50 (1.1%) |
| 85 Years and over | 13 (0.3%) | 21 (0.4%) |
| Total | 5,050 (100.0%) | 4,663 (100.0%) |
Families and Households in Ingleside
Median Family Size in Ingleside
The median family size in Ingleside is 3.34 persons per family, with single female/mother families (461 | 19.7%) accounting for the largest median family size of 3.53 persons per family. On the other hand, single male/father families (199 | 8.5%) represent the smallest median family size with 2.63 persons per family.
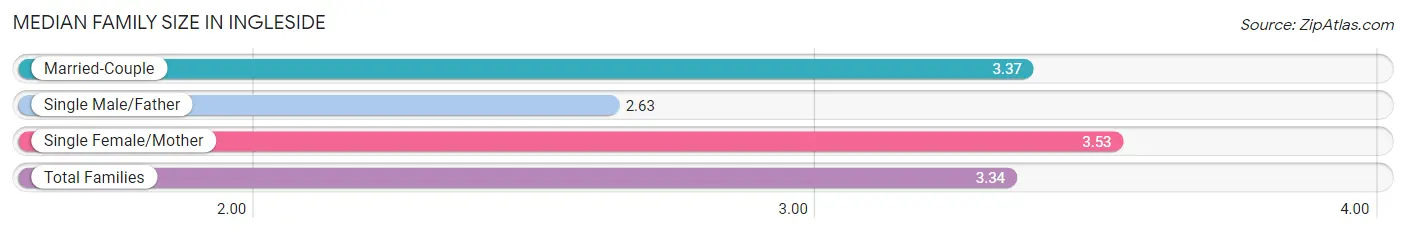
| Family Type | # Families | Family Size |
| Married-Couple | 1,685 (71.9%) | 3.37 |
| Single Male/Father | 199 (8.5%) | 2.63 |
| Single Female/Mother | 461 (19.7%) | 3.53 |
| Total Families | 2,345 (100.0%) | 3.34 |
Median Household Size in Ingleside
The median household size in Ingleside is 2.76 persons per household, with single female/mother households (461 | 13.3%) accounting for the largest median household size of 3.9 persons per household. non-family households (1,135 | 32.6%) represent the smallest median household size with 1.30 persons per household.
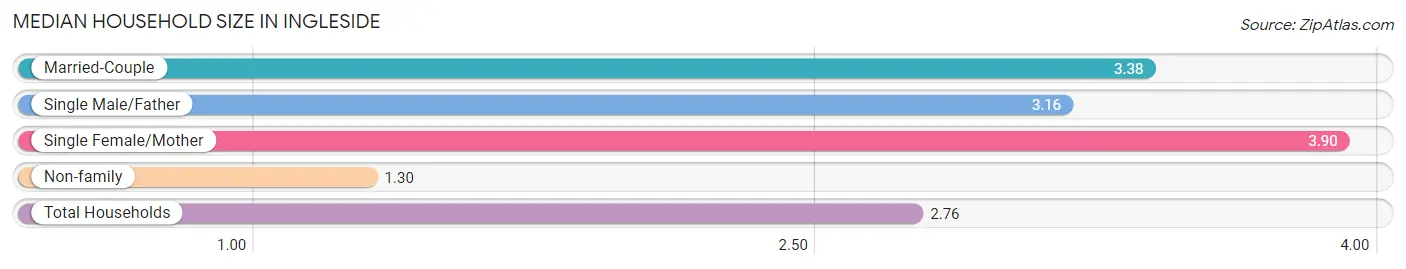
| Household Type | # Households | Household Size |
| Married-Couple | 1,685 (48.4%) | 3.38 |
| Single Male/Father | 199 (5.7%) | 3.16 |
| Single Female/Mother | 461 (13.3%) | 3.90 |
| Non-family | 1,135 (32.6%) | 1.30 |
| Total Households | 3,480 (100.0%) | 2.76 |
Household Size by Marriage Status in Ingleside
Out of a total of 3,480 households in Ingleside, 2,345 (67.4%) are family households, while 1,135 (32.6%) are nonfamily households. The most numerous type of family households are 2-person households, comprising 918, and the most common type of nonfamily households are 1-person households, comprising 856.
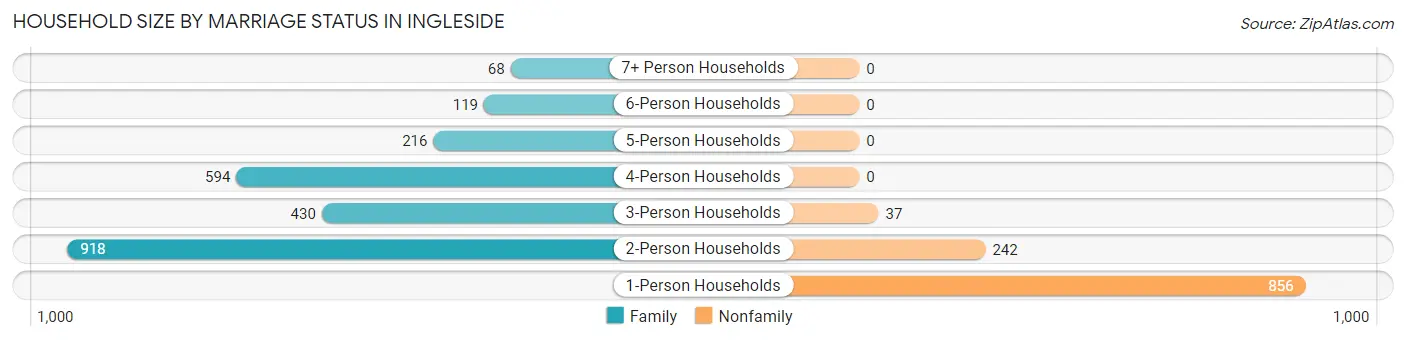
| Household Size | Family Households | Nonfamily Households |
| 1-Person Households | - | 856 (24.6%) |
| 2-Person Households | 918 (26.4%) | 242 (7.0%) |
| 3-Person Households | 430 (12.4%) | 37 (1.1%) |
| 4-Person Households | 594 (17.1%) | 0 (0.0%) |
| 5-Person Households | 216 (6.2%) | 0 (0.0%) |
| 6-Person Households | 119 (3.4%) | 0 (0.0%) |
| 7+ Person Households | 68 (1.9%) | 0 (0.0%) |
| Total | 2,345 (67.4%) | 1,135 (32.6%) |
Female Fertility in Ingleside
Fertility by Age in Ingleside
Average fertility rate in Ingleside is 41.0 births per 1,000 women. Women in the age bracket of 20 to 34 years have the highest fertility rate with 84.0 births per 1,000 women. Women in the age bracket of 20 to 34 years acount for 81.7% of all women with births.
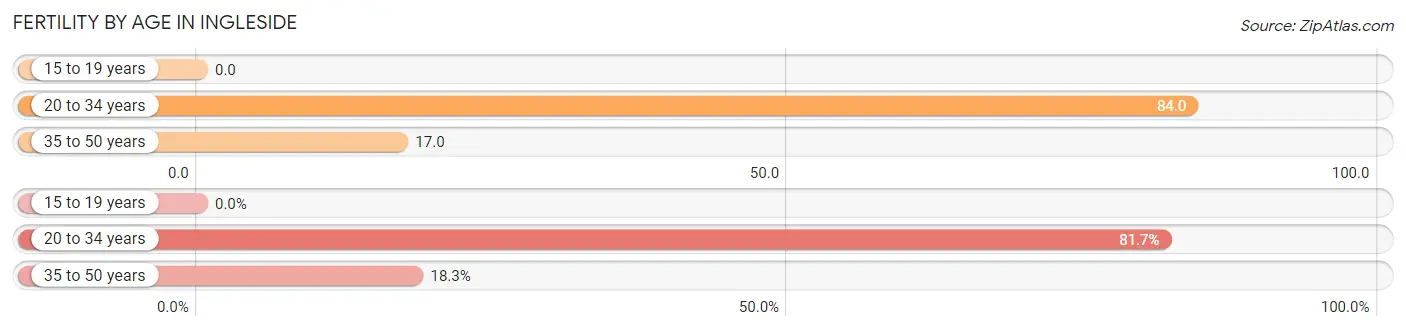
| Age Bracket | Women with Births | Births / 1,000 Women |
| 15 to 19 years | 0 (0.0%) | 0.0 |
| 20 to 34 years | 76 (81.7%) | 84.0 |
| 35 to 50 years | 17 (18.3%) | 17.0 |
| Total | 93 (100.0%) | 41.0 |
Fertility by Age by Marriage Status in Ingleside
45.2% of women with births (93) in Ingleside are married. The highest percentage of unmarried women with births falls into 20 to 34 years age bracket with 67.1% of them unmarried at the time of birth, while the lowest percentage of unmarried women with births belong to 35 to 50 years age bracket with 0.0% of them unmarried.
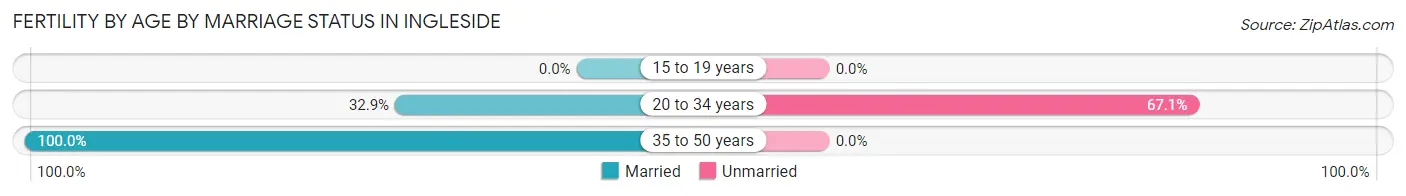
| Age Bracket | Married | Unmarried |
| 15 to 19 years | 0 (0.0%) | 0 (0.0%) |
| 20 to 34 years | 25 (32.9%) | 51 (67.1%) |
| 35 to 50 years | 17 (100.0%) | 0 (0.0%) |
| Total | 42 (45.2%) | 51 (54.8%) |
Fertility by Education in Ingleside
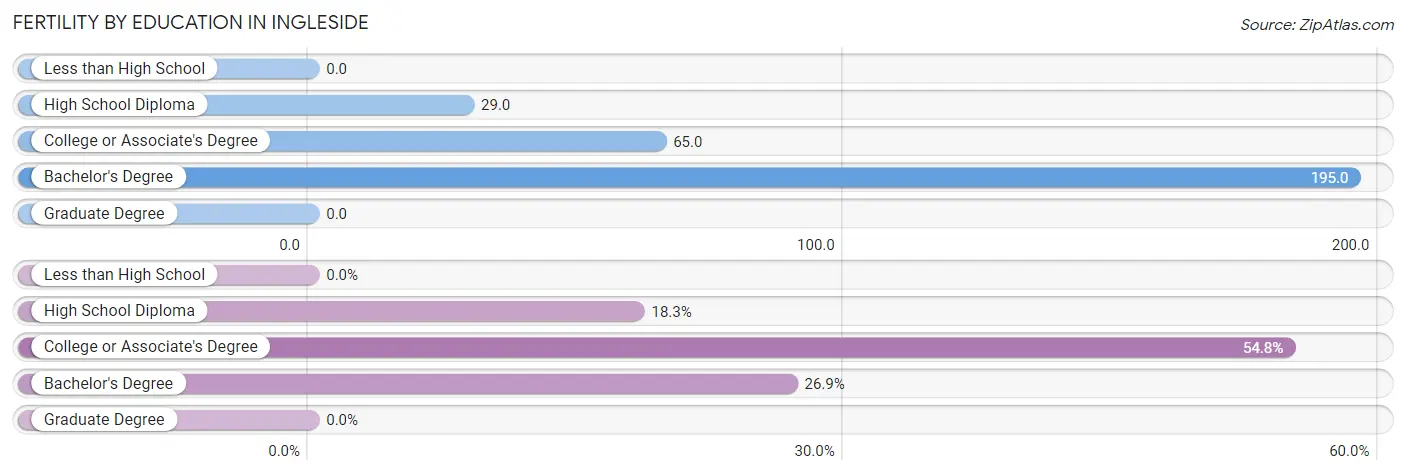
| Educational Attainment | Women with Births | Births / 1,000 Women |
| Less than High School | 0 (0.0%) | 0.0 |
| High School Diploma | 17 (18.3%) | 29.0 |
| College or Associate's Degree | 51 (54.8%) | 65.0 |
| Bachelor's Degree | 25 (26.9%) | 195.0 |
| Graduate Degree | 0 (0.0%) | 0.0 |
| Total | 93 (100.0%) | 41.0 |
Fertility by Education by Marriage Status in Ingleside
54.8% of women with births in Ingleside are unmarried. Women with the educational attainment of high school diploma are most likely to be married with 100.0% of them married at childbirth, while women with the educational attainment of college or associate's degree are least likely to be married with 100.0% of them unmarried at childbirth.
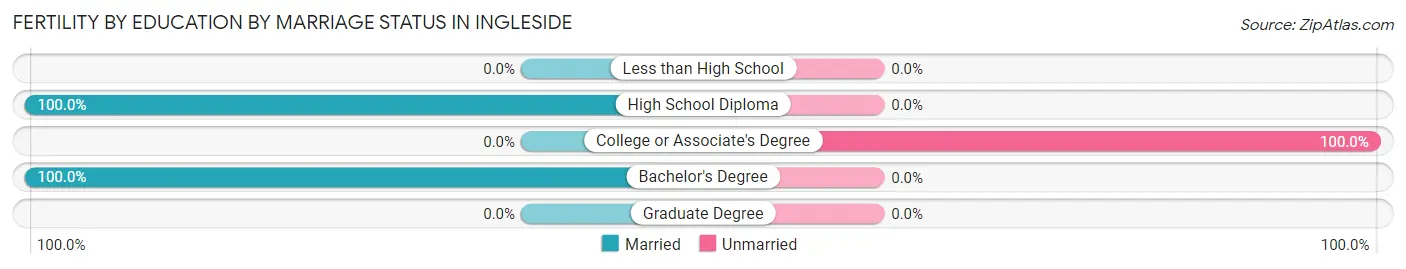
| Educational Attainment | Married | Unmarried |
| Less than High School | 0 (0.0%) | 0 (0.0%) |
| High School Diploma | 17 (100.0%) | 0 (0.0%) |
| College or Associate's Degree | 0 (0.0%) | 51 (100.0%) |
| Bachelor's Degree | 25 (100.0%) | 0 (0.0%) |
| Graduate Degree | 0 (0.0%) | 0 (0.0%) |
| Total | 42 (45.2%) | 51 (54.8%) |
Employment Characteristics in Ingleside
Employment by Class of Employer in Ingleside
Among the 4,787 employed individuals in Ingleside, private company employees (3,463 | 72.3%), local government employees (622 | 13.0%), and federal government employees (192 | 4.0%) make up the most common classes of employment.
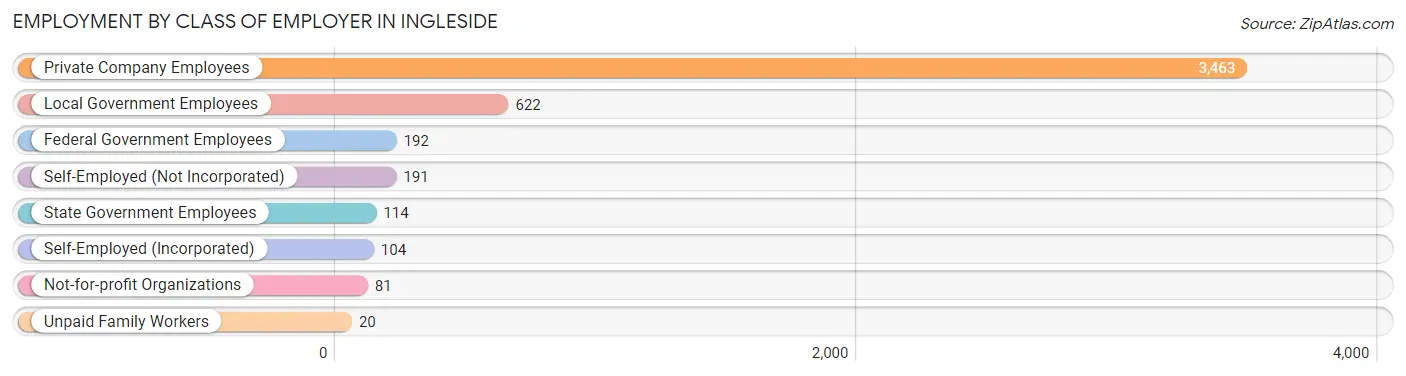
| Employer Class | # Employees | % Employees |
| Private Company Employees | 3,463 | 72.3% |
| Self-Employed (Incorporated) | 104 | 2.2% |
| Self-Employed (Not Incorporated) | 191 | 4.0% |
| Not-for-profit Organizations | 81 | 1.7% |
| Local Government Employees | 622 | 13.0% |
| State Government Employees | 114 | 2.4% |
| Federal Government Employees | 192 | 4.0% |
| Unpaid Family Workers | 20 | 0.4% |
| Total | 4,787 | 100.0% |
Employment Status by Age in Ingleside
According to the labor force statistics for Ingleside, out of the total population over 16 years of age (7,426), 66.2% or 4,916 individuals are in the labor force, with 1.7% or 84 of them unemployed. The age group with the highest labor force participation rate is 45 to 54 years, with 92.0% or 1,147 individuals in the labor force. Within the labor force, the 20 to 24 years age range has the highest percentage of unemployed individuals, with 7.5% or 43 of them being unemployed.
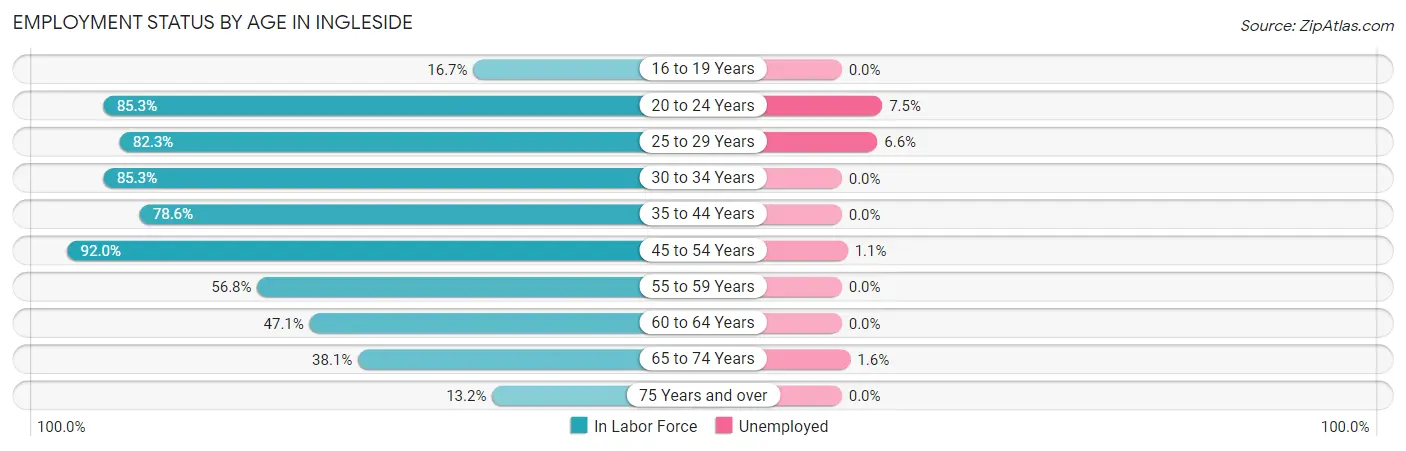
| Age Bracket | In Labor Force | Unemployed |
| 16 to 19 Years | 85 (16.7%) | 0 (0.0%) |
| 20 to 24 Years | 570 (85.3%) | 43 (7.5%) |
| 25 to 29 Years | 432 (82.3%) | 29 (6.6%) |
| 30 to 34 Years | 569 (85.3%) | 0 (0.0%) |
| 35 to 44 Years | 1,239 (78.6%) | 0 (0.0%) |
| 45 to 54 Years | 1,147 (92.0%) | 13 (1.1%) |
| 55 to 59 Years | 193 (56.8%) | 0 (0.0%) |
| 60 to 64 Years | 313 (47.1%) | 0 (0.0%) |
| 65 to 74 Years | 310 (38.1%) | 5 (1.6%) |
| 75 Years and over | 55 (13.2%) | 0 (0.0%) |
| Total | 4,916 (66.2%) | 84 (1.7%) |
Employment Status by Educational Attainment in Ingleside
According to labor force statistics for Ingleside, 77.5% of individuals (3,890) out of the total population between 25 and 64 years of age (5,020) are in the labor force, with 1.0% or 39 of them being unemployed. The group with the highest labor force participation rate are those with the educational attainment of high school diploma, with 82.1% or 1,270 individuals in the labor force. Within the labor force, individuals with high school diploma education have the highest percentage of unemployment, with 3.2% or 41 of them being unemployed.
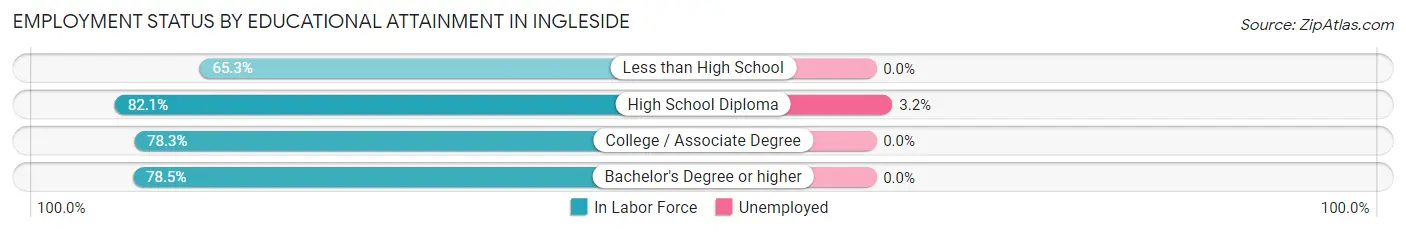
| Educational Attainment | In Labor Force | Unemployed |
| Less than High School | 490 (65.3%) | 0 (0.0%) |
| High School Diploma | 1,270 (82.1%) | 50 (3.2%) |
| College / Associate Degree | 1,405 (78.3%) | 0 (0.0%) |
| Bachelor's Degree or higher | 729 (78.5%) | 0 (0.0%) |
| Total | 3,890 (77.5%) | 50 (1.0%) |
Employment Occupations by Sex in Ingleside
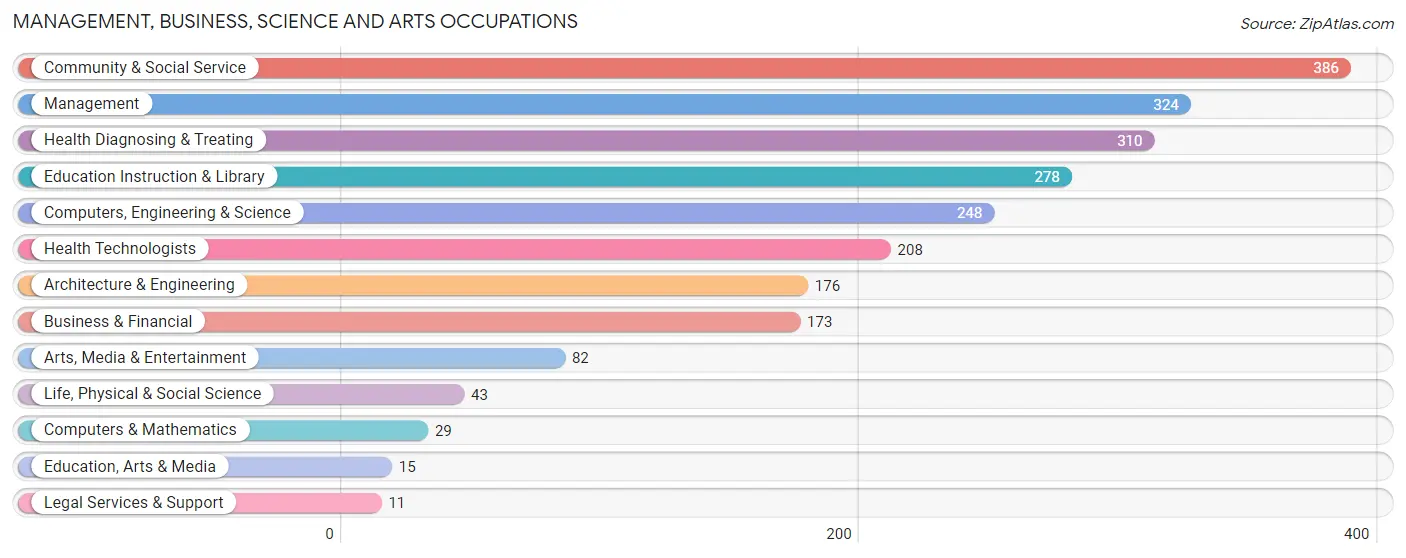
Management, Business, Science and Arts Occupations
The most common Management, Business, Science and Arts occupations in Ingleside are Community & Social Service (386 | 8.2%), Management (324 | 6.9%), Health Diagnosing & Treating (310 | 6.6%), Education Instruction & Library (278 | 5.9%), and Computers, Engineering & Science (248 | 5.2%).
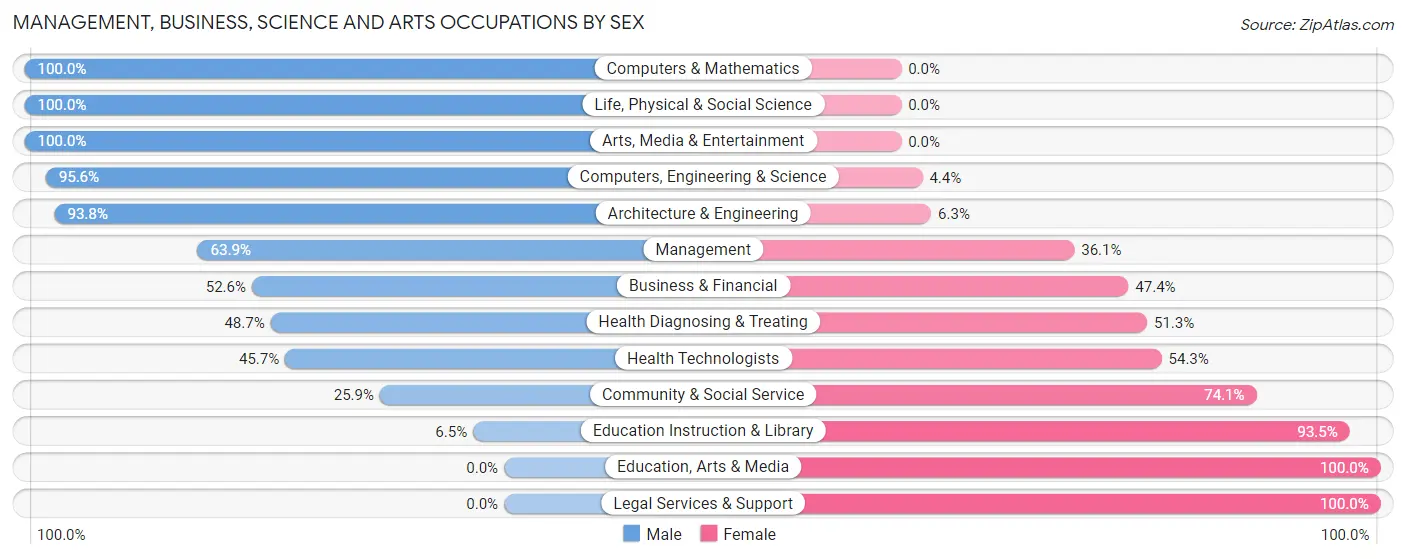
Management, Business, Science and Arts Occupations by Sex
Within the Management, Business, Science and Arts occupations in Ingleside, the most male-oriented occupations are Computers & Mathematics (100.0%), Life, Physical & Social Science (100.0%), and Arts, Media & Entertainment (100.0%), while the most female-oriented occupations are Education, Arts & Media (100.0%), Legal Services & Support (100.0%), and Education Instruction & Library (93.5%).
| Occupation | Male | Female |
| Management | 207 (63.9%) | 117 (36.1%) |
| Business & Financial | 91 (52.6%) | 82 (47.4%) |
| Computers, Engineering & Science | 237 (95.6%) | 11 (4.4%) |
| Computers & Mathematics | 29 (100.0%) | 0 (0.0%) |
| Architecture & Engineering | 165 (93.8%) | 11 (6.2%) |
| Life, Physical & Social Science | 43 (100.0%) | 0 (0.0%) |
| Community & Social Service | 100 (25.9%) | 286 (74.1%) |
| Education, Arts & Media | 0 (0.0%) | 15 (100.0%) |
| Legal Services & Support | 0 (0.0%) | 11 (100.0%) |
| Education Instruction & Library | 18 (6.5%) | 260 (93.5%) |
| Arts, Media & Entertainment | 82 (100.0%) | 0 (0.0%) |
| Health Diagnosing & Treating | 151 (48.7%) | 159 (51.3%) |
| Health Technologists | 95 (45.7%) | 113 (54.3%) |
| Total (Category) | 786 (54.5%) | 655 (45.5%) |
| Total (Overall) | 2,620 (55.5%) | 2,100 (44.5%) |
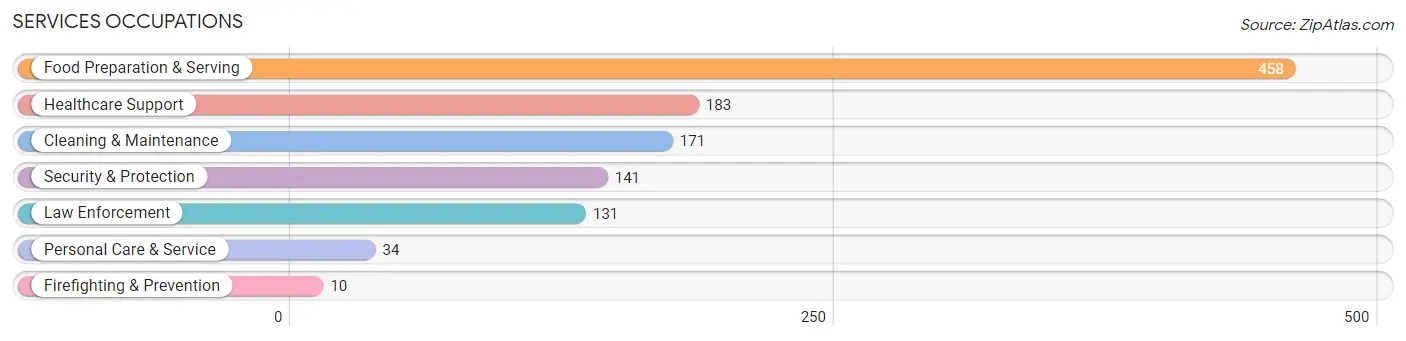
Services Occupations
The most common Services occupations in Ingleside are Food Preparation & Serving (458 | 9.7%), Healthcare Support (183 | 3.9%), Cleaning & Maintenance (171 | 3.6%), Security & Protection (141 | 3.0%), and Law Enforcement (131 | 2.8%).
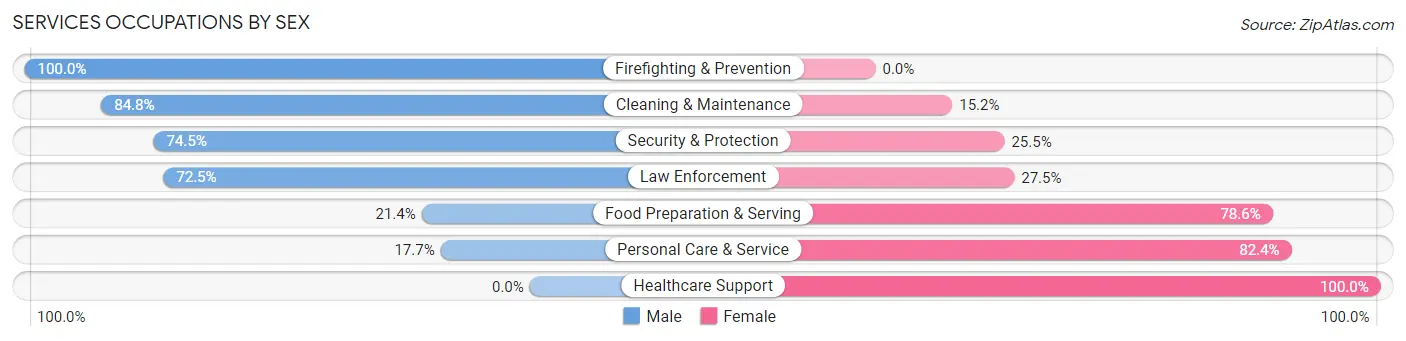
Services Occupations by Sex
Within the Services occupations in Ingleside, the most male-oriented occupations are Firefighting & Prevention (100.0%), Cleaning & Maintenance (84.8%), and Security & Protection (74.5%), while the most female-oriented occupations are Healthcare Support (100.0%), Personal Care & Service (82.4%), and Food Preparation & Serving (78.6%).
| Occupation | Male | Female |
| Healthcare Support | 0 (0.0%) | 183 (100.0%) |
| Security & Protection | 105 (74.5%) | 36 (25.5%) |
| Firefighting & Prevention | 10 (100.0%) | 0 (0.0%) |
| Law Enforcement | 95 (72.5%) | 36 (27.5%) |
| Food Preparation & Serving | 98 (21.4%) | 360 (78.6%) |
| Cleaning & Maintenance | 145 (84.8%) | 26 (15.2%) |
| Personal Care & Service | 6 (17.6%) | 28 (82.4%) |
| Total (Category) | 354 (35.9%) | 633 (64.1%) |
| Total (Overall) | 2,620 (55.5%) | 2,100 (44.5%) |
Sales and Office Occupations
The most common Sales and Office occupations in Ingleside are Office & Administration (594 | 12.6%), and Sales & Related (410 | 8.7%).
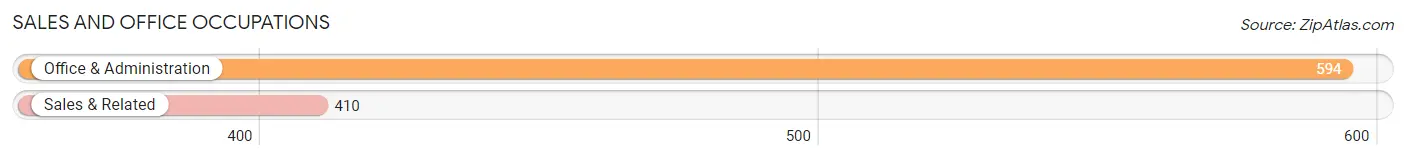
Sales and Office Occupations by Sex
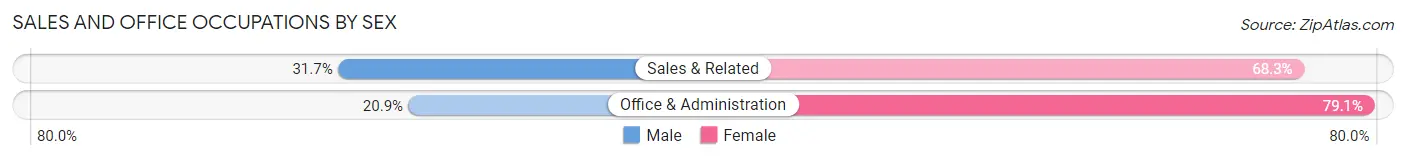
| Occupation | Male | Female |
| Sales & Related | 130 (31.7%) | 280 (68.3%) |
| Office & Administration | 124 (20.9%) | 470 (79.1%) |
| Total (Category) | 254 (25.3%) | 750 (74.7%) |
| Total (Overall) | 2,620 (55.5%) | 2,100 (44.5%) |
Natural Resources, Construction and Maintenance Occupations
The most common Natural Resources, Construction and Maintenance occupations in Ingleside are Construction & Extraction (377 | 8.0%), Installation, Maintenance & Repair (116 | 2.5%), and Farming, Fishing & Forestry (39 | 0.8%).
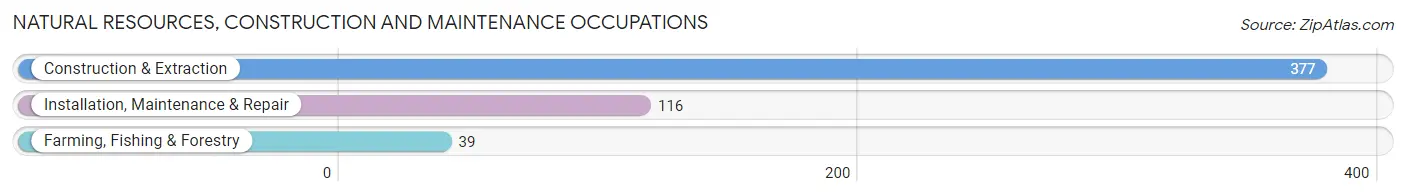
Natural Resources, Construction and Maintenance Occupations by Sex
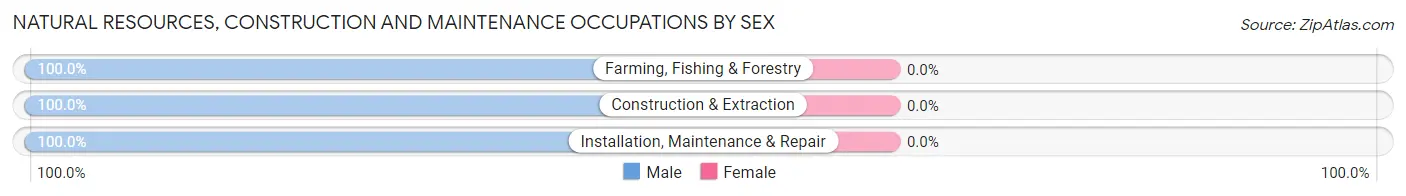
| Occupation | Male | Female |
| Farming, Fishing & Forestry | 39 (100.0%) | 0 (0.0%) |
| Construction & Extraction | 377 (100.0%) | 0 (0.0%) |
| Installation, Maintenance & Repair | 116 (100.0%) | 0 (0.0%) |
| Total (Category) | 532 (100.0%) | 0 (0.0%) |
| Total (Overall) | 2,620 (55.5%) | 2,100 (44.5%) |
Production, Transportation and Moving Occupations
The most common Production, Transportation and Moving occupations in Ingleside are Production (290 | 6.1%), Transportation (287 | 6.1%), and Material Moving (179 | 3.8%).
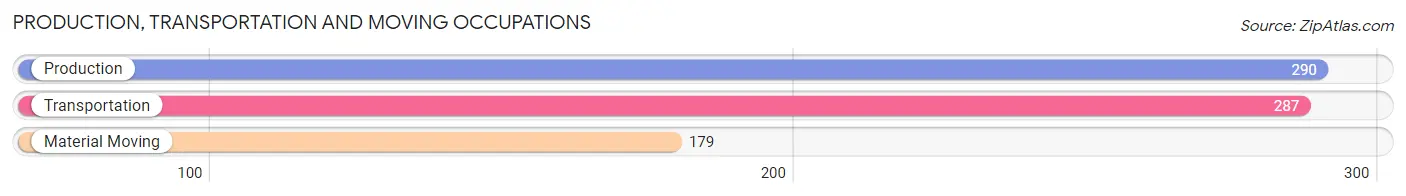
Production, Transportation and Moving Occupations by Sex
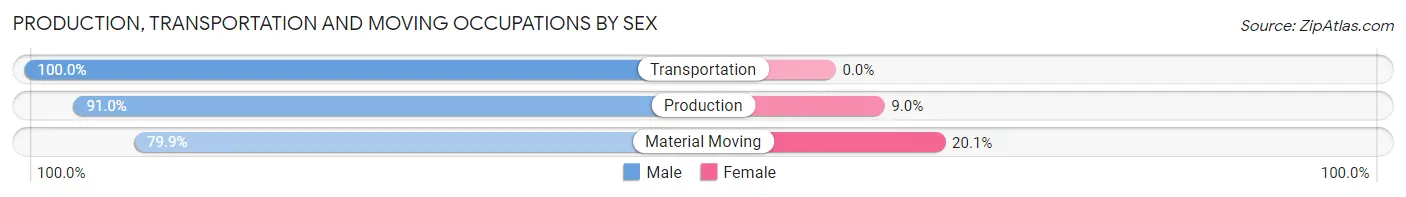
| Occupation | Male | Female |
| Production | 264 (91.0%) | 26 (9.0%) |
| Transportation | 287 (100.0%) | 0 (0.0%) |
| Material Moving | 143 (79.9%) | 36 (20.1%) |
| Total (Category) | 694 (91.8%) | 62 (8.2%) |
| Total (Overall) | 2,620 (55.5%) | 2,100 (44.5%) |
Employment Industries by Sex in Ingleside
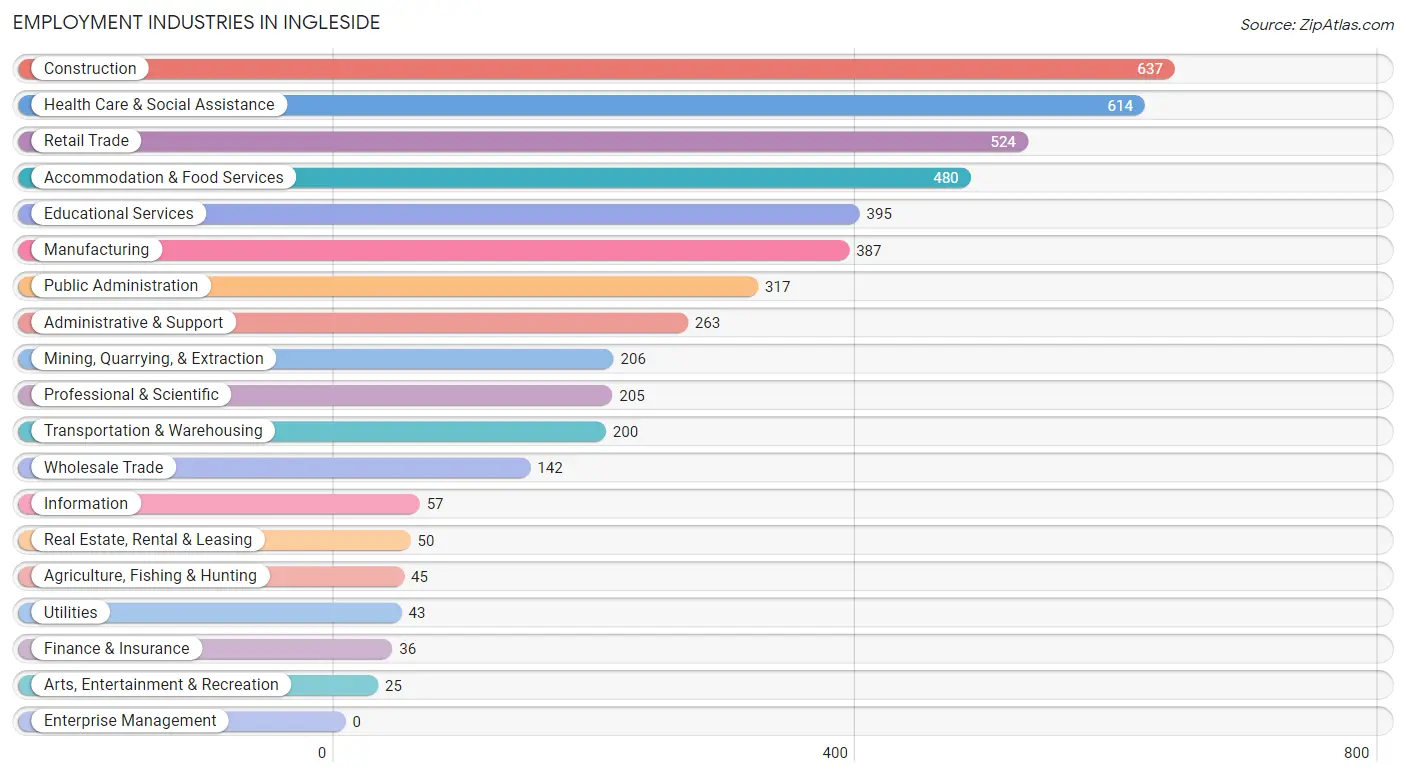
Employment Industries in Ingleside
The major employment industries in Ingleside include Construction (637 | 13.5%), Health Care & Social Assistance (614 | 13.0%), Retail Trade (524 | 11.1%), Accommodation & Food Services (480 | 10.2%), and Educational Services (395 | 8.4%).
Employment Industries by Sex in Ingleside
The Ingleside industries that see more men than women are Transportation & Warehousing (100.0%), Utilities (100.0%), and Wholesale Trade (93.7%), whereas the industries that tend to have a higher number of women are Accommodation & Food Services (82.3%), Educational Services (77.5%), and Health Care & Social Assistance (74.4%).
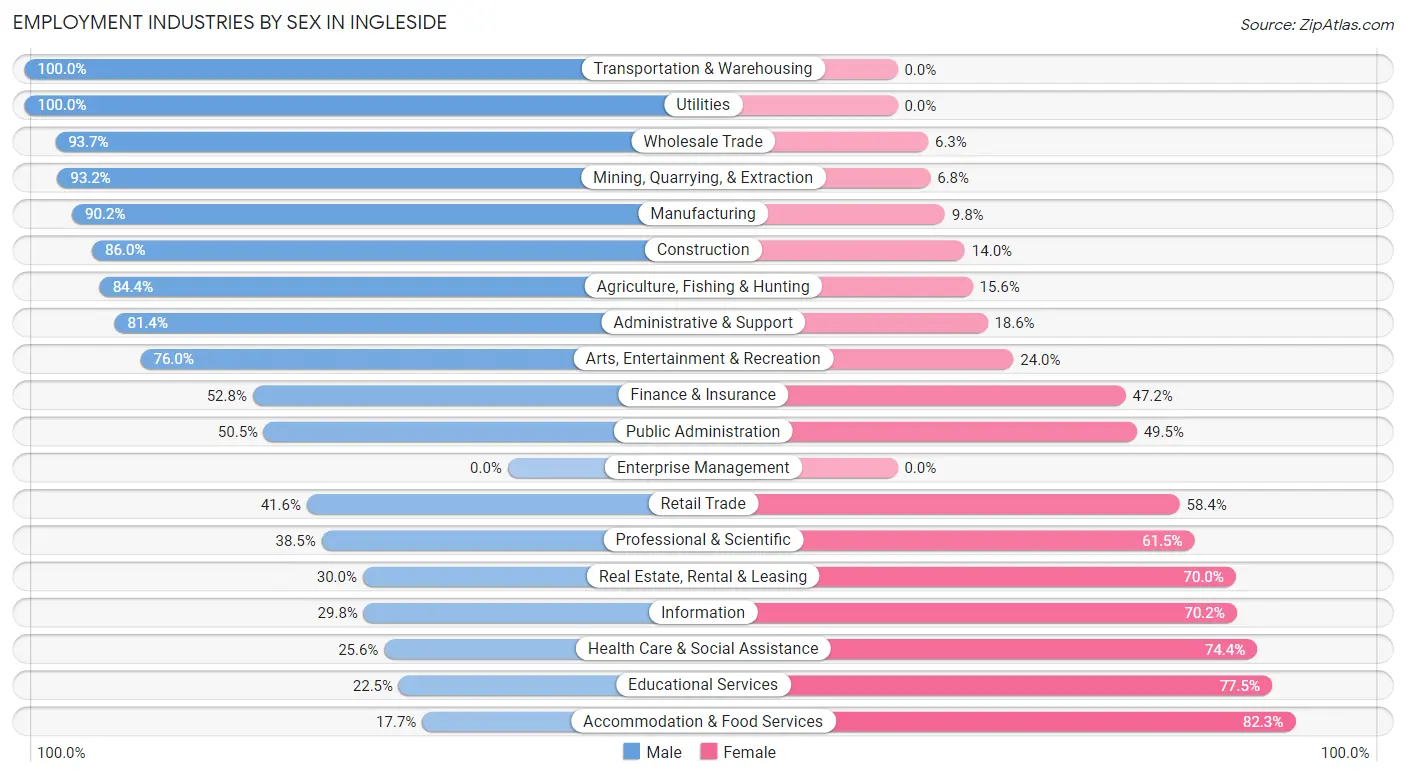
| Industry | Male | Female |
| Agriculture, Fishing & Hunting | 38 (84.4%) | 7 (15.6%) |
| Mining, Quarrying, & Extraction | 192 (93.2%) | 14 (6.8%) |
| Construction | 548 (86.0%) | 89 (14.0%) |
| Manufacturing | 349 (90.2%) | 38 (9.8%) |
| Wholesale Trade | 133 (93.7%) | 9 (6.3%) |
| Retail Trade | 218 (41.6%) | 306 (58.4%) |
| Transportation & Warehousing | 200 (100.0%) | 0 (0.0%) |
| Utilities | 43 (100.0%) | 0 (0.0%) |
| Information | 17 (29.8%) | 40 (70.2%) |
| Finance & Insurance | 19 (52.8%) | 17 (47.2%) |
| Real Estate, Rental & Leasing | 15 (30.0%) | 35 (70.0%) |
| Professional & Scientific | 79 (38.5%) | 126 (61.5%) |
| Enterprise Management | 0 (0.0%) | 0 (0.0%) |
| Administrative & Support | 214 (81.4%) | 49 (18.6%) |
| Educational Services | 89 (22.5%) | 306 (77.5%) |
| Health Care & Social Assistance | 157 (25.6%) | 457 (74.4%) |
| Arts, Entertainment & Recreation | 19 (76.0%) | 6 (24.0%) |
| Accommodation & Food Services | 85 (17.7%) | 395 (82.3%) |
| Public Administration | 160 (50.5%) | 157 (49.5%) |
| Total | 2,620 (55.5%) | 2,100 (44.5%) |
Education in Ingleside
School Enrollment in Ingleside
The most common levels of schooling among the 2,649 students in Ingleside are high school (823 | 31.1%), middle school (784 | 29.6%), and elementary school (456 | 17.2%).
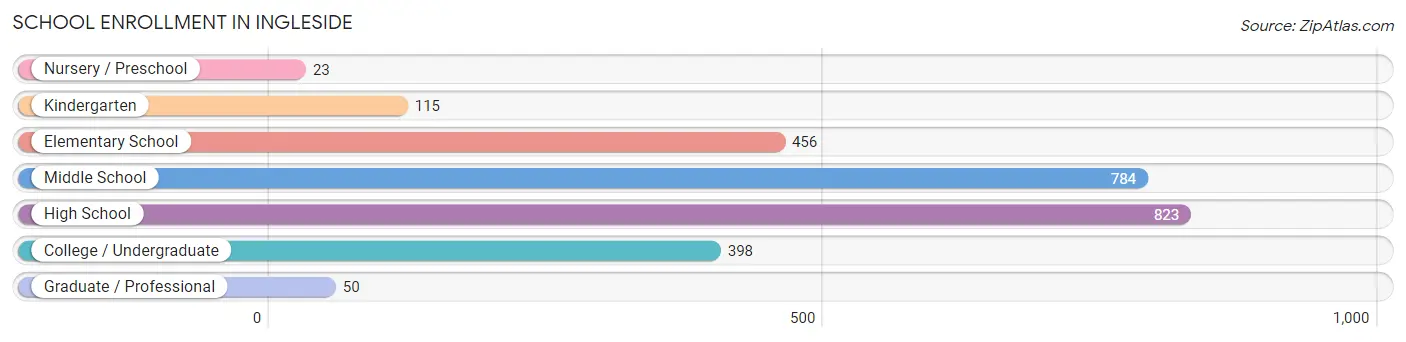
| School Level | # Students | % Students |
| Nursery / Preschool | 23 | 0.9% |
| Kindergarten | 115 | 4.3% |
| Elementary School | 456 | 17.2% |
| Middle School | 784 | 29.6% |
| High School | 823 | 31.1% |
| College / Undergraduate | 398 | 15.0% |
| Graduate / Professional | 50 | 1.9% |
| Total | 2,649 | 100.0% |
School Enrollment by Age by Funding Source in Ingleside
Out of a total of 2,649 students who are enrolled in schools in Ingleside, 58 (2.2%) attend a private institution, while the remaining 2,591 (97.8%) are enrolled in public schools. The age group of 5 to 9 year old has the highest likelihood of being enrolled in private schools, with 26 (4.9% in the age bracket) enrolled. Conversely, the age group of 3 to 4 year olds has the lowest likelihood of being enrolled in a private school, with 18 (100.0% in the age bracket) attending a public institution.
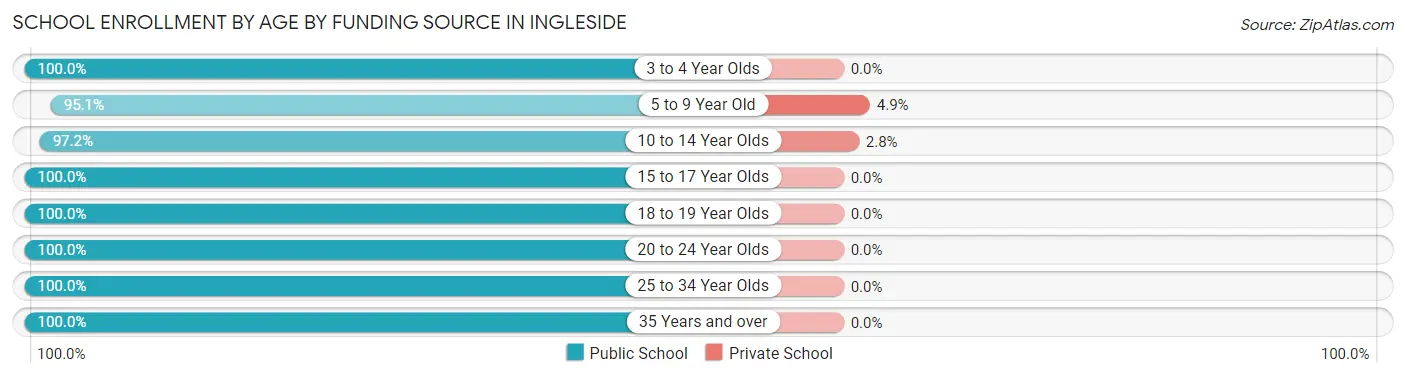
| Age Bracket | Public School | Private School |
| 3 to 4 Year Olds | 18 (100.0%) | 0 (0.0%) |
| 5 to 9 Year Old | 507 (95.1%) | 26 (4.9%) |
| 10 to 14 Year Olds | 1,064 (97.2%) | 31 (2.8%) |
| 15 to 17 Year Olds | 447 (100.0%) | 0 (0.0%) |
| 18 to 19 Year Olds | 195 (100.0%) | 0 (0.0%) |
| 20 to 24 Year Olds | 239 (100.0%) | 0 (0.0%) |
| 25 to 34 Year Olds | 52 (100.0%) | 0 (0.0%) |
| 35 Years and over | 70 (100.0%) | 0 (0.0%) |
| Total | 2,591 (97.8%) | 58 (2.2%) |
Educational Attainment by Field of Study in Ingleside
Education (288 | 26.9%), science & technology (138 | 12.9%), psychology (107 | 10.0%), physical & health sciences (92 | 8.6%), and arts & humanities (89 | 8.3%) are the most common fields of study among 1,072 individuals in Ingleside who have obtained a bachelor's degree or higher.
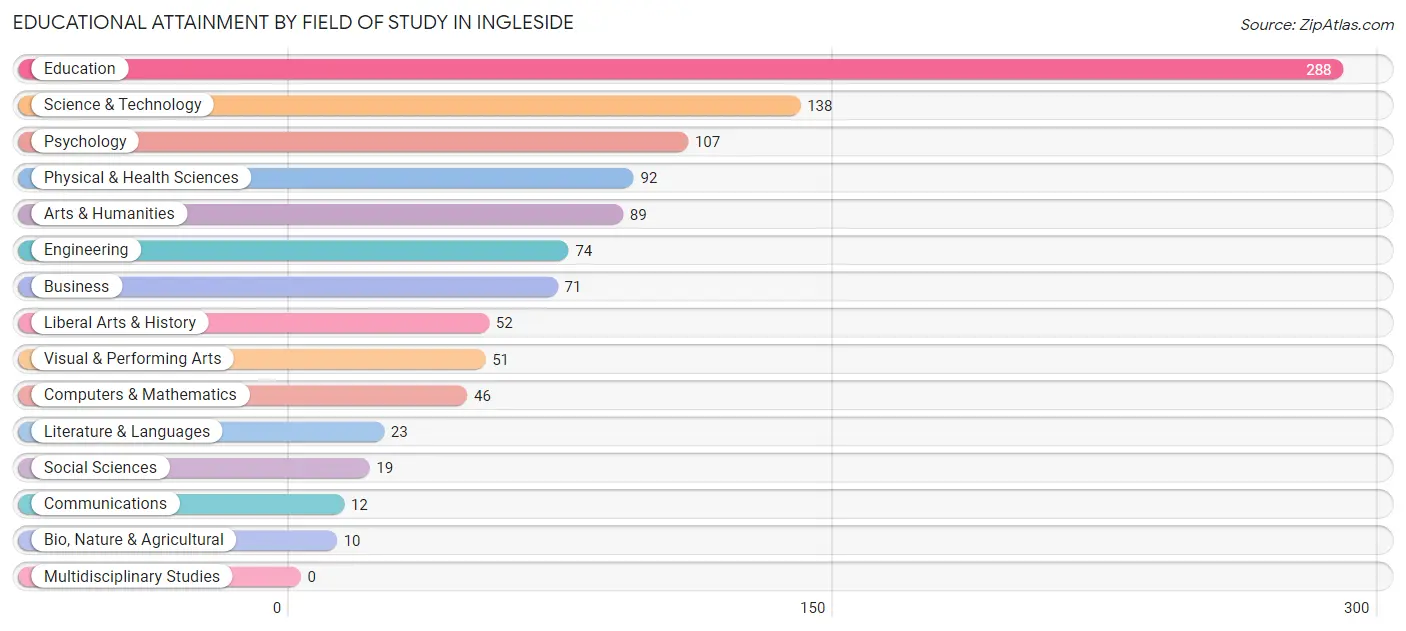
| Field of Study | # Graduates | % Graduates |
| Computers & Mathematics | 46 | 4.3% |
| Bio, Nature & Agricultural | 10 | 0.9% |
| Physical & Health Sciences | 92 | 8.6% |
| Psychology | 107 | 10.0% |
| Social Sciences | 19 | 1.8% |
| Engineering | 74 | 6.9% |
| Multidisciplinary Studies | 0 | 0.0% |
| Science & Technology | 138 | 12.9% |
| Business | 71 | 6.6% |
| Education | 288 | 26.9% |
| Literature & Languages | 23 | 2.1% |
| Liberal Arts & History | 52 | 4.9% |
| Visual & Performing Arts | 51 | 4.8% |
| Communications | 12 | 1.1% |
| Arts & Humanities | 89 | 8.3% |
| Total | 1,072 | 100.0% |
Transportation & Commute in Ingleside
Vehicle Availability by Sex in Ingleside
The most prevalent vehicle ownership categories in Ingleside are males with 2 vehicles (1,305, accounting for 49.9%) and females with 2 vehicles (930, making up 63.4%).
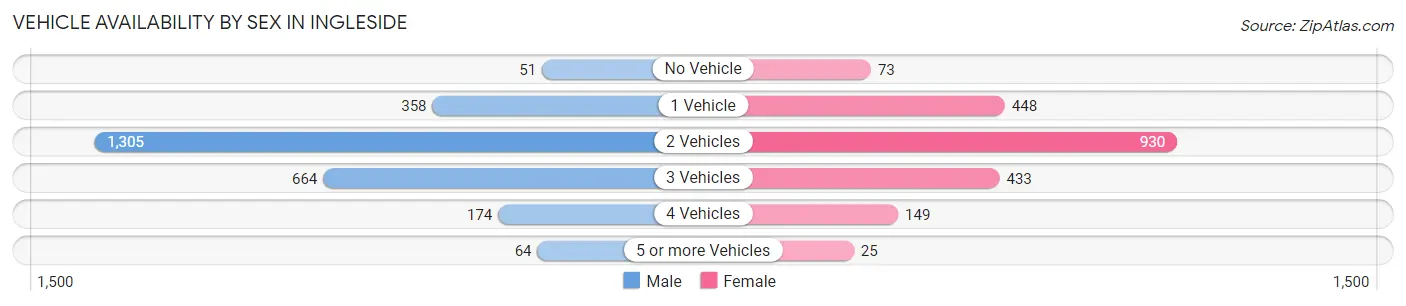
| Vehicles Available | Male | Female |
| No Vehicle | 51 (1.9%) | 73 (3.5%) |
| 1 Vehicle | 358 (13.7%) | 448 (21.8%) |
| 2 Vehicles | 1,305 (49.9%) | 930 (45.2%) |
| 3 Vehicles | 664 (25.4%) | 433 (21.0%) |
| 4 Vehicles | 174 (6.7%) | 149 (7.2%) |
| 5 or more Vehicles | 64 (2.5%) | 25 (1.2%) |
| Total | 2,616 (100.0%) | 2,058 (100.0%) |
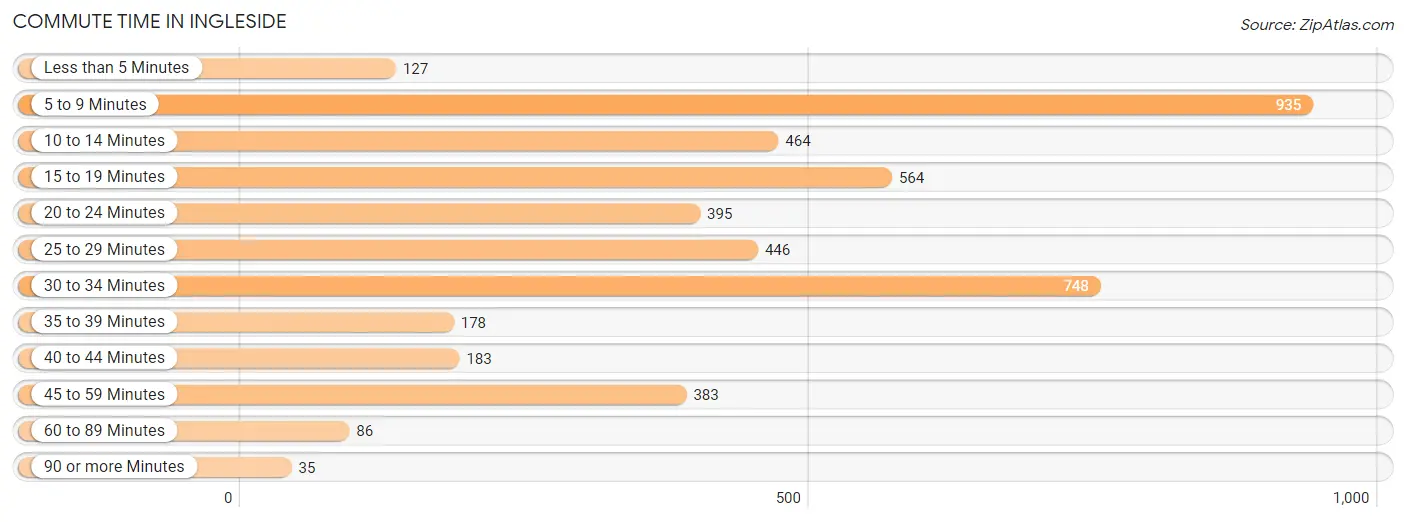
Commute Time in Ingleside
The most frequently occuring commute durations in Ingleside are 5 to 9 minutes (935 commuters, 20.6%), 30 to 34 minutes (748 commuters, 16.5%), and 15 to 19 minutes (564 commuters, 12.4%).
| Commute Time | # Commuters | % Commuters |
| Less than 5 Minutes | 127 | 2.8% |
| 5 to 9 Minutes | 935 | 20.6% |
| 10 to 14 Minutes | 464 | 10.2% |
| 15 to 19 Minutes | 564 | 12.4% |
| 20 to 24 Minutes | 395 | 8.7% |
| 25 to 29 Minutes | 446 | 9.8% |
| 30 to 34 Minutes | 748 | 16.5% |
| 35 to 39 Minutes | 178 | 3.9% |
| 40 to 44 Minutes | 183 | 4.0% |
| 45 to 59 Minutes | 383 | 8.4% |
| 60 to 89 Minutes | 86 | 1.9% |
| 90 or more Minutes | 35 | 0.8% |
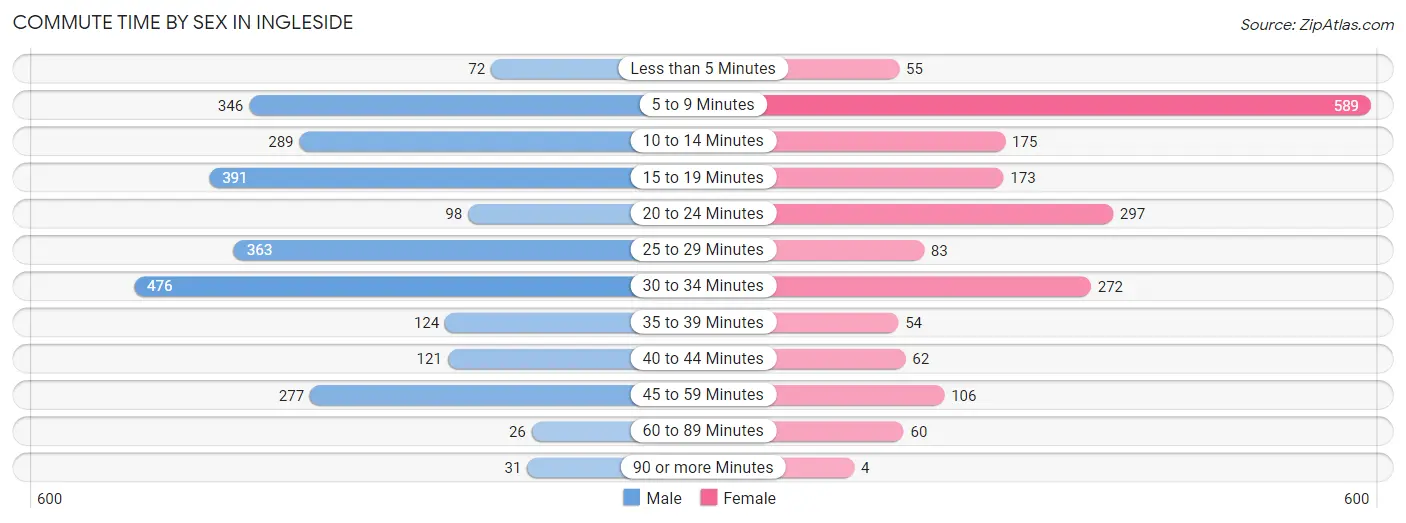
Commute Time by Sex in Ingleside
The most common commute times in Ingleside are 30 to 34 minutes (476 commuters, 18.2%) for males and 5 to 9 minutes (589 commuters, 30.5%) for females.
| Commute Time | Male | Female |
| Less than 5 Minutes | 72 (2.8%) | 55 (2.9%) |
| 5 to 9 Minutes | 346 (13.2%) | 589 (30.5%) |
| 10 to 14 Minutes | 289 (11.1%) | 175 (9.1%) |
| 15 to 19 Minutes | 391 (15.0%) | 173 (9.0%) |
| 20 to 24 Minutes | 98 (3.7%) | 297 (15.4%) |
| 25 to 29 Minutes | 363 (13.9%) | 83 (4.3%) |
| 30 to 34 Minutes | 476 (18.2%) | 272 (14.1%) |
| 35 to 39 Minutes | 124 (4.7%) | 54 (2.8%) |
| 40 to 44 Minutes | 121 (4.6%) | 62 (3.2%) |
| 45 to 59 Minutes | 277 (10.6%) | 106 (5.5%) |
| 60 to 89 Minutes | 26 (1.0%) | 60 (3.1%) |
| 90 or more Minutes | 31 (1.2%) | 4 (0.2%) |
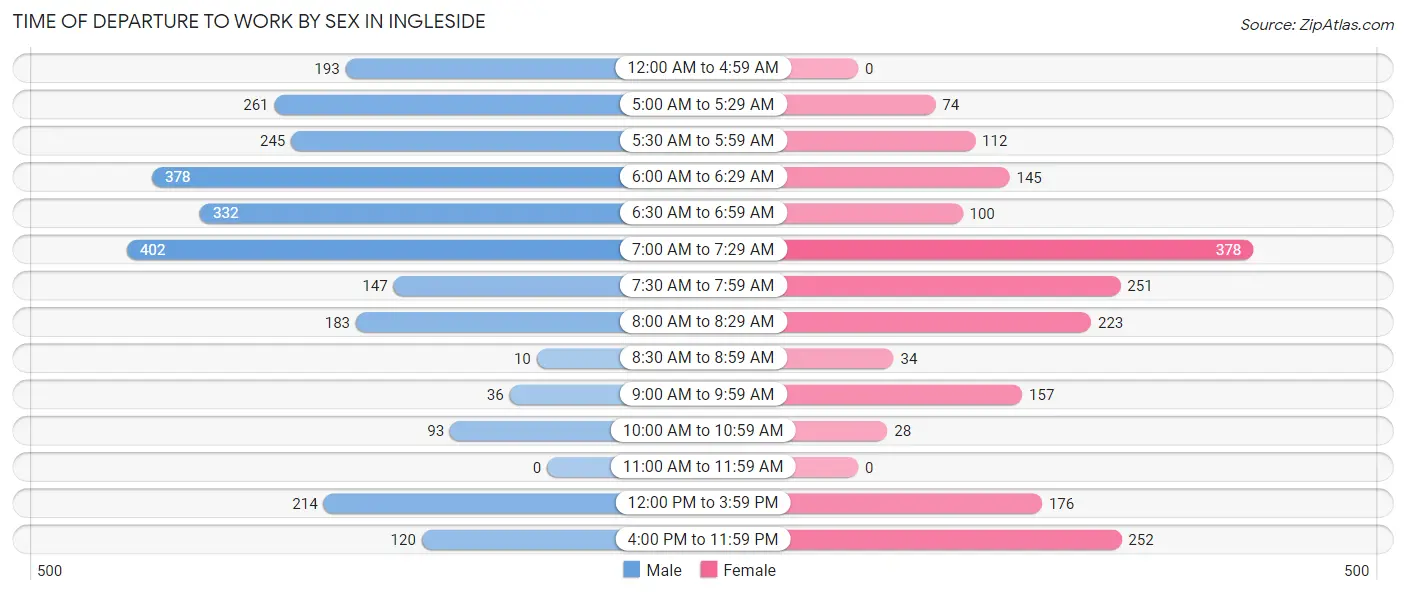
Time of Departure to Work by Sex in Ingleside
The most frequent times of departure to work in Ingleside are 7:00 AM to 7:29 AM (402, 15.4%) for males and 7:00 AM to 7:29 AM (378, 19.6%) for females.
| Time of Departure | Male | Female |
| 12:00 AM to 4:59 AM | 193 (7.4%) | 0 (0.0%) |
| 5:00 AM to 5:29 AM | 261 (10.0%) | 74 (3.8%) |
| 5:30 AM to 5:59 AM | 245 (9.4%) | 112 (5.8%) |
| 6:00 AM to 6:29 AM | 378 (14.5%) | 145 (7.5%) |
| 6:30 AM to 6:59 AM | 332 (12.7%) | 100 (5.2%) |
| 7:00 AM to 7:29 AM | 402 (15.4%) | 378 (19.6%) |
| 7:30 AM to 7:59 AM | 147 (5.6%) | 251 (13.0%) |
| 8:00 AM to 8:29 AM | 183 (7.0%) | 223 (11.6%) |
| 8:30 AM to 8:59 AM | 10 (0.4%) | 34 (1.8%) |
| 9:00 AM to 9:59 AM | 36 (1.4%) | 157 (8.1%) |
| 10:00 AM to 10:59 AM | 93 (3.6%) | 28 (1.5%) |
| 11:00 AM to 11:59 AM | 0 (0.0%) | 0 (0.0%) |
| 12:00 PM to 3:59 PM | 214 (8.2%) | 176 (9.1%) |
| 4:00 PM to 11:59 PM | 120 (4.6%) | 252 (13.1%) |
| Total | 2,614 (100.0%) | 1,930 (100.0%) |
Housing Occupancy in Ingleside
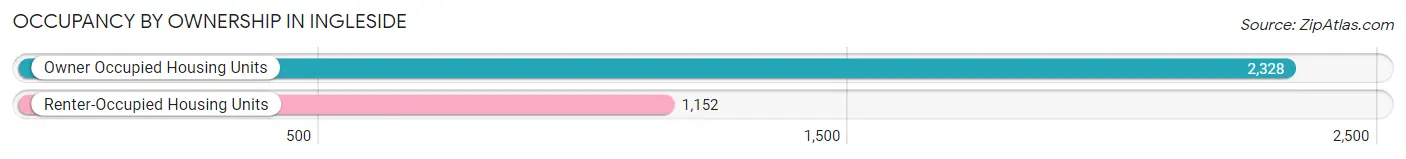
Occupancy by Ownership in Ingleside
Of the total 3,480 dwellings in Ingleside, owner-occupied units account for 2,328 (66.9%), while renter-occupied units make up 1,152 (33.1%).
| Occupancy | # Housing Units | % Housing Units |
| Owner Occupied Housing Units | 2,328 | 66.9% |
| Renter-Occupied Housing Units | 1,152 | 33.1% |
| Total Occupied Housing Units | 3,480 | 100.0% |
Occupancy by Household Size in Ingleside
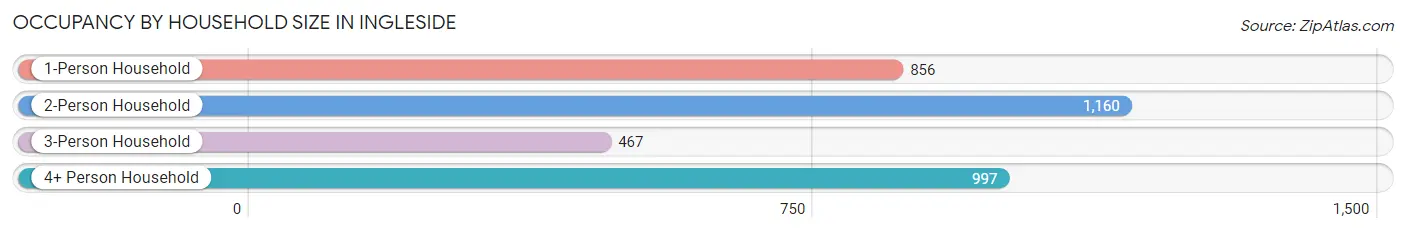
| Household Size | # Housing Units | % Housing Units |
| 1-Person Household | 856 | 24.6% |
| 2-Person Household | 1,160 | 33.3% |
| 3-Person Household | 467 | 13.4% |
| 4+ Person Household | 997 | 28.6% |
| Total Housing Units | 3,480 | 100.0% |
Occupancy by Ownership by Household Size in Ingleside
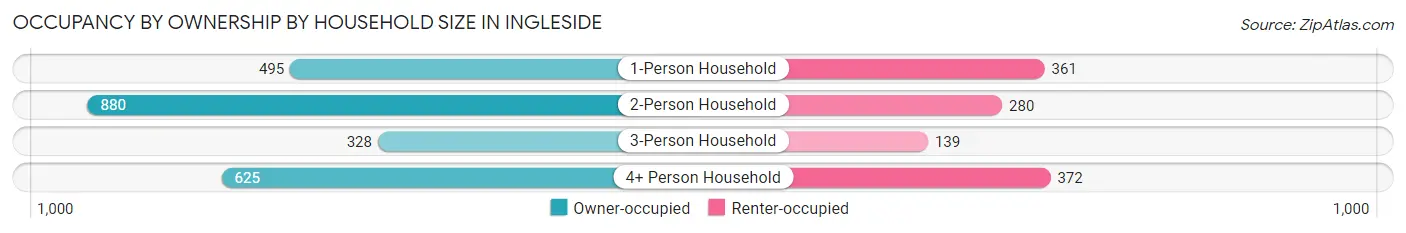
| Household Size | Owner-occupied | Renter-occupied |
| 1-Person Household | 495 (57.8%) | 361 (42.2%) |
| 2-Person Household | 880 (75.9%) | 280 (24.1%) |
| 3-Person Household | 328 (70.2%) | 139 (29.8%) |
| 4+ Person Household | 625 (62.7%) | 372 (37.3%) |
| Total Housing Units | 2,328 (66.9%) | 1,152 (33.1%) |
Occupancy by Educational Attainment in Ingleside
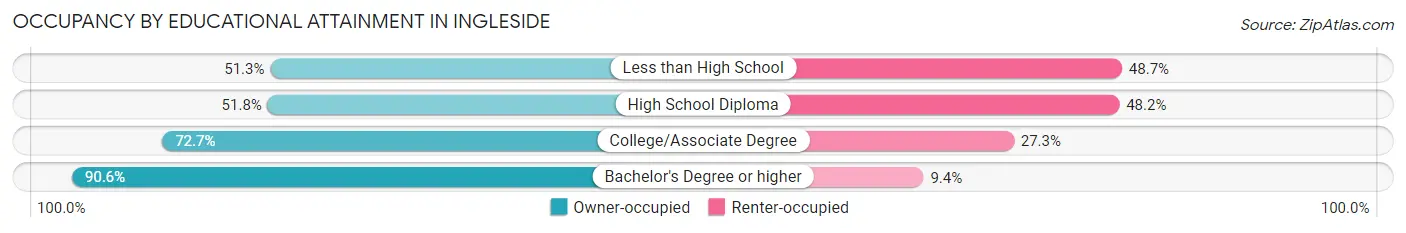
| Household Size | Owner-occupied | Renter-occupied |
| Less than High School | 140 (51.3%) | 133 (48.7%) |
| High School Diploma | 645 (51.8%) | 600 (48.2%) |
| College/Associate Degree | 954 (72.7%) | 358 (27.3%) |
| Bachelor's Degree or higher | 589 (90.6%) | 61 (9.4%) |
Occupancy by Age of Householder in Ingleside
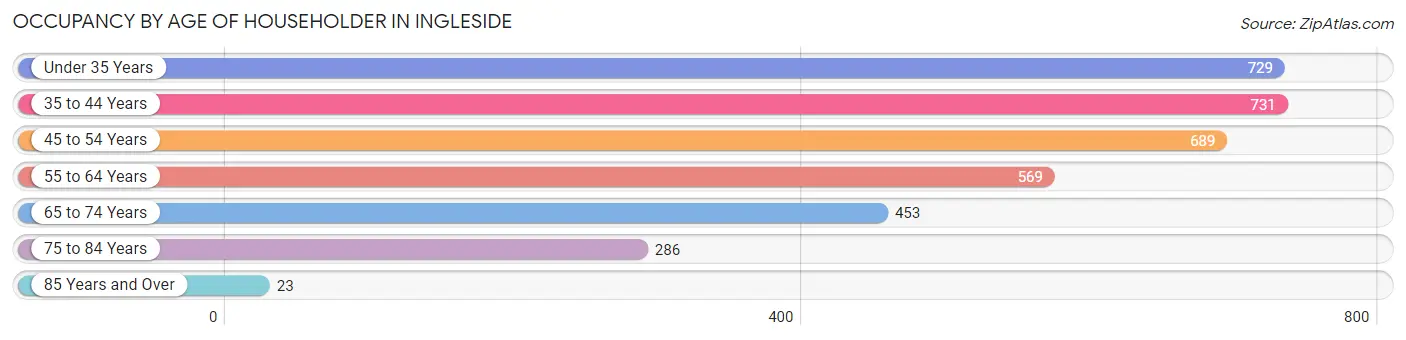
| Age Bracket | # Households | % Households |
| Under 35 Years | 729 | 20.9% |
| 35 to 44 Years | 731 | 21.0% |
| 45 to 54 Years | 689 | 19.8% |
| 55 to 64 Years | 569 | 16.4% |
| 65 to 74 Years | 453 | 13.0% |
| 75 to 84 Years | 286 | 8.2% |
| 85 Years and Over | 23 | 0.7% |
| Total | 3,480 | 100.0% |
Housing Finances in Ingleside
Median Income by Occupancy in Ingleside
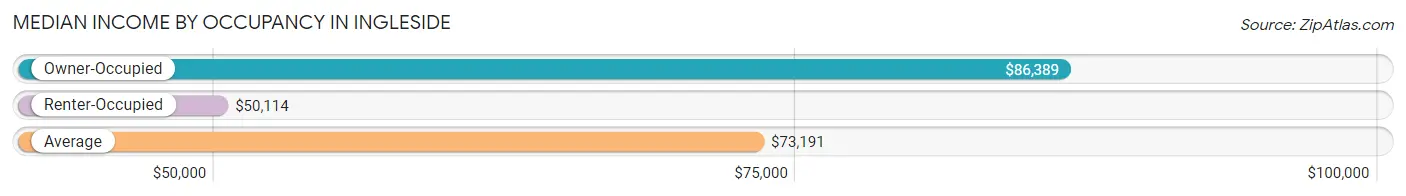
| Occupancy Type | # Households | Median Income |
| Owner-Occupied | 2,328 (66.9%) | $86,389 |
| Renter-Occupied | 1,152 (33.1%) | $50,114 |
| Average | 3,480 (100.0%) | $73,191 |
Occupancy by Householder Income Bracket in Ingleside
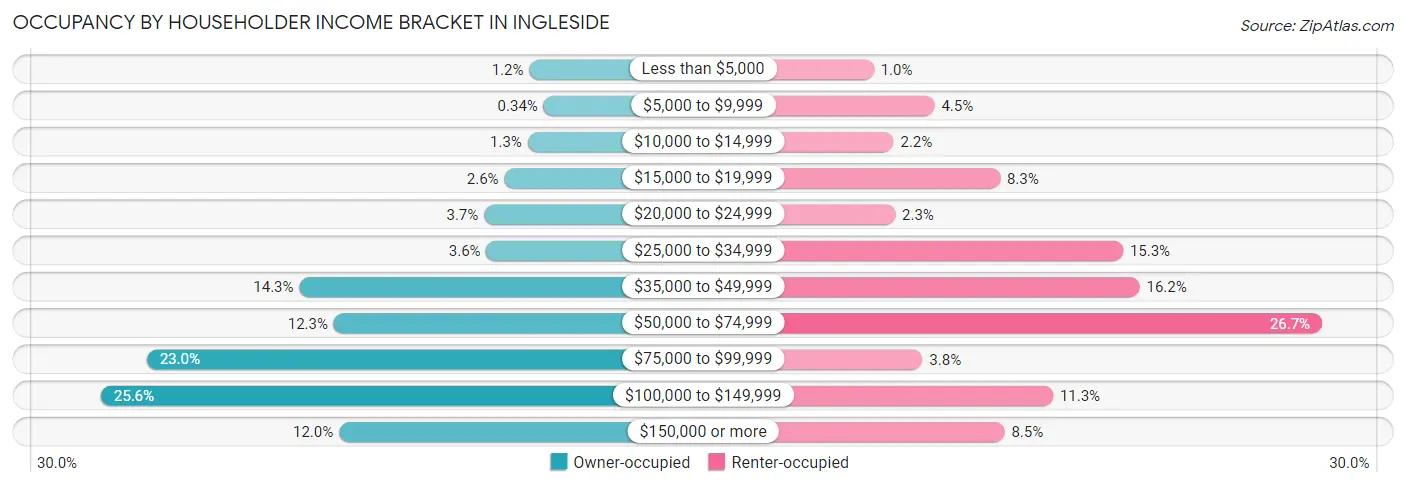
| Income Bracket | Owner-occupied | Renter-occupied |
| Less than $5,000 | 27 (1.2%) | 12 (1.0%) |
| $5,000 to $9,999 | 8 (0.3%) | 52 (4.5%) |
| $10,000 to $14,999 | 29 (1.3%) | 25 (2.2%) |
| $15,000 to $19,999 | 60 (2.6%) | 95 (8.3%) |
| $20,000 to $24,999 | 87 (3.7%) | 26 (2.3%) |
| $25,000 to $34,999 | 84 (3.6%) | 176 (15.3%) |
| $35,000 to $49,999 | 333 (14.3%) | 187 (16.2%) |
| $50,000 to $74,999 | 287 (12.3%) | 307 (26.7%) |
| $75,000 to $99,999 | 536 (23.0%) | 44 (3.8%) |
| $100,000 to $149,999 | 597 (25.6%) | 130 (11.3%) |
| $150,000 or more | 280 (12.0%) | 98 (8.5%) |
| Total | 2,328 (100.0%) | 1,152 (100.0%) |
Monthly Housing Cost Tiers in Ingleside
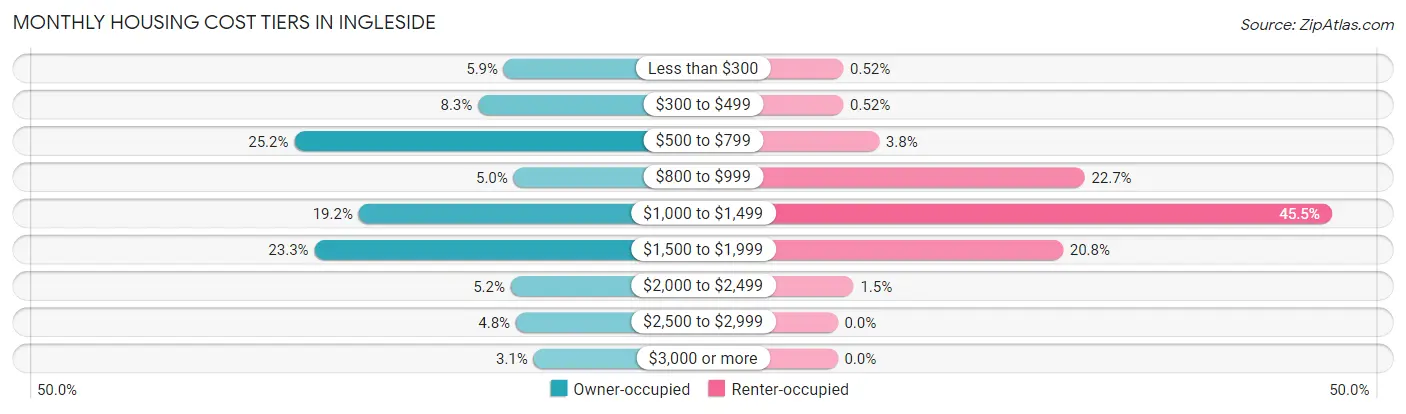
| Monthly Cost | Owner-occupied | Renter-occupied |
| Less than $300 | 137 (5.9%) | 6 (0.5%) |
| $300 to $499 | 192 (8.3%) | 6 (0.5%) |
| $500 to $799 | 586 (25.2%) | 44 (3.8%) |
| $800 to $999 | 116 (5.0%) | 262 (22.7%) |
| $1,000 to $1,499 | 448 (19.2%) | 524 (45.5%) |
| $1,500 to $1,999 | 543 (23.3%) | 239 (20.7%) |
| $2,000 to $2,499 | 122 (5.2%) | 17 (1.5%) |
| $2,500 to $2,999 | 111 (4.8%) | 0 (0.0%) |
| $3,000 or more | 73 (3.1%) | 0 (0.0%) |
| Total | 2,328 (100.0%) | 1,152 (100.0%) |
Physical Housing Characteristics in Ingleside
Housing Structures in Ingleside
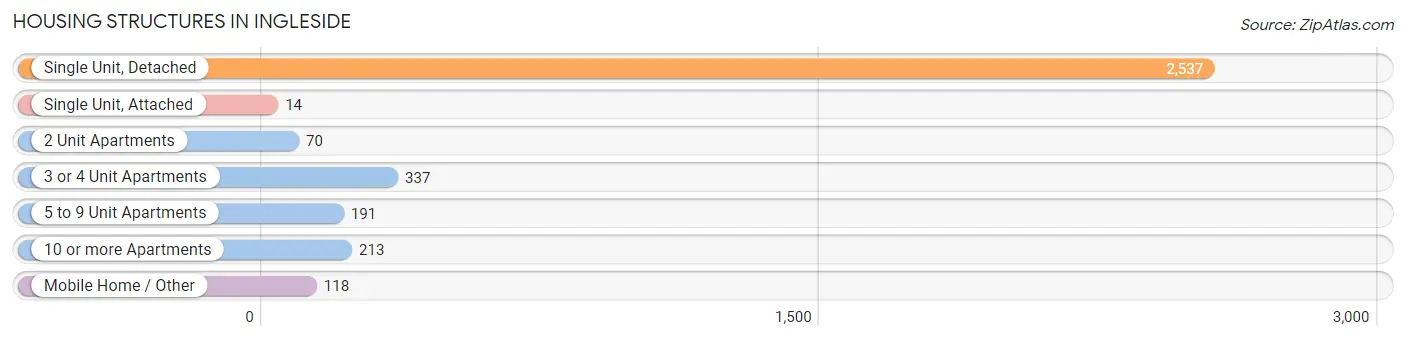
| Structure Type | # Housing Units | % Housing Units |
| Single Unit, Detached | 2,537 | 72.9% |
| Single Unit, Attached | 14 | 0.4% |
| 2 Unit Apartments | 70 | 2.0% |
| 3 or 4 Unit Apartments | 337 | 9.7% |
| 5 to 9 Unit Apartments | 191 | 5.5% |
| 10 or more Apartments | 213 | 6.1% |
| Mobile Home / Other | 118 | 3.4% |
| Total | 3,480 | 100.0% |
Housing Structures by Occupancy in Ingleside
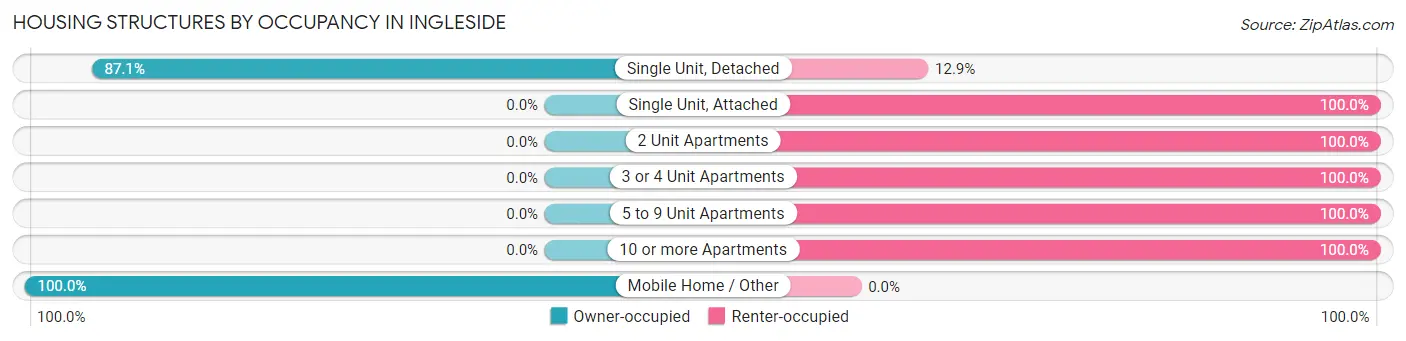
| Structure Type | Owner-occupied | Renter-occupied |
| Single Unit, Detached | 2,210 (87.1%) | 327 (12.9%) |
| Single Unit, Attached | 0 (0.0%) | 14 (100.0%) |
| 2 Unit Apartments | 0 (0.0%) | 70 (100.0%) |
| 3 or 4 Unit Apartments | 0 (0.0%) | 337 (100.0%) |
| 5 to 9 Unit Apartments | 0 (0.0%) | 191 (100.0%) |
| 10 or more Apartments | 0 (0.0%) | 213 (100.0%) |
| Mobile Home / Other | 118 (100.0%) | 0 (0.0%) |
| Total | 2,328 (66.9%) | 1,152 (33.1%) |
Housing Structures by Number of Rooms in Ingleside
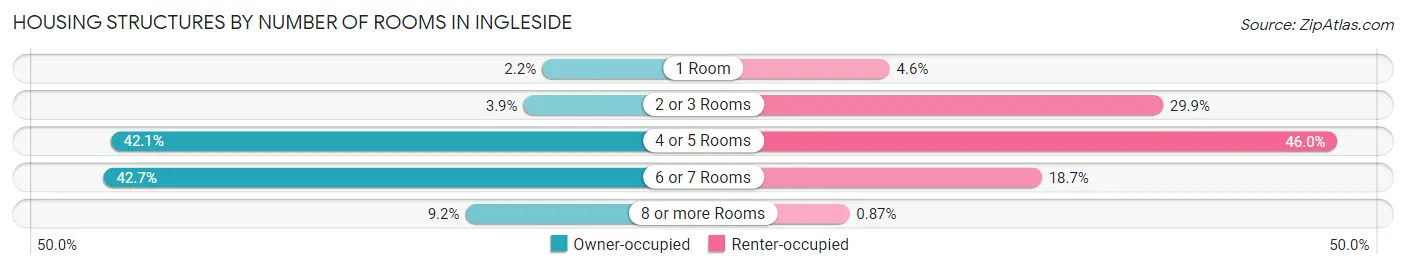
| Number of Rooms | Owner-occupied | Renter-occupied |
| 1 Room | 50 (2.1%) | 53 (4.6%) |
| 2 or 3 Rooms | 90 (3.9%) | 344 (29.9%) |
| 4 or 5 Rooms | 979 (42.0%) | 530 (46.0%) |
| 6 or 7 Rooms | 994 (42.7%) | 215 (18.7%) |
| 8 or more Rooms | 215 (9.2%) | 10 (0.9%) |
| Total | 2,328 (100.0%) | 1,152 (100.0%) |
Housing Structure by Heating Type in Ingleside
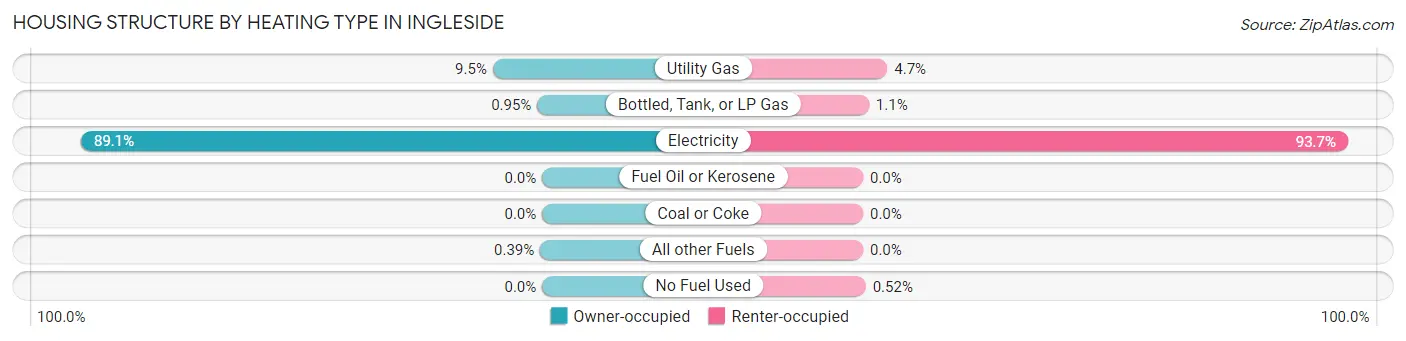
| Heating Type | Owner-occupied | Renter-occupied |
| Utility Gas | 222 (9.5%) | 54 (4.7%) |
| Bottled, Tank, or LP Gas | 22 (0.9%) | 13 (1.1%) |
| Electricity | 2,075 (89.1%) | 1,079 (93.7%) |
| Fuel Oil or Kerosene | 0 (0.0%) | 0 (0.0%) |
| Coal or Coke | 0 (0.0%) | 0 (0.0%) |
| All other Fuels | 9 (0.4%) | 0 (0.0%) |
| No Fuel Used | 0 (0.0%) | 6 (0.5%) |
| Total | 2,328 (100.0%) | 1,152 (100.0%) |
Household Vehicle Usage in Ingleside
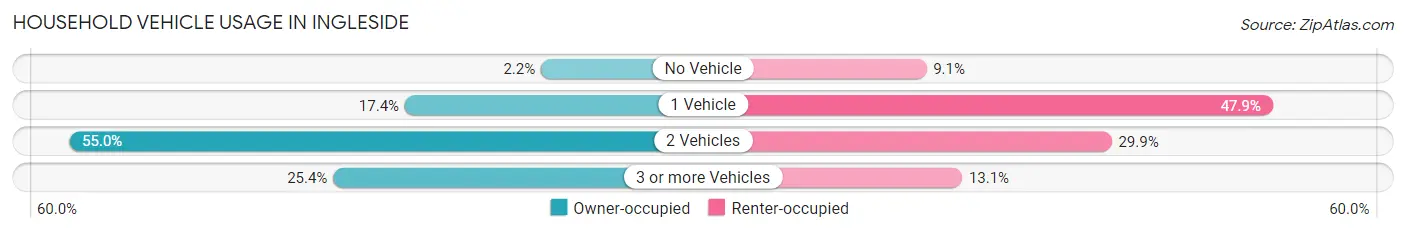
| Vehicles per Household | Owner-occupied | Renter-occupied |
| No Vehicle | 50 (2.1%) | 105 (9.1%) |
| 1 Vehicle | 405 (17.4%) | 552 (47.9%) |
| 2 Vehicles | 1,281 (55.0%) | 344 (29.9%) |
| 3 or more Vehicles | 592 (25.4%) | 151 (13.1%) |
| Total | 2,328 (100.0%) | 1,152 (100.0%) |
Real Estate & Mortgages in Ingleside
Real Estate and Mortgage Overview in Ingleside
| Characteristic | Without Mortgage | With Mortgage |
| Housing Units | 1,095 | 1,233 |
| Median Property Value | $158,600 | $177,600 |
| Median Household Income | $56,648 | $215 |
| Monthly Housing Costs | $586 | $73 |
| Real Estate Taxes | $2,394 | $34 |
Property Value by Mortgage Status in Ingleside
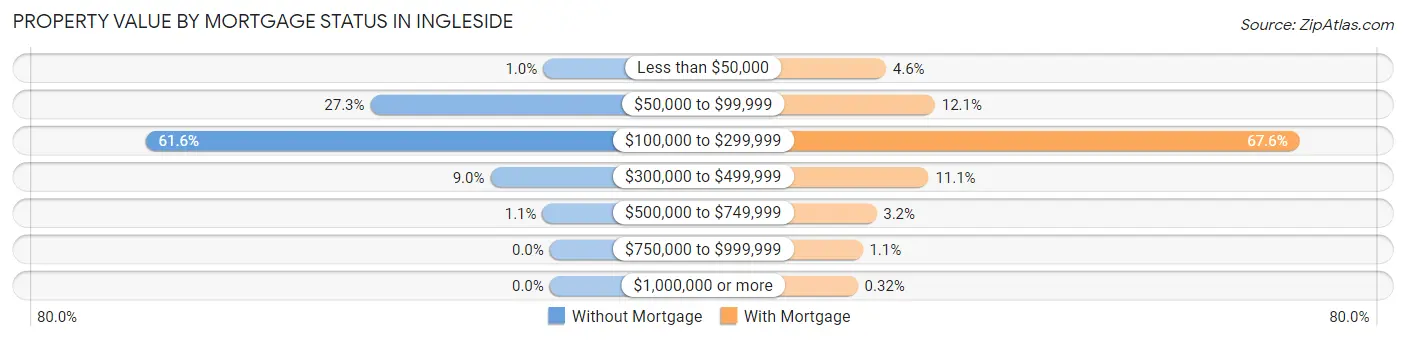
| Property Value | Without Mortgage | With Mortgage |
| Less than $50,000 | 11 (1.0%) | 57 (4.6%) |
| $50,000 to $99,999 | 299 (27.3%) | 149 (12.1%) |
| $100,000 to $299,999 | 674 (61.6%) | 834 (67.6%) |
| $300,000 to $499,999 | 99 (9.0%) | 137 (11.1%) |
| $500,000 to $749,999 | 12 (1.1%) | 39 (3.2%) |
| $750,000 to $999,999 | 0 (0.0%) | 13 (1.1%) |
| $1,000,000 or more | 0 (0.0%) | 4 (0.3%) |
| Total | 1,095 (100.0%) | 1,233 (100.0%) |
Household Income by Mortgage Status in Ingleside
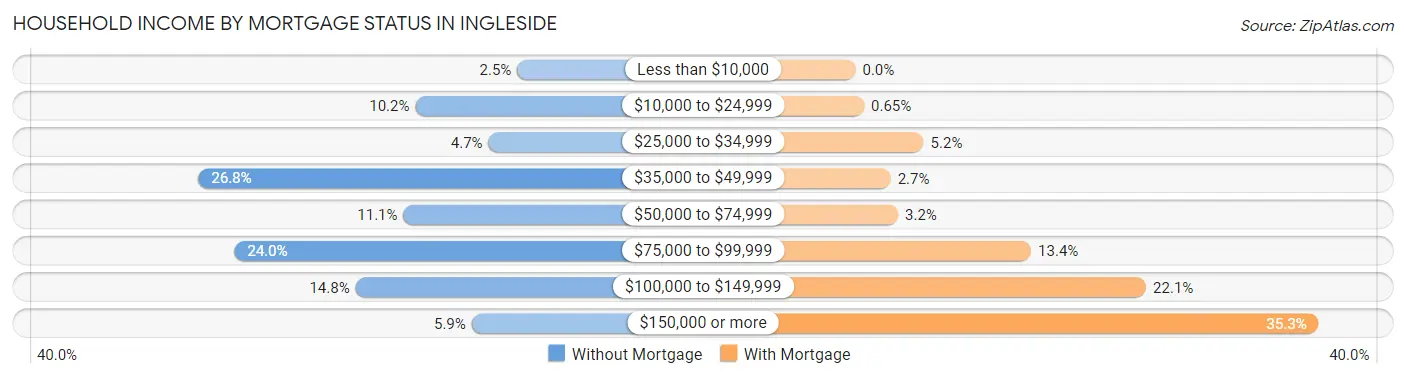
| Household Income | Without Mortgage | With Mortgage |
| Less than $10,000 | 27 (2.5%) | 0 (0.0%) |
| $10,000 to $24,999 | 112 (10.2%) | 8 (0.6%) |
| $25,000 to $34,999 | 51 (4.7%) | 64 (5.2%) |
| $35,000 to $49,999 | 293 (26.8%) | 33 (2.7%) |
| $50,000 to $74,999 | 122 (11.1%) | 40 (3.2%) |
| $75,000 to $99,999 | 263 (24.0%) | 165 (13.4%) |
| $100,000 to $149,999 | 162 (14.8%) | 273 (22.1%) |
| $150,000 or more | 65 (5.9%) | 435 (35.3%) |
| Total | 1,095 (100.0%) | 1,233 (100.0%) |
Property Value to Household Income Ratio in Ingleside
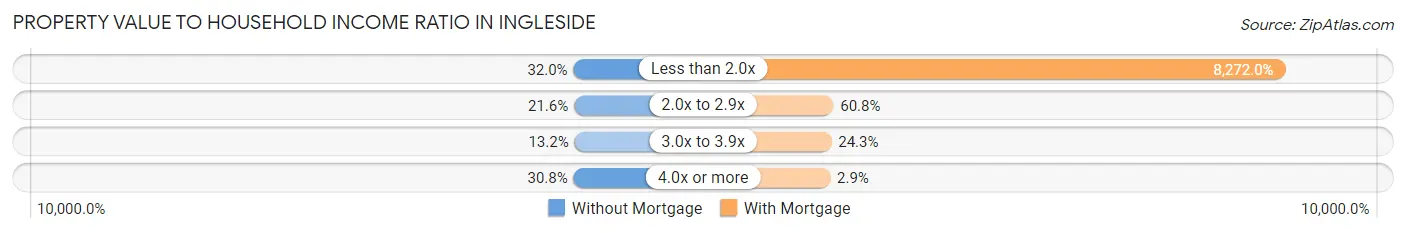
| Value-to-Income Ratio | Without Mortgage | With Mortgage |
| Less than 2.0x | 350 (32.0%) | 101,994 (8,272.0%) |
| 2.0x to 2.9x | 236 (21.5%) | 750 (60.8%) |
| 3.0x to 3.9x | 145 (13.2%) | 300 (24.3%) |
| 4.0x or more | 337 (30.8%) | 36 (2.9%) |
| Total | 1,095 (100.0%) | 1,233 (100.0%) |
Real Estate Taxes by Mortgage Status in Ingleside
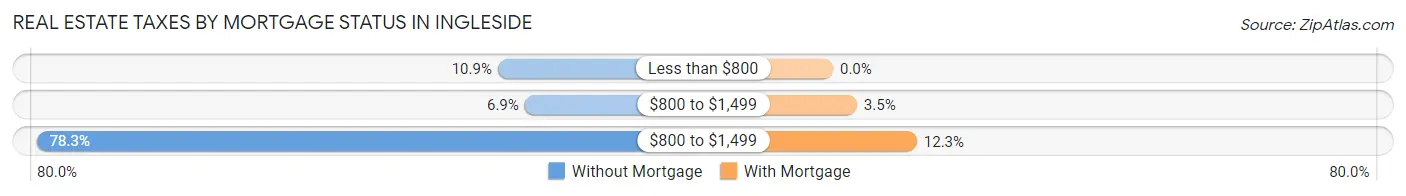
| Property Taxes | Without Mortgage | With Mortgage |
| Less than $800 | 119 (10.9%) | 0 (0.0%) |
| $800 to $1,499 | 76 (6.9%) | 43 (3.5%) |
| $800 to $1,499 | 857 (78.3%) | 151 (12.2%) |
| Total | 1,095 (100.0%) | 1,233 (100.0%) |
Health & Disability in Ingleside
Health Insurance Coverage by Age in Ingleside
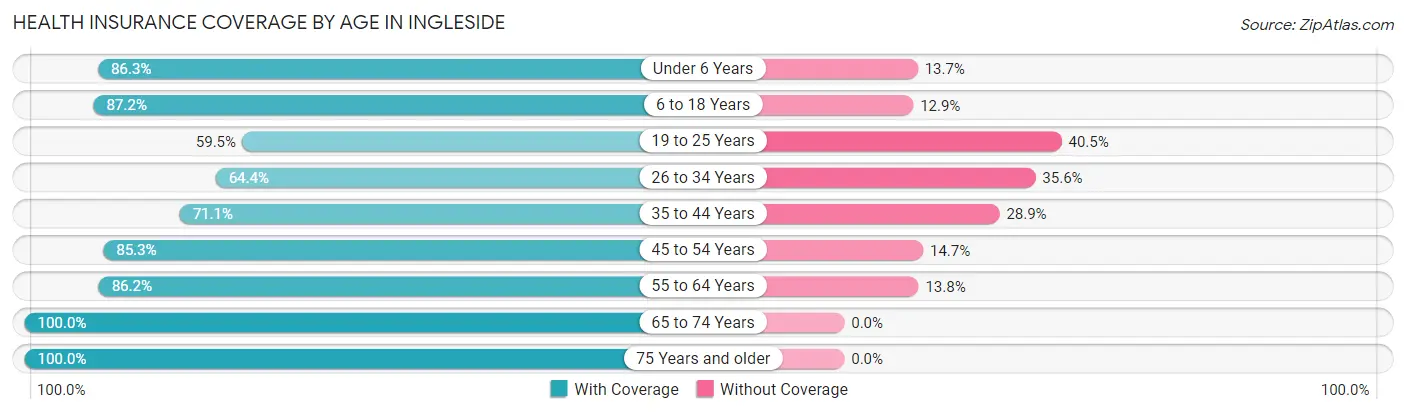
| Age Bracket | With Coverage | Without Coverage |
| Under 6 Years | 479 (86.3%) | 76 (13.7%) |
| 6 to 18 Years | 1,893 (87.2%) | 279 (12.9%) |
| 19 to 25 Years | 395 (59.5%) | 269 (40.5%) |
| 26 to 34 Years | 726 (64.4%) | 402 (35.6%) |
| 35 to 44 Years | 1,120 (71.1%) | 456 (28.9%) |
| 45 to 54 Years | 1,064 (85.3%) | 183 (14.7%) |
| 55 to 64 Years | 866 (86.2%) | 139 (13.8%) |
| 65 to 74 Years | 813 (100.0%) | 0 (0.0%) |
| 75 Years and older | 417 (100.0%) | 0 (0.0%) |
| Total | 7,773 (81.2%) | 1,804 (18.8%) |
Health Insurance Coverage by Citizenship Status in Ingleside
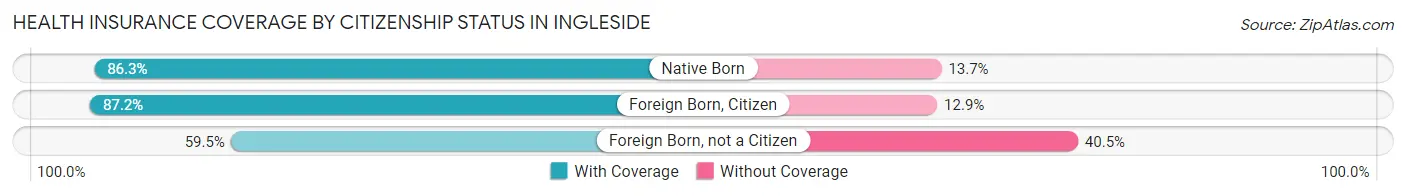
| Citizenship Status | With Coverage | Without Coverage |
| Native Born | 479 (86.3%) | 76 (13.7%) |
| Foreign Born, Citizen | 1,893 (87.2%) | 279 (12.9%) |
| Foreign Born, not a Citizen | 395 (59.5%) | 269 (40.5%) |
Health Insurance Coverage by Household Income in Ingleside
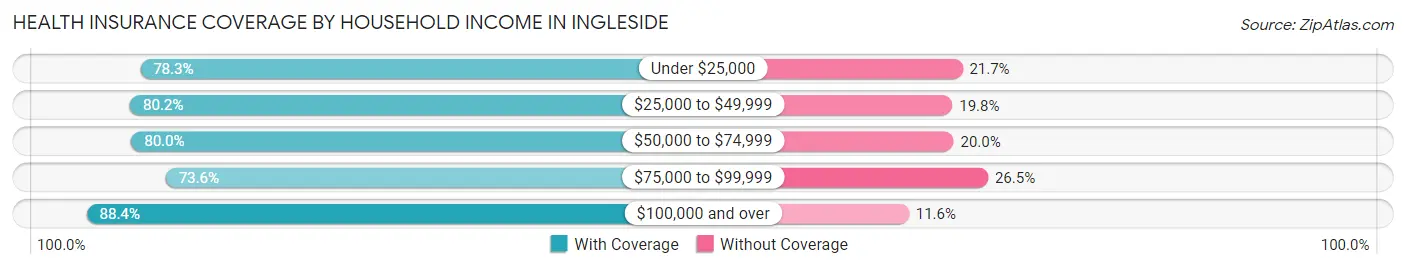
| Household Income | With Coverage | Without Coverage |
| Under $25,000 | 600 (78.3%) | 166 (21.7%) |
| $25,000 to $49,999 | 1,730 (80.2%) | 426 (19.8%) |
| $50,000 to $74,999 | 1,180 (80.0%) | 295 (20.0%) |
| $75,000 to $99,999 | 1,563 (73.6%) | 562 (26.5%) |
| $100,000 and over | 2,700 (88.4%) | 355 (11.6%) |
Public vs Private Health Insurance Coverage by Age in Ingleside
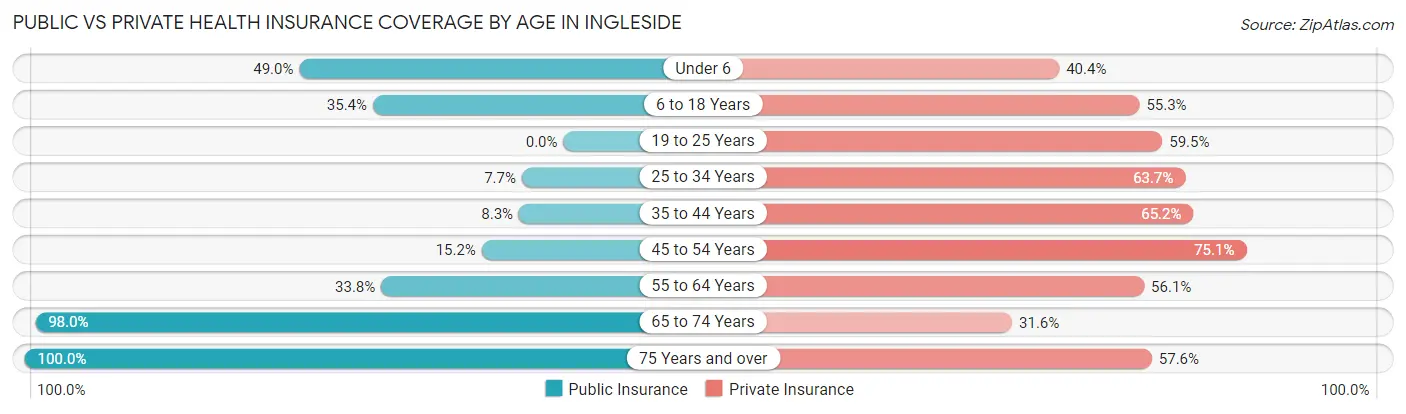
| Age Bracket | Public Insurance | Private Insurance |
| Under 6 | 272 (49.0%) | 224 (40.4%) |
| 6 to 18 Years | 768 (35.4%) | 1,200 (55.2%) |
| 19 to 25 Years | 0 (0.0%) | 395 (59.5%) |
| 25 to 34 Years | 87 (7.7%) | 719 (63.7%) |
| 35 to 44 Years | 130 (8.3%) | 1,028 (65.2%) |
| 45 to 54 Years | 189 (15.2%) | 936 (75.1%) |
| 55 to 64 Years | 340 (33.8%) | 564 (56.1%) |
| 65 to 74 Years | 797 (98.0%) | 257 (31.6%) |
| 75 Years and over | 417 (100.0%) | 240 (57.6%) |
| Total | 3,000 (31.3%) | 5,563 (58.1%) |
Disability Status by Sex by Age in Ingleside
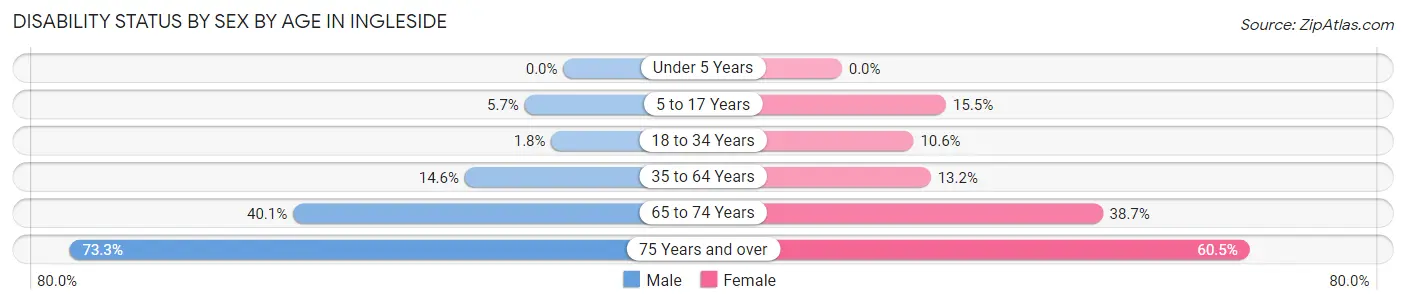
| Age Bracket | Male | Female |
| Under 5 Years | 0 (0.0%) | 0 (0.0%) |
| 5 to 17 Years | 56 (5.7%) | 182 (15.5%) |
| 18 to 34 Years | 18 (1.8%) | 100 (10.6%) |
| 35 to 64 Years | 310 (14.6%) | 226 (13.2%) |
| 65 to 74 Years | 118 (40.1%) | 201 (38.7%) |
| 75 Years and over | 198 (73.3%) | 89 (60.5%) |
Disability Class by Sex by Age in Ingleside
Disability Class: Hearing Difficulty
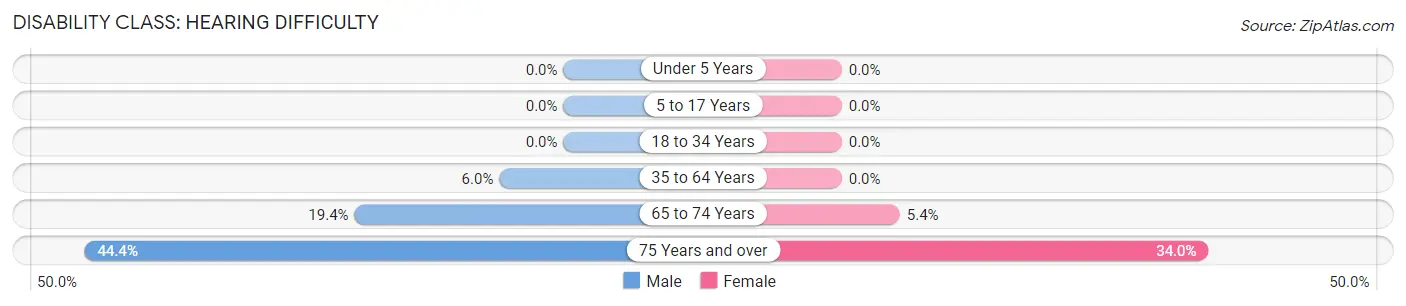
| Age Bracket | Male | Female |
| Under 5 Years | 0 (0.0%) | 0 (0.0%) |
| 5 to 17 Years | 0 (0.0%) | 0 (0.0%) |
| 18 to 34 Years | 0 (0.0%) | 0 (0.0%) |
| 35 to 64 Years | 126 (5.9%) | 0 (0.0%) |
| 65 to 74 Years | 57 (19.4%) | 28 (5.4%) |
| 75 Years and over | 120 (44.4%) | 50 (34.0%) |
Disability Class: Vision Difficulty
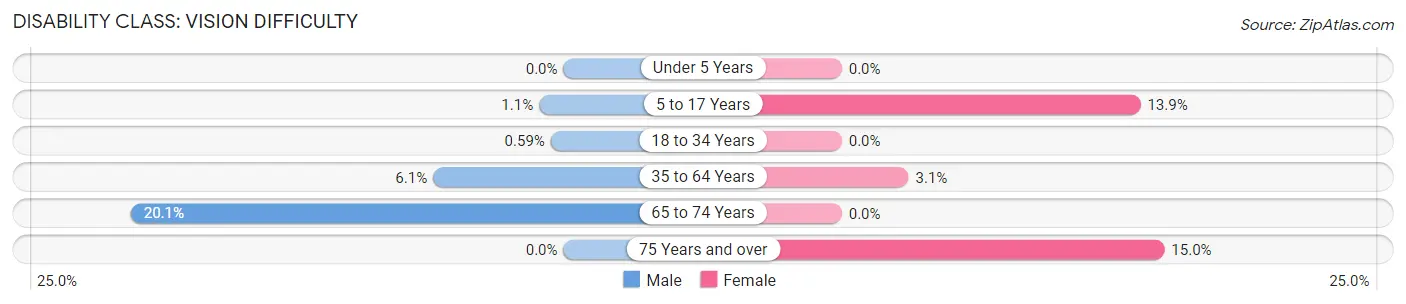
| Age Bracket | Male | Female |
| Under 5 Years | 0 (0.0%) | 0 (0.0%) |
| 5 to 17 Years | 11 (1.1%) | 163 (13.9%) |
| 18 to 34 Years | 6 (0.6%) | 0 (0.0%) |
| 35 to 64 Years | 128 (6.0%) | 53 (3.1%) |
| 65 to 74 Years | 59 (20.1%) | 0 (0.0%) |
| 75 Years and over | 0 (0.0%) | 22 (15.0%) |
Disability Class: Cognitive Difficulty
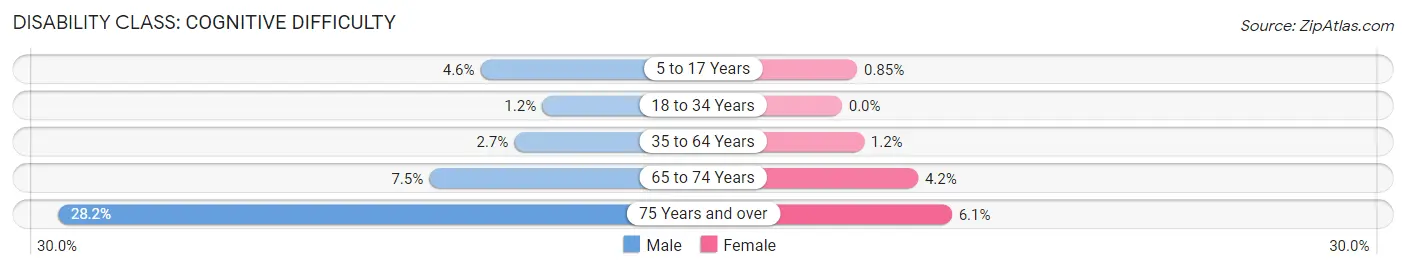
| Age Bracket | Male | Female |
| 5 to 17 Years | 45 (4.6%) | 10 (0.9%) |
| 18 to 34 Years | 12 (1.2%) | 0 (0.0%) |
| 35 to 64 Years | 58 (2.7%) | 21 (1.2%) |
| 65 to 74 Years | 22 (7.5%) | 22 (4.2%) |
| 75 Years and over | 76 (28.1%) | 9 (6.1%) |
Disability Class: Ambulatory Difficulty
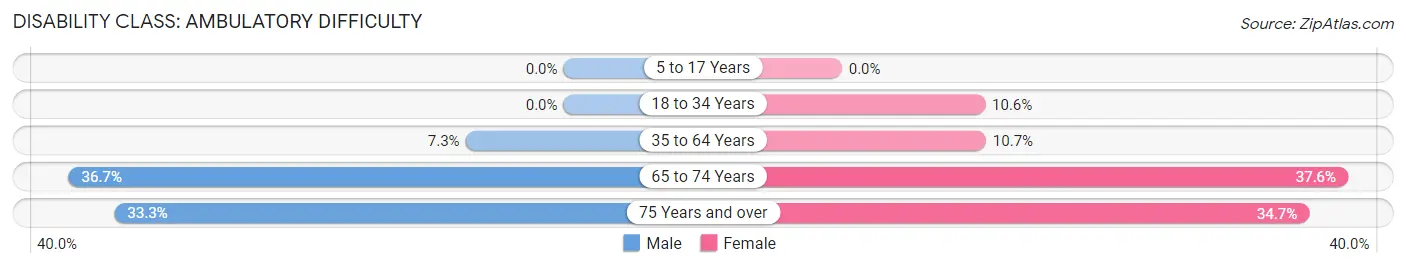
| Age Bracket | Male | Female |
| 5 to 17 Years | 0 (0.0%) | 0 (0.0%) |
| 18 to 34 Years | 0 (0.0%) | 100 (10.6%) |
| 35 to 64 Years | 154 (7.3%) | 183 (10.7%) |
| 65 to 74 Years | 108 (36.7%) | 195 (37.6%) |
| 75 Years and over | 90 (33.3%) | 51 (34.7%) |
Disability Class: Self-Care Difficulty
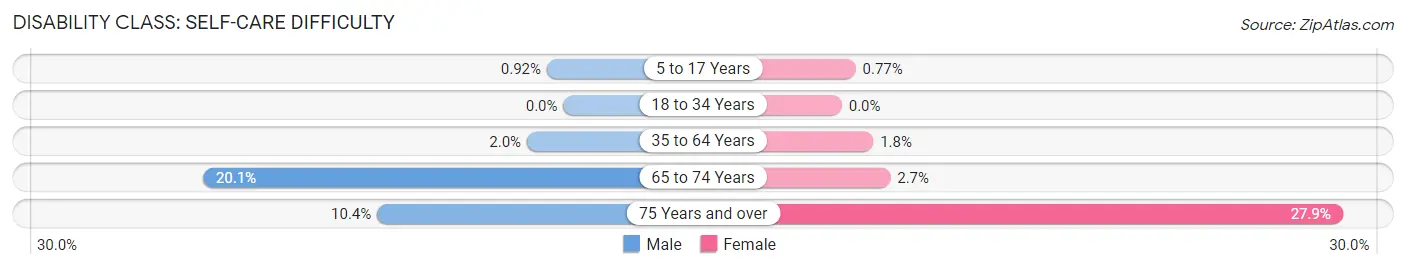
| Age Bracket | Male | Female |
| 5 to 17 Years | 9 (0.9%) | 9 (0.8%) |
| 18 to 34 Years | 0 (0.0%) | 0 (0.0%) |
| 35 to 64 Years | 43 (2.0%) | 30 (1.8%) |
| 65 to 74 Years | 59 (20.1%) | 14 (2.7%) |
| 75 Years and over | 28 (10.4%) | 41 (27.9%) |
Technology Access in Ingleside
Computing Device Access in Ingleside
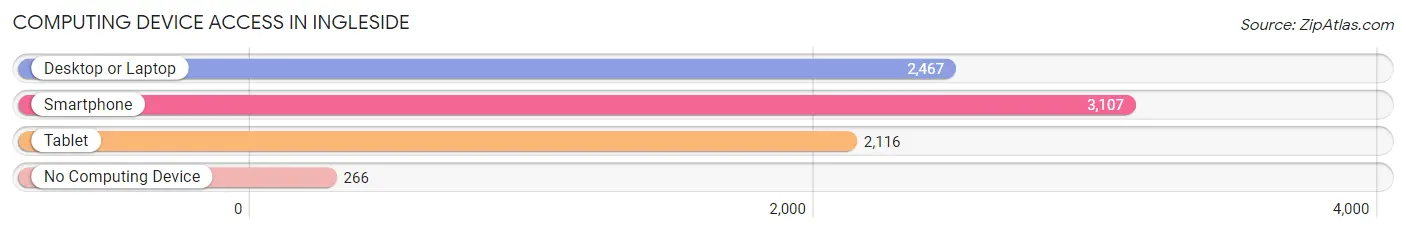
| Device Type | # Households | % Households |
| Desktop or Laptop | 2,467 | 70.9% |
| Smartphone | 3,107 | 89.3% |
| Tablet | 2,116 | 60.8% |
| No Computing Device | 266 | 7.6% |
| Total | 3,480 | 100.0% |
Internet Access in Ingleside
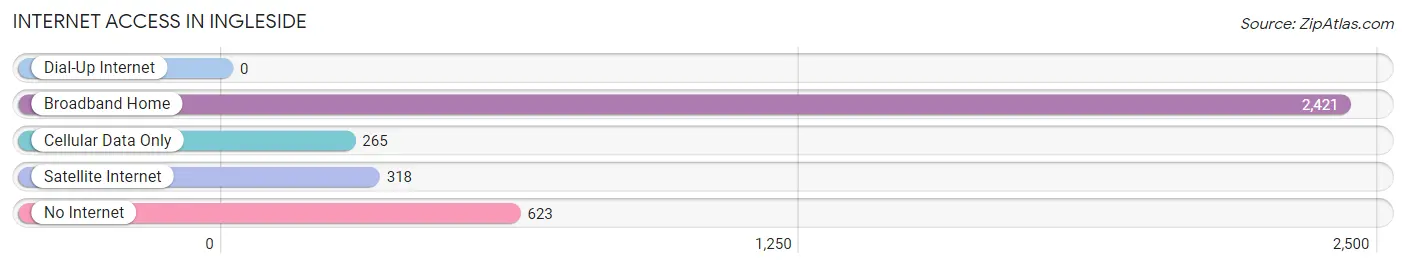
| Internet Type | # Households | % Households |
| Dial-Up Internet | 0 | 0.0% |
| Broadband Home | 2,421 | 69.6% |
| Cellular Data Only | 265 | 7.6% |
| Satellite Internet | 318 | 9.1% |
| No Internet | 623 | 17.9% |
| Total | 3,480 | 100.0% |
Ingleside Summary
Engleside, Texas is a small town located in the northern part of the state, just south of the Red River. It is part of the Texoma region, which is known for its rich history and culture. The town was founded in 1876 and has a population of just over 1,000 people.
Geography
Engleside is located in the northern part of Texas, just south of the Red River. It is part of the Texoma region, which is known for its rich history and culture. The town is situated on the banks of the Red River, and is surrounded by rolling hills and lush vegetation. The climate is generally mild, with temperatures ranging from the mid-50s in the winter to the mid-90s in the summer.
Economy
Engleside’s economy is largely based on agriculture and tourism. The town is home to several farms, which produce a variety of crops, including cotton, corn, and wheat. The town also has a thriving tourism industry, with visitors coming to enjoy the area’s natural beauty and rich history.
Demographics
As of the 2010 census, Engleside had a population of 1,072 people. The racial makeup of the town was 94.3% White, 0.7% African American, 0.3% Native American, 0.2% Asian, 0.1% Pacific Islander, and 4.4% from other races. The median household income was $37,917, and the median family income was $45,625.
History
Engleside was founded in 1876 by a group of settlers from the nearby town of Gainesville. The town was named after a local creek, which was named after a nearby plantation. The town quickly grew, and by the early 1900s, it had become a thriving agricultural center. The town was also home to several churches, schools, and businesses.
In the mid-1900s, the town began to decline as the local economy shifted away from agriculture. The town’s population began to decline, and by the 1980s, it had become a small, rural community. In recent years, the town has seen a resurgence in population and economic activity, as more people have moved to the area to take advantage of the area’s natural beauty and rich history.
Conclusion
Engleside, Texas is a small town located in the northern part of the state, just south of the Red River. It is part of the Texoma region, which is known for its rich history and culture. The town was founded in 1876 and has a population of just over 1,000 people. The town’s economy is largely based on agriculture and tourism, and the town has seen a resurgence in population and economic activity in recent years. The town is home to several farms, churches, schools, and businesses, and is a great place to visit for its natural beauty and rich history.
Common Questions
What is Per Capita Income in Ingleside?
Per Capita income in Ingleside is $32,271.
What is the Median Family Income in Ingleside?
Median Family Income in Ingleside is $77,706.
What is the Median Household income in Ingleside?
Median Household Income in Ingleside is $73,191.
What is Income or Wage Gap in Ingleside?
Income or Wage Gap in Ingleside is 35.6%.
Women in Ingleside earn 64.4 cents for every dollar earned by a man.
What is Inequality or Gini Index in Ingleside?
Inequality or Gini Index in Ingleside is 0.39.
What is the Total Population of Ingleside?
Total Population of Ingleside is 9,713.
What is the Total Male Population of Ingleside?
Total Male Population of Ingleside is 5,050.
What is the Total Female Population of Ingleside?
Total Female Population of Ingleside is 4,663.
What is the Ratio of Males per 100 Females in Ingleside?
There are 108.30 Males per 100 Females in Ingleside.
What is the Ratio of Females per 100 Males in Ingleside?
There are 92.34 Females per 100 Males in Ingleside.
What is the Median Population Age in Ingleside?
Median Population Age in Ingleside is 36.9 Years.
What is the Average Family Size in Ingleside
Average Family Size in Ingleside is 3.3 People.
What is the Average Household Size in Ingleside
Average Household Size in Ingleside is 2.8 People.
How Large is the Labor Force in Ingleside?
There are 4,916 People in the Labor Forcein in Ingleside.
What is the Percentage of People in the Labor Force in Ingleside?
66.2% of People are in the Labor Force in Ingleside.
What is the Unemployment Rate in Ingleside?
Unemployment Rate in Ingleside is 1.7%.