Providence Village, TX Map & Demographics
Providence Village Map
Providence Village Overview
$34,994
PER CAPITA INCOME
$103,871
AVG FAMILY INCOME
$101,654
AVG HOUSEHOLD INCOME
38.8%
WAGE / INCOME GAP [ % ]
61.2¢/ $1
WAGE / INCOME GAP [ $ ]
0.29
INEQUALITY / GINI INDEX
7,710
TOTAL POPULATION
3,306
MALE POPULATION
4,404
FEMALE POPULATION
75.07
MALES / 100 FEMALES
133.21
FEMALES / 100 MALES
33.4
MEDIAN AGE
3.3
AVG FAMILY SIZE
3.1
AVG HOUSEHOLD SIZE
3,671
LABOR FORCE [ PEOPLE ]
70.5%
PERCENT IN LABOR FORCE
2.4%
UNEMPLOYMENT RATE
Providence Village Area Codes
Income in Providence Village
Income Overview in Providence Village
Per Capita Income in Providence Village is $34,994, while median incomes of families and households are $103,871 and $101,654 respectively.
| Characteristic | Number | Measure |
| Per Capita Income | 7,710 | $34,994 |
| Median Family Income | 2,164 | $103,871 |
| Mean Family Income | 2,164 | $105,526 |
| Median Household Income | 2,480 | $101,654 |
| Mean Household Income | 2,480 | $104,960 |
| Income Deficit | 2,164 | $0 |
| Wage / Income Gap (%) | 7,710 | 38.83% |
| Wage / Income Gap ($) | 7,710 | 61.17¢ per $1 |
| Gini / Inequality Index | 7,710 | 0.29 |
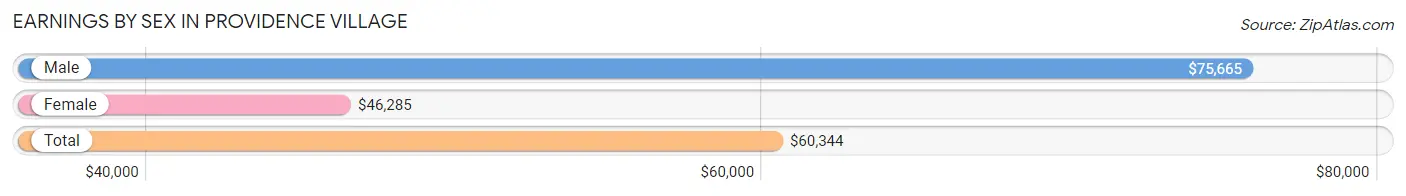
Earnings by Sex in Providence Village
Average Earnings in Providence Village are $60,344, $75,665 for men and $46,285 for women, a difference of 38.8%.
| Sex | Number | Average Earnings |
| Male | 1,868 (48.2%) | $75,665 |
| Female | 2,009 (51.8%) | $46,285 |
| Total | 3,877 (100.0%) | $60,344 |
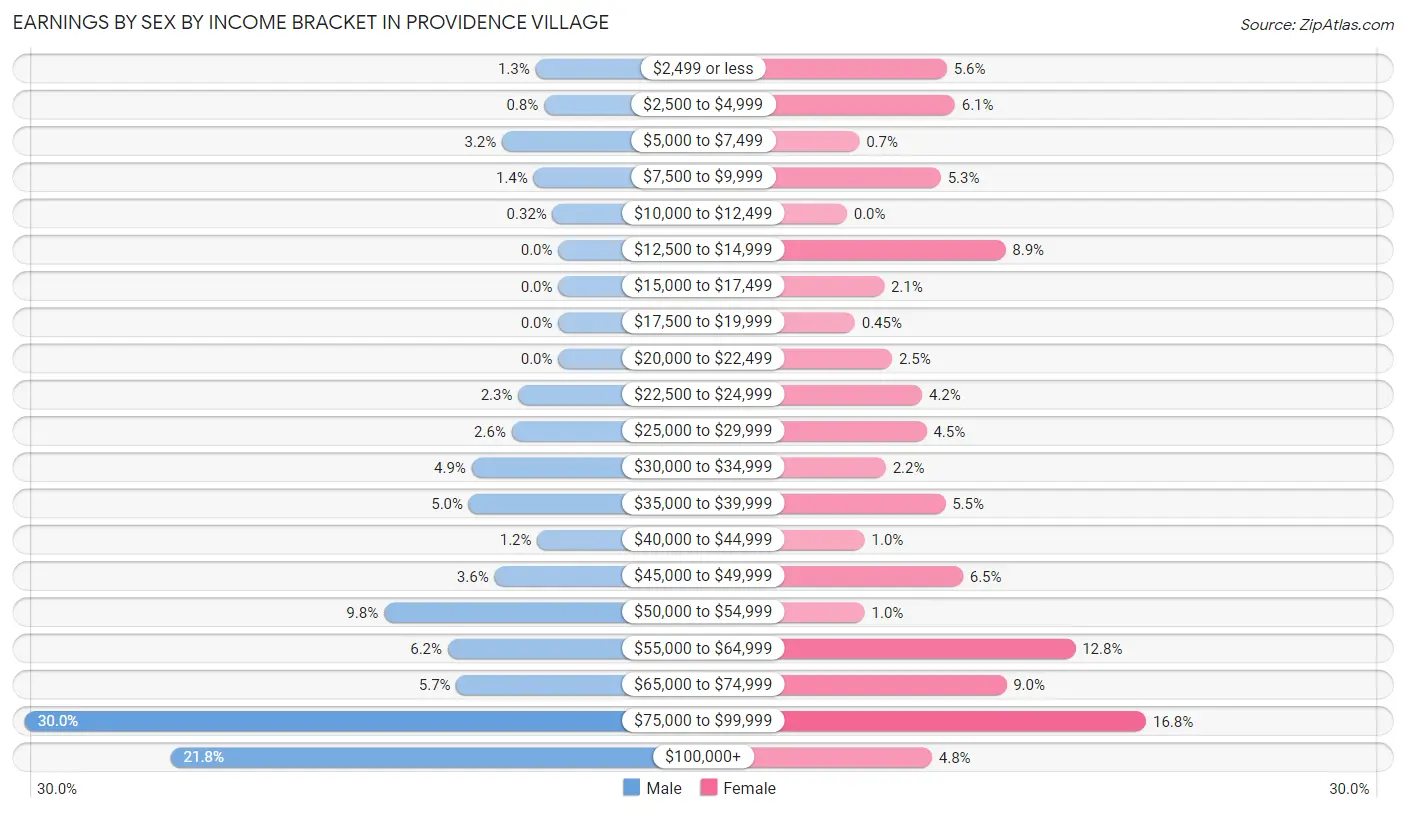
Earnings by Sex by Income Bracket in Providence Village
The most common earnings brackets in Providence Village are $75,000 to $99,999 for men (560 | 30.0%) and $75,000 to $99,999 for women (338 | 16.8%).
| Income | Male | Female |
| $2,499 or less | 24 (1.3%) | 113 (5.6%) |
| $2,500 to $4,999 | 15 (0.8%) | 122 (6.1%) |
| $5,000 to $7,499 | 59 (3.2%) | 14 (0.7%) |
| $7,500 to $9,999 | 26 (1.4%) | 106 (5.3%) |
| $10,000 to $12,499 | 6 (0.3%) | 0 (0.0%) |
| $12,500 to $14,999 | 0 (0.0%) | 179 (8.9%) |
| $15,000 to $17,499 | 0 (0.0%) | 42 (2.1%) |
| $17,500 to $19,999 | 0 (0.0%) | 9 (0.4%) |
| $20,000 to $22,499 | 0 (0.0%) | 51 (2.5%) |
| $22,500 to $24,999 | 42 (2.2%) | 85 (4.2%) |
| $25,000 to $29,999 | 49 (2.6%) | 90 (4.5%) |
| $30,000 to $34,999 | 91 (4.9%) | 44 (2.2%) |
| $35,000 to $39,999 | 94 (5.0%) | 111 (5.5%) |
| $40,000 to $44,999 | 22 (1.2%) | 20 (1.0%) |
| $45,000 to $49,999 | 67 (3.6%) | 131 (6.5%) |
| $50,000 to $54,999 | 183 (9.8%) | 20 (1.0%) |
| $55,000 to $64,999 | 116 (6.2%) | 258 (12.8%) |
| $65,000 to $74,999 | 107 (5.7%) | 180 (9.0%) |
| $75,000 to $99,999 | 560 (30.0%) | 338 (16.8%) |
| $100,000+ | 407 (21.8%) | 96 (4.8%) |
| Total | 1,868 (100.0%) | 2,009 (100.0%) |
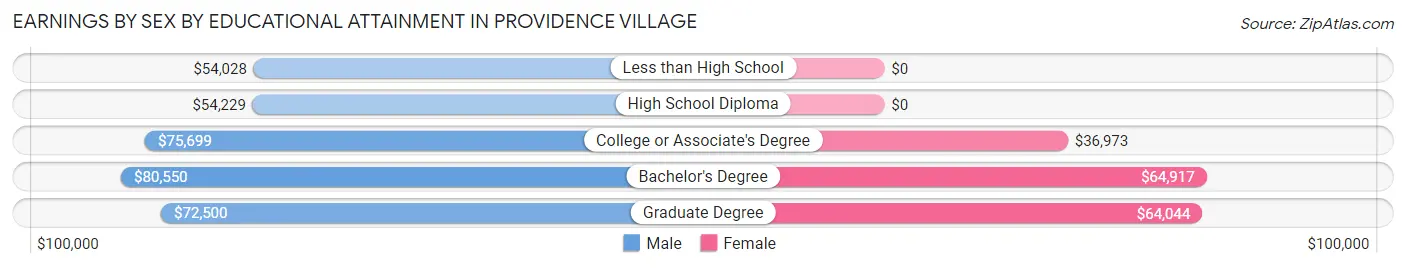
Earnings by Sex by Educational Attainment in Providence Village
Average earnings in Providence Village are $76,391 for men and $49,000 for women, a difference of 35.9%. Men with an educational attainment of bachelor's degree enjoy the highest average annual earnings of $80,550, while those with less than high school education earn the least with $54,028. Women with an educational attainment of bachelor's degree earn the most with the average annual earnings of $64,917, while those with college or associate's degree education have the smallest earnings of $36,973.
| Educational Attainment | Male Income | Female Income |
| Less than High School | $54,028 | $0 |
| High School Diploma | $54,229 | $0 |
| College or Associate's Degree | $75,699 | $36,973 |
| Bachelor's Degree | $80,550 | $64,917 |
| Graduate Degree | $72,500 | $64,044 |
| Total | $76,391 | $49,000 |
Family Income in Providence Village
Family Income Brackets in Providence Village
According to the Providence Village family income data, there are 734 families falling into the $100,000 to $149,999 income range, which is the most common income bracket and makes up 33.9% of all families.
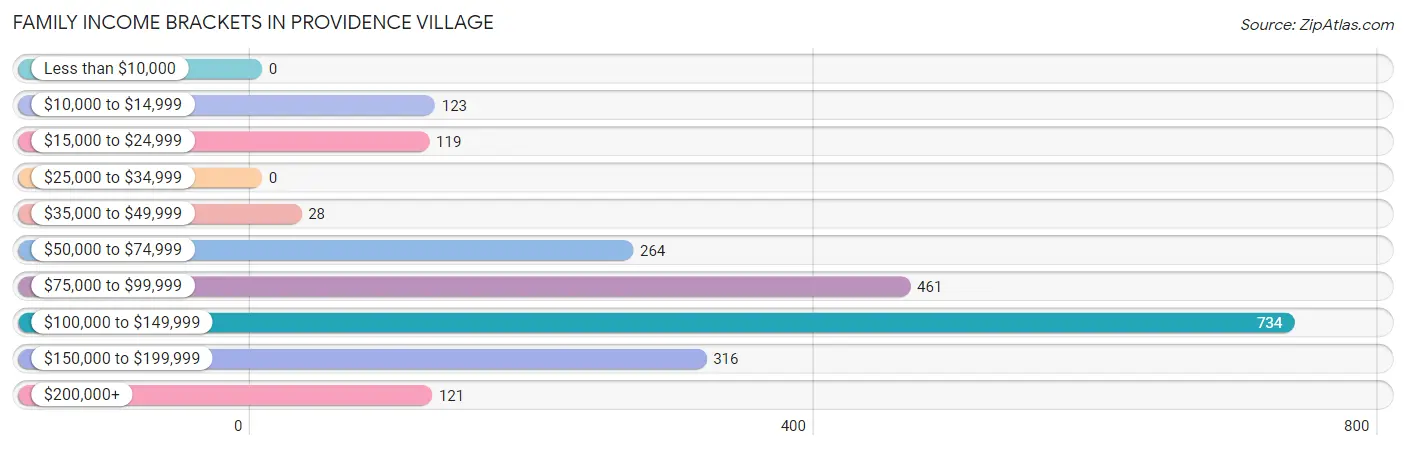
| Income Bracket | # Families | % Families |
| Less than $10,000 | 0 | 0.0% |
| $10,000 to $14,999 | 123 | 5.7% |
| $15,000 to $24,999 | 119 | 5.5% |
| $25,000 to $34,999 | 0 | 0.0% |
| $35,000 to $49,999 | 28 | 1.3% |
| $50,000 to $74,999 | 264 | 12.2% |
| $75,000 to $99,999 | 461 | 21.3% |
| $100,000 to $149,999 | 734 | 33.9% |
| $150,000 to $199,999 | 316 | 14.6% |
| $200,000+ | 121 | 5.6% |
Family Income by Famaliy Size in Providence Village
4-person families (530 | 24.5%) account for the highest median family income in Providence Village with $111,389 per family, while 2-person families (919 | 42.5%) have the highest median income of $51,996 per family member.
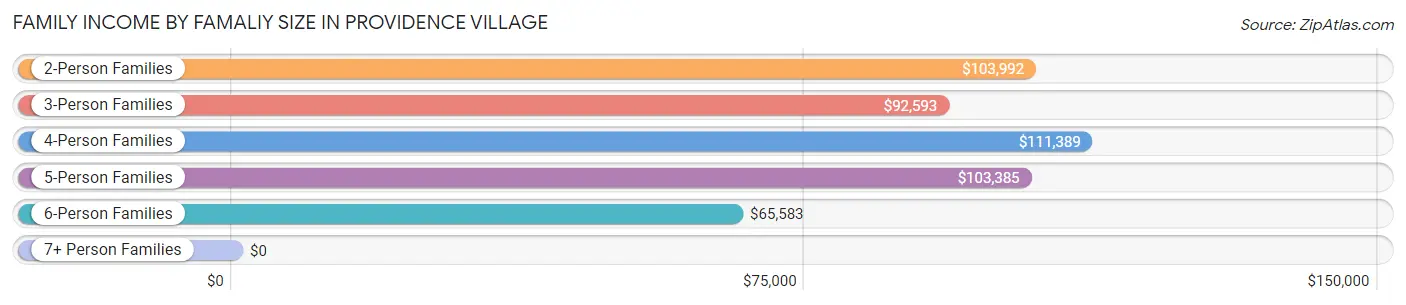
| Income Bracket | # Families | Median Income |
| 2-Person Families | 919 (42.5%) | $103,992 |
| 3-Person Families | 300 (13.9%) | $92,593 |
| 4-Person Families | 530 (24.5%) | $111,389 |
| 5-Person Families | 269 (12.4%) | $103,385 |
| 6-Person Families | 53 (2.5%) | $65,583 |
| 7+ Person Families | 93 (4.3%) | $0 |
| Total | 2,164 (100.0%) | $103,871 |
Family Income by Number of Earners in Providence Village
The median family income in Providence Village is $103,871, with families comprising 3+ earners (181) having the highest median family income of $141,940, while families with no earners (221) have the lowest median family income of $54,267, accounting for 8.4% and 10.2% of families, respectively.
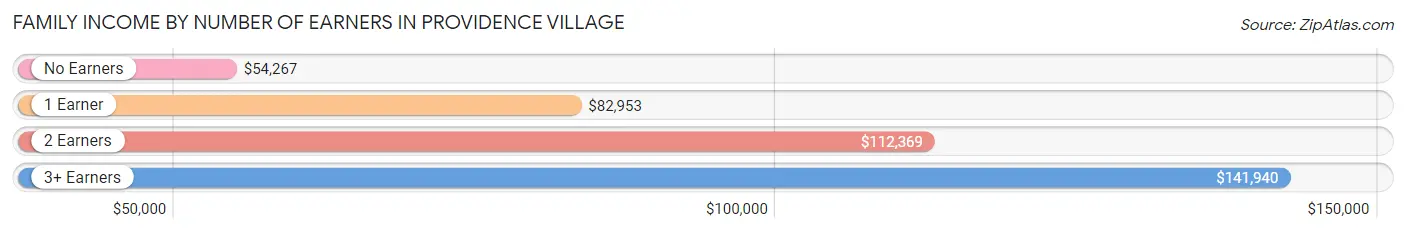
| Number of Earners | # Families | Median Income |
| No Earners | 221 (10.2%) | $54,267 |
| 1 Earner | 713 (33.0%) | $82,953 |
| 2 Earners | 1,049 (48.5%) | $112,369 |
| 3+ Earners | 181 (8.4%) | $141,940 |
| Total | 2,164 (100.0%) | $103,871 |
Household Income in Providence Village
Household Income Brackets in Providence Village
With 804 households falling in the category, the $100,000 to $149,999 income range is the most frequent in Providence Village, accounting for 32.4% of all households.
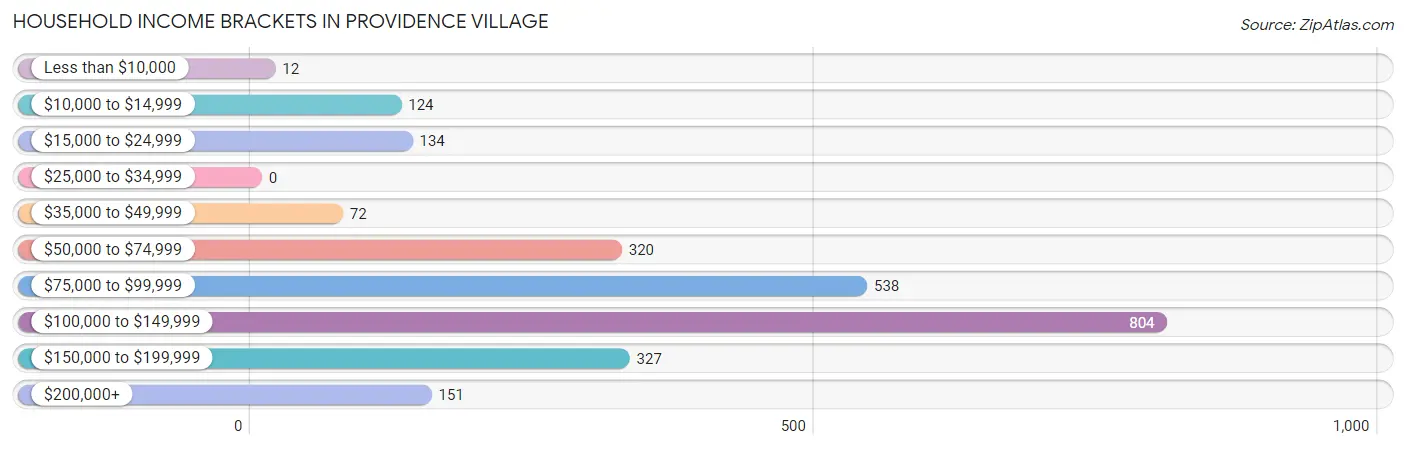
| Income Bracket | # Households | % Households |
| Less than $10,000 | 12 | 0.5% |
| $10,000 to $14,999 | 124 | 5.0% |
| $15,000 to $24,999 | 134 | 5.4% |
| $25,000 to $34,999 | 0 | 0.0% |
| $35,000 to $49,999 | 72 | 2.9% |
| $50,000 to $74,999 | 320 | 12.9% |
| $75,000 to $99,999 | 538 | 21.7% |
| $100,000 to $149,999 | 804 | 32.4% |
| $150,000 to $199,999 | 327 | 13.2% |
| $200,000+ | 151 | 6.1% |
Household Income by Householder Age in Providence Village
The median household income in Providence Village is $101,654, with the highest median household income of $111,023 found in the 45 to 64 years age bracket for the primary householder. A total of 739 households (29.8%) fall into this category.
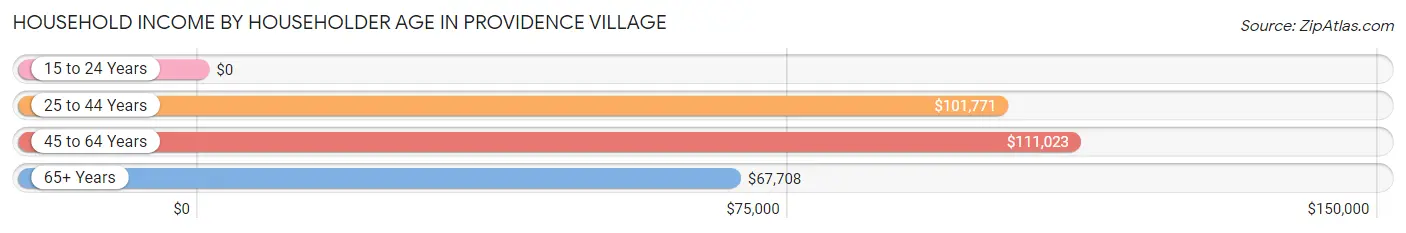
| Income Bracket | # Households | Median Income |
| 15 to 24 Years | 0 (0.0%) | $0 |
| 25 to 44 Years | 1,469 (59.2%) | $101,771 |
| 45 to 64 Years | 739 (29.8%) | $111,023 |
| 65+ Years | 272 (11.0%) | $67,708 |
| Total | 2,480 (100.0%) | $101,654 |
Poverty in Providence Village
Income Below Poverty by Sex and Age in Providence Village
With 14.3% poverty level for males and 12.8% for females among the residents of Providence Village, 65 to 74 year old males and 5 year old females are the most vulnerable to poverty, with 51 males (53.1%) and 58 females (36.2%) in their respective age groups living below the poverty level.
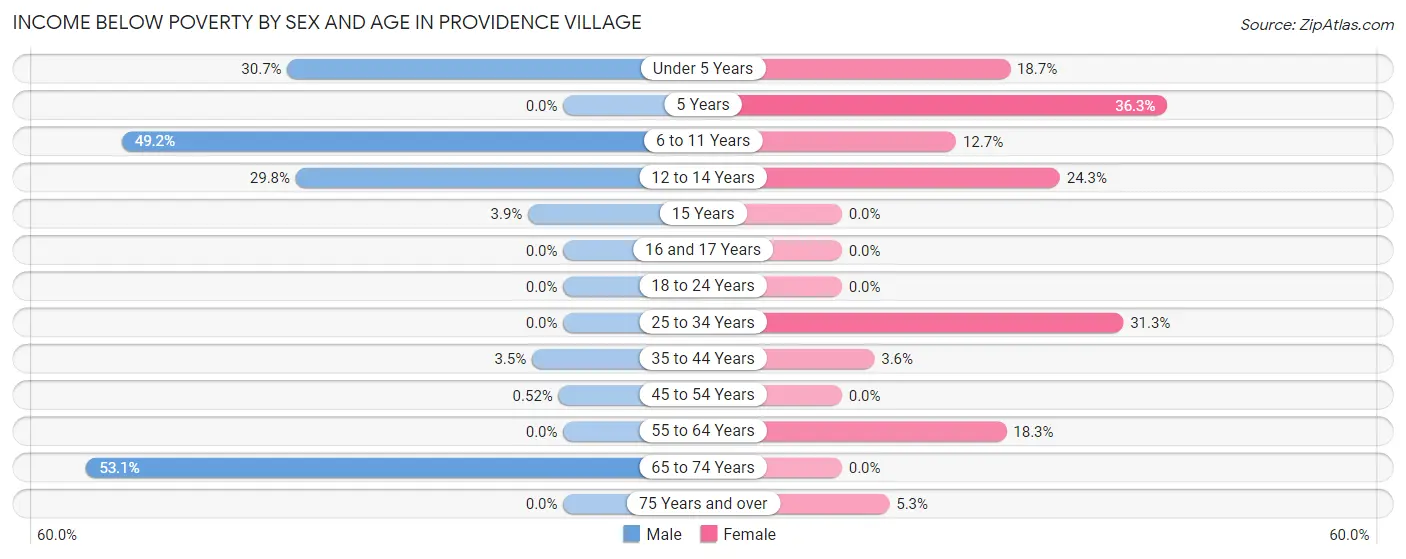
| Age Bracket | Male | Female |
| Under 5 Years | 63 (30.7%) | 59 (18.7%) |
| 5 Years | 0 (0.0%) | 58 (36.2%) |
| 6 to 11 Years | 238 (49.2%) | 64 (12.7%) |
| 12 to 14 Years | 87 (29.8%) | 59 (24.3%) |
| 15 Years | 2 (3.9%) | 0 (0.0%) |
| 16 and 17 Years | 0 (0.0%) | 0 (0.0%) |
| 18 to 24 Years | 0 (0.0%) | 0 (0.0%) |
| 25 to 34 Years | 0 (0.0%) | 230 (31.3%) |
| 35 to 44 Years | 29 (3.5%) | 30 (3.6%) |
| 45 to 54 Years | 2 (0.5%) | 0 (0.0%) |
| 55 to 64 Years | 0 (0.0%) | 46 (18.3%) |
| 65 to 74 Years | 51 (53.1%) | 0 (0.0%) |
| 75 Years and over | 0 (0.0%) | 12 (5.3%) |
| Total | 472 (14.3%) | 558 (12.8%) |
Income Above Poverty by Sex and Age in Providence Village
According to the poverty statistics in Providence Village, males aged 5 years and females aged 15 years are the age groups that are most secure financially, with 100.0% of males and 100.0% of females in these age groups living above the poverty line.
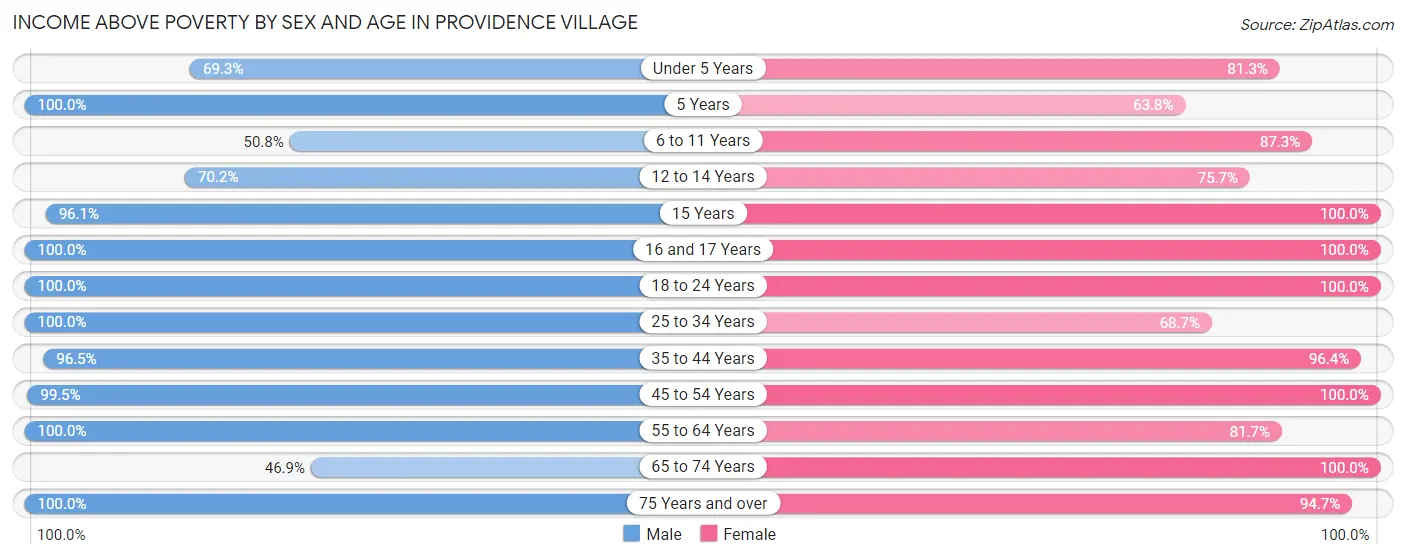
| Age Bracket | Male | Female |
| Under 5 Years | 142 (69.3%) | 256 (81.3%) |
| 5 Years | 100 (100.0%) | 102 (63.7%) |
| 6 to 11 Years | 246 (50.8%) | 439 (87.3%) |
| 12 to 14 Years | 205 (70.2%) | 184 (75.7%) |
| 15 Years | 49 (96.1%) | 117 (100.0%) |
| 16 and 17 Years | 71 (100.0%) | 37 (100.0%) |
| 18 to 24 Years | 105 (100.0%) | 200 (100.0%) |
| 25 to 34 Years | 428 (100.0%) | 504 (68.7%) |
| 35 to 44 Years | 803 (96.5%) | 798 (96.4%) |
| 45 to 54 Years | 384 (99.5%) | 463 (100.0%) |
| 55 to 64 Years | 200 (100.0%) | 205 (81.7%) |
| 65 to 74 Years | 45 (46.9%) | 293 (100.0%) |
| 75 Years and over | 56 (100.0%) | 215 (94.7%) |
| Total | 2,834 (85.7%) | 3,813 (87.2%) |
Income Below Poverty Among Married-Couple Families in Providence Village
The poverty statistics for married-couple families in Providence Village show that 4.8% or 76 of the total 1,571 families live below the poverty line. Families with no children have the highest poverty rate of 7.4%, comprising of 46 families. On the other hand, families with 3 or 4 children have the lowest poverty rate of 1.4%, which includes 3 families.
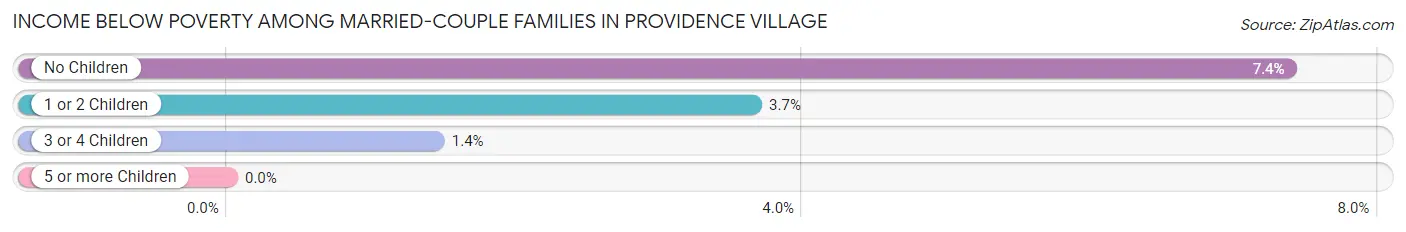
| Children | Above Poverty | Below Poverty |
| No Children | 578 (92.6%) | 46 (7.4%) |
| 1 or 2 Children | 712 (96.4%) | 27 (3.6%) |
| 3 or 4 Children | 205 (98.6%) | 3 (1.4%) |
| 5 or more Children | 0 (0.0%) | 0 (0.0%) |
| Total | 1,495 (95.2%) | 76 (4.8%) |
Income Below Poverty Among Single-Parent Households in Providence Village
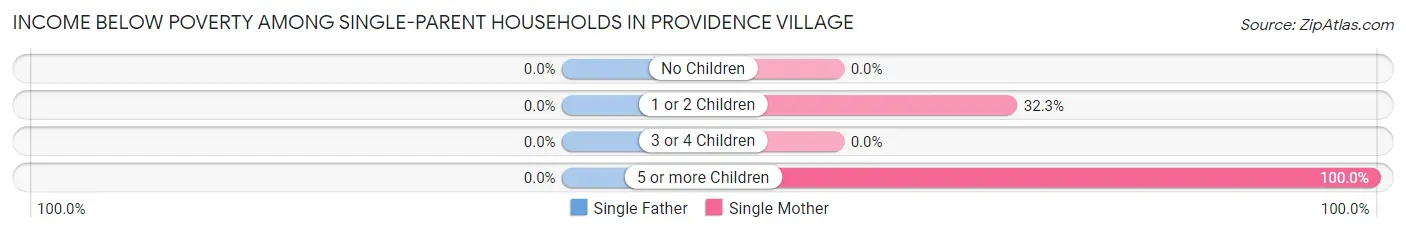
| Children | Single Father | Single Mother |
| No Children | 0 (0.0%) | 0 (0.0%) |
| 1 or 2 Children | 0 (0.0%) | 90 (32.3%) |
| 3 or 4 Children | 0 (0.0%) | 0 (0.0%) |
| 5 or more Children | 0 (0.0%) | 77 (100.0%) |
| Total | 0 (0.0%) | 167 (32.1%) |
Income Below Poverty Among Married-Couple vs Single-Parent Households in Providence Village
The poverty data for Providence Village shows that 76 of the married-couple family households (4.8%) and 167 of the single-parent households (28.2%) are living below the poverty level. Within the married-couple family households, those with no children have the highest poverty rate, with 46 households (7.4%) falling below the poverty line. Among the single-parent households, those with 5 or more children have the highest poverty rate, with 77 household (100.0%) living below poverty.
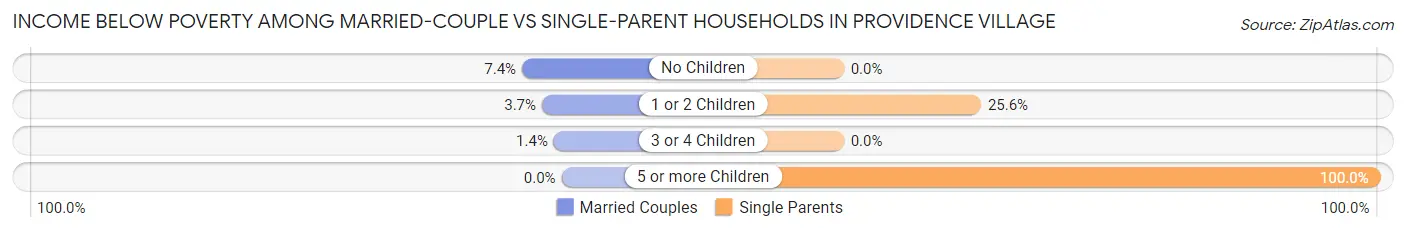
| Children | Married-Couple Families | Single-Parent Households |
| No Children | 46 (7.4%) | 0 (0.0%) |
| 1 or 2 Children | 27 (3.6%) | 90 (25.6%) |
| 3 or 4 Children | 3 (1.4%) | 0 (0.0%) |
| 5 or more Children | 0 (0.0%) | 77 (100.0%) |
| Total | 76 (4.8%) | 167 (28.2%) |
Race in Providence Village
The most populous races in Providence Village are White / Caucasian (5,586 | 72.5%), Hispanic or Latino (1,346 | 17.5%), and Black / African American (1,038 | 13.5%).
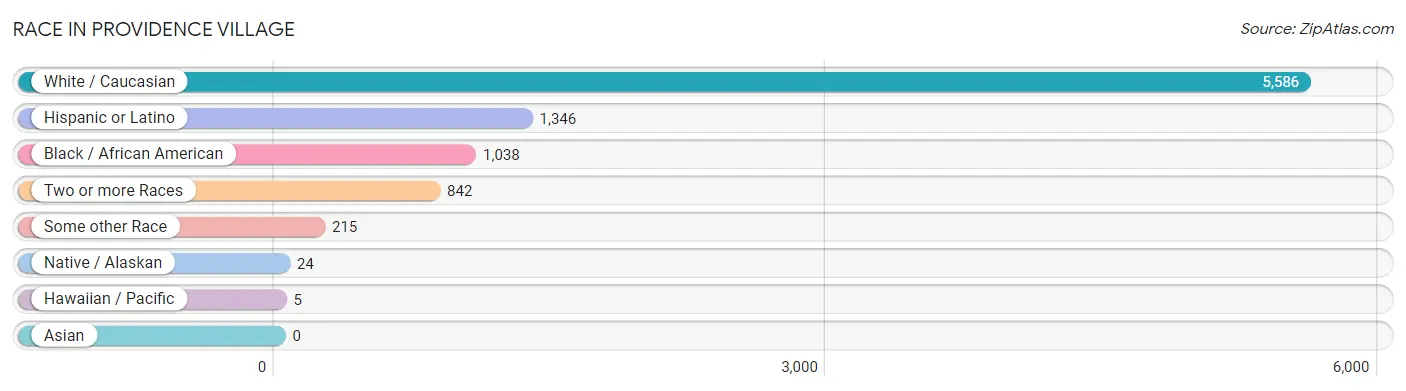
| Race | # Population | % Population |
| Asian | 0 | 0.0% |
| Black / African American | 1,038 | 13.5% |
| Hawaiian / Pacific | 5 | 0.1% |
| Hispanic or Latino | 1,346 | 17.5% |
| Native / Alaskan | 24 | 0.3% |
| White / Caucasian | 5,586 | 72.5% |
| Two or more Races | 842 | 10.9% |
| Some other Race | 215 | 2.8% |
| Total | 7,710 | 100.0% |
Ancestry in Providence Village
The most populous ancestries reported in Providence Village are German (865 | 11.2%), Mexican (786 | 10.2%), Irish (718 | 9.3%), English (694 | 9.0%), and French (577 | 7.5%), together accounting for 47.2% of all Providence Village residents.
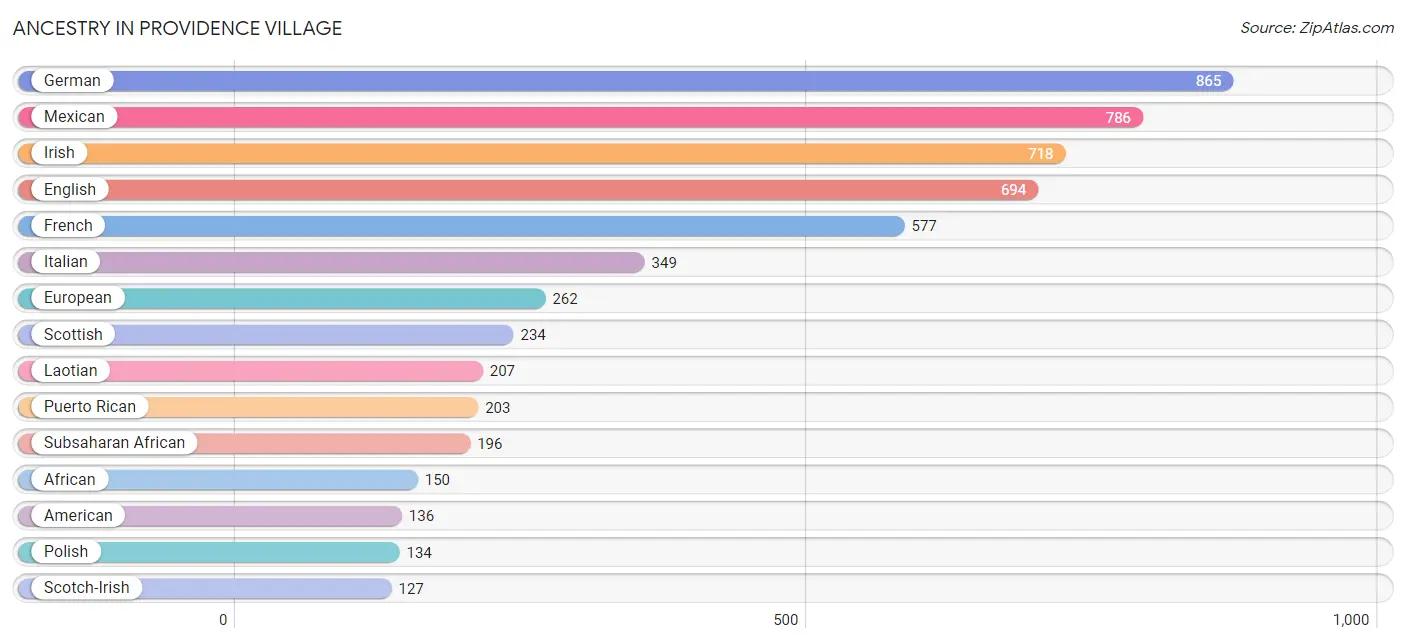
| Ancestry | # Population | % Population |
| African | 150 | 1.9% |
| American | 136 | 1.8% |
| Argentinean | 27 | 0.4% |
| Austrian | 38 | 0.5% |
| Belgian | 59 | 0.8% |
| Brazilian | 14 | 0.2% |
| British | 12 | 0.2% |
| Canadian | 19 | 0.3% |
| Central American | 104 | 1.3% |
| Choctaw | 26 | 0.3% |
| Costa Rican | 59 | 0.8% |
| Cuban | 97 | 1.3% |
| Czech | 73 | 0.9% |
| Danish | 22 | 0.3% |
| Eastern European | 65 | 0.8% |
| English | 694 | 9.0% |
| Ethiopian | 15 | 0.2% |
| European | 262 | 3.4% |
| French | 577 | 7.5% |
| German | 865 | 11.2% |
| Irish | 718 | 9.3% |
| Italian | 349 | 4.5% |
| Laotian | 207 | 2.7% |
| Lithuanian | 29 | 0.4% |
| Mexican | 786 | 10.2% |
| Nigerian | 31 | 0.4% |
| Northern European | 24 | 0.3% |
| Norwegian | 12 | 0.2% |
| Polish | 134 | 1.7% |
| Portuguese | 68 | 0.9% |
| Puerto Rican | 203 | 2.6% |
| Russian | 27 | 0.4% |
| Salvadoran | 45 | 0.6% |
| Samoan | 11 | 0.1% |
| Scandinavian | 15 | 0.2% |
| Scotch-Irish | 127 | 1.7% |
| Scottish | 234 | 3.0% |
| South American | 72 | 0.9% |
| Spaniard | 84 | 1.1% |
| Subsaharan African | 196 | 2.5% |
| Swedish | 51 | 0.7% |
| Tongan | 11 | 0.1% |
| Venezuelan | 45 | 0.6% |
| Welsh | 67 | 0.9% | View All 44 Rows |
Immigrants in Providence Village
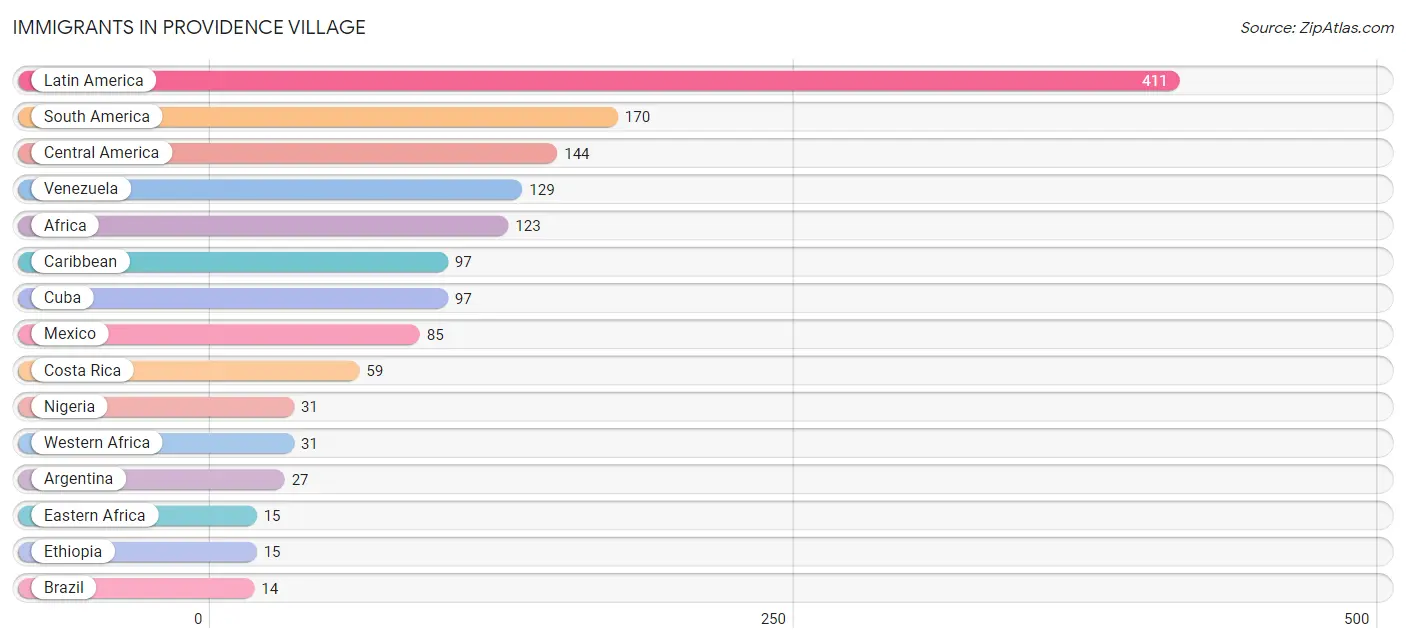
The most numerous immigrant groups reported in Providence Village came from Latin America (411 | 5.3%), South America (170 | 2.2%), Central America (144 | 1.9%), Venezuela (129 | 1.7%), and Africa (123 | 1.6%), together accounting for 12.7% of all Providence Village residents.
| Immigration Origin | # Population | % Population |
| Africa | 123 | 1.6% |
| Argentina | 27 | 0.4% |
| Brazil | 14 | 0.2% |
| Canada | 14 | 0.2% |
| Caribbean | 97 | 1.3% |
| Central America | 144 | 1.9% |
| Costa Rica | 59 | 0.8% |
| Cuba | 97 | 1.3% |
| Eastern Africa | 15 | 0.2% |
| Eastern Europe | 9 | 0.1% |
| Ethiopia | 15 | 0.2% |
| Europe | 9 | 0.1% |
| Latin America | 411 | 5.3% |
| Mexico | 85 | 1.1% |
| Nigeria | 31 | 0.4% |
| Oceania | 5 | 0.1% |
| Russia | 9 | 0.1% |
| South America | 170 | 2.2% |
| Venezuela | 129 | 1.7% |
| Western Africa | 31 | 0.4% | View All 20 Rows |
Sex and Age in Providence Village
Sex and Age in Providence Village
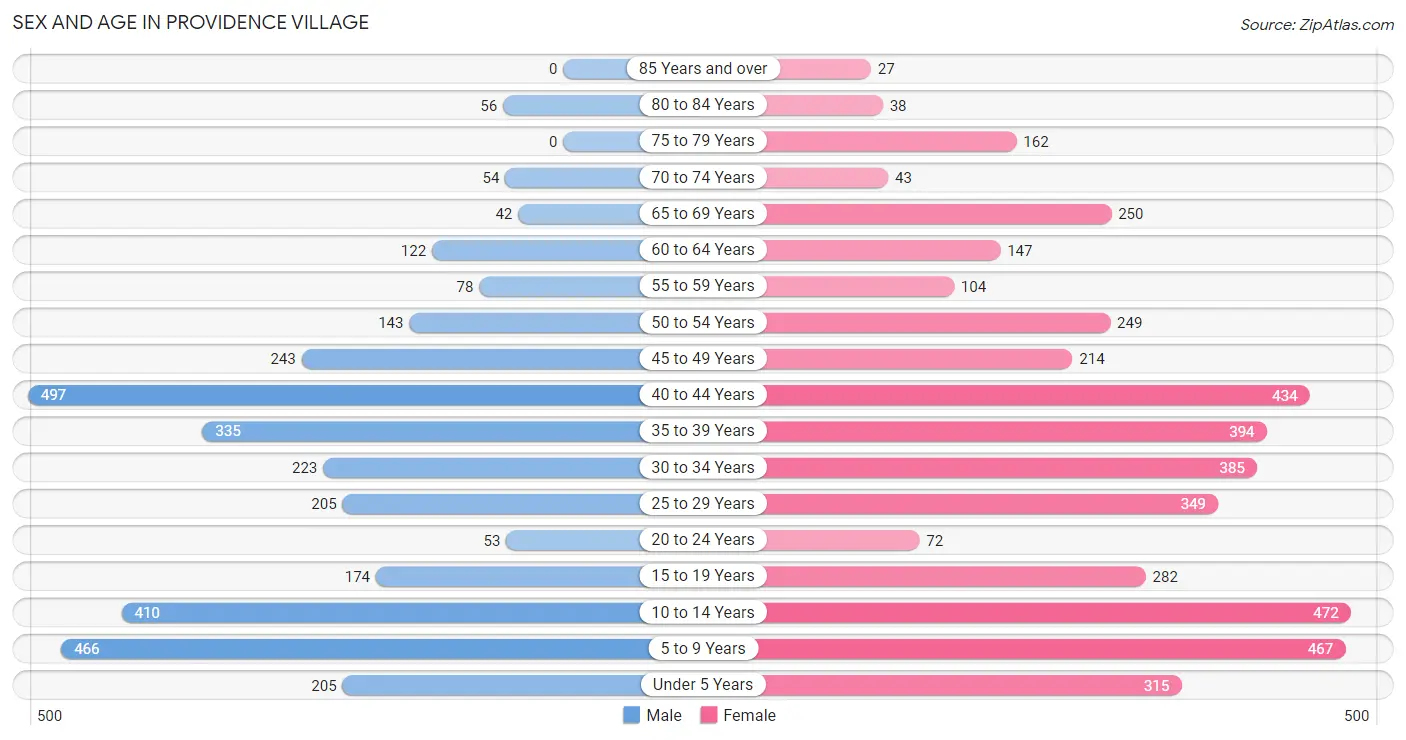
The most populous age groups in Providence Village are 40 to 44 Years (497 | 15.0%) for men and 10 to 14 Years (472 | 10.7%) for women.
| Age Bracket | Male | Female |
| Under 5 Years | 205 (6.2%) | 315 (7.1%) |
| 5 to 9 Years | 466 (14.1%) | 467 (10.6%) |
| 10 to 14 Years | 410 (12.4%) | 472 (10.7%) |
| 15 to 19 Years | 174 (5.3%) | 282 (6.4%) |
| 20 to 24 Years | 53 (1.6%) | 72 (1.6%) |
| 25 to 29 Years | 205 (6.2%) | 349 (7.9%) |
| 30 to 34 Years | 223 (6.8%) | 385 (8.7%) |
| 35 to 39 Years | 335 (10.1%) | 394 (8.9%) |
| 40 to 44 Years | 497 (15.0%) | 434 (9.9%) |
| 45 to 49 Years | 243 (7.3%) | 214 (4.9%) |
| 50 to 54 Years | 143 (4.3%) | 249 (5.7%) |
| 55 to 59 Years | 78 (2.4%) | 104 (2.4%) |
| 60 to 64 Years | 122 (3.7%) | 147 (3.3%) |
| 65 to 69 Years | 42 (1.3%) | 250 (5.7%) |
| 70 to 74 Years | 54 (1.6%) | 43 (1.0%) |
| 75 to 79 Years | 0 (0.0%) | 162 (3.7%) |
| 80 to 84 Years | 56 (1.7%) | 38 (0.9%) |
| 85 Years and over | 0 (0.0%) | 27 (0.6%) |
| Total | 3,306 (100.0%) | 4,404 (100.0%) |
Families and Households in Providence Village
Median Family Size in Providence Village
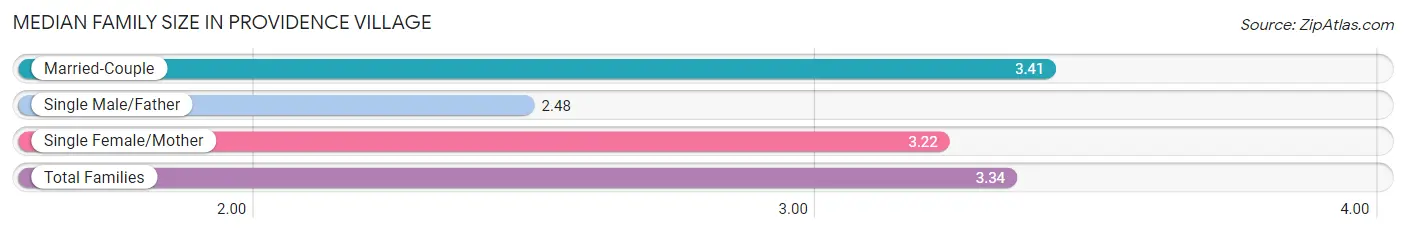
The median family size in Providence Village is 3.34 persons per family, with married-couple families (1,571 | 72.6%) accounting for the largest median family size of 3.41 persons per family. On the other hand, single male/father families (73 | 3.4%) represent the smallest median family size with 2.48 persons per family.
| Family Type | # Families | Family Size |
| Married-Couple | 1,571 (72.6%) | 3.41 |
| Single Male/Father | 73 (3.4%) | 2.48 |
| Single Female/Mother | 520 (24.0%) | 3.22 |
| Total Families | 2,164 (100.0%) | 3.34 |
Median Household Size in Providence Village
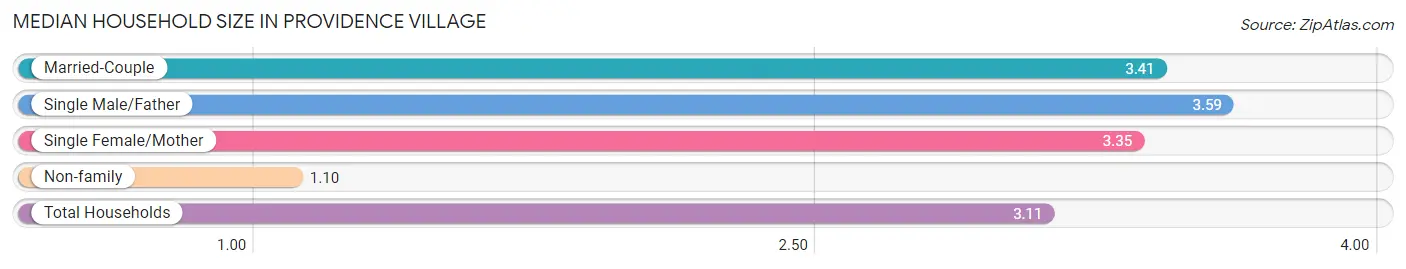
The median household size in Providence Village is 3.11 persons per household, with single male/father households (73 | 2.9%) accounting for the largest median household size of 3.59 persons per household. non-family households (316 | 12.7%) represent the smallest median household size with 1.10 persons per household.
| Household Type | # Households | Household Size |
| Married-Couple | 1,571 (63.3%) | 3.41 |
| Single Male/Father | 73 (2.9%) | 3.59 |
| Single Female/Mother | 520 (21.0%) | 3.35 |
| Non-family | 316 (12.7%) | 1.10 |
| Total Households | 2,480 (100.0%) | 3.11 |
Household Size by Marriage Status in Providence Village
Out of a total of 2,480 households in Providence Village, 2,164 (87.3%) are family households, while 316 (12.7%) are nonfamily households. The most numerous type of family households are 2-person households, comprising 832, and the most common type of nonfamily households are 1-person households, comprising 285.
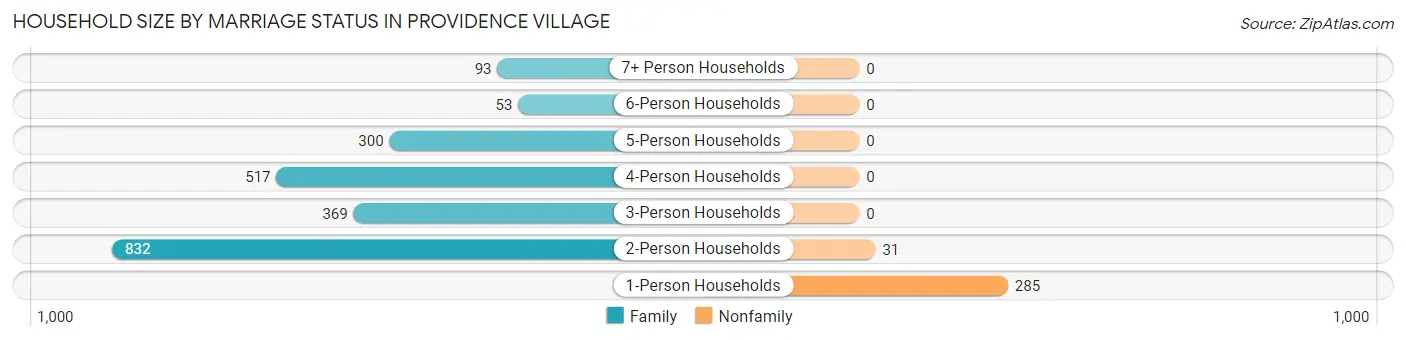
| Household Size | Family Households | Nonfamily Households |
| 1-Person Households | - | 285 (11.5%) |
| 2-Person Households | 832 (33.6%) | 31 (1.3%) |
| 3-Person Households | 369 (14.9%) | 0 (0.0%) |
| 4-Person Households | 517 (20.8%) | 0 (0.0%) |
| 5-Person Households | 300 (12.1%) | 0 (0.0%) |
| 6-Person Households | 53 (2.1%) | 0 (0.0%) |
| 7+ Person Households | 93 (3.7%) | 0 (0.0%) |
| Total | 2,164 (87.3%) | 316 (12.7%) |
Female Fertility in Providence Village
Fertility by Age in Providence Village
Average fertility rate in Providence Village is 47.0 births per 1,000 women. Women in the age bracket of 20 to 34 years have the highest fertility rate with 83.0 births per 1,000 women. Women in the age bracket of 20 to 34 years acount for 63.2% of all women with births.
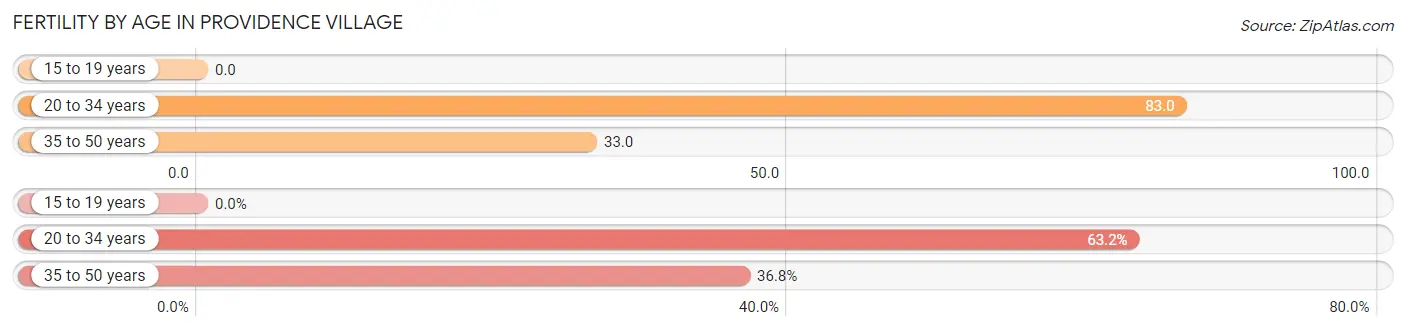
| Age Bracket | Women with Births | Births / 1,000 Women |
| 15 to 19 years | 0 (0.0%) | 0.0 |
| 20 to 34 years | 67 (63.2%) | 83.0 |
| 35 to 50 years | 39 (36.8%) | 33.0 |
| Total | 106 (100.0%) | 47.0 |
Fertility by Age by Marriage Status in Providence Village
85.8% of women with births (106) in Providence Village are married. The highest percentage of unmarried women with births falls into 20 to 34 years age bracket with 22.4% of them unmarried at the time of birth, while the lowest percentage of unmarried women with births belong to 35 to 50 years age bracket with 0.0% of them unmarried.
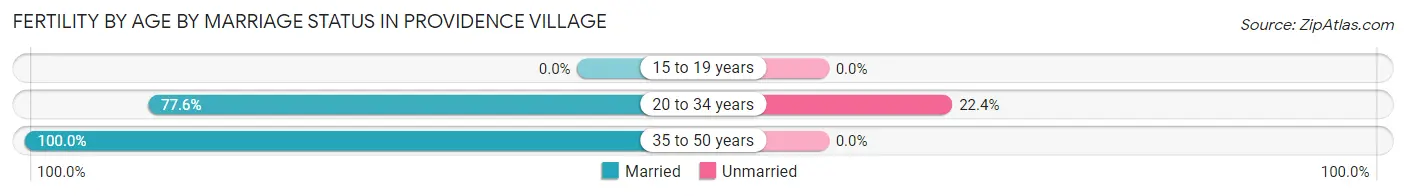
| Age Bracket | Married | Unmarried |
| 15 to 19 years | 0 (0.0%) | 0 (0.0%) |
| 20 to 34 years | 52 (77.6%) | 15 (22.4%) |
| 35 to 50 years | 39 (100.0%) | 0 (0.0%) |
| Total | 91 (85.9%) | 15 (14.1%) |
Fertility by Education in Providence Village
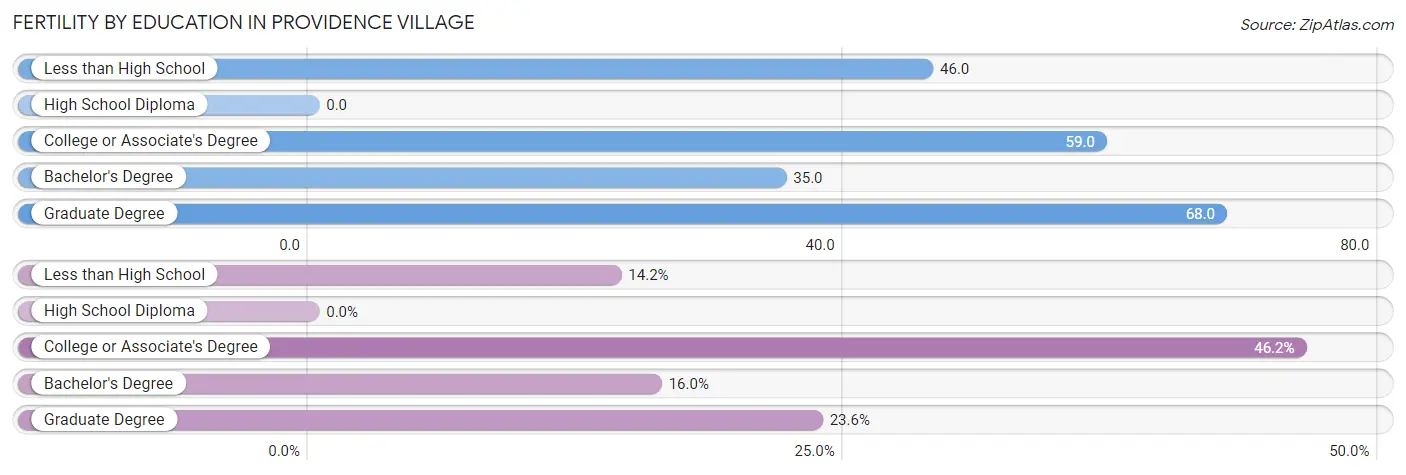
| Educational Attainment | Women with Births | Births / 1,000 Women |
| Less than High School | 15 (14.1%) | 46.0 |
| High School Diploma | 0 (0.0%) | 0.0 |
| College or Associate's Degree | 49 (46.2%) | 59.0 |
| Bachelor's Degree | 17 (16.0%) | 35.0 |
| Graduate Degree | 25 (23.6%) | 68.0 |
| Total | 106 (100.0%) | 47.0 |
Fertility by Education by Marriage Status in Providence Village
14.1% of women with births in Providence Village are unmarried. Women with the educational attainment of college or associate's degree are most likely to be married with 100.0% of them married at childbirth, while women with the educational attainment of less than high school are least likely to be married with 100.0% of them unmarried at childbirth.
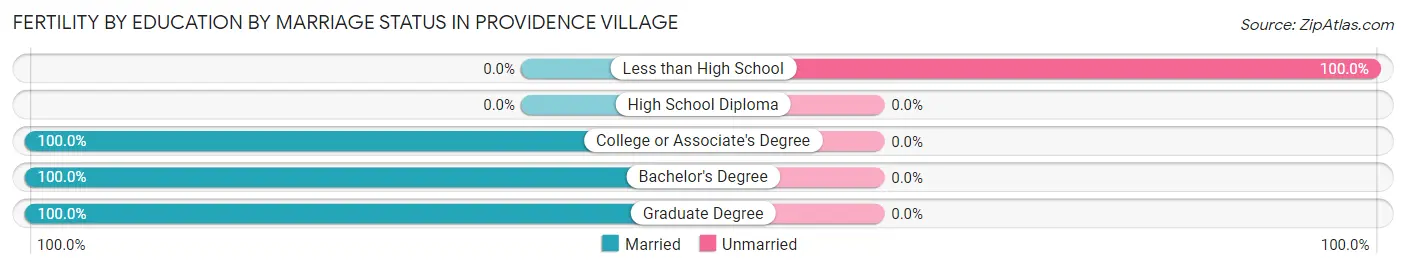
| Educational Attainment | Married | Unmarried |
| Less than High School | 0 (0.0%) | 15 (100.0%) |
| High School Diploma | 0 (0.0%) | 0 (0.0%) |
| College or Associate's Degree | 49 (100.0%) | 0 (0.0%) |
| Bachelor's Degree | 17 (100.0%) | 0 (0.0%) |
| Graduate Degree | 25 (100.0%) | 0 (0.0%) |
| Total | 91 (85.9%) | 15 (14.1%) |
Employment Characteristics in Providence Village
Employment by Class of Employer in Providence Village
Among the 3,567 employed individuals in Providence Village, private company employees (2,468 | 69.2%), not-for-profit organizations (326 | 9.1%), and self-employed (not incorporated) (204 | 5.7%) make up the most common classes of employment.
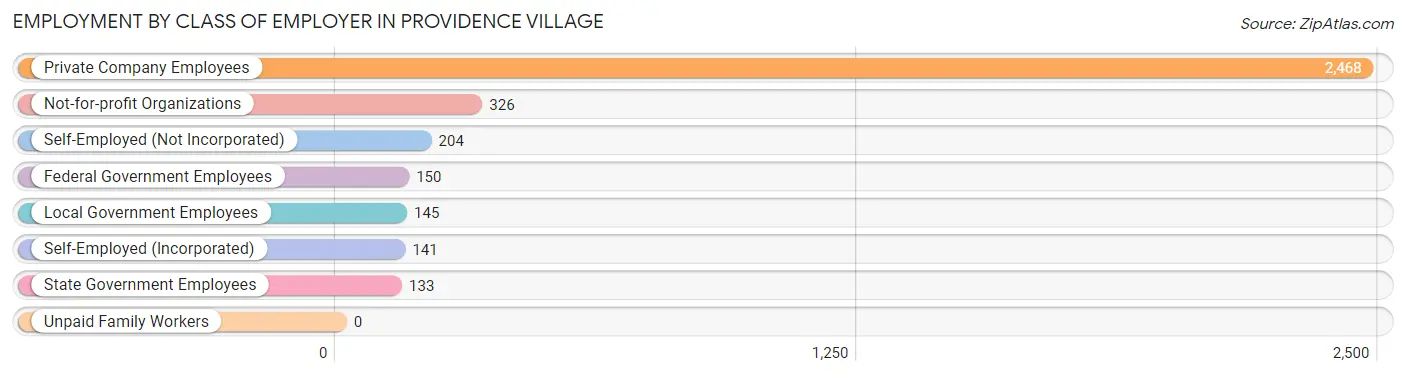
| Employer Class | # Employees | % Employees |
| Private Company Employees | 2,468 | 69.2% |
| Self-Employed (Incorporated) | 141 | 4.0% |
| Self-Employed (Not Incorporated) | 204 | 5.7% |
| Not-for-profit Organizations | 326 | 9.1% |
| Local Government Employees | 145 | 4.1% |
| State Government Employees | 133 | 3.7% |
| Federal Government Employees | 150 | 4.2% |
| Unpaid Family Workers | 0 | 0.0% |
| Total | 3,567 | 100.0% |
Employment Status by Age in Providence Village
According to the labor force statistics for Providence Village, out of the total population over 16 years of age (5,207), 70.5% or 3,671 individuals are in the labor force, with 2.4% or 88 of them unemployed. The age group with the highest labor force participation rate is 35 to 44 years, with 93.2% or 1,547 individuals in the labor force. Within the labor force, the 30 to 34 years age range has the highest percentage of unemployed individuals, with 8.5% or 45 of them being unemployed.
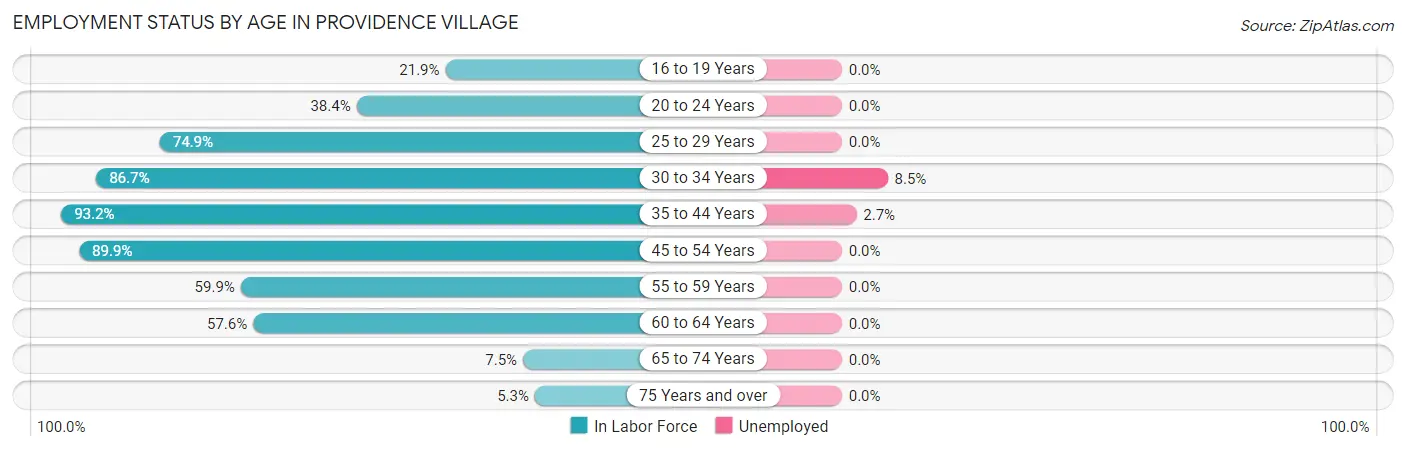
| Age Bracket | In Labor Force | Unemployed |
| 16 to 19 Years | 63 (21.9%) | 0 (0.0%) |
| 20 to 24 Years | 48 (38.4%) | 0 (0.0%) |
| 25 to 29 Years | 415 (74.9%) | 0 (0.0%) |
| 30 to 34 Years | 527 (86.7%) | 45 (8.5%) |
| 35 to 44 Years | 1,547 (93.2%) | 42 (2.7%) |
| 45 to 54 Years | 763 (89.9%) | 0 (0.0%) |
| 55 to 59 Years | 109 (59.9%) | 0 (0.0%) |
| 60 to 64 Years | 155 (57.6%) | 0 (0.0%) |
| 65 to 74 Years | 29 (7.5%) | 0 (0.0%) |
| 75 Years and over | 15 (5.3%) | 0 (0.0%) |
| Total | 3,671 (70.5%) | 88 (2.4%) |
Employment Status by Educational Attainment in Providence Village
According to labor force statistics for Providence Village, 85.3% of individuals (3,516) out of the total population between 25 and 64 years of age (4,122) are in the labor force, with 2.5% or 88 of them being unemployed. The group with the highest labor force participation rate are those with the educational attainment of less than high school, with 100.0% or 337 individuals in the labor force. Within the labor force, individuals with less than high school education have the highest percentage of unemployment, with 5.6% or 19 of them being unemployed.
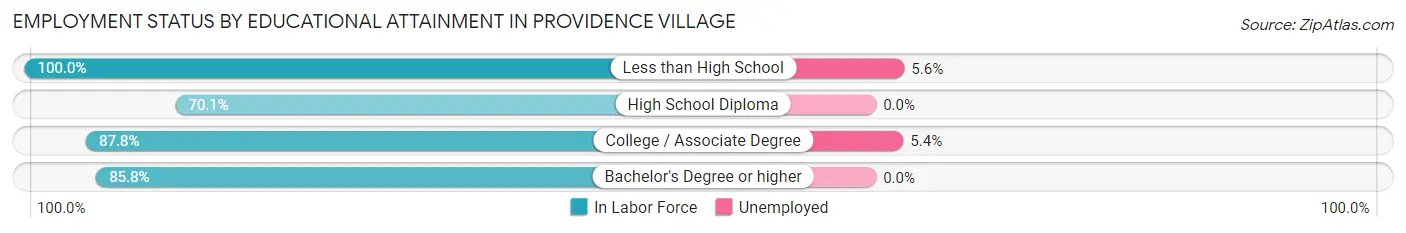
| Educational Attainment | In Labor Force | Unemployed |
| Less than High School | 337 (100.0%) | 19 (5.6%) |
| High School Diploma | 426 (70.1%) | 0 (0.0%) |
| College / Associate Degree | 1,255 (87.8%) | 77 (5.4%) |
| Bachelor's Degree or higher | 1,500 (85.8%) | 0 (0.0%) |
| Total | 3,516 (85.3%) | 103 (2.5%) |
Employment Occupations by Sex in Providence Village
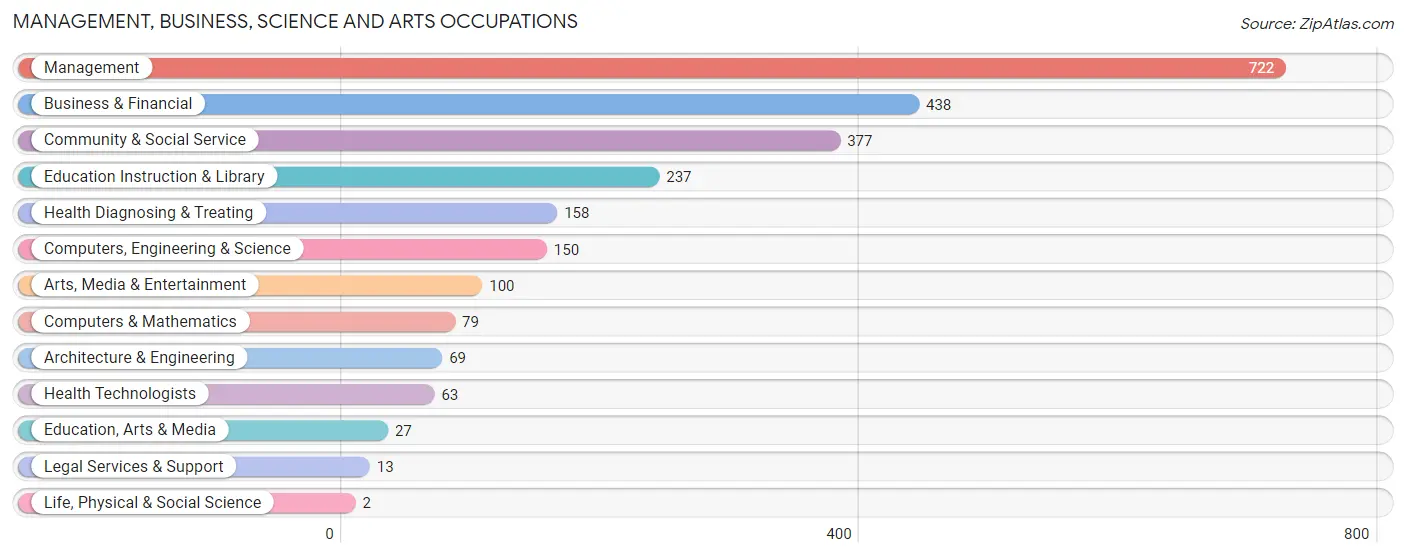
Management, Business, Science and Arts Occupations
The most common Management, Business, Science and Arts occupations in Providence Village are Management (722 | 20.2%), Business & Financial (438 | 12.2%), Community & Social Service (377 | 10.5%), Education Instruction & Library (237 | 6.6%), and Health Diagnosing & Treating (158 | 4.4%).
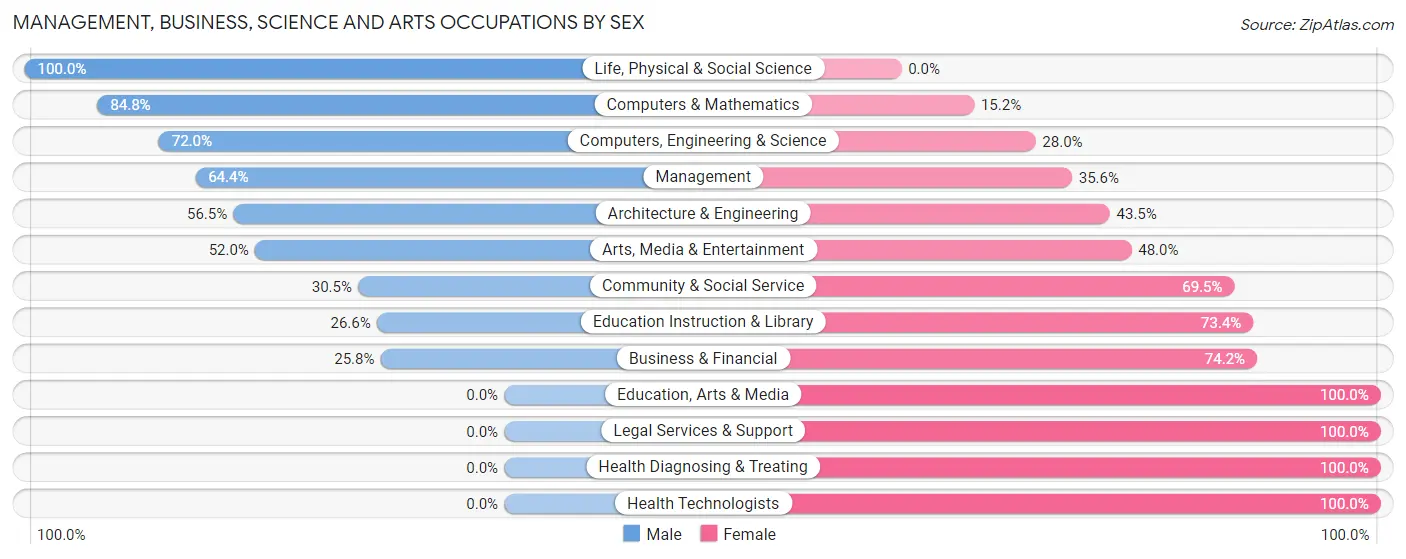
Management, Business, Science and Arts Occupations by Sex
Within the Management, Business, Science and Arts occupations in Providence Village, the most male-oriented occupations are Life, Physical & Social Science (100.0%), Computers & Mathematics (84.8%), and Computers, Engineering & Science (72.0%), while the most female-oriented occupations are Education, Arts & Media (100.0%), Legal Services & Support (100.0%), and Health Diagnosing & Treating (100.0%).
| Occupation | Male | Female |
| Management | 465 (64.4%) | 257 (35.6%) |
| Business & Financial | 113 (25.8%) | 325 (74.2%) |
| Computers, Engineering & Science | 108 (72.0%) | 42 (28.0%) |
| Computers & Mathematics | 67 (84.8%) | 12 (15.2%) |
| Architecture & Engineering | 39 (56.5%) | 30 (43.5%) |
| Life, Physical & Social Science | 2 (100.0%) | 0 (0.0%) |
| Community & Social Service | 115 (30.5%) | 262 (69.5%) |
| Education, Arts & Media | 0 (0.0%) | 27 (100.0%) |
| Legal Services & Support | 0 (0.0%) | 13 (100.0%) |
| Education Instruction & Library | 63 (26.6%) | 174 (73.4%) |
| Arts, Media & Entertainment | 52 (52.0%) | 48 (48.0%) |
| Health Diagnosing & Treating | 0 (0.0%) | 158 (100.0%) |
| Health Technologists | 0 (0.0%) | 63 (100.0%) |
| Total (Category) | 801 (43.4%) | 1,044 (56.6%) |
| Total (Overall) | 1,749 (48.8%) | 1,835 (51.2%) |
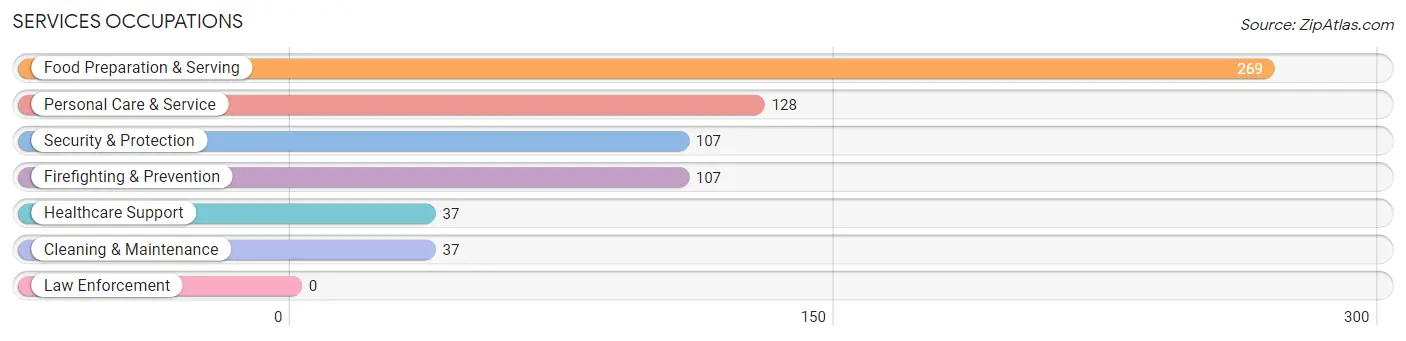
Services Occupations
The most common Services occupations in Providence Village are Food Preparation & Serving (269 | 7.5%), Personal Care & Service (128 | 3.6%), Security & Protection (107 | 3.0%), Firefighting & Prevention (107 | 3.0%), and Healthcare Support (37 | 1.0%).
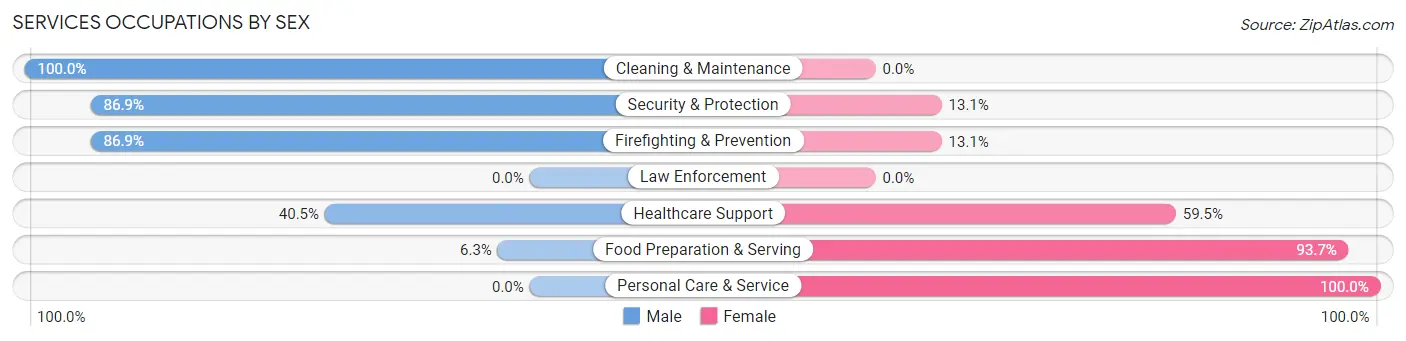
Services Occupations by Sex
Within the Services occupations in Providence Village, the most male-oriented occupations are Cleaning & Maintenance (100.0%), Security & Protection (86.9%), and Firefighting & Prevention (86.9%), while the most female-oriented occupations are Personal Care & Service (100.0%), Food Preparation & Serving (93.7%), and Healthcare Support (59.5%).
| Occupation | Male | Female |
| Healthcare Support | 15 (40.5%) | 22 (59.5%) |
| Security & Protection | 93 (86.9%) | 14 (13.1%) |
| Firefighting & Prevention | 93 (86.9%) | 14 (13.1%) |
| Law Enforcement | 0 (0.0%) | 0 (0.0%) |
| Food Preparation & Serving | 17 (6.3%) | 252 (93.7%) |
| Cleaning & Maintenance | 37 (100.0%) | 0 (0.0%) |
| Personal Care & Service | 0 (0.0%) | 128 (100.0%) |
| Total (Category) | 162 (28.0%) | 416 (72.0%) |
| Total (Overall) | 1,749 (48.8%) | 1,835 (51.2%) |
Sales and Office Occupations
The most common Sales and Office occupations in Providence Village are Sales & Related (442 | 12.3%), and Office & Administration (245 | 6.8%).
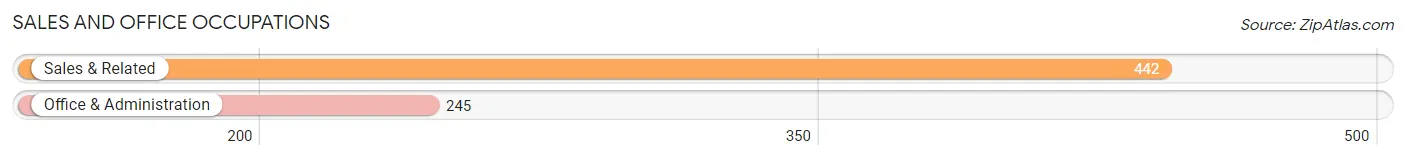
Sales and Office Occupations by Sex
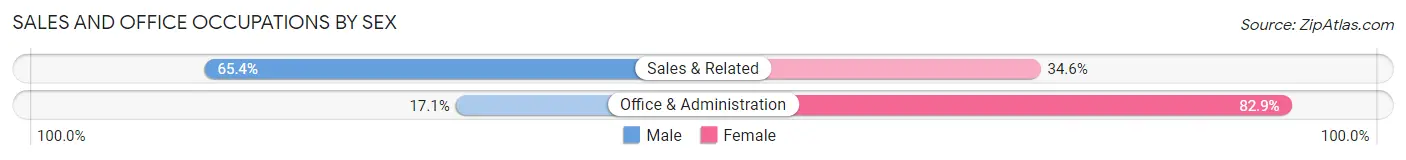
| Occupation | Male | Female |
| Sales & Related | 289 (65.4%) | 153 (34.6%) |
| Office & Administration | 42 (17.1%) | 203 (82.9%) |
| Total (Category) | 331 (48.2%) | 356 (51.8%) |
| Total (Overall) | 1,749 (48.8%) | 1,835 (51.2%) |
Natural Resources, Construction and Maintenance Occupations
The most common Natural Resources, Construction and Maintenance occupations in Providence Village are Construction & Extraction (107 | 3.0%), and Installation, Maintenance & Repair (99 | 2.8%).

Natural Resources, Construction and Maintenance Occupations by Sex

| Occupation | Male | Female |
| Farming, Fishing & Forestry | 0 (0.0%) | 0 (0.0%) |
| Construction & Extraction | 107 (100.0%) | 0 (0.0%) |
| Installation, Maintenance & Repair | 99 (100.0%) | 0 (0.0%) |
| Total (Category) | 206 (100.0%) | 0 (0.0%) |
| Total (Overall) | 1,749 (48.8%) | 1,835 (51.2%) |
Production, Transportation and Moving Occupations
The most common Production, Transportation and Moving occupations in Providence Village are Production (155 | 4.3%), and Transportation (113 | 3.2%).
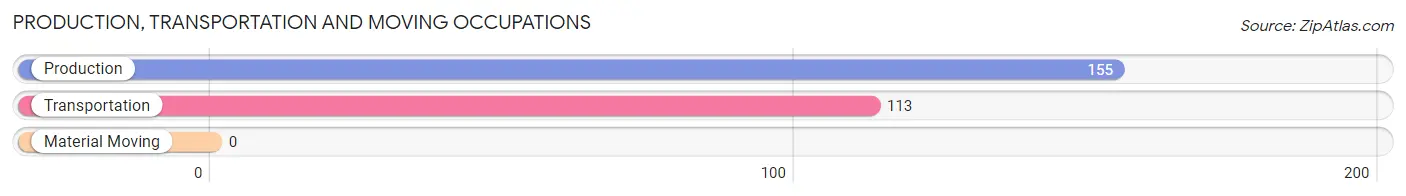
Production, Transportation and Moving Occupations by Sex
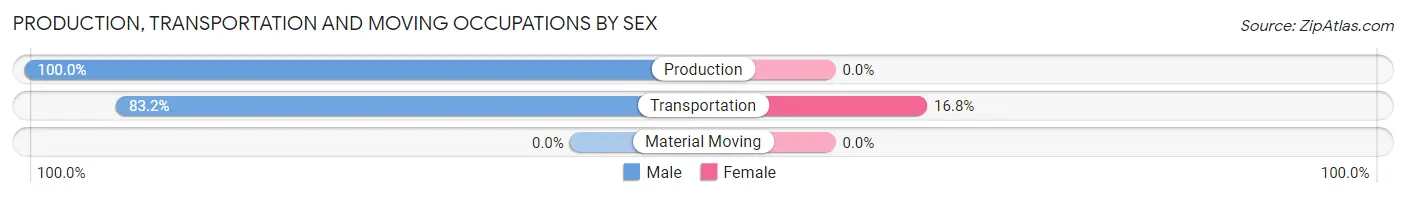
| Occupation | Male | Female |
| Production | 155 (100.0%) | 0 (0.0%) |
| Transportation | 94 (83.2%) | 19 (16.8%) |
| Material Moving | 0 (0.0%) | 0 (0.0%) |
| Total (Category) | 249 (92.9%) | 19 (7.1%) |
| Total (Overall) | 1,749 (48.8%) | 1,835 (51.2%) |
Employment Industries by Sex in Providence Village
Employment Industries in Providence Village
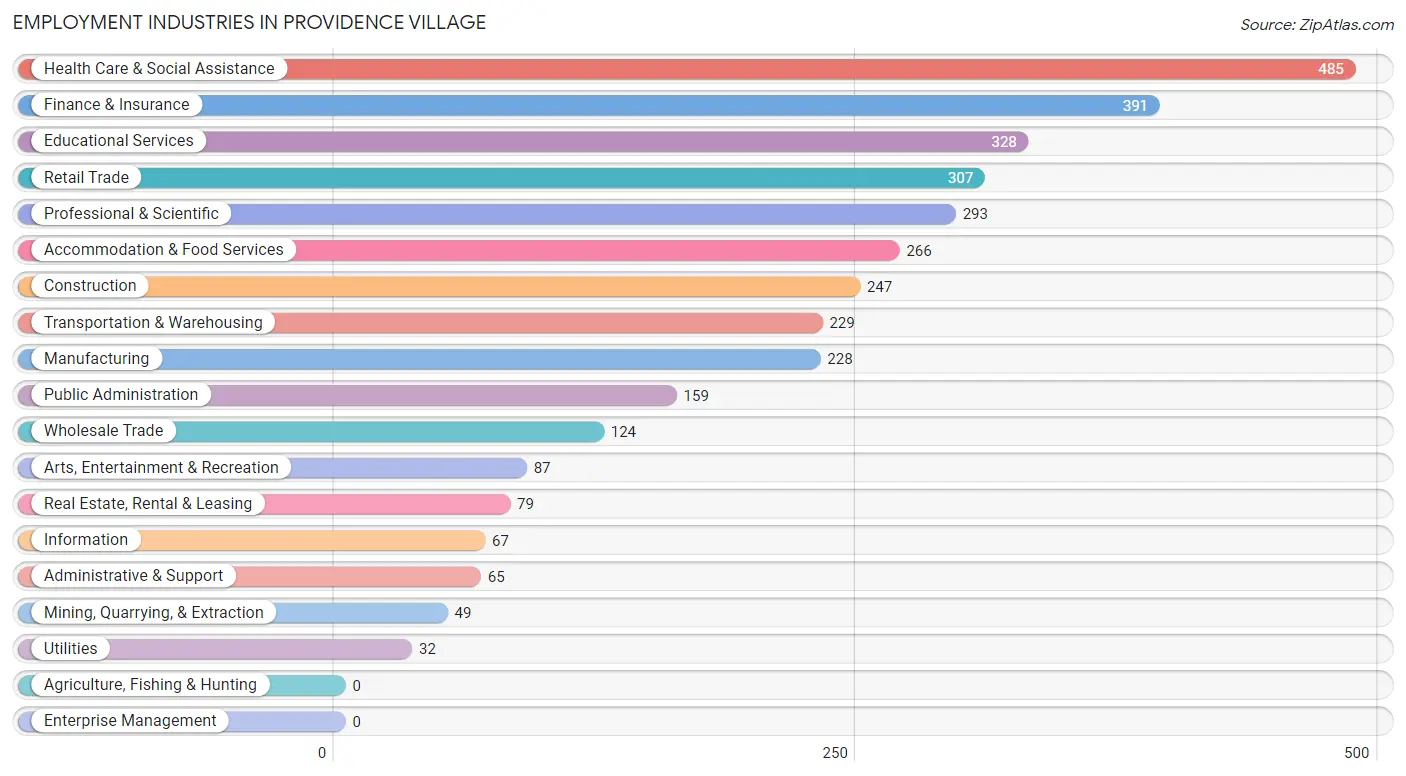
The major employment industries in Providence Village include Health Care & Social Assistance (485 | 13.5%), Finance & Insurance (391 | 10.9%), Educational Services (328 | 9.1%), Retail Trade (307 | 8.6%), and Professional & Scientific (293 | 8.2%).
Employment Industries by Sex in Providence Village
The Providence Village industries that see more men than women are Utilities (100.0%), Construction (91.1%), and Professional & Scientific (79.9%), whereas the industries that tend to have a higher number of women are Information (100.0%), Health Care & Social Assistance (93.0%), and Real Estate, Rental & Leasing (79.7%).
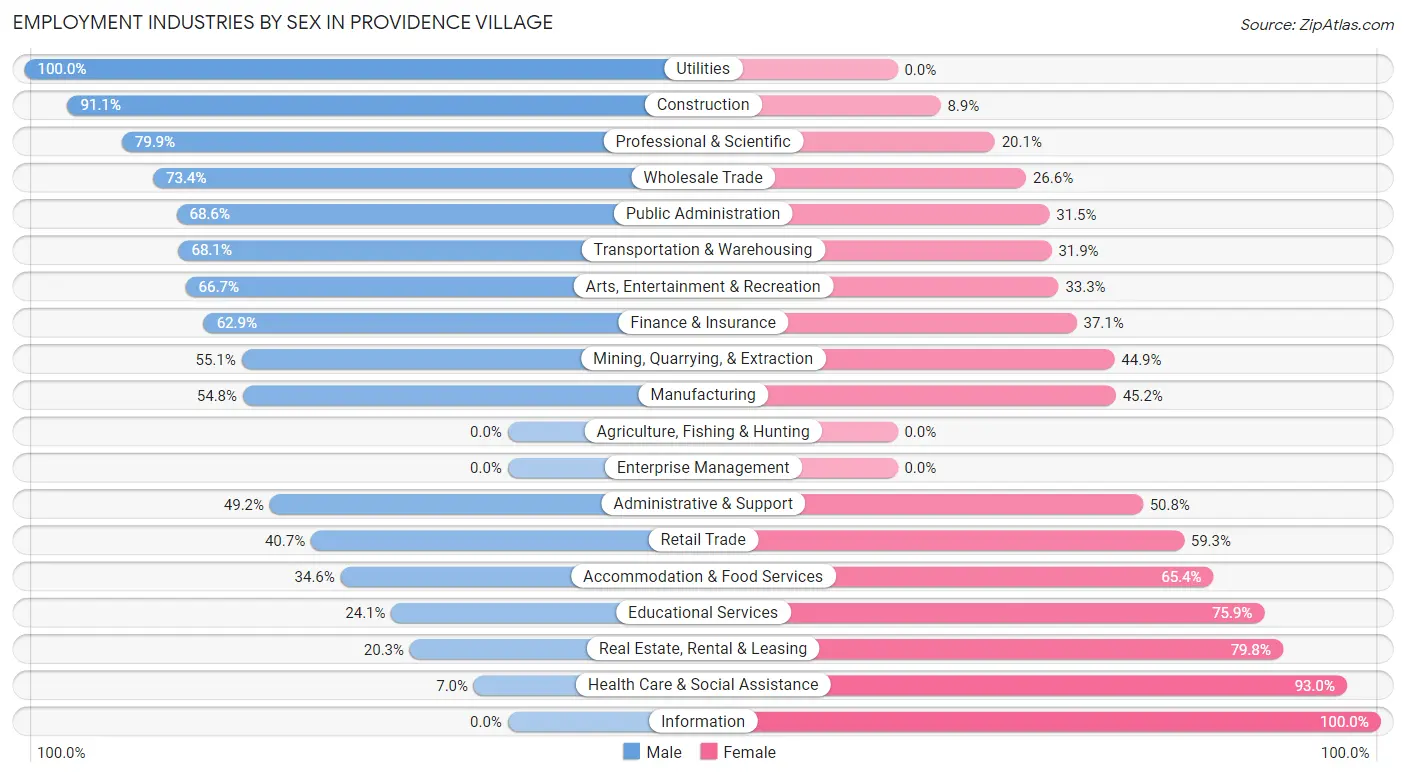
| Industry | Male | Female |
| Agriculture, Fishing & Hunting | 0 (0.0%) | 0 (0.0%) |
| Mining, Quarrying, & Extraction | 27 (55.1%) | 22 (44.9%) |
| Construction | 225 (91.1%) | 22 (8.9%) |
| Manufacturing | 125 (54.8%) | 103 (45.2%) |
| Wholesale Trade | 91 (73.4%) | 33 (26.6%) |
| Retail Trade | 125 (40.7%) | 182 (59.3%) |
| Transportation & Warehousing | 156 (68.1%) | 73 (31.9%) |
| Utilities | 32 (100.0%) | 0 (0.0%) |
| Information | 0 (0.0%) | 67 (100.0%) |
| Finance & Insurance | 246 (62.9%) | 145 (37.1%) |
| Real Estate, Rental & Leasing | 16 (20.3%) | 63 (79.7%) |
| Professional & Scientific | 234 (79.9%) | 59 (20.1%) |
| Enterprise Management | 0 (0.0%) | 0 (0.0%) |
| Administrative & Support | 32 (49.2%) | 33 (50.8%) |
| Educational Services | 79 (24.1%) | 249 (75.9%) |
| Health Care & Social Assistance | 34 (7.0%) | 451 (93.0%) |
| Arts, Entertainment & Recreation | 58 (66.7%) | 29 (33.3%) |
| Accommodation & Food Services | 92 (34.6%) | 174 (65.4%) |
| Public Administration | 109 (68.5%) | 50 (31.5%) |
| Total | 1,749 (48.8%) | 1,835 (51.2%) |
Education in Providence Village
School Enrollment in Providence Village
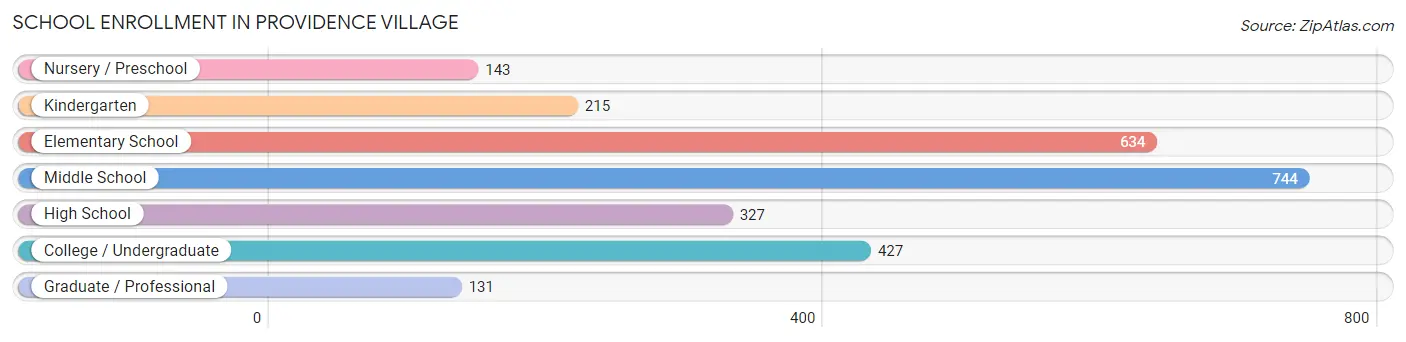
The most common levels of schooling among the 2,621 students in Providence Village are middle school (744 | 28.4%), elementary school (634 | 24.2%), and college / undergraduate (427 | 16.3%).
| School Level | # Students | % Students |
| Nursery / Preschool | 143 | 5.5% |
| Kindergarten | 215 | 8.2% |
| Elementary School | 634 | 24.2% |
| Middle School | 744 | 28.4% |
| High School | 327 | 12.5% |
| College / Undergraduate | 427 | 16.3% |
| Graduate / Professional | 131 | 5.0% |
| Total | 2,621 | 100.0% |
School Enrollment by Age by Funding Source in Providence Village
Out of a total of 2,621 students who are enrolled in schools in Providence Village, 267 (10.2%) attend a private institution, while the remaining 2,354 (89.8%) are enrolled in public schools. The age group of 20 to 24 year olds has the highest likelihood of being enrolled in private schools, with 33 (53.2% in the age bracket) enrolled. Conversely, the age group of 25 to 34 year olds has the lowest likelihood of being enrolled in a private school, with 86 (100.0% in the age bracket) attending a public institution.
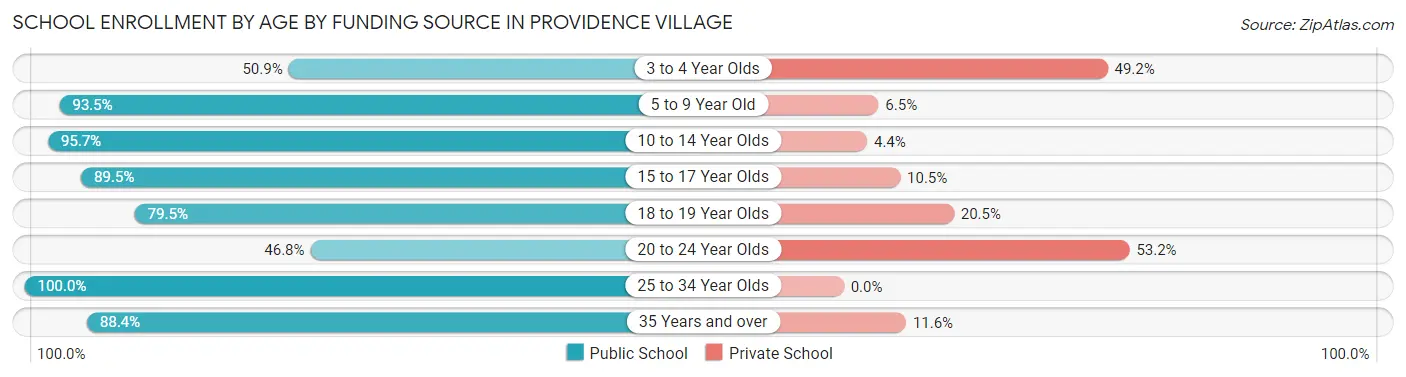
| Age Bracket | Public School | Private School |
| 3 to 4 Year Olds | 60 (50.8%) | 58 (49.1%) |
| 5 to 9 Year Old | 766 (93.5%) | 53 (6.5%) |
| 10 to 14 Year Olds | 813 (95.7%) | 37 (4.3%) |
| 15 to 17 Year Olds | 247 (89.5%) | 29 (10.5%) |
| 18 to 19 Year Olds | 93 (79.5%) | 24 (20.5%) |
| 20 to 24 Year Olds | 29 (46.8%) | 33 (53.2%) |
| 25 to 34 Year Olds | 86 (100.0%) | 0 (0.0%) |
| 35 Years and over | 259 (88.4%) | 34 (11.6%) |
| Total | 2,354 (89.8%) | 267 (10.2%) |
Educational Attainment by Field of Study in Providence Village
Business (404 | 20.7%), arts & humanities (292 | 15.0%), education (237 | 12.2%), visual & performing arts (202 | 10.4%), and psychology (190 | 9.8%) are the most common fields of study among 1,947 individuals in Providence Village who have obtained a bachelor's degree or higher.
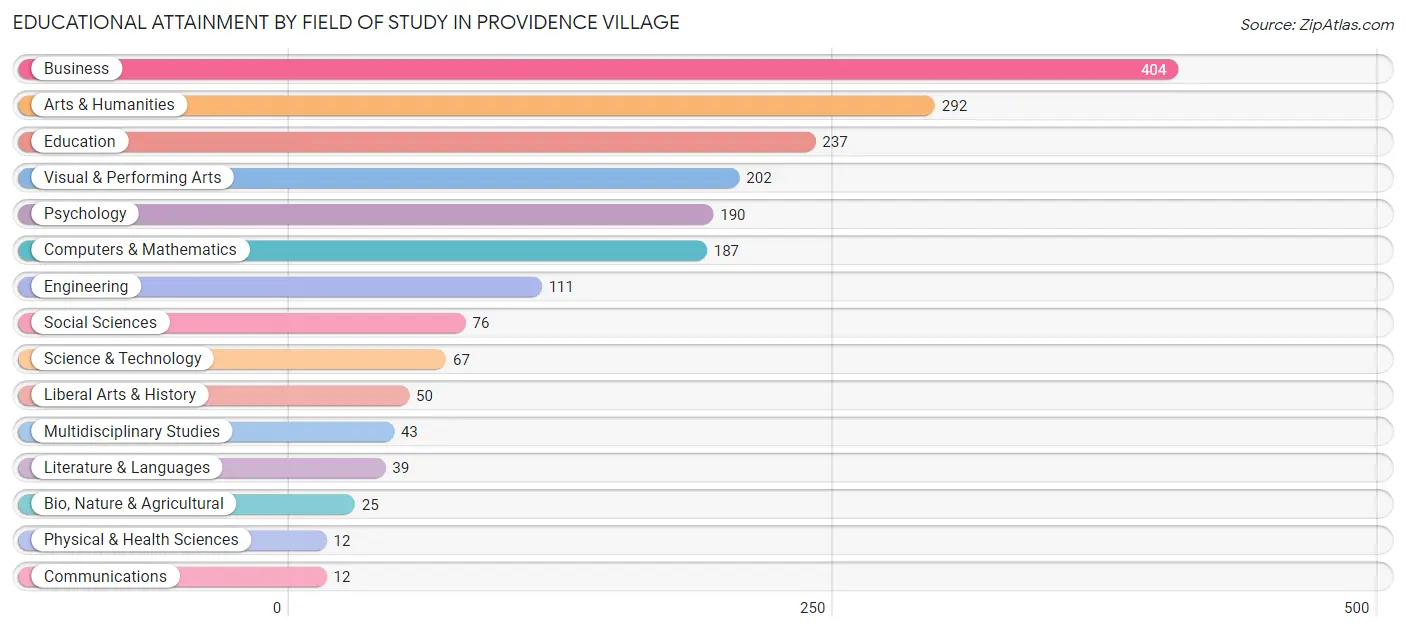
| Field of Study | # Graduates | % Graduates |
| Computers & Mathematics | 187 | 9.6% |
| Bio, Nature & Agricultural | 25 | 1.3% |
| Physical & Health Sciences | 12 | 0.6% |
| Psychology | 190 | 9.8% |
| Social Sciences | 76 | 3.9% |
| Engineering | 111 | 5.7% |
| Multidisciplinary Studies | 43 | 2.2% |
| Science & Technology | 67 | 3.4% |
| Business | 404 | 20.7% |
| Education | 237 | 12.2% |
| Literature & Languages | 39 | 2.0% |
| Liberal Arts & History | 50 | 2.6% |
| Visual & Performing Arts | 202 | 10.4% |
| Communications | 12 | 0.6% |
| Arts & Humanities | 292 | 15.0% |
| Total | 1,947 | 100.0% |
Transportation & Commute in Providence Village
Vehicle Availability by Sex in Providence Village
The most prevalent vehicle ownership categories in Providence Village are males with 2 vehicles (1,113, accounting for 63.7%) and females with 2 vehicles (1,188, making up 61.2%).
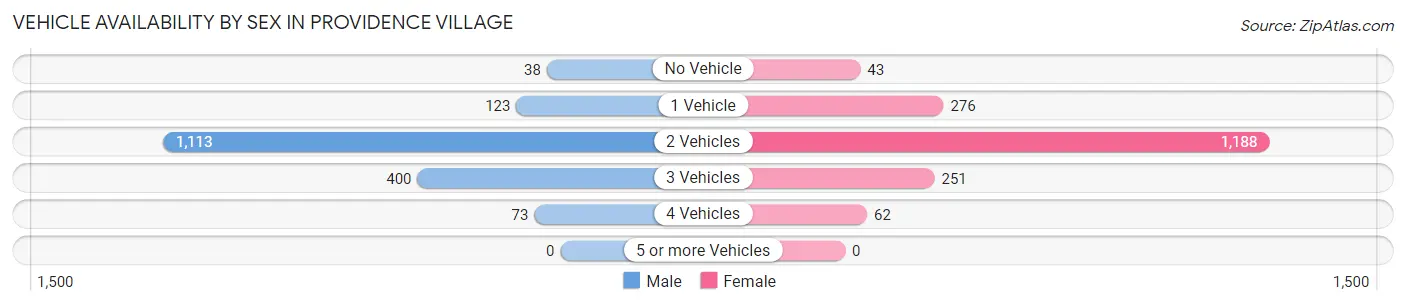
| Vehicles Available | Male | Female |
| No Vehicle | 38 (2.2%) | 43 (2.4%) |
| 1 Vehicle | 123 (7.0%) | 276 (15.2%) |
| 2 Vehicles | 1,113 (63.7%) | 1,188 (65.3%) |
| 3 Vehicles | 400 (22.9%) | 251 (13.8%) |
| 4 Vehicles | 73 (4.2%) | 62 (3.4%) |
| 5 or more Vehicles | 0 (0.0%) | 0 (0.0%) |
| Total | 1,747 (100.0%) | 1,820 (100.0%) |
Commute Time in Providence Village
The most frequently occuring commute durations in Providence Village are 45 to 59 minutes (998 commuters, 34.2%), 15 to 19 minutes (394 commuters, 13.5%), and 40 to 44 minutes (355 commuters, 12.2%).
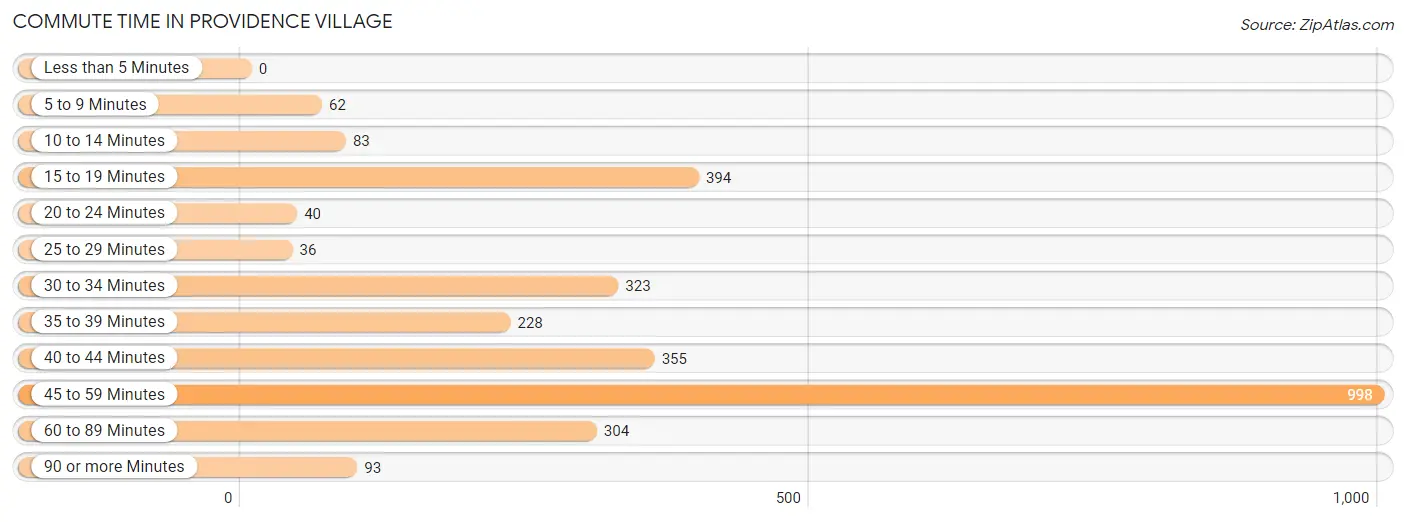
| Commute Time | # Commuters | % Commuters |
| Less than 5 Minutes | 0 | 0.0% |
| 5 to 9 Minutes | 62 | 2.1% |
| 10 to 14 Minutes | 83 | 2.9% |
| 15 to 19 Minutes | 394 | 13.5% |
| 20 to 24 Minutes | 40 | 1.4% |
| 25 to 29 Minutes | 36 | 1.2% |
| 30 to 34 Minutes | 323 | 11.1% |
| 35 to 39 Minutes | 228 | 7.8% |
| 40 to 44 Minutes | 355 | 12.2% |
| 45 to 59 Minutes | 998 | 34.2% |
| 60 to 89 Minutes | 304 | 10.4% |
| 90 or more Minutes | 93 | 3.2% |
Commute Time by Sex in Providence Village
The most common commute times in Providence Village are 45 to 59 minutes (640 commuters, 46.9%) for males and 45 to 59 minutes (358 commuters, 23.1%) for females.
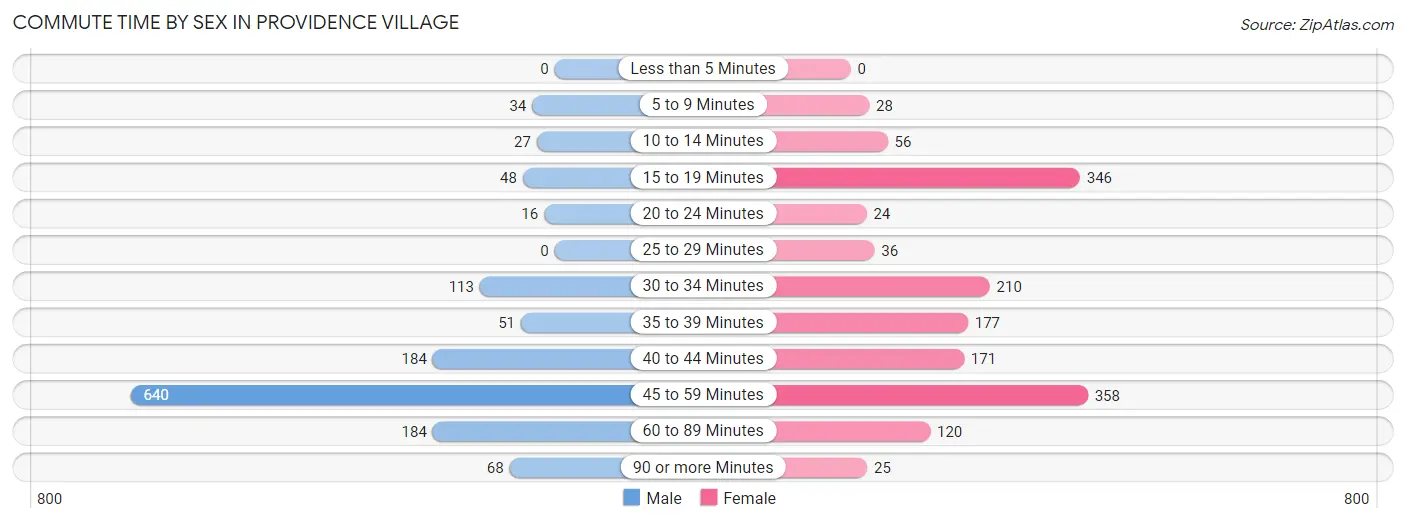
| Commute Time | Male | Female |
| Less than 5 Minutes | 0 (0.0%) | 0 (0.0%) |
| 5 to 9 Minutes | 34 (2.5%) | 28 (1.8%) |
| 10 to 14 Minutes | 27 (2.0%) | 56 (3.6%) |
| 15 to 19 Minutes | 48 (3.5%) | 346 (22.3%) |
| 20 to 24 Minutes | 16 (1.2%) | 24 (1.5%) |
| 25 to 29 Minutes | 0 (0.0%) | 36 (2.3%) |
| 30 to 34 Minutes | 113 (8.3%) | 210 (13.5%) |
| 35 to 39 Minutes | 51 (3.7%) | 177 (11.4%) |
| 40 to 44 Minutes | 184 (13.5%) | 171 (11.0%) |
| 45 to 59 Minutes | 640 (46.9%) | 358 (23.1%) |
| 60 to 89 Minutes | 184 (13.5%) | 120 (7.7%) |
| 90 or more Minutes | 68 (5.0%) | 25 (1.6%) |
Time of Departure to Work by Sex in Providence Village
The most frequent times of departure to work in Providence Village are 6:30 AM to 6:59 AM (284, 20.8%) for males and 9:00 AM to 9:59 AM (247, 15.9%) for females.
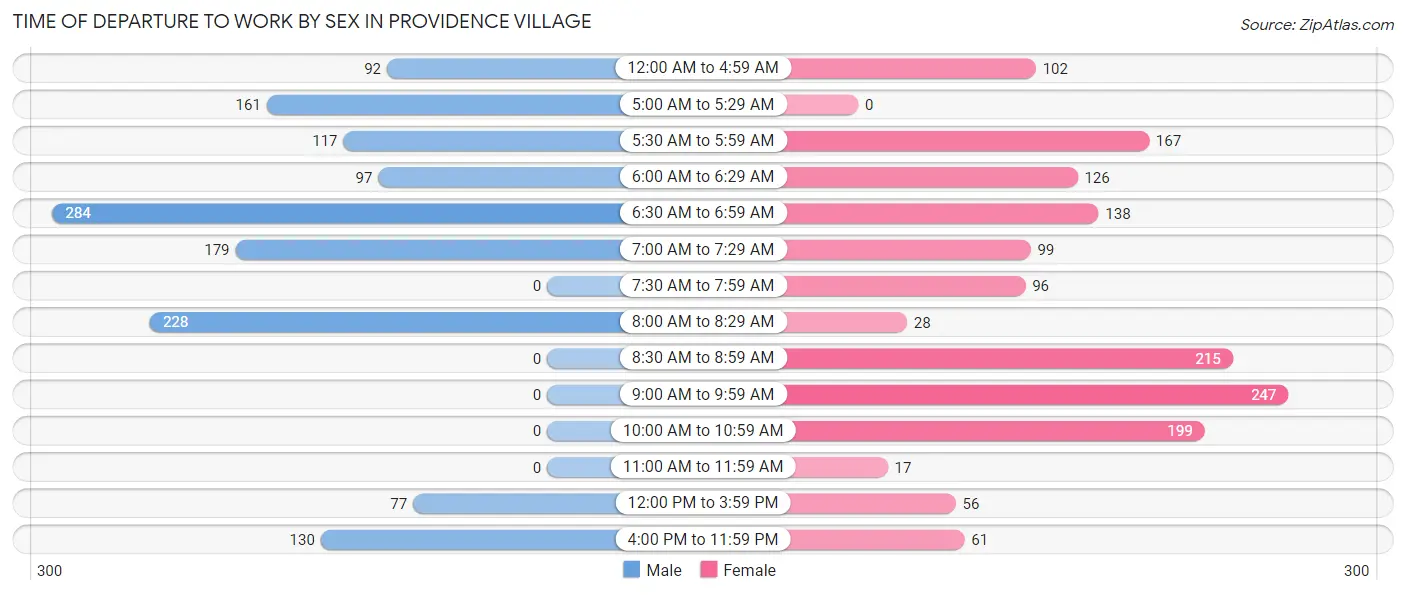
| Time of Departure | Male | Female |
| 12:00 AM to 4:59 AM | 92 (6.7%) | 102 (6.6%) |
| 5:00 AM to 5:29 AM | 161 (11.8%) | 0 (0.0%) |
| 5:30 AM to 5:59 AM | 117 (8.6%) | 167 (10.8%) |
| 6:00 AM to 6:29 AM | 97 (7.1%) | 126 (8.1%) |
| 6:30 AM to 6:59 AM | 284 (20.8%) | 138 (8.9%) |
| 7:00 AM to 7:29 AM | 179 (13.1%) | 99 (6.4%) |
| 7:30 AM to 7:59 AM | 0 (0.0%) | 96 (6.2%) |
| 8:00 AM to 8:29 AM | 228 (16.7%) | 28 (1.8%) |
| 8:30 AM to 8:59 AM | 0 (0.0%) | 215 (13.9%) |
| 9:00 AM to 9:59 AM | 0 (0.0%) | 247 (15.9%) |
| 10:00 AM to 10:59 AM | 0 (0.0%) | 199 (12.8%) |
| 11:00 AM to 11:59 AM | 0 (0.0%) | 17 (1.1%) |
| 12:00 PM to 3:59 PM | 77 (5.6%) | 56 (3.6%) |
| 4:00 PM to 11:59 PM | 130 (9.5%) | 61 (3.9%) |
| Total | 1,365 (100.0%) | 1,551 (100.0%) |
Housing Occupancy in Providence Village
Occupancy by Ownership in Providence Village
Of the total 2,480 dwellings in Providence Village, owner-occupied units account for 1,814 (73.2%), while renter-occupied units make up 666 (26.9%).
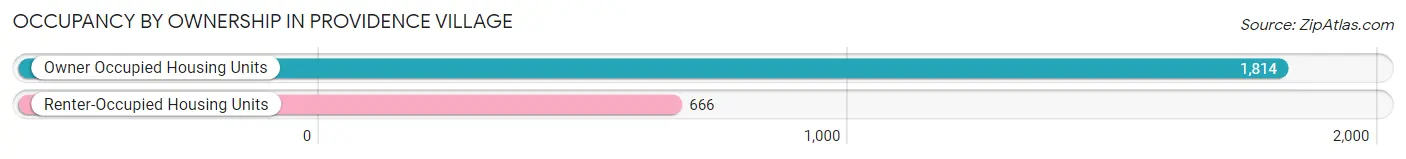
| Occupancy | # Housing Units | % Housing Units |
| Owner Occupied Housing Units | 1,814 | 73.2% |
| Renter-Occupied Housing Units | 666 | 26.9% |
| Total Occupied Housing Units | 2,480 | 100.0% |
Occupancy by Household Size in Providence Village
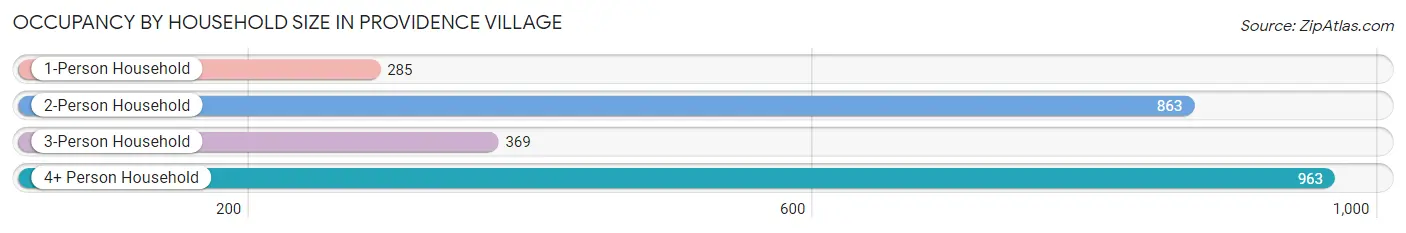
| Household Size | # Housing Units | % Housing Units |
| 1-Person Household | 285 | 11.5% |
| 2-Person Household | 863 | 34.8% |
| 3-Person Household | 369 | 14.9% |
| 4+ Person Household | 963 | 38.8% |
| Total Housing Units | 2,480 | 100.0% |
Occupancy by Ownership by Household Size in Providence Village
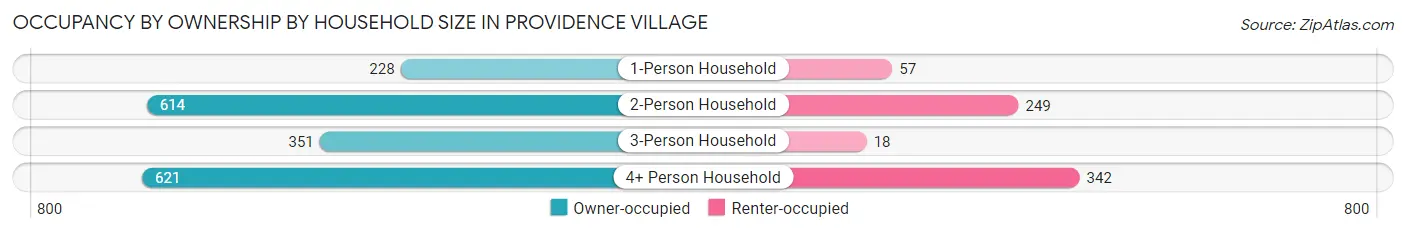
| Household Size | Owner-occupied | Renter-occupied |
| 1-Person Household | 228 (80.0%) | 57 (20.0%) |
| 2-Person Household | 614 (71.2%) | 249 (28.8%) |
| 3-Person Household | 351 (95.1%) | 18 (4.9%) |
| 4+ Person Household | 621 (64.5%) | 342 (35.5%) |
| Total Housing Units | 1,814 (73.2%) | 666 (26.9%) |
Occupancy by Educational Attainment in Providence Village
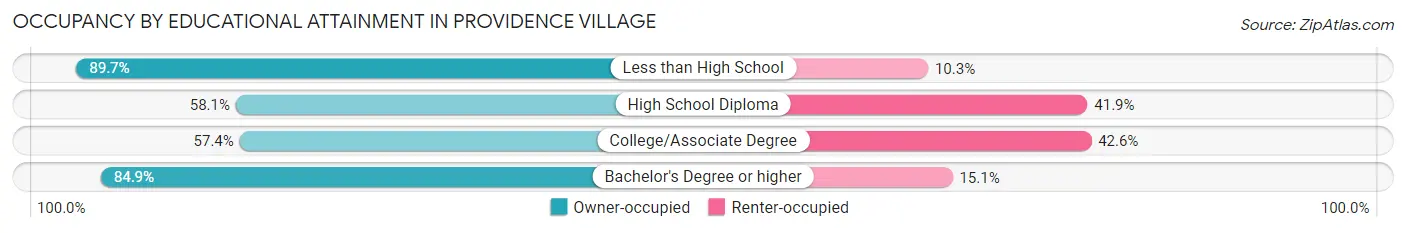
| Household Size | Owner-occupied | Renter-occupied |
| Less than High School | 166 (89.7%) | 19 (10.3%) |
| High School Diploma | 193 (58.1%) | 139 (41.9%) |
| College/Associate Degree | 440 (57.4%) | 327 (42.6%) |
| Bachelor's Degree or higher | 1,015 (84.9%) | 181 (15.1%) |
Occupancy by Age of Householder in Providence Village
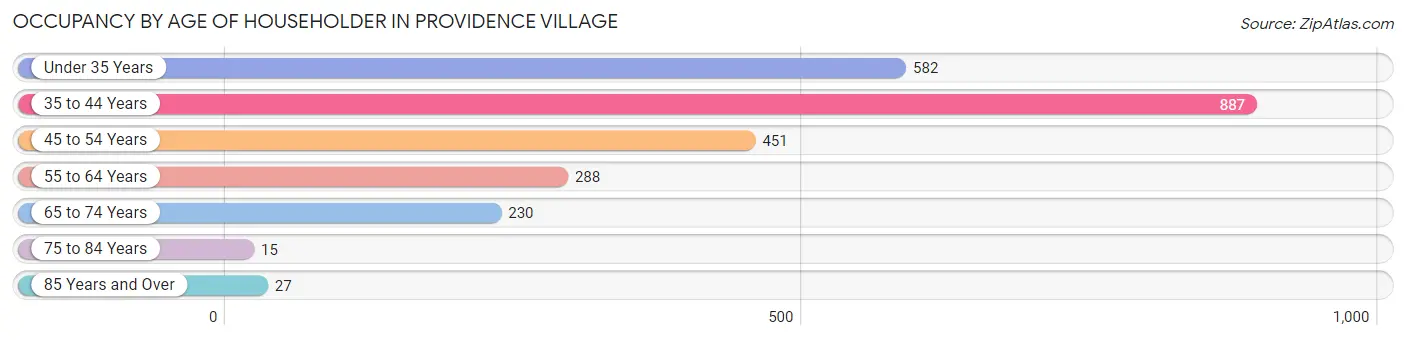
| Age Bracket | # Households | % Households |
| Under 35 Years | 582 | 23.5% |
| 35 to 44 Years | 887 | 35.8% |
| 45 to 54 Years | 451 | 18.2% |
| 55 to 64 Years | 288 | 11.6% |
| 65 to 74 Years | 230 | 9.3% |
| 75 to 84 Years | 15 | 0.6% |
| 85 Years and Over | 27 | 1.1% |
| Total | 2,480 | 100.0% |
Housing Finances in Providence Village
Median Income by Occupancy in Providence Village
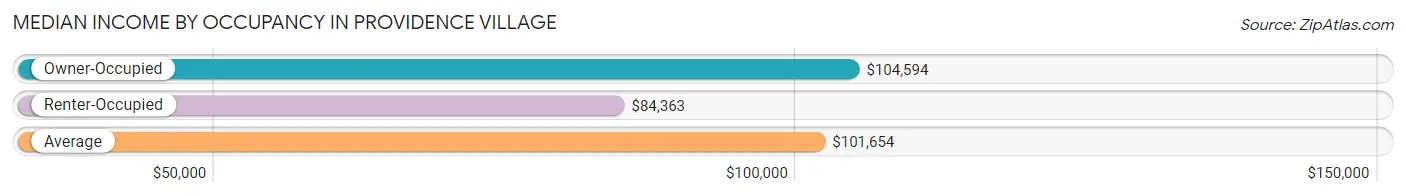
| Occupancy Type | # Households | Median Income |
| Owner-Occupied | 1,814 (73.2%) | $104,594 |
| Renter-Occupied | 666 (26.9%) | $84,363 |
| Average | 2,480 (100.0%) | $101,654 |
Occupancy by Householder Income Bracket in Providence Village
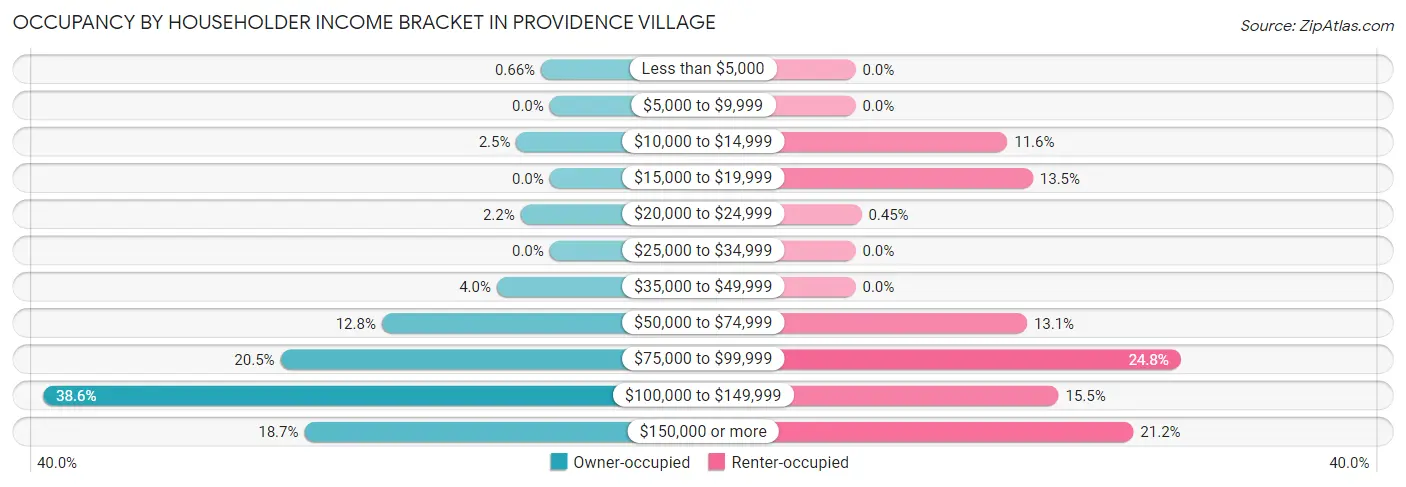
| Income Bracket | Owner-occupied | Renter-occupied |
| Less than $5,000 | 12 (0.7%) | 0 (0.0%) |
| $5,000 to $9,999 | 0 (0.0%) | 0 (0.0%) |
| $10,000 to $14,999 | 46 (2.5%) | 77 (11.6%) |
| $15,000 to $19,999 | 0 (0.0%) | 90 (13.5%) |
| $20,000 to $24,999 | 40 (2.2%) | 3 (0.4%) |
| $25,000 to $34,999 | 0 (0.0%) | 0 (0.0%) |
| $35,000 to $49,999 | 73 (4.0%) | 0 (0.0%) |
| $50,000 to $74,999 | 232 (12.8%) | 87 (13.1%) |
| $75,000 to $99,999 | 372 (20.5%) | 165 (24.8%) |
| $100,000 to $149,999 | 700 (38.6%) | 103 (15.5%) |
| $150,000 or more | 339 (18.7%) | 141 (21.2%) |
| Total | 1,814 (100.0%) | 666 (100.0%) |
Monthly Housing Cost Tiers in Providence Village
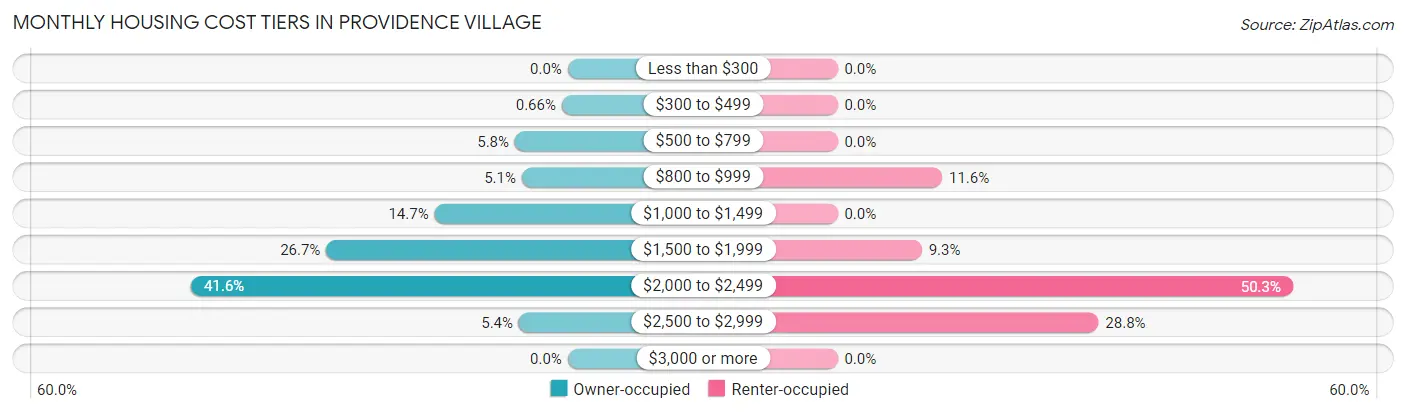
| Monthly Cost | Owner-occupied | Renter-occupied |
| Less than $300 | 0 (0.0%) | 0 (0.0%) |
| $300 to $499 | 12 (0.7%) | 0 (0.0%) |
| $500 to $799 | 106 (5.8%) | 0 (0.0%) |
| $800 to $999 | 92 (5.1%) | 77 (11.6%) |
| $1,000 to $1,499 | 267 (14.7%) | 0 (0.0%) |
| $1,500 to $1,999 | 484 (26.7%) | 62 (9.3%) |
| $2,000 to $2,499 | 755 (41.6%) | 335 (50.3%) |
| $2,500 to $2,999 | 98 (5.4%) | 192 (28.8%) |
| $3,000 or more | 0 (0.0%) | 0 (0.0%) |
| Total | 1,814 (100.0%) | 666 (100.0%) |
Physical Housing Characteristics in Providence Village
Housing Structures in Providence Village
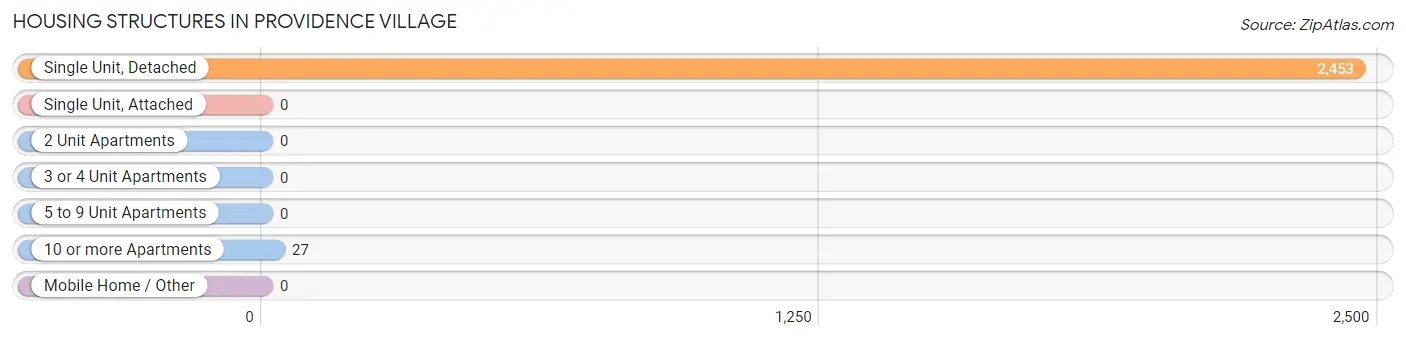
| Structure Type | # Housing Units | % Housing Units |
| Single Unit, Detached | 2,453 | 98.9% |
| Single Unit, Attached | 0 | 0.0% |
| 2 Unit Apartments | 0 | 0.0% |
| 3 or 4 Unit Apartments | 0 | 0.0% |
| 5 to 9 Unit Apartments | 0 | 0.0% |
| 10 or more Apartments | 27 | 1.1% |
| Mobile Home / Other | 0 | 0.0% |
| Total | 2,480 | 100.0% |
Housing Structures by Occupancy in Providence Village
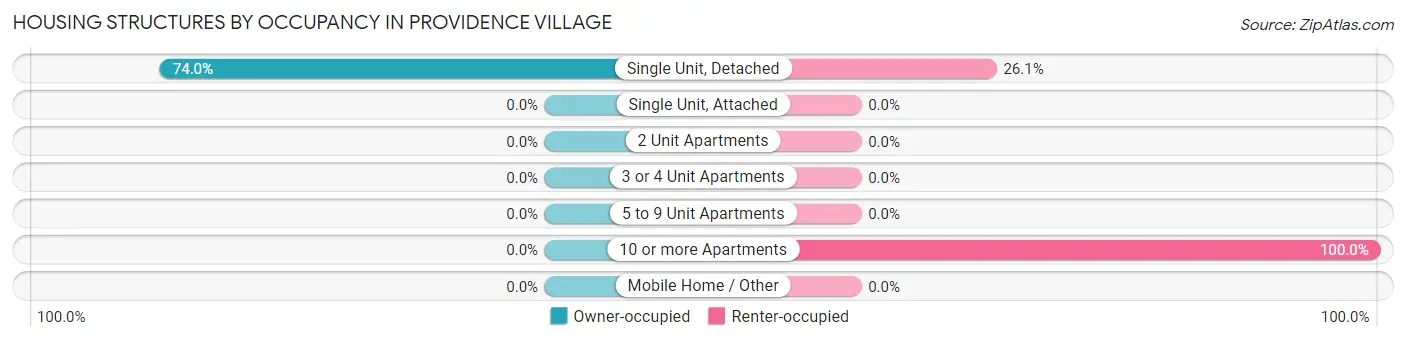
| Structure Type | Owner-occupied | Renter-occupied |
| Single Unit, Detached | 1,814 (74.0%) | 639 (26.1%) |
| Single Unit, Attached | 0 (0.0%) | 0 (0.0%) |
| 2 Unit Apartments | 0 (0.0%) | 0 (0.0%) |
| 3 or 4 Unit Apartments | 0 (0.0%) | 0 (0.0%) |
| 5 to 9 Unit Apartments | 0 (0.0%) | 0 (0.0%) |
| 10 or more Apartments | 0 (0.0%) | 27 (100.0%) |
| Mobile Home / Other | 0 (0.0%) | 0 (0.0%) |
| Total | 1,814 (73.2%) | 666 (26.9%) |
Housing Structures by Number of Rooms in Providence Village
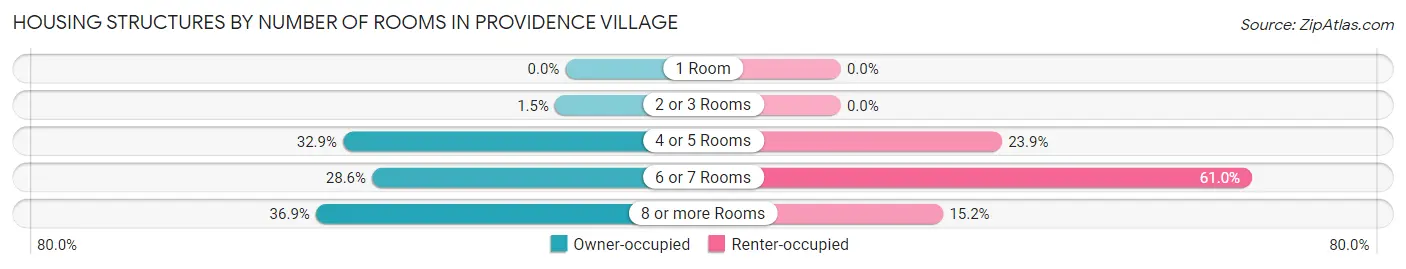
| Number of Rooms | Owner-occupied | Renter-occupied |
| 1 Room | 0 (0.0%) | 0 (0.0%) |
| 2 or 3 Rooms | 28 (1.5%) | 0 (0.0%) |
| 4 or 5 Rooms | 597 (32.9%) | 159 (23.9%) |
| 6 or 7 Rooms | 519 (28.6%) | 406 (61.0%) |
| 8 or more Rooms | 670 (36.9%) | 101 (15.2%) |
| Total | 1,814 (100.0%) | 666 (100.0%) |
Housing Structure by Heating Type in Providence Village
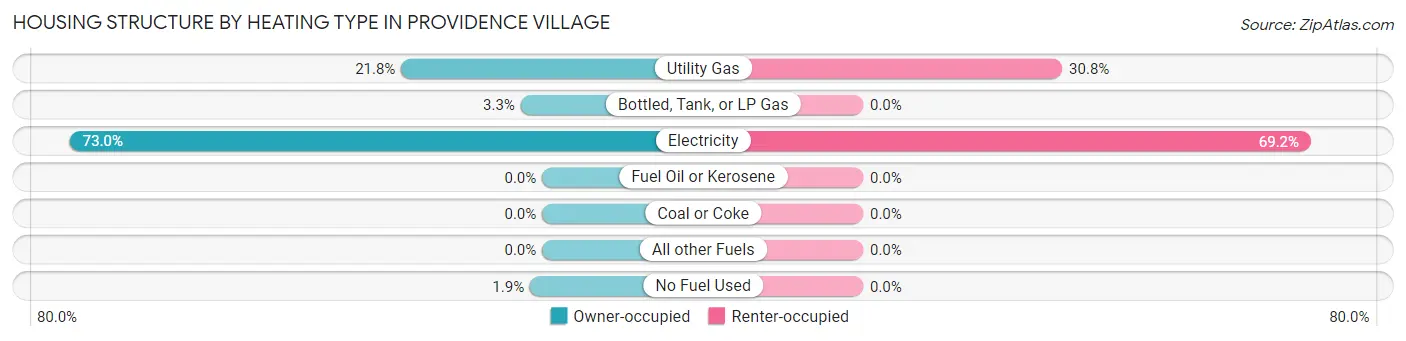
| Heating Type | Owner-occupied | Renter-occupied |
| Utility Gas | 395 (21.8%) | 205 (30.8%) |
| Bottled, Tank, or LP Gas | 60 (3.3%) | 0 (0.0%) |
| Electricity | 1,325 (73.0%) | 461 (69.2%) |
| Fuel Oil or Kerosene | 0 (0.0%) | 0 (0.0%) |
| Coal or Coke | 0 (0.0%) | 0 (0.0%) |
| All other Fuels | 0 (0.0%) | 0 (0.0%) |
| No Fuel Used | 34 (1.9%) | 0 (0.0%) |
| Total | 1,814 (100.0%) | 666 (100.0%) |
Household Vehicle Usage in Providence Village
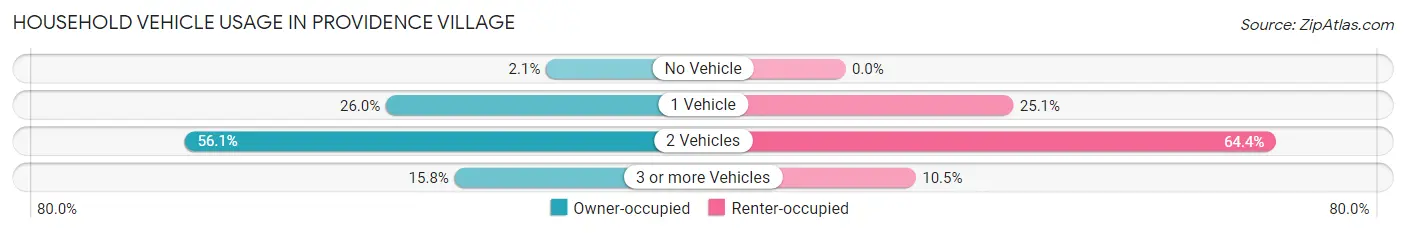
| Vehicles per Household | Owner-occupied | Renter-occupied |
| No Vehicle | 38 (2.1%) | 0 (0.0%) |
| 1 Vehicle | 472 (26.0%) | 167 (25.1%) |
| 2 Vehicles | 1,018 (56.1%) | 429 (64.4%) |
| 3 or more Vehicles | 286 (15.8%) | 70 (10.5%) |
| Total | 1,814 (100.0%) | 666 (100.0%) |
Real Estate & Mortgages in Providence Village
Real Estate and Mortgage Overview in Providence Village
| Characteristic | Without Mortgage | With Mortgage |
| Housing Units | 246 | 1,568 |
| Median Property Value | $287,900 | $277,900 |
| Median Household Income | $73,750 | $326 |
| Monthly Housing Costs | $905 | $0 |
| Real Estate Taxes | $5,222 | $3 |
Property Value by Mortgage Status in Providence Village
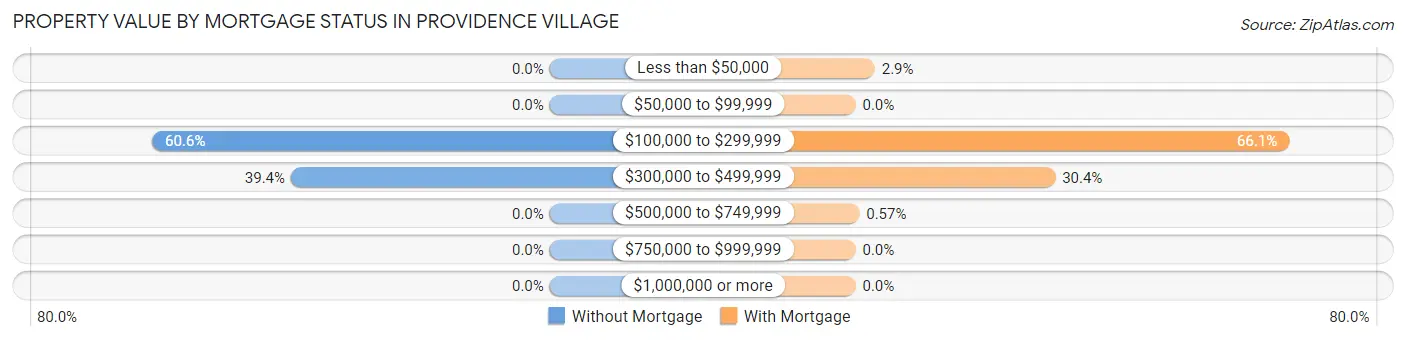
| Property Value | Without Mortgage | With Mortgage |
| Less than $50,000 | 0 (0.0%) | 46 (2.9%) |
| $50,000 to $99,999 | 0 (0.0%) | 0 (0.0%) |
| $100,000 to $299,999 | 149 (60.6%) | 1,036 (66.1%) |
| $300,000 to $499,999 | 97 (39.4%) | 477 (30.4%) |
| $500,000 to $749,999 | 0 (0.0%) | 9 (0.6%) |
| $750,000 to $999,999 | 0 (0.0%) | 0 (0.0%) |
| $1,000,000 or more | 0 (0.0%) | 0 (0.0%) |
| Total | 246 (100.0%) | 1,568 (100.0%) |
Household Income by Mortgage Status in Providence Village
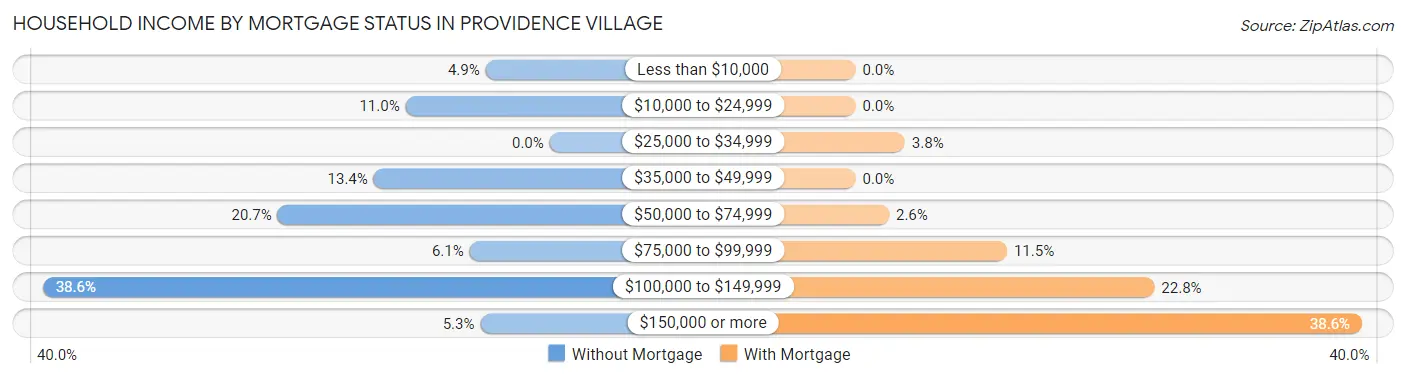
| Household Income | Without Mortgage | With Mortgage |
| Less than $10,000 | 12 (4.9%) | 0 (0.0%) |
| $10,000 to $24,999 | 27 (11.0%) | 0 (0.0%) |
| $25,000 to $34,999 | 0 (0.0%) | 59 (3.8%) |
| $35,000 to $49,999 | 33 (13.4%) | 0 (0.0%) |
| $50,000 to $74,999 | 51 (20.7%) | 40 (2.5%) |
| $75,000 to $99,999 | 15 (6.1%) | 181 (11.5%) |
| $100,000 to $149,999 | 95 (38.6%) | 357 (22.8%) |
| $150,000 or more | 13 (5.3%) | 605 (38.6%) |
| Total | 246 (100.0%) | 1,568 (100.0%) |
Property Value to Household Income Ratio in Providence Village
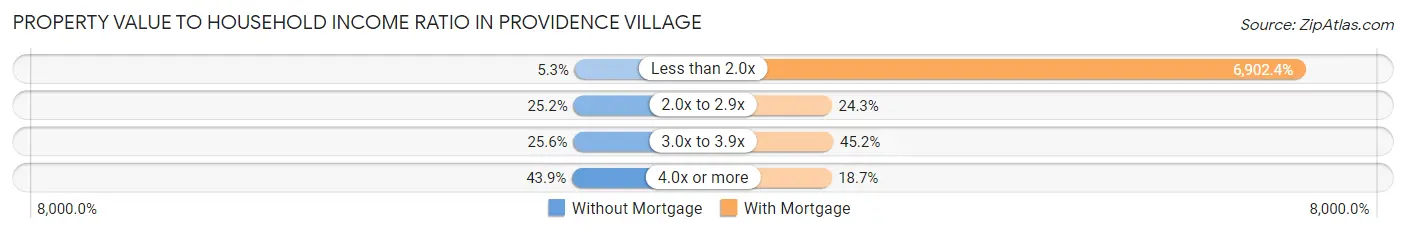
| Value-to-Income Ratio | Without Mortgage | With Mortgage |
| Less than 2.0x | 13 (5.3%) | 108,229 (6,902.4%) |
| 2.0x to 2.9x | 62 (25.2%) | 381 (24.3%) |
| 3.0x to 3.9x | 63 (25.6%) | 708 (45.2%) |
| 4.0x or more | 108 (43.9%) | 293 (18.7%) |
| Total | 246 (100.0%) | 1,568 (100.0%) |
Real Estate Taxes by Mortgage Status in Providence Village
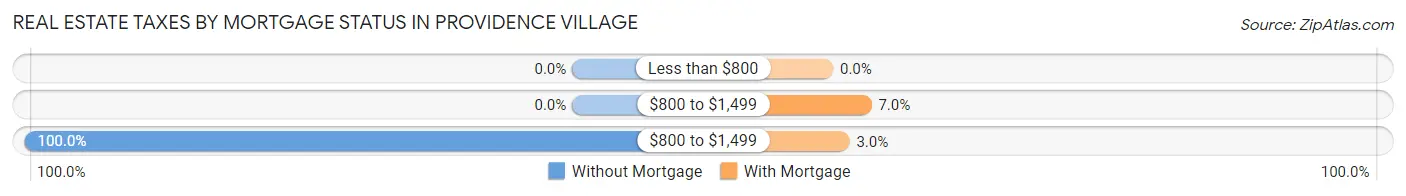
| Property Taxes | Without Mortgage | With Mortgage |
| Less than $800 | 0 (0.0%) | 0 (0.0%) |
| $800 to $1,499 | 0 (0.0%) | 110 (7.0%) |
| $800 to $1,499 | 246 (100.0%) | 47 (3.0%) |
| Total | 246 (100.0%) | 1,568 (100.0%) |
Health & Disability in Providence Village
Health Insurance Coverage by Age in Providence Village
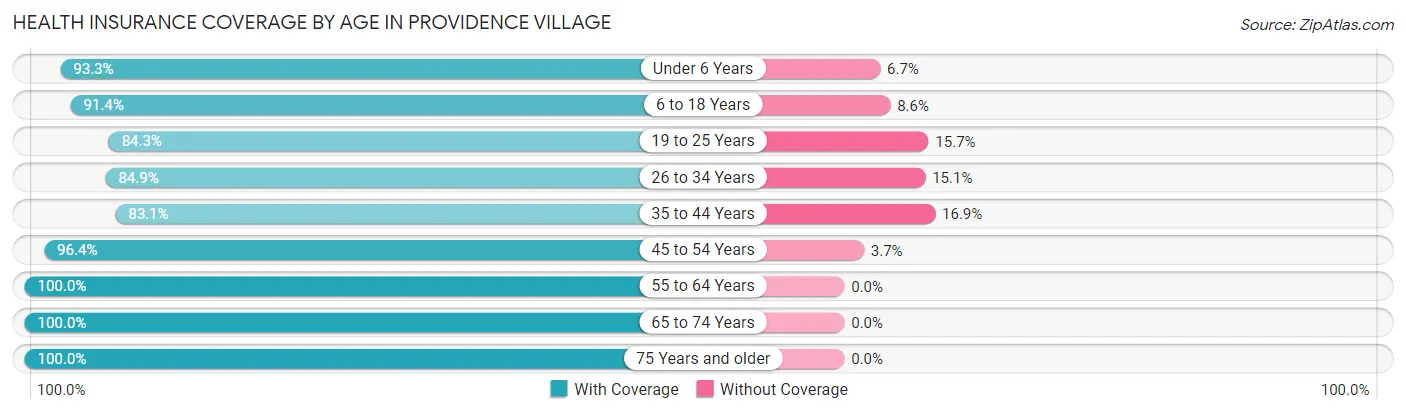
| Age Bracket | With Coverage | Without Coverage |
| Under 6 Years | 728 (93.3%) | 52 (6.7%) |
| 6 to 18 Years | 1,742 (91.4%) | 163 (8.6%) |
| 19 to 25 Years | 258 (84.3%) | 48 (15.7%) |
| 26 to 34 Years | 923 (84.9%) | 164 (15.1%) |
| 35 to 44 Years | 1,379 (83.1%) | 281 (16.9%) |
| 45 to 54 Years | 818 (96.4%) | 31 (3.6%) |
| 55 to 64 Years | 451 (100.0%) | 0 (0.0%) |
| 65 to 74 Years | 389 (100.0%) | 0 (0.0%) |
| 75 Years and older | 283 (100.0%) | 0 (0.0%) |
| Total | 6,971 (90.4%) | 739 (9.6%) |
Health Insurance Coverage by Citizenship Status in Providence Village
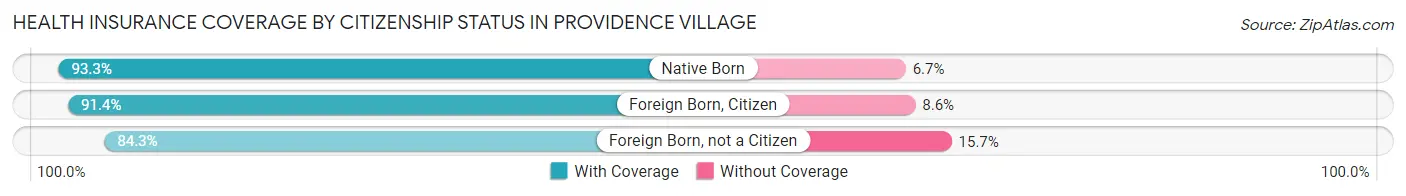
| Citizenship Status | With Coverage | Without Coverage |
| Native Born | 728 (93.3%) | 52 (6.7%) |
| Foreign Born, Citizen | 1,742 (91.4%) | 163 (8.6%) |
| Foreign Born, not a Citizen | 258 (84.3%) | 48 (15.7%) |
Health Insurance Coverage by Household Income in Providence Village
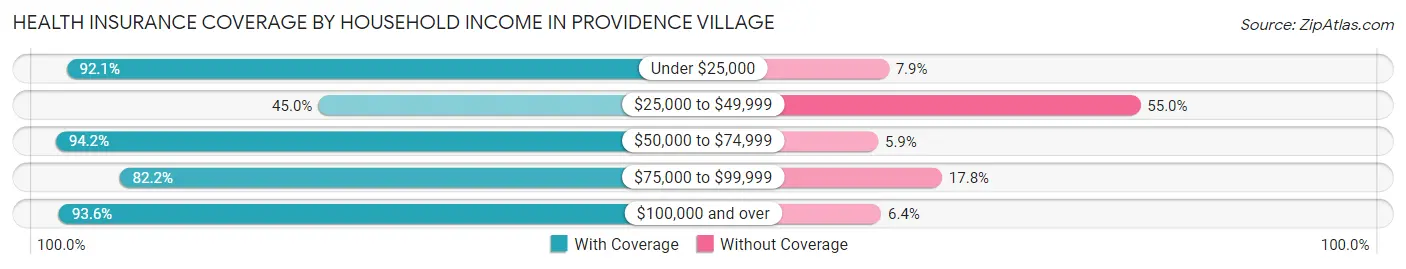
| Household Income | With Coverage | Without Coverage |
| Under $25,000 | 903 (92.1%) | 77 (7.9%) |
| $25,000 to $49,999 | 45 (45.0%) | 55 (55.0%) |
| $50,000 to $74,999 | 757 (94.2%) | 47 (5.9%) |
| $75,000 to $99,999 | 1,337 (82.2%) | 290 (17.8%) |
| $100,000 and over | 3,929 (93.6%) | 270 (6.4%) |
Public vs Private Health Insurance Coverage by Age in Providence Village
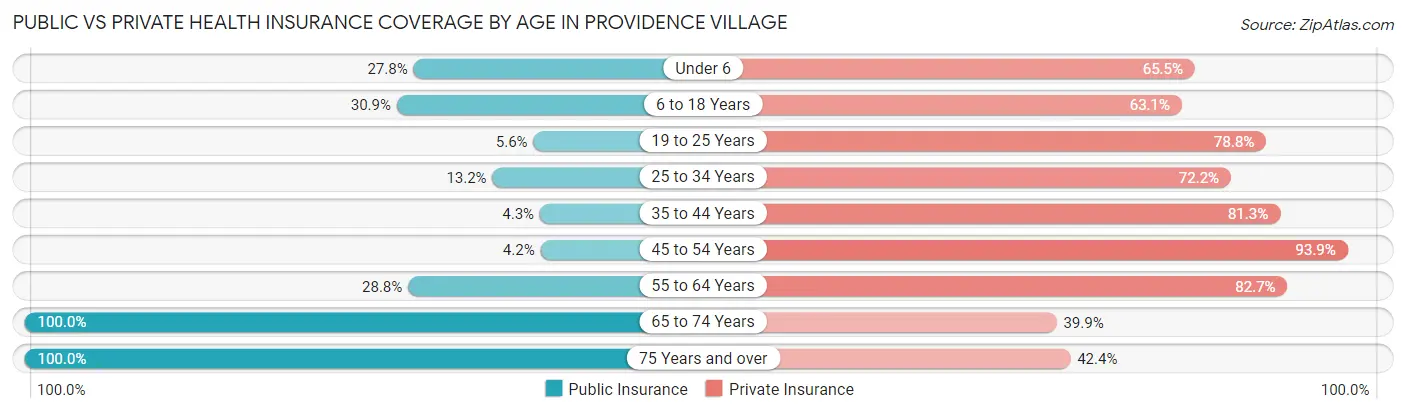
| Age Bracket | Public Insurance | Private Insurance |
| Under 6 | 217 (27.8%) | 511 (65.5%) |
| 6 to 18 Years | 589 (30.9%) | 1,202 (63.1%) |
| 19 to 25 Years | 17 (5.6%) | 241 (78.8%) |
| 25 to 34 Years | 143 (13.2%) | 785 (72.2%) |
| 35 to 44 Years | 72 (4.3%) | 1,350 (81.3%) |
| 45 to 54 Years | 36 (4.2%) | 797 (93.9%) |
| 55 to 64 Years | 130 (28.8%) | 373 (82.7%) |
| 65 to 74 Years | 389 (100.0%) | 155 (39.9%) |
| 75 Years and over | 283 (100.0%) | 120 (42.4%) |
| Total | 1,876 (24.3%) | 5,534 (71.8%) |
Disability Status by Sex by Age in Providence Village
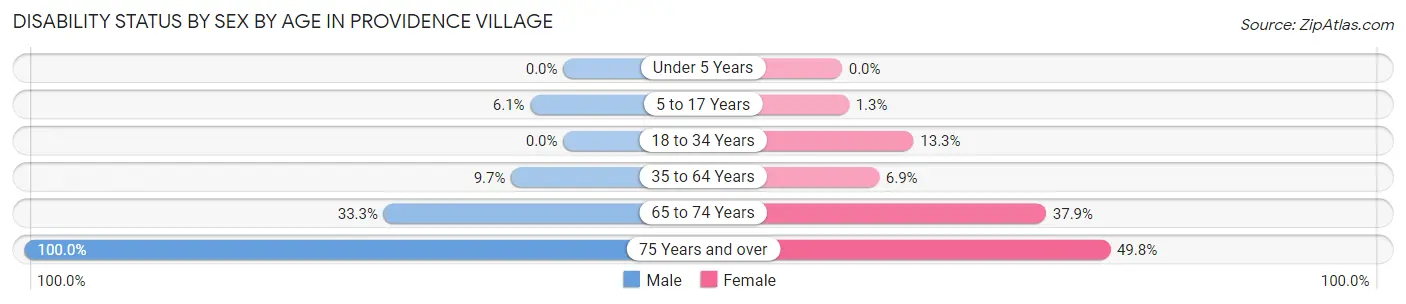
| Age Bracket | Male | Female |
| Under 5 Years | 0 (0.0%) | 0 (0.0%) |
| 5 to 17 Years | 61 (6.1%) | 14 (1.3%) |
| 18 to 34 Years | 0 (0.0%) | 124 (13.3%) |
| 35 to 64 Years | 137 (9.7%) | 106 (6.9%) |
| 65 to 74 Years | 32 (33.3%) | 111 (37.9%) |
| 75 Years and over | 56 (100.0%) | 113 (49.8%) |
Disability Class by Sex by Age in Providence Village
Disability Class: Hearing Difficulty
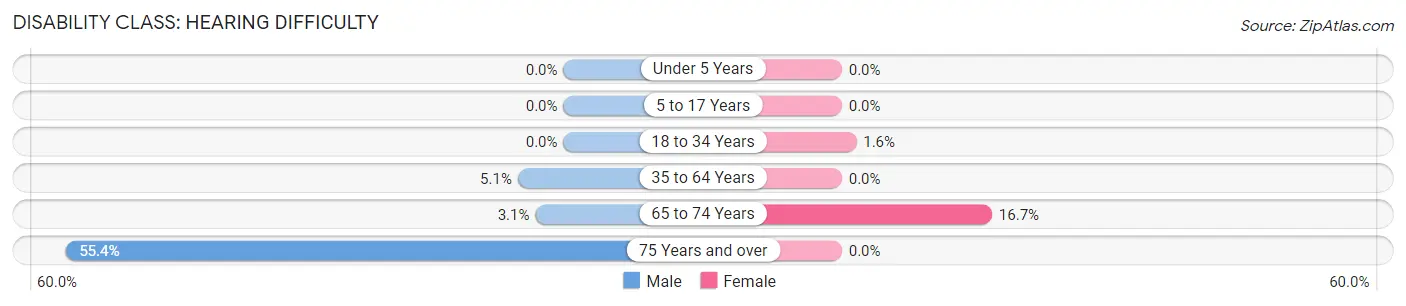
| Age Bracket | Male | Female |
| Under 5 Years | 0 (0.0%) | 0 (0.0%) |
| 5 to 17 Years | 0 (0.0%) | 0 (0.0%) |
| 18 to 34 Years | 0 (0.0%) | 15 (1.6%) |
| 35 to 64 Years | 72 (5.1%) | 0 (0.0%) |
| 65 to 74 Years | 3 (3.1%) | 49 (16.7%) |
| 75 Years and over | 31 (55.4%) | 0 (0.0%) |
Disability Class: Vision Difficulty
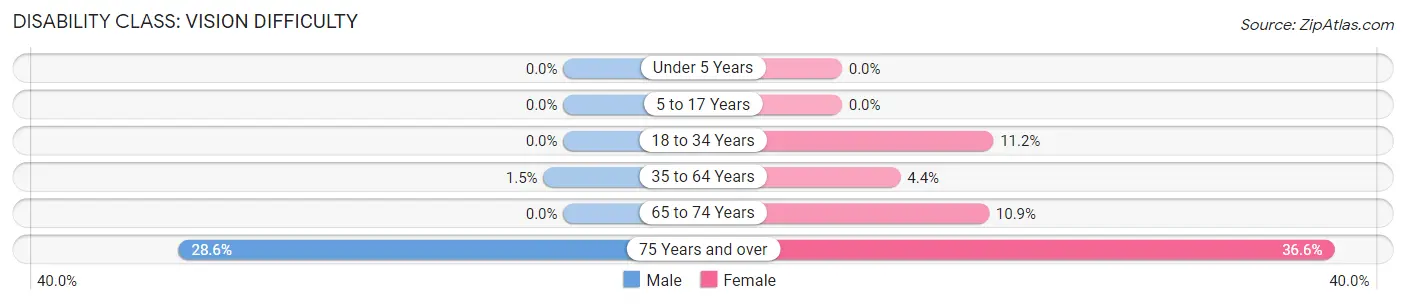
| Age Bracket | Male | Female |
| Under 5 Years | 0 (0.0%) | 0 (0.0%) |
| 5 to 17 Years | 0 (0.0%) | 0 (0.0%) |
| 18 to 34 Years | 0 (0.0%) | 105 (11.2%) |
| 35 to 64 Years | 21 (1.5%) | 67 (4.3%) |
| 65 to 74 Years | 0 (0.0%) | 32 (10.9%) |
| 75 Years and over | 16 (28.6%) | 83 (36.6%) |
Disability Class: Cognitive Difficulty
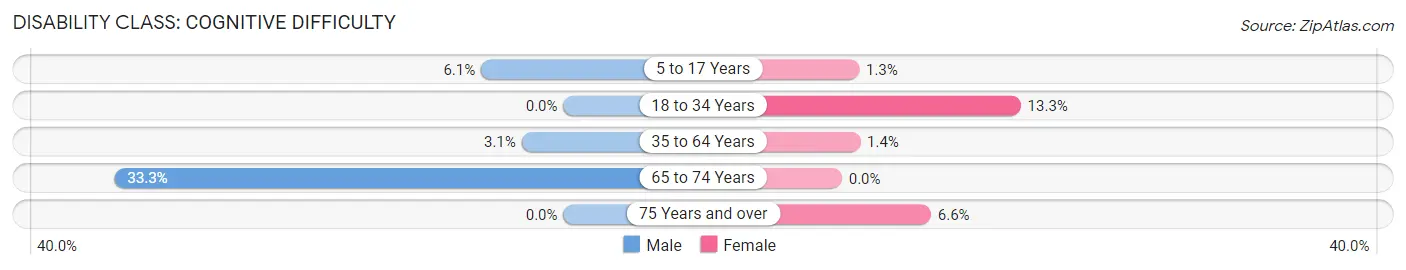
| Age Bracket | Male | Female |
| 5 to 17 Years | 61 (6.1%) | 14 (1.3%) |
| 18 to 34 Years | 0 (0.0%) | 124 (13.3%) |
| 35 to 64 Years | 44 (3.1%) | 21 (1.4%) |
| 65 to 74 Years | 32 (33.3%) | 0 (0.0%) |
| 75 Years and over | 0 (0.0%) | 15 (6.6%) |
Disability Class: Ambulatory Difficulty
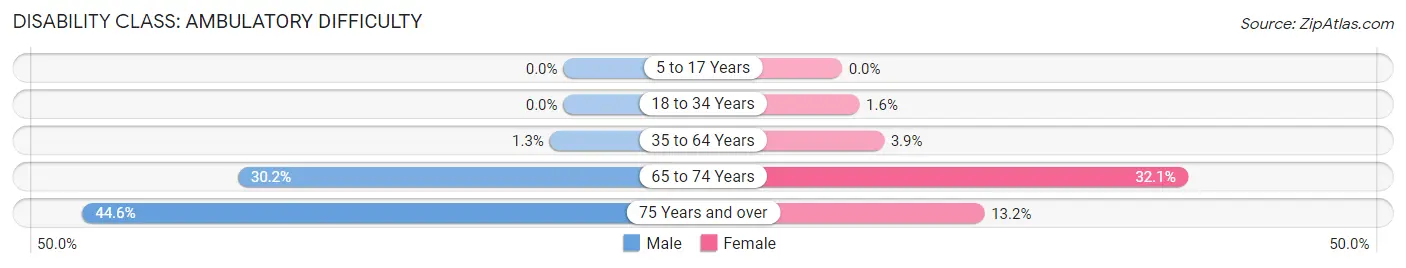
| Age Bracket | Male | Female |
| 5 to 17 Years | 0 (0.0%) | 0 (0.0%) |
| 18 to 34 Years | 0 (0.0%) | 15 (1.6%) |
| 35 to 64 Years | 18 (1.3%) | 60 (3.9%) |
| 65 to 74 Years | 29 (30.2%) | 94 (32.1%) |
| 75 Years and over | 25 (44.6%) | 30 (13.2%) |
Disability Class: Self-Care Difficulty
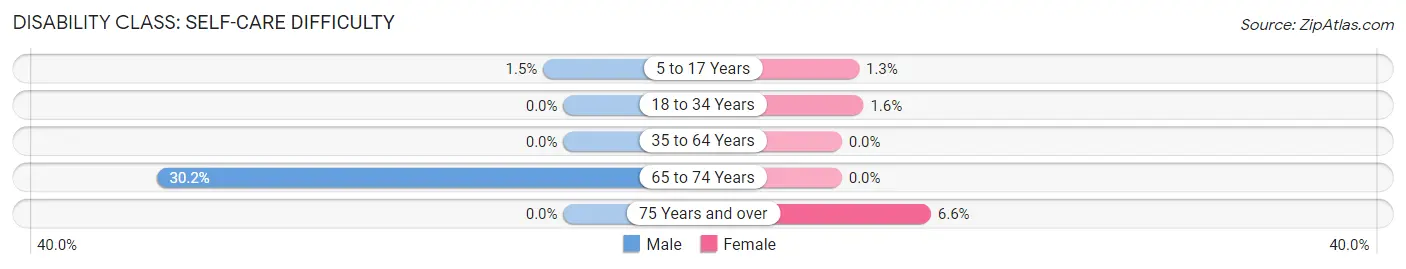
| Age Bracket | Male | Female |
| 5 to 17 Years | 15 (1.5%) | 14 (1.3%) |
| 18 to 34 Years | 0 (0.0%) | 15 (1.6%) |
| 35 to 64 Years | 0 (0.0%) | 0 (0.0%) |
| 65 to 74 Years | 29 (30.2%) | 0 (0.0%) |
| 75 Years and over | 0 (0.0%) | 15 (6.6%) |
Technology Access in Providence Village
Computing Device Access in Providence Village
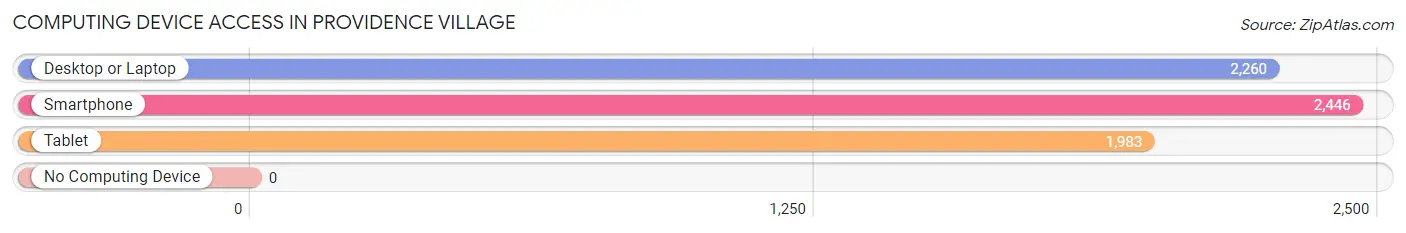
| Device Type | # Households | % Households |
| Desktop or Laptop | 2,260 | 91.1% |
| Smartphone | 2,446 | 98.6% |
| Tablet | 1,983 | 80.0% |
| No Computing Device | 0 | 0.0% |
| Total | 2,480 | 100.0% |
Internet Access in Providence Village
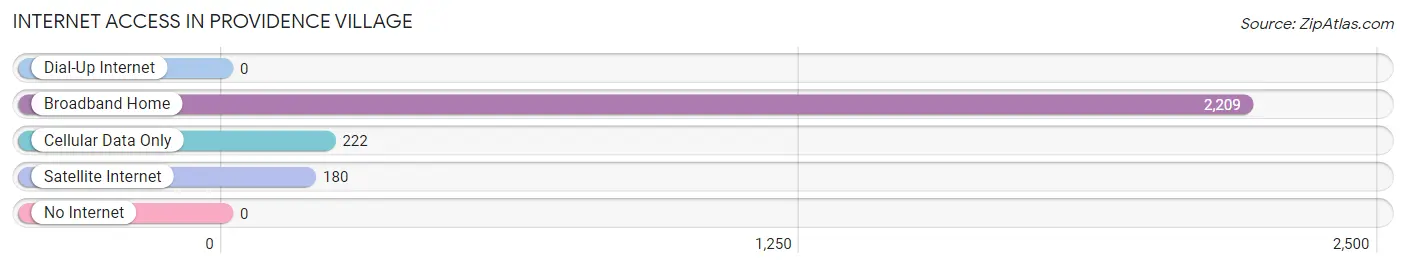
| Internet Type | # Households | % Households |
| Dial-Up Internet | 0 | 0.0% |
| Broadband Home | 2,209 | 89.1% |
| Cellular Data Only | 222 | 8.9% |
| Satellite Internet | 180 | 7.3% |
| No Internet | 0 | 0.0% |
| Total | 2,480 | 100.0% |
Providence Village Summary
Providence Village, Texas is a small town located in Denton County, Texas. It is situated about 30 miles north of Dallas and is part of the Dallas-Fort Worth-Arlington metropolitan area. The town was founded in 2002 and has a population of approximately 5,000 people.
Geography
Providence Village is located in the northern part of Denton County, Texas. It is situated on the western edge of Lake Ray Roberts, a large reservoir created by the damming of the Trinity River. The town is bordered by the cities of Aubrey, Pilot Point, and Sanger. The terrain of the area is mostly flat, with some rolling hills. The climate is humid subtropical, with hot summers and mild winters.
Economy
The economy of Providence Village is largely based on agriculture and tourism. The town is home to several farms, which produce a variety of crops, including corn, cotton, and hay. The town also has several wineries and vineyards, which attract tourists from all over the state. Additionally, the town is home to several small businesses, including restaurants, retail stores, and service providers.
Demographics
As of the 2010 census, the population of Providence Village was 5,000. The racial makeup of the town was 94.3% White, 0.7% African American, 0.3% Native American, 0.7% Asian, 0.1% Pacific Islander, 2.2% from other races, and 1.9% from two or more races. Hispanic or Latino of any race were 5.3% of the population.
The median income for a household in the town was $50,000, and the median income for a family was $54,000. The per capita income for the town was $20,000. About 8.3% of families and 10.2% of the population were below the poverty line, including 14.3% of those under age 18 and 6.2% of those age 65 or over.
History
The area that is now Providence Village was originally inhabited by Native American tribes, including the Caddo, Comanche, and Wichita. The first European settlers arrived in the area in the 1840s, and the town was officially founded in 2002. The town was named after the nearby Providence Baptist Church, which was established in 1854.
In the early 2000s, the town experienced rapid growth due to its proximity to the Dallas-Fort Worth-Arlington metropolitan area. The town was incorporated in 2002, and the population has grown steadily since then. Today, Providence Village is a thriving small town with a strong sense of community.
Common Questions
What is Per Capita Income in Providence Village?
Per Capita income in Providence Village is $34,994.
What is the Median Family Income in Providence Village?
Median Family Income in Providence Village is $103,871.
What is the Median Household income in Providence Village?
Median Household Income in Providence Village is $101,654.
What is Income or Wage Gap in Providence Village?
Income or Wage Gap in Providence Village is 38.8%.
Women in Providence Village earn 61.2 cents for every dollar earned by a man.
What is Inequality or Gini Index in Providence Village?
Inequality or Gini Index in Providence Village is 0.29.
What is the Total Population of Providence Village?
Total Population of Providence Village is 7,710.
What is the Total Male Population of Providence Village?
Total Male Population of Providence Village is 3,306.
What is the Total Female Population of Providence Village?
Total Female Population of Providence Village is 4,404.
What is the Ratio of Males per 100 Females in Providence Village?
There are 75.07 Males per 100 Females in Providence Village.
What is the Ratio of Females per 100 Males in Providence Village?
There are 133.21 Females per 100 Males in Providence Village.
What is the Median Population Age in Providence Village?
Median Population Age in Providence Village is 33.4 Years.
What is the Average Family Size in Providence Village
Average Family Size in Providence Village is 3.3 People.
What is the Average Household Size in Providence Village
Average Household Size in Providence Village is 3.1 People.
How Large is the Labor Force in Providence Village?
There are 3,671 People in the Labor Forcein in Providence Village.
What is the Percentage of People in the Labor Force in Providence Village?
70.5% of People are in the Labor Force in Providence Village.
What is the Unemployment Rate in Providence Village?
Unemployment Rate in Providence Village is 2.4%.