Zip Codes with the Highest Percentage of Population Employed in Life, Physical & Social Science in Cordova, TN
RELATED REPORTS & OPTIONS
Life, Physical & Social Science
Cordova
Compare Zip Codes
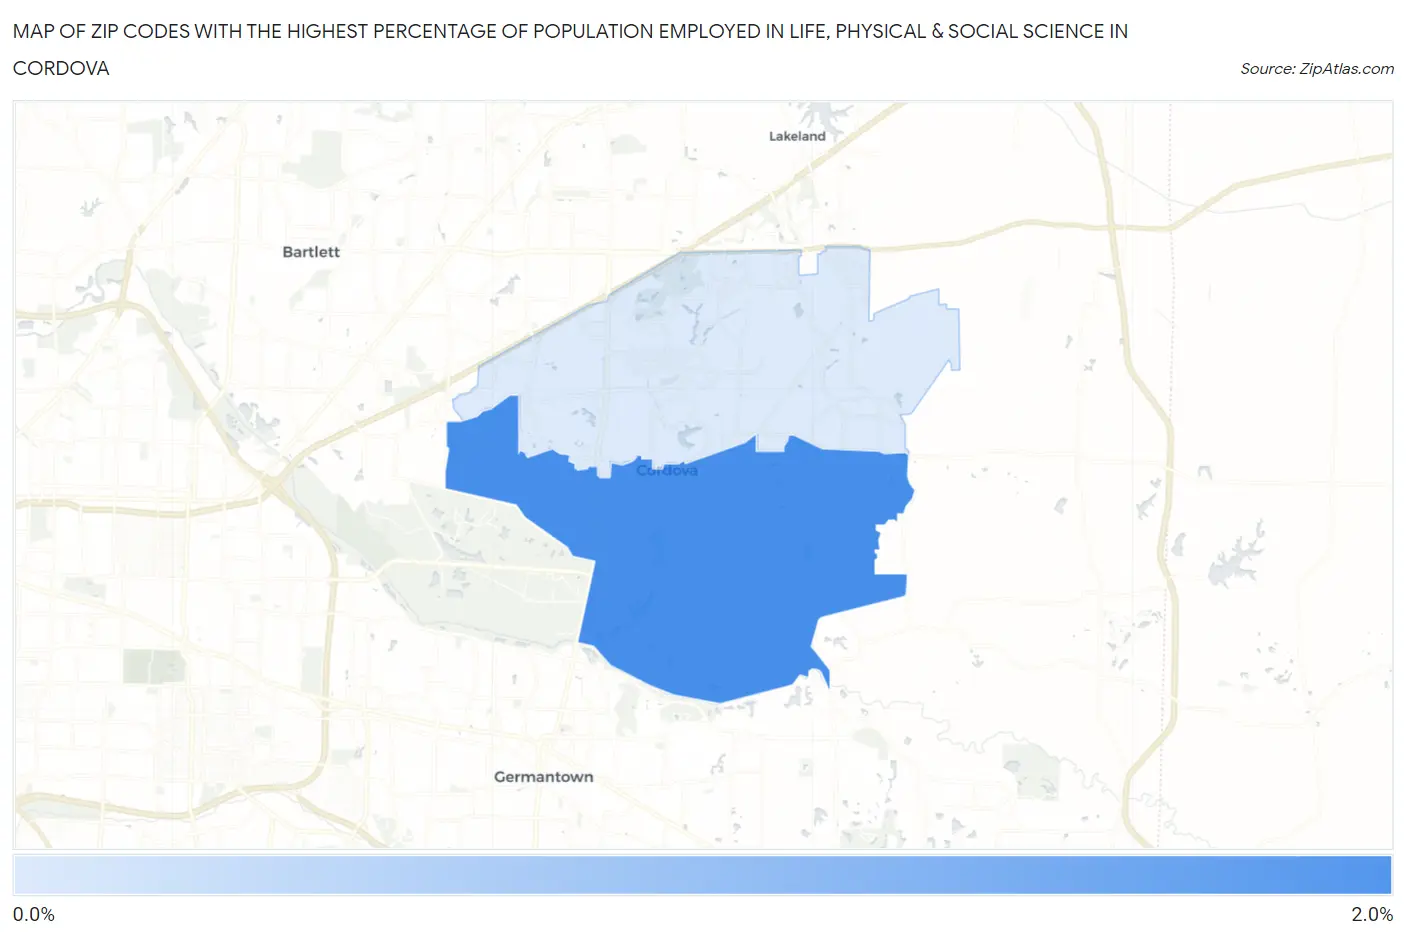
Map of Zip Codes with the Highest Percentage of Population Employed in Life, Physical & Social Science in Cordova
0.93%
1.8%
Zip Codes with the Highest Percentage of Population Employed in Life, Physical & Social Science in Cordova, TN
| Zip Code | % Employed | vs State | vs National | |
| 1. | 38018 | 1.8% | 0.83%(+0.986)#66 | 1.1%(+0.726)#4,273 |
| 2. | 38016 | 0.93% | 0.83%(+0.104)#162 | 1.1%(-0.156)#9,613 |
1
Common Questions
What are the Top Zip Codes with the Highest Percentage of Population Employed in Life, Physical & Social Science in Cordova, TN?
Top Zip Codes with the Highest Percentage of Population Employed in Life, Physical & Social Science in Cordova, TN are:
What zip code has the Highest Percentage of Population Employed in Life, Physical & Social Science in Cordova, TN?
38018 has the Highest Percentage of Population Employed in Life, Physical & Social Science in Cordova, TN with 1.8%.
What is the Percentage of Population Employed in Life, Physical & Social Science in Tennessee?
Percentage of Population Employed in Life, Physical & Social Science in Tennessee is 0.83%.
What is the Percentage of Population Employed in Life, Physical & Social Science in the United States?
Percentage of Population Employed in Life, Physical & Social Science in the United States is 1.1%.