Zip Codes with the Highest Percentage of Population Employed in Life, Physical & Social Science in Sevierville, TN
RELATED REPORTS & OPTIONS
Life, Physical & Social Science
Sevierville
Compare Zip Codes
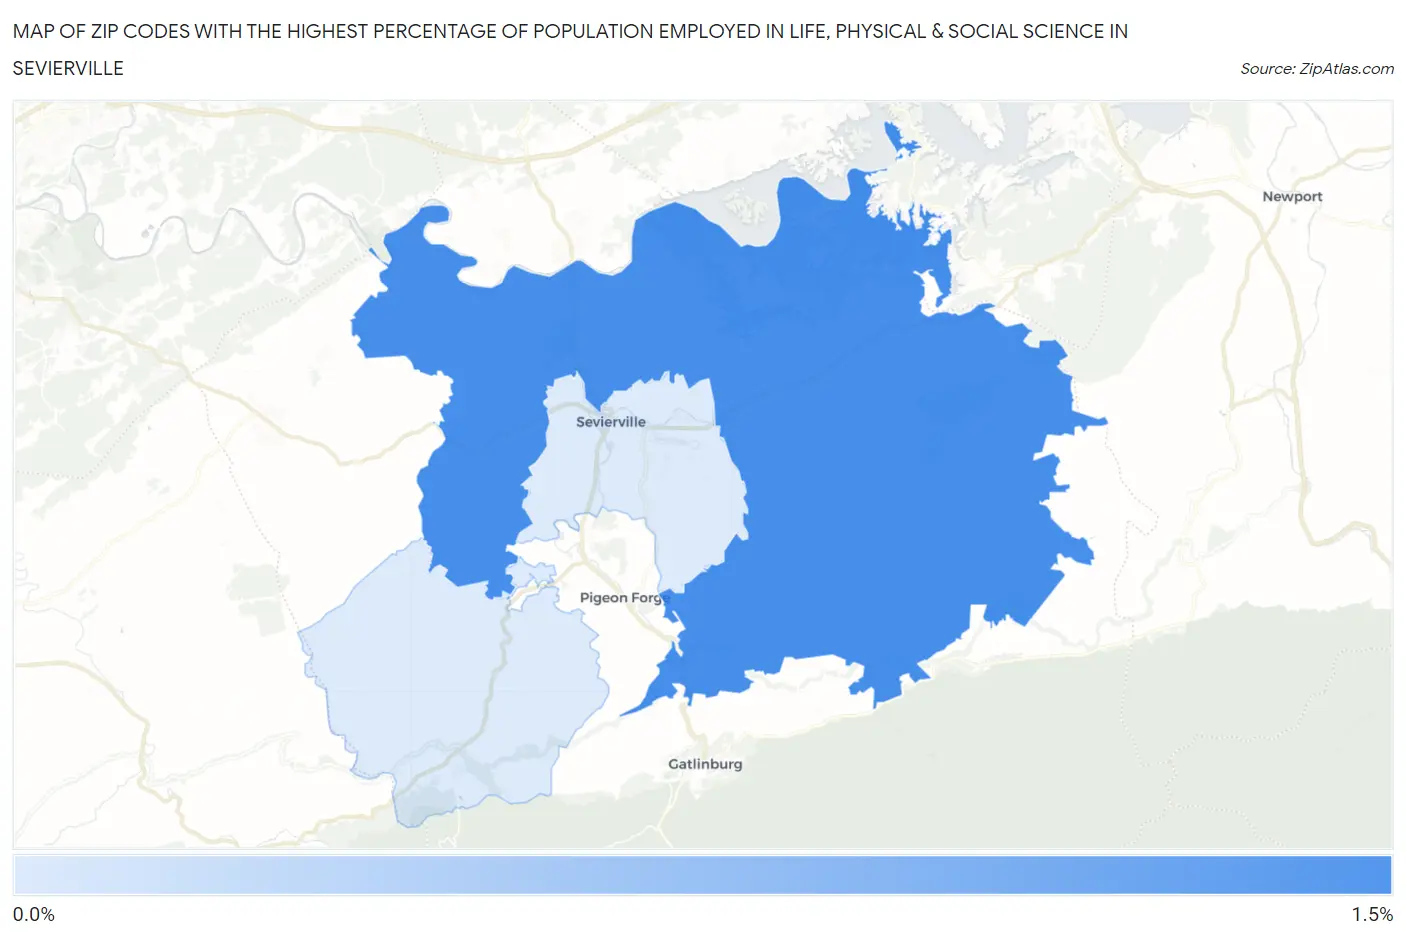
Map of Zip Codes with the Highest Percentage of Population Employed in Life, Physical & Social Science in Sevierville
0.35%
1.5%
Zip Codes with the Highest Percentage of Population Employed in Life, Physical & Social Science in Sevierville, TN
| Zip Code | % Employed | vs State | vs National | |
| 1. | 37876 | 1.5% | 0.83%(+0.644)#81 | 1.1%(+0.384)#5,801 |
| 2. | 37862 | 0.35% | 0.83%(-0.477)#283 | 1.1%(-0.736)#16,348 |
1
Common Questions
What are the Top Zip Codes with the Highest Percentage of Population Employed in Life, Physical & Social Science in Sevierville, TN?
Top Zip Codes with the Highest Percentage of Population Employed in Life, Physical & Social Science in Sevierville, TN are:
What zip code has the Highest Percentage of Population Employed in Life, Physical & Social Science in Sevierville, TN?
37876 has the Highest Percentage of Population Employed in Life, Physical & Social Science in Sevierville, TN with 1.5%.
What is the Percentage of Population Employed in Life, Physical & Social Science in Sevierville, TN?
Percentage of Population Employed in Life, Physical & Social Science in Sevierville is 0.15%.
What is the Percentage of Population Employed in Life, Physical & Social Science in Tennessee?
Percentage of Population Employed in Life, Physical & Social Science in Tennessee is 0.83%.
What is the Percentage of Population Employed in Life, Physical & Social Science in the United States?
Percentage of Population Employed in Life, Physical & Social Science in the United States is 1.1%.