Surgoinsville, TN Map & Demographics
Surgoinsville Map
Surgoinsville Overview
$25,852
PER CAPITA INCOME
$57,181
AVG FAMILY INCOME
$46,250
AVG HOUSEHOLD INCOME
22.8%
WAGE / INCOME GAP [ % ]
77.2¢/ $1
WAGE / INCOME GAP [ $ ]
$6,911
FAMILY INCOME DEFICIT
0.46
INEQUALITY / GINI INDEX
2,316
TOTAL POPULATION
1,065
MALE POPULATION
1,251
FEMALE POPULATION
85.13
MALES / 100 FEMALES
117.46
FEMALES / 100 MALES
43.2
MEDIAN AGE
3.2
AVG FAMILY SIZE
2.6
AVG HOUSEHOLD SIZE
923
LABOR FORCE [ PEOPLE ]
51.2%
PERCENT IN LABOR FORCE
3.7%
UNEMPLOYMENT RATE
Surgoinsville Zip Codes
Surgoinsville Area Codes
Income in Surgoinsville
Income Overview in Surgoinsville
Per Capita Income in Surgoinsville is $25,852, while median incomes of families and households are $57,181 and $46,250 respectively.
| Characteristic | Number | Measure |
| Per Capita Income | 2,316 | $25,852 |
| Median Family Income | 646 | $57,181 |
| Mean Family Income | 646 | $77,443 |
| Median Household Income | 874 | $46,250 |
| Mean Household Income | 874 | $66,285 |
| Income Deficit | 646 | $6,911 |
| Wage / Income Gap (%) | 2,316 | 22.84% |
| Wage / Income Gap ($) | 2,316 | 77.16¢ per $1 |
| Gini / Inequality Index | 2,316 | 0.46 |
Earnings by Sex in Surgoinsville
Average Earnings in Surgoinsville are $35,893, $42,933 for men and $33,125 for women, a difference of 22.8%.
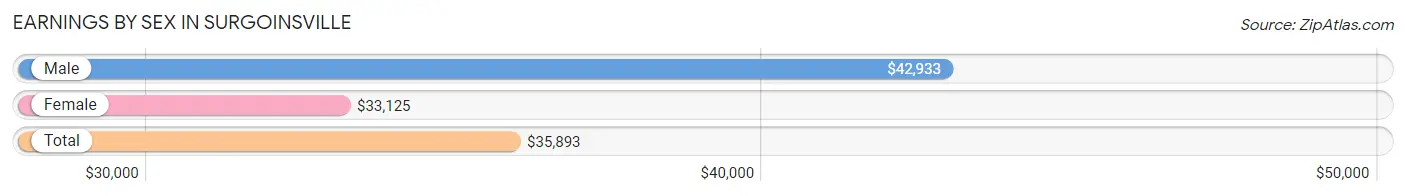
| Sex | Number | Average Earnings |
| Male | 514 (53.9%) | $42,933 |
| Female | 439 (46.1%) | $33,125 |
| Total | 953 (100.0%) | $35,893 |
Earnings by Sex by Income Bracket in Surgoinsville
The most common earnings brackets in Surgoinsville are $40,000 to $44,999 for men (64 | 12.4%) and $2,499 or less for women (60 | 13.7%).
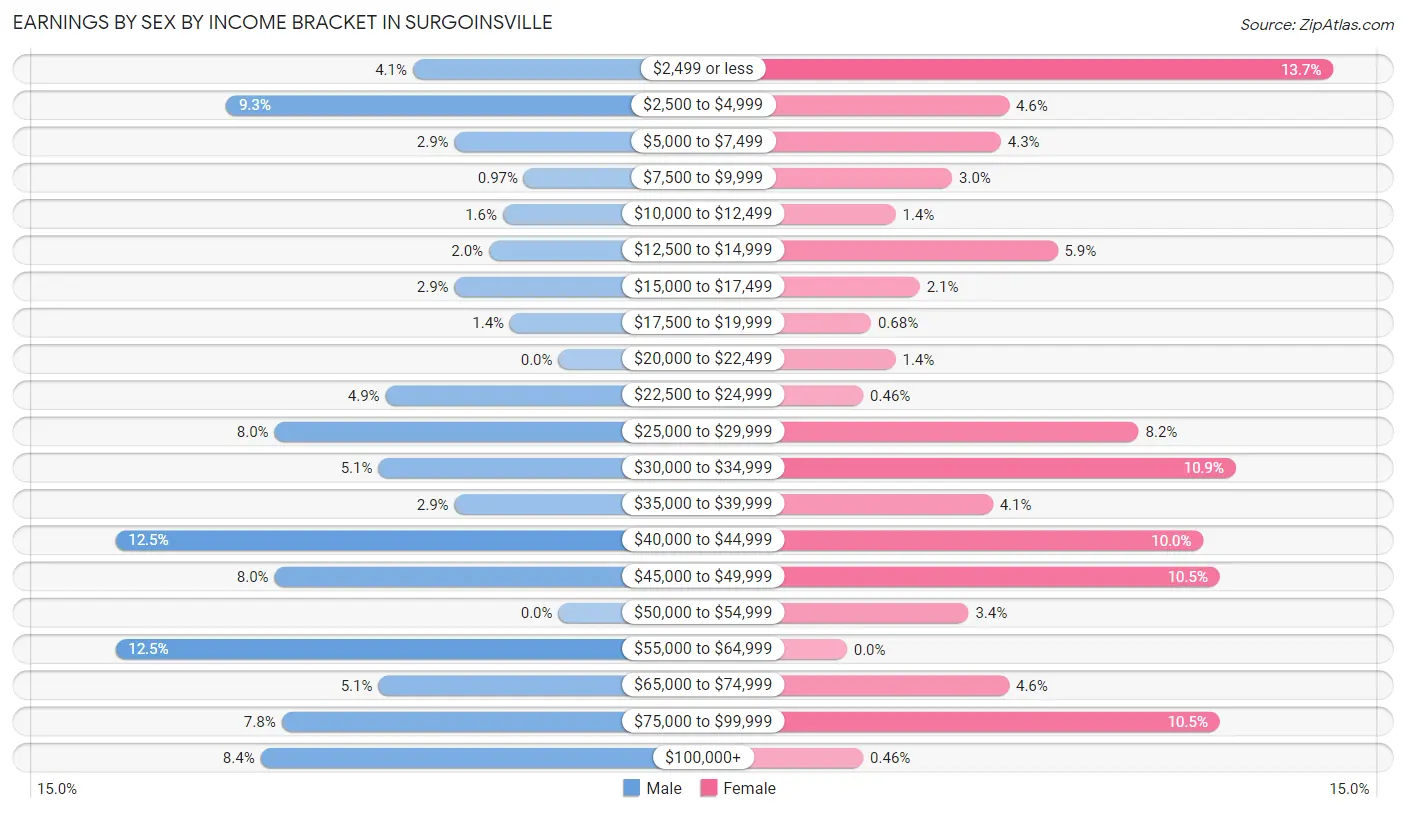
| Income | Male | Female |
| $2,499 or less | 21 (4.1%) | 60 (13.7%) |
| $2,500 to $4,999 | 48 (9.3%) | 20 (4.6%) |
| $5,000 to $7,499 | 15 (2.9%) | 19 (4.3%) |
| $7,500 to $9,999 | 5 (1.0%) | 13 (3.0%) |
| $10,000 to $12,499 | 8 (1.6%) | 6 (1.4%) |
| $12,500 to $14,999 | 10 (1.9%) | 26 (5.9%) |
| $15,000 to $17,499 | 15 (2.9%) | 9 (2.1%) |
| $17,500 to $19,999 | 7 (1.4%) | 3 (0.7%) |
| $20,000 to $22,499 | 0 (0.0%) | 6 (1.4%) |
| $22,500 to $24,999 | 25 (4.9%) | 2 (0.5%) |
| $25,000 to $29,999 | 41 (8.0%) | 36 (8.2%) |
| $30,000 to $34,999 | 26 (5.1%) | 48 (10.9%) |
| $35,000 to $39,999 | 15 (2.9%) | 18 (4.1%) |
| $40,000 to $44,999 | 64 (12.4%) | 44 (10.0%) |
| $45,000 to $49,999 | 41 (8.0%) | 46 (10.5%) |
| $50,000 to $54,999 | 0 (0.0%) | 15 (3.4%) |
| $55,000 to $64,999 | 64 (12.4%) | 0 (0.0%) |
| $65,000 to $74,999 | 26 (5.1%) | 20 (4.6%) |
| $75,000 to $99,999 | 40 (7.8%) | 46 (10.5%) |
| $100,000+ | 43 (8.4%) | 2 (0.5%) |
| Total | 514 (100.0%) | 439 (100.0%) |
Earnings by Sex by Educational Attainment in Surgoinsville
Average earnings in Surgoinsville are $44,519 for men and $35,455 for women, a difference of 20.4%. Men with an educational attainment of bachelor's degree enjoy the highest average annual earnings of $82,750, while those with high school diploma education earn the least with $42,585. Women with an educational attainment of bachelor's degree earn the most with the average annual earnings of $47,440, while those with high school diploma education have the smallest earnings of $32,599.
| Educational Attainment | Male Income | Female Income |
| Less than High School | $42,917 | $0 |
| High School Diploma | $42,585 | $32,599 |
| College or Associate's Degree | $46,042 | $35,469 |
| Bachelor's Degree | $82,750 | $47,440 |
| Graduate Degree | - | - |
| Total | $44,519 | $35,455 |
Family Income in Surgoinsville
Family Income Brackets in Surgoinsville
According to the Surgoinsville family income data, there are 138 families falling into the $25,000 to $34,999 income range, which is the most common income bracket and makes up 21.4% of all families. Conversely, the $10,000 to $14,999 income bracket is the least frequent group with only 7 families (1.1%) belonging to this category.
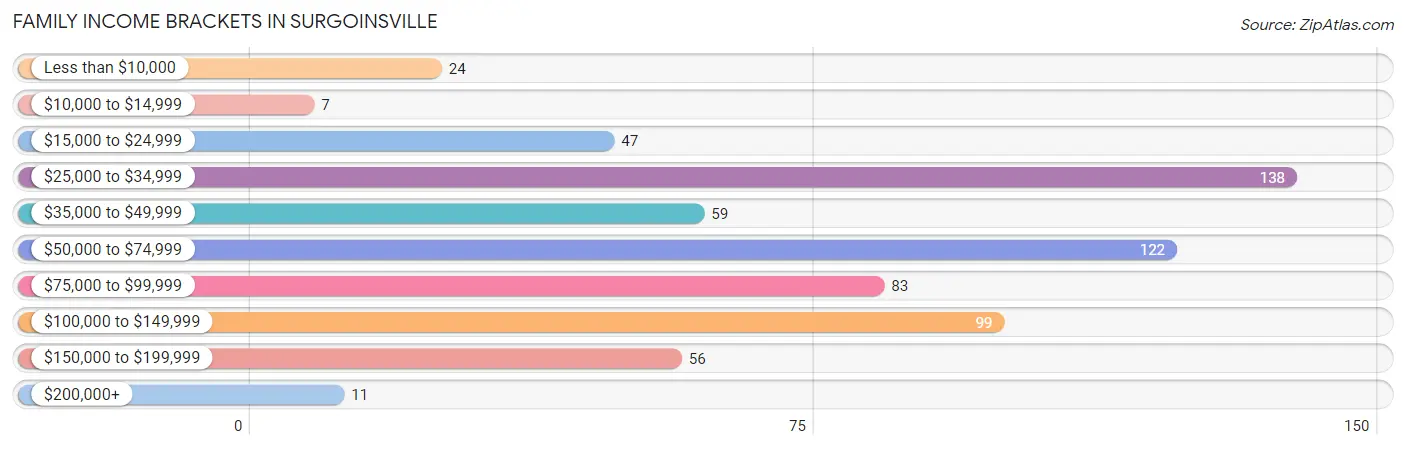
| Income Bracket | # Families | % Families |
| Less than $10,000 | 24 | 3.7% |
| $10,000 to $14,999 | 7 | 1.1% |
| $15,000 to $24,999 | 47 | 7.3% |
| $25,000 to $34,999 | 138 | 21.4% |
| $35,000 to $49,999 | 59 | 9.1% |
| $50,000 to $74,999 | 122 | 18.9% |
| $75,000 to $99,999 | 83 | 12.8% |
| $100,000 to $149,999 | 99 | 15.3% |
| $150,000 to $199,999 | 56 | 8.7% |
| $200,000+ | 11 | 1.7% |
Family Income by Famaliy Size in Surgoinsville
4-person families (84 | 13.0%) account for the highest median family income in Surgoinsville with $90,833 per family, while 2-person families (316 | 48.9%) have the highest median income of $23,296 per family member.
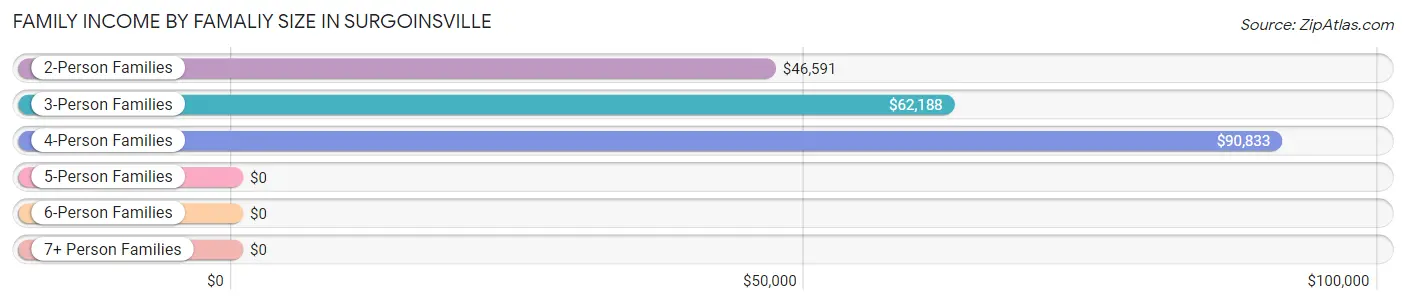
| Income Bracket | # Families | Median Income |
| 2-Person Families | 316 (48.9%) | $46,591 |
| 3-Person Families | 162 (25.1%) | $62,188 |
| 4-Person Families | 84 (13.0%) | $90,833 |
| 5-Person Families | 59 (9.1%) | $0 |
| 6-Person Families | 16 (2.5%) | $0 |
| 7+ Person Families | 9 (1.4%) | $0 |
| Total | 646 (100.0%) | $57,181 |
Family Income by Number of Earners in Surgoinsville
The median family income in Surgoinsville is $57,181, with families comprising 3+ earners (49) having the highest median family income of $166,528, while families with no earners (203) have the lowest median family income of $30,707, accounting for 7.6% and 31.4% of families, respectively.
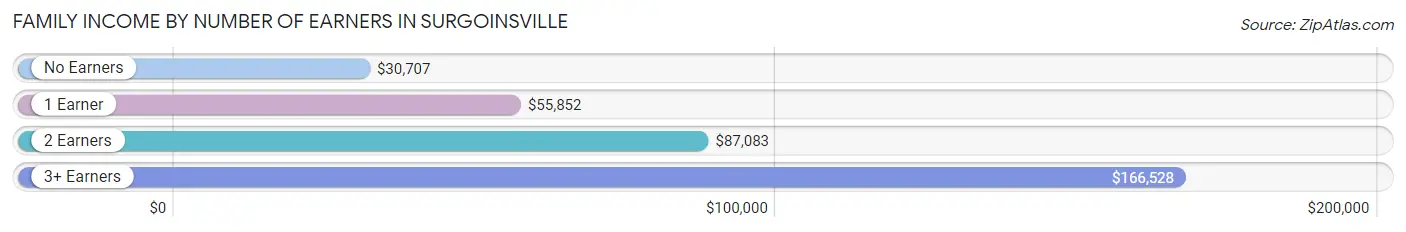
| Number of Earners | # Families | Median Income |
| No Earners | 203 (31.4%) | $30,707 |
| 1 Earner | 198 (30.6%) | $55,852 |
| 2 Earners | 196 (30.3%) | $87,083 |
| 3+ Earners | 49 (7.6%) | $166,528 |
| Total | 646 (100.0%) | $57,181 |
Household Income in Surgoinsville
Household Income Brackets in Surgoinsville
With 187 households falling in the category, the $25,000 to $34,999 income range is the most frequent in Surgoinsville, accounting for 21.4% of all households. In contrast, only 11 households (1.3%) fall into the $200,000+ income bracket, making it the least populous group.
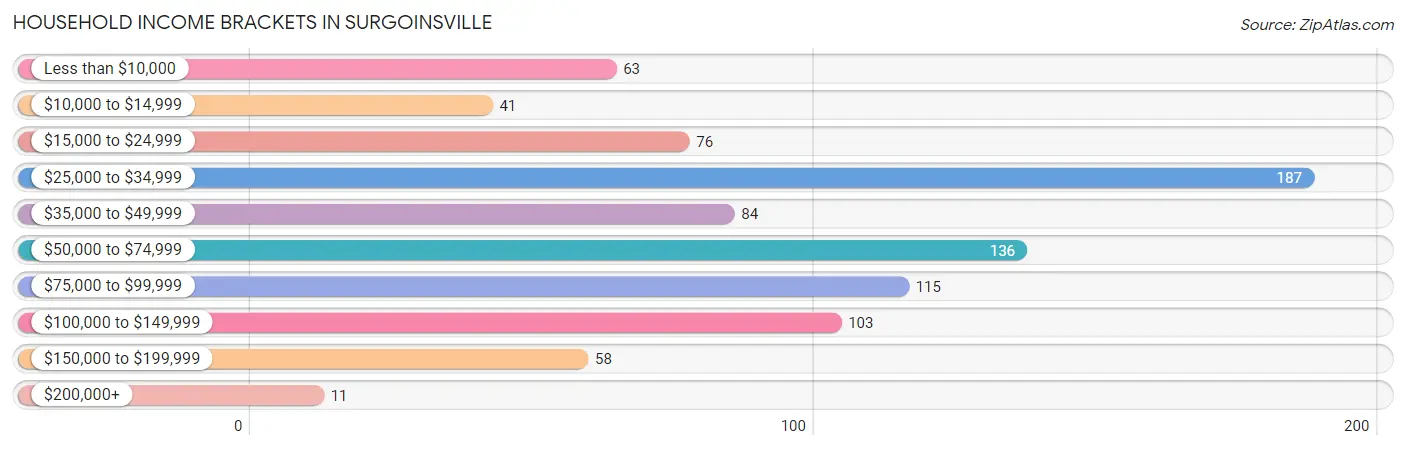
| Income Bracket | # Households | % Households |
| Less than $10,000 | 63 | 7.2% |
| $10,000 to $14,999 | 41 | 4.7% |
| $15,000 to $24,999 | 76 | 8.7% |
| $25,000 to $34,999 | 187 | 21.4% |
| $35,000 to $49,999 | 84 | 9.6% |
| $50,000 to $74,999 | 136 | 15.6% |
| $75,000 to $99,999 | 115 | 13.2% |
| $100,000 to $149,999 | 103 | 11.8% |
| $150,000 to $199,999 | 58 | 6.6% |
| $200,000+ | 11 | 1.3% |
Household Income by Householder Age in Surgoinsville
The median household income in Surgoinsville is $46,250, with the highest median household income of $61,042 found in the 45 to 64 years age bracket for the primary householder. A total of 319 households (36.5%) fall into this category. Meanwhile, the 15 to 24 years age bracket for the primary householder has the lowest median household income of $0, with 25 households (2.9%) in this group.
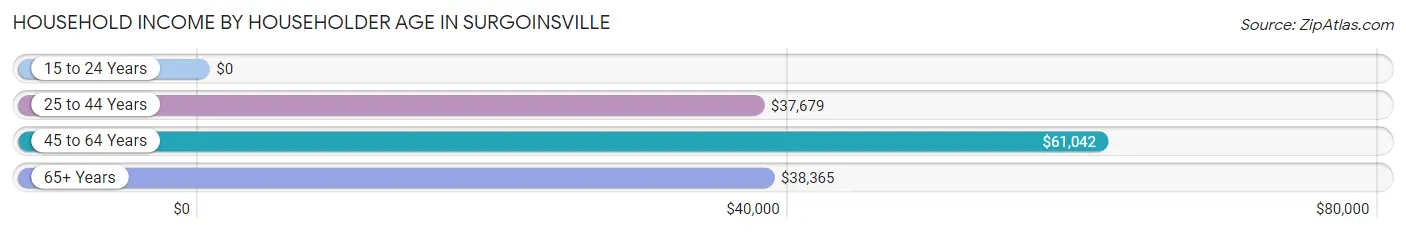
| Income Bracket | # Households | Median Income |
| 15 to 24 Years | 25 (2.9%) | $0 |
| 25 to 44 Years | 247 (28.3%) | $37,679 |
| 45 to 64 Years | 319 (36.5%) | $61,042 |
| 65+ Years | 283 (32.4%) | $38,365 |
| Total | 874 (100.0%) | $46,250 |
Poverty in Surgoinsville
Income Below Poverty by Sex and Age in Surgoinsville
With 19.0% poverty level for males and 34.3% for females among the residents of Surgoinsville, under 5 year old males and 6 to 11 year old females are the most vulnerable to poverty, with 23 males (53.5%) and 116 females (78.4%) in their respective age groups living below the poverty level.
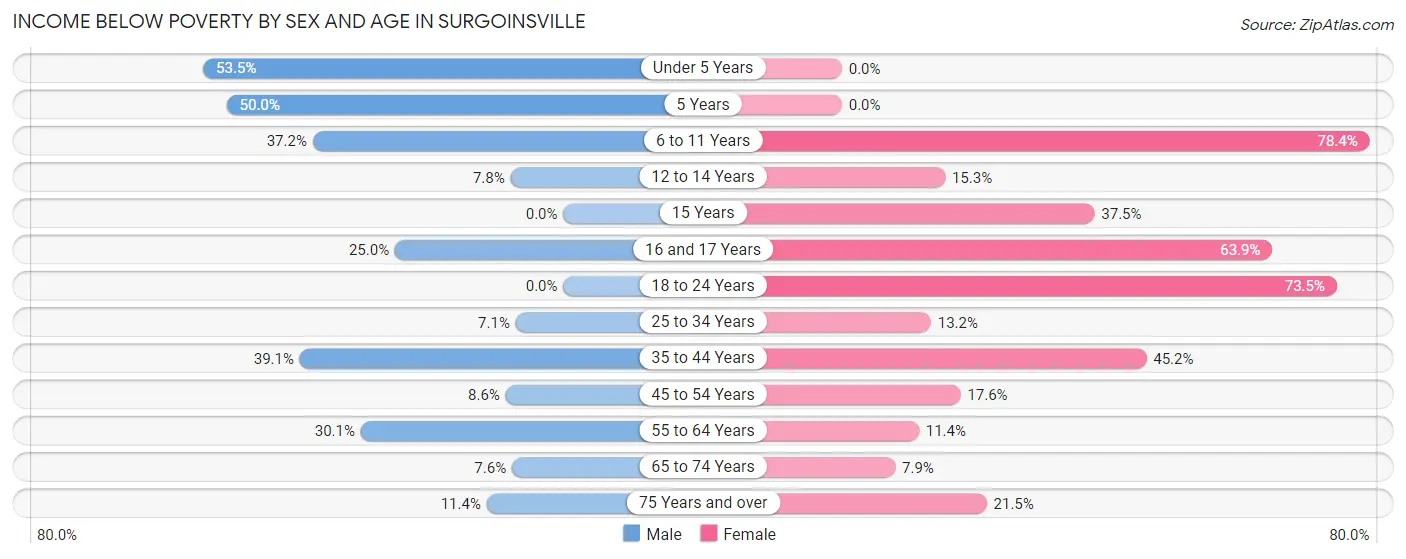
| Age Bracket | Male | Female |
| Under 5 Years | 23 (53.5%) | 0 (0.0%) |
| 5 Years | 19 (50.0%) | 0 (0.0%) |
| 6 to 11 Years | 32 (37.2%) | 116 (78.4%) |
| 12 to 14 Years | 4 (7.8%) | 17 (15.3%) |
| 15 Years | 0 (0.0%) | 9 (37.5%) |
| 16 and 17 Years | 3 (25.0%) | 39 (63.9%) |
| 18 to 24 Years | 0 (0.0%) | 86 (73.5%) |
| 25 to 34 Years | 7 (7.1%) | 16 (13.2%) |
| 35 to 44 Years | 36 (39.1%) | 66 (45.2%) |
| 45 to 54 Years | 15 (8.6%) | 37 (17.6%) |
| 55 to 64 Years | 40 (30.1%) | 12 (11.4%) |
| 65 to 74 Years | 9 (7.6%) | 8 (7.9%) |
| 75 Years and over | 14 (11.4%) | 23 (21.5%) |
| Total | 202 (19.0%) | 429 (34.3%) |
Income Above Poverty by Sex and Age in Surgoinsville
According to the poverty statistics in Surgoinsville, males aged 15 years and females aged 65 to 74 years are the age groups that are most secure financially, with 100.0% of males and 92.1% of females in these age groups living above the poverty line.
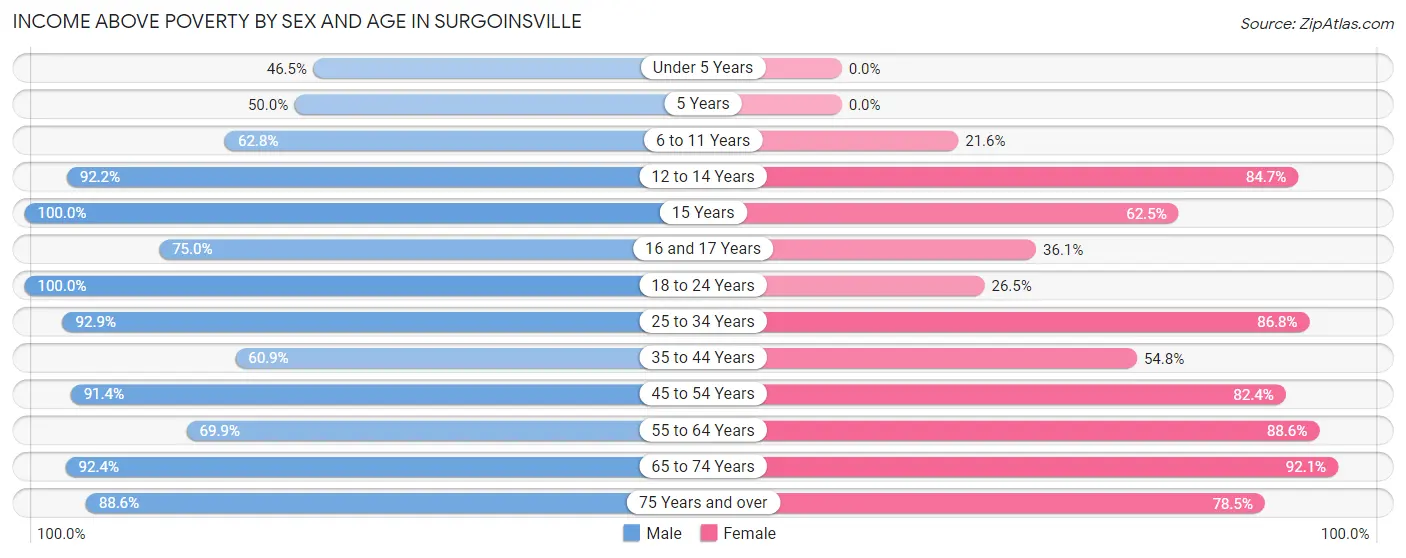
| Age Bracket | Male | Female |
| Under 5 Years | 20 (46.5%) | 0 (0.0%) |
| 5 Years | 19 (50.0%) | 0 (0.0%) |
| 6 to 11 Years | 54 (62.8%) | 32 (21.6%) |
| 12 to 14 Years | 47 (92.2%) | 94 (84.7%) |
| 15 Years | 13 (100.0%) | 15 (62.5%) |
| 16 and 17 Years | 9 (75.0%) | 22 (36.1%) |
| 18 to 24 Years | 82 (100.0%) | 31 (26.5%) |
| 25 to 34 Years | 92 (92.9%) | 105 (86.8%) |
| 35 to 44 Years | 56 (60.9%) | 80 (54.8%) |
| 45 to 54 Years | 160 (91.4%) | 173 (82.4%) |
| 55 to 64 Years | 93 (69.9%) | 93 (88.6%) |
| 65 to 74 Years | 109 (92.4%) | 93 (92.1%) |
| 75 Years and over | 109 (88.6%) | 84 (78.5%) |
| Total | 863 (81.0%) | 822 (65.7%) |
Income Below Poverty Among Married-Couple Families in Surgoinsville
The poverty statistics for married-couple families in Surgoinsville show that 9.1% or 41 of the total 452 families live below the poverty line. Families with 1 or 2 children have the highest poverty rate of 16.4%, comprising of 30 families. On the other hand, families with 3 or 4 children have the lowest poverty rate of 0.0%, which includes 0 families.
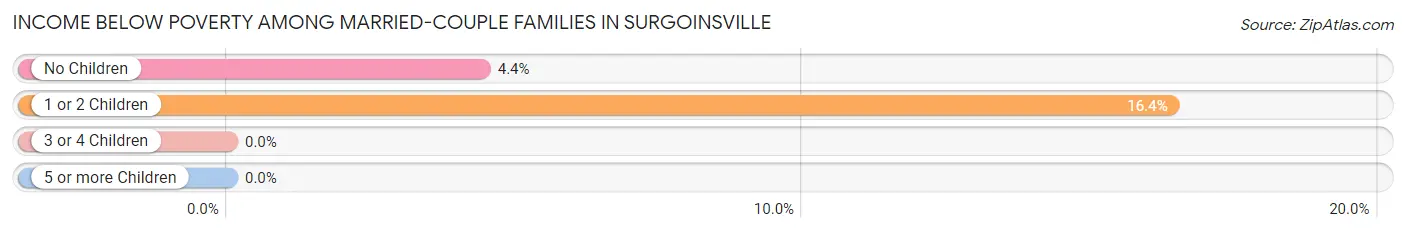
| Children | Above Poverty | Below Poverty |
| No Children | 239 (95.6%) | 11 (4.4%) |
| 1 or 2 Children | 153 (83.6%) | 30 (16.4%) |
| 3 or 4 Children | 10 (100.0%) | 0 (0.0%) |
| 5 or more Children | 9 (100.0%) | 0 (0.0%) |
| Total | 411 (90.9%) | 41 (9.1%) |
Income Below Poverty Among Single-Parent Households in Surgoinsville
According to the poverty data in Surgoinsville, 16.4% or 12 single-father households and 62.8% or 76 single-mother households are living below the poverty line. Among single-father households, those with 1 or 2 children have the highest poverty rate, with 9 households (19.6%) experiencing poverty. Likewise, among single-mother households, those with 3 or 4 children have the highest poverty rate, with 39 households (100.0%) falling below the poverty line.
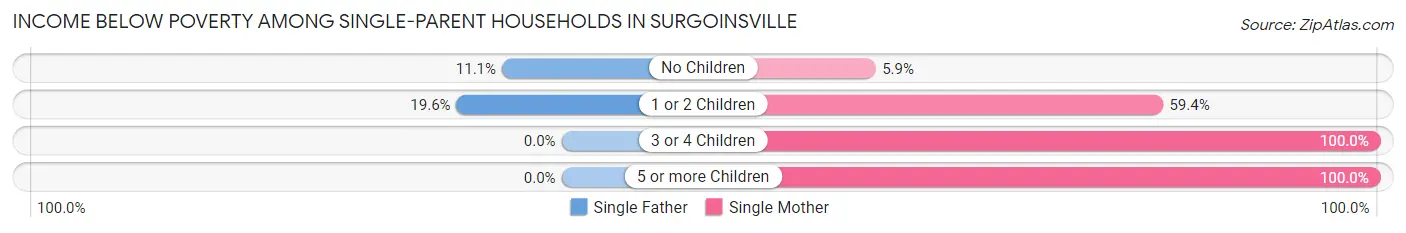
| Children | Single Father | Single Mother |
| No Children | 3 (11.1%) | 2 (5.9%) |
| 1 or 2 Children | 9 (19.6%) | 19 (59.4%) |
| 3 or 4 Children | 0 (0.0%) | 39 (100.0%) |
| 5 or more Children | 0 (0.0%) | 16 (100.0%) |
| Total | 12 (16.4%) | 76 (62.8%) |
Income Below Poverty Among Married-Couple vs Single-Parent Households in Surgoinsville
The poverty data for Surgoinsville shows that 41 of the married-couple family households (9.1%) and 88 of the single-parent households (45.4%) are living below the poverty level. Within the married-couple family households, those with 1 or 2 children have the highest poverty rate, with 30 households (16.4%) falling below the poverty line. Among the single-parent households, those with 3 or 4 children have the highest poverty rate, with 39 household (100.0%) living below poverty.
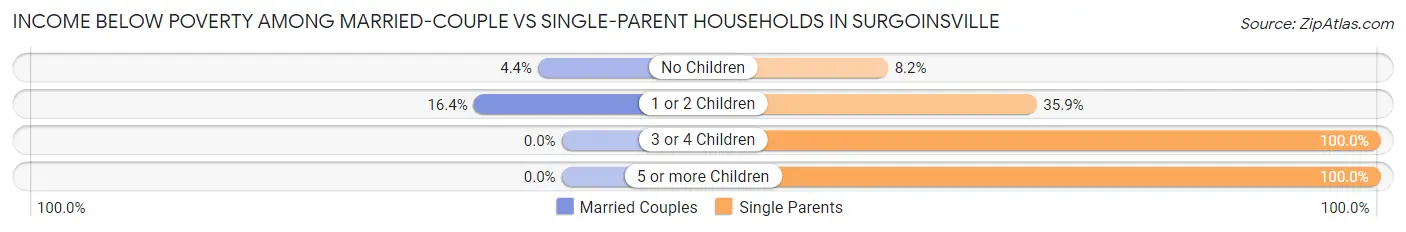
| Children | Married-Couple Families | Single-Parent Households |
| No Children | 11 (4.4%) | 5 (8.2%) |
| 1 or 2 Children | 30 (16.4%) | 28 (35.9%) |
| 3 or 4 Children | 0 (0.0%) | 39 (100.0%) |
| 5 or more Children | 0 (0.0%) | 16 (100.0%) |
| Total | 41 (9.1%) | 88 (45.4%) |
Race in Surgoinsville
The most populous races in Surgoinsville are White / Caucasian (2,131 | 92.0%), Two or more Races (113 | 4.9%), and Hispanic or Latino (79 | 3.4%).
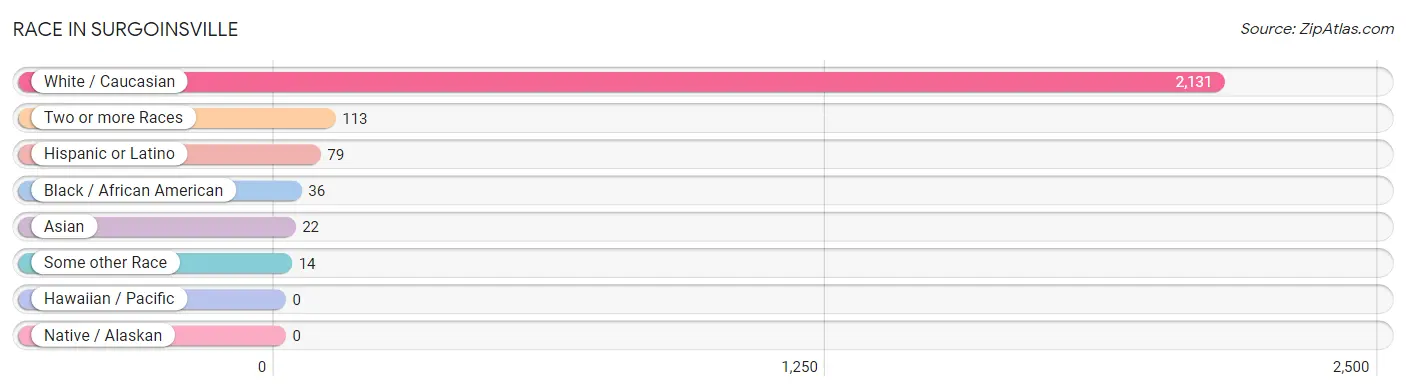
| Race | # Population | % Population |
| Asian | 22 | 0.9% |
| Black / African American | 36 | 1.5% |
| Hawaiian / Pacific | 0 | 0.0% |
| Hispanic or Latino | 79 | 3.4% |
| Native / Alaskan | 0 | 0.0% |
| White / Caucasian | 2,131 | 92.0% |
| Two or more Races | 113 | 4.9% |
| Some other Race | 14 | 0.6% |
| Total | 2,316 | 100.0% |
Ancestry in Surgoinsville
The most populous ancestries reported in Surgoinsville are English (485 | 20.9%), American (201 | 8.7%), Irish (187 | 8.1%), German (153 | 6.6%), and Italian (98 | 4.2%), together accounting for 48.5% of all Surgoinsville residents.
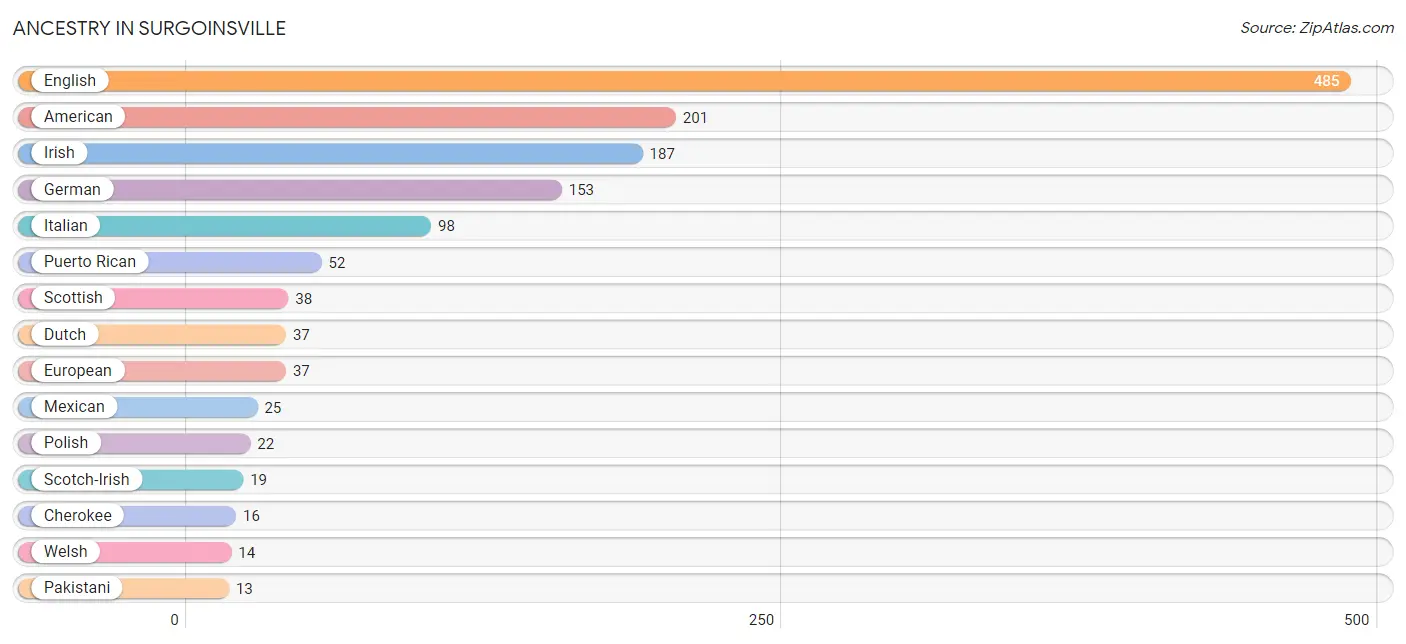
| Ancestry | # Population | % Population |
| African | 8 | 0.4% |
| American | 201 | 8.7% |
| Armenian | 3 | 0.1% |
| Bhutanese | 4 | 0.2% |
| Burmese | 5 | 0.2% |
| Canadian | 3 | 0.1% |
| Cherokee | 16 | 0.7% |
| Dutch | 37 | 1.6% |
| English | 485 | 20.9% |
| European | 37 | 1.6% |
| French | 12 | 0.5% |
| French Canadian | 3 | 0.1% |
| German | 153 | 6.6% |
| Guyanese | 9 | 0.4% |
| Irish | 187 | 8.1% |
| Italian | 98 | 4.2% |
| Korean | 4 | 0.2% |
| Mexican | 25 | 1.1% |
| Northern European | 2 | 0.1% |
| Pakistani | 13 | 0.6% |
| Polish | 22 | 0.9% |
| Puerto Rican | 52 | 2.2% |
| Scandinavian | 3 | 0.1% |
| Scotch-Irish | 19 | 0.8% |
| Scottish | 38 | 1.6% |
| Subsaharan African | 8 | 0.4% |
| Swedish | 3 | 0.1% |
| Welsh | 14 | 0.6% | View All 28 Rows |
Immigrants in Surgoinsville
The most numerous immigrant groups reported in Surgoinsville came from Asia (22 | 0.9%), South Eastern Asia (13 | 0.6%), Thailand (13 | 0.6%), Eastern Asia (9 | 0.4%), and Korea (5 | 0.2%), together accounting for 2.7% of all Surgoinsville residents.
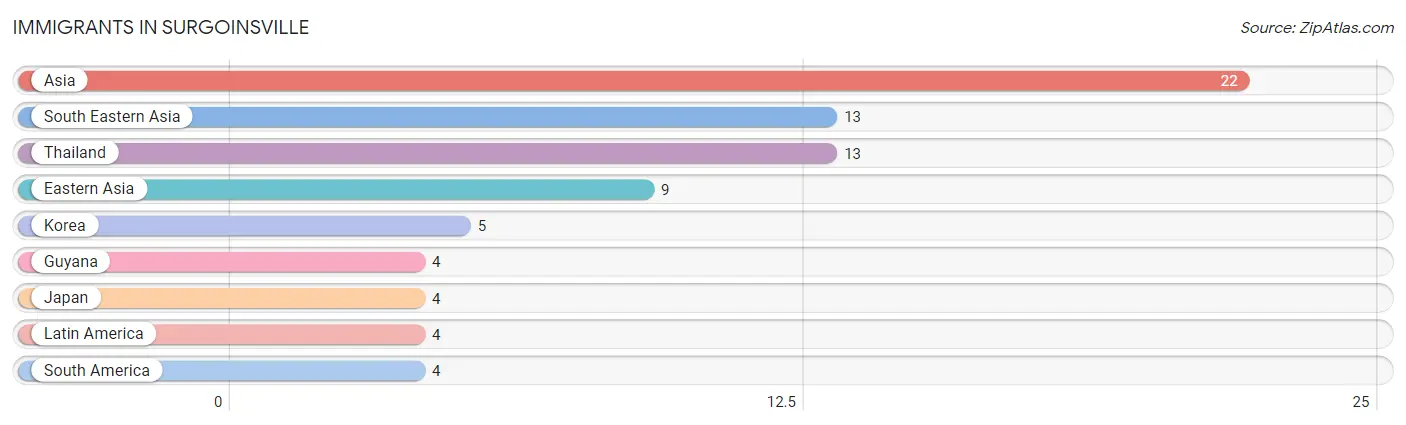
| Immigration Origin | # Population | % Population |
| Asia | 22 | 0.9% |
| Eastern Asia | 9 | 0.4% |
| Guyana | 4 | 0.2% |
| Japan | 4 | 0.2% |
| Korea | 5 | 0.2% |
| Latin America | 4 | 0.2% |
| South America | 4 | 0.2% |
| South Eastern Asia | 13 | 0.6% |
| Thailand | 13 | 0.6% | View All 9 Rows |
Sex and Age in Surgoinsville
Sex and Age in Surgoinsville
The most populous age groups in Surgoinsville are 50 to 54 Years (102 | 9.6%) for men and 50 to 54 Years (136 | 10.9%) for women.
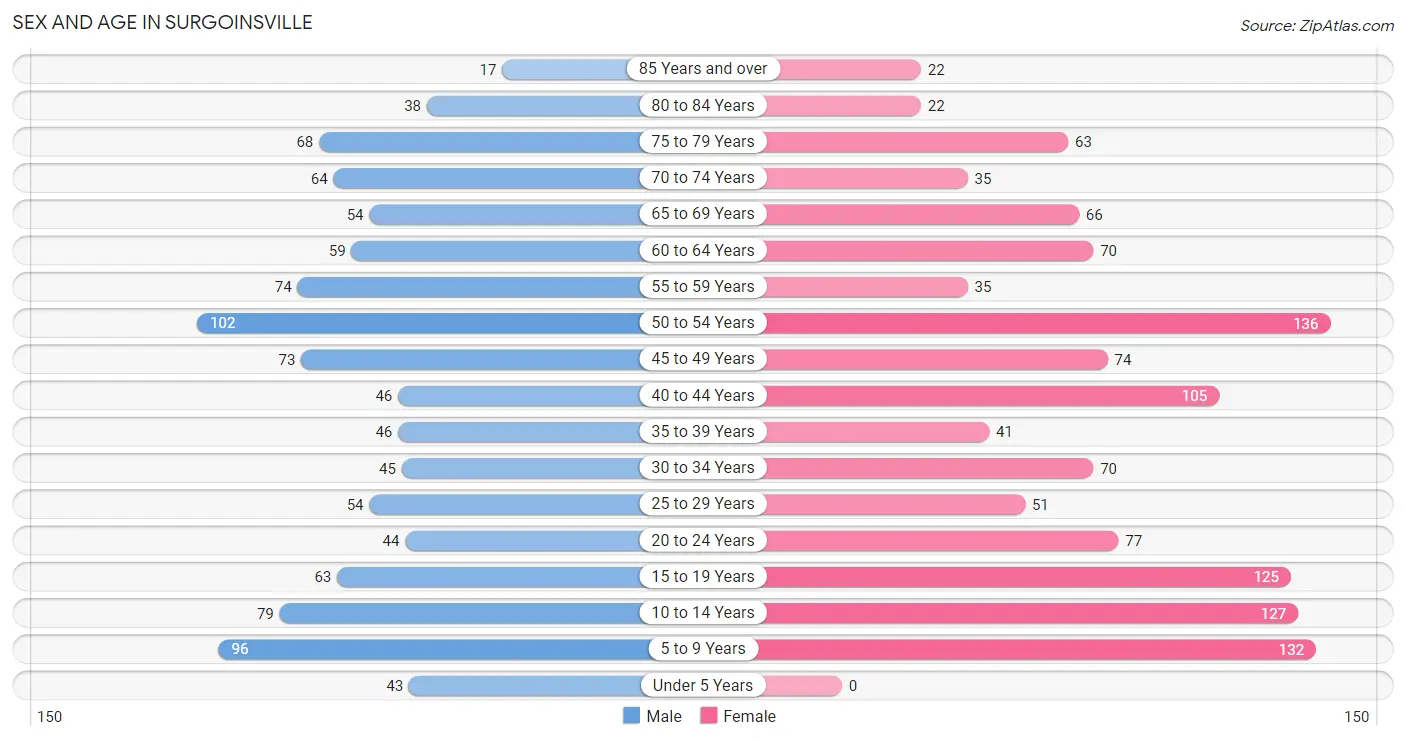
| Age Bracket | Male | Female |
| Under 5 Years | 43 (4.0%) | 0 (0.0%) |
| 5 to 9 Years | 96 (9.0%) | 132 (10.5%) |
| 10 to 14 Years | 79 (7.4%) | 127 (10.2%) |
| 15 to 19 Years | 63 (5.9%) | 125 (10.0%) |
| 20 to 24 Years | 44 (4.1%) | 77 (6.2%) |
| 25 to 29 Years | 54 (5.1%) | 51 (4.1%) |
| 30 to 34 Years | 45 (4.2%) | 70 (5.6%) |
| 35 to 39 Years | 46 (4.3%) | 41 (3.3%) |
| 40 to 44 Years | 46 (4.3%) | 105 (8.4%) |
| 45 to 49 Years | 73 (6.9%) | 74 (5.9%) |
| 50 to 54 Years | 102 (9.6%) | 136 (10.9%) |
| 55 to 59 Years | 74 (7.0%) | 35 (2.8%) |
| 60 to 64 Years | 59 (5.5%) | 70 (5.6%) |
| 65 to 69 Years | 54 (5.1%) | 66 (5.3%) |
| 70 to 74 Years | 64 (6.0%) | 35 (2.8%) |
| 75 to 79 Years | 68 (6.4%) | 63 (5.0%) |
| 80 to 84 Years | 38 (3.6%) | 22 (1.8%) |
| 85 Years and over | 17 (1.6%) | 22 (1.8%) |
| Total | 1,065 (100.0%) | 1,251 (100.0%) |
Families and Households in Surgoinsville
Median Family Size in Surgoinsville
The median family size in Surgoinsville is 3.16 persons per family, with single female/mother families (121 | 18.7%) accounting for the largest median family size of 3.76 persons per family. On the other hand, single male/father families (73 | 11.3%) represent the smallest median family size with 2.68 persons per family.
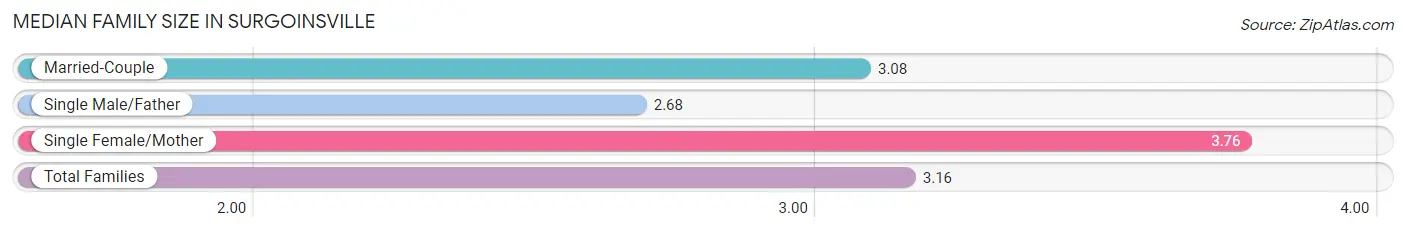
| Family Type | # Families | Family Size |
| Married-Couple | 452 (70.0%) | 3.08 |
| Single Male/Father | 73 (11.3%) | 2.68 |
| Single Female/Mother | 121 (18.7%) | 3.76 |
| Total Families | 646 (100.0%) | 3.16 |
Median Household Size in Surgoinsville
The median household size in Surgoinsville is 2.65 persons per household, with single female/mother households (121 | 13.8%) accounting for the largest median household size of 3.76 persons per household. non-family households (228 | 26.1%) represent the smallest median household size with 1.18 persons per household.
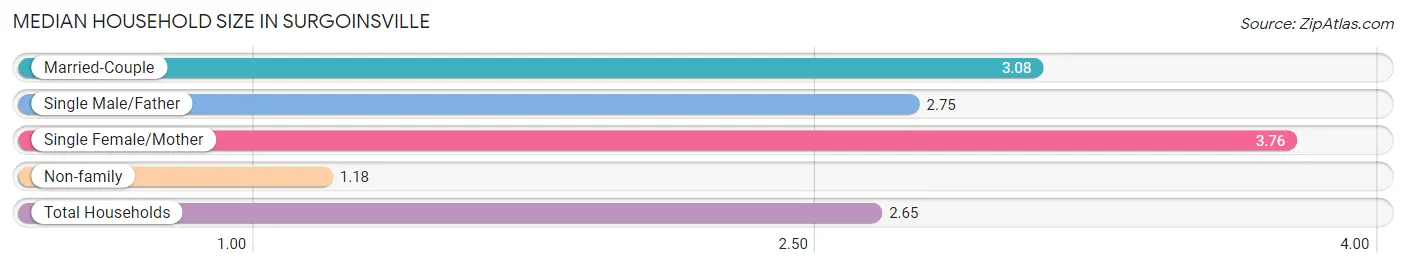
| Household Type | # Households | Household Size |
| Married-Couple | 452 (51.7%) | 3.08 |
| Single Male/Father | 73 (8.4%) | 2.75 |
| Single Female/Mother | 121 (13.8%) | 3.76 |
| Non-family | 228 (26.1%) | 1.18 |
| Total Households | 874 (100.0%) | 2.65 |
Household Size by Marriage Status in Surgoinsville
Out of a total of 874 households in Surgoinsville, 646 (73.9%) are family households, while 228 (26.1%) are nonfamily households. The most numerous type of family households are 2-person households, comprising 311, and the most common type of nonfamily households are 1-person households, comprising 199.
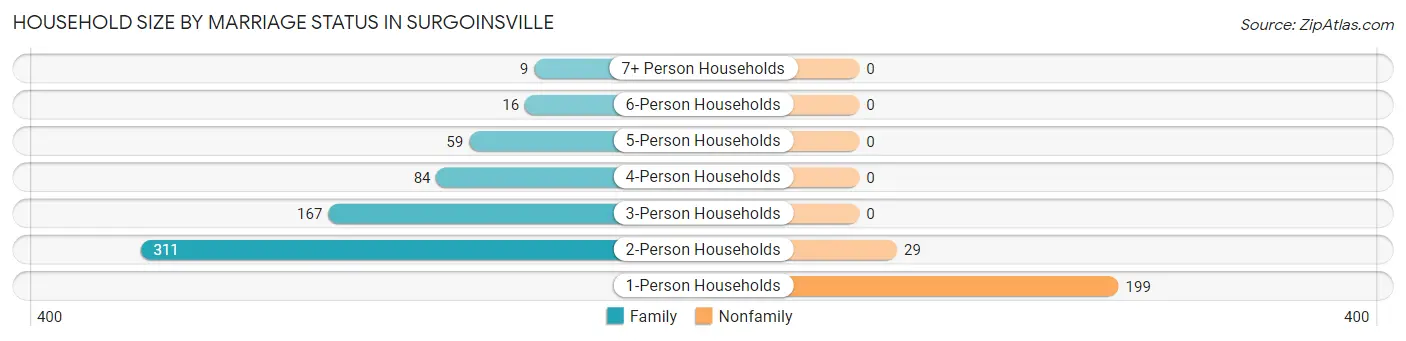
| Household Size | Family Households | Nonfamily Households |
| 1-Person Households | - | 199 (22.8%) |
| 2-Person Households | 311 (35.6%) | 29 (3.3%) |
| 3-Person Households | 167 (19.1%) | 0 (0.0%) |
| 4-Person Households | 84 (9.6%) | 0 (0.0%) |
| 5-Person Households | 59 (6.8%) | 0 (0.0%) |
| 6-Person Households | 16 (1.8%) | 0 (0.0%) |
| 7+ Person Households | 9 (1.0%) | 0 (0.0%) |
| Total | 646 (73.9%) | 228 (26.1%) |
Female Fertility in Surgoinsville
Fertility by Age in Surgoinsville
| Age Bracket | Women with Births | Births / 1,000 Women |
| 15 to 19 years | 0 (0.0%) | 0.0 |
| 20 to 34 years | 0 (0.0%) | 0.0 |
| 35 to 50 years | 0 (0.0%) | 0.0 |
| Total | 0 (0.0%) | 0.0 |
Fertility by Age by Marriage Status in Surgoinsville
| Age Bracket | Married | Unmarried |
| 15 to 19 years | 0 (0.0%) | 0 (0.0%) |
| 20 to 34 years | 0 (0.0%) | 0 (0.0%) |
| 35 to 50 years | 0 (0.0%) | 0 (0.0%) |
| Total | 0 (0.0%) | 0 (0.0%) |
Fertility by Education in Surgoinsville
| Educational Attainment | Women with Births | Births / 1,000 Women |
| Less than High School | 0 (0.0%) | 0.0 |
| High School Diploma | 0 (0.0%) | 0.0 |
| College or Associate's Degree | 0 (0.0%) | 0.0 |
| Bachelor's Degree | 0 (0.0%) | 0.0 |
| Graduate Degree | 0 (0.0%) | 0.0 |
| Total | 0 (0.0%) | 0.0 |
Fertility by Education by Marriage Status in Surgoinsville
| Educational Attainment | Married | Unmarried |
| Less than High School | 0 (0.0%) | 0 (0.0%) |
| High School Diploma | 0 (0.0%) | 0 (0.0%) |
| College or Associate's Degree | 0 (0.0%) | 0 (0.0%) |
| Bachelor's Degree | 0 (0.0%) | 0 (0.0%) |
| Graduate Degree | 0 (0.0%) | 0 (0.0%) |
| Total | 0 (0.0%) | 0 (0.0%) |
Employment Characteristics in Surgoinsville
Employment by Class of Employer in Surgoinsville
Among the 857 employed individuals in Surgoinsville, private company employees (593 | 69.2%), not-for-profit organizations (79 | 9.2%), and local government employees (61 | 7.1%) make up the most common classes of employment.
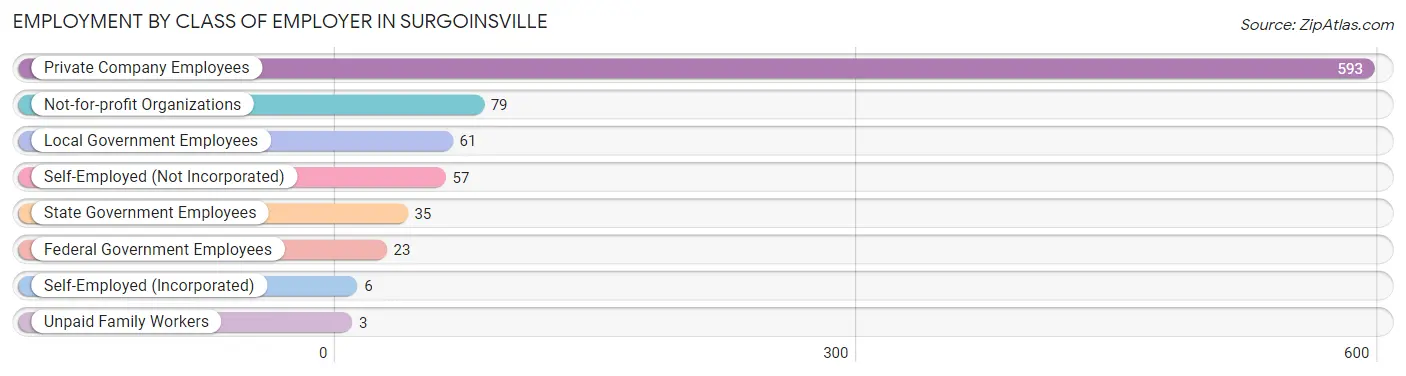
| Employer Class | # Employees | % Employees |
| Private Company Employees | 593 | 69.2% |
| Self-Employed (Incorporated) | 6 | 0.7% |
| Self-Employed (Not Incorporated) | 57 | 6.7% |
| Not-for-profit Organizations | 79 | 9.2% |
| Local Government Employees | 61 | 7.1% |
| State Government Employees | 35 | 4.1% |
| Federal Government Employees | 23 | 2.7% |
| Unpaid Family Workers | 3 | 0.4% |
| Total | 857 | 100.0% |
Employment Status by Age in Surgoinsville
According to the labor force statistics for Surgoinsville, out of the total population over 16 years of age (1,802), 51.2% or 923 individuals are in the labor force, with 3.7% or 34 of them unemployed. The age group with the highest labor force participation rate is 25 to 29 years, with 94.3% or 99 individuals in the labor force. Within the labor force, the 35 to 44 years age range has the highest percentage of unemployed individuals, with 11.9% or 21 of them being unemployed.
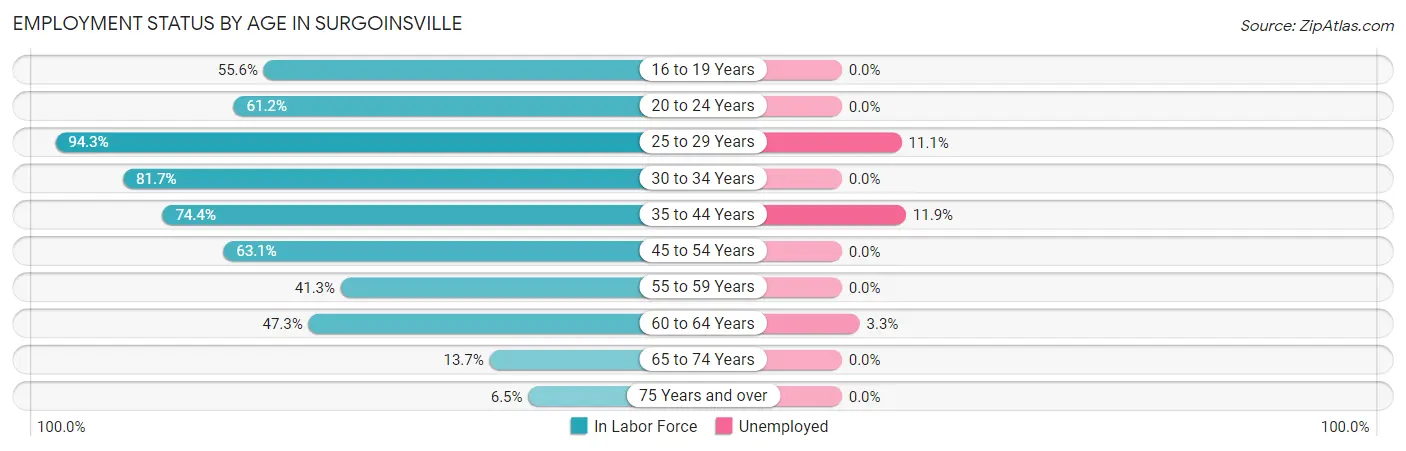
| Age Bracket | In Labor Force | Unemployed |
| 16 to 19 Years | 84 (55.6%) | 0 (0.0%) |
| 20 to 24 Years | 74 (61.2%) | 0 (0.0%) |
| 25 to 29 Years | 99 (94.3%) | 11 (11.1%) |
| 30 to 34 Years | 94 (81.7%) | 0 (0.0%) |
| 35 to 44 Years | 177 (74.4%) | 21 (11.9%) |
| 45 to 54 Years | 243 (63.1%) | 0 (0.0%) |
| 55 to 59 Years | 45 (41.3%) | 0 (0.0%) |
| 60 to 64 Years | 61 (47.3%) | 2 (3.3%) |
| 65 to 74 Years | 30 (13.7%) | 0 (0.0%) |
| 75 Years and over | 15 (6.5%) | 0 (0.0%) |
| Total | 923 (51.2%) | 34 (3.7%) |
Employment Status by Educational Attainment in Surgoinsville
According to labor force statistics for Surgoinsville, 66.5% of individuals (719) out of the total population between 25 and 64 years of age (1,081) are in the labor force, with 4.7% or 34 of them being unemployed. The group with the highest labor force participation rate are those with the educational attainment of bachelor's degree or higher, with 82.4% or 168 individuals in the labor force. Within the labor force, individuals with high school diploma education have the highest percentage of unemployment, with 9.5% or 26 of them being unemployed.
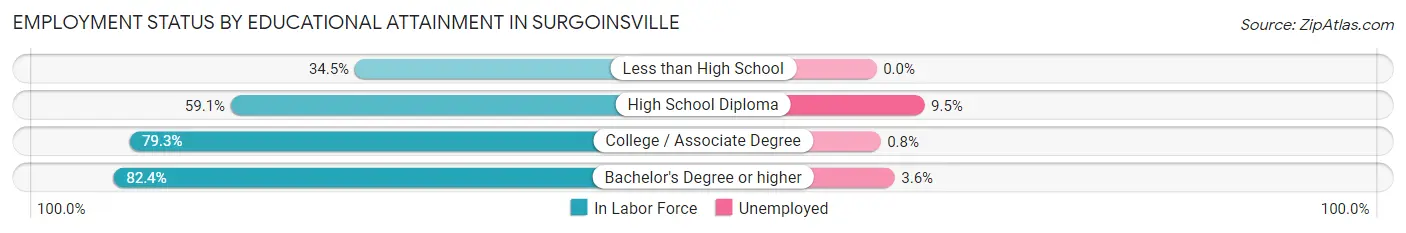
| Educational Attainment | In Labor Force | Unemployed |
| Less than High School | 39 (34.5%) | 0 (0.0%) |
| High School Diploma | 274 (59.1%) | 44 (9.5%) |
| College / Associate Degree | 238 (79.3%) | 2 (0.8%) |
| Bachelor's Degree or higher | 168 (82.4%) | 7 (3.6%) |
| Total | 719 (66.5%) | 51 (4.7%) |
Employment Occupations by Sex in Surgoinsville
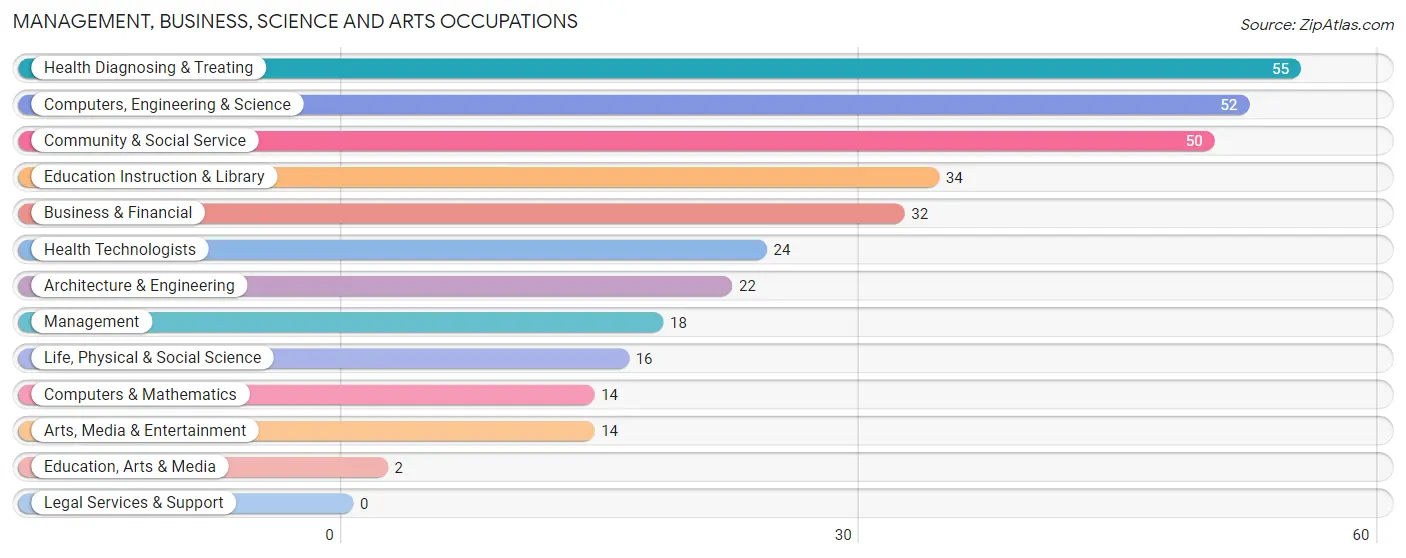
Management, Business, Science and Arts Occupations
The most common Management, Business, Science and Arts occupations in Surgoinsville are Health Diagnosing & Treating (55 | 6.2%), Computers, Engineering & Science (52 | 5.9%), Community & Social Service (50 | 5.6%), Education Instruction & Library (34 | 3.8%), and Business & Financial (32 | 3.6%).
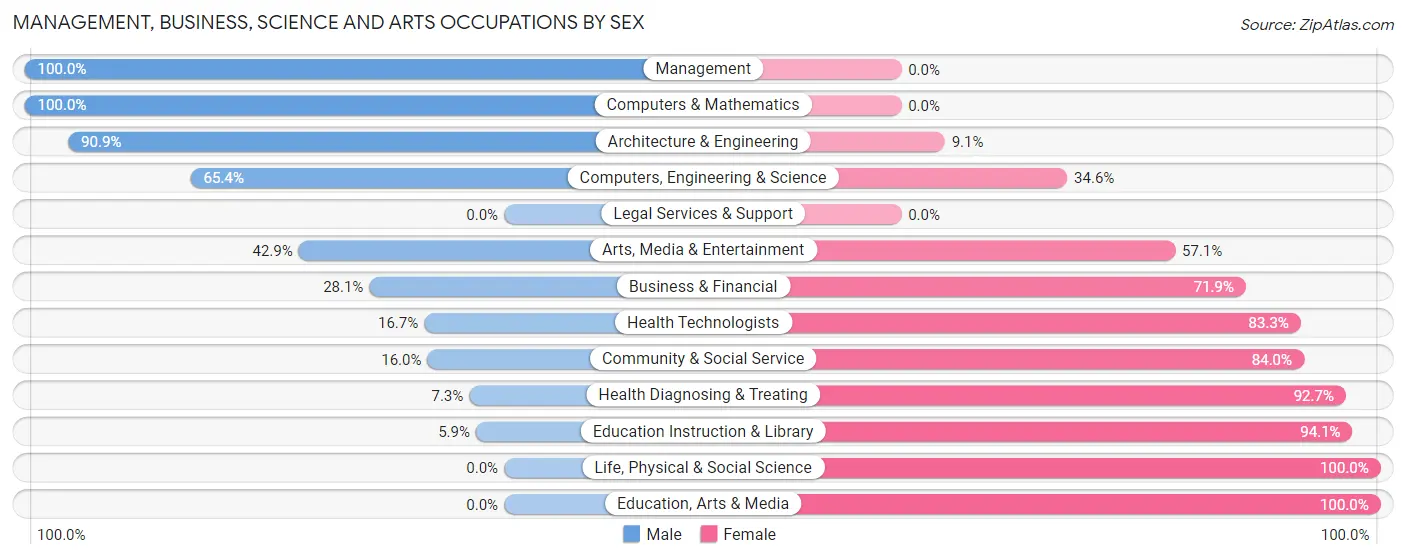
Management, Business, Science and Arts Occupations by Sex
Within the Management, Business, Science and Arts occupations in Surgoinsville, the most male-oriented occupations are Management (100.0%), Computers & Mathematics (100.0%), and Architecture & Engineering (90.9%), while the most female-oriented occupations are Life, Physical & Social Science (100.0%), Education, Arts & Media (100.0%), and Education Instruction & Library (94.1%).
| Occupation | Male | Female |
| Management | 18 (100.0%) | 0 (0.0%) |
| Business & Financial | 9 (28.1%) | 23 (71.9%) |
| Computers, Engineering & Science | 34 (65.4%) | 18 (34.6%) |
| Computers & Mathematics | 14 (100.0%) | 0 (0.0%) |
| Architecture & Engineering | 20 (90.9%) | 2 (9.1%) |
| Life, Physical & Social Science | 0 (0.0%) | 16 (100.0%) |
| Community & Social Service | 8 (16.0%) | 42 (84.0%) |
| Education, Arts & Media | 0 (0.0%) | 2 (100.0%) |
| Legal Services & Support | 0 (0.0%) | 0 (0.0%) |
| Education Instruction & Library | 2 (5.9%) | 32 (94.1%) |
| Arts, Media & Entertainment | 6 (42.9%) | 8 (57.1%) |
| Health Diagnosing & Treating | 4 (7.3%) | 51 (92.7%) |
| Health Technologists | 4 (16.7%) | 20 (83.3%) |
| Total (Category) | 73 (35.3%) | 134 (64.7%) |
| Total (Overall) | 488 (54.9%) | 400 (45.1%) |
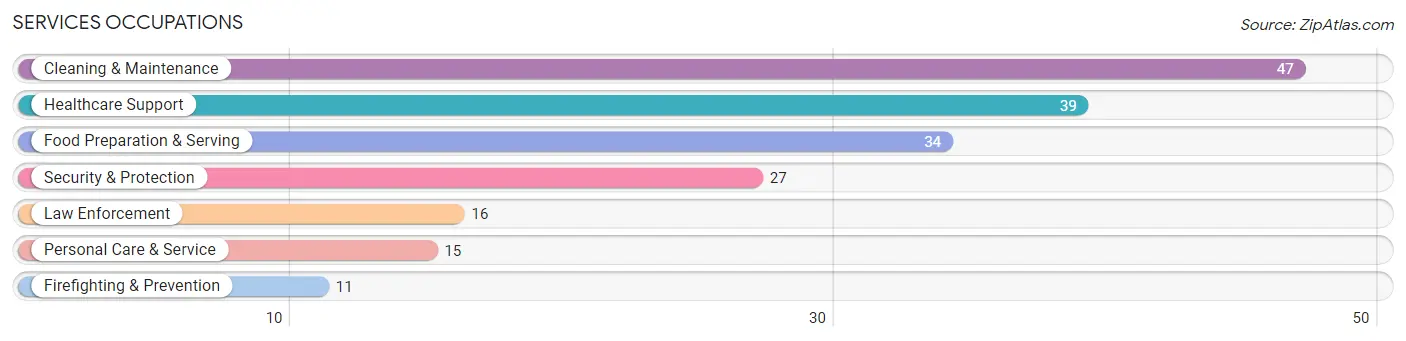
Services Occupations
The most common Services occupations in Surgoinsville are Cleaning & Maintenance (47 | 5.3%), Healthcare Support (39 | 4.4%), Food Preparation & Serving (34 | 3.8%), Security & Protection (27 | 3.0%), and Law Enforcement (16 | 1.8%).
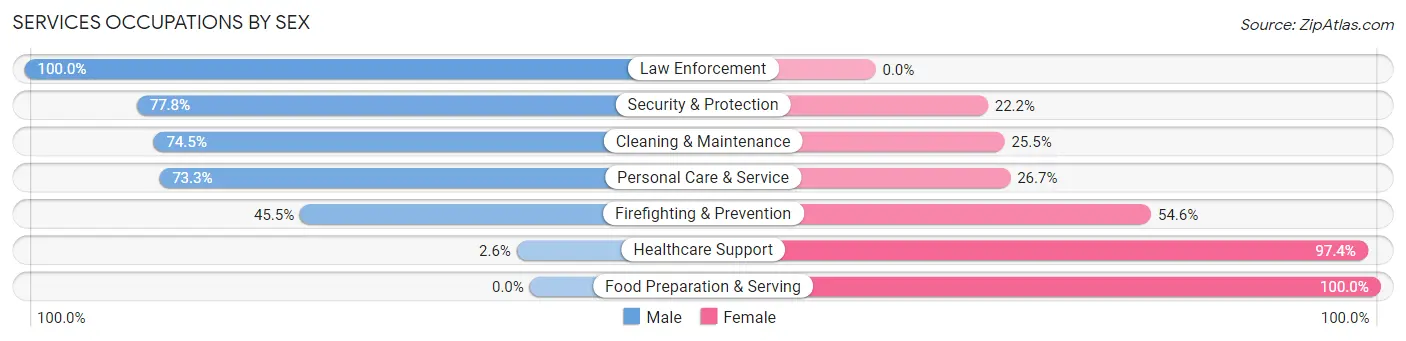
Services Occupations by Sex
Within the Services occupations in Surgoinsville, the most male-oriented occupations are Law Enforcement (100.0%), Security & Protection (77.8%), and Cleaning & Maintenance (74.5%), while the most female-oriented occupations are Food Preparation & Serving (100.0%), Healthcare Support (97.4%), and Firefighting & Prevention (54.5%).
| Occupation | Male | Female |
| Healthcare Support | 1 (2.6%) | 38 (97.4%) |
| Security & Protection | 21 (77.8%) | 6 (22.2%) |
| Firefighting & Prevention | 5 (45.5%) | 6 (54.5%) |
| Law Enforcement | 16 (100.0%) | 0 (0.0%) |
| Food Preparation & Serving | 0 (0.0%) | 34 (100.0%) |
| Cleaning & Maintenance | 35 (74.5%) | 12 (25.5%) |
| Personal Care & Service | 11 (73.3%) | 4 (26.7%) |
| Total (Category) | 68 (42.0%) | 94 (58.0%) |
| Total (Overall) | 488 (54.9%) | 400 (45.1%) |
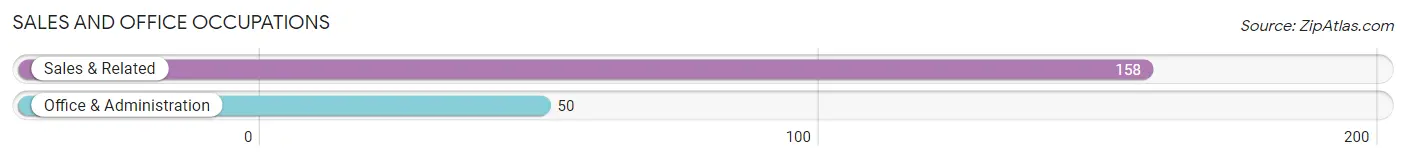
Sales and Office Occupations
The most common Sales and Office occupations in Surgoinsville are Sales & Related (158 | 17.8%), and Office & Administration (50 | 5.6%).
Sales and Office Occupations by Sex
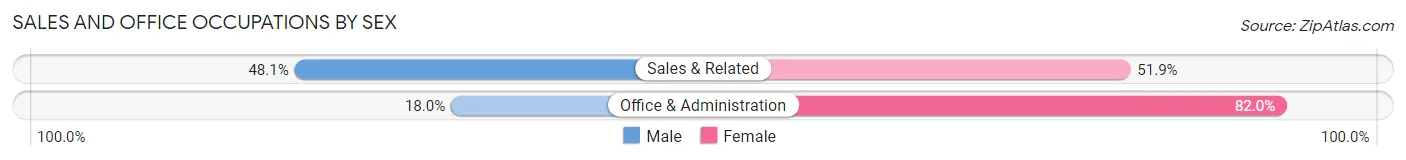
| Occupation | Male | Female |
| Sales & Related | 76 (48.1%) | 82 (51.9%) |
| Office & Administration | 9 (18.0%) | 41 (82.0%) |
| Total (Category) | 85 (40.9%) | 123 (59.1%) |
| Total (Overall) | 488 (54.9%) | 400 (45.1%) |
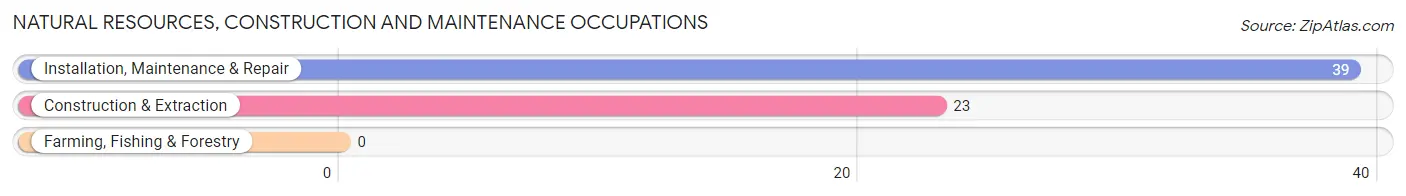
Natural Resources, Construction and Maintenance Occupations
The most common Natural Resources, Construction and Maintenance occupations in Surgoinsville are Installation, Maintenance & Repair (39 | 4.4%), and Construction & Extraction (23 | 2.6%).
Natural Resources, Construction and Maintenance Occupations by Sex
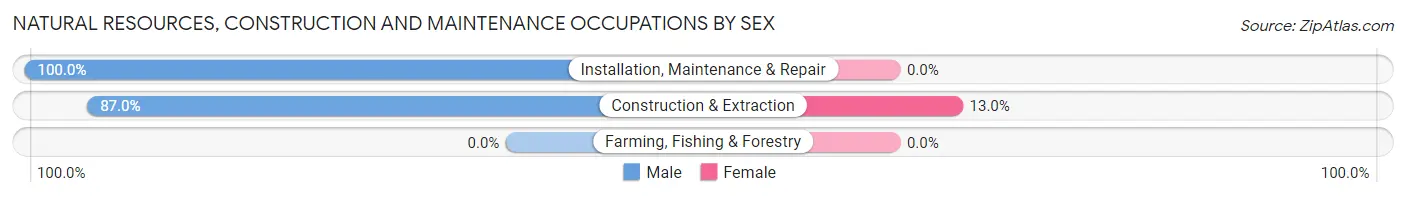
| Occupation | Male | Female |
| Farming, Fishing & Forestry | 0 (0.0%) | 0 (0.0%) |
| Construction & Extraction | 20 (87.0%) | 3 (13.0%) |
| Installation, Maintenance & Repair | 39 (100.0%) | 0 (0.0%) |
| Total (Category) | 59 (95.2%) | 3 (4.8%) |
| Total (Overall) | 488 (54.9%) | 400 (45.1%) |
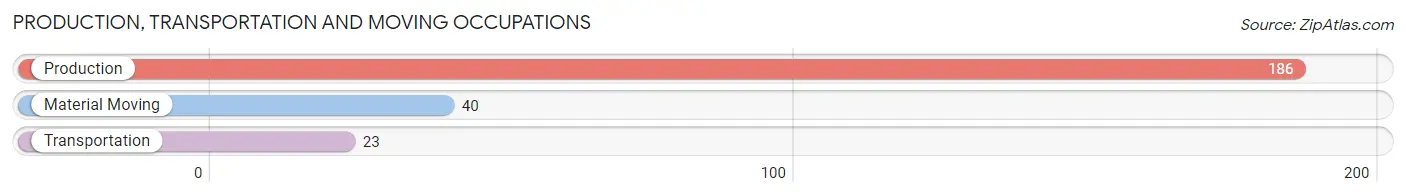
Production, Transportation and Moving Occupations
The most common Production, Transportation and Moving occupations in Surgoinsville are Production (186 | 20.9%), Material Moving (40 | 4.5%), and Transportation (23 | 2.6%).
Production, Transportation and Moving Occupations by Sex
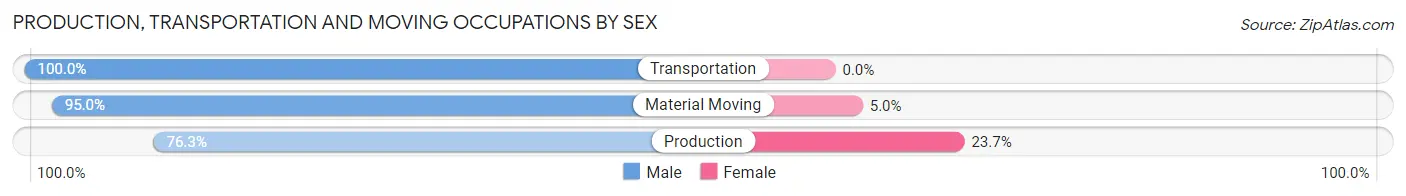
| Occupation | Male | Female |
| Production | 142 (76.3%) | 44 (23.7%) |
| Transportation | 23 (100.0%) | 0 (0.0%) |
| Material Moving | 38 (95.0%) | 2 (5.0%) |
| Total (Category) | 203 (81.5%) | 46 (18.5%) |
| Total (Overall) | 488 (54.9%) | 400 (45.1%) |
Employment Industries by Sex in Surgoinsville
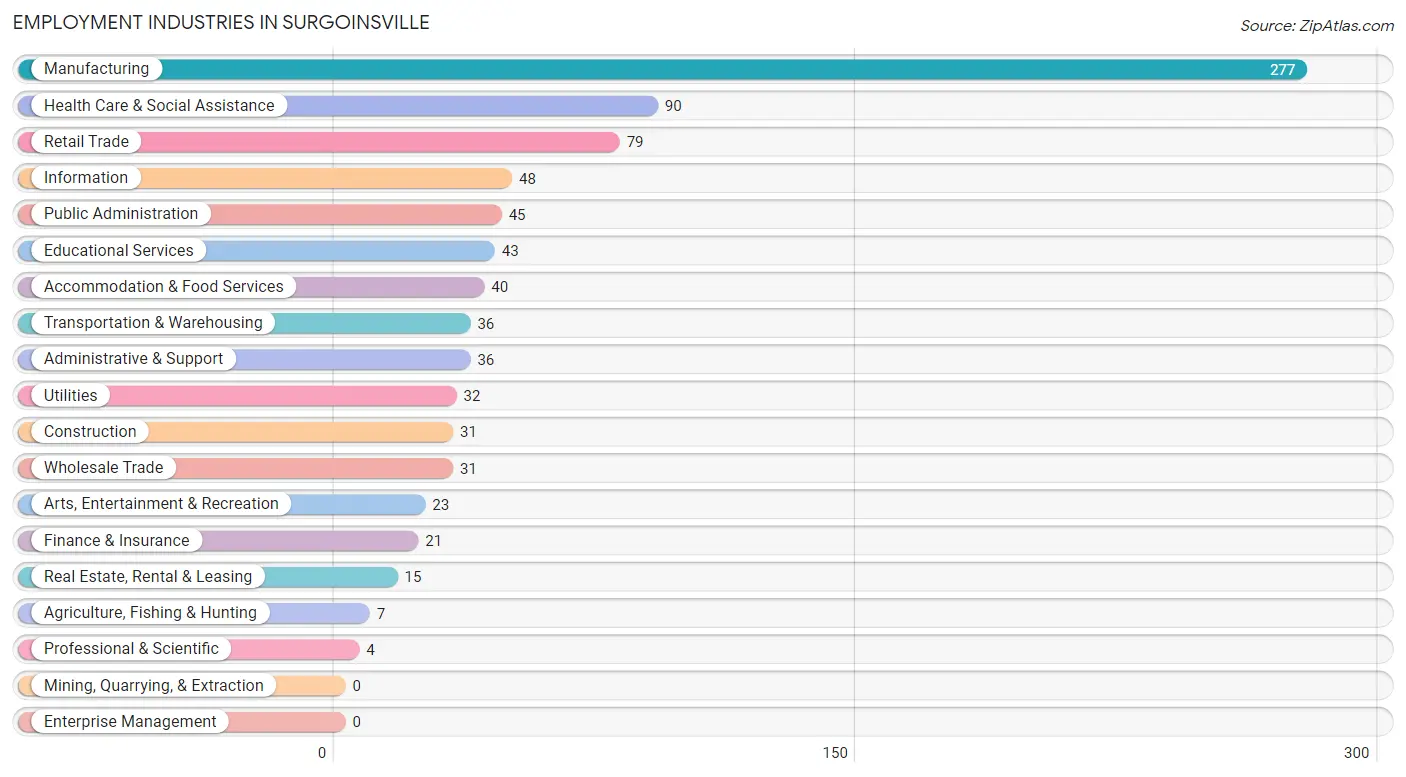
Employment Industries in Surgoinsville
The major employment industries in Surgoinsville include Manufacturing (277 | 31.2%), Health Care & Social Assistance (90 | 10.1%), Retail Trade (79 | 8.9%), Information (48 | 5.4%), and Public Administration (45 | 5.1%).
Employment Industries by Sex in Surgoinsville
The Surgoinsville industries that see more men than women are Agriculture, Fishing & Hunting (100.0%), Information (93.8%), and Public Administration (88.9%), whereas the industries that tend to have a higher number of women are Professional & Scientific (100.0%), Health Care & Social Assistance (98.9%), and Educational Services (95.4%).
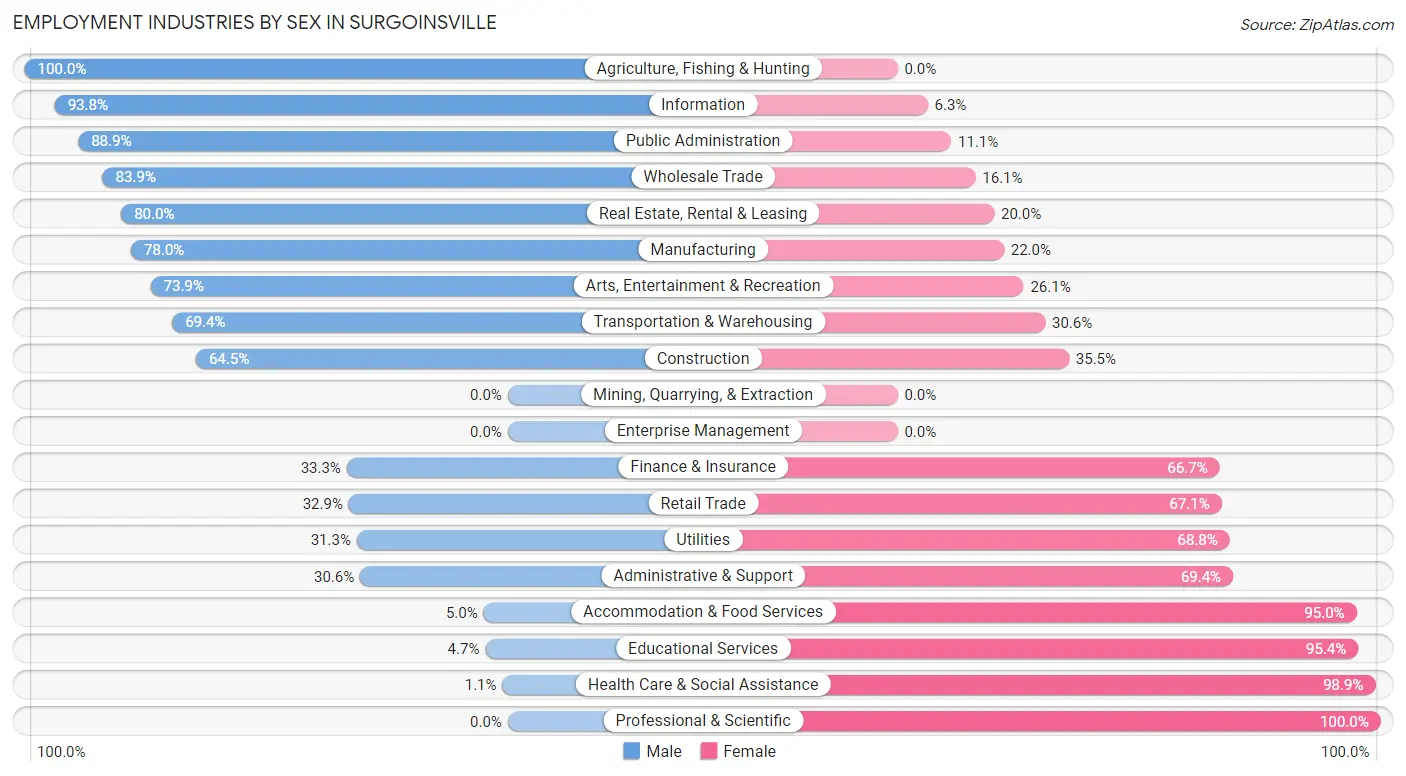
| Industry | Male | Female |
| Agriculture, Fishing & Hunting | 7 (100.0%) | 0 (0.0%) |
| Mining, Quarrying, & Extraction | 0 (0.0%) | 0 (0.0%) |
| Construction | 20 (64.5%) | 11 (35.5%) |
| Manufacturing | 216 (78.0%) | 61 (22.0%) |
| Wholesale Trade | 26 (83.9%) | 5 (16.1%) |
| Retail Trade | 26 (32.9%) | 53 (67.1%) |
| Transportation & Warehousing | 25 (69.4%) | 11 (30.6%) |
| Utilities | 10 (31.2%) | 22 (68.8%) |
| Information | 45 (93.8%) | 3 (6.2%) |
| Finance & Insurance | 7 (33.3%) | 14 (66.7%) |
| Real Estate, Rental & Leasing | 12 (80.0%) | 3 (20.0%) |
| Professional & Scientific | 0 (0.0%) | 4 (100.0%) |
| Enterprise Management | 0 (0.0%) | 0 (0.0%) |
| Administrative & Support | 11 (30.6%) | 25 (69.4%) |
| Educational Services | 2 (4.6%) | 41 (95.4%) |
| Health Care & Social Assistance | 1 (1.1%) | 89 (98.9%) |
| Arts, Entertainment & Recreation | 17 (73.9%) | 6 (26.1%) |
| Accommodation & Food Services | 2 (5.0%) | 38 (95.0%) |
| Public Administration | 40 (88.9%) | 5 (11.1%) |
| Total | 488 (54.9%) | 400 (45.1%) |
Education in Surgoinsville
School Enrollment in Surgoinsville
The most common levels of schooling among the 644 students in Surgoinsville are middle school (204 | 31.7%), elementary school (157 | 24.4%), and high school (119 | 18.5%).
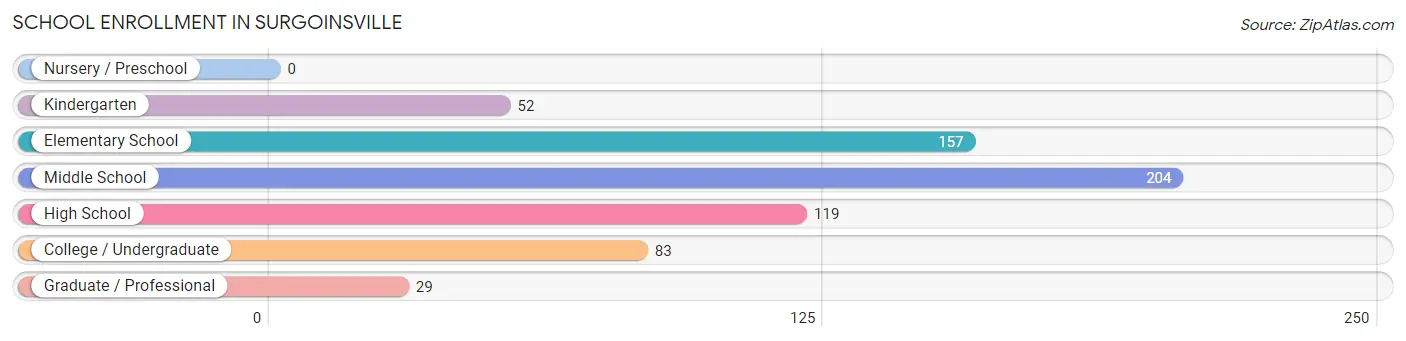
| School Level | # Students | % Students |
| Nursery / Preschool | 0 | 0.0% |
| Kindergarten | 52 | 8.1% |
| Elementary School | 157 | 24.4% |
| Middle School | 204 | 31.7% |
| High School | 119 | 18.5% |
| College / Undergraduate | 83 | 12.9% |
| Graduate / Professional | 29 | 4.5% |
| Total | 644 | 100.0% |
School Enrollment by Age by Funding Source in Surgoinsville
Out of a total of 644 students who are enrolled in schools in Surgoinsville, 35 (5.4%) attend a private institution, while the remaining 609 (94.6%) are enrolled in public schools. The age group of 20 to 24 year olds has the highest likelihood of being enrolled in private schools, with 1 (100.0% in the age bracket) enrolled. Conversely, the age group of 18 to 19 year olds has the lowest likelihood of being enrolled in a private school, with 73 (100.0% in the age bracket) attending a public institution.
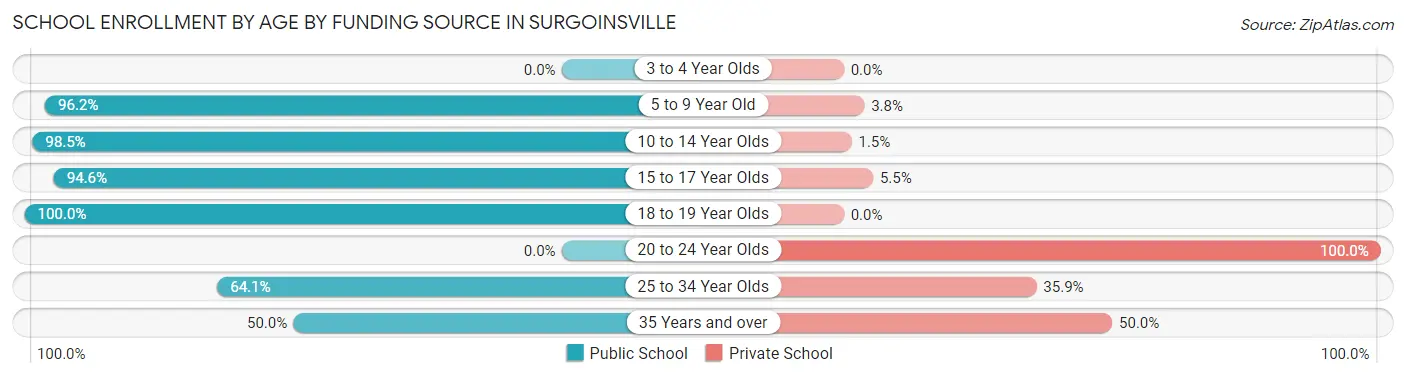
| Age Bracket | Public School | Private School |
| 3 to 4 Year Olds | 0 (0.0%) | 0 (0.0%) |
| 5 to 9 Year Old | 201 (96.2%) | 8 (3.8%) |
| 10 to 14 Year Olds | 203 (98.5%) | 3 (1.5%) |
| 15 to 17 Year Olds | 104 (94.6%) | 6 (5.4%) |
| 18 to 19 Year Olds | 73 (100.0%) | 0 (0.0%) |
| 20 to 24 Year Olds | 0 (0.0%) | 1 (100.0%) |
| 25 to 34 Year Olds | 25 (64.1%) | 14 (35.9%) |
| 35 Years and over | 3 (50.0%) | 3 (50.0%) |
| Total | 609 (94.6%) | 35 (5.4%) |
Educational Attainment by Field of Study in Surgoinsville
Education (98 | 30.5%), business (79 | 24.6%), science & technology (50 | 15.6%), liberal arts & history (21 | 6.5%), and visual & performing arts (15 | 4.7%) are the most common fields of study among 321 individuals in Surgoinsville who have obtained a bachelor's degree or higher.
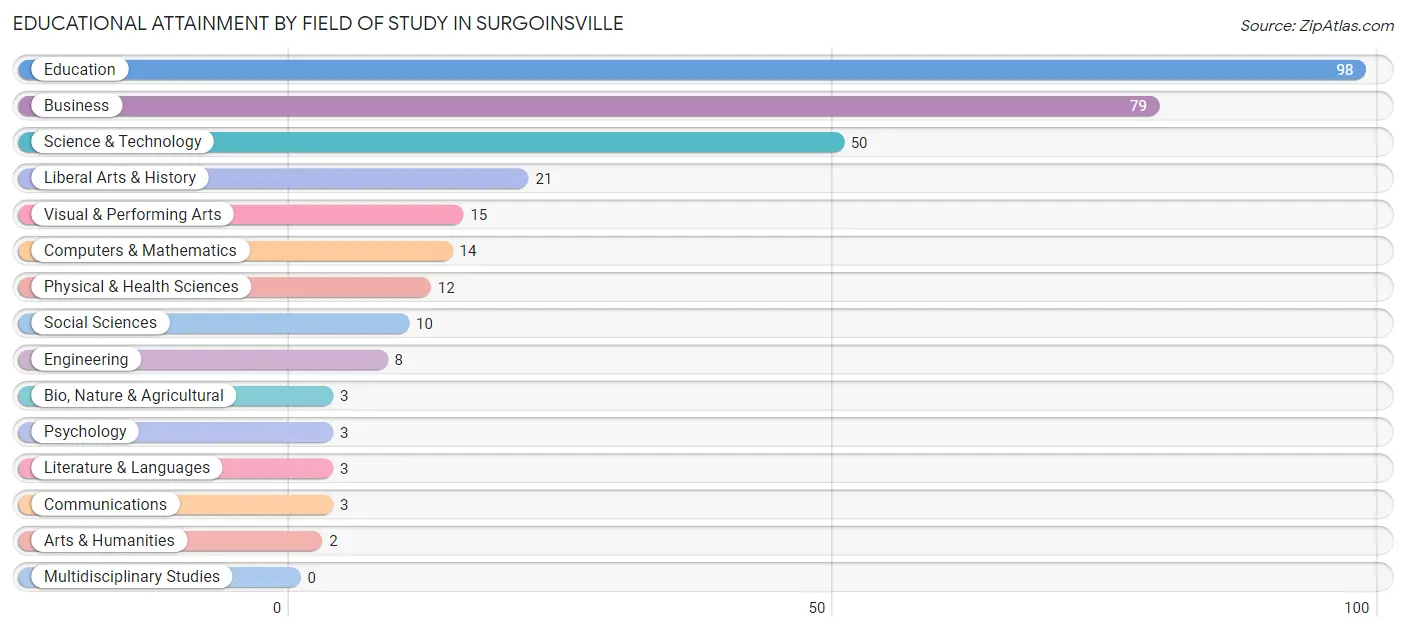
| Field of Study | # Graduates | % Graduates |
| Computers & Mathematics | 14 | 4.4% |
| Bio, Nature & Agricultural | 3 | 0.9% |
| Physical & Health Sciences | 12 | 3.7% |
| Psychology | 3 | 0.9% |
| Social Sciences | 10 | 3.1% |
| Engineering | 8 | 2.5% |
| Multidisciplinary Studies | 0 | 0.0% |
| Science & Technology | 50 | 15.6% |
| Business | 79 | 24.6% |
| Education | 98 | 30.5% |
| Literature & Languages | 3 | 0.9% |
| Liberal Arts & History | 21 | 6.5% |
| Visual & Performing Arts | 15 | 4.7% |
| Communications | 3 | 0.9% |
| Arts & Humanities | 2 | 0.6% |
| Total | 321 | 100.0% |
Transportation & Commute in Surgoinsville
Vehicle Availability by Sex in Surgoinsville
The most prevalent vehicle ownership categories in Surgoinsville are males with 3 vehicles (172, accounting for 37.1%) and females with 3 vehicles (107, making up 43.8%).
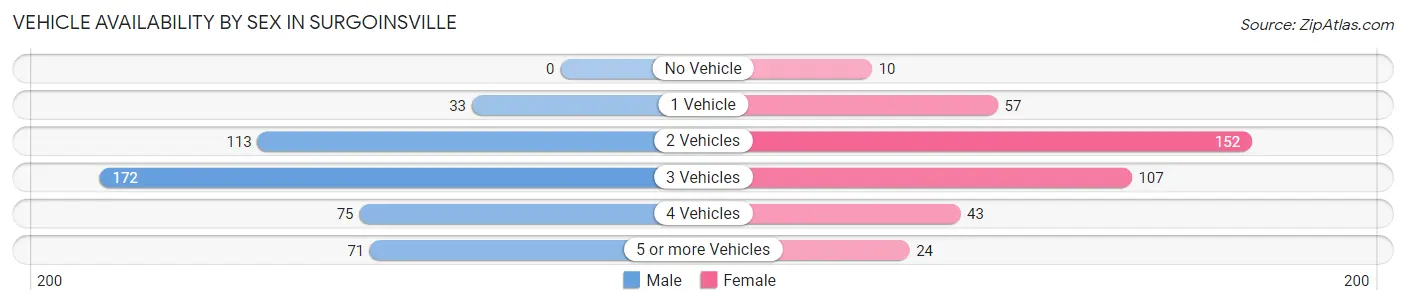
| Vehicles Available | Male | Female |
| No Vehicle | 0 (0.0%) | 10 (2.5%) |
| 1 Vehicle | 33 (7.1%) | 57 (14.5%) |
| 2 Vehicles | 113 (24.3%) | 152 (38.7%) |
| 3 Vehicles | 172 (37.1%) | 107 (27.2%) |
| 4 Vehicles | 75 (16.2%) | 43 (10.9%) |
| 5 or more Vehicles | 71 (15.3%) | 24 (6.1%) |
| Total | 464 (100.0%) | 393 (100.0%) |
Commute Time in Surgoinsville
The most frequently occuring commute durations in Surgoinsville are 10 to 14 minutes (187 commuters, 22.8%), 15 to 19 minutes (146 commuters, 17.8%), and 20 to 24 minutes (91 commuters, 11.1%).
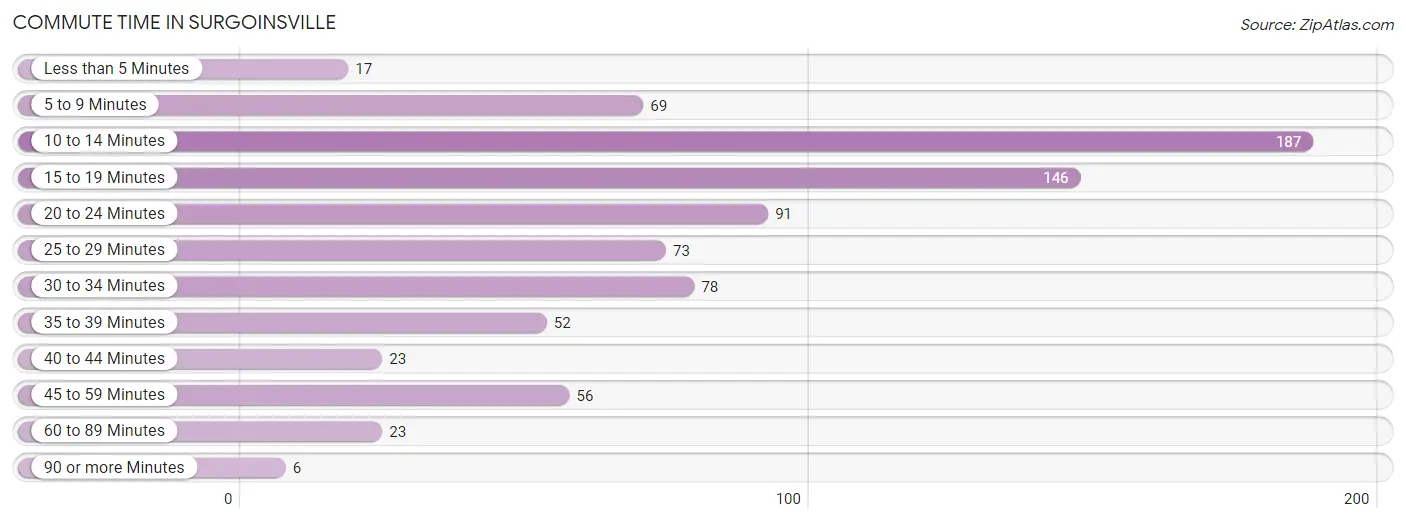
| Commute Time | # Commuters | % Commuters |
| Less than 5 Minutes | 17 | 2.1% |
| 5 to 9 Minutes | 69 | 8.4% |
| 10 to 14 Minutes | 187 | 22.8% |
| 15 to 19 Minutes | 146 | 17.8% |
| 20 to 24 Minutes | 91 | 11.1% |
| 25 to 29 Minutes | 73 | 8.9% |
| 30 to 34 Minutes | 78 | 9.5% |
| 35 to 39 Minutes | 52 | 6.3% |
| 40 to 44 Minutes | 23 | 2.8% |
| 45 to 59 Minutes | 56 | 6.8% |
| 60 to 89 Minutes | 23 | 2.8% |
| 90 or more Minutes | 6 | 0.7% |
Commute Time by Sex in Surgoinsville
The most common commute times in Surgoinsville are 10 to 14 minutes (104 commuters, 23.1%) for males and 10 to 14 minutes (83 commuters, 22.4%) for females.
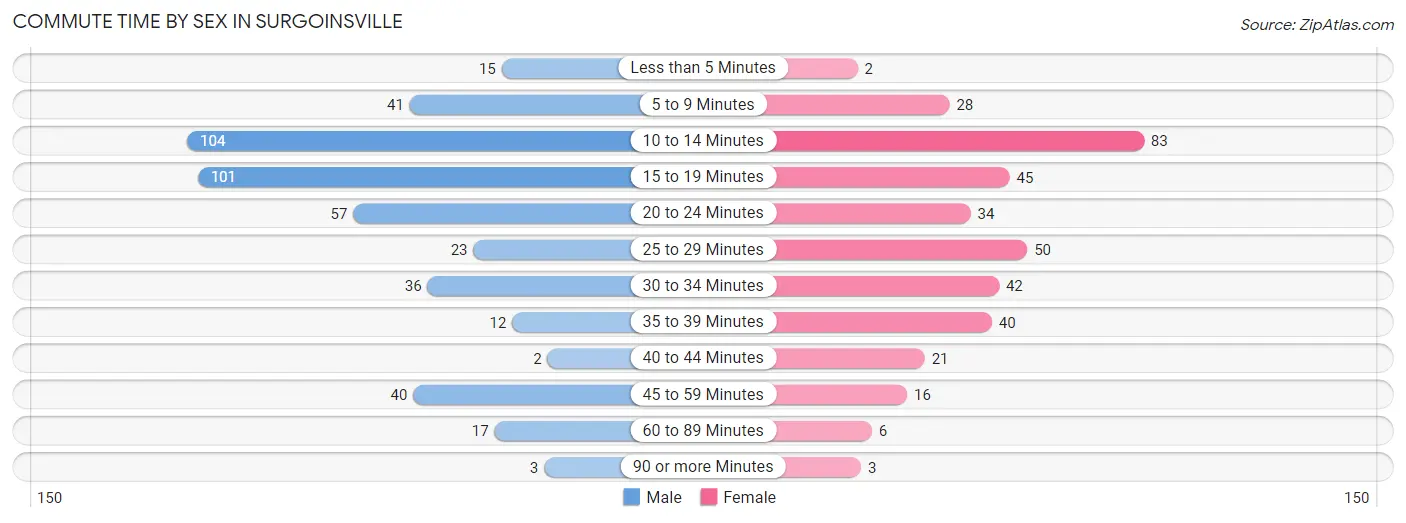
| Commute Time | Male | Female |
| Less than 5 Minutes | 15 (3.3%) | 2 (0.5%) |
| 5 to 9 Minutes | 41 (9.1%) | 28 (7.6%) |
| 10 to 14 Minutes | 104 (23.1%) | 83 (22.4%) |
| 15 to 19 Minutes | 101 (22.4%) | 45 (12.2%) |
| 20 to 24 Minutes | 57 (12.6%) | 34 (9.2%) |
| 25 to 29 Minutes | 23 (5.1%) | 50 (13.5%) |
| 30 to 34 Minutes | 36 (8.0%) | 42 (11.4%) |
| 35 to 39 Minutes | 12 (2.7%) | 40 (10.8%) |
| 40 to 44 Minutes | 2 (0.4%) | 21 (5.7%) |
| 45 to 59 Minutes | 40 (8.9%) | 16 (4.3%) |
| 60 to 89 Minutes | 17 (3.8%) | 6 (1.6%) |
| 90 or more Minutes | 3 (0.7%) | 3 (0.8%) |
Time of Departure to Work by Sex in Surgoinsville
The most frequent times of departure to work in Surgoinsville are 7:00 AM to 7:29 AM (102, 22.6%) for males and 7:30 AM to 7:59 AM (110, 29.7%) for females.
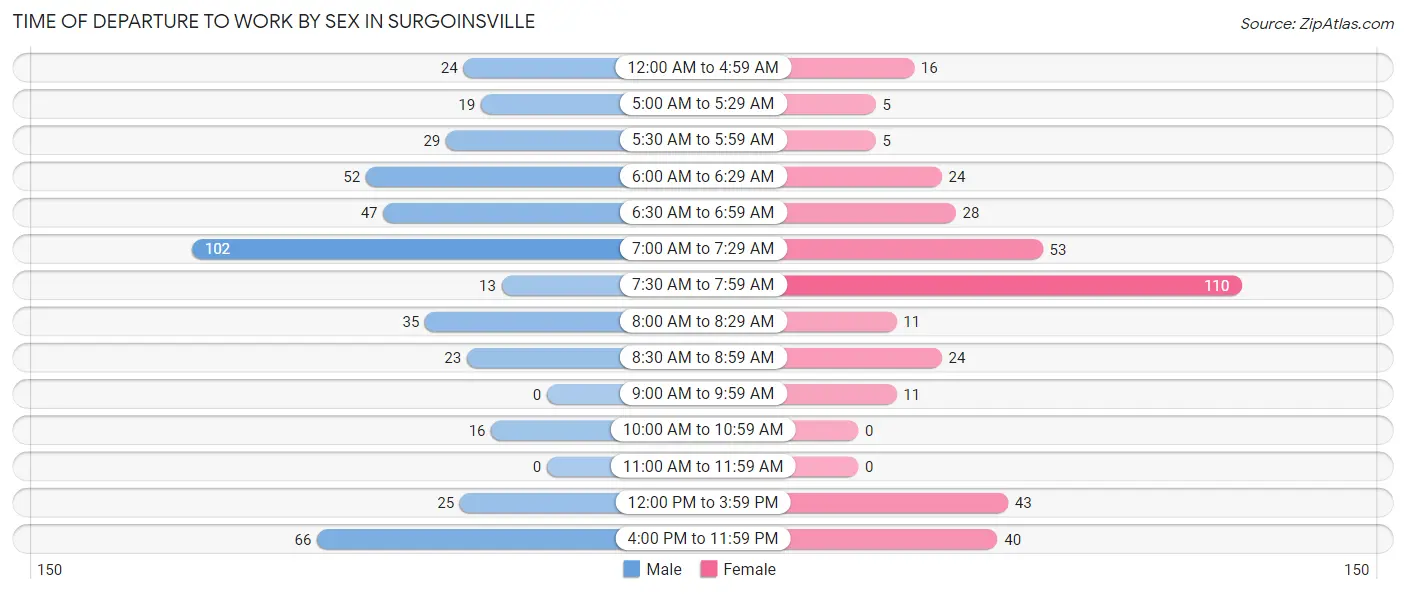
| Time of Departure | Male | Female |
| 12:00 AM to 4:59 AM | 24 (5.3%) | 16 (4.3%) |
| 5:00 AM to 5:29 AM | 19 (4.2%) | 5 (1.3%) |
| 5:30 AM to 5:59 AM | 29 (6.4%) | 5 (1.3%) |
| 6:00 AM to 6:29 AM | 52 (11.5%) | 24 (6.5%) |
| 6:30 AM to 6:59 AM | 47 (10.4%) | 28 (7.6%) |
| 7:00 AM to 7:29 AM | 102 (22.6%) | 53 (14.3%) |
| 7:30 AM to 7:59 AM | 13 (2.9%) | 110 (29.7%) |
| 8:00 AM to 8:29 AM | 35 (7.8%) | 11 (3.0%) |
| 8:30 AM to 8:59 AM | 23 (5.1%) | 24 (6.5%) |
| 9:00 AM to 9:59 AM | 0 (0.0%) | 11 (3.0%) |
| 10:00 AM to 10:59 AM | 16 (3.5%) | 0 (0.0%) |
| 11:00 AM to 11:59 AM | 0 (0.0%) | 0 (0.0%) |
| 12:00 PM to 3:59 PM | 25 (5.5%) | 43 (11.6%) |
| 4:00 PM to 11:59 PM | 66 (14.6%) | 40 (10.8%) |
| Total | 451 (100.0%) | 370 (100.0%) |
Housing Occupancy in Surgoinsville
Occupancy by Ownership in Surgoinsville
Of the total 874 dwellings in Surgoinsville, owner-occupied units account for 673 (77.0%), while renter-occupied units make up 201 (23.0%).
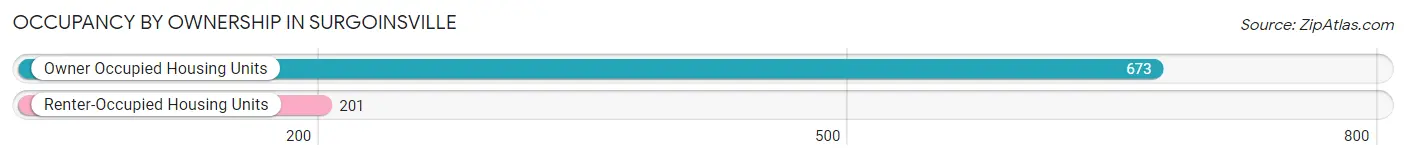
| Occupancy | # Housing Units | % Housing Units |
| Owner Occupied Housing Units | 673 | 77.0% |
| Renter-Occupied Housing Units | 201 | 23.0% |
| Total Occupied Housing Units | 874 | 100.0% |
Occupancy by Household Size in Surgoinsville
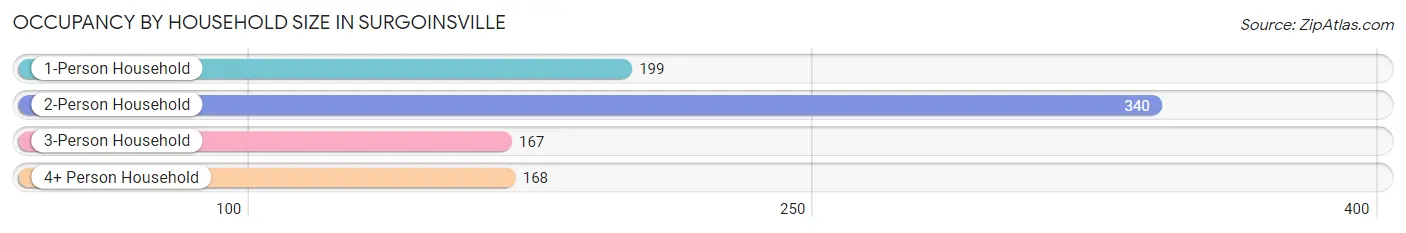
| Household Size | # Housing Units | % Housing Units |
| 1-Person Household | 199 | 22.8% |
| 2-Person Household | 340 | 38.9% |
| 3-Person Household | 167 | 19.1% |
| 4+ Person Household | 168 | 19.2% |
| Total Housing Units | 874 | 100.0% |
Occupancy by Ownership by Household Size in Surgoinsville
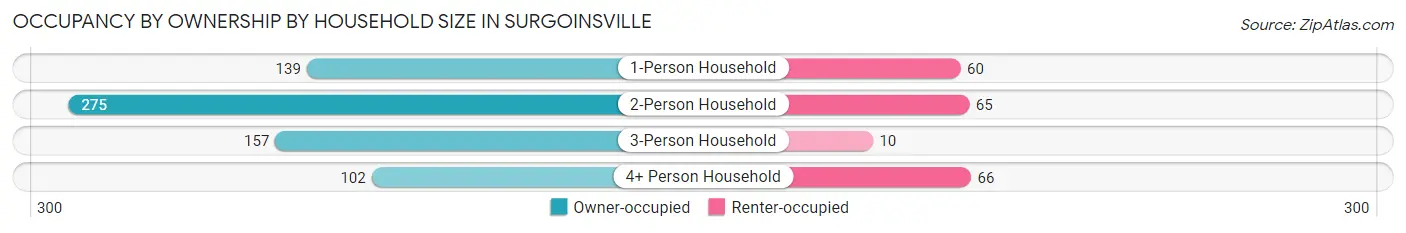
| Household Size | Owner-occupied | Renter-occupied |
| 1-Person Household | 139 (69.9%) | 60 (30.1%) |
| 2-Person Household | 275 (80.9%) | 65 (19.1%) |
| 3-Person Household | 157 (94.0%) | 10 (6.0%) |
| 4+ Person Household | 102 (60.7%) | 66 (39.3%) |
| Total Housing Units | 673 (77.0%) | 201 (23.0%) |
Occupancy by Educational Attainment in Surgoinsville
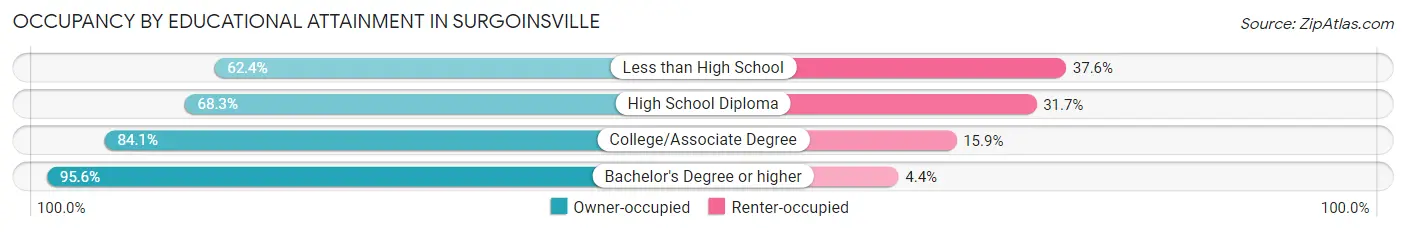
| Household Size | Owner-occupied | Renter-occupied |
| Less than High School | 68 (62.4%) | 41 (37.6%) |
| High School Diploma | 256 (68.3%) | 119 (31.7%) |
| College/Associate Degree | 175 (84.1%) | 33 (15.9%) |
| Bachelor's Degree or higher | 174 (95.6%) | 8 (4.4%) |
Occupancy by Age of Householder in Surgoinsville
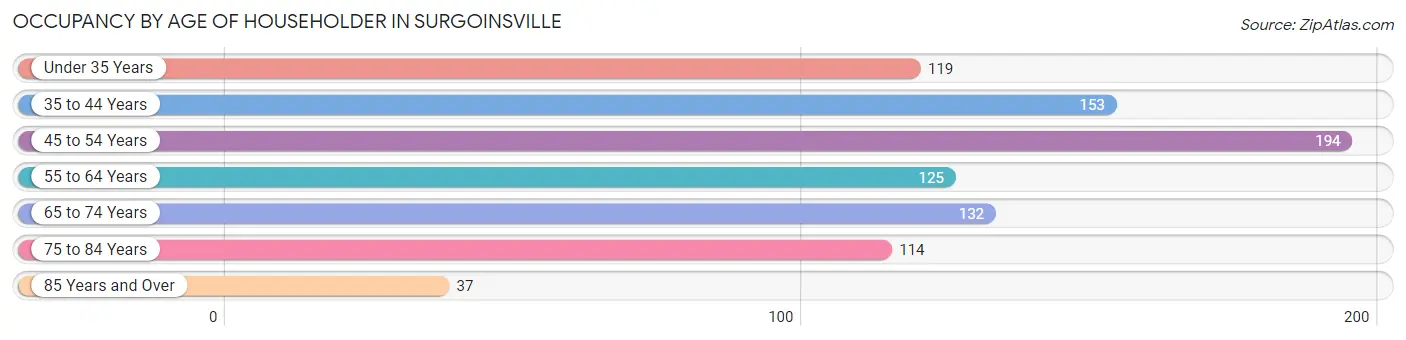
| Age Bracket | # Households | % Households |
| Under 35 Years | 119 | 13.6% |
| 35 to 44 Years | 153 | 17.5% |
| 45 to 54 Years | 194 | 22.2% |
| 55 to 64 Years | 125 | 14.3% |
| 65 to 74 Years | 132 | 15.1% |
| 75 to 84 Years | 114 | 13.0% |
| 85 Years and Over | 37 | 4.2% |
| Total | 874 | 100.0% |
Housing Finances in Surgoinsville
Median Income by Occupancy in Surgoinsville
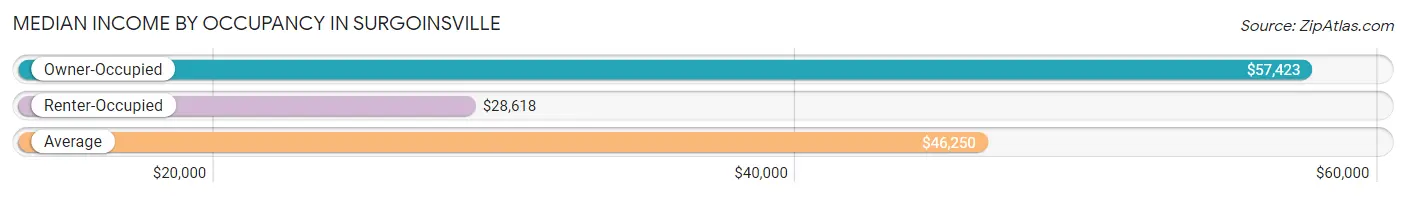
| Occupancy Type | # Households | Median Income |
| Owner-Occupied | 673 (77.0%) | $57,423 |
| Renter-Occupied | 201 (23.0%) | $28,618 |
| Average | 874 (100.0%) | $46,250 |
Occupancy by Householder Income Bracket in Surgoinsville
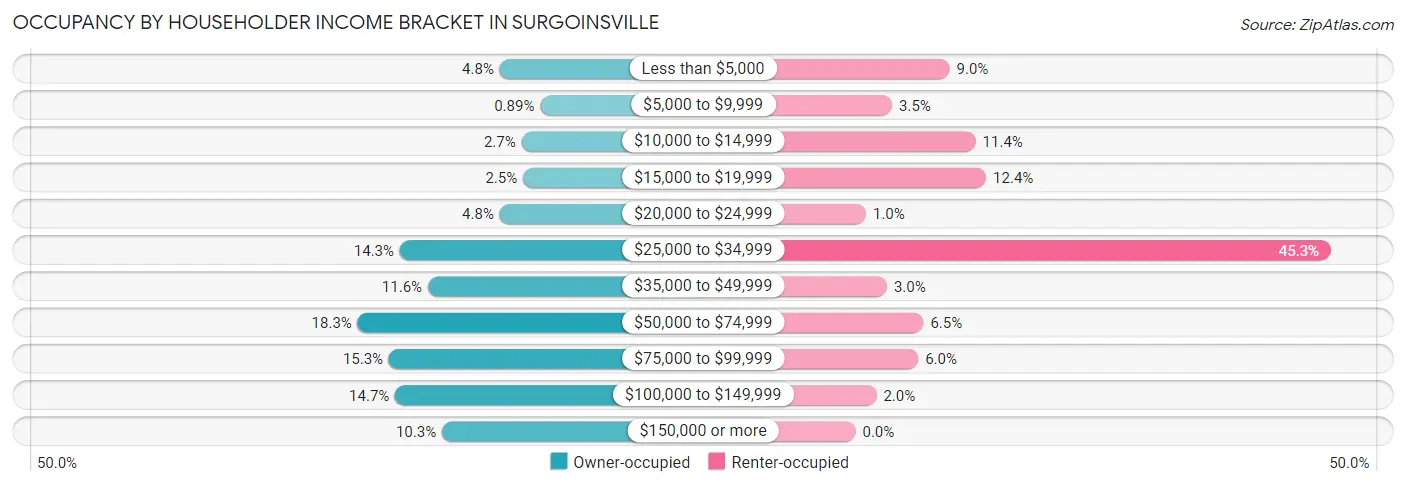
| Income Bracket | Owner-occupied | Renter-occupied |
| Less than $5,000 | 32 (4.8%) | 18 (9.0%) |
| $5,000 to $9,999 | 6 (0.9%) | 7 (3.5%) |
| $10,000 to $14,999 | 18 (2.7%) | 23 (11.4%) |
| $15,000 to $19,999 | 17 (2.5%) | 25 (12.4%) |
| $20,000 to $24,999 | 32 (4.8%) | 2 (1.0%) |
| $25,000 to $34,999 | 96 (14.3%) | 91 (45.3%) |
| $35,000 to $49,999 | 78 (11.6%) | 6 (3.0%) |
| $50,000 to $74,999 | 123 (18.3%) | 13 (6.5%) |
| $75,000 to $99,999 | 103 (15.3%) | 12 (6.0%) |
| $100,000 to $149,999 | 99 (14.7%) | 4 (2.0%) |
| $150,000 or more | 69 (10.2%) | 0 (0.0%) |
| Total | 673 (100.0%) | 201 (100.0%) |
Monthly Housing Cost Tiers in Surgoinsville
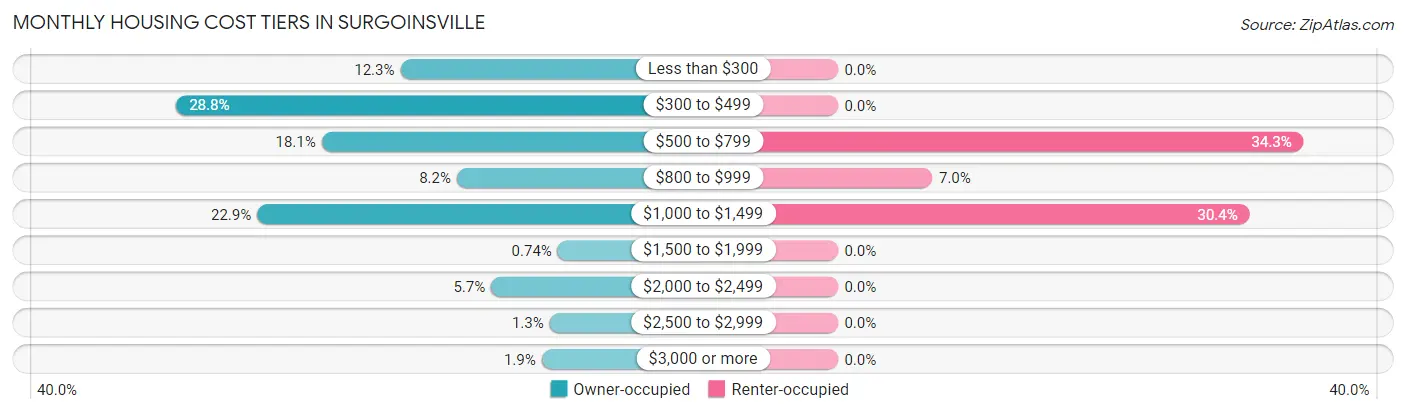
| Monthly Cost | Owner-occupied | Renter-occupied |
| Less than $300 | 83 (12.3%) | 0 (0.0%) |
| $300 to $499 | 194 (28.8%) | 0 (0.0%) |
| $500 to $799 | 122 (18.1%) | 69 (34.3%) |
| $800 to $999 | 55 (8.2%) | 14 (7.0%) |
| $1,000 to $1,499 | 154 (22.9%) | 61 (30.3%) |
| $1,500 to $1,999 | 5 (0.7%) | 0 (0.0%) |
| $2,000 to $2,499 | 38 (5.7%) | 0 (0.0%) |
| $2,500 to $2,999 | 9 (1.3%) | 0 (0.0%) |
| $3,000 or more | 13 (1.9%) | 0 (0.0%) |
| Total | 673 (100.0%) | 201 (100.0%) |
Physical Housing Characteristics in Surgoinsville
Housing Structures in Surgoinsville
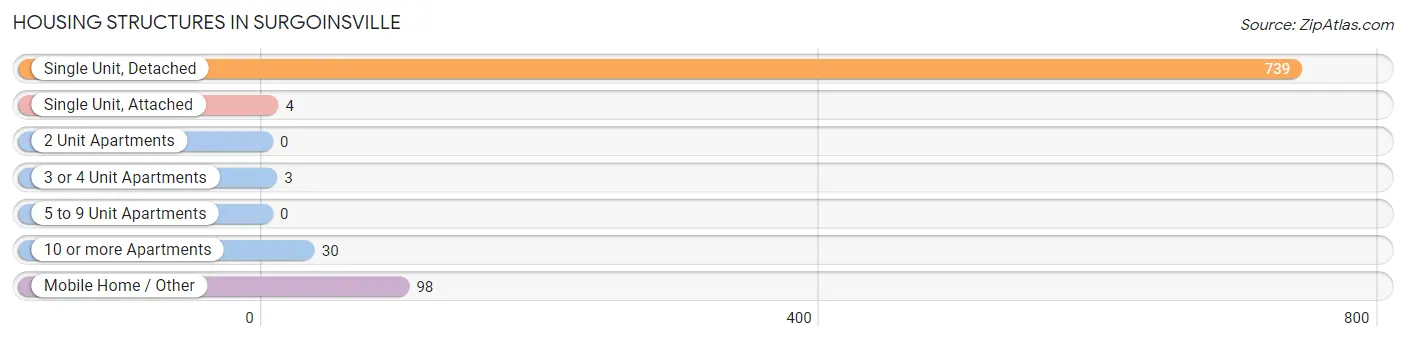
| Structure Type | # Housing Units | % Housing Units |
| Single Unit, Detached | 739 | 84.6% |
| Single Unit, Attached | 4 | 0.5% |
| 2 Unit Apartments | 0 | 0.0% |
| 3 or 4 Unit Apartments | 3 | 0.3% |
| 5 to 9 Unit Apartments | 0 | 0.0% |
| 10 or more Apartments | 30 | 3.4% |
| Mobile Home / Other | 98 | 11.2% |
| Total | 874 | 100.0% |
Housing Structures by Occupancy in Surgoinsville
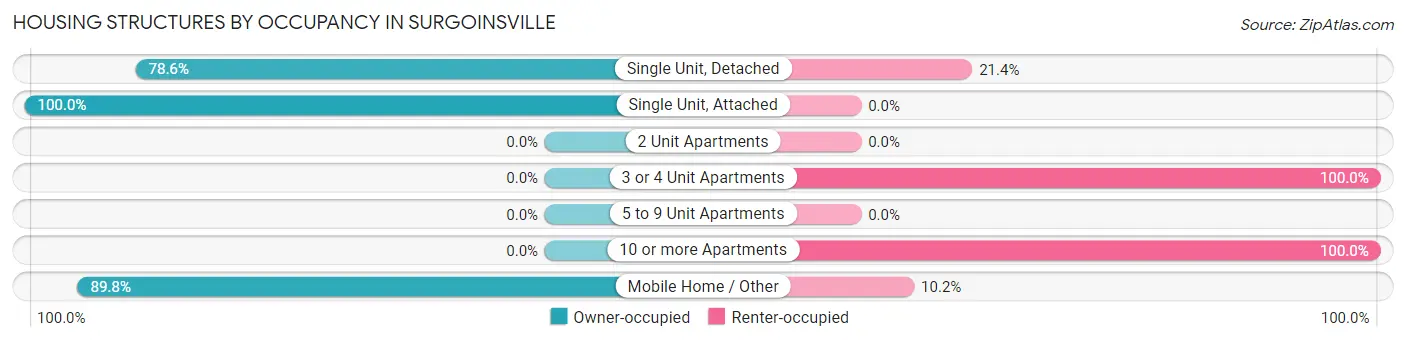
| Structure Type | Owner-occupied | Renter-occupied |
| Single Unit, Detached | 581 (78.6%) | 158 (21.4%) |
| Single Unit, Attached | 4 (100.0%) | 0 (0.0%) |
| 2 Unit Apartments | 0 (0.0%) | 0 (0.0%) |
| 3 or 4 Unit Apartments | 0 (0.0%) | 3 (100.0%) |
| 5 to 9 Unit Apartments | 0 (0.0%) | 0 (0.0%) |
| 10 or more Apartments | 0 (0.0%) | 30 (100.0%) |
| Mobile Home / Other | 88 (89.8%) | 10 (10.2%) |
| Total | 673 (77.0%) | 201 (23.0%) |
Housing Structures by Number of Rooms in Surgoinsville
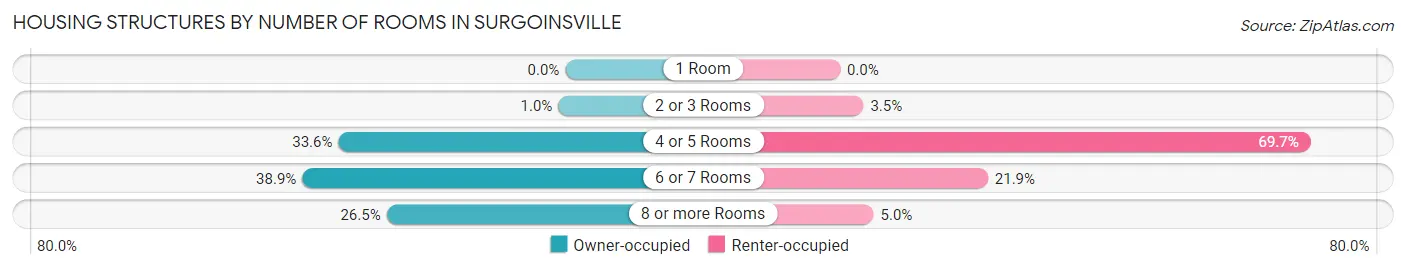
| Number of Rooms | Owner-occupied | Renter-occupied |
| 1 Room | 0 (0.0%) | 0 (0.0%) |
| 2 or 3 Rooms | 7 (1.0%) | 7 (3.5%) |
| 4 or 5 Rooms | 226 (33.6%) | 140 (69.7%) |
| 6 or 7 Rooms | 262 (38.9%) | 44 (21.9%) |
| 8 or more Rooms | 178 (26.5%) | 10 (5.0%) |
| Total | 673 (100.0%) | 201 (100.0%) |
Housing Structure by Heating Type in Surgoinsville
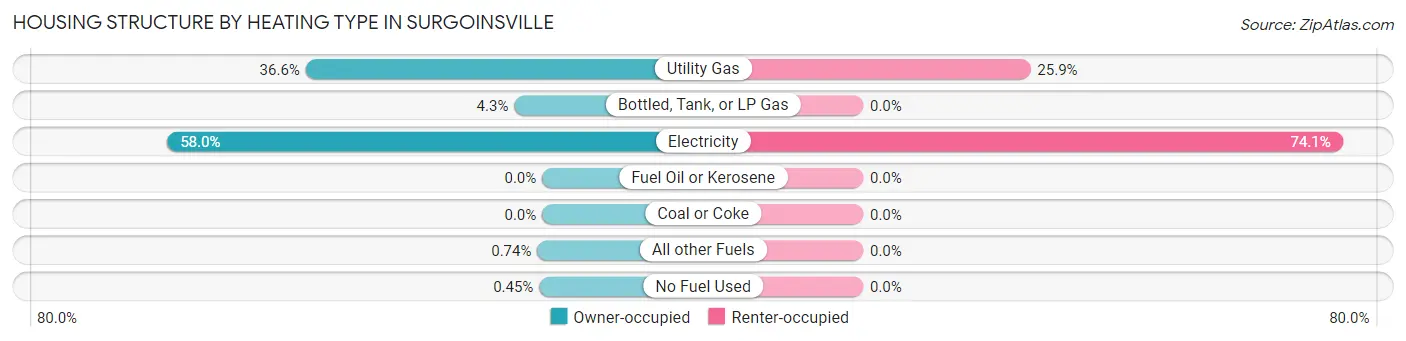
| Heating Type | Owner-occupied | Renter-occupied |
| Utility Gas | 246 (36.5%) | 52 (25.9%) |
| Bottled, Tank, or LP Gas | 29 (4.3%) | 0 (0.0%) |
| Electricity | 390 (58.0%) | 149 (74.1%) |
| Fuel Oil or Kerosene | 0 (0.0%) | 0 (0.0%) |
| Coal or Coke | 0 (0.0%) | 0 (0.0%) |
| All other Fuels | 5 (0.7%) | 0 (0.0%) |
| No Fuel Used | 3 (0.4%) | 0 (0.0%) |
| Total | 673 (100.0%) | 201 (100.0%) |
Household Vehicle Usage in Surgoinsville
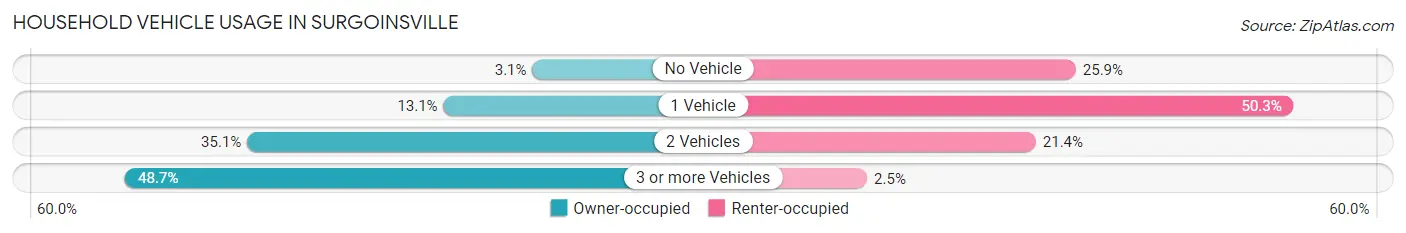
| Vehicles per Household | Owner-occupied | Renter-occupied |
| No Vehicle | 21 (3.1%) | 52 (25.9%) |
| 1 Vehicle | 88 (13.1%) | 101 (50.2%) |
| 2 Vehicles | 236 (35.1%) | 43 (21.4%) |
| 3 or more Vehicles | 328 (48.7%) | 5 (2.5%) |
| Total | 673 (100.0%) | 201 (100.0%) |
Real Estate & Mortgages in Surgoinsville
Real Estate and Mortgage Overview in Surgoinsville
| Characteristic | Without Mortgage | With Mortgage |
| Housing Units | 379 | 294 |
| Median Property Value | $155,200 | $174,100 |
| Median Household Income | $46,953 | $31 |
| Monthly Housing Costs | $431 | $9 |
| Real Estate Taxes | $1,080 | $13 |
Property Value by Mortgage Status in Surgoinsville
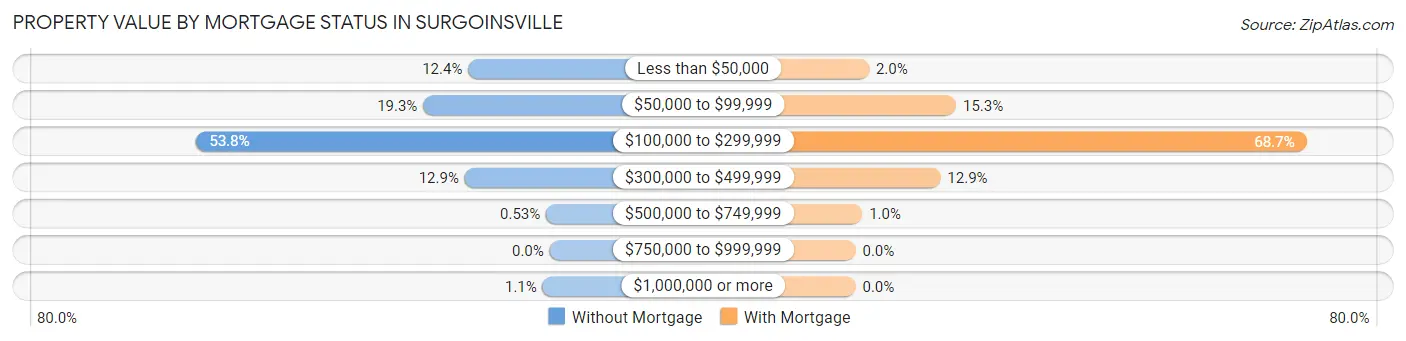
| Property Value | Without Mortgage | With Mortgage |
| Less than $50,000 | 47 (12.4%) | 6 (2.0%) |
| $50,000 to $99,999 | 73 (19.3%) | 45 (15.3%) |
| $100,000 to $299,999 | 204 (53.8%) | 202 (68.7%) |
| $300,000 to $499,999 | 49 (12.9%) | 38 (12.9%) |
| $500,000 to $749,999 | 2 (0.5%) | 3 (1.0%) |
| $750,000 to $999,999 | 0 (0.0%) | 0 (0.0%) |
| $1,000,000 or more | 4 (1.1%) | 0 (0.0%) |
| Total | 379 (100.0%) | 294 (100.0%) |
Household Income by Mortgage Status in Surgoinsville
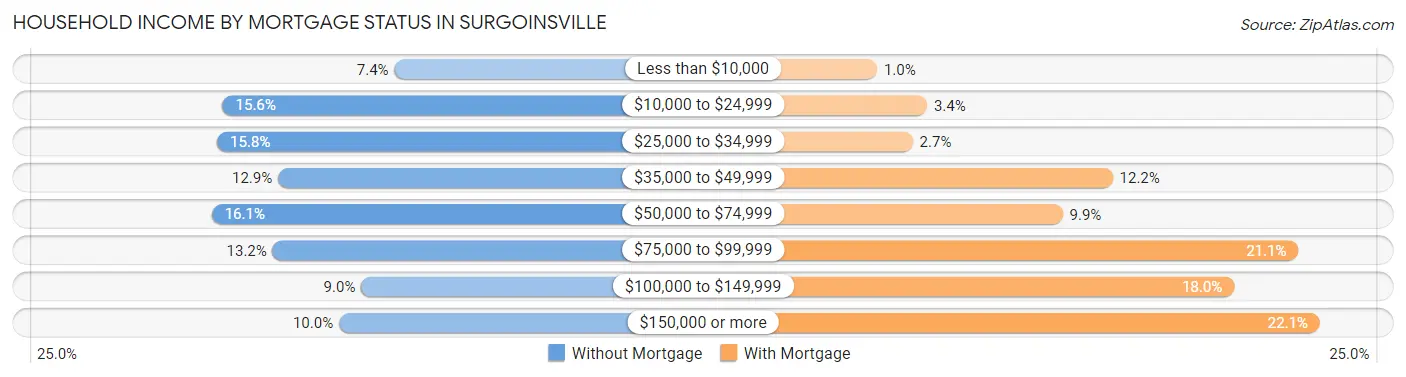
| Household Income | Without Mortgage | With Mortgage |
| Less than $10,000 | 28 (7.4%) | 3 (1.0%) |
| $10,000 to $24,999 | 59 (15.6%) | 10 (3.4%) |
| $25,000 to $34,999 | 60 (15.8%) | 8 (2.7%) |
| $35,000 to $49,999 | 49 (12.9%) | 36 (12.2%) |
| $50,000 to $74,999 | 61 (16.1%) | 29 (9.9%) |
| $75,000 to $99,999 | 50 (13.2%) | 62 (21.1%) |
| $100,000 to $149,999 | 34 (9.0%) | 53 (18.0%) |
| $150,000 or more | 38 (10.0%) | 65 (22.1%) |
| Total | 379 (100.0%) | 294 (100.0%) |
Property Value to Household Income Ratio in Surgoinsville
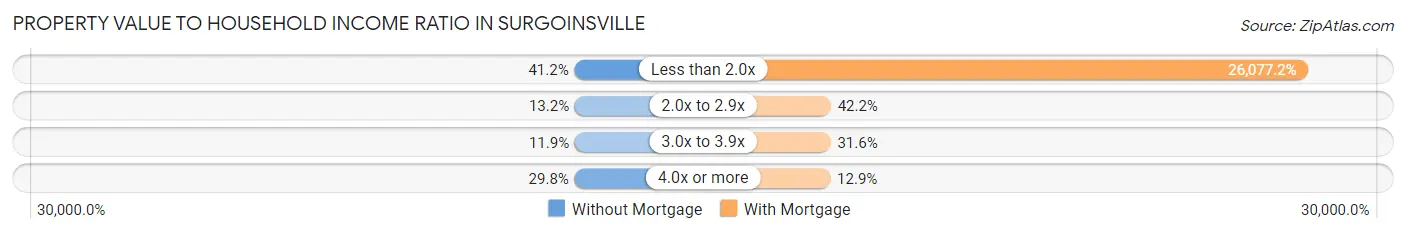
| Value-to-Income Ratio | Without Mortgage | With Mortgage |
| Less than 2.0x | 156 (41.2%) | 76,667 (26,077.2%) |
| 2.0x to 2.9x | 50 (13.2%) | 124 (42.2%) |
| 3.0x to 3.9x | 45 (11.9%) | 93 (31.6%) |
| 4.0x or more | 113 (29.8%) | 38 (12.9%) |
| Total | 379 (100.0%) | 294 (100.0%) |
Real Estate Taxes by Mortgage Status in Surgoinsville
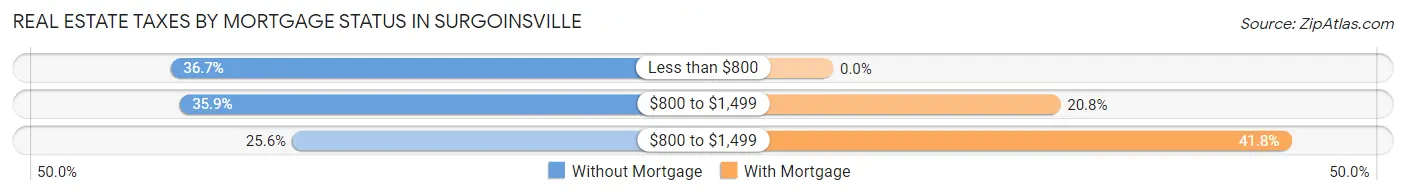
| Property Taxes | Without Mortgage | With Mortgage |
| Less than $800 | 139 (36.7%) | 0 (0.0%) |
| $800 to $1,499 | 136 (35.9%) | 61 (20.7%) |
| $800 to $1,499 | 97 (25.6%) | 123 (41.8%) |
| Total | 379 (100.0%) | 294 (100.0%) |
Health & Disability in Surgoinsville
Health Insurance Coverage by Age in Surgoinsville
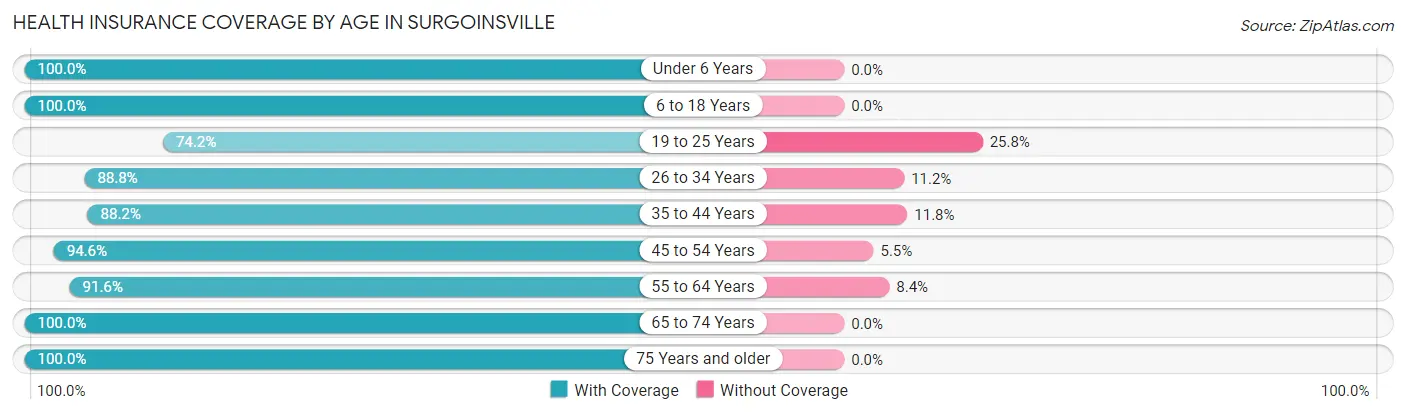
| Age Bracket | With Coverage | Without Coverage |
| Under 6 Years | 81 (100.0%) | 0 (0.0%) |
| 6 to 18 Years | 551 (100.0%) | 0 (0.0%) |
| 19 to 25 Years | 138 (74.2%) | 48 (25.8%) |
| 26 to 34 Years | 167 (88.8%) | 21 (11.2%) |
| 35 to 44 Years | 210 (88.2%) | 28 (11.8%) |
| 45 to 54 Years | 364 (94.6%) | 21 (5.4%) |
| 55 to 64 Years | 218 (91.6%) | 20 (8.4%) |
| 65 to 74 Years | 219 (100.0%) | 0 (0.0%) |
| 75 Years and older | 230 (100.0%) | 0 (0.0%) |
| Total | 2,178 (94.0%) | 138 (6.0%) |
Health Insurance Coverage by Citizenship Status in Surgoinsville
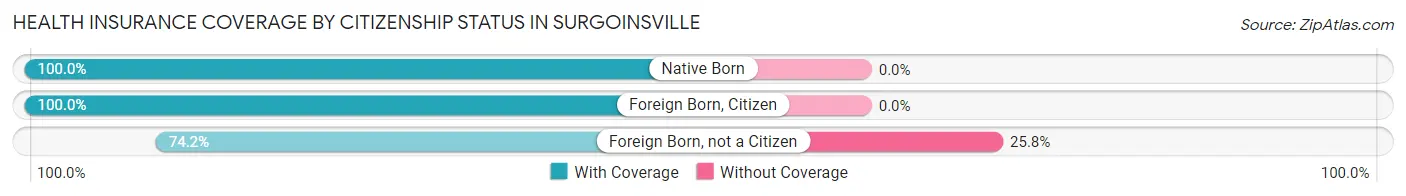
| Citizenship Status | With Coverage | Without Coverage |
| Native Born | 81 (100.0%) | 0 (0.0%) |
| Foreign Born, Citizen | 551 (100.0%) | 0 (0.0%) |
| Foreign Born, not a Citizen | 138 (74.2%) | 48 (25.8%) |
Health Insurance Coverage by Household Income in Surgoinsville
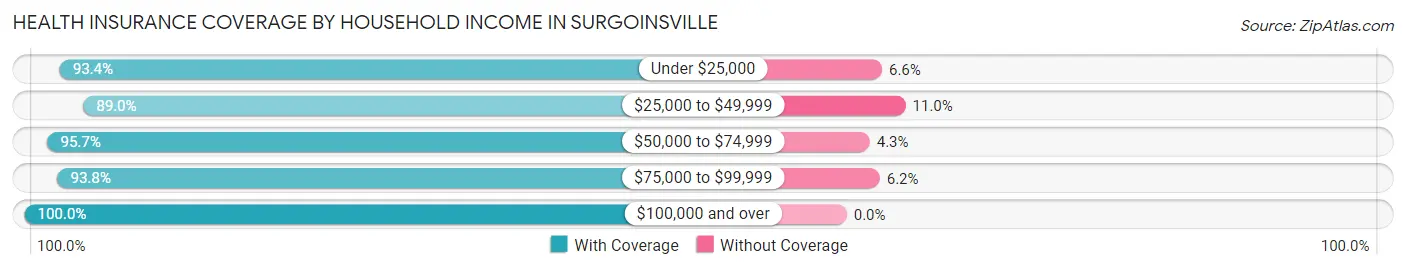
| Household Income | With Coverage | Without Coverage |
| Under $25,000 | 297 (93.4%) | 21 (6.6%) |
| $25,000 to $49,999 | 678 (89.0%) | 84 (11.0%) |
| $50,000 to $74,999 | 355 (95.7%) | 16 (4.3%) |
| $75,000 to $99,999 | 258 (93.8%) | 17 (6.2%) |
| $100,000 and over | 590 (100.0%) | 0 (0.0%) |
Public vs Private Health Insurance Coverage by Age in Surgoinsville
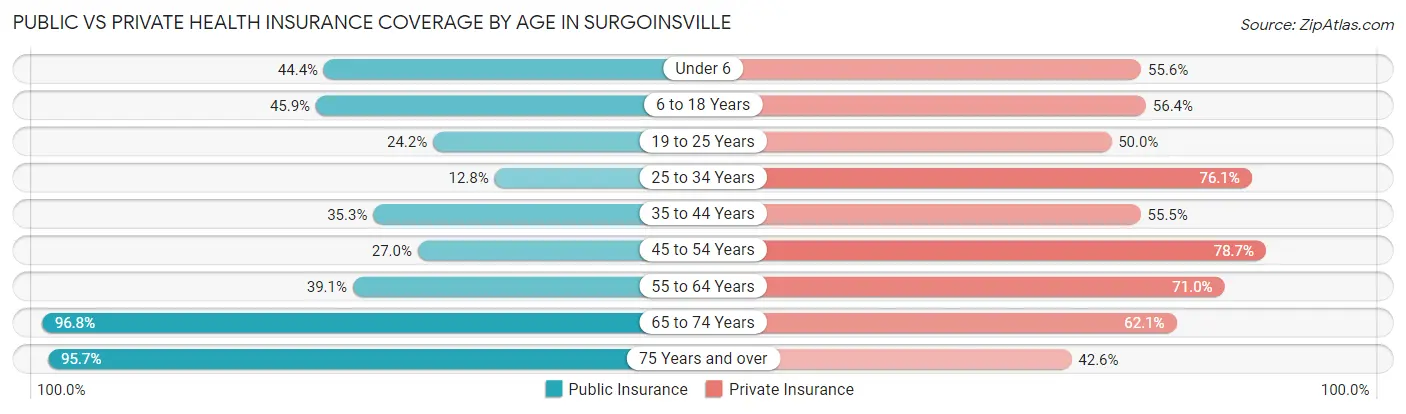
| Age Bracket | Public Insurance | Private Insurance |
| Under 6 | 36 (44.4%) | 45 (55.6%) |
| 6 to 18 Years | 253 (45.9%) | 311 (56.4%) |
| 19 to 25 Years | 45 (24.2%) | 93 (50.0%) |
| 25 to 34 Years | 24 (12.8%) | 143 (76.1%) |
| 35 to 44 Years | 84 (35.3%) | 132 (55.5%) |
| 45 to 54 Years | 104 (27.0%) | 303 (78.7%) |
| 55 to 64 Years | 93 (39.1%) | 169 (71.0%) |
| 65 to 74 Years | 212 (96.8%) | 136 (62.1%) |
| 75 Years and over | 220 (95.7%) | 98 (42.6%) |
| Total | 1,071 (46.2%) | 1,430 (61.7%) |
Disability Status by Sex by Age in Surgoinsville
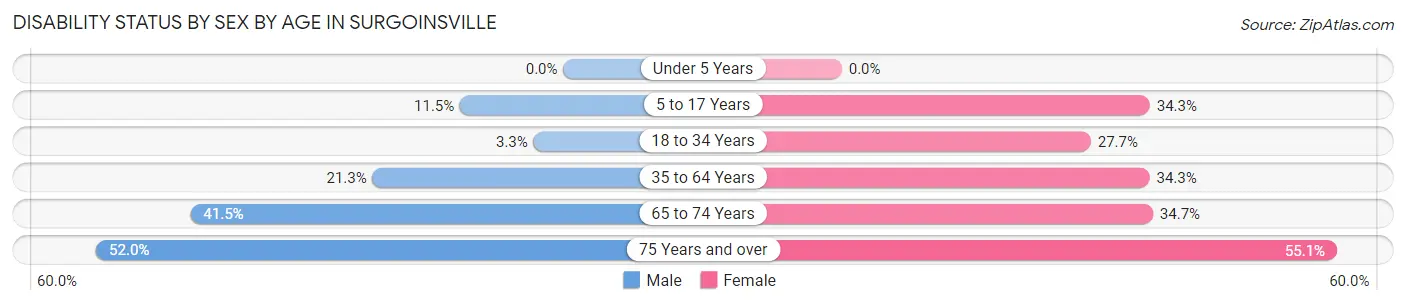
| Age Bracket | Male | Female |
| Under 5 Years | 0 (0.0%) | 0 (0.0%) |
| 5 to 17 Years | 23 (11.5%) | 118 (34.3%) |
| 18 to 34 Years | 6 (3.3%) | 66 (27.7%) |
| 35 to 64 Years | 85 (21.2%) | 158 (34.3%) |
| 65 to 74 Years | 49 (41.5%) | 35 (34.6%) |
| 75 Years and over | 64 (52.0%) | 59 (55.1%) |
Disability Class by Sex by Age in Surgoinsville
Disability Class: Hearing Difficulty
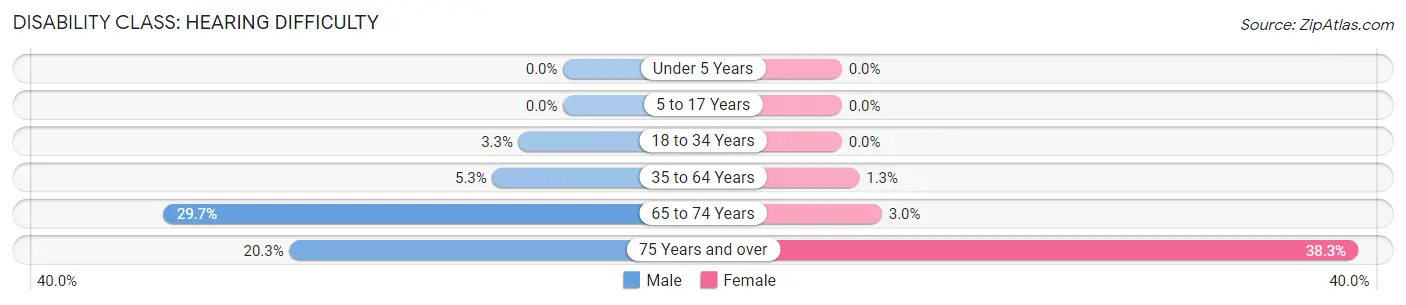
| Age Bracket | Male | Female |
| Under 5 Years | 0 (0.0%) | 0 (0.0%) |
| 5 to 17 Years | 0 (0.0%) | 0 (0.0%) |
| 18 to 34 Years | 6 (3.3%) | 0 (0.0%) |
| 35 to 64 Years | 21 (5.2%) | 6 (1.3%) |
| 65 to 74 Years | 35 (29.7%) | 3 (3.0%) |
| 75 Years and over | 25 (20.3%) | 41 (38.3%) |
Disability Class: Vision Difficulty
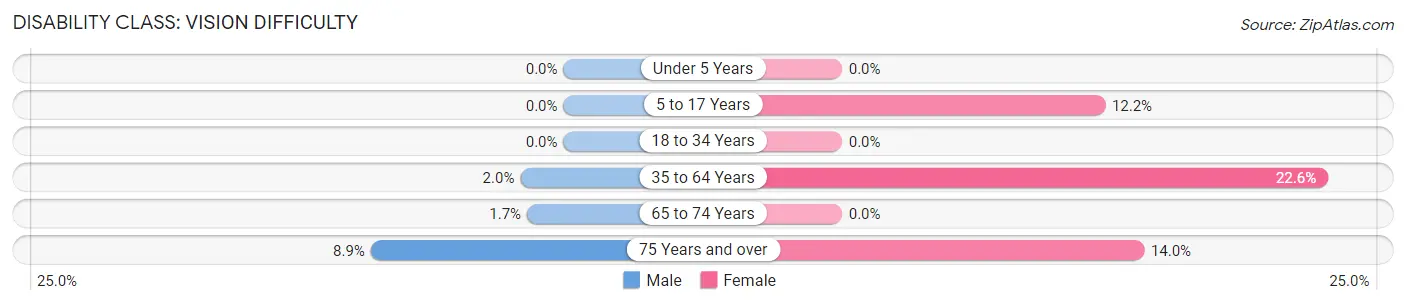
| Age Bracket | Male | Female |
| Under 5 Years | 0 (0.0%) | 0 (0.0%) |
| 5 to 17 Years | 0 (0.0%) | 42 (12.2%) |
| 18 to 34 Years | 0 (0.0%) | 0 (0.0%) |
| 35 to 64 Years | 8 (2.0%) | 104 (22.6%) |
| 65 to 74 Years | 2 (1.7%) | 0 (0.0%) |
| 75 Years and over | 11 (8.9%) | 15 (14.0%) |
Disability Class: Cognitive Difficulty
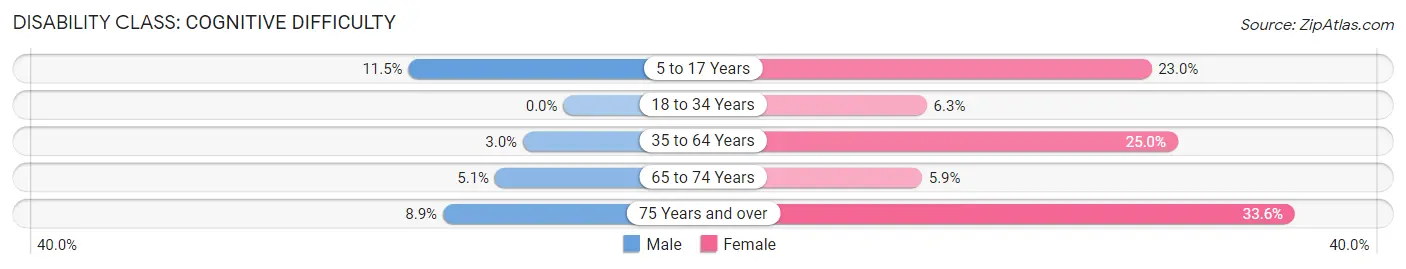
| Age Bracket | Male | Female |
| 5 to 17 Years | 23 (11.5%) | 79 (23.0%) |
| 18 to 34 Years | 0 (0.0%) | 15 (6.3%) |
| 35 to 64 Years | 12 (3.0%) | 115 (24.9%) |
| 65 to 74 Years | 6 (5.1%) | 6 (5.9%) |
| 75 Years and over | 11 (8.9%) | 36 (33.6%) |
Disability Class: Ambulatory Difficulty
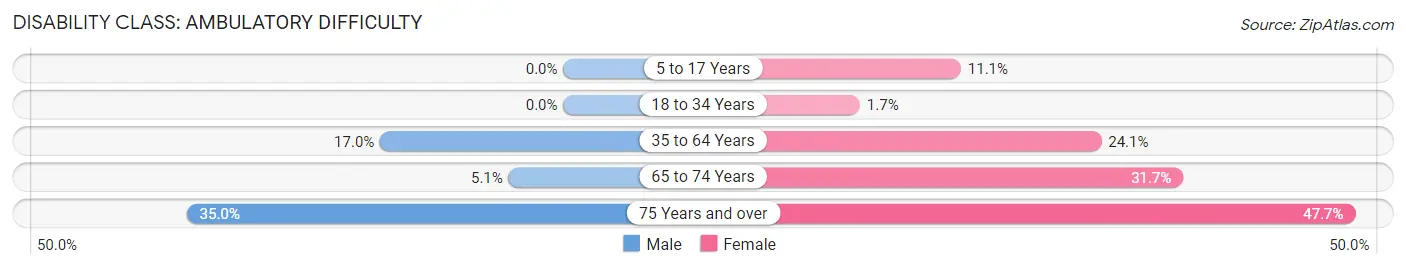
| Age Bracket | Male | Female |
| 5 to 17 Years | 0 (0.0%) | 38 (11.1%) |
| 18 to 34 Years | 0 (0.0%) | 4 (1.7%) |
| 35 to 64 Years | 68 (17.0%) | 111 (24.1%) |
| 65 to 74 Years | 6 (5.1%) | 32 (31.7%) |
| 75 Years and over | 43 (35.0%) | 51 (47.7%) |
Disability Class: Self-Care Difficulty
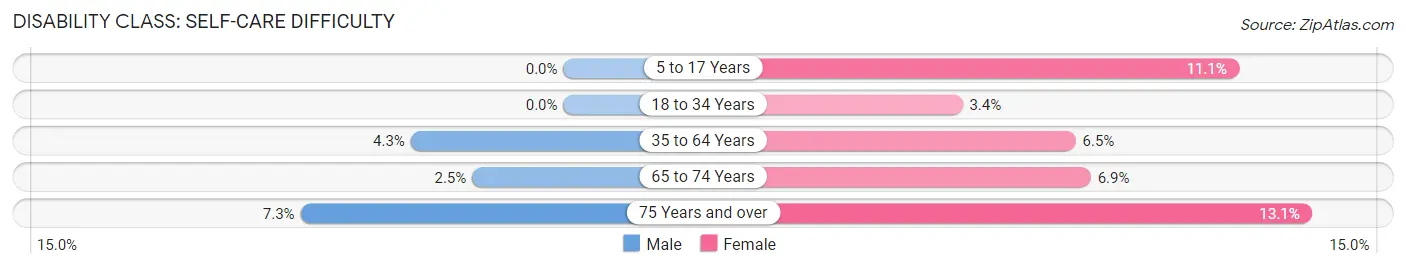
| Age Bracket | Male | Female |
| 5 to 17 Years | 0 (0.0%) | 38 (11.1%) |
| 18 to 34 Years | 0 (0.0%) | 8 (3.4%) |
| 35 to 64 Years | 17 (4.3%) | 30 (6.5%) |
| 65 to 74 Years | 3 (2.5%) | 7 (6.9%) |
| 75 Years and over | 9 (7.3%) | 14 (13.1%) |
Technology Access in Surgoinsville
Computing Device Access in Surgoinsville
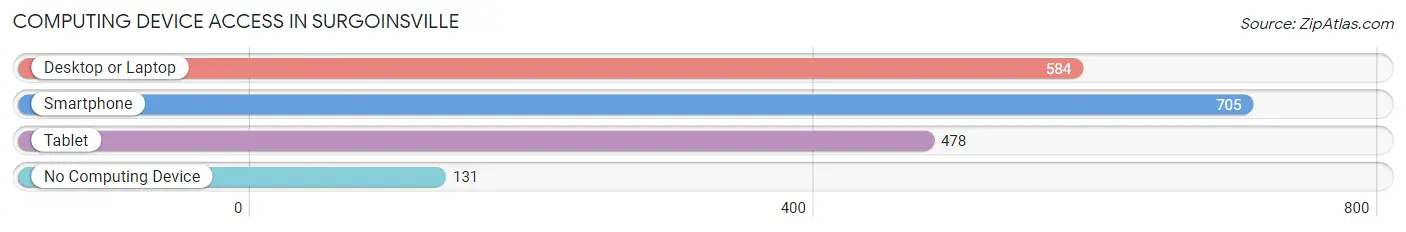
| Device Type | # Households | % Households |
| Desktop or Laptop | 584 | 66.8% |
| Smartphone | 705 | 80.7% |
| Tablet | 478 | 54.7% |
| No Computing Device | 131 | 15.0% |
| Total | 874 | 100.0% |
Internet Access in Surgoinsville
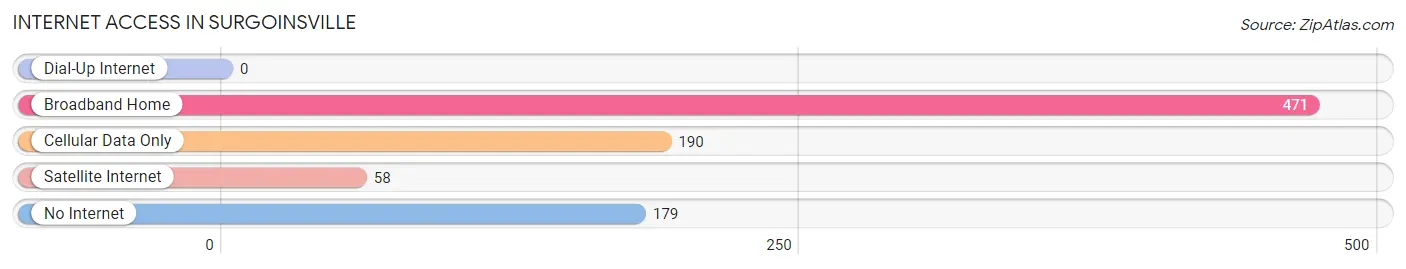
| Internet Type | # Households | % Households |
| Dial-Up Internet | 0 | 0.0% |
| Broadband Home | 471 | 53.9% |
| Cellular Data Only | 190 | 21.7% |
| Satellite Internet | 58 | 6.6% |
| No Internet | 179 | 20.5% |
| Total | 874 | 100.0% |
Surgoinsville Summary
Surgoinsville is a small town located in Hawkins County, Tennessee. It is situated along the Nolichucky River, and is part of the Kingsport-Bristol-Bristol metropolitan area. The town has a population of approximately 1,500 people, and is known for its rural charm and friendly atmosphere.
History
Surgoinsville was founded in 1810 by William Surgoin, a Revolutionary War veteran. The town was originally known as Surgoin’s Crossroads, and was a popular stop for travelers on the Great Stage Road. The town was officially incorporated in 1871, and the name was changed to Surgoinsville.
In the late 19th century, Surgoinsville was a thriving agricultural community. The town was home to several cotton mills, and the local economy was largely based on the production of cotton and tobacco. The town also had a thriving lumber industry, and was home to several sawmills.
In the early 20th century, Surgoinsville experienced a period of decline. The Great Depression hit the town hard, and many of the local businesses closed. The town’s population decreased, and the economy stagnated.
In the 1950s, the town began to experience a resurgence. The local economy was revitalized by the opening of a new paper mill, and the town’s population began to grow again. The town also experienced a period of growth in the 1970s, when several new businesses opened in the area.
Geography
Surgoinsville is located in Hawkins County, Tennessee. The town is situated along the Nolichucky River, and is part of the Kingsport-Bristol-Bristol metropolitan area. The town is located approximately 25 miles northeast of Knoxville, and is situated at an elevation of 1,000 feet.
The town is located in a hilly region of the Appalachian Mountains, and is surrounded by several small mountains. The town is located in a temperate climate, and experiences mild winters and hot summers.
Economy
The economy of Surgoinsville is largely based on agriculture and manufacturing. The town is home to several small farms, and the local economy is largely based on the production of corn, soybeans, and tobacco. The town is also home to several small manufacturing businesses, including a paper mill and a furniture factory.
The town is also home to several small retail businesses, including several antique stores and a few restaurants. The town is also home to a small airport, which serves the local area.
Demographics
As of the 2010 census, the population of Surgoinsville was 1,500 people. The town is predominantly white, with approximately 95% of the population being white. The town is also home to a small Hispanic population, with approximately 4% of the population being Hispanic.
The median household income in Surgoinsville is approximately $35,000, and the median home value is approximately $90,000. The town has a low unemployment rate, and the poverty rate is below the national average.
Conclusion
Surgoinsville is a small town located in Hawkins County, Tennessee. The town has a population of approximately 1,500 people, and is known for its rural charm and friendly atmosphere. The town’s economy is largely based on agriculture and manufacturing, and the town is home to several small retail businesses. The town is predominantly white, with a small Hispanic population. The median household income in Surgoinsville is approximately $35,000, and the median home value is approximately $90,000.
Common Questions
What is Per Capita Income in Surgoinsville?
Per Capita income in Surgoinsville is $25,852.
What is the Median Family Income in Surgoinsville?
Median Family Income in Surgoinsville is $57,181.
What is the Median Household income in Surgoinsville?
Median Household Income in Surgoinsville is $46,250.
What is Income or Wage Gap in Surgoinsville?
Income or Wage Gap in Surgoinsville is 22.8%.
Women in Surgoinsville earn 77.2 cents for every dollar earned by a man.
What is Family Income Deficit in Surgoinsville?
Family Income Deficit in Surgoinsville is $6,911.
Families that are below poverty line in Surgoinsville earn $6,911 less on average than the poverty threshold level.
What is Inequality or Gini Index in Surgoinsville?
Inequality or Gini Index in Surgoinsville is 0.46.
What is the Total Population of Surgoinsville?
Total Population of Surgoinsville is 2,316.
What is the Total Male Population of Surgoinsville?
Total Male Population of Surgoinsville is 1,065.
What is the Total Female Population of Surgoinsville?
Total Female Population of Surgoinsville is 1,251.
What is the Ratio of Males per 100 Females in Surgoinsville?
There are 85.13 Males per 100 Females in Surgoinsville.
What is the Ratio of Females per 100 Males in Surgoinsville?
There are 117.46 Females per 100 Males in Surgoinsville.
What is the Median Population Age in Surgoinsville?
Median Population Age in Surgoinsville is 43.2 Years.
What is the Average Family Size in Surgoinsville
Average Family Size in Surgoinsville is 3.2 People.
What is the Average Household Size in Surgoinsville
Average Household Size in Surgoinsville is 2.6 People.
How Large is the Labor Force in Surgoinsville?
There are 923 People in the Labor Forcein in Surgoinsville.
What is the Percentage of People in the Labor Force in Surgoinsville?
51.2% of People are in the Labor Force in Surgoinsville.
What is the Unemployment Rate in Surgoinsville?
Unemployment Rate in Surgoinsville is 3.7%.