Zip Codes with the Highest Percentage of Population Employed in Life, Physical & Social Science in Crossville, TN
RELATED REPORTS & OPTIONS
Life, Physical & Social Science
Crossville
Compare Zip Codes
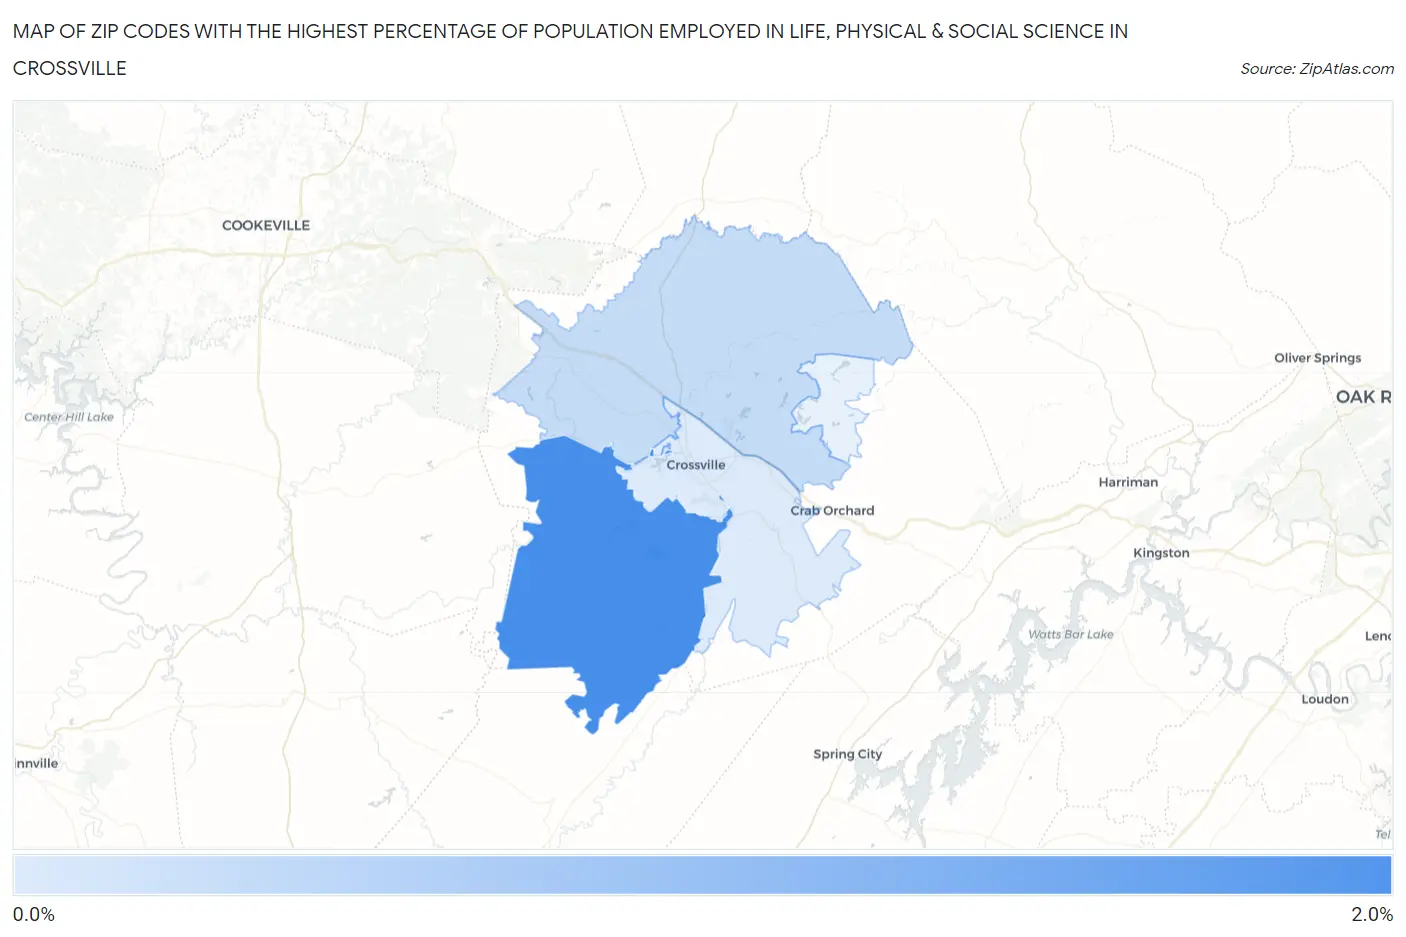
Map of Zip Codes with the Highest Percentage of Population Employed in Life, Physical & Social Science in Crossville
0.23%
2.0%
Zip Codes with the Highest Percentage of Population Employed in Life, Physical & Social Science in Crossville, TN
| Zip Code | % Employed | vs State | vs National | |
| 1. | 38572 | 2.0% | 0.83%(+1.15)#53 | 1.1%(+0.886)#3,749 |
| 2. | 38571 | 0.49% | 0.83%(-0.337)#247 | 1.1%(-0.597)#14,581 |
| 3. | 38555 | 0.23% | 0.83%(-0.598)#322 | 1.1%(-0.857)#17,823 |
1
Common Questions
What are the Top 3 Zip Codes with the Highest Percentage of Population Employed in Life, Physical & Social Science in Crossville, TN?
Top 3 Zip Codes with the Highest Percentage of Population Employed in Life, Physical & Social Science in Crossville, TN are:
What zip code has the Highest Percentage of Population Employed in Life, Physical & Social Science in Crossville, TN?
38572 has the Highest Percentage of Population Employed in Life, Physical & Social Science in Crossville, TN with 2.0%.
What is the Percentage of Population Employed in Life, Physical & Social Science in Crossville, TN?
Percentage of Population Employed in Life, Physical & Social Science in Crossville is 0.59%.
What is the Percentage of Population Employed in Life, Physical & Social Science in Tennessee?
Percentage of Population Employed in Life, Physical & Social Science in Tennessee is 0.83%.
What is the Percentage of Population Employed in Life, Physical & Social Science in the United States?
Percentage of Population Employed in Life, Physical & Social Science in the United States is 1.1%.