South Carthage, TN Map & Demographics
South Carthage Map
South Carthage Overview
$24,486
PER CAPITA INCOME
$46,912
AVG FAMILY INCOME
$45,804
AVG HOUSEHOLD INCOME
1.6%
WAGE / INCOME GAP [ % ]
98.4¢/ $1
WAGE / INCOME GAP [ $ ]
$8,863
FAMILY INCOME DEFICIT
0.41
INEQUALITY / GINI INDEX
1,698
TOTAL POPULATION
856
MALE POPULATION
842
FEMALE POPULATION
101.66
MALES / 100 FEMALES
98.36
FEMALES / 100 MALES
33.7
MEDIAN AGE
3.0
AVG FAMILY SIZE
2.5
AVG HOUSEHOLD SIZE
762
LABOR FORCE [ PEOPLE ]
57.0%
PERCENT IN LABOR FORCE
1.4%
UNEMPLOYMENT RATE
South Carthage Area Codes
Income in South Carthage
Income Overview in South Carthage
Per Capita Income in South Carthage is $24,486, while median incomes of families and households are $46,912 and $45,804 respectively.
| Characteristic | Number | Measure |
| Per Capita Income | 1,698 | $24,486 |
| Median Family Income | 494 | $46,912 |
| Mean Family Income | 494 | $60,648 |
| Median Household Income | 686 | $45,804 |
| Mean Household Income | 686 | $59,213 |
| Income Deficit | 494 | $8,863 |
| Wage / Income Gap (%) | 1,698 | 1.59% |
| Wage / Income Gap ($) | 1,698 | 98.41¢ per $1 |
| Gini / Inequality Index | 1,698 | 0.41 |
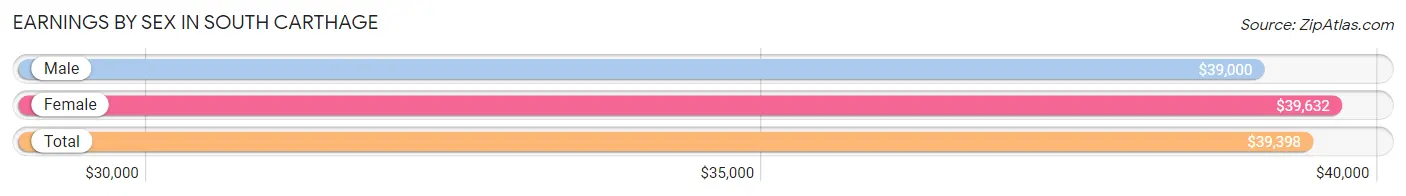
Earnings by Sex in South Carthage
Average Earnings in South Carthage are $39,398, $39,000 for men and $39,632 for women, a difference of 1.6%.
| Sex | Number | Average Earnings |
| Male | 450 (57.9%) | $39,000 |
| Female | 327 (42.1%) | $39,632 |
| Total | 777 (100.0%) | $39,398 |
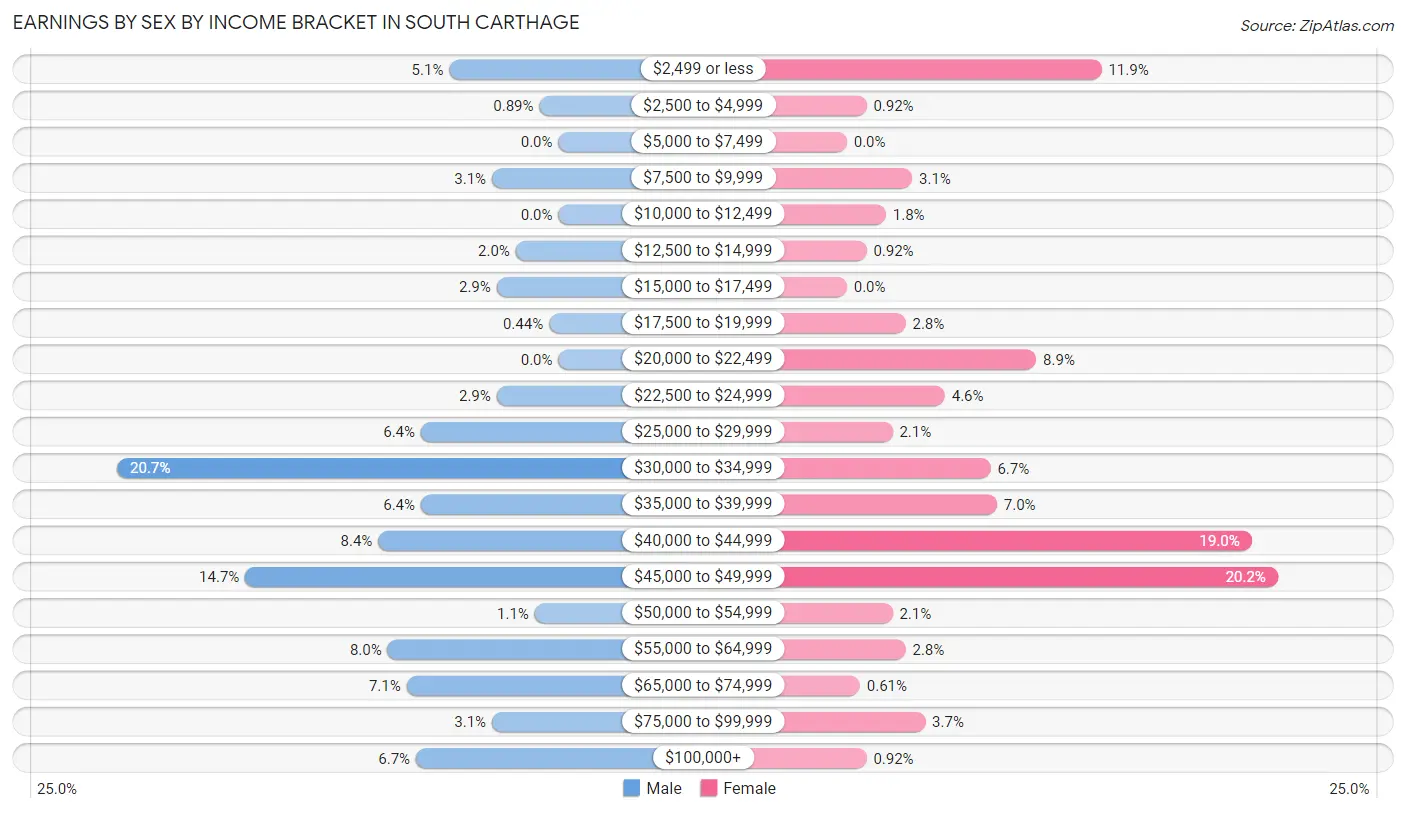
Earnings by Sex by Income Bracket in South Carthage
The most common earnings brackets in South Carthage are $30,000 to $34,999 for men (93 | 20.7%) and $45,000 to $49,999 for women (66 | 20.2%).
| Income | Male | Female |
| $2,499 or less | 23 (5.1%) | 39 (11.9%) |
| $2,500 to $4,999 | 4 (0.9%) | 3 (0.9%) |
| $5,000 to $7,499 | 0 (0.0%) | 0 (0.0%) |
| $7,500 to $9,999 | 14 (3.1%) | 10 (3.1%) |
| $10,000 to $12,499 | 0 (0.0%) | 6 (1.8%) |
| $12,500 to $14,999 | 9 (2.0%) | 3 (0.9%) |
| $15,000 to $17,499 | 13 (2.9%) | 0 (0.0%) |
| $17,500 to $19,999 | 2 (0.4%) | 9 (2.8%) |
| $20,000 to $22,499 | 0 (0.0%) | 29 (8.9%) |
| $22,500 to $24,999 | 13 (2.9%) | 15 (4.6%) |
| $25,000 to $29,999 | 29 (6.4%) | 7 (2.1%) |
| $30,000 to $34,999 | 93 (20.7%) | 22 (6.7%) |
| $35,000 to $39,999 | 29 (6.4%) | 23 (7.0%) |
| $40,000 to $44,999 | 38 (8.4%) | 62 (19.0%) |
| $45,000 to $49,999 | 66 (14.7%) | 66 (20.2%) |
| $50,000 to $54,999 | 5 (1.1%) | 7 (2.1%) |
| $55,000 to $64,999 | 36 (8.0%) | 9 (2.8%) |
| $65,000 to $74,999 | 32 (7.1%) | 2 (0.6%) |
| $75,000 to $99,999 | 14 (3.1%) | 12 (3.7%) |
| $100,000+ | 30 (6.7%) | 3 (0.9%) |
| Total | 450 (100.0%) | 327 (100.0%) |
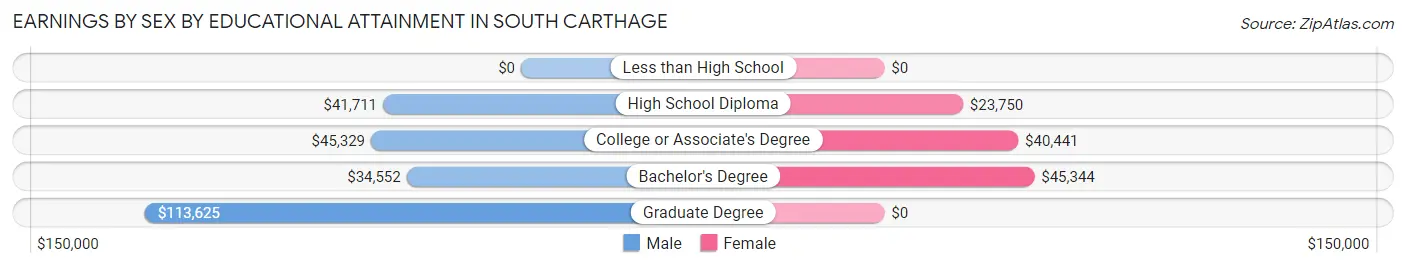
Earnings by Sex by Educational Attainment in South Carthage
Average earnings in South Carthage are $40,855 for men and $40,956 for women, a difference of 0.3%. Men with an educational attainment of graduate degree enjoy the highest average annual earnings of $113,625, while those with bachelor's degree education earn the least with $34,552. Women with an educational attainment of bachelor's degree earn the most with the average annual earnings of $45,344, while those with high school diploma education have the smallest earnings of $23,750.
| Educational Attainment | Male Income | Female Income |
| Less than High School | - | - |
| High School Diploma | $41,711 | $23,750 |
| College or Associate's Degree | $45,329 | $40,441 |
| Bachelor's Degree | $34,552 | $45,344 |
| Graduate Degree | $113,625 | $0 |
| Total | $40,855 | $40,956 |
Family Income in South Carthage
Family Income Brackets in South Carthage
According to the South Carthage family income data, there are 104 families falling into the $75,000 to $99,999 income range, which is the most common income bracket and makes up 21.0% of all families. Conversely, the $200,000+ income bracket is the least frequent group with only 9 families (1.8%) belonging to this category.
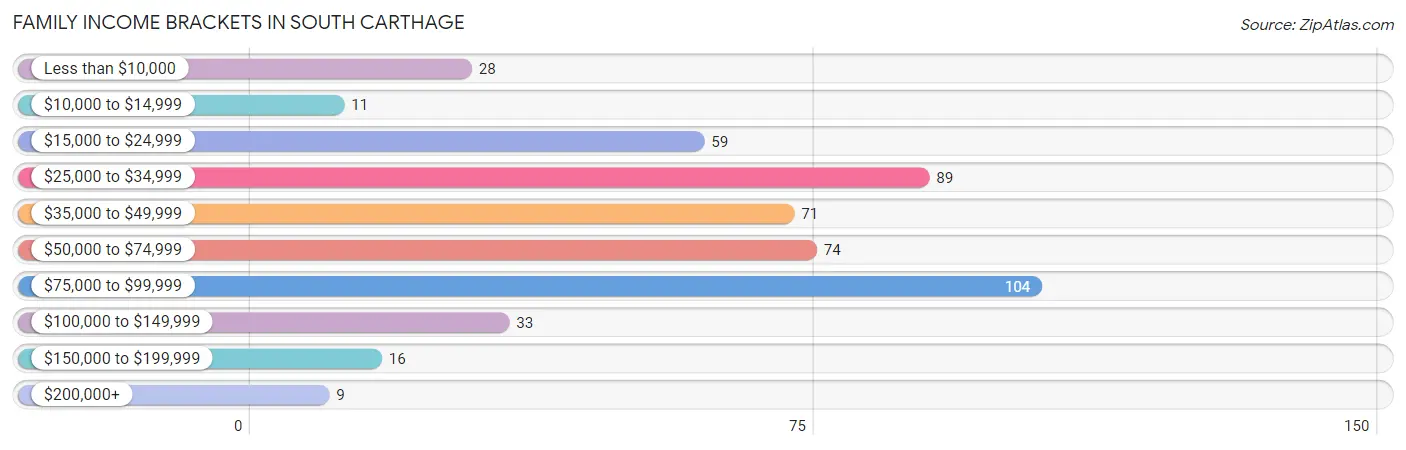
| Income Bracket | # Families | % Families |
| Less than $10,000 | 28 | 5.7% |
| $10,000 to $14,999 | 11 | 2.2% |
| $15,000 to $24,999 | 59 | 11.9% |
| $25,000 to $34,999 | 89 | 18.0% |
| $35,000 to $49,999 | 71 | 14.4% |
| $50,000 to $74,999 | 74 | 15.0% |
| $75,000 to $99,999 | 104 | 21.1% |
| $100,000 to $149,999 | 33 | 6.7% |
| $150,000 to $199,999 | 16 | 3.2% |
| $200,000+ | 9 | 1.8% |
Family Income by Famaliy Size in South Carthage
4-person families (57 | 11.5%) account for the highest median family income in South Carthage with $84,531 per family, while 2-person families (212 | 42.9%) have the highest median income of $23,750 per family member.
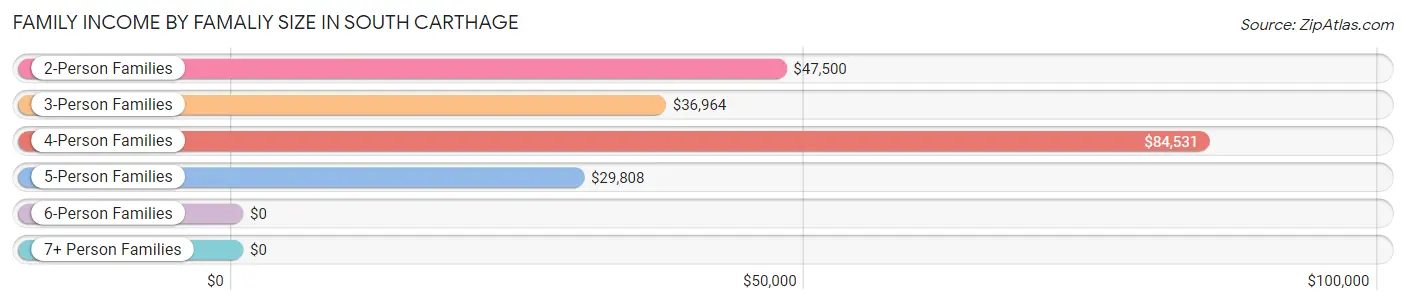
| Income Bracket | # Families | Median Income |
| 2-Person Families | 212 (42.9%) | $47,500 |
| 3-Person Families | 167 (33.8%) | $36,964 |
| 4-Person Families | 57 (11.5%) | $84,531 |
| 5-Person Families | 46 (9.3%) | $29,808 |
| 6-Person Families | 4 (0.8%) | $0 |
| 7+ Person Families | 8 (1.6%) | $0 |
| Total | 494 (100.0%) | $46,912 |
Family Income by Number of Earners in South Carthage
The median family income in South Carthage is $46,912, with families comprising 3+ earners (19) having the highest median family income of $89,464, while families with no earners (110) have the lowest median family income of $17,917, accounting for 3.8% and 22.3% of families, respectively.
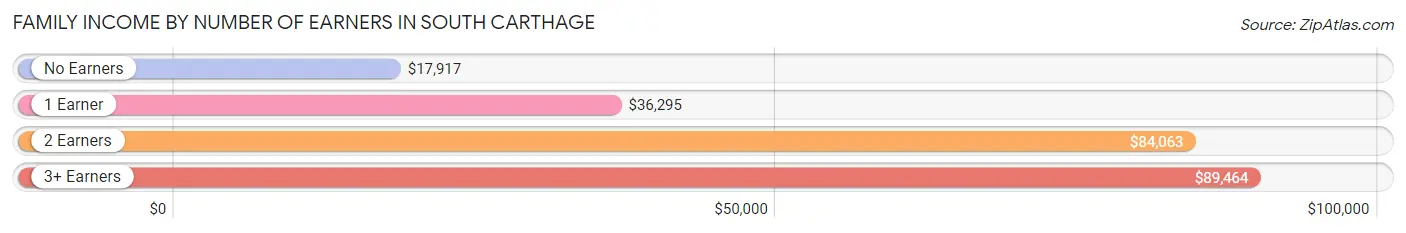
| Number of Earners | # Families | Median Income |
| No Earners | 110 (22.3%) | $17,917 |
| 1 Earner | 185 (37.4%) | $36,295 |
| 2 Earners | 180 (36.4%) | $84,063 |
| 3+ Earners | 19 (3.8%) | $89,464 |
| Total | 494 (100.0%) | $46,912 |
Household Income in South Carthage
Household Income Brackets in South Carthage
With 119 households falling in the category, the $75,000 to $99,999 income range is the most frequent in South Carthage, accounting for 17.3% of all households. In contrast, only 15 households (2.2%) fall into the $200,000+ income bracket, making it the least populous group.
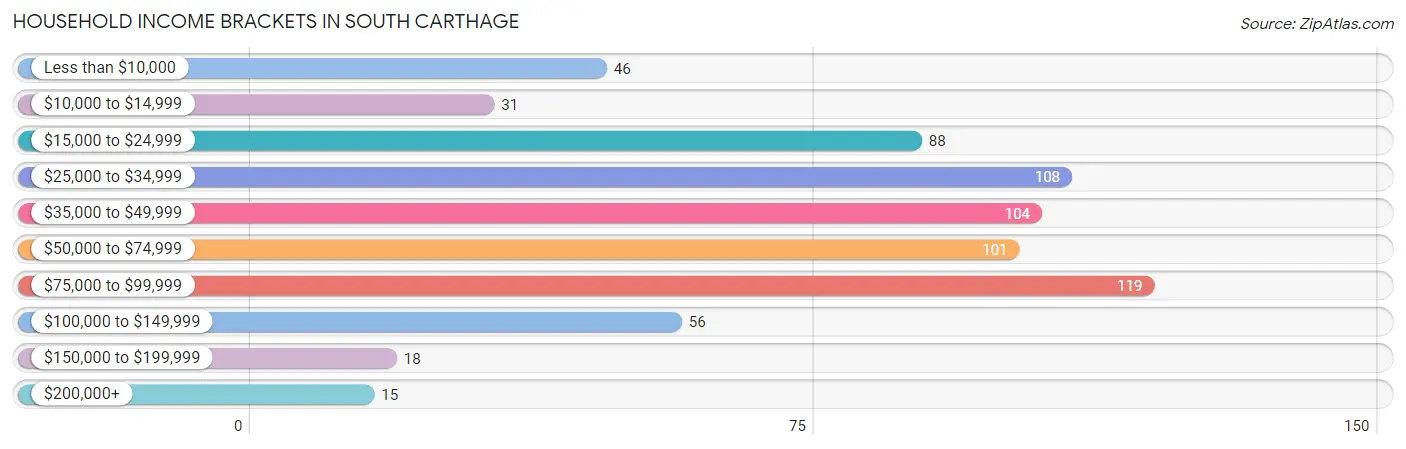
| Income Bracket | # Households | % Households |
| Less than $10,000 | 46 | 6.7% |
| $10,000 to $14,999 | 31 | 4.5% |
| $15,000 to $24,999 | 88 | 12.8% |
| $25,000 to $34,999 | 108 | 15.7% |
| $35,000 to $49,999 | 104 | 15.2% |
| $50,000 to $74,999 | 101 | 14.7% |
| $75,000 to $99,999 | 119 | 17.3% |
| $100,000 to $149,999 | 56 | 8.2% |
| $150,000 to $199,999 | 18 | 2.6% |
| $200,000+ | 15 | 2.2% |
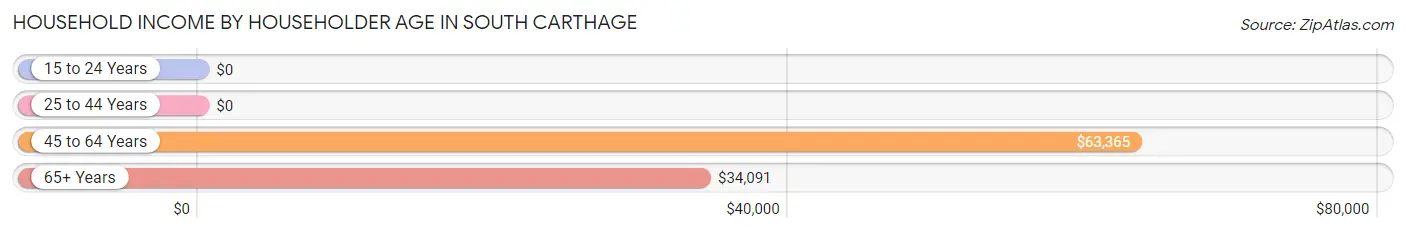
Household Income by Householder Age in South Carthage
The median household income in South Carthage is $45,804, with the highest median household income of $63,365 found in the 45 to 64 years age bracket for the primary householder. A total of 196 households (28.6%) fall into this category. Meanwhile, the 15 to 24 years age bracket for the primary householder has the lowest median household income of $0, with 42 households (6.1%) in this group.
| Income Bracket | # Households | Median Income |
| 15 to 24 Years | 42 (6.1%) | $0 |
| 25 to 44 Years | 270 (39.4%) | $0 |
| 45 to 64 Years | 196 (28.6%) | $63,365 |
| 65+ Years | 178 (26.0%) | $34,091 |
| Total | 686 (100.0%) | $45,804 |
Poverty in South Carthage
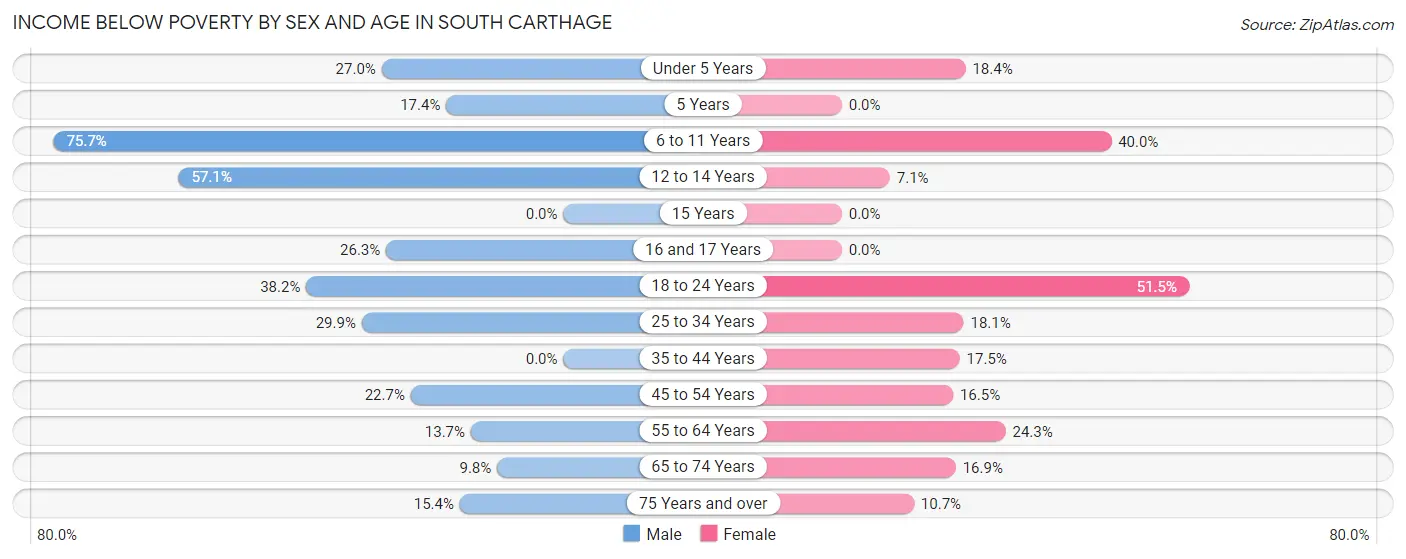
Income Below Poverty by Sex and Age in South Carthage
With 25.2% poverty level for males and 22.4% for females among the residents of South Carthage, 6 to 11 year old males and 18 to 24 year old females are the most vulnerable to poverty, with 53 males (75.7%) and 34 females (51.5%) in their respective age groups living below the poverty level.
| Age Bracket | Male | Female |
| Under 5 Years | 17 (27.0%) | 9 (18.4%) |
| 5 Years | 4 (17.4%) | 0 (0.0%) |
| 6 to 11 Years | 53 (75.7%) | 42 (40.0%) |
| 12 to 14 Years | 12 (57.1%) | 1 (7.1%) |
| 15 Years | 0 (0.0%) | 0 (0.0%) |
| 16 and 17 Years | 10 (26.3%) | 0 (0.0%) |
| 18 to 24 Years | 21 (38.2%) | 34 (51.5%) |
| 25 to 34 Years | 47 (29.9%) | 32 (18.1%) |
| 35 to 44 Years | 0 (0.0%) | 14 (17.5%) |
| 45 to 54 Years | 29 (22.7%) | 18 (16.5%) |
| 55 to 64 Years | 7 (13.7%) | 18 (24.3%) |
| 65 to 74 Years | 6 (9.8%) | 11 (16.9%) |
| 75 Years and over | 10 (15.4%) | 9 (10.7%) |
| Total | 216 (25.2%) | 188 (22.4%) |
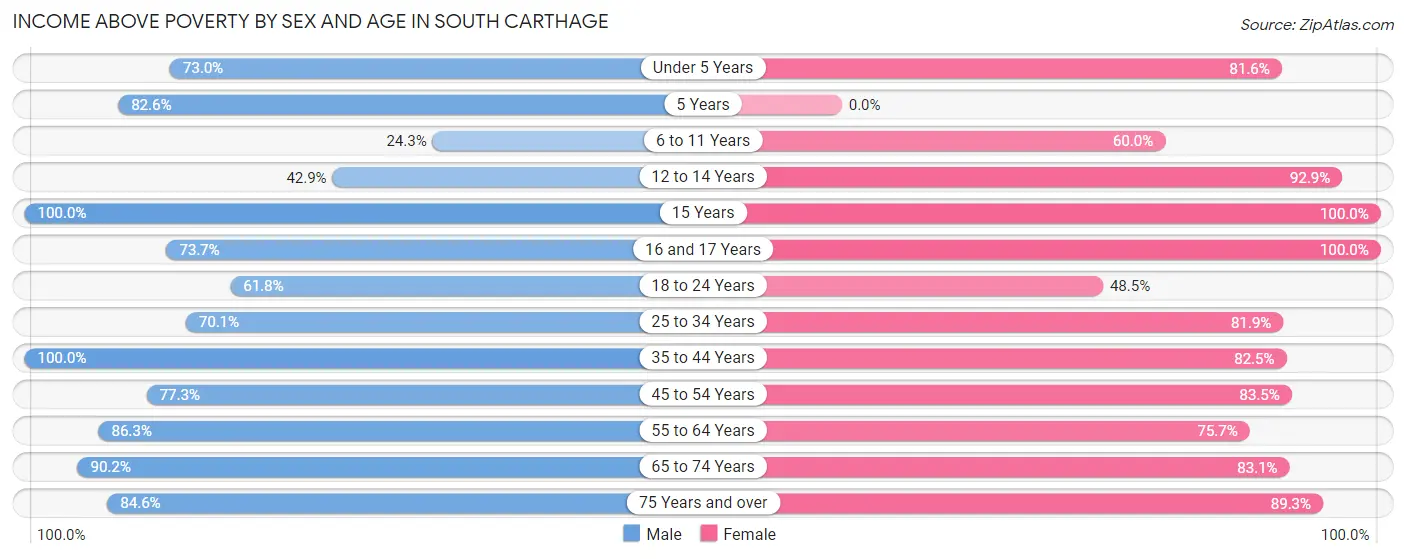
Income Above Poverty by Sex and Age in South Carthage
According to the poverty statistics in South Carthage, males aged 15 years and females aged 15 years are the age groups that are most secure financially, with 100.0% of males and 100.0% of females in these age groups living above the poverty line.
| Age Bracket | Male | Female |
| Under 5 Years | 46 (73.0%) | 40 (81.6%) |
| 5 Years | 19 (82.6%) | 0 (0.0%) |
| 6 to 11 Years | 17 (24.3%) | 63 (60.0%) |
| 12 to 14 Years | 9 (42.9%) | 13 (92.9%) |
| 15 Years | 6 (100.0%) | 9 (100.0%) |
| 16 and 17 Years | 28 (73.7%) | 8 (100.0%) |
| 18 to 24 Years | 34 (61.8%) | 32 (48.5%) |
| 25 to 34 Years | 110 (70.1%) | 145 (81.9%) |
| 35 to 44 Years | 118 (100.0%) | 66 (82.5%) |
| 45 to 54 Years | 99 (77.3%) | 91 (83.5%) |
| 55 to 64 Years | 44 (86.3%) | 56 (75.7%) |
| 65 to 74 Years | 55 (90.2%) | 54 (83.1%) |
| 75 Years and over | 55 (84.6%) | 75 (89.3%) |
| Total | 640 (74.8%) | 652 (77.6%) |
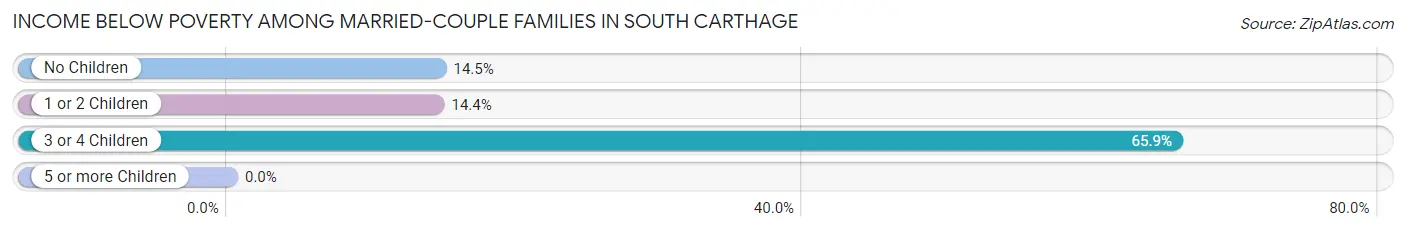
Income Below Poverty Among Married-Couple Families in South Carthage
The poverty statistics for married-couple families in South Carthage show that 20.0% or 76 of the total 380 families live below the poverty line. Families with 3 or 4 children have the highest poverty rate of 65.8%, comprising of 27 families. On the other hand, families with 1 or 2 children have the lowest poverty rate of 14.4%, which includes 22 families.
| Children | Above Poverty | Below Poverty |
| No Children | 159 (85.5%) | 27 (14.5%) |
| 1 or 2 Children | 131 (85.6%) | 22 (14.4%) |
| 3 or 4 Children | 14 (34.2%) | 27 (65.8%) |
| 5 or more Children | 0 (0.0%) | 0 (0.0%) |
| Total | 304 (80.0%) | 76 (20.0%) |
Income Below Poverty Among Single-Parent Households in South Carthage
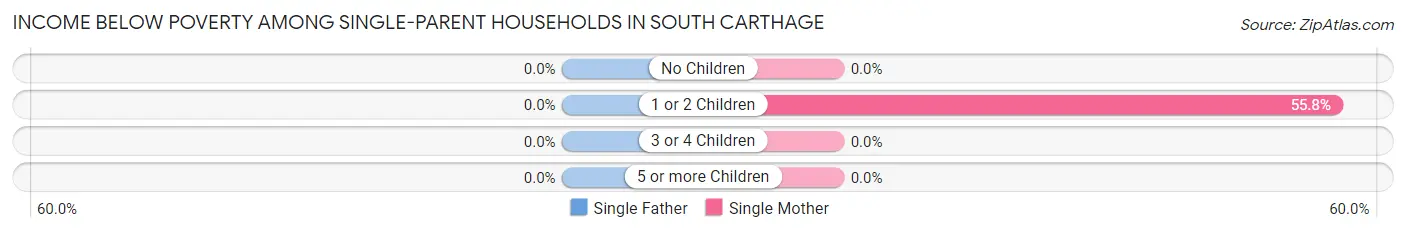
| Children | Single Father | Single Mother |
| No Children | 0 (0.0%) | 0 (0.0%) |
| 1 or 2 Children | 0 (0.0%) | 29 (55.8%) |
| 3 or 4 Children | 0 (0.0%) | 0 (0.0%) |
| 5 or more Children | 0 (0.0%) | 0 (0.0%) |
| Total | 0 (0.0%) | 29 (32.6%) |
Income Below Poverty Among Married-Couple vs Single-Parent Households in South Carthage
The poverty data for South Carthage shows that 76 of the married-couple family households (20.0%) and 29 of the single-parent households (25.4%) are living below the poverty level. Within the married-couple family households, those with 3 or 4 children have the highest poverty rate, with 27 households (65.8%) falling below the poverty line. Among the single-parent households, those with 1 or 2 children have the highest poverty rate, with 29 household (42.0%) living below poverty.
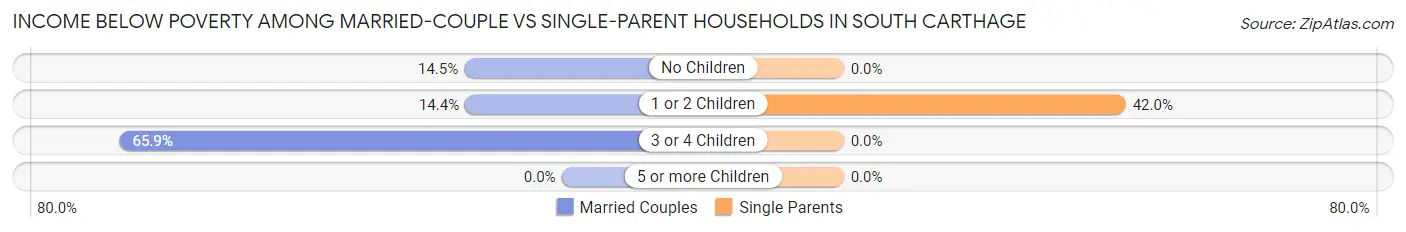
| Children | Married-Couple Families | Single-Parent Households |
| No Children | 27 (14.5%) | 0 (0.0%) |
| 1 or 2 Children | 22 (14.4%) | 29 (42.0%) |
| 3 or 4 Children | 27 (65.8%) | 0 (0.0%) |
| 5 or more Children | 0 (0.0%) | 0 (0.0%) |
| Total | 76 (20.0%) | 29 (25.4%) |
Race in South Carthage
The most populous races in South Carthage are White / Caucasian (1,667 | 98.2%), Two or more Races (17 | 1.0%), and Black / African American (13 | 0.8%).
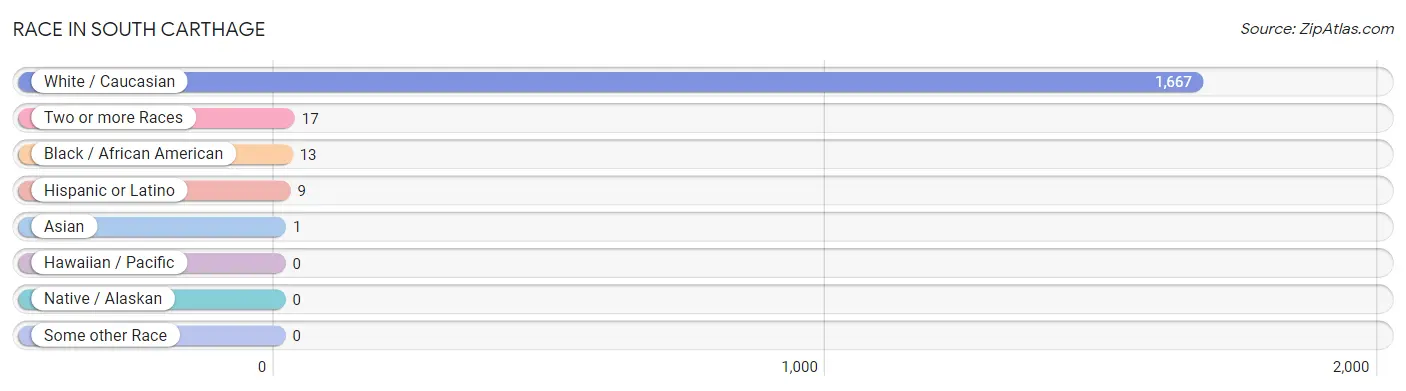
| Race | # Population | % Population |
| Asian | 1 | 0.1% |
| Black / African American | 13 | 0.8% |
| Hawaiian / Pacific | 0 | 0.0% |
| Hispanic or Latino | 9 | 0.5% |
| Native / Alaskan | 0 | 0.0% |
| White / Caucasian | 1,667 | 98.2% |
| Two or more Races | 17 | 1.0% |
| Some other Race | 0 | 0.0% |
| Total | 1,698 | 100.0% |
Ancestry in South Carthage
The most populous ancestries reported in South Carthage are American (288 | 17.0%), Irish (148 | 8.7%), English (116 | 6.8%), German (115 | 6.8%), and French (44 | 2.6%), together accounting for 41.9% of all South Carthage residents.
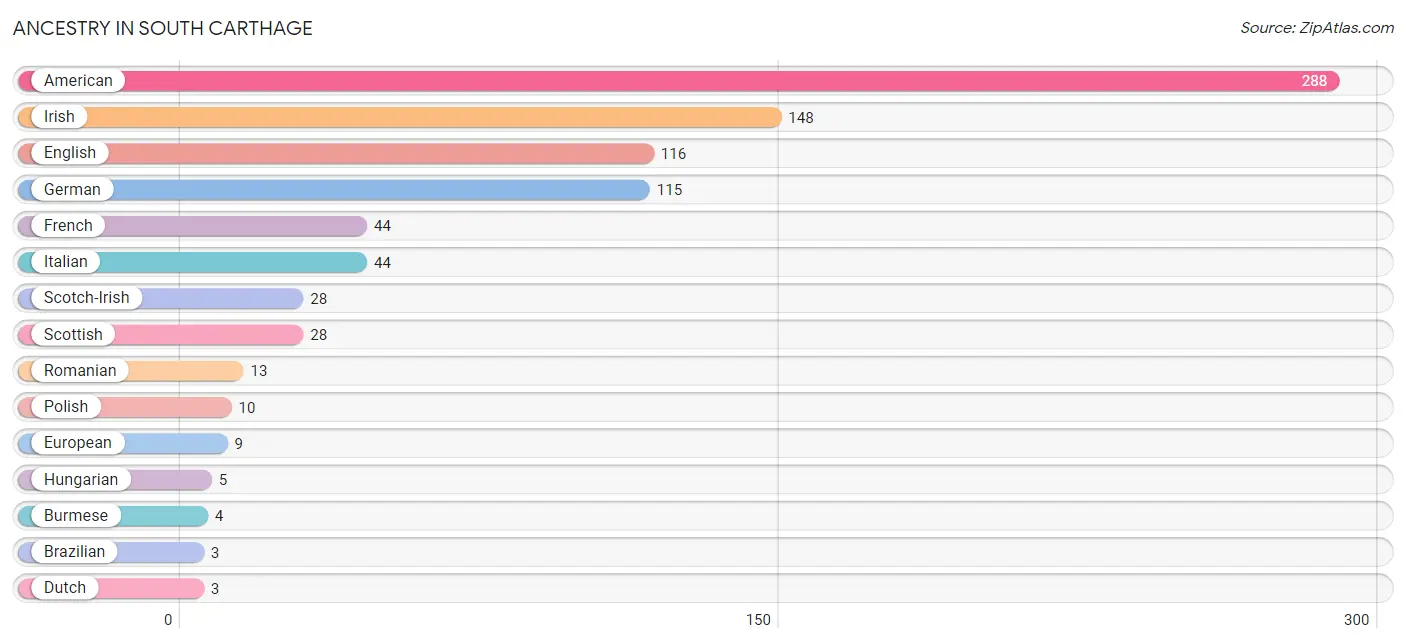
| Ancestry | # Population | % Population |
| American | 288 | 17.0% |
| Brazilian | 3 | 0.2% |
| Burmese | 4 | 0.2% |
| Cherokee | 2 | 0.1% |
| Choctaw | 1 | 0.1% |
| Dutch | 3 | 0.2% |
| English | 116 | 6.8% |
| European | 9 | 0.5% |
| Finnish | 2 | 0.1% |
| French | 44 | 2.6% |
| German | 115 | 6.8% |
| Haitian | 2 | 0.1% |
| Hungarian | 5 | 0.3% |
| Irish | 148 | 8.7% |
| Italian | 44 | 2.6% |
| Korean | 1 | 0.1% |
| Mexican | 3 | 0.2% |
| Polish | 10 | 0.6% |
| Romanian | 13 | 0.8% |
| Scotch-Irish | 28 | 1.7% |
| Scottish | 28 | 1.7% | View All 21 Rows |
Immigrants in South Carthage
The most numerous immigrant groups reported in South Carthage came from Brazil (3 | 0.2%), Latin America (3 | 0.2%), South America (3 | 0.2%), Europe (2 | 0.1%), and Germany (2 | 0.1%), together accounting for 0.8% of all South Carthage residents.
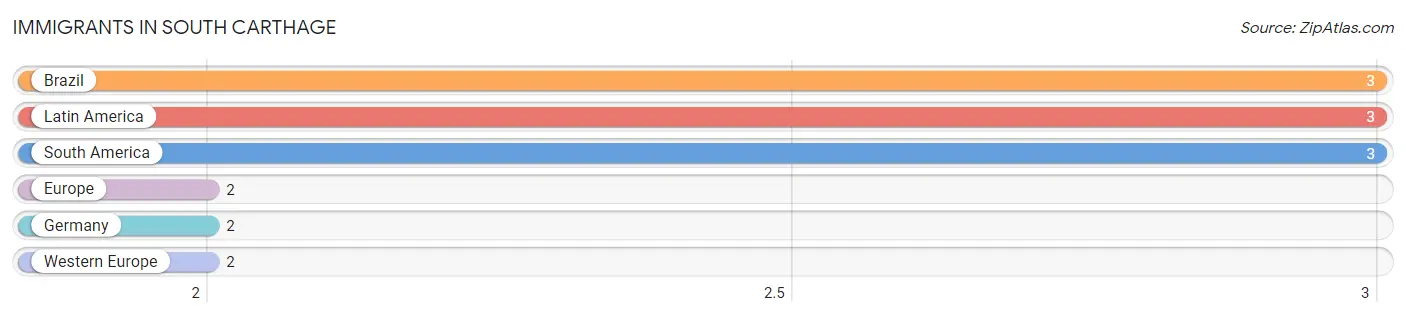
| Immigration Origin | # Population | % Population |
| Brazil | 3 | 0.2% |
| Europe | 2 | 0.1% |
| Germany | 2 | 0.1% |
| Latin America | 3 | 0.2% |
| South America | 3 | 0.2% |
| Western Europe | 2 | 0.1% | View All 6 Rows |
Sex and Age in South Carthage
Sex and Age in South Carthage
The most populous age groups in South Carthage are 25 to 29 Years (124 | 14.5%) for men and 25 to 29 Years (134 | 15.9%) for women.
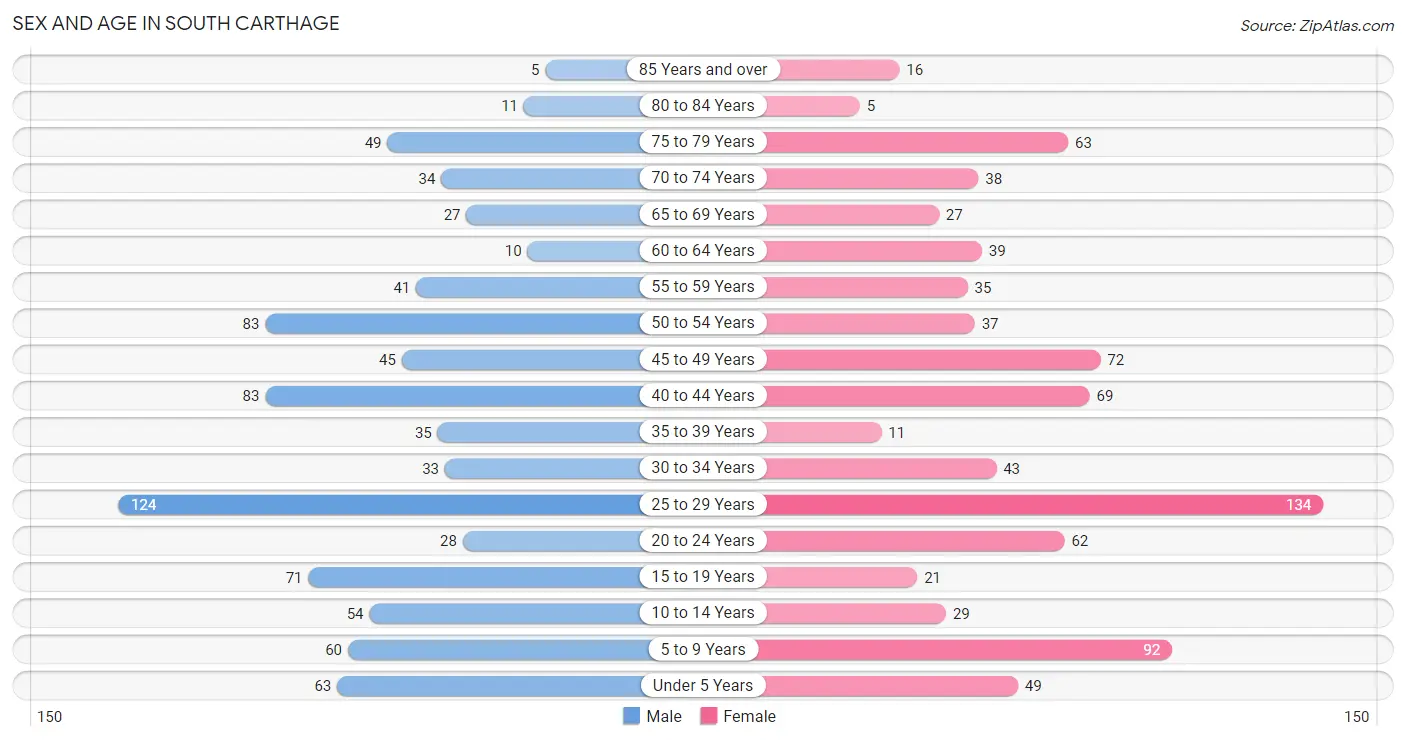
| Age Bracket | Male | Female |
| Under 5 Years | 63 (7.4%) | 49 (5.8%) |
| 5 to 9 Years | 60 (7.0%) | 92 (10.9%) |
| 10 to 14 Years | 54 (6.3%) | 29 (3.4%) |
| 15 to 19 Years | 71 (8.3%) | 21 (2.5%) |
| 20 to 24 Years | 28 (3.3%) | 62 (7.4%) |
| 25 to 29 Years | 124 (14.5%) | 134 (15.9%) |
| 30 to 34 Years | 33 (3.9%) | 43 (5.1%) |
| 35 to 39 Years | 35 (4.1%) | 11 (1.3%) |
| 40 to 44 Years | 83 (9.7%) | 69 (8.2%) |
| 45 to 49 Years | 45 (5.3%) | 72 (8.6%) |
| 50 to 54 Years | 83 (9.7%) | 37 (4.4%) |
| 55 to 59 Years | 41 (4.8%) | 35 (4.2%) |
| 60 to 64 Years | 10 (1.2%) | 39 (4.6%) |
| 65 to 69 Years | 27 (3.2%) | 27 (3.2%) |
| 70 to 74 Years | 34 (4.0%) | 38 (4.5%) |
| 75 to 79 Years | 49 (5.7%) | 63 (7.5%) |
| 80 to 84 Years | 11 (1.3%) | 5 (0.6%) |
| 85 Years and over | 5 (0.6%) | 16 (1.9%) |
| Total | 856 (100.0%) | 842 (100.0%) |
Families and Households in South Carthage
Median Family Size in South Carthage
The median family size in South Carthage is 2.96 persons per family, with married-couple families (380 | 76.9%) accounting for the largest median family size of 3.14 persons per family. On the other hand, single female/mother families (89 | 18.0%) represent the smallest median family size with 2.29 persons per family.
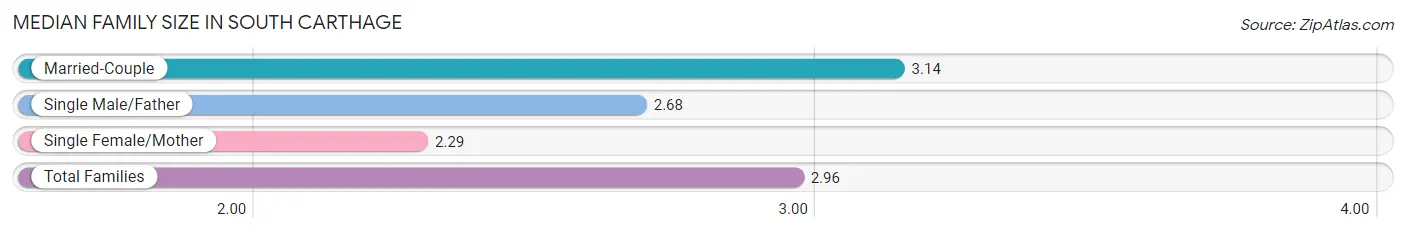
| Family Type | # Families | Family Size |
| Married-Couple | 380 (76.9%) | 3.14 |
| Single Male/Father | 25 (5.1%) | 2.68 |
| Single Female/Mother | 89 (18.0%) | 2.29 |
| Total Families | 494 (100.0%) | 2.96 |
Median Household Size in South Carthage
The median household size in South Carthage is 2.47 persons per household, with married-couple households (380 | 55.4%) accounting for the largest median household size of 3.15 persons per household. non-family households (192 | 28.0%) represent the smallest median household size with 1.12 persons per household.
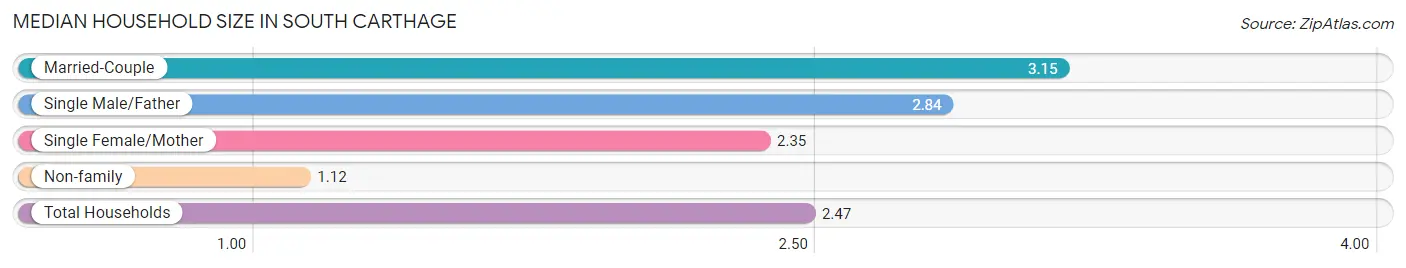
| Household Type | # Households | Household Size |
| Married-Couple | 380 (55.4%) | 3.15 |
| Single Male/Father | 25 (3.6%) | 2.84 |
| Single Female/Mother | 89 (13.0%) | 2.35 |
| Non-family | 192 (28.0%) | 1.12 |
| Total Households | 686 (100.0%) | 2.47 |
Household Size by Marriage Status in South Carthage
Out of a total of 686 households in South Carthage, 494 (72.0%) are family households, while 192 (28.0%) are nonfamily households. The most numerous type of family households are 2-person households, comprising 207, and the most common type of nonfamily households are 1-person households, comprising 170.
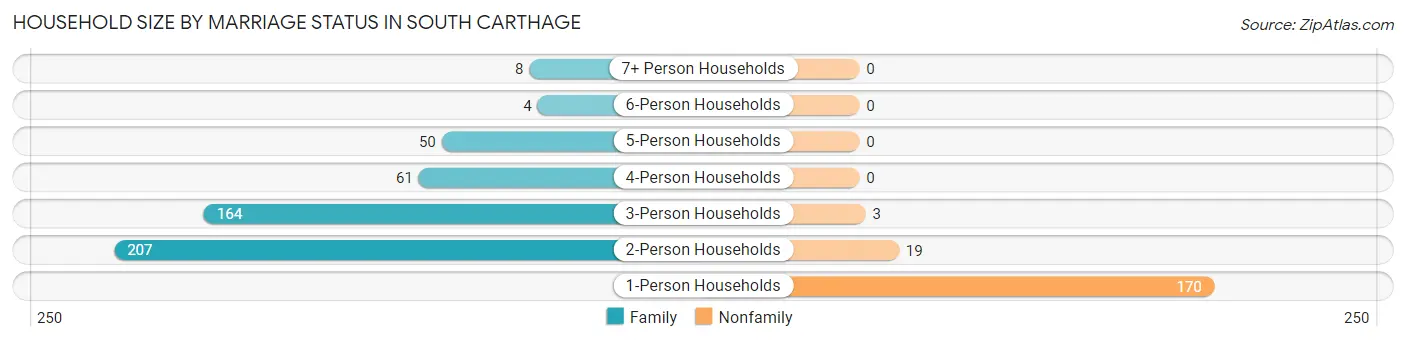
| Household Size | Family Households | Nonfamily Households |
| 1-Person Households | - | 170 (24.8%) |
| 2-Person Households | 207 (30.2%) | 19 (2.8%) |
| 3-Person Households | 164 (23.9%) | 3 (0.4%) |
| 4-Person Households | 61 (8.9%) | 0 (0.0%) |
| 5-Person Households | 50 (7.3%) | 0 (0.0%) |
| 6-Person Households | 4 (0.6%) | 0 (0.0%) |
| 7+ Person Households | 8 (1.2%) | 0 (0.0%) |
| Total | 494 (72.0%) | 192 (28.0%) |
Female Fertility in South Carthage
Fertility by Age in South Carthage
Average fertility rate in South Carthage is 187.0 births per 1,000 women. Women in the age bracket of 20 to 34 years have the highest fertility rate with 318.0 births per 1,000 women. Women in the age bracket of 20 to 34 years acount for 96.2% of all women with births.
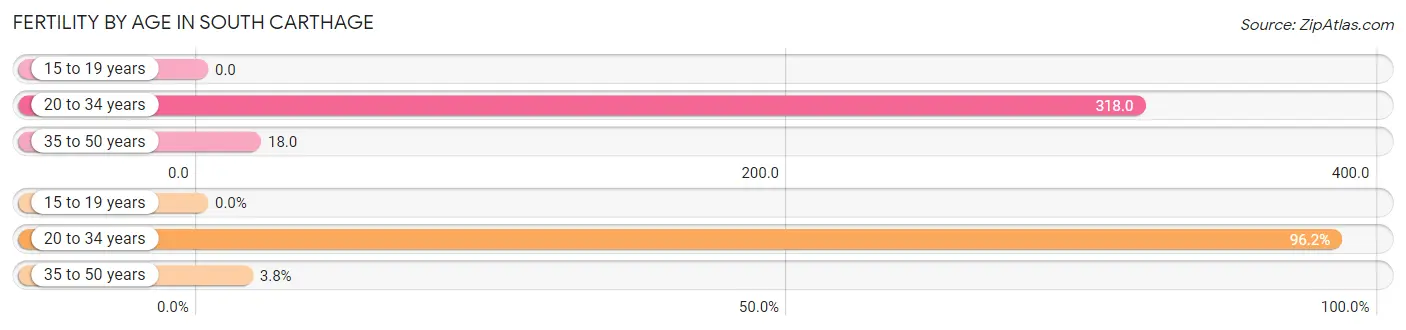
| Age Bracket | Women with Births | Births / 1,000 Women |
| 15 to 19 years | 0 (0.0%) | 0.0 |
| 20 to 34 years | 76 (96.2%) | 318.0 |
| 35 to 50 years | 3 (3.8%) | 18.0 |
| Total | 79 (100.0%) | 187.0 |
Fertility by Age by Marriage Status in South Carthage
92.4% of women with births (79) in South Carthage are married. The highest percentage of unmarried women with births falls into 20 to 34 years age bracket with 7.9% of them unmarried at the time of birth, while the lowest percentage of unmarried women with births belong to 35 to 50 years age bracket with 0.0% of them unmarried.
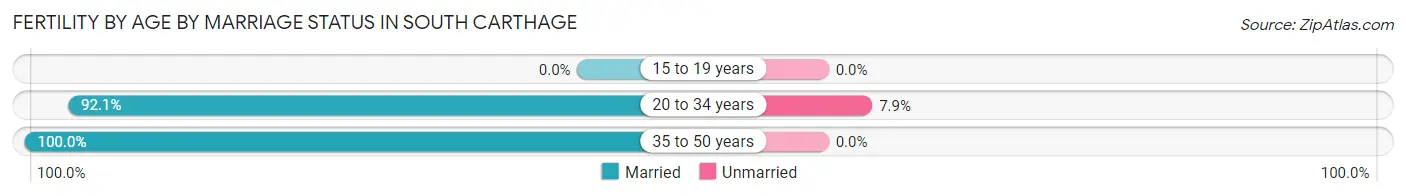
| Age Bracket | Married | Unmarried |
| 15 to 19 years | 0 (0.0%) | 0 (0.0%) |
| 20 to 34 years | 70 (92.1%) | 6 (7.9%) |
| 35 to 50 years | 3 (100.0%) | 0 (0.0%) |
| Total | 73 (92.4%) | 6 (7.6%) |
Fertility by Education in South Carthage
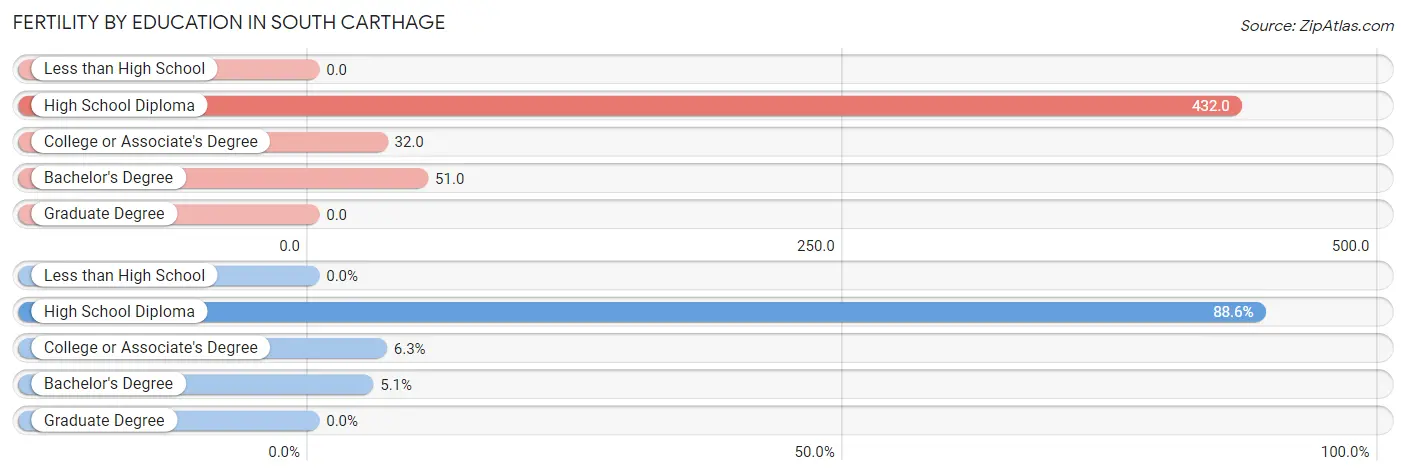
| Educational Attainment | Women with Births | Births / 1,000 Women |
| Less than High School | 0 (0.0%) | 0.0 |
| High School Diploma | 70 (88.6%) | 432.0 |
| College or Associate's Degree | 5 (6.3%) | 32.0 |
| Bachelor's Degree | 4 (5.1%) | 51.0 |
| Graduate Degree | 0 (0.0%) | 0.0 |
| Total | 79 (100.0%) | 187.0 |
Fertility by Education by Marriage Status in South Carthage
7.6% of women with births in South Carthage are unmarried. Women with the educational attainment of college or associate's degree are most likely to be married with 100.0% of them married at childbirth, while women with the educational attainment of high school diploma are least likely to be married with 8.6% of them unmarried at childbirth.
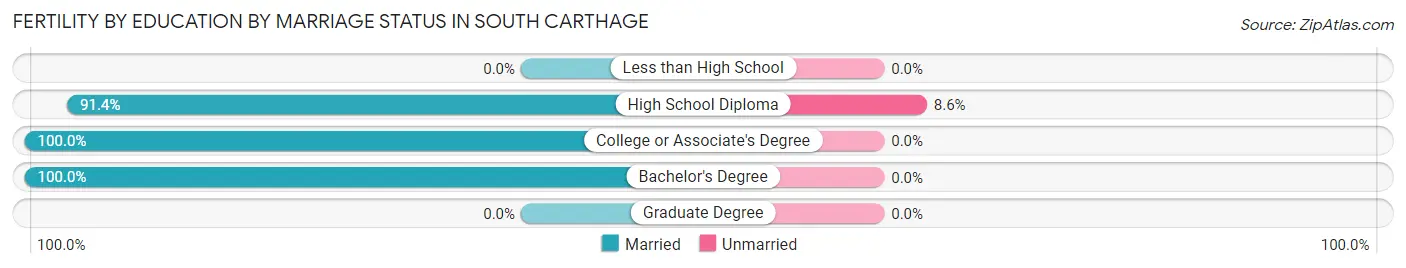
| Educational Attainment | Married | Unmarried |
| Less than High School | 0 (0.0%) | 0 (0.0%) |
| High School Diploma | 64 (91.4%) | 6 (8.6%) |
| College or Associate's Degree | 5 (100.0%) | 0 (0.0%) |
| Bachelor's Degree | 4 (100.0%) | 0 (0.0%) |
| Graduate Degree | 0 (0.0%) | 0 (0.0%) |
| Total | 73 (92.4%) | 6 (7.6%) |
Employment Characteristics in South Carthage
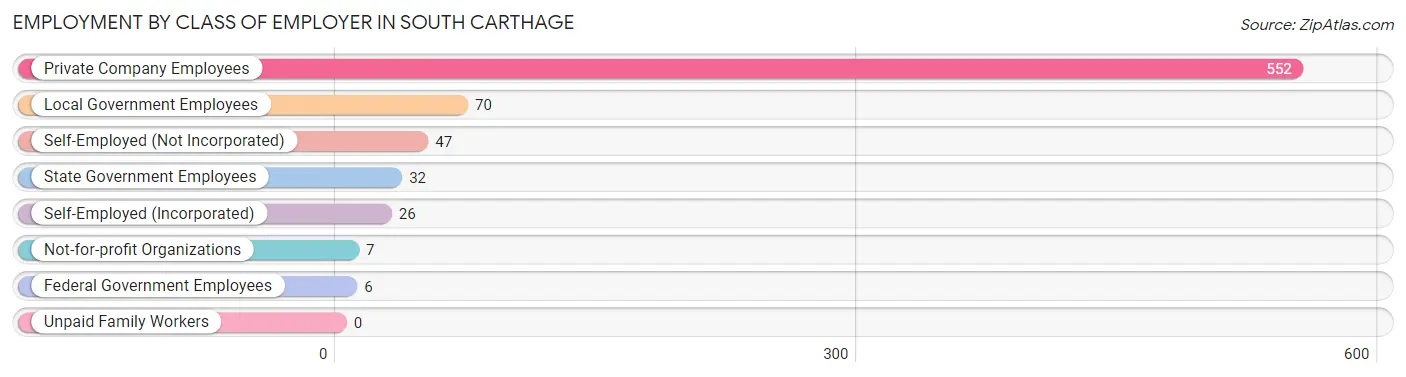
Employment by Class of Employer in South Carthage
Among the 740 employed individuals in South Carthage, private company employees (552 | 74.6%), local government employees (70 | 9.5%), and self-employed (not incorporated) (47 | 6.4%) make up the most common classes of employment.
| Employer Class | # Employees | % Employees |
| Private Company Employees | 552 | 74.6% |
| Self-Employed (Incorporated) | 26 | 3.5% |
| Self-Employed (Not Incorporated) | 47 | 6.4% |
| Not-for-profit Organizations | 7 | 0.9% |
| Local Government Employees | 70 | 9.5% |
| State Government Employees | 32 | 4.3% |
| Federal Government Employees | 6 | 0.8% |
| Unpaid Family Workers | 0 | 0.0% |
| Total | 740 | 100.0% |
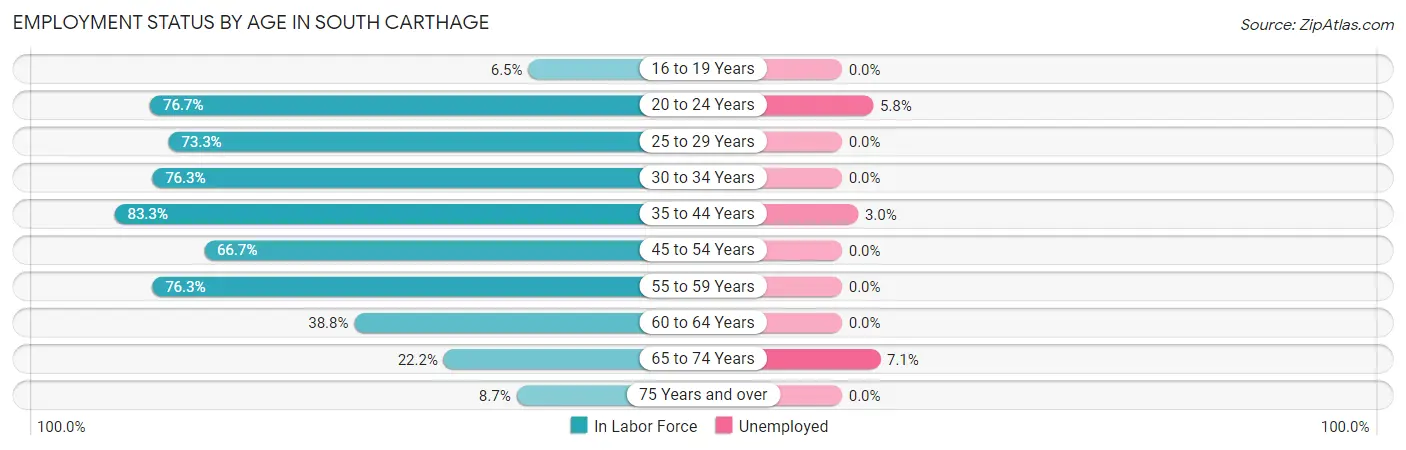
Employment Status by Age in South Carthage
According to the labor force statistics for South Carthage, out of the total population over 16 years of age (1,336), 57.0% or 762 individuals are in the labor force, with 1.4% or 11 of them unemployed. The age group with the highest labor force participation rate is 35 to 44 years, with 83.3% or 165 individuals in the labor force. Within the labor force, the 65 to 74 years age range has the highest percentage of unemployed individuals, with 7.1% or 2 of them being unemployed.
| Age Bracket | In Labor Force | Unemployed |
| 16 to 19 Years | 5 (6.5%) | 0 (0.0%) |
| 20 to 24 Years | 69 (76.7%) | 4 (5.8%) |
| 25 to 29 Years | 189 (73.3%) | 0 (0.0%) |
| 30 to 34 Years | 58 (76.3%) | 0 (0.0%) |
| 35 to 44 Years | 165 (83.3%) | 5 (3.0%) |
| 45 to 54 Years | 158 (66.7%) | 0 (0.0%) |
| 55 to 59 Years | 58 (76.3%) | 0 (0.0%) |
| 60 to 64 Years | 19 (38.8%) | 0 (0.0%) |
| 65 to 74 Years | 28 (22.2%) | 2 (7.1%) |
| 75 Years and over | 13 (8.7%) | 0 (0.0%) |
| Total | 762 (57.0%) | 11 (1.4%) |
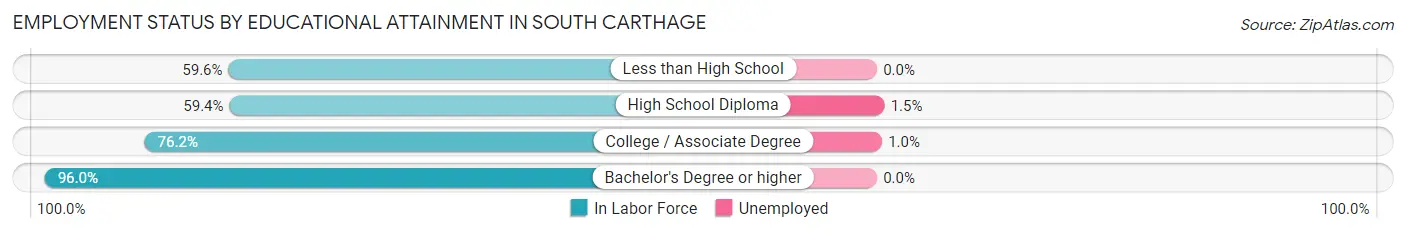
Employment Status by Educational Attainment in South Carthage
According to labor force statistics for South Carthage, 72.4% of individuals (647) out of the total population between 25 and 64 years of age (894) are in the labor force, with 0.8% or 5 of them being unemployed. The group with the highest labor force participation rate are those with the educational attainment of bachelor's degree or higher, with 96.0% or 193 individuals in the labor force. Within the labor force, individuals with high school diploma education have the highest percentage of unemployment, with 1.5% or 3 of them being unemployed.
| Educational Attainment | In Labor Force | Unemployed |
| Less than High School | 59 (59.6%) | 0 (0.0%) |
| High School Diploma | 203 (59.4%) | 5 (1.5%) |
| College / Associate Degree | 192 (76.2%) | 3 (1.0%) |
| Bachelor's Degree or higher | 193 (96.0%) | 0 (0.0%) |
| Total | 647 (72.4%) | 7 (0.8%) |
Employment Occupations by Sex in South Carthage
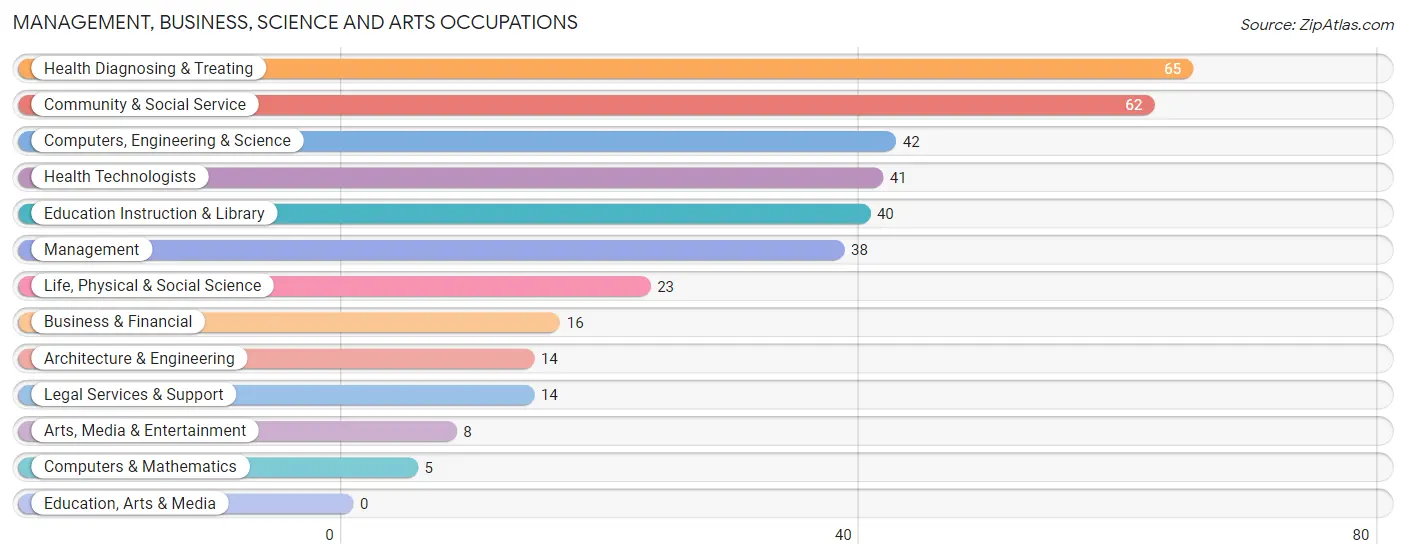
Management, Business, Science and Arts Occupations
The most common Management, Business, Science and Arts occupations in South Carthage are Health Diagnosing & Treating (65 | 8.7%), Community & Social Service (62 | 8.3%), Computers, Engineering & Science (42 | 5.6%), Health Technologists (41 | 5.5%), and Education Instruction & Library (40 | 5.3%).
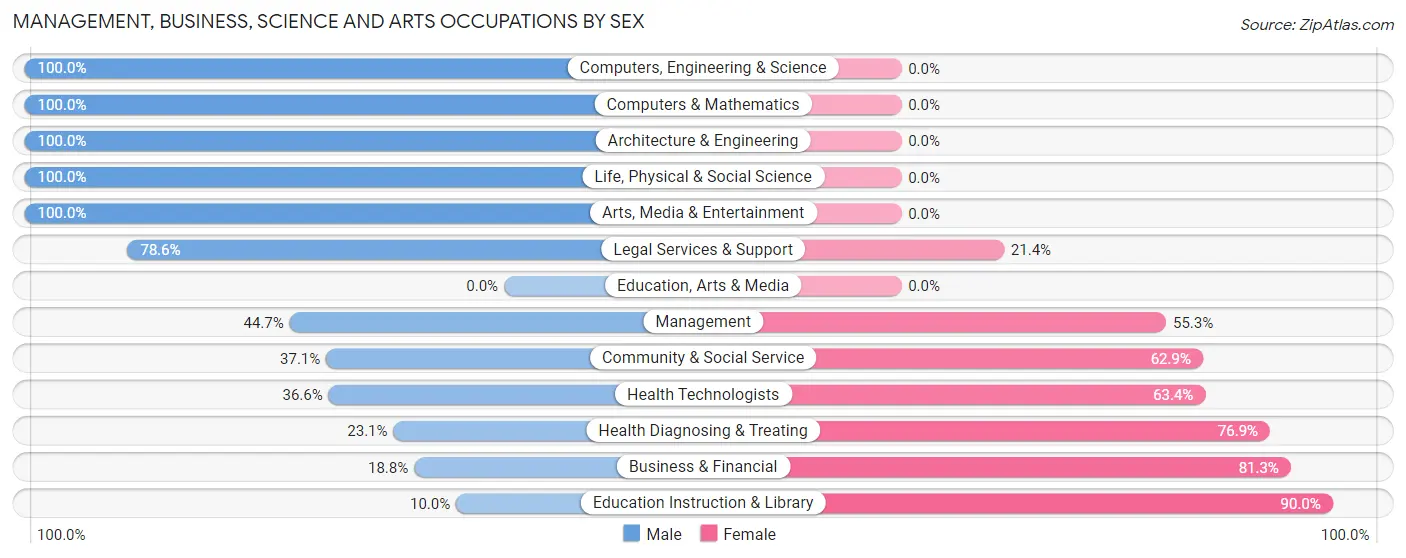
Management, Business, Science and Arts Occupations by Sex
Within the Management, Business, Science and Arts occupations in South Carthage, the most male-oriented occupations are Computers, Engineering & Science (100.0%), Computers & Mathematics (100.0%), and Architecture & Engineering (100.0%), while the most female-oriented occupations are Education Instruction & Library (90.0%), Business & Financial (81.2%), and Health Diagnosing & Treating (76.9%).
| Occupation | Male | Female |
| Management | 17 (44.7%) | 21 (55.3%) |
| Business & Financial | 3 (18.8%) | 13 (81.2%) |
| Computers, Engineering & Science | 42 (100.0%) | 0 (0.0%) |
| Computers & Mathematics | 5 (100.0%) | 0 (0.0%) |
| Architecture & Engineering | 14 (100.0%) | 0 (0.0%) |
| Life, Physical & Social Science | 23 (100.0%) | 0 (0.0%) |
| Community & Social Service | 23 (37.1%) | 39 (62.9%) |
| Education, Arts & Media | 0 (0.0%) | 0 (0.0%) |
| Legal Services & Support | 11 (78.6%) | 3 (21.4%) |
| Education Instruction & Library | 4 (10.0%) | 36 (90.0%) |
| Arts, Media & Entertainment | 8 (100.0%) | 0 (0.0%) |
| Health Diagnosing & Treating | 15 (23.1%) | 50 (76.9%) |
| Health Technologists | 15 (36.6%) | 26 (63.4%) |
| Total (Category) | 100 (44.8%) | 123 (55.2%) |
| Total (Overall) | 440 (58.6%) | 311 (41.4%) |
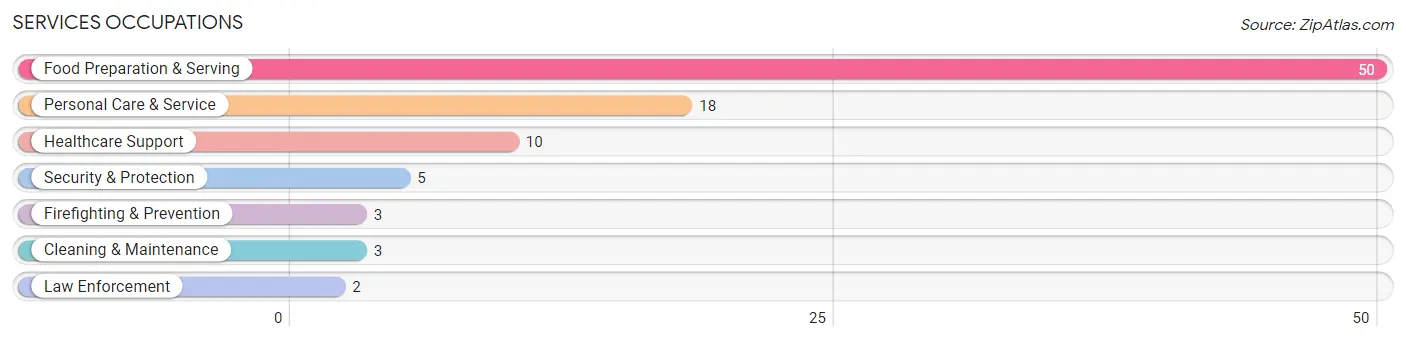
Services Occupations
The most common Services occupations in South Carthage are Food Preparation & Serving (50 | 6.7%), Personal Care & Service (18 | 2.4%), Healthcare Support (10 | 1.3%), Security & Protection (5 | 0.7%), and Firefighting & Prevention (3 | 0.4%).
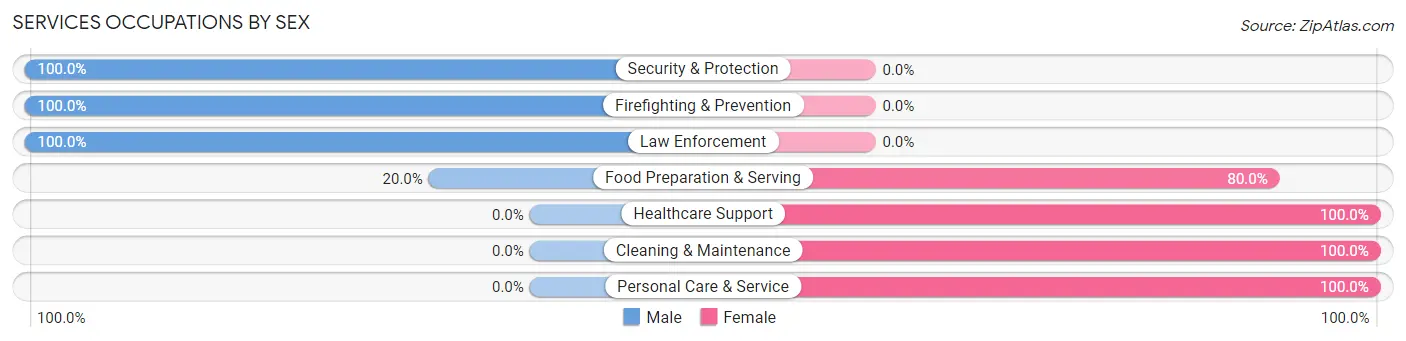
Services Occupations by Sex
Within the Services occupations in South Carthage, the most male-oriented occupations are Security & Protection (100.0%), Firefighting & Prevention (100.0%), and Law Enforcement (100.0%), while the most female-oriented occupations are Healthcare Support (100.0%), Cleaning & Maintenance (100.0%), and Personal Care & Service (100.0%).
| Occupation | Male | Female |
| Healthcare Support | 0 (0.0%) | 10 (100.0%) |
| Security & Protection | 5 (100.0%) | 0 (0.0%) |
| Firefighting & Prevention | 3 (100.0%) | 0 (0.0%) |
| Law Enforcement | 2 (100.0%) | 0 (0.0%) |
| Food Preparation & Serving | 10 (20.0%) | 40 (80.0%) |
| Cleaning & Maintenance | 0 (0.0%) | 3 (100.0%) |
| Personal Care & Service | 0 (0.0%) | 18 (100.0%) |
| Total (Category) | 15 (17.4%) | 71 (82.6%) |
| Total (Overall) | 440 (58.6%) | 311 (41.4%) |
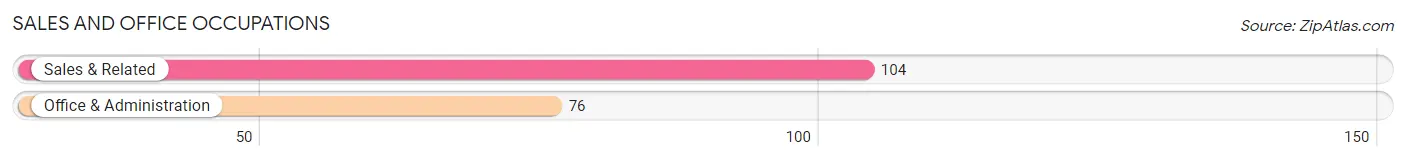
Sales and Office Occupations
The most common Sales and Office occupations in South Carthage are Sales & Related (104 | 13.9%), and Office & Administration (76 | 10.1%).
Sales and Office Occupations by Sex
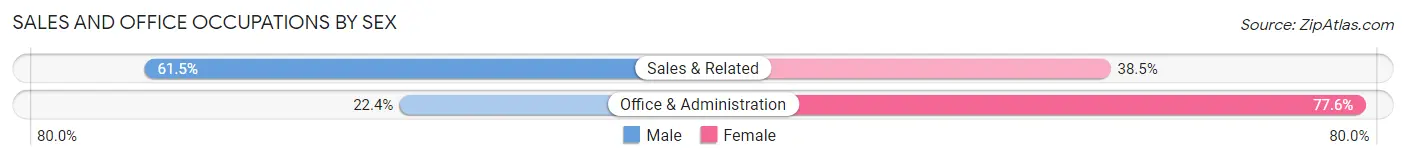
| Occupation | Male | Female |
| Sales & Related | 64 (61.5%) | 40 (38.5%) |
| Office & Administration | 17 (22.4%) | 59 (77.6%) |
| Total (Category) | 81 (45.0%) | 99 (55.0%) |
| Total (Overall) | 440 (58.6%) | 311 (41.4%) |
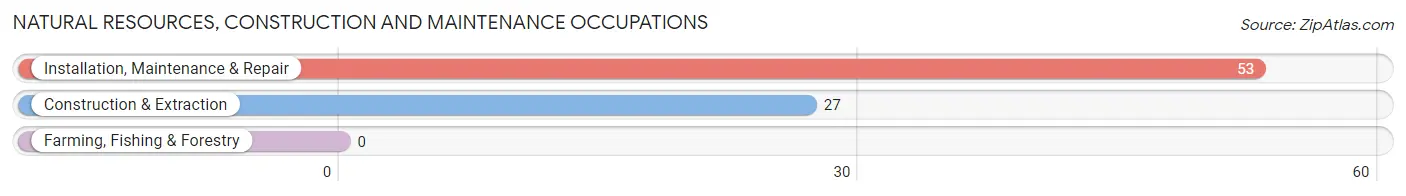
Natural Resources, Construction and Maintenance Occupations
The most common Natural Resources, Construction and Maintenance occupations in South Carthage are Installation, Maintenance & Repair (53 | 7.1%), and Construction & Extraction (27 | 3.6%).
Natural Resources, Construction and Maintenance Occupations by Sex
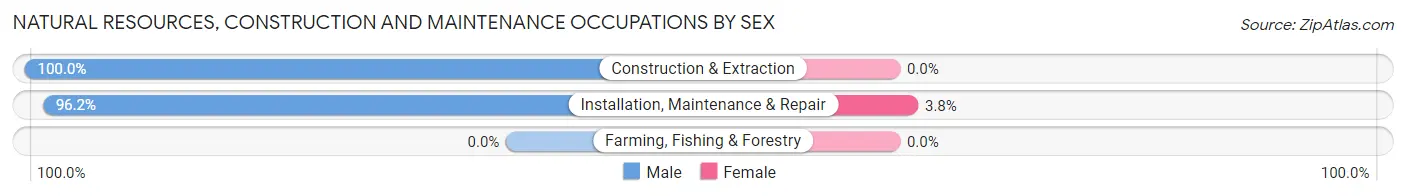
| Occupation | Male | Female |
| Farming, Fishing & Forestry | 0 (0.0%) | 0 (0.0%) |
| Construction & Extraction | 27 (100.0%) | 0 (0.0%) |
| Installation, Maintenance & Repair | 51 (96.2%) | 2 (3.8%) |
| Total (Category) | 78 (97.5%) | 2 (2.5%) |
| Total (Overall) | 440 (58.6%) | 311 (41.4%) |
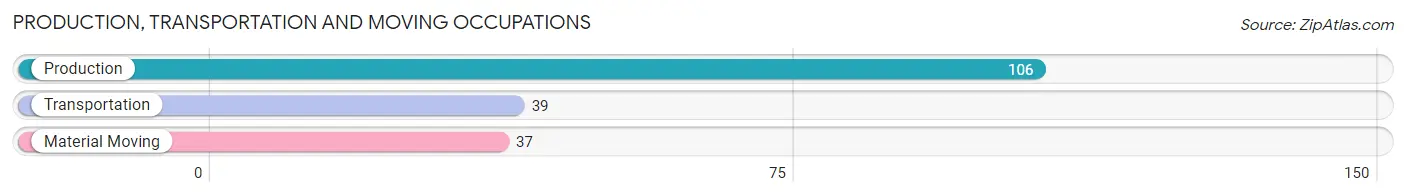
Production, Transportation and Moving Occupations
The most common Production, Transportation and Moving occupations in South Carthage are Production (106 | 14.1%), Transportation (39 | 5.2%), and Material Moving (37 | 4.9%).
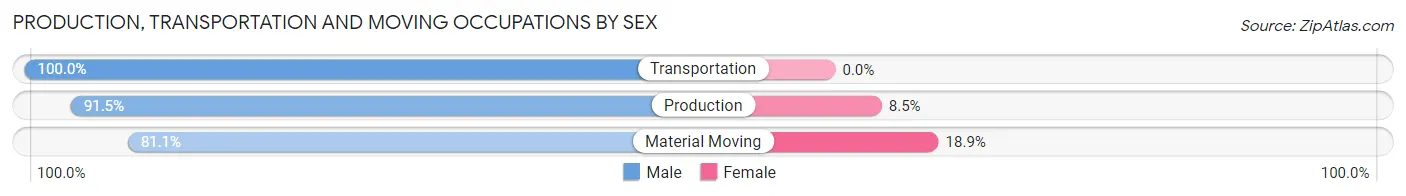
Production, Transportation and Moving Occupations by Sex
| Occupation | Male | Female |
| Production | 97 (91.5%) | 9 (8.5%) |
| Transportation | 39 (100.0%) | 0 (0.0%) |
| Material Moving | 30 (81.1%) | 7 (18.9%) |
| Total (Category) | 166 (91.2%) | 16 (8.8%) |
| Total (Overall) | 440 (58.6%) | 311 (41.4%) |
Employment Industries by Sex in South Carthage
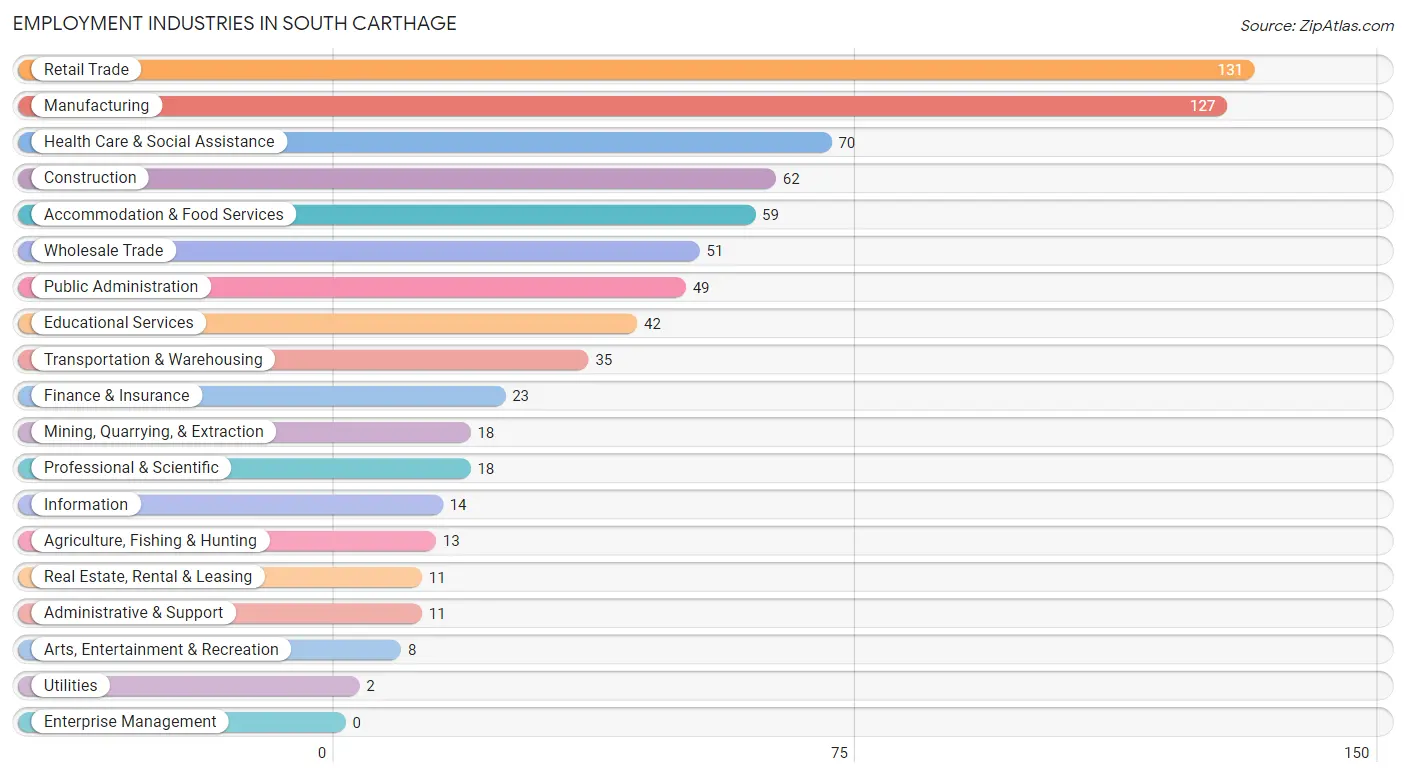
Employment Industries in South Carthage
The major employment industries in South Carthage include Retail Trade (131 | 17.4%), Manufacturing (127 | 16.9%), Health Care & Social Assistance (70 | 9.3%), Construction (62 | 8.3%), and Accommodation & Food Services (59 | 7.9%).
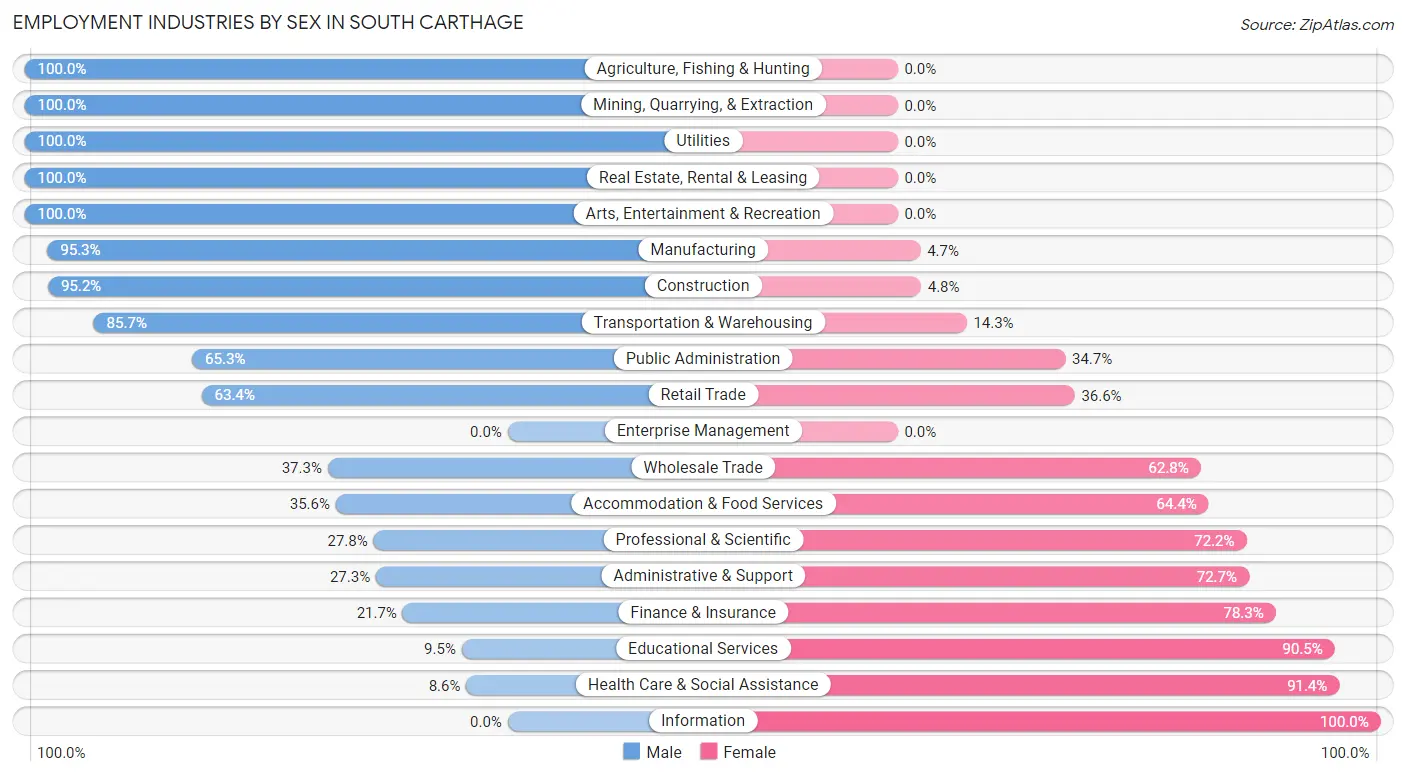
Employment Industries by Sex in South Carthage
The South Carthage industries that see more men than women are Agriculture, Fishing & Hunting (100.0%), Mining, Quarrying, & Extraction (100.0%), and Utilities (100.0%), whereas the industries that tend to have a higher number of women are Information (100.0%), Health Care & Social Assistance (91.4%), and Educational Services (90.5%).
| Industry | Male | Female |
| Agriculture, Fishing & Hunting | 13 (100.0%) | 0 (0.0%) |
| Mining, Quarrying, & Extraction | 18 (100.0%) | 0 (0.0%) |
| Construction | 59 (95.2%) | 3 (4.8%) |
| Manufacturing | 121 (95.3%) | 6 (4.7%) |
| Wholesale Trade | 19 (37.2%) | 32 (62.7%) |
| Retail Trade | 83 (63.4%) | 48 (36.6%) |
| Transportation & Warehousing | 30 (85.7%) | 5 (14.3%) |
| Utilities | 2 (100.0%) | 0 (0.0%) |
| Information | 0 (0.0%) | 14 (100.0%) |
| Finance & Insurance | 5 (21.7%) | 18 (78.3%) |
| Real Estate, Rental & Leasing | 11 (100.0%) | 0 (0.0%) |
| Professional & Scientific | 5 (27.8%) | 13 (72.2%) |
| Enterprise Management | 0 (0.0%) | 0 (0.0%) |
| Administrative & Support | 3 (27.3%) | 8 (72.7%) |
| Educational Services | 4 (9.5%) | 38 (90.5%) |
| Health Care & Social Assistance | 6 (8.6%) | 64 (91.4%) |
| Arts, Entertainment & Recreation | 8 (100.0%) | 0 (0.0%) |
| Accommodation & Food Services | 21 (35.6%) | 38 (64.4%) |
| Public Administration | 32 (65.3%) | 17 (34.7%) |
| Total | 440 (58.6%) | 311 (41.4%) |
Education in South Carthage
School Enrollment in South Carthage
The most common levels of schooling among the 402 students in South Carthage are elementary school (120 | 29.8%), high school (87 | 21.6%), and graduate / professional (58 | 14.4%).
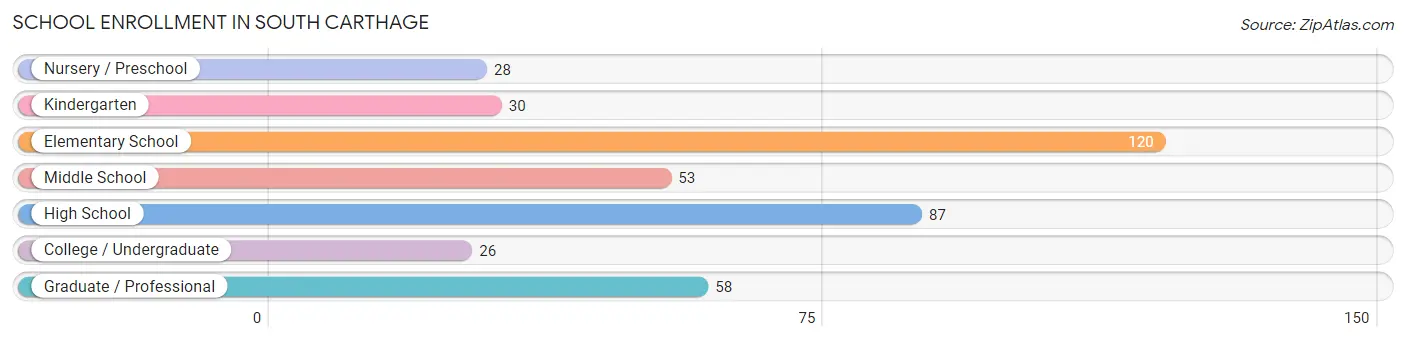
| School Level | # Students | % Students |
| Nursery / Preschool | 28 | 7.0% |
| Kindergarten | 30 | 7.5% |
| Elementary School | 120 | 29.8% |
| Middle School | 53 | 13.2% |
| High School | 87 | 21.6% |
| College / Undergraduate | 26 | 6.5% |
| Graduate / Professional | 58 | 14.4% |
| Total | 402 | 100.0% |
School Enrollment by Age by Funding Source in South Carthage
Out of a total of 402 students who are enrolled in schools in South Carthage, 66 (16.4%) attend a private institution, while the remaining 336 (83.6%) are enrolled in public schools. The age group of 18 to 19 year olds has the highest likelihood of being enrolled in private schools, with 16 (51.6% in the age bracket) enrolled. Conversely, the age group of 3 to 4 year olds has the lowest likelihood of being enrolled in a private school, with 7 (100.0% in the age bracket) attending a public institution.
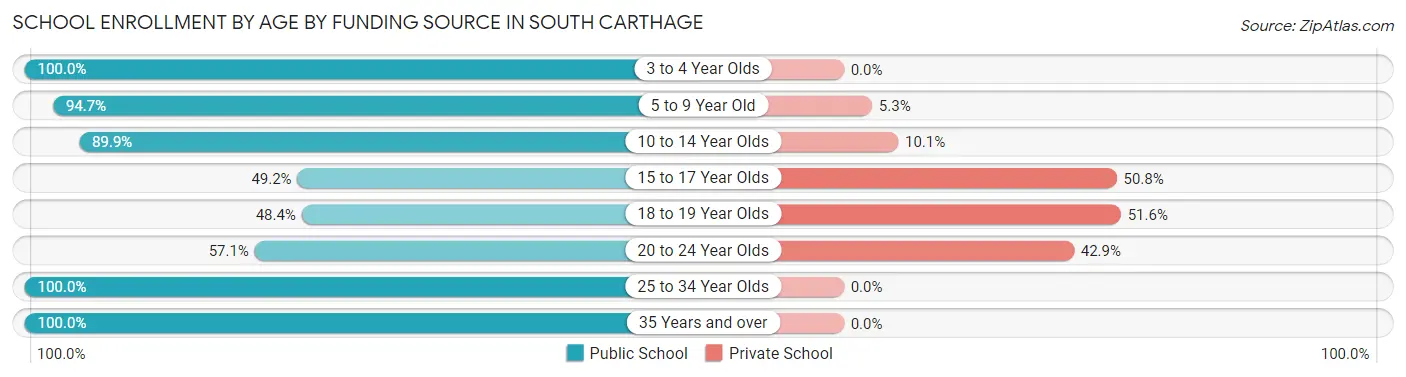
| Age Bracket | Public School | Private School |
| 3 to 4 Year Olds | 7 (100.0%) | 0 (0.0%) |
| 5 to 9 Year Old | 144 (94.7%) | 8 (5.3%) |
| 10 to 14 Year Olds | 71 (89.9%) | 8 (10.1%) |
| 15 to 17 Year Olds | 30 (49.2%) | 31 (50.8%) |
| 18 to 19 Year Olds | 15 (48.4%) | 16 (51.6%) |
| 20 to 24 Year Olds | 4 (57.1%) | 3 (42.9%) |
| 25 to 34 Year Olds | 53 (100.0%) | 0 (0.0%) |
| 35 Years and over | 12 (100.0%) | 0 (0.0%) |
| Total | 336 (83.6%) | 66 (16.4%) |
Educational Attainment by Field of Study in South Carthage
Communications (56 | 24.0%), education (52 | 22.3%), science & technology (36 | 15.4%), arts & humanities (31 | 13.3%), and engineering (18 | 7.7%) are the most common fields of study among 233 individuals in South Carthage who have obtained a bachelor's degree or higher.
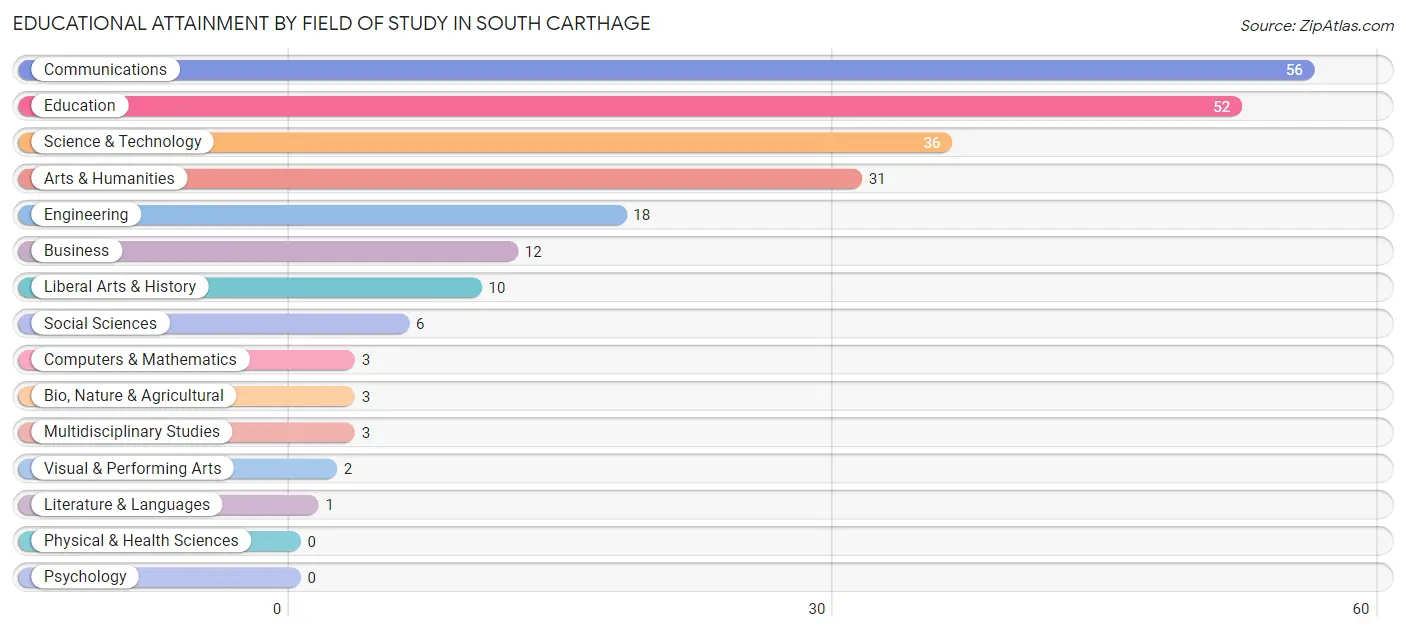
| Field of Study | # Graduates | % Graduates |
| Computers & Mathematics | 3 | 1.3% |
| Bio, Nature & Agricultural | 3 | 1.3% |
| Physical & Health Sciences | 0 | 0.0% |
| Psychology | 0 | 0.0% |
| Social Sciences | 6 | 2.6% |
| Engineering | 18 | 7.7% |
| Multidisciplinary Studies | 3 | 1.3% |
| Science & Technology | 36 | 15.4% |
| Business | 12 | 5.1% |
| Education | 52 | 22.3% |
| Literature & Languages | 1 | 0.4% |
| Liberal Arts & History | 10 | 4.3% |
| Visual & Performing Arts | 2 | 0.9% |
| Communications | 56 | 24.0% |
| Arts & Humanities | 31 | 13.3% |
| Total | 233 | 100.0% |
Transportation & Commute in South Carthage
Vehicle Availability by Sex in South Carthage
The most prevalent vehicle ownership categories in South Carthage are males with 2 vehicles (147, accounting for 34.0%) and females with 2 vehicles (80, making up 47.9%).
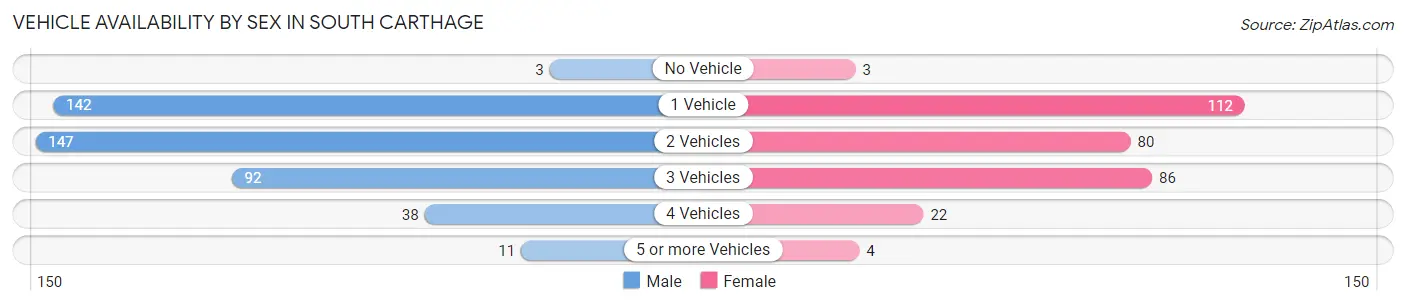
| Vehicles Available | Male | Female |
| No Vehicle | 3 (0.7%) | 3 (1.0%) |
| 1 Vehicle | 142 (32.8%) | 112 (36.5%) |
| 2 Vehicles | 147 (34.0%) | 80 (26.1%) |
| 3 Vehicles | 92 (21.2%) | 86 (28.0%) |
| 4 Vehicles | 38 (8.8%) | 22 (7.2%) |
| 5 or more Vehicles | 11 (2.5%) | 4 (1.3%) |
| Total | 433 (100.0%) | 307 (100.0%) |
Commute Time in South Carthage
The most frequently occuring commute durations in South Carthage are 10 to 14 minutes (124 commuters, 17.9%), 5 to 9 minutes (110 commuters, 15.9%), and 30 to 34 minutes (98 commuters, 14.2%).
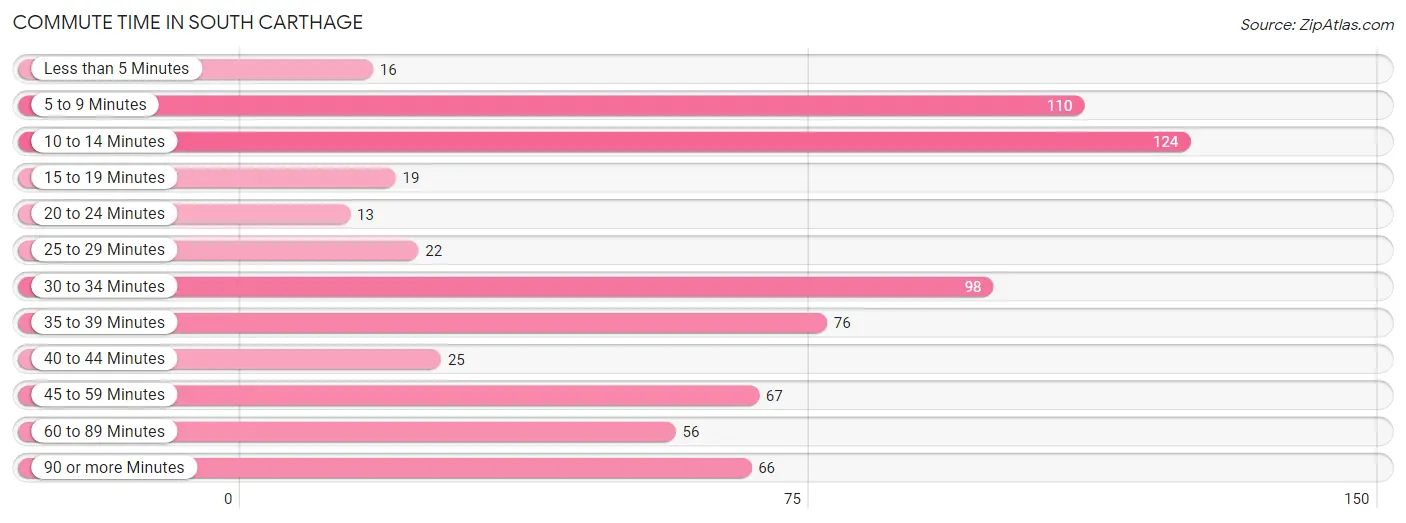
| Commute Time | # Commuters | % Commuters |
| Less than 5 Minutes | 16 | 2.3% |
| 5 to 9 Minutes | 110 | 15.9% |
| 10 to 14 Minutes | 124 | 17.9% |
| 15 to 19 Minutes | 19 | 2.8% |
| 20 to 24 Minutes | 13 | 1.9% |
| 25 to 29 Minutes | 22 | 3.2% |
| 30 to 34 Minutes | 98 | 14.2% |
| 35 to 39 Minutes | 76 | 11.0% |
| 40 to 44 Minutes | 25 | 3.6% |
| 45 to 59 Minutes | 67 | 9.7% |
| 60 to 89 Minutes | 56 | 8.1% |
| 90 or more Minutes | 66 | 9.5% |
Commute Time by Sex in South Carthage
The most common commute times in South Carthage are 10 to 14 minutes (74 commuters, 18.1%) for males and 5 to 9 minutes (59 commuters, 20.8%) for females.
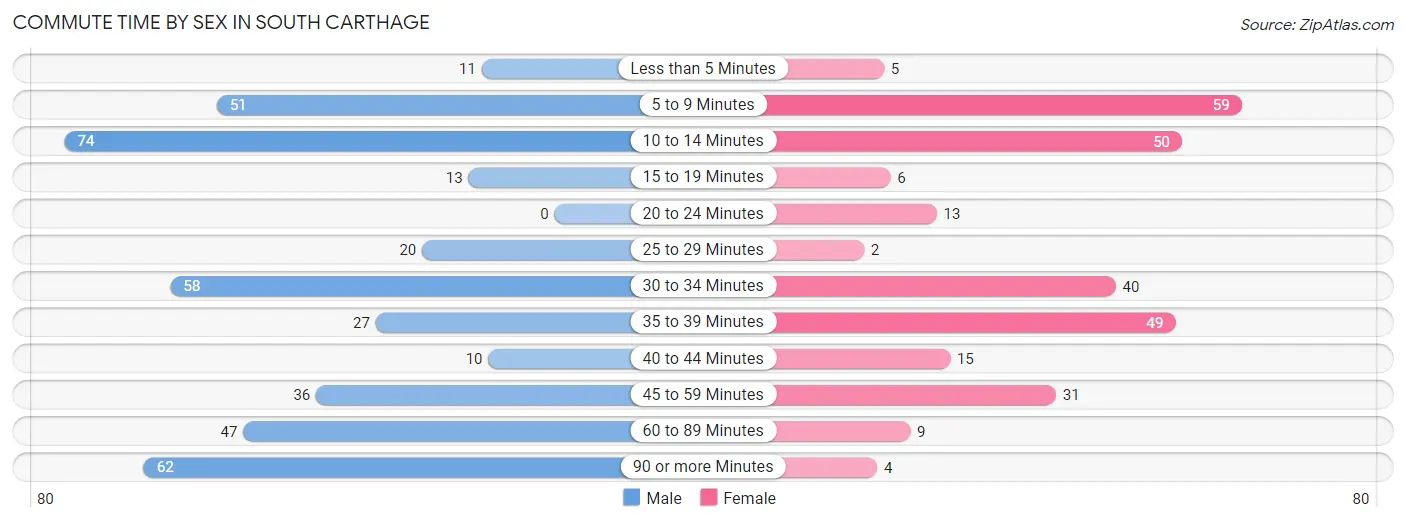
| Commute Time | Male | Female |
| Less than 5 Minutes | 11 (2.7%) | 5 (1.8%) |
| 5 to 9 Minutes | 51 (12.5%) | 59 (20.8%) |
| 10 to 14 Minutes | 74 (18.1%) | 50 (17.7%) |
| 15 to 19 Minutes | 13 (3.2%) | 6 (2.1%) |
| 20 to 24 Minutes | 0 (0.0%) | 13 (4.6%) |
| 25 to 29 Minutes | 20 (4.9%) | 2 (0.7%) |
| 30 to 34 Minutes | 58 (14.2%) | 40 (14.1%) |
| 35 to 39 Minutes | 27 (6.6%) | 49 (17.3%) |
| 40 to 44 Minutes | 10 (2.4%) | 15 (5.3%) |
| 45 to 59 Minutes | 36 (8.8%) | 31 (11.0%) |
| 60 to 89 Minutes | 47 (11.5%) | 9 (3.2%) |
| 90 or more Minutes | 62 (15.2%) | 4 (1.4%) |
Time of Departure to Work by Sex in South Carthage
The most frequent times of departure to work in South Carthage are 5:00 AM to 5:29 AM (73, 17.8%) for males and 7:30 AM to 7:59 AM (76, 26.9%) for females.
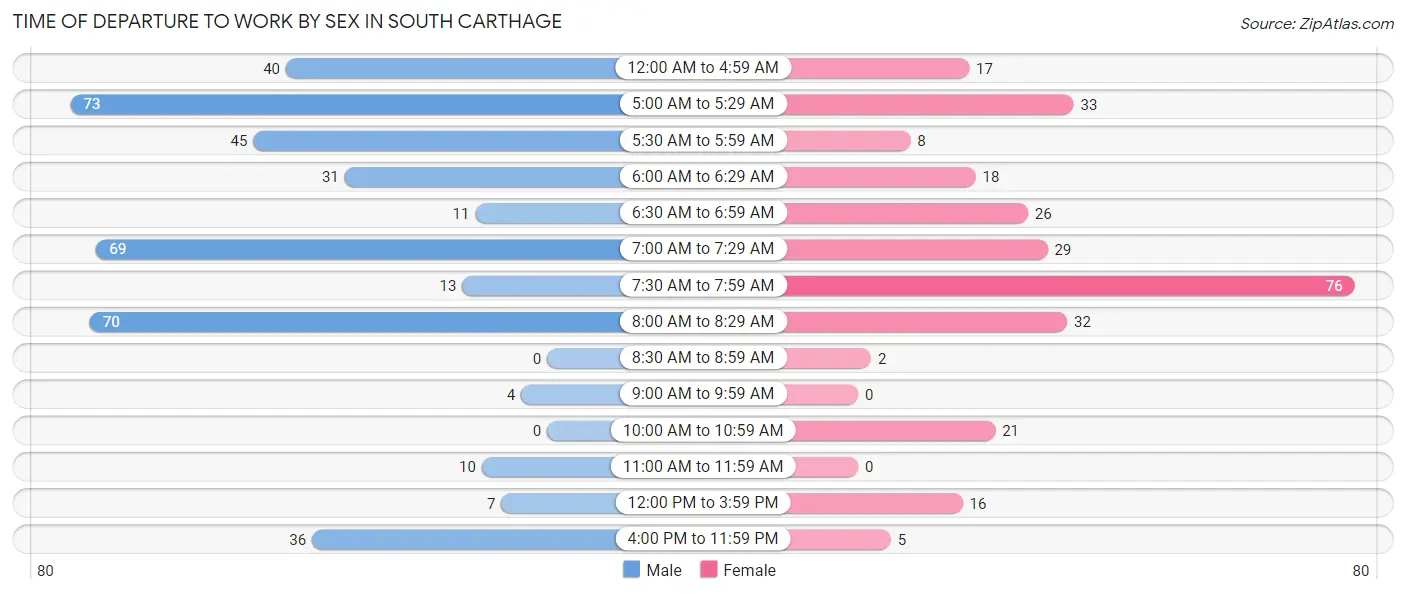
| Time of Departure | Male | Female |
| 12:00 AM to 4:59 AM | 40 (9.8%) | 17 (6.0%) |
| 5:00 AM to 5:29 AM | 73 (17.8%) | 33 (11.7%) |
| 5:30 AM to 5:59 AM | 45 (11.0%) | 8 (2.8%) |
| 6:00 AM to 6:29 AM | 31 (7.6%) | 18 (6.4%) |
| 6:30 AM to 6:59 AM | 11 (2.7%) | 26 (9.2%) |
| 7:00 AM to 7:29 AM | 69 (16.9%) | 29 (10.2%) |
| 7:30 AM to 7:59 AM | 13 (3.2%) | 76 (26.9%) |
| 8:00 AM to 8:29 AM | 70 (17.1%) | 32 (11.3%) |
| 8:30 AM to 8:59 AM | 0 (0.0%) | 2 (0.7%) |
| 9:00 AM to 9:59 AM | 4 (1.0%) | 0 (0.0%) |
| 10:00 AM to 10:59 AM | 0 (0.0%) | 21 (7.4%) |
| 11:00 AM to 11:59 AM | 10 (2.4%) | 0 (0.0%) |
| 12:00 PM to 3:59 PM | 7 (1.7%) | 16 (5.7%) |
| 4:00 PM to 11:59 PM | 36 (8.8%) | 5 (1.8%) |
| Total | 409 (100.0%) | 283 (100.0%) |
Housing Occupancy in South Carthage
Occupancy by Ownership in South Carthage
Of the total 686 dwellings in South Carthage, owner-occupied units account for 423 (61.7%), while renter-occupied units make up 263 (38.3%).
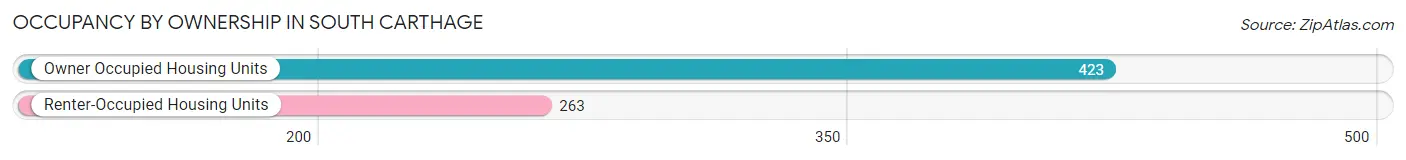
| Occupancy | # Housing Units | % Housing Units |
| Owner Occupied Housing Units | 423 | 61.7% |
| Renter-Occupied Housing Units | 263 | 38.3% |
| Total Occupied Housing Units | 686 | 100.0% |
Occupancy by Household Size in South Carthage
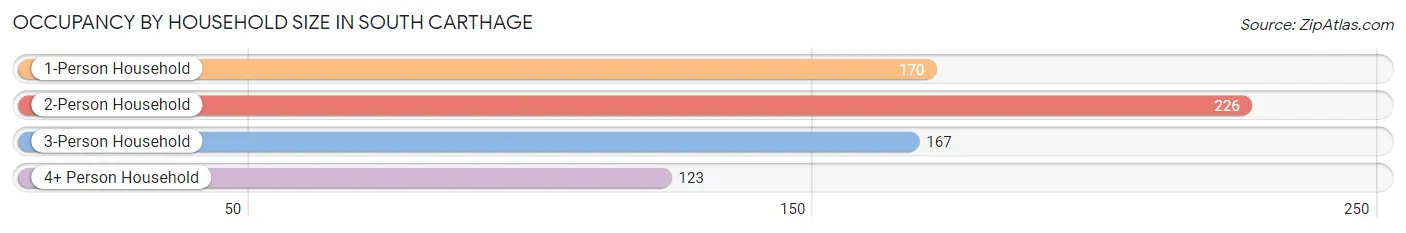
| Household Size | # Housing Units | % Housing Units |
| 1-Person Household | 170 | 24.8% |
| 2-Person Household | 226 | 32.9% |
| 3-Person Household | 167 | 24.3% |
| 4+ Person Household | 123 | 17.9% |
| Total Housing Units | 686 | 100.0% |
Occupancy by Ownership by Household Size in South Carthage
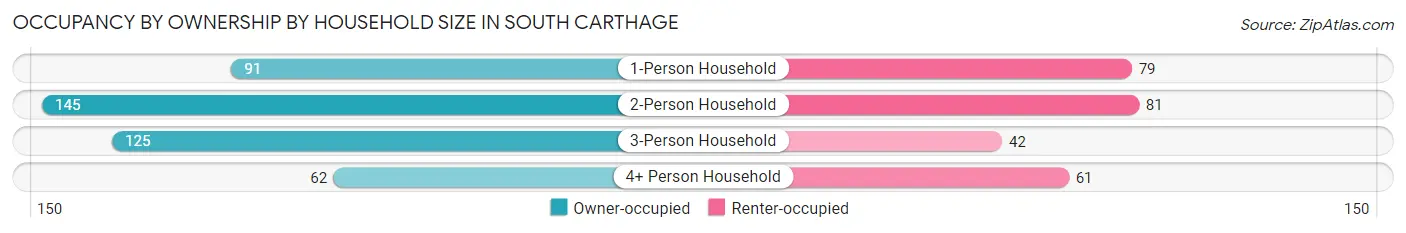
| Household Size | Owner-occupied | Renter-occupied |
| 1-Person Household | 91 (53.5%) | 79 (46.5%) |
| 2-Person Household | 145 (64.2%) | 81 (35.8%) |
| 3-Person Household | 125 (74.9%) | 42 (25.2%) |
| 4+ Person Household | 62 (50.4%) | 61 (49.6%) |
| Total Housing Units | 423 (61.7%) | 263 (38.3%) |
Occupancy by Educational Attainment in South Carthage
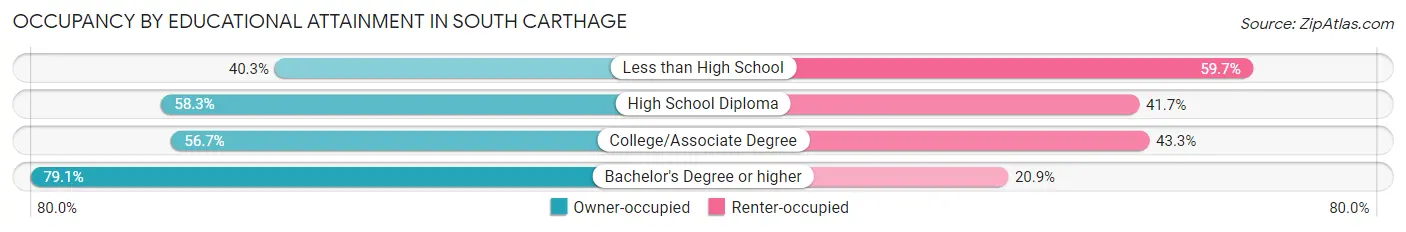
| Household Size | Owner-occupied | Renter-occupied |
| Less than High School | 25 (40.3%) | 37 (59.7%) |
| High School Diploma | 165 (58.3%) | 118 (41.7%) |
| College/Associate Degree | 93 (56.7%) | 71 (43.3%) |
| Bachelor's Degree or higher | 140 (79.1%) | 37 (20.9%) |
Occupancy by Age of Householder in South Carthage
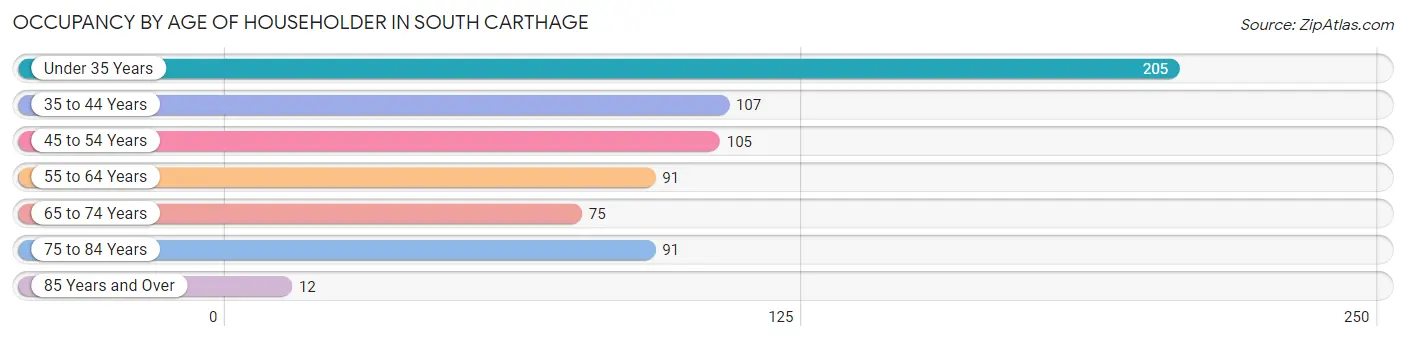
| Age Bracket | # Households | % Households |
| Under 35 Years | 205 | 29.9% |
| 35 to 44 Years | 107 | 15.6% |
| 45 to 54 Years | 105 | 15.3% |
| 55 to 64 Years | 91 | 13.3% |
| 65 to 74 Years | 75 | 10.9% |
| 75 to 84 Years | 91 | 13.3% |
| 85 Years and Over | 12 | 1.8% |
| Total | 686 | 100.0% |
Housing Finances in South Carthage
Median Income by Occupancy in South Carthage
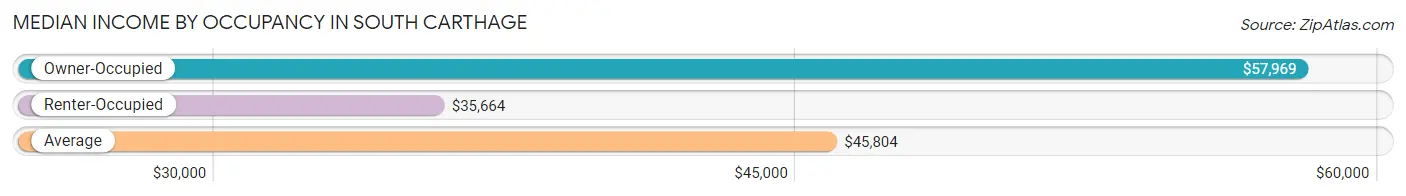
| Occupancy Type | # Households | Median Income |
| Owner-Occupied | 423 (61.7%) | $57,969 |
| Renter-Occupied | 263 (38.3%) | $35,664 |
| Average | 686 (100.0%) | $45,804 |
Occupancy by Householder Income Bracket in South Carthage
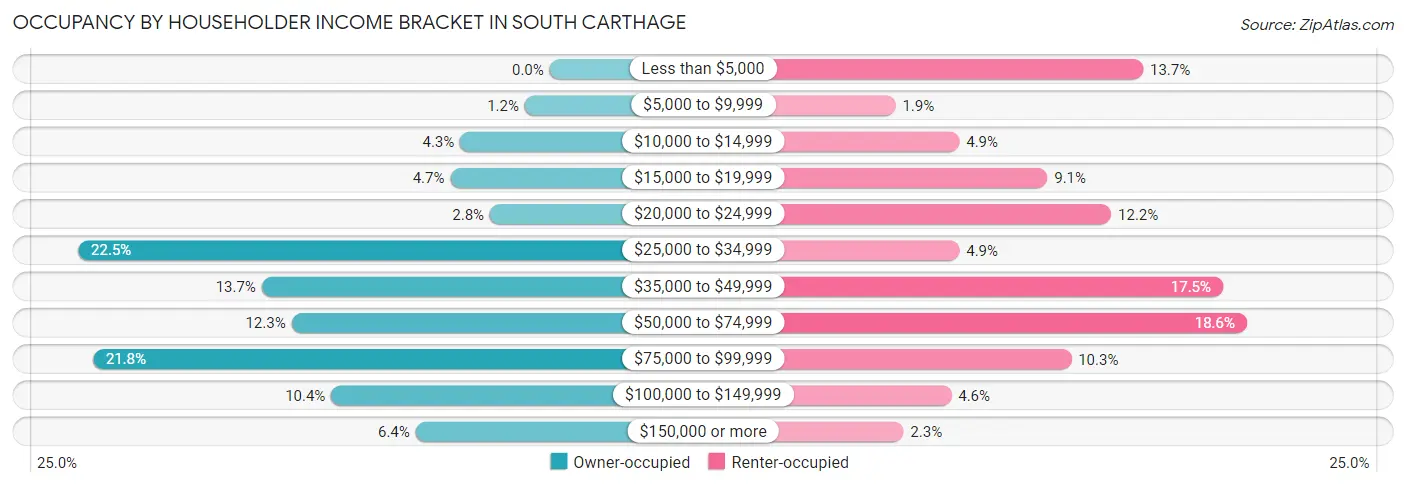
| Income Bracket | Owner-occupied | Renter-occupied |
| Less than $5,000 | 0 (0.0%) | 36 (13.7%) |
| $5,000 to $9,999 | 5 (1.2%) | 5 (1.9%) |
| $10,000 to $14,999 | 18 (4.3%) | 13 (4.9%) |
| $15,000 to $19,999 | 20 (4.7%) | 24 (9.1%) |
| $20,000 to $24,999 | 12 (2.8%) | 32 (12.2%) |
| $25,000 to $34,999 | 95 (22.5%) | 13 (4.9%) |
| $35,000 to $49,999 | 58 (13.7%) | 46 (17.5%) |
| $50,000 to $74,999 | 52 (12.3%) | 49 (18.6%) |
| $75,000 to $99,999 | 92 (21.7%) | 27 (10.3%) |
| $100,000 to $149,999 | 44 (10.4%) | 12 (4.6%) |
| $150,000 or more | 27 (6.4%) | 6 (2.3%) |
| Total | 423 (100.0%) | 263 (100.0%) |
Monthly Housing Cost Tiers in South Carthage
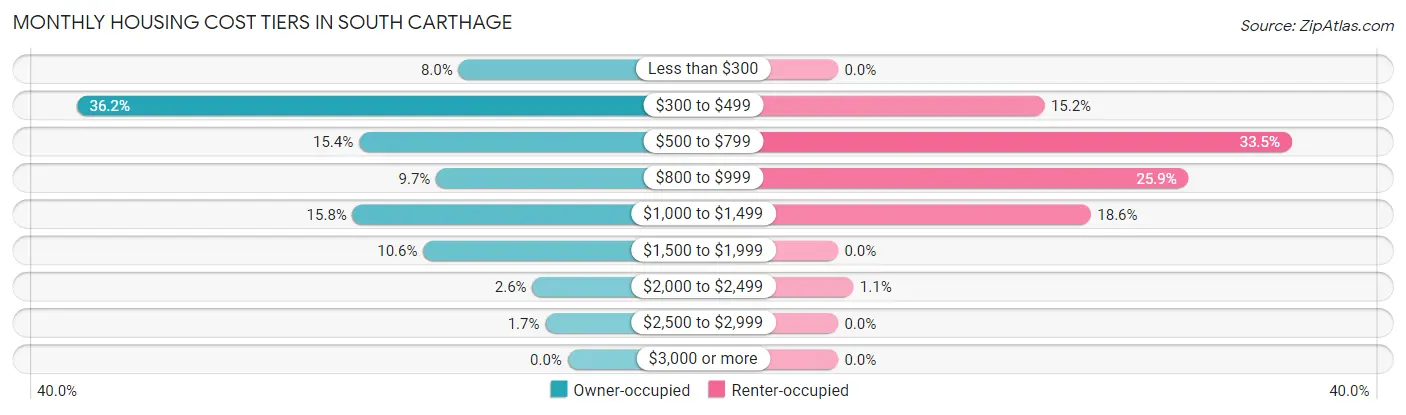
| Monthly Cost | Owner-occupied | Renter-occupied |
| Less than $300 | 34 (8.0%) | 0 (0.0%) |
| $300 to $499 | 153 (36.2%) | 40 (15.2%) |
| $500 to $799 | 65 (15.4%) | 88 (33.5%) |
| $800 to $999 | 41 (9.7%) | 68 (25.9%) |
| $1,000 to $1,499 | 67 (15.8%) | 49 (18.6%) |
| $1,500 to $1,999 | 45 (10.6%) | 0 (0.0%) |
| $2,000 to $2,499 | 11 (2.6%) | 3 (1.1%) |
| $2,500 to $2,999 | 7 (1.7%) | 0 (0.0%) |
| $3,000 or more | 0 (0.0%) | 0 (0.0%) |
| Total | 423 (100.0%) | 263 (100.0%) |
Physical Housing Characteristics in South Carthage
Housing Structures in South Carthage
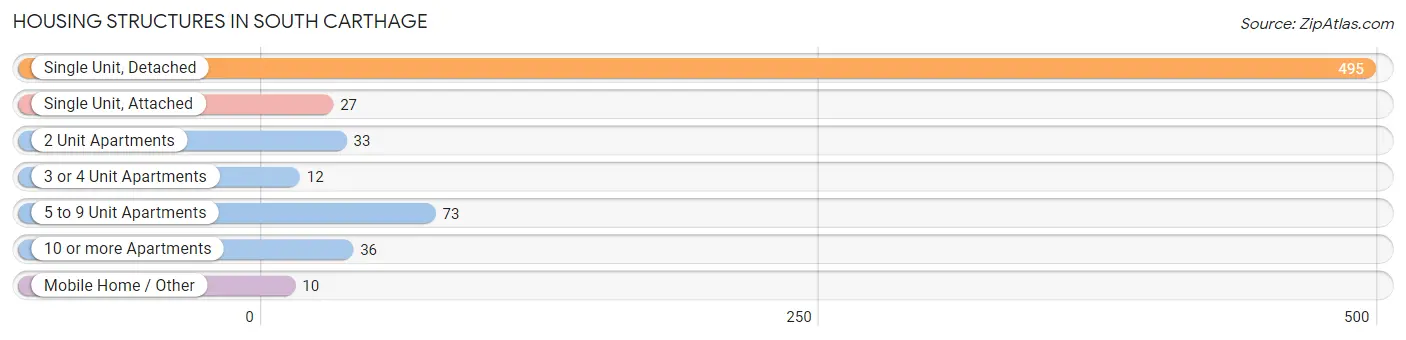
| Structure Type | # Housing Units | % Housing Units |
| Single Unit, Detached | 495 | 72.2% |
| Single Unit, Attached | 27 | 3.9% |
| 2 Unit Apartments | 33 | 4.8% |
| 3 or 4 Unit Apartments | 12 | 1.8% |
| 5 to 9 Unit Apartments | 73 | 10.6% |
| 10 or more Apartments | 36 | 5.2% |
| Mobile Home / Other | 10 | 1.5% |
| Total | 686 | 100.0% |
Housing Structures by Occupancy in South Carthage
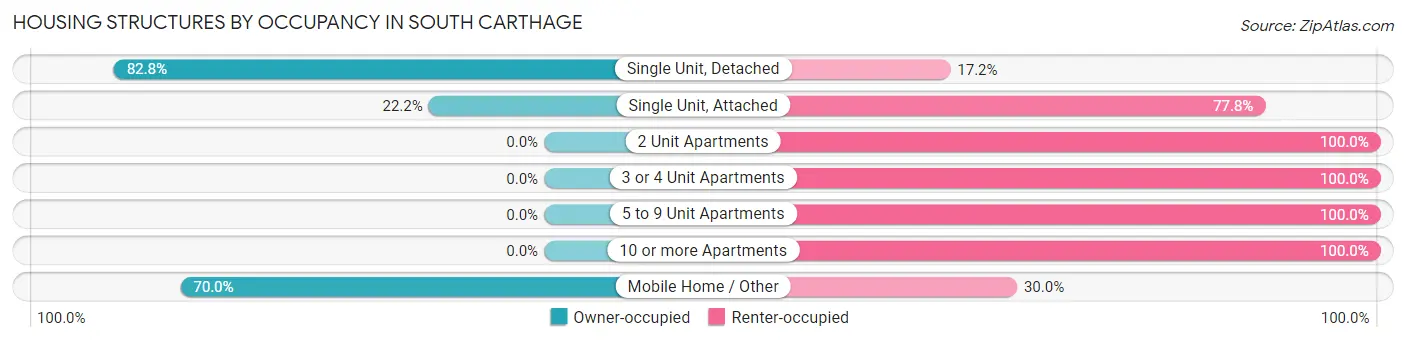
| Structure Type | Owner-occupied | Renter-occupied |
| Single Unit, Detached | 410 (82.8%) | 85 (17.2%) |
| Single Unit, Attached | 6 (22.2%) | 21 (77.8%) |
| 2 Unit Apartments | 0 (0.0%) | 33 (100.0%) |
| 3 or 4 Unit Apartments | 0 (0.0%) | 12 (100.0%) |
| 5 to 9 Unit Apartments | 0 (0.0%) | 73 (100.0%) |
| 10 or more Apartments | 0 (0.0%) | 36 (100.0%) |
| Mobile Home / Other | 7 (70.0%) | 3 (30.0%) |
| Total | 423 (61.7%) | 263 (38.3%) |
Housing Structures by Number of Rooms in South Carthage
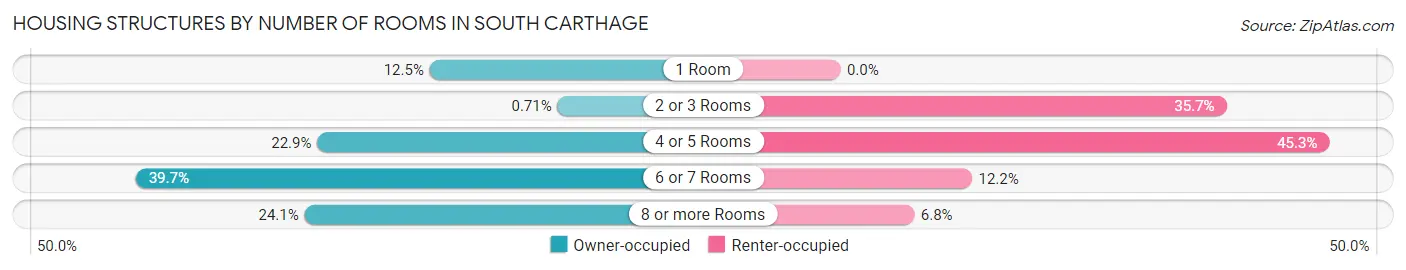
| Number of Rooms | Owner-occupied | Renter-occupied |
| 1 Room | 53 (12.5%) | 0 (0.0%) |
| 2 or 3 Rooms | 3 (0.7%) | 94 (35.7%) |
| 4 or 5 Rooms | 97 (22.9%) | 119 (45.3%) |
| 6 or 7 Rooms | 168 (39.7%) | 32 (12.2%) |
| 8 or more Rooms | 102 (24.1%) | 18 (6.8%) |
| Total | 423 (100.0%) | 263 (100.0%) |
Housing Structure by Heating Type in South Carthage
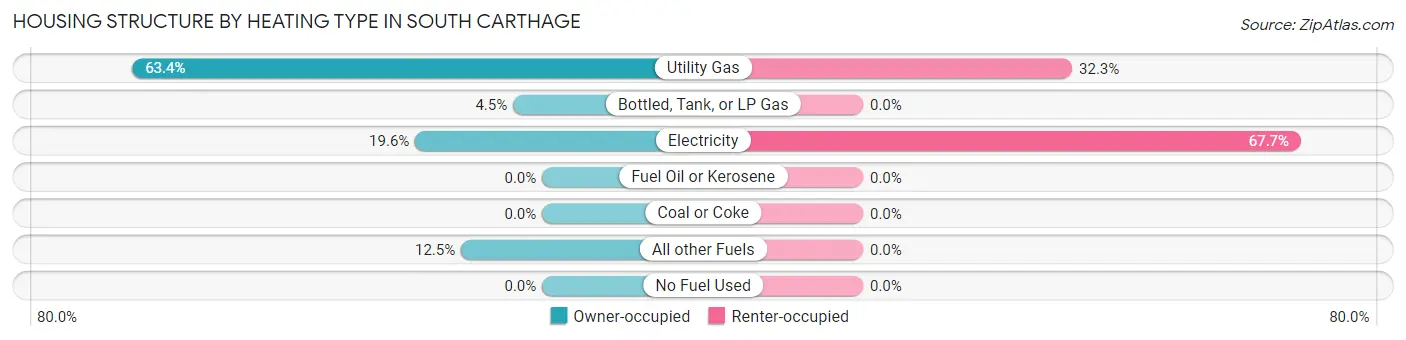
| Heating Type | Owner-occupied | Renter-occupied |
| Utility Gas | 268 (63.4%) | 85 (32.3%) |
| Bottled, Tank, or LP Gas | 19 (4.5%) | 0 (0.0%) |
| Electricity | 83 (19.6%) | 178 (67.7%) |
| Fuel Oil or Kerosene | 0 (0.0%) | 0 (0.0%) |
| Coal or Coke | 0 (0.0%) | 0 (0.0%) |
| All other Fuels | 53 (12.5%) | 0 (0.0%) |
| No Fuel Used | 0 (0.0%) | 0 (0.0%) |
| Total | 423 (100.0%) | 263 (100.0%) |
Household Vehicle Usage in South Carthage
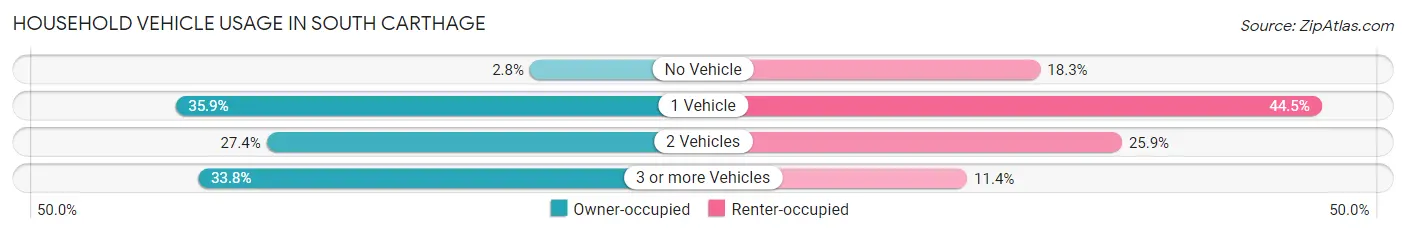
| Vehicles per Household | Owner-occupied | Renter-occupied |
| No Vehicle | 12 (2.8%) | 48 (18.2%) |
| 1 Vehicle | 152 (35.9%) | 117 (44.5%) |
| 2 Vehicles | 116 (27.4%) | 68 (25.9%) |
| 3 or more Vehicles | 143 (33.8%) | 30 (11.4%) |
| Total | 423 (100.0%) | 263 (100.0%) |
Real Estate & Mortgages in South Carthage
Real Estate and Mortgage Overview in South Carthage
| Characteristic | Without Mortgage | With Mortgage |
| Housing Units | 238 | 185 |
| Median Property Value | $167,700 | $211,400 |
| Median Household Income | $40,833 | $10 |
| Monthly Housing Costs | $377 | $0 |
| Real Estate Taxes | $1,221 | $17 |
Property Value by Mortgage Status in South Carthage
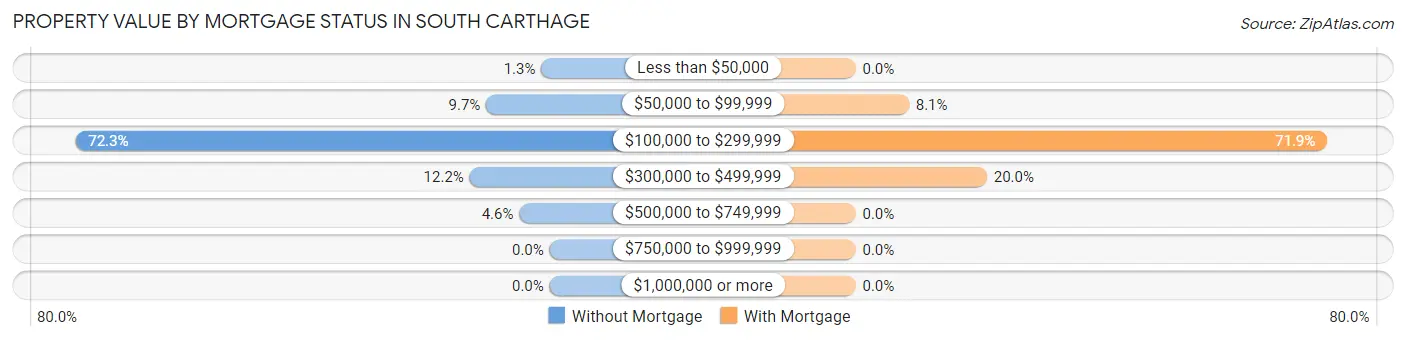
| Property Value | Without Mortgage | With Mortgage |
| Less than $50,000 | 3 (1.3%) | 0 (0.0%) |
| $50,000 to $99,999 | 23 (9.7%) | 15 (8.1%) |
| $100,000 to $299,999 | 172 (72.3%) | 133 (71.9%) |
| $300,000 to $499,999 | 29 (12.2%) | 37 (20.0%) |
| $500,000 to $749,999 | 11 (4.6%) | 0 (0.0%) |
| $750,000 to $999,999 | 0 (0.0%) | 0 (0.0%) |
| $1,000,000 or more | 0 (0.0%) | 0 (0.0%) |
| Total | 238 (100.0%) | 185 (100.0%) |
Household Income by Mortgage Status in South Carthage
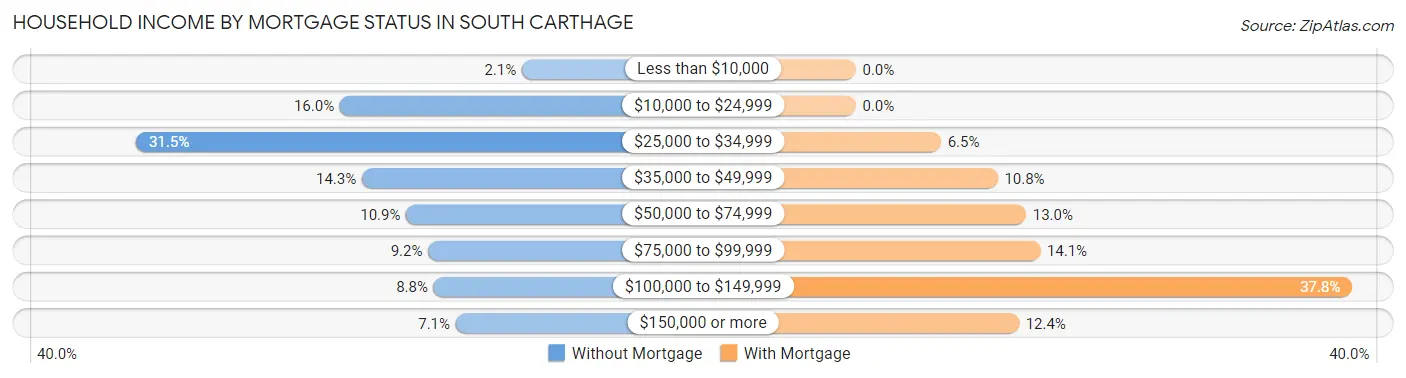
| Household Income | Without Mortgage | With Mortgage |
| Less than $10,000 | 5 (2.1%) | 0 (0.0%) |
| $10,000 to $24,999 | 38 (16.0%) | 0 (0.0%) |
| $25,000 to $34,999 | 75 (31.5%) | 12 (6.5%) |
| $35,000 to $49,999 | 34 (14.3%) | 20 (10.8%) |
| $50,000 to $74,999 | 26 (10.9%) | 24 (13.0%) |
| $75,000 to $99,999 | 22 (9.2%) | 26 (14.1%) |
| $100,000 to $149,999 | 21 (8.8%) | 70 (37.8%) |
| $150,000 or more | 17 (7.1%) | 23 (12.4%) |
| Total | 238 (100.0%) | 185 (100.0%) |
Property Value to Household Income Ratio in South Carthage
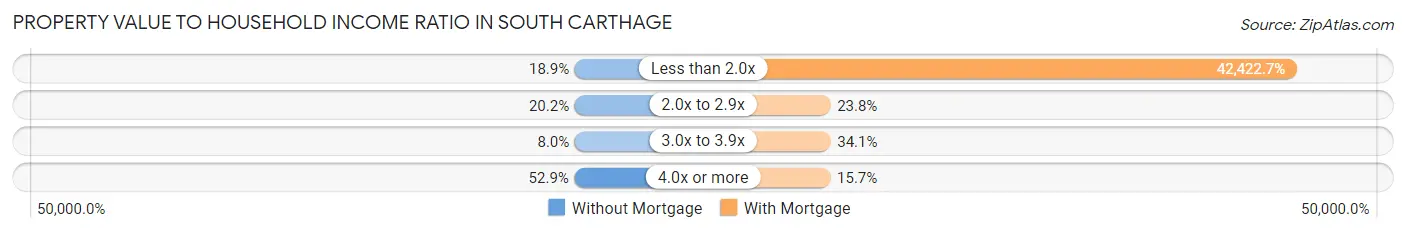
| Value-to-Income Ratio | Without Mortgage | With Mortgage |
| Less than 2.0x | 45 (18.9%) | 78,482 (42,422.7%) |
| 2.0x to 2.9x | 48 (20.2%) | 44 (23.8%) |
| 3.0x to 3.9x | 19 (8.0%) | 63 (34.1%) |
| 4.0x or more | 126 (52.9%) | 29 (15.7%) |
| Total | 238 (100.0%) | 185 (100.0%) |
Real Estate Taxes by Mortgage Status in South Carthage
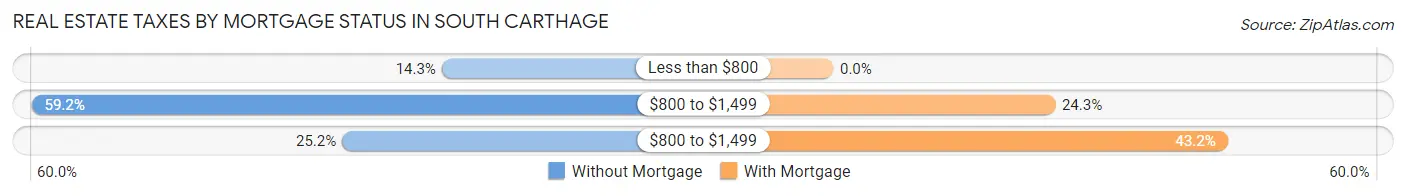
| Property Taxes | Without Mortgage | With Mortgage |
| Less than $800 | 34 (14.3%) | 0 (0.0%) |
| $800 to $1,499 | 141 (59.2%) | 45 (24.3%) |
| $800 to $1,499 | 60 (25.2%) | 80 (43.2%) |
| Total | 238 (100.0%) | 185 (100.0%) |
Health & Disability in South Carthage
Health Insurance Coverage by Age in South Carthage
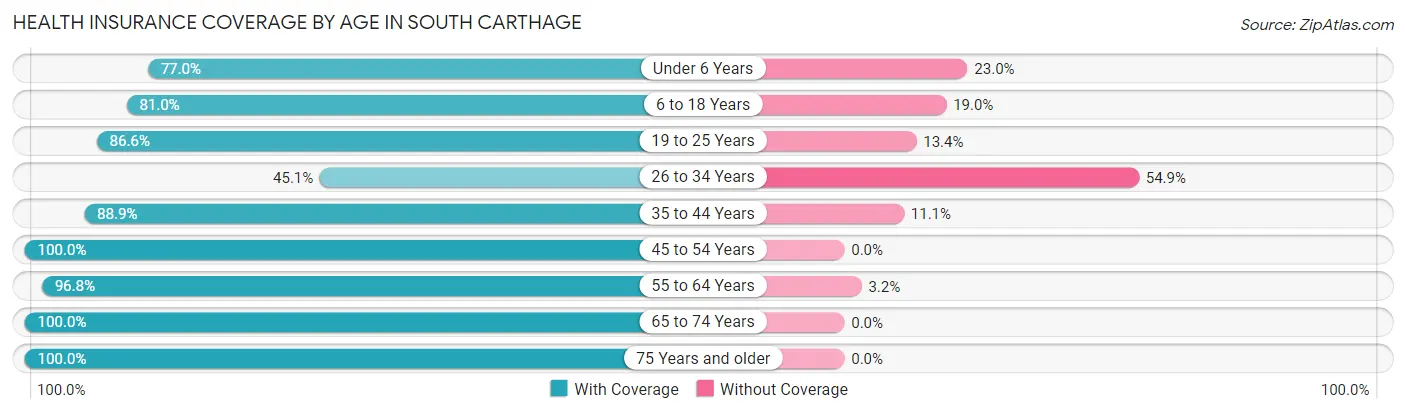
| Age Bracket | With Coverage | Without Coverage |
| Under 6 Years | 104 (77.0%) | 31 (23.0%) |
| 6 to 18 Years | 226 (81.0%) | 53 (19.0%) |
| 19 to 25 Years | 116 (86.6%) | 18 (13.4%) |
| 26 to 34 Years | 142 (45.1%) | 173 (54.9%) |
| 35 to 44 Years | 176 (88.9%) | 22 (11.1%) |
| 45 to 54 Years | 237 (100.0%) | 0 (0.0%) |
| 55 to 64 Years | 121 (96.8%) | 4 (3.2%) |
| 65 to 74 Years | 126 (100.0%) | 0 (0.0%) |
| 75 Years and older | 149 (100.0%) | 0 (0.0%) |
| Total | 1,397 (82.3%) | 301 (17.7%) |
Health Insurance Coverage by Citizenship Status in South Carthage
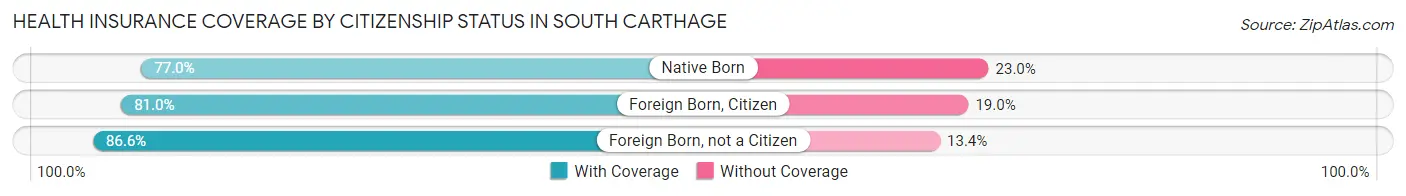
| Citizenship Status | With Coverage | Without Coverage |
| Native Born | 104 (77.0%) | 31 (23.0%) |
| Foreign Born, Citizen | 226 (81.0%) | 53 (19.0%) |
| Foreign Born, not a Citizen | 116 (86.6%) | 18 (13.4%) |
Health Insurance Coverage by Household Income in South Carthage
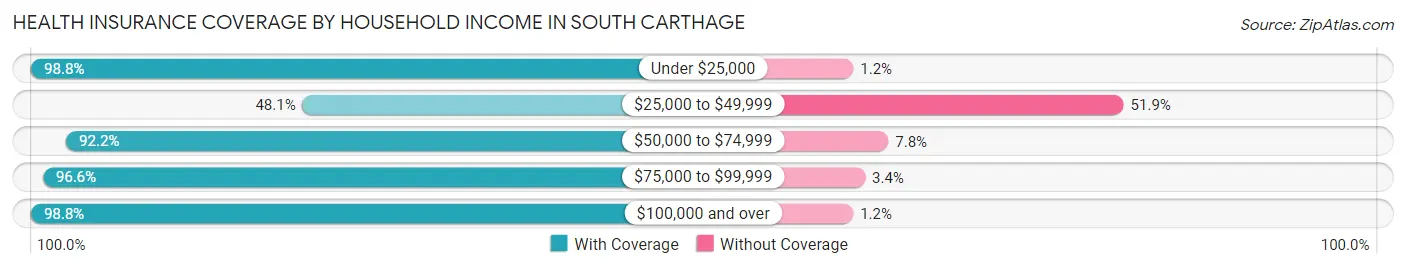
| Household Income | With Coverage | Without Coverage |
| Under $25,000 | 321 (98.8%) | 4 (1.2%) |
| $25,000 to $49,999 | 244 (48.1%) | 263 (51.9%) |
| $50,000 to $74,999 | 213 (92.2%) | 18 (7.8%) |
| $75,000 to $99,999 | 366 (96.6%) | 13 (3.4%) |
| $100,000 and over | 248 (98.8%) | 3 (1.2%) |
Public vs Private Health Insurance Coverage by Age in South Carthage
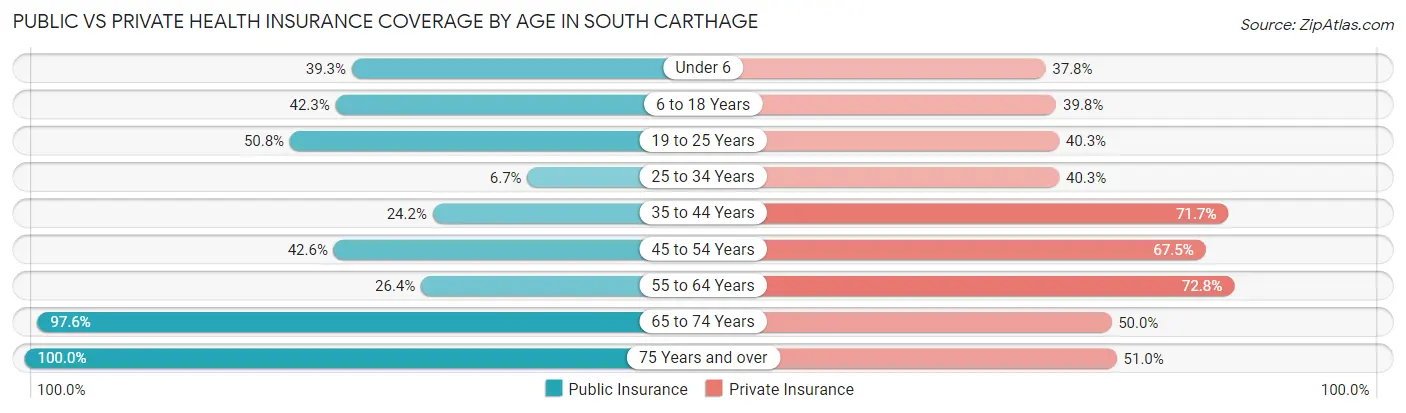
| Age Bracket | Public Insurance | Private Insurance |
| Under 6 | 53 (39.3%) | 51 (37.8%) |
| 6 to 18 Years | 118 (42.3%) | 111 (39.8%) |
| 19 to 25 Years | 68 (50.7%) | 54 (40.3%) |
| 25 to 34 Years | 21 (6.7%) | 127 (40.3%) |
| 35 to 44 Years | 48 (24.2%) | 142 (71.7%) |
| 45 to 54 Years | 101 (42.6%) | 160 (67.5%) |
| 55 to 64 Years | 33 (26.4%) | 91 (72.8%) |
| 65 to 74 Years | 123 (97.6%) | 63 (50.0%) |
| 75 Years and over | 149 (100.0%) | 76 (51.0%) |
| Total | 714 (42.0%) | 875 (51.5%) |
Disability Status by Sex by Age in South Carthage
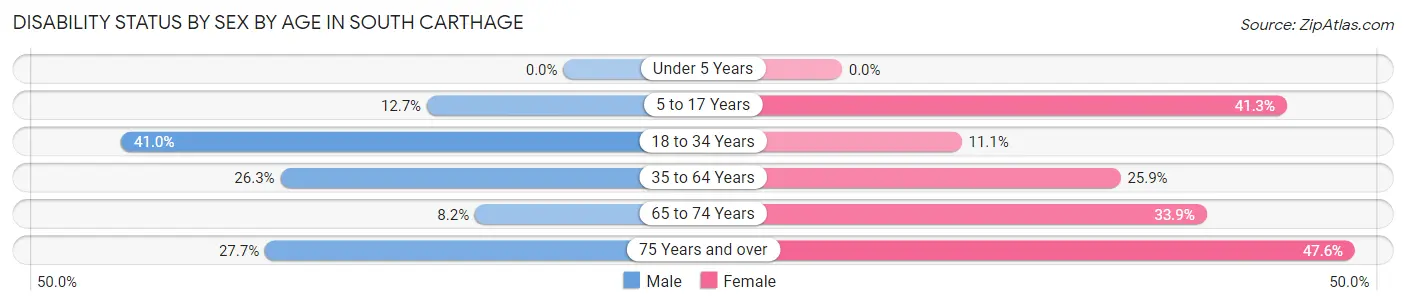
| Age Bracket | Male | Female |
| Under 5 Years | 0 (0.0%) | 0 (0.0%) |
| 5 to 17 Years | 20 (12.7%) | 57 (41.3%) |
| 18 to 34 Years | 87 (41.0%) | 27 (11.1%) |
| 35 to 64 Years | 78 (26.3%) | 68 (25.9%) |
| 65 to 74 Years | 5 (8.2%) | 22 (33.9%) |
| 75 Years and over | 18 (27.7%) | 40 (47.6%) |
Disability Class by Sex by Age in South Carthage
Disability Class: Hearing Difficulty
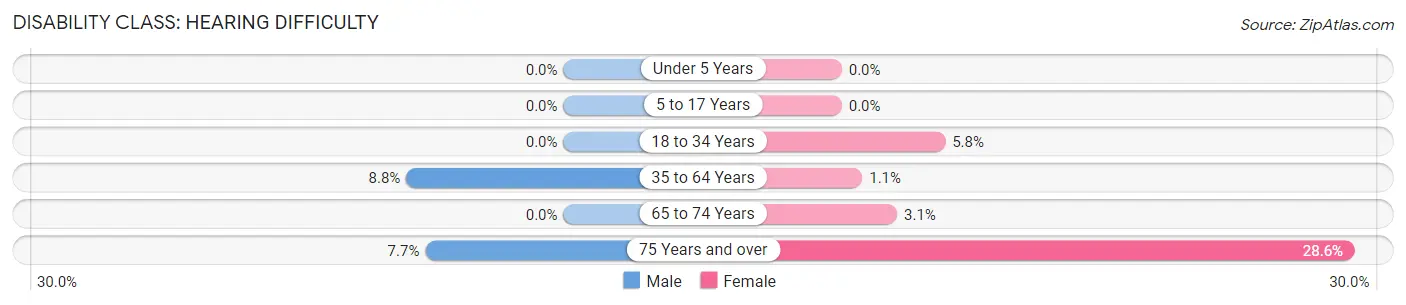
| Age Bracket | Male | Female |
| Under 5 Years | 0 (0.0%) | 0 (0.0%) |
| 5 to 17 Years | 0 (0.0%) | 0 (0.0%) |
| 18 to 34 Years | 0 (0.0%) | 14 (5.8%) |
| 35 to 64 Years | 26 (8.7%) | 3 (1.1%) |
| 65 to 74 Years | 0 (0.0%) | 2 (3.1%) |
| 75 Years and over | 5 (7.7%) | 24 (28.6%) |
Disability Class: Vision Difficulty
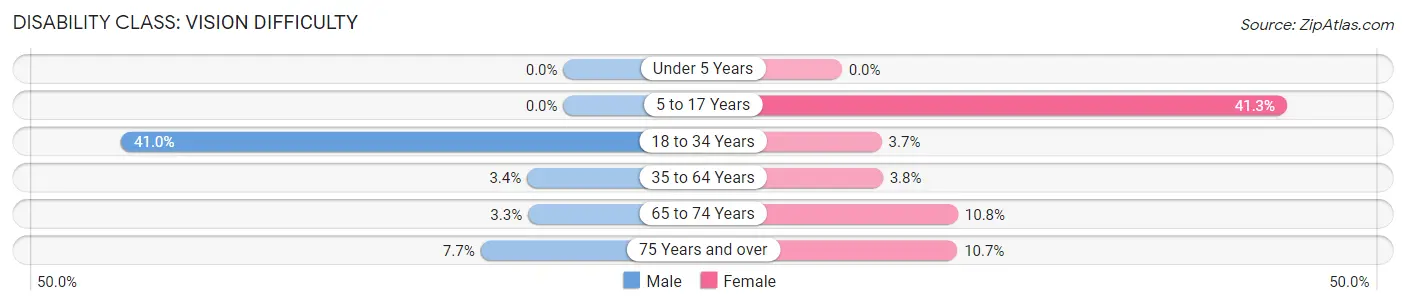
| Age Bracket | Male | Female |
| Under 5 Years | 0 (0.0%) | 0 (0.0%) |
| 5 to 17 Years | 0 (0.0%) | 57 (41.3%) |
| 18 to 34 Years | 87 (41.0%) | 9 (3.7%) |
| 35 to 64 Years | 10 (3.4%) | 10 (3.8%) |
| 65 to 74 Years | 2 (3.3%) | 7 (10.8%) |
| 75 Years and over | 5 (7.7%) | 9 (10.7%) |
Disability Class: Cognitive Difficulty
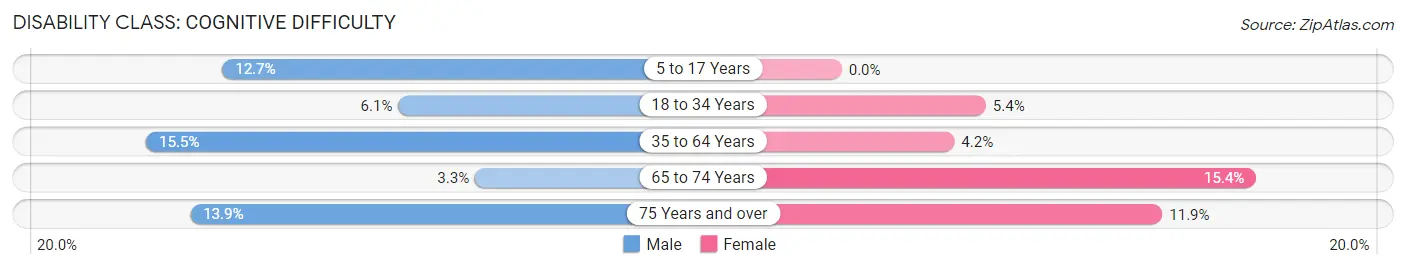
| Age Bracket | Male | Female |
| 5 to 17 Years | 20 (12.7%) | 0 (0.0%) |
| 18 to 34 Years | 13 (6.1%) | 13 (5.3%) |
| 35 to 64 Years | 46 (15.5%) | 11 (4.2%) |
| 65 to 74 Years | 2 (3.3%) | 10 (15.4%) |
| 75 Years and over | 9 (13.9%) | 10 (11.9%) |
Disability Class: Ambulatory Difficulty
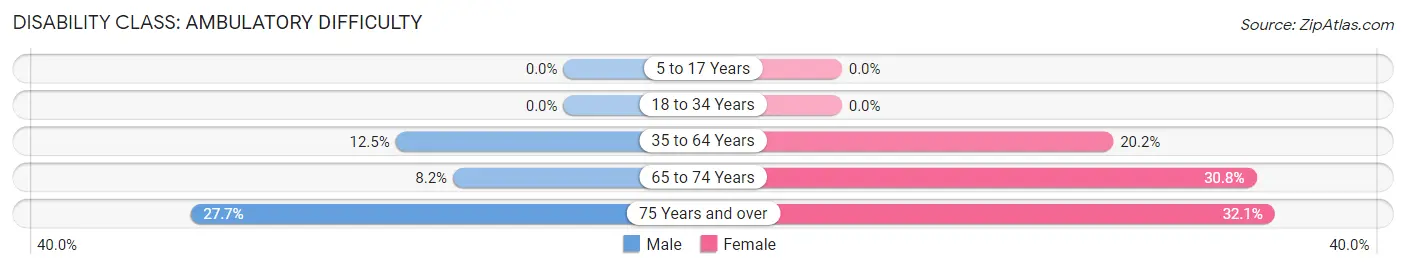
| Age Bracket | Male | Female |
| 5 to 17 Years | 0 (0.0%) | 0 (0.0%) |
| 18 to 34 Years | 0 (0.0%) | 0 (0.0%) |
| 35 to 64 Years | 37 (12.5%) | 53 (20.2%) |
| 65 to 74 Years | 5 (8.2%) | 20 (30.8%) |
| 75 Years and over | 18 (27.7%) | 27 (32.1%) |
Disability Class: Self-Care Difficulty
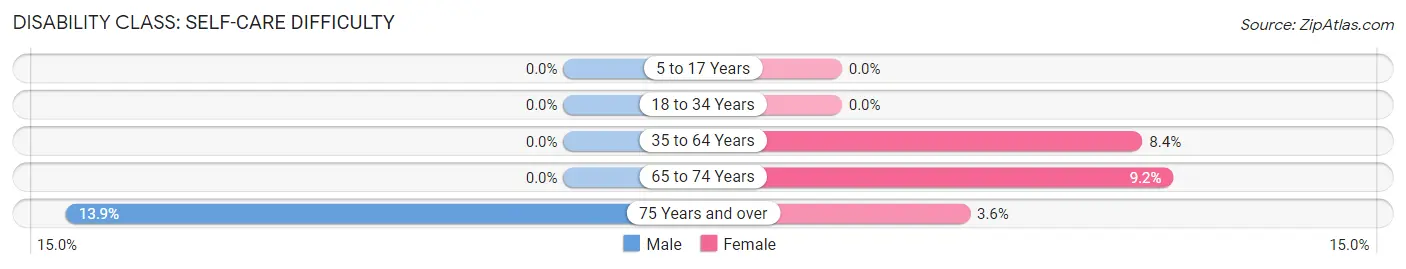
| Age Bracket | Male | Female |
| 5 to 17 Years | 0 (0.0%) | 0 (0.0%) |
| 18 to 34 Years | 0 (0.0%) | 0 (0.0%) |
| 35 to 64 Years | 0 (0.0%) | 22 (8.4%) |
| 65 to 74 Years | 0 (0.0%) | 6 (9.2%) |
| 75 Years and over | 9 (13.9%) | 3 (3.6%) |
Technology Access in South Carthage
Computing Device Access in South Carthage
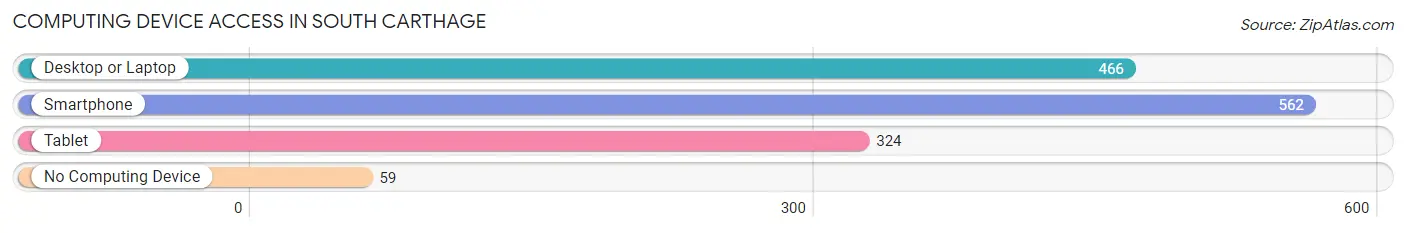
| Device Type | # Households | % Households |
| Desktop or Laptop | 466 | 67.9% |
| Smartphone | 562 | 81.9% |
| Tablet | 324 | 47.2% |
| No Computing Device | 59 | 8.6% |
| Total | 686 | 100.0% |
Internet Access in South Carthage
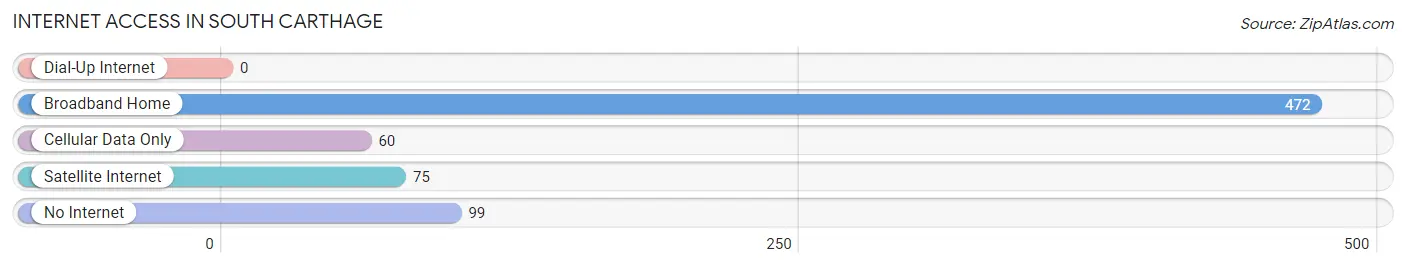
| Internet Type | # Households | % Households |
| Dial-Up Internet | 0 | 0.0% |
| Broadband Home | 472 | 68.8% |
| Cellular Data Only | 60 | 8.7% |
| Satellite Internet | 75 | 10.9% |
| No Internet | 99 | 14.4% |
| Total | 686 | 100.0% |
South Carthage Summary
South Carthage is a small town located in Smith County, Tennessee. It is situated on the banks of the Caney Fork River, approximately 25 miles northeast of Nashville. The town has a population of 1,845 people, according to the 2010 census.
History
South Carthage was founded in 1817 by a group of settlers from North Carolina. The town was named after the ancient city of Carthage, which was located in present-day Tunisia. The settlers were attracted to the area due to its fertile soil and abundant natural resources.
The town quickly grew and prospered, becoming an important center for trade and commerce. In 1820, the first post office was established in South Carthage. The town was incorporated in 1836 and the first mayor was elected in 1837.
In the late 19th century, South Carthage was a major producer of tobacco and cotton. The town also had several mills and factories, including a cotton mill, a grist mill, and a sawmill.
Geography
South Carthage is located in the central part of Smith County, Tennessee. It is situated on the banks of the Caney Fork River, approximately 25 miles northeast of Nashville. The town has a total area of 2.2 square miles, all of which is land.
The terrain of South Carthage is mostly flat, with some rolling hills. The town is located in a humid subtropical climate zone, with hot summers and mild winters. The average annual temperature is around 60 degrees Fahrenheit.
Economy
The economy of South Carthage is largely based on agriculture. The town is home to several farms, which produce a variety of crops, including corn, soybeans, and tobacco. The town also has several small businesses, including restaurants, retail stores, and service providers.
The town is also home to several manufacturing companies, including a furniture factory and a plastics factory. The town is served by the Smith County Airport, which provides air transportation to the surrounding area.
Demographics
According to the 2010 census, South Carthage has a population of 1,845 people. The town has a median household income of $37,917 and a median family income of $45,917. The town has a poverty rate of 17.3%, which is higher than the national average.
The racial makeup of South Carthage is 97.2% White, 0.9% African American, 0.2% Native American, 0.2% Asian, 0.1% Pacific Islander, and 1.4% from other races. The town has a Hispanic or Latino population of 1.4%.
Conclusion
South Carthage is a small town located in Smith County, Tennessee. It was founded in 1817 and has a population of 1,845 people, according to the 2010 census. The town has a largely agricultural economy, with several farms and small businesses. The town also has several manufacturing companies and is served by the Smith County Airport. The racial makeup of South Carthage is 97.2% White, 0.9% African American, 0.2% Native American, 0.2% Asian, 0.1% Pacific Islander, and 1.4% from other races. The town has a median household income of $37,917 and a poverty rate of 17.3%.
Common Questions
What is Per Capita Income in South Carthage?
Per Capita income in South Carthage is $24,486.
What is the Median Family Income in South Carthage?
Median Family Income in South Carthage is $46,912.
What is the Median Household income in South Carthage?
Median Household Income in South Carthage is $45,804.
What is Income or Wage Gap in South Carthage?
Income or Wage Gap in South Carthage is 1.6%.
Women in South Carthage earn 98.4 cents for every dollar earned by a man.
What is Family Income Deficit in South Carthage?
Family Income Deficit in South Carthage is $8,863.
Families that are below poverty line in South Carthage earn $8,863 less on average than the poverty threshold level.
What is Inequality or Gini Index in South Carthage?
Inequality or Gini Index in South Carthage is 0.41.
What is the Total Population of South Carthage?
Total Population of South Carthage is 1,698.
What is the Total Male Population of South Carthage?
Total Male Population of South Carthage is 856.
What is the Total Female Population of South Carthage?
Total Female Population of South Carthage is 842.
What is the Ratio of Males per 100 Females in South Carthage?
There are 101.66 Males per 100 Females in South Carthage.
What is the Ratio of Females per 100 Males in South Carthage?
There are 98.36 Females per 100 Males in South Carthage.
What is the Median Population Age in South Carthage?
Median Population Age in South Carthage is 33.7 Years.
What is the Average Family Size in South Carthage
Average Family Size in South Carthage is 3.0 People.
What is the Average Household Size in South Carthage
Average Household Size in South Carthage is 2.5 People.
How Large is the Labor Force in South Carthage?
There are 762 People in the Labor Forcein in South Carthage.
What is the Percentage of People in the Labor Force in South Carthage?
57.0% of People are in the Labor Force in South Carthage.
What is the Unemployment Rate in South Carthage?
Unemployment Rate in South Carthage is 1.4%.