Zip Codes with the Highest Percentage of Population Employed in Life, Physical & Social Science in Chattanooga, TN
RELATED REPORTS & OPTIONS
Life, Physical & Social Science
Chattanooga
Compare Zip Codes
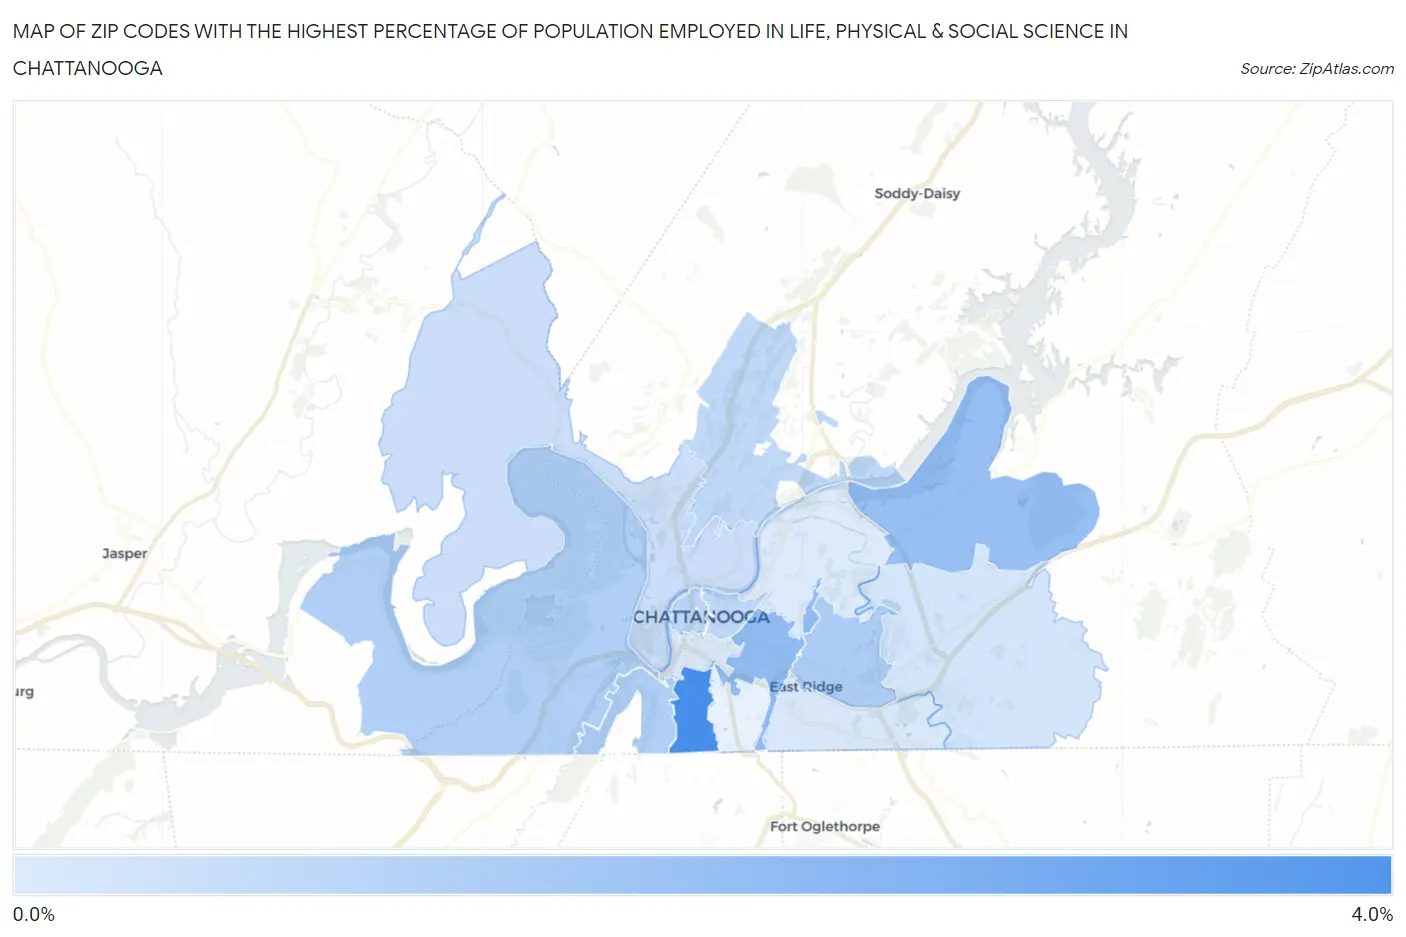
Map of Zip Codes with the Highest Percentage of Population Employed in Life, Physical & Social Science in Chattanooga
0.18%
3.8%
Zip Codes with the Highest Percentage of Population Employed in Life, Physical & Social Science in Chattanooga, TN
| Zip Code | % Employed | vs State | vs National | |
| 1. | 37410 | 3.8% | 0.83%(+2.99)#11 | 1.1%(+2.73)#1,251 |
| 2. | 37404 | 2.0% | 0.83%(+1.16)#52 | 1.1%(+0.901)#3,707 |
| 3. | 37416 | 1.8% | 0.83%(+1.01)#64 | 1.1%(+0.750)#4,172 |
| 4. | 37411 | 1.3% | 0.83%(+0.492)#93 | 1.1%(+0.233)#6,641 |
| 5. | 37409 | 1.3% | 0.83%(+0.421)#105 | 1.1%(+0.161)#7,116 |
| 6. | 37419 | 1.2% | 0.83%(+0.418)#107 | 1.1%(+0.158)#7,141 |
| 7. | 37402 | 0.97% | 0.83%(+0.143)#150 | 1.1%(-0.117)#9,287 |
| 8. | 37403 | 0.91% | 0.83%(+0.078)#166 | 1.1%(-0.182)#9,875 |
| 9. | 37415 | 0.91% | 0.83%(+0.077)#167 | 1.1%(-0.182)#9,880 |
| 10. | 37405 | 0.59% | 0.83%(-0.241)#223 | 1.1%(-0.500)#13,404 |
| 11. | 37421 | 0.41% | 0.83%(-0.425)#268 | 1.1%(-0.685)#15,676 |
| 12. | 37412 | 0.29% | 0.83%(-0.542)#307 | 1.1%(-0.802)#17,192 |
| 13. | 37408 | 0.24% | 0.83%(-0.588)#319 | 1.1%(-0.847)#17,701 |
| 14. | 37406 | 0.18% | 0.83%(-0.656)#337 | 1.1%(-0.916)#18,440 |
1
Common Questions
What are the Top 10 Zip Codes with the Highest Percentage of Population Employed in Life, Physical & Social Science in Chattanooga, TN?
Top 10 Zip Codes with the Highest Percentage of Population Employed in Life, Physical & Social Science in Chattanooga, TN are:
What zip code has the Highest Percentage of Population Employed in Life, Physical & Social Science in Chattanooga, TN?
37410 has the Highest Percentage of Population Employed in Life, Physical & Social Science in Chattanooga, TN with 3.8%.
What is the Percentage of Population Employed in Life, Physical & Social Science in Chattanooga, TN?
Percentage of Population Employed in Life, Physical & Social Science in Chattanooga is 0.85%.
What is the Percentage of Population Employed in Life, Physical & Social Science in Tennessee?
Percentage of Population Employed in Life, Physical & Social Science in Tennessee is 0.83%.
What is the Percentage of Population Employed in Life, Physical & Social Science in the United States?
Percentage of Population Employed in Life, Physical & Social Science in the United States is 1.1%.