Sweetwater, OK Map & Demographics
Sweetwater Map
Sweetwater Overview
$28,302
PER CAPITA INCOME
$74,821
AVG FAMILY INCOME
$53,750
AVG HOUSEHOLD INCOME
14.3%
WAGE / INCOME GAP [ % ]
85.7¢/ $1
WAGE / INCOME GAP [ $ ]
0.26
INEQUALITY / GINI INDEX
143
TOTAL POPULATION
65
MALE POPULATION
78
FEMALE POPULATION
83.33
MALES / 100 FEMALES
120.00
FEMALES / 100 MALES
38.1
MEDIAN AGE
2.9
AVG FAMILY SIZE
2.0
AVG HOUSEHOLD SIZE
66
LABOR FORCE [ PEOPLE ]
70.2%
PERCENT IN LABOR FORCE
Sweetwater Zip Codes
Sweetwater Area Codes
Income in Sweetwater
Income Overview in Sweetwater
Per Capita Income in Sweetwater is $28,302, while median incomes of families and households are $74,821 and $53,750 respectively.
| Characteristic | Number | Measure |
| Per Capita Income | 143 | $28,302 |
| Median Family Income | 37 | $74,821 |
| Mean Family Income | 37 | $72,341 |
| Median Household Income | 72 | $53,750 |
| Mean Household Income | 72 | $57,788 |
| Income Deficit | 37 | $0 |
| Wage / Income Gap (%) | 143 | 14.29% |
| Wage / Income Gap ($) | 143 | 85.71¢ per $1 |
| Gini / Inequality Index | 143 | 0.26 |
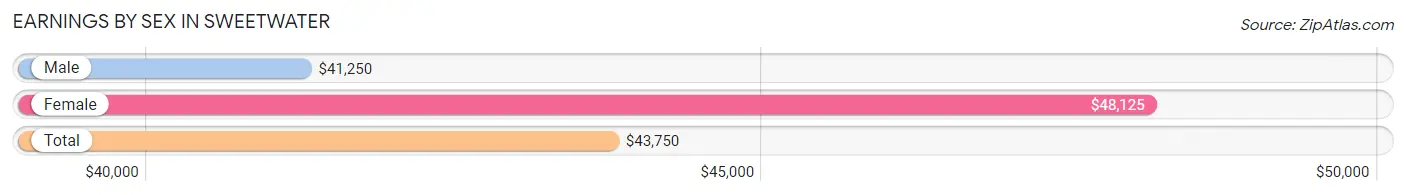
Earnings by Sex in Sweetwater
Average Earnings in Sweetwater are $43,750, $41,250 for men and $48,125 for women, a difference of 14.3%.
| Sex | Number | Average Earnings |
| Male | 38 (55.9%) | $41,250 |
| Female | 30 (44.1%) | $48,125 |
| Total | 68 (100.0%) | $43,750 |
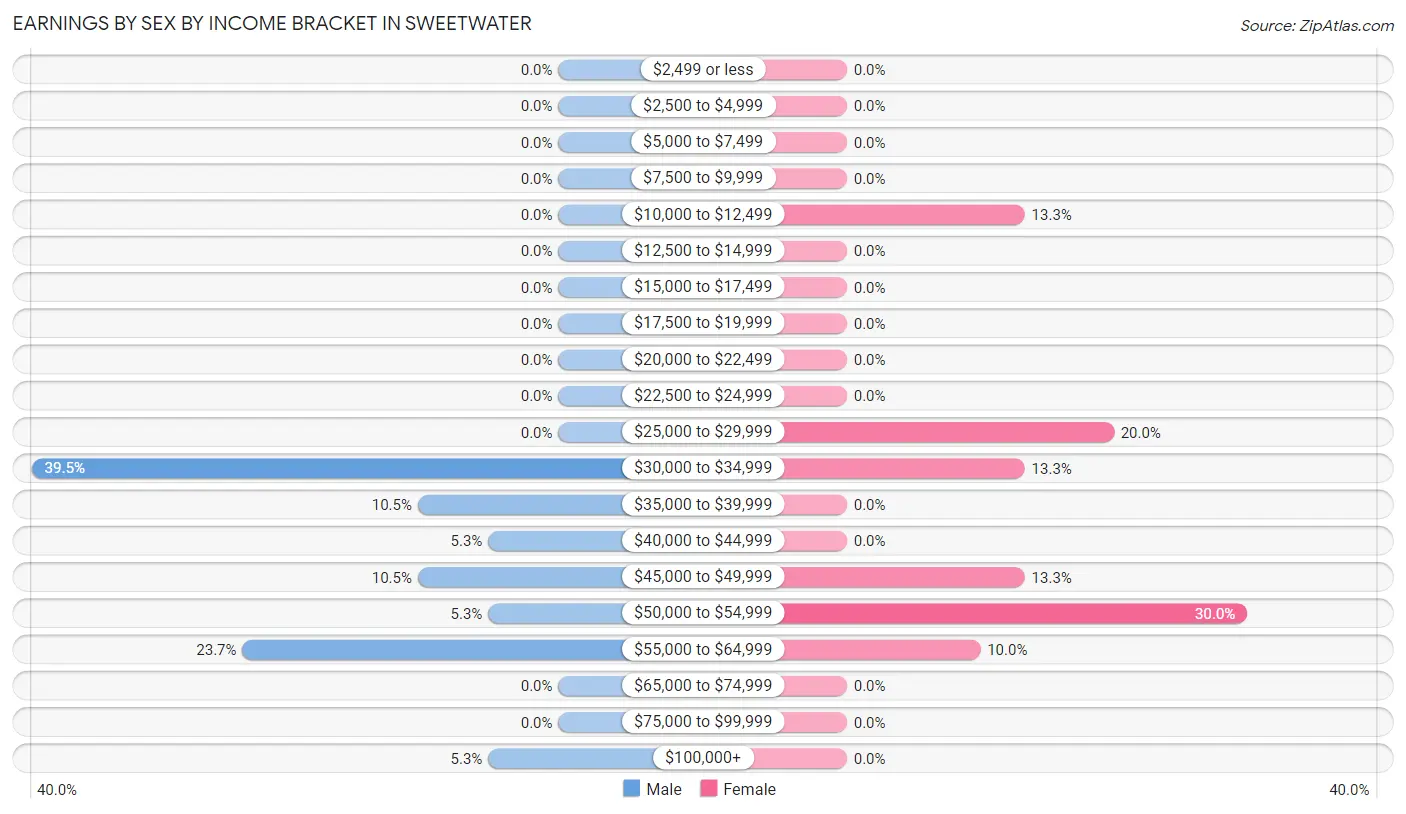
Earnings by Sex by Income Bracket in Sweetwater
The most common earnings brackets in Sweetwater are $30,000 to $34,999 for men (15 | 39.5%) and $50,000 to $54,999 for women (9 | 30.0%).
| Income | Male | Female |
| $2,499 or less | 0 (0.0%) | 0 (0.0%) |
| $2,500 to $4,999 | 0 (0.0%) | 0 (0.0%) |
| $5,000 to $7,499 | 0 (0.0%) | 0 (0.0%) |
| $7,500 to $9,999 | 0 (0.0%) | 0 (0.0%) |
| $10,000 to $12,499 | 0 (0.0%) | 4 (13.3%) |
| $12,500 to $14,999 | 0 (0.0%) | 0 (0.0%) |
| $15,000 to $17,499 | 0 (0.0%) | 0 (0.0%) |
| $17,500 to $19,999 | 0 (0.0%) | 0 (0.0%) |
| $20,000 to $22,499 | 0 (0.0%) | 0 (0.0%) |
| $22,500 to $24,999 | 0 (0.0%) | 0 (0.0%) |
| $25,000 to $29,999 | 0 (0.0%) | 6 (20.0%) |
| $30,000 to $34,999 | 15 (39.5%) | 4 (13.3%) |
| $35,000 to $39,999 | 4 (10.5%) | 0 (0.0%) |
| $40,000 to $44,999 | 2 (5.3%) | 0 (0.0%) |
| $45,000 to $49,999 | 4 (10.5%) | 4 (13.3%) |
| $50,000 to $54,999 | 2 (5.3%) | 9 (30.0%) |
| $55,000 to $64,999 | 9 (23.7%) | 3 (10.0%) |
| $65,000 to $74,999 | 0 (0.0%) | 0 (0.0%) |
| $75,000 to $99,999 | 0 (0.0%) | 0 (0.0%) |
| $100,000+ | 2 (5.3%) | 0 (0.0%) |
| Total | 38 (100.0%) | 30 (100.0%) |
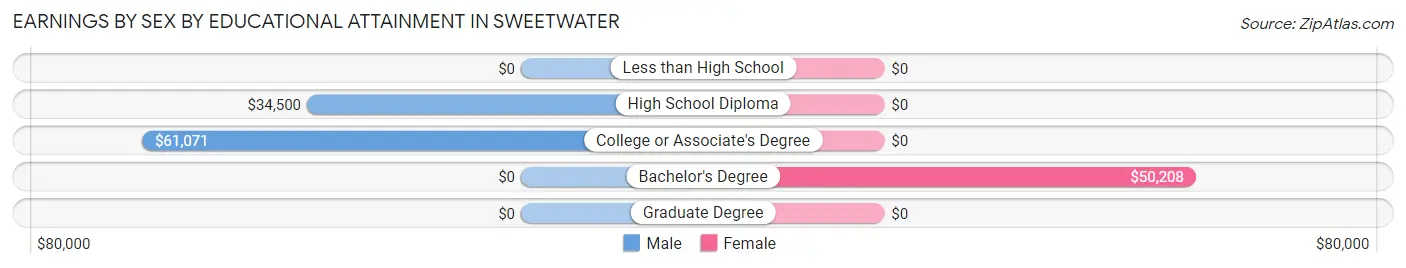
Earnings by Sex by Educational Attainment in Sweetwater
Average earnings in Sweetwater are $41,250 for men and $50,000 for women, a difference of 17.5%. Men with an educational attainment of college or associate's degree enjoy the highest average annual earnings of $61,071, while those with high school diploma education earn the least with $34,500. Women with an educational attainment of bachelor's degree earn the most with the average annual earnings of $50,208, while those with bachelor's degree education have the smallest earnings of $50,208.
| Educational Attainment | Male Income | Female Income |
| Less than High School | - | - |
| High School Diploma | $34,500 | $0 |
| College or Associate's Degree | $61,071 | $0 |
| Bachelor's Degree | - | - |
| Graduate Degree | - | - |
| Total | $41,250 | $50,000 |
Family Income in Sweetwater
Family Income Brackets in Sweetwater
According to the Sweetwater family income data, there are 14 families falling into the $75,000 to $99,999 income range, which is the most common income bracket and makes up 37.8% of all families.
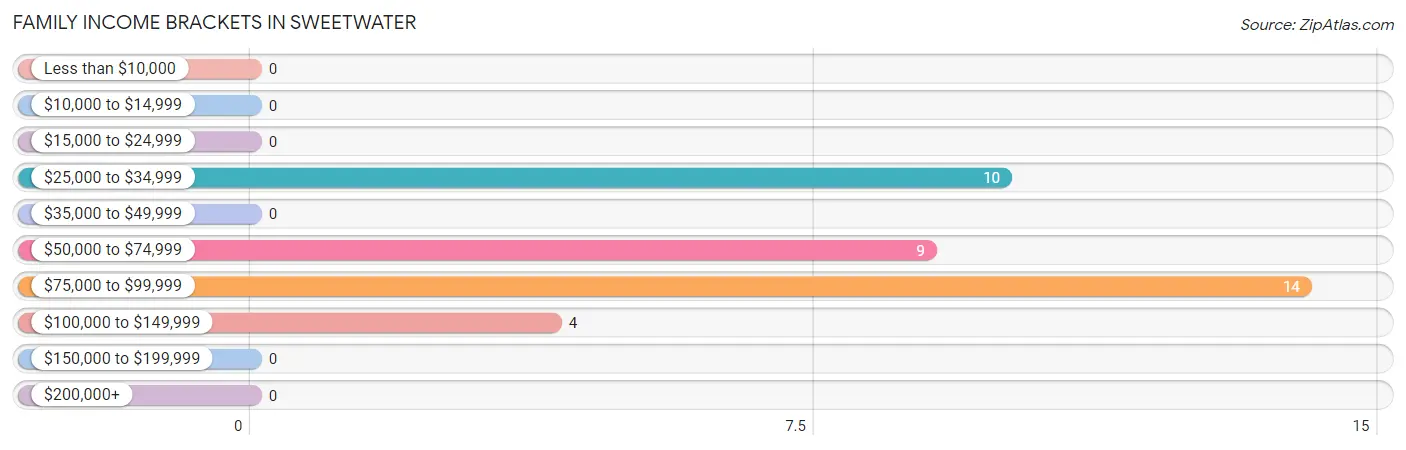
| Income Bracket | # Families | % Families |
| Less than $10,000 | 0 | 0.0% |
| $10,000 to $14,999 | 0 | 0.0% |
| $15,000 to $24,999 | 0 | 0.0% |
| $25,000 to $34,999 | 10 | 27.0% |
| $35,000 to $49,999 | 0 | 0.0% |
| $50,000 to $74,999 | 9 | 24.3% |
| $75,000 to $99,999 | 14 | 37.8% |
| $100,000 to $149,999 | 4 | 10.8% |
| $150,000 to $199,999 | 0 | 0.0% |
| $200,000+ | 0 | 0.0% |
Family Income by Famaliy Size in Sweetwater
4-person families (10 | 27.0%) account for the highest median family income in Sweetwater with $98,125 per family, while 2-person families (5 | 13.5%) have the highest median income of $40,625 per family member.
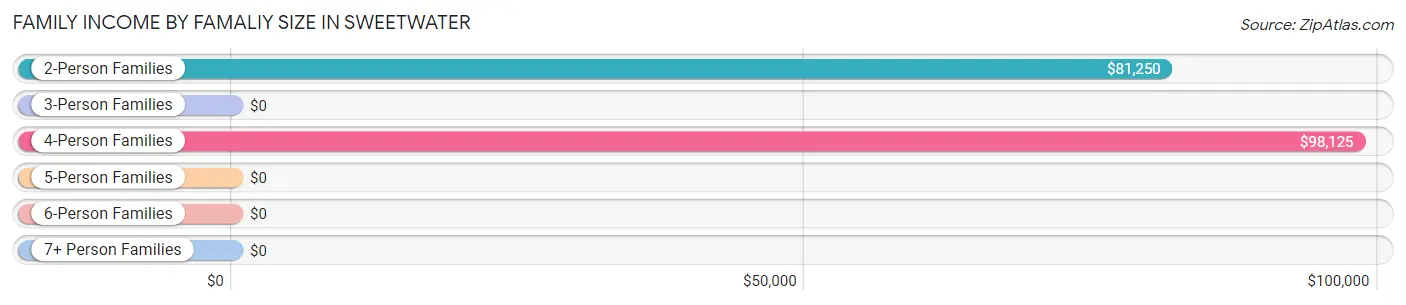
| Income Bracket | # Families | Median Income |
| 2-Person Families | 5 (13.5%) | $81,250 |
| 3-Person Families | 20 (54.0%) | $0 |
| 4-Person Families | 10 (27.0%) | $98,125 |
| 5-Person Families | 2 (5.4%) | $0 |
| 6-Person Families | 0 (0.0%) | $0 |
| 7+ Person Families | 0 (0.0%) | $0 |
| Total | 37 (100.0%) | $74,821 |
Family Income by Number of Earners in Sweetwater
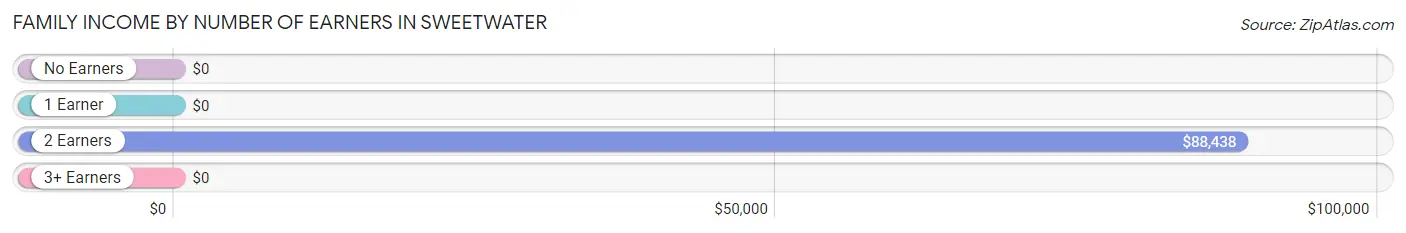
| Number of Earners | # Families | Median Income |
| No Earners | 0 (0.0%) | $0 |
| 1 Earner | 20 (54.0%) | $0 |
| 2 Earners | 17 (46.0%) | $88,438 |
| 3+ Earners | 0 (0.0%) | $0 |
| Total | 37 (100.0%) | $74,821 |
Household Income in Sweetwater
Household Income Brackets in Sweetwater
With 26 households falling in the category, the $50,000 to $74,999 income range is the most frequent in Sweetwater, accounting for 36.1% of all households.
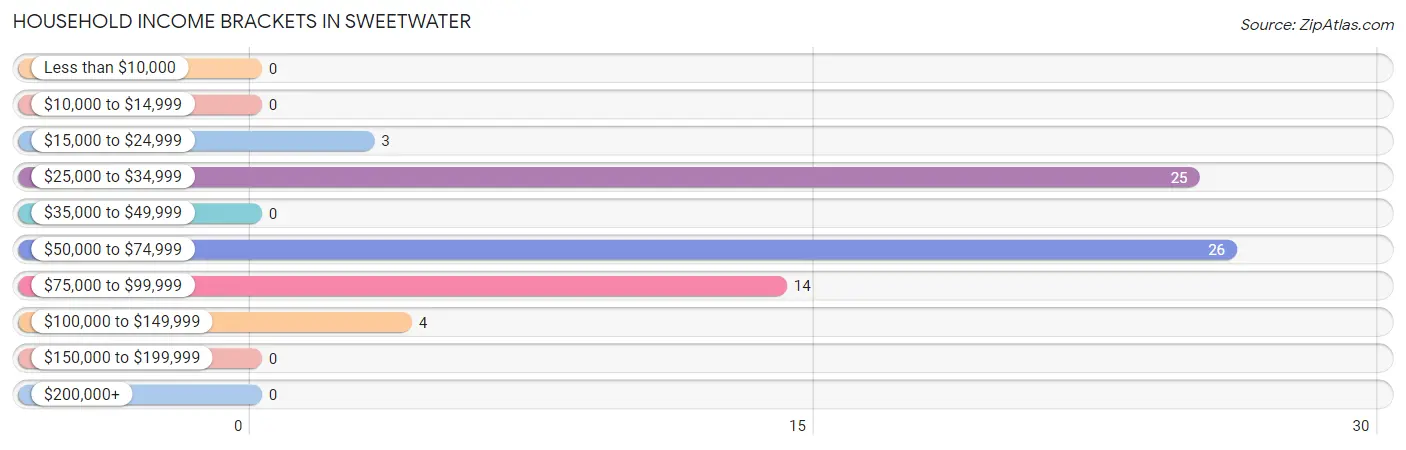
| Income Bracket | # Households | % Households |
| Less than $10,000 | 0 | 0.0% |
| $10,000 to $14,999 | 0 | 0.0% |
| $15,000 to $24,999 | 3 | 4.2% |
| $25,000 to $34,999 | 25 | 34.7% |
| $35,000 to $49,999 | 0 | 0.0% |
| $50,000 to $74,999 | 26 | 36.1% |
| $75,000 to $99,999 | 14 | 19.4% |
| $100,000 to $149,999 | 4 | 5.6% |
| $150,000 to $199,999 | 0 | 0.0% |
| $200,000+ | 0 | 0.0% |
Household Income by Householder Age in Sweetwater
The median household income in Sweetwater is $53,750, with the highest median household income of $81,667 found in the 25 to 44 years age bracket for the primary householder. A total of 26 households (36.1%) fall into this category. Meanwhile, the 15 to 24 years age bracket for the primary householder has the lowest median household income of $0, with 6 households (8.3%) in this group.
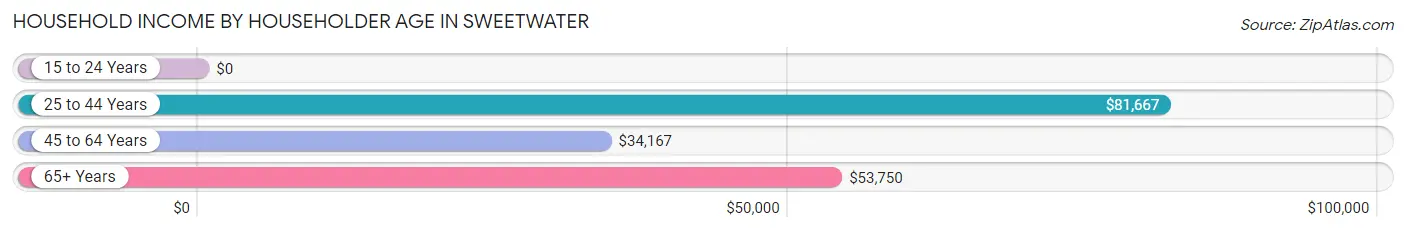
| Income Bracket | # Households | Median Income |
| 15 to 24 Years | 6 (8.3%) | $0 |
| 25 to 44 Years | 26 (36.1%) | $81,667 |
| 45 to 64 Years | 20 (27.8%) | $34,167 |
| 65+ Years | 20 (27.8%) | $53,750 |
| Total | 72 (100.0%) | $53,750 |
Poverty in Sweetwater
Income Below Poverty by Sex and Age in Sweetwater
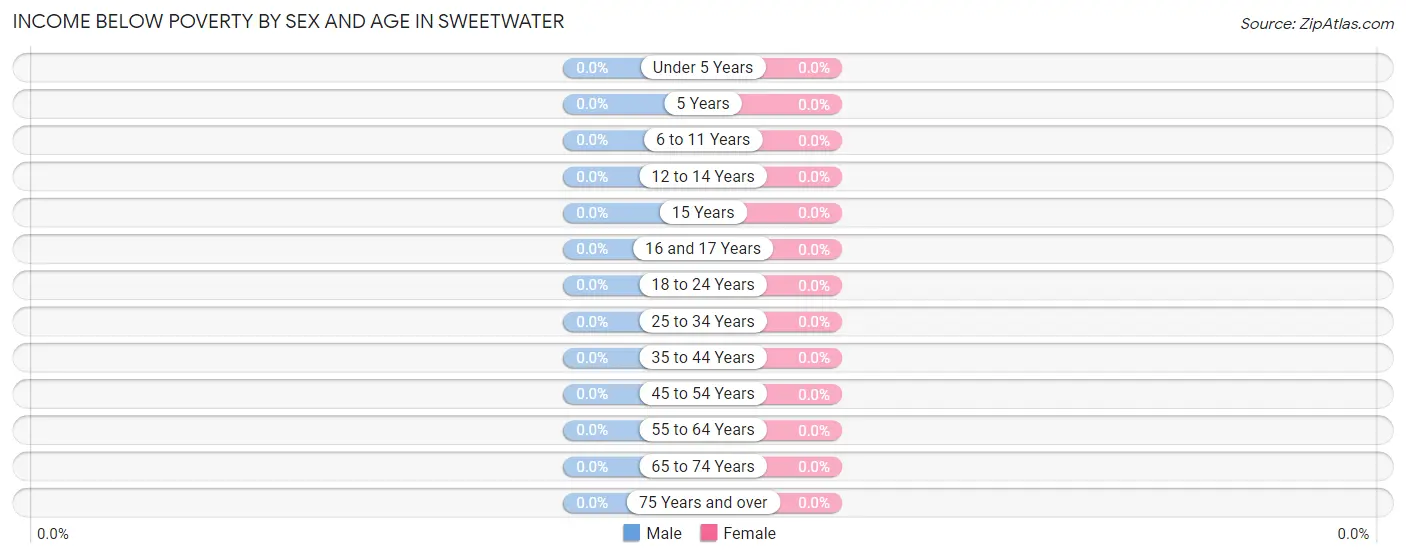
| Age Bracket | Male | Female |
| Under 5 Years | 0 (0.0%) | 0 (0.0%) |
| 5 Years | 0 (0.0%) | 0 (0.0%) |
| 6 to 11 Years | 0 (0.0%) | 0 (0.0%) |
| 12 to 14 Years | 0 (0.0%) | 0 (0.0%) |
| 15 Years | 0 (0.0%) | 0 (0.0%) |
| 16 and 17 Years | 0 (0.0%) | 0 (0.0%) |
| 18 to 24 Years | 0 (0.0%) | 0 (0.0%) |
| 25 to 34 Years | 0 (0.0%) | 0 (0.0%) |
| 35 to 44 Years | 0 (0.0%) | 0 (0.0%) |
| 45 to 54 Years | 0 (0.0%) | 0 (0.0%) |
| 55 to 64 Years | 0 (0.0%) | 0 (0.0%) |
| 65 to 74 Years | 0 (0.0%) | 0 (0.0%) |
| 75 Years and over | 0 (0.0%) | 0 (0.0%) |
| Total | 0 (0.0%) | 0 (0.0%) |
Income Above Poverty by Sex and Age in Sweetwater
According to the poverty statistics in Sweetwater, males aged under 5 years and females aged under 5 years are the age groups that are most secure financially, with 100.0% of males and 100.0% of females in these age groups living above the poverty line.
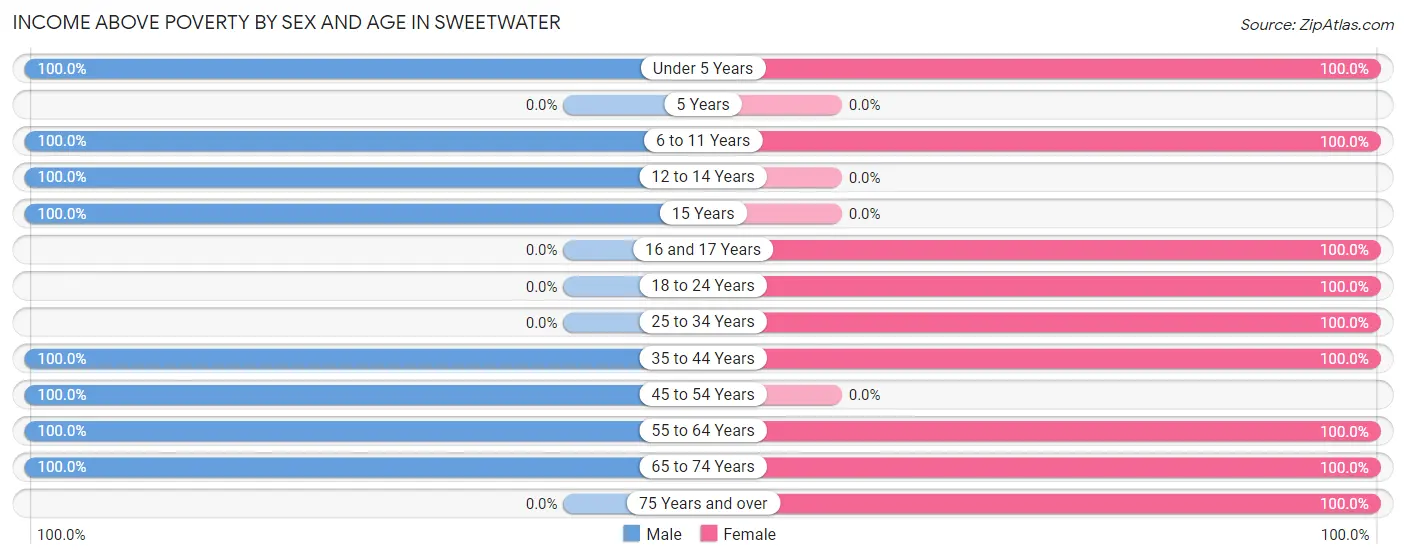
| Age Bracket | Male | Female |
| Under 5 Years | 2 (100.0%) | 7 (100.0%) |
| 5 Years | 0 (0.0%) | 0 (0.0%) |
| 6 to 11 Years | 5 (100.0%) | 29 (100.0%) |
| 12 to 14 Years | 5 (100.0%) | 0 (0.0%) |
| 15 Years | 1 (100.0%) | 0 (0.0%) |
| 16 and 17 Years | 0 (0.0%) | 2 (100.0%) |
| 18 to 24 Years | 0 (0.0%) | 6 (100.0%) |
| 25 to 34 Years | 0 (0.0%) | 4 (100.0%) |
| 35 to 44 Years | 18 (100.0%) | 19 (100.0%) |
| 45 to 54 Years | 15 (100.0%) | 0 (0.0%) |
| 55 to 64 Years | 2 (100.0%) | 6 (100.0%) |
| 65 to 74 Years | 17 (100.0%) | 4 (100.0%) |
| 75 Years and over | 0 (0.0%) | 1 (100.0%) |
| Total | 65 (100.0%) | 78 (100.0%) |
Income Below Poverty Among Married-Couple Families in Sweetwater
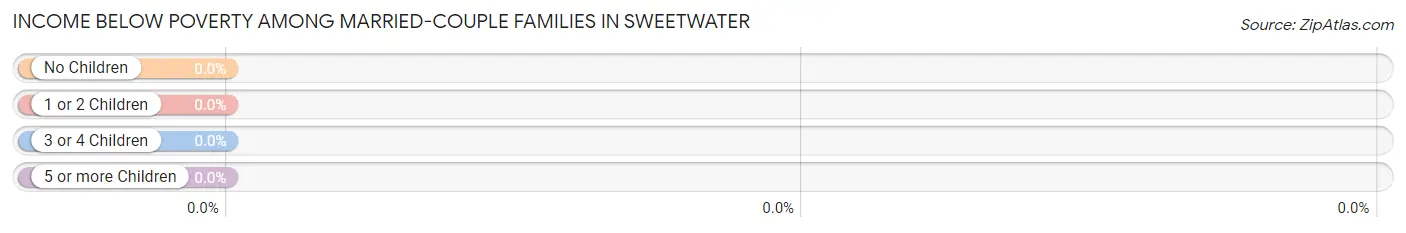
| Children | Above Poverty | Below Poverty |
| No Children | 5 (100.0%) | 0 (0.0%) |
| 1 or 2 Children | 17 (100.0%) | 0 (0.0%) |
| 3 or 4 Children | 2 (100.0%) | 0 (0.0%) |
| 5 or more Children | 0 (0.0%) | 0 (0.0%) |
| Total | 24 (100.0%) | 0 (0.0%) |
Income Below Poverty Among Single-Parent Households in Sweetwater
| Children | Single Father | Single Mother |
| No Children | 0 (0.0%) | 0 (0.0%) |
| 1 or 2 Children | 0 (0.0%) | 0 (0.0%) |
| 3 or 4 Children | 0 (0.0%) | 0 (0.0%) |
| 5 or more Children | 0 (0.0%) | 0 (0.0%) |
| Total | 0 (0.0%) | 0 (0.0%) |
Income Below Poverty Among Married-Couple vs Single-Parent Households in Sweetwater
| Children | Married-Couple Families | Single-Parent Households |
| No Children | 0 (0.0%) | 0 (0.0%) |
| 1 or 2 Children | 0 (0.0%) | 0 (0.0%) |
| 3 or 4 Children | 0 (0.0%) | 0 (0.0%) |
| 5 or more Children | 0 (0.0%) | 0 (0.0%) |
| Total | 0 (0.0%) | 0 (0.0%) |
Race in Sweetwater
The most populous races in Sweetwater are , and White / Caucasian (143 | 100.0%).
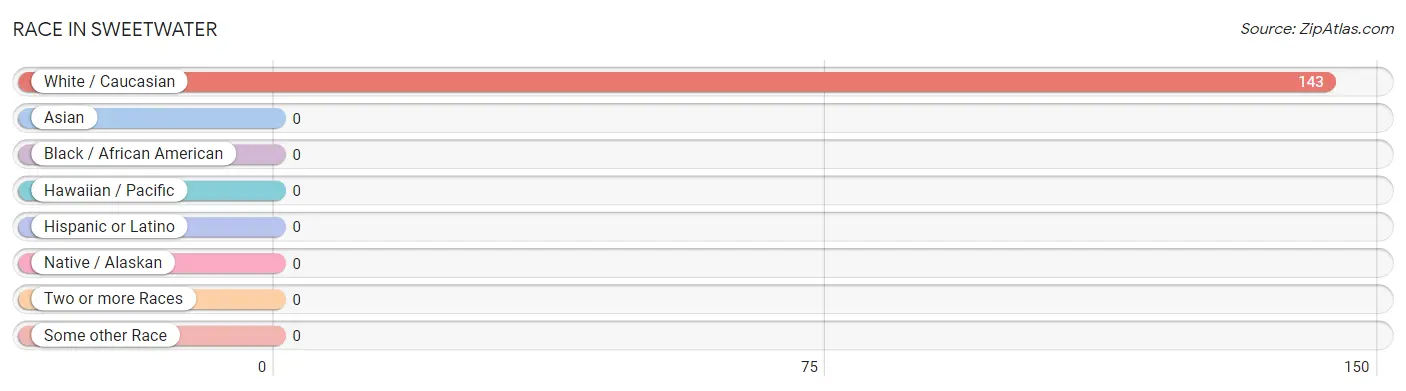
| Race | # Population | % Population |
| Asian | 0 | 0.0% |
| Black / African American | 0 | 0.0% |
| Hawaiian / Pacific | 0 | 0.0% |
| Hispanic or Latino | 0 | 0.0% |
| Native / Alaskan | 0 | 0.0% |
| White / Caucasian | 143 | 100.0% |
| Two or more Races | 0 | 0.0% |
| Some other Race | 0 | 0.0% |
| Total | 143 | 100.0% |
Ancestry in Sweetwater
The most populous ancestries reported in Sweetwater are German (49 | 34.3%), Irish (28 | 19.6%), Scottish (21 | 14.7%), English (8 | 5.6%), and Swedish (8 | 5.6%), together accounting for 79.7% of all Sweetwater residents.
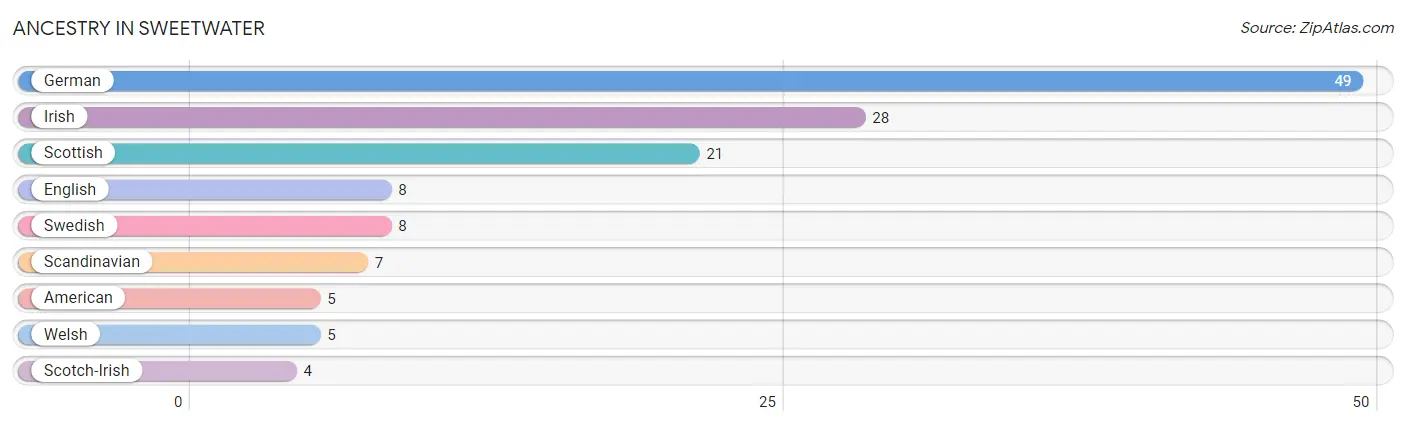
| Ancestry | # Population | % Population |
| American | 5 | 3.5% |
| English | 8 | 5.6% |
| German | 49 | 34.3% |
| Irish | 28 | 19.6% |
| Scandinavian | 7 | 4.9% |
| Scotch-Irish | 4 | 2.8% |
| Scottish | 21 | 14.7% |
| Swedish | 8 | 5.6% |
| Welsh | 5 | 3.5% | View All 9 Rows |
Immigrants in Sweetwater

| Immigration Origin | # Population | % Population | View All 0 Rows |
Sex and Age in Sweetwater
Sex and Age in Sweetwater
The most populous age groups in Sweetwater are 65 to 69 Years (17 | 26.2%) for men and 5 to 9 Years (22 | 28.2%) for women.
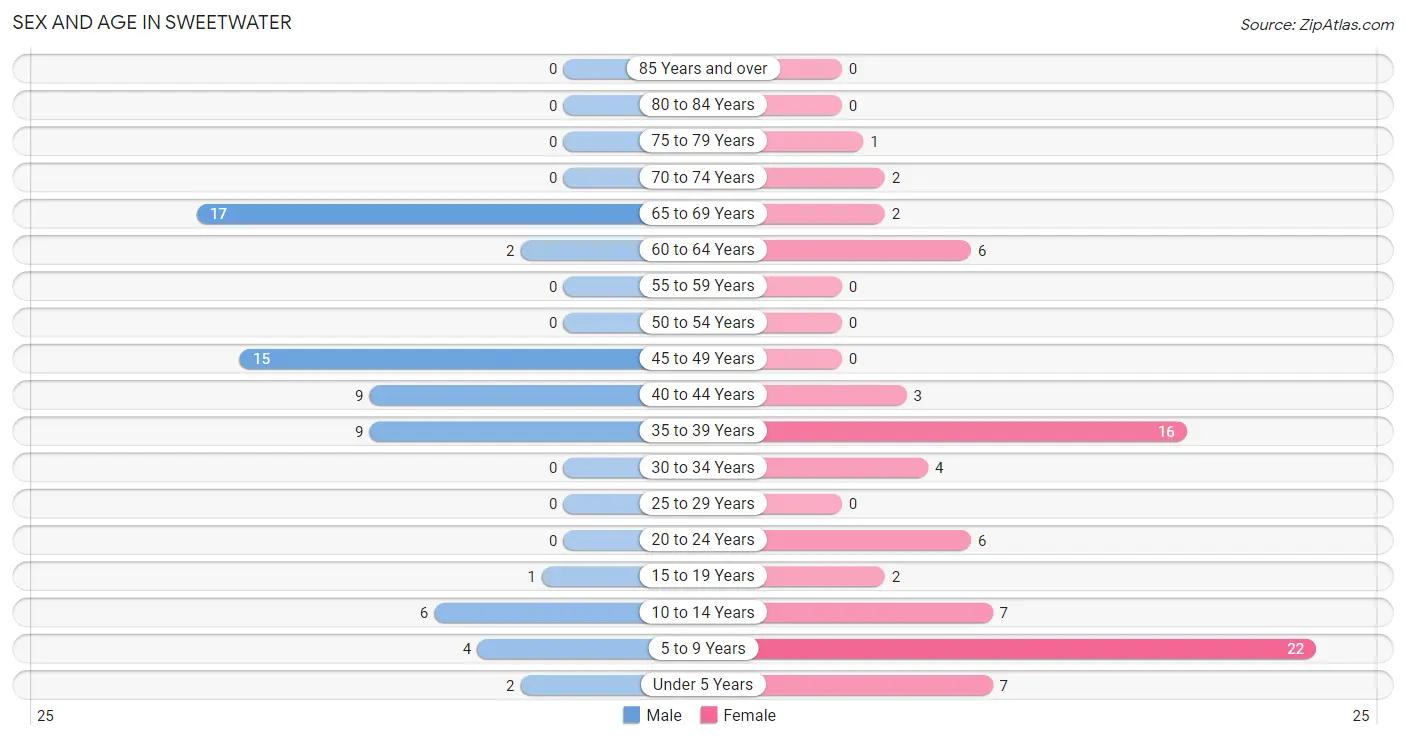
| Age Bracket | Male | Female |
| Under 5 Years | 2 (3.1%) | 7 (9.0%) |
| 5 to 9 Years | 4 (6.1%) | 22 (28.2%) |
| 10 to 14 Years | 6 (9.2%) | 7 (9.0%) |
| 15 to 19 Years | 1 (1.5%) | 2 (2.6%) |
| 20 to 24 Years | 0 (0.0%) | 6 (7.7%) |
| 25 to 29 Years | 0 (0.0%) | 0 (0.0%) |
| 30 to 34 Years | 0 (0.0%) | 4 (5.1%) |
| 35 to 39 Years | 9 (13.9%) | 16 (20.5%) |
| 40 to 44 Years | 9 (13.9%) | 3 (3.8%) |
| 45 to 49 Years | 15 (23.1%) | 0 (0.0%) |
| 50 to 54 Years | 0 (0.0%) | 0 (0.0%) |
| 55 to 59 Years | 0 (0.0%) | 0 (0.0%) |
| 60 to 64 Years | 2 (3.1%) | 6 (7.7%) |
| 65 to 69 Years | 17 (26.2%) | 2 (2.6%) |
| 70 to 74 Years | 0 (0.0%) | 2 (2.6%) |
| 75 to 79 Years | 0 (0.0%) | 1 (1.3%) |
| 80 to 84 Years | 0 (0.0%) | 0 (0.0%) |
| 85 Years and over | 0 (0.0%) | 0 (0.0%) |
| Total | 65 (100.0%) | 78 (100.0%) |
Families and Households in Sweetwater
Median Family Size in Sweetwater
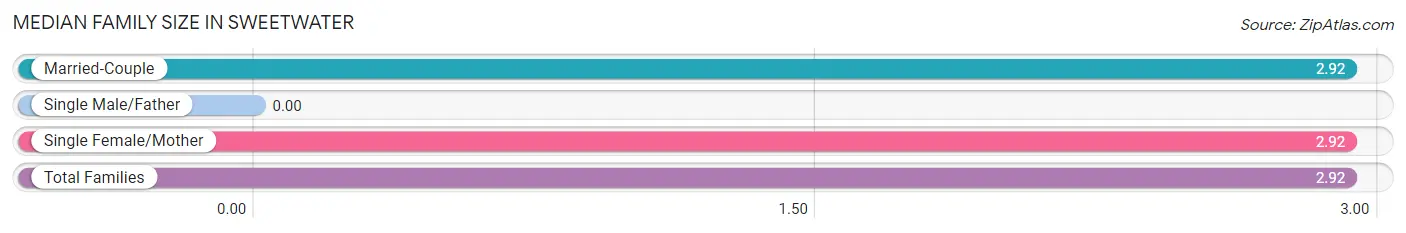
| Family Type | # Families | Family Size |
| Married-Couple | 24 (64.9%) | 2.92 |
| Single Male/Father | 0 (0.0%) | - |
| Single Female/Mother | 13 (35.1%) | 2.92 |
| Total Families | 37 (100.0%) | 2.92 |
Median Household Size in Sweetwater
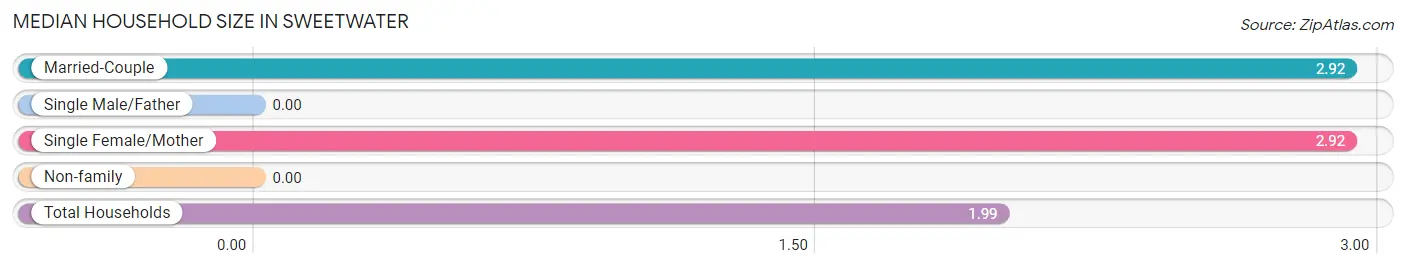
| Household Type | # Households | Household Size |
| Married-Couple | 24 (33.3%) | 2.92 |
| Single Male/Father | 0 (0.0%) | - |
| Single Female/Mother | 13 (18.1%) | 2.92 |
| Non-family | 35 (48.6%) | - |
| Total Households | 72 (100.0%) | 1.99 |
Household Size by Marriage Status in Sweetwater
Out of a total of 72 households in Sweetwater, 37 (51.4%) are family households, while 35 (48.6%) are nonfamily households. The most numerous type of family households are 3-person households, comprising 20, and the most common type of nonfamily households are 1-person households, comprising 35.
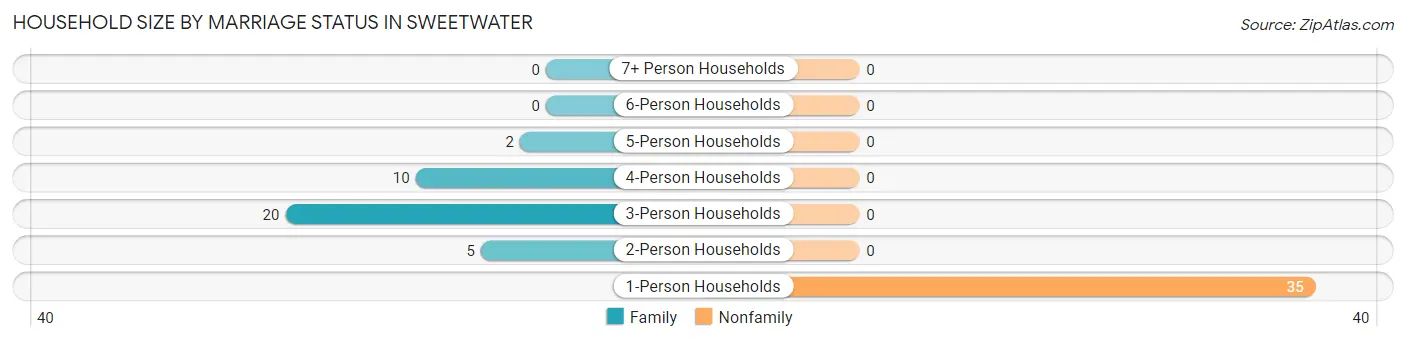
| Household Size | Family Households | Nonfamily Households |
| 1-Person Households | - | 35 (48.6%) |
| 2-Person Households | 5 (6.9%) | 0 (0.0%) |
| 3-Person Households | 20 (27.8%) | 0 (0.0%) |
| 4-Person Households | 10 (13.9%) | 0 (0.0%) |
| 5-Person Households | 2 (2.8%) | 0 (0.0%) |
| 6-Person Households | 0 (0.0%) | 0 (0.0%) |
| 7+ Person Households | 0 (0.0%) | 0 (0.0%) |
| Total | 37 (51.4%) | 35 (48.6%) |
Female Fertility in Sweetwater
Fertility by Age in Sweetwater
| Age Bracket | Women with Births | Births / 1,000 Women |
| 15 to 19 years | 0 (0.0%) | 0.0 |
| 20 to 34 years | 0 (0.0%) | 0.0 |
| 35 to 50 years | 0 (0.0%) | 0.0 |
| Total | 0 (0.0%) | 0.0 |
Fertility by Age by Marriage Status in Sweetwater
| Age Bracket | Married | Unmarried |
| 15 to 19 years | 0 (0.0%) | 0 (0.0%) |
| 20 to 34 years | 0 (0.0%) | 0 (0.0%) |
| 35 to 50 years | 0 (0.0%) | 0 (0.0%) |
| Total | 0 (0.0%) | 0 (0.0%) |
Fertility by Education in Sweetwater
| Educational Attainment | Women with Births | Births / 1,000 Women |
| Less than High School | 0 (0.0%) | 0.0 |
| High School Diploma | 0 (0.0%) | 0.0 |
| College or Associate's Degree | 0 (0.0%) | 0.0 |
| Bachelor's Degree | 0 (0.0%) | 0.0 |
| Graduate Degree | 0 (0.0%) | 0.0 |
| Total | 0 (0.0%) | 0.0 |
Fertility by Education by Marriage Status in Sweetwater
| Educational Attainment | Married | Unmarried |
| Less than High School | 0 (0.0%) | 0 (0.0%) |
| High School Diploma | 0 (0.0%) | 0 (0.0%) |
| College or Associate's Degree | 0 (0.0%) | 0 (0.0%) |
| Bachelor's Degree | 0 (0.0%) | 0 (0.0%) |
| Graduate Degree | 0 (0.0%) | 0 (0.0%) |
| Total | 0 (0.0%) | 0 (0.0%) |
Employment Characteristics in Sweetwater
Employment by Class of Employer in Sweetwater
Among the 66 employed individuals in Sweetwater, local government employees (37 | 56.1%), private company employees (10 | 15.1%), and not-for-profit organizations (7 | 10.6%) make up the most common classes of employment.
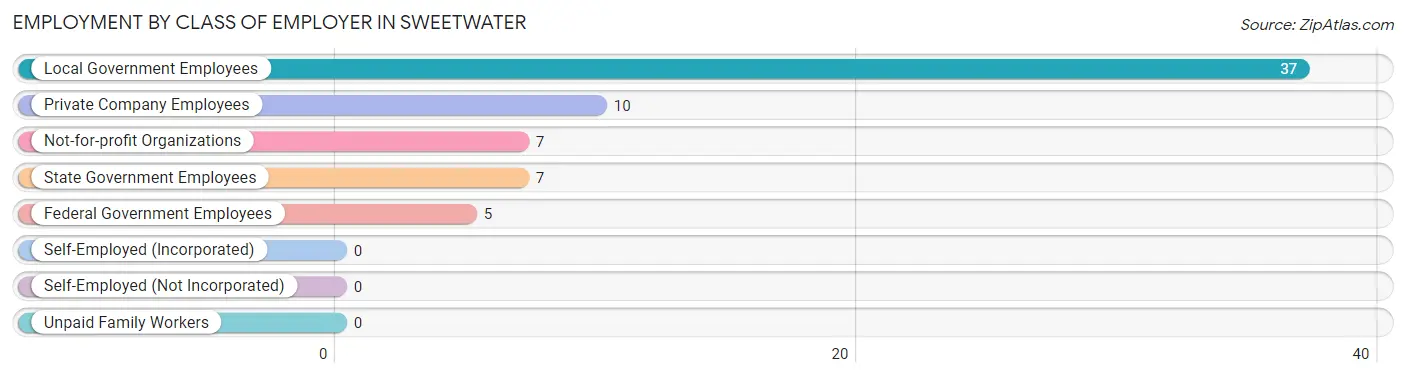
| Employer Class | # Employees | % Employees |
| Private Company Employees | 10 | 15.1% |
| Self-Employed (Incorporated) | 0 | 0.0% |
| Self-Employed (Not Incorporated) | 0 | 0.0% |
| Not-for-profit Organizations | 7 | 10.6% |
| Local Government Employees | 37 | 56.1% |
| State Government Employees | 7 | 10.6% |
| Federal Government Employees | 5 | 7.6% |
| Unpaid Family Workers | 0 | 0.0% |
| Total | 66 | 100.0% |
Employment Status by Age in Sweetwater
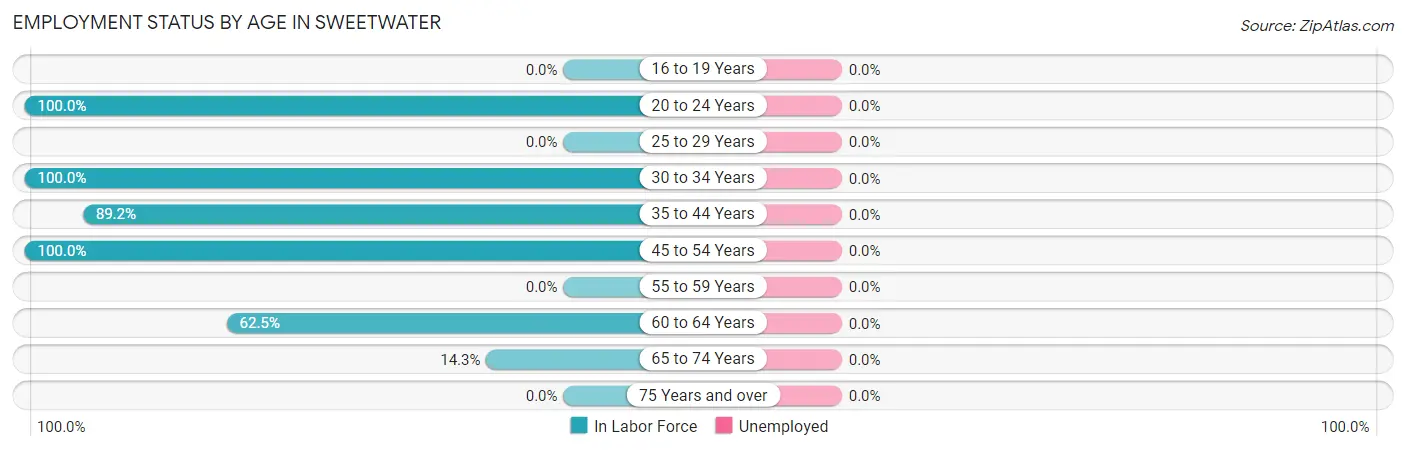
| Age Bracket | In Labor Force | Unemployed |
| 16 to 19 Years | 0 (0.0%) | 0 (0.0%) |
| 20 to 24 Years | 6 (100.0%) | 0 (0.0%) |
| 25 to 29 Years | 0 (0.0%) | 0 (0.0%) |
| 30 to 34 Years | 4 (100.0%) | 0 (0.0%) |
| 35 to 44 Years | 33 (89.2%) | 0 (0.0%) |
| 45 to 54 Years | 15 (100.0%) | 0 (0.0%) |
| 55 to 59 Years | 0 (0.0%) | 0 (0.0%) |
| 60 to 64 Years | 5 (62.5%) | 0 (0.0%) |
| 65 to 74 Years | 3 (14.3%) | 0 (0.0%) |
| 75 Years and over | 0 (0.0%) | 0 (0.0%) |
| Total | 66 (70.2%) | 0 (0.0%) |
Employment Status by Educational Attainment in Sweetwater
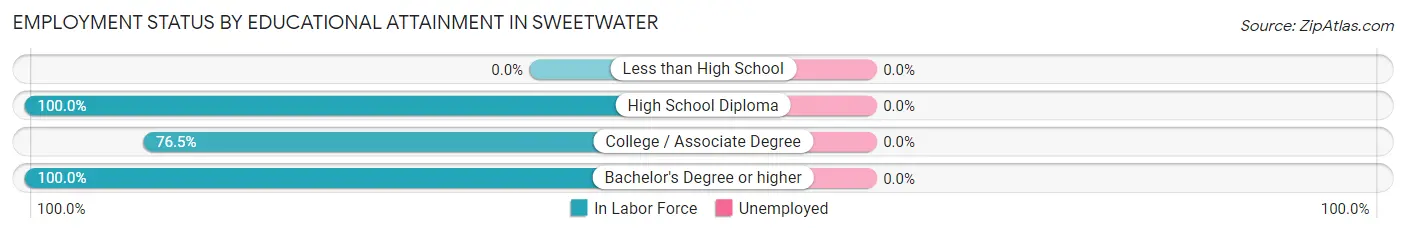
| Educational Attainment | In Labor Force | Unemployed |
| Less than High School | 0 (0.0%) | 0 (0.0%) |
| High School Diploma | 22 (100.0%) | 0 (0.0%) |
| College / Associate Degree | 13 (76.5%) | 0 (0.0%) |
| Bachelor's Degree or higher | 22 (100.0%) | 0 (0.0%) |
| Total | 57 (89.1%) | 0 (0.0%) |
Employment Occupations by Sex in Sweetwater
Management, Business, Science and Arts Occupations
The most common Management, Business, Science and Arts occupations in Sweetwater are Community & Social Service (22 | 33.3%), Education Instruction & Library (19 | 28.8%), and Education, Arts & Media (3 | 4.5%).
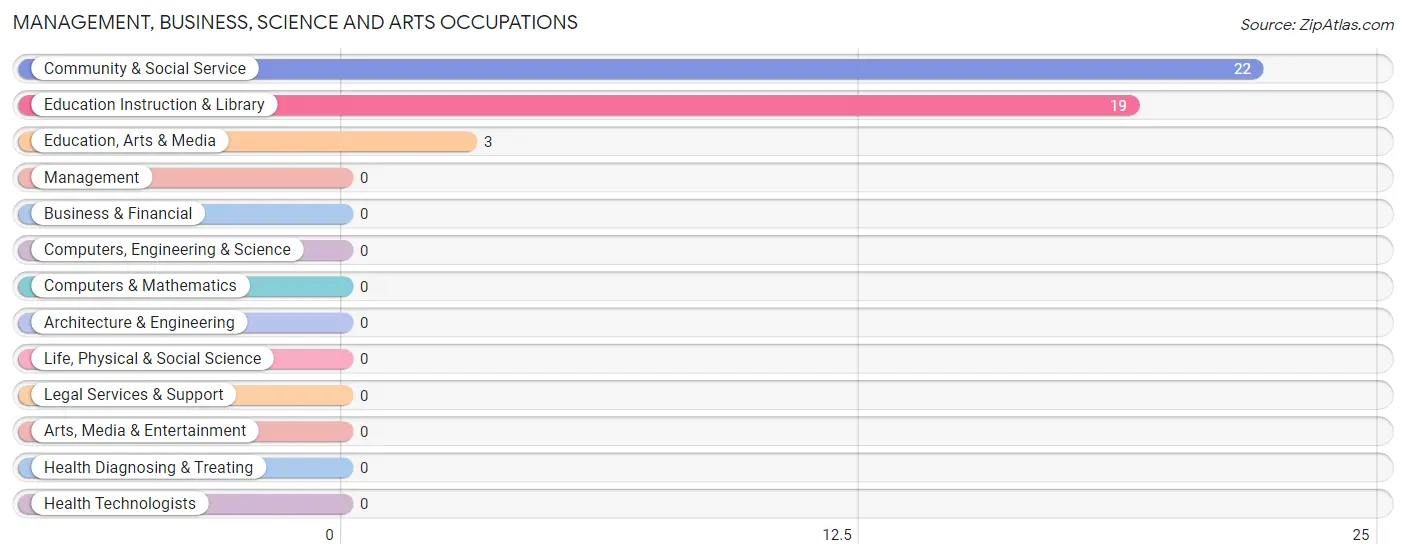
Management, Business, Science and Arts Occupations by Sex
Within the Management, Business, Science and Arts occupations in Sweetwater, the most male-oriented occupations are Education Instruction & Library (10.5%), and Community & Social Service (9.1%), while the most female-oriented occupations are Education, Arts & Media (100.0%), Community & Social Service (90.9%), and Education Instruction & Library (89.5%).
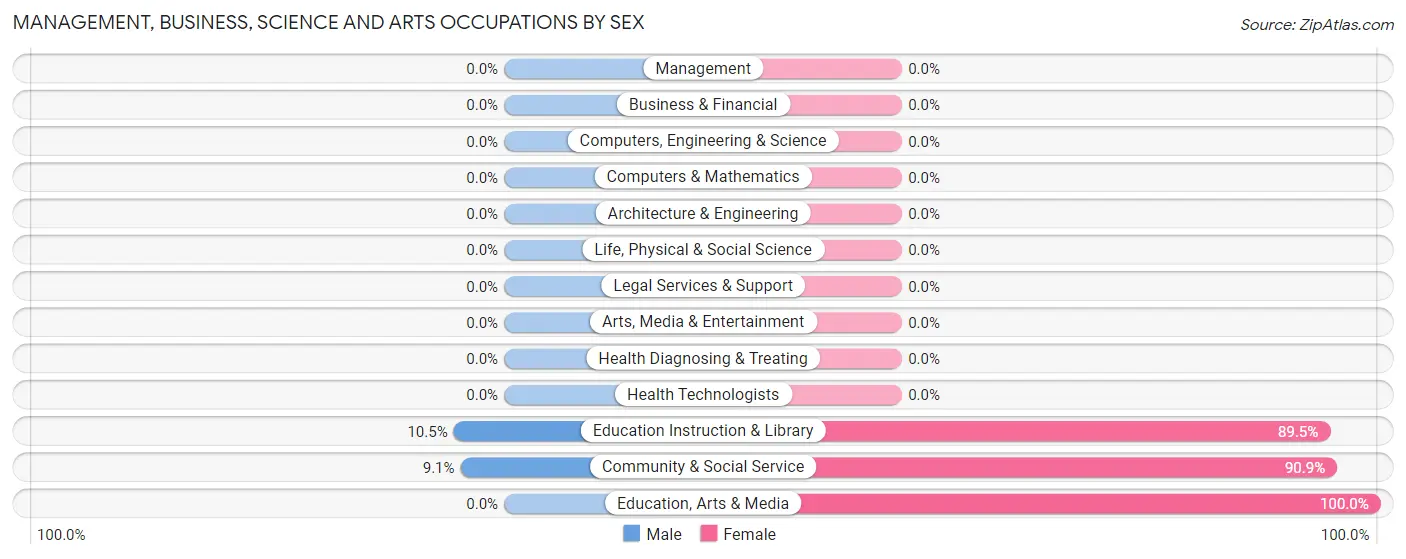
| Occupation | Male | Female |
| Management | 0 (0.0%) | 0 (0.0%) |
| Business & Financial | 0 (0.0%) | 0 (0.0%) |
| Computers, Engineering & Science | 0 (0.0%) | 0 (0.0%) |
| Computers & Mathematics | 0 (0.0%) | 0 (0.0%) |
| Architecture & Engineering | 0 (0.0%) | 0 (0.0%) |
| Life, Physical & Social Science | 0 (0.0%) | 0 (0.0%) |
| Community & Social Service | 2 (9.1%) | 20 (90.9%) |
| Education, Arts & Media | 0 (0.0%) | 3 (100.0%) |
| Legal Services & Support | 0 (0.0%) | 0 (0.0%) |
| Education Instruction & Library | 2 (10.5%) | 17 (89.5%) |
| Arts, Media & Entertainment | 0 (0.0%) | 0 (0.0%) |
| Health Diagnosing & Treating | 0 (0.0%) | 0 (0.0%) |
| Health Technologists | 0 (0.0%) | 0 (0.0%) |
| Total (Category) | 2 (9.1%) | 20 (90.9%) |
| Total (Overall) | 36 (54.5%) | 30 (45.5%) |
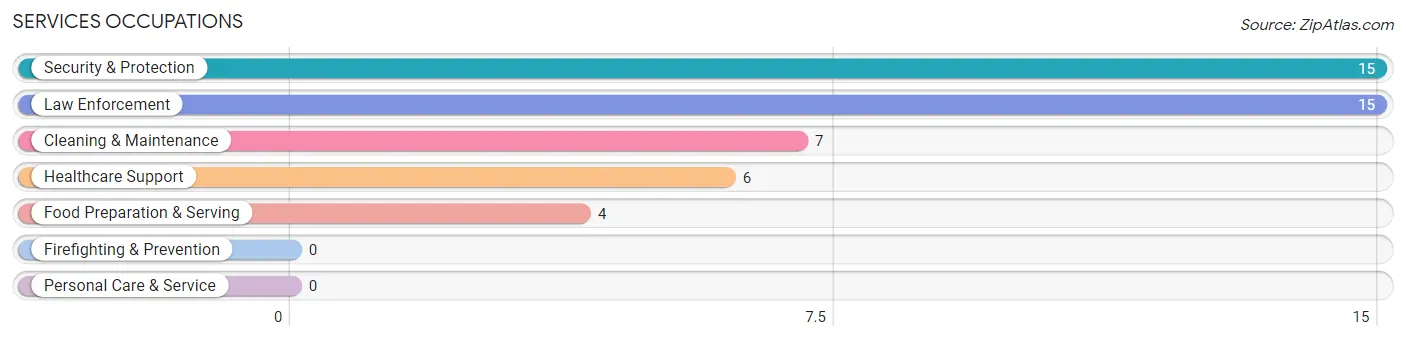
Services Occupations
The most common Services occupations in Sweetwater are Security & Protection (15 | 22.7%), Law Enforcement (15 | 22.7%), Cleaning & Maintenance (7 | 10.6%), Healthcare Support (6 | 9.1%), and Food Preparation & Serving (4 | 6.1%).
Services Occupations by Sex
Within the Services occupations in Sweetwater, the most male-oriented occupations are Security & Protection (100.0%), Law Enforcement (100.0%), and Cleaning & Maintenance (100.0%), while the most female-oriented occupations are Healthcare Support (100.0%), and Food Preparation & Serving (100.0%).
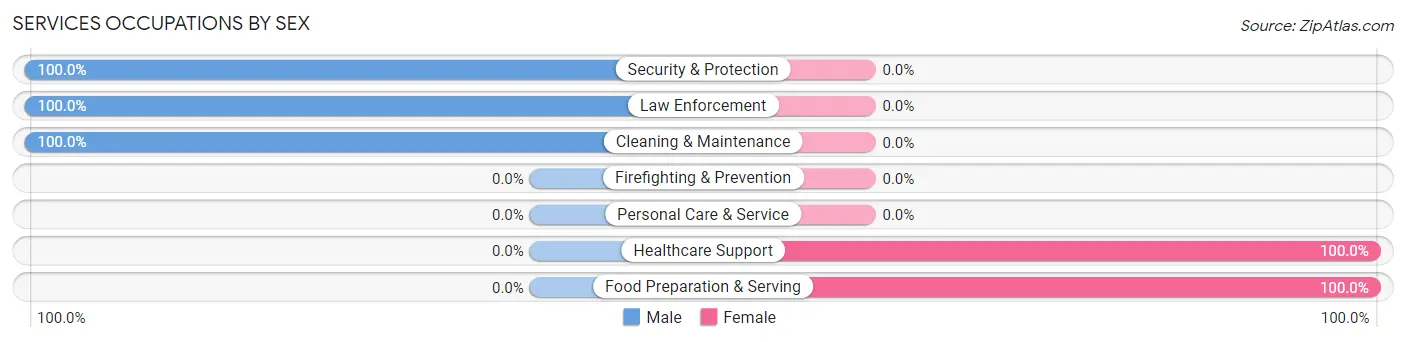
| Occupation | Male | Female |
| Healthcare Support | 0 (0.0%) | 6 (100.0%) |
| Security & Protection | 15 (100.0%) | 0 (0.0%) |
| Firefighting & Prevention | 0 (0.0%) | 0 (0.0%) |
| Law Enforcement | 15 (100.0%) | 0 (0.0%) |
| Food Preparation & Serving | 0 (0.0%) | 4 (100.0%) |
| Cleaning & Maintenance | 7 (100.0%) | 0 (0.0%) |
| Personal Care & Service | 0 (0.0%) | 0 (0.0%) |
| Total (Category) | 22 (68.8%) | 10 (31.2%) |
| Total (Overall) | 36 (54.5%) | 30 (45.5%) |
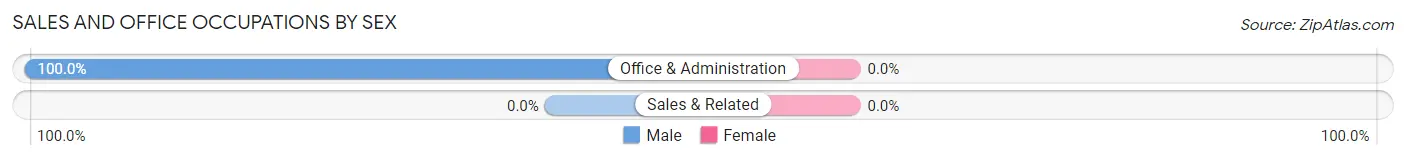
Sales and Office Occupations
The most common Sales and Office occupations in Sweetwater are , and Office & Administration (3 | 4.5%).
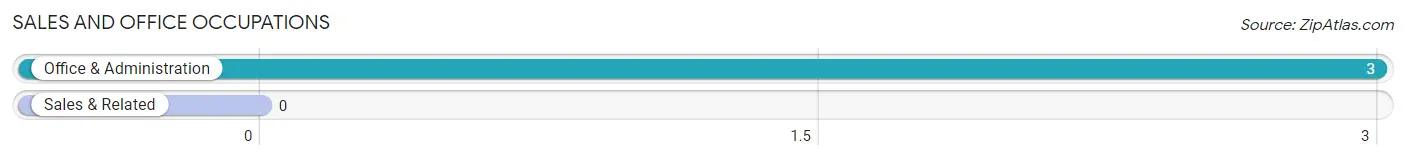
Sales and Office Occupations by Sex
| Occupation | Male | Female |
| Sales & Related | 0 (0.0%) | 0 (0.0%) |
| Office & Administration | 3 (100.0%) | 0 (0.0%) |
| Total (Category) | 3 (100.0%) | 0 (0.0%) |
| Total (Overall) | 36 (54.5%) | 30 (45.5%) |
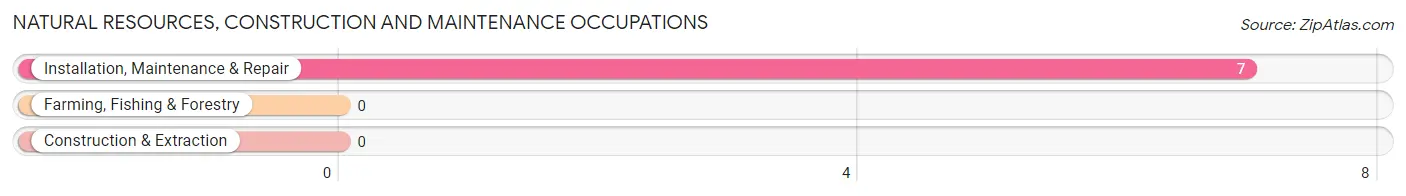
Natural Resources, Construction and Maintenance Occupations
The most common Natural Resources, Construction and Maintenance occupations in Sweetwater are , and Installation, Maintenance & Repair (7 | 10.6%).
Natural Resources, Construction and Maintenance Occupations by Sex
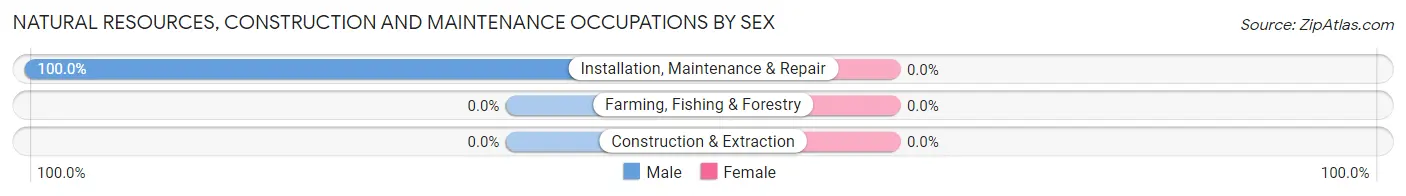
| Occupation | Male | Female |
| Farming, Fishing & Forestry | 0 (0.0%) | 0 (0.0%) |
| Construction & Extraction | 0 (0.0%) | 0 (0.0%) |
| Installation, Maintenance & Repair | 7 (100.0%) | 0 (0.0%) |
| Total (Category) | 7 (100.0%) | 0 (0.0%) |
| Total (Overall) | 36 (54.5%) | 30 (45.5%) |
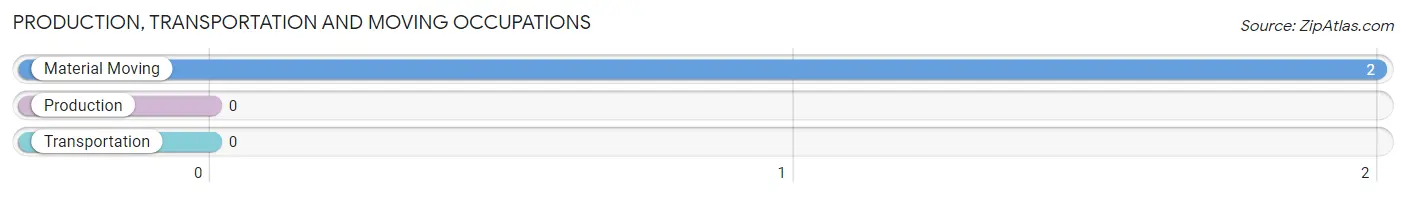
Production, Transportation and Moving Occupations
The most common Production, Transportation and Moving occupations in Sweetwater are , and Material Moving (2 | 3.0%).
Production, Transportation and Moving Occupations by Sex
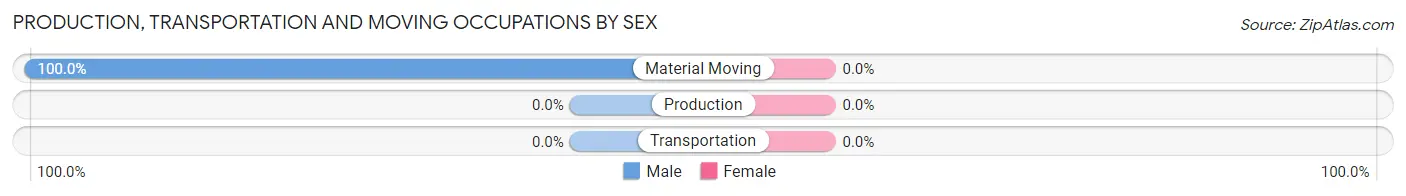
| Occupation | Male | Female |
| Production | 0 (0.0%) | 0 (0.0%) |
| Transportation | 0 (0.0%) | 0 (0.0%) |
| Material Moving | 2 (100.0%) | 0 (0.0%) |
| Total (Category) | 2 (100.0%) | 0 (0.0%) |
| Total (Overall) | 36 (54.5%) | 30 (45.5%) |
Employment Industries by Sex in Sweetwater
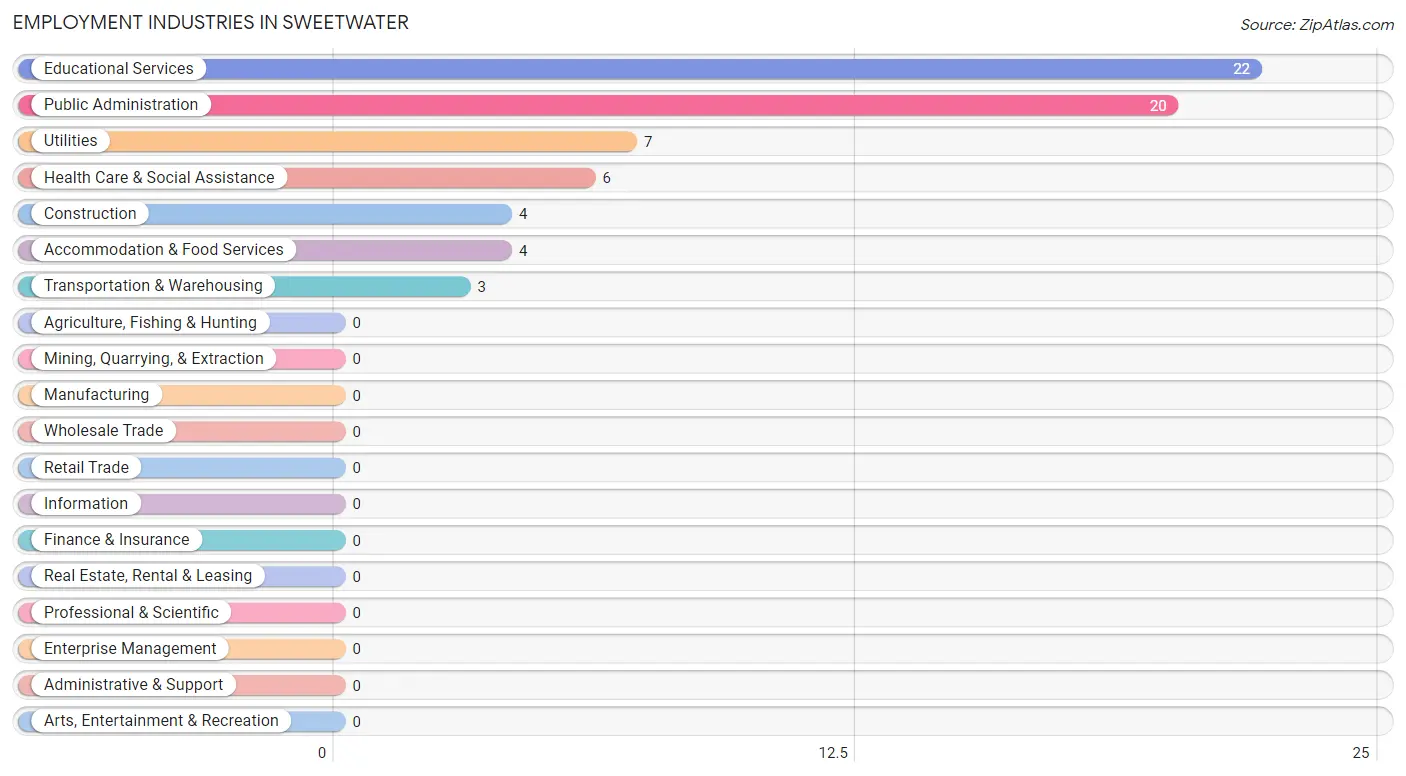
Employment Industries in Sweetwater
The major employment industries in Sweetwater include Educational Services (22 | 33.3%), Public Administration (20 | 30.3%), Utilities (7 | 10.6%), Health Care & Social Assistance (6 | 9.1%), and Construction (4 | 6.1%).
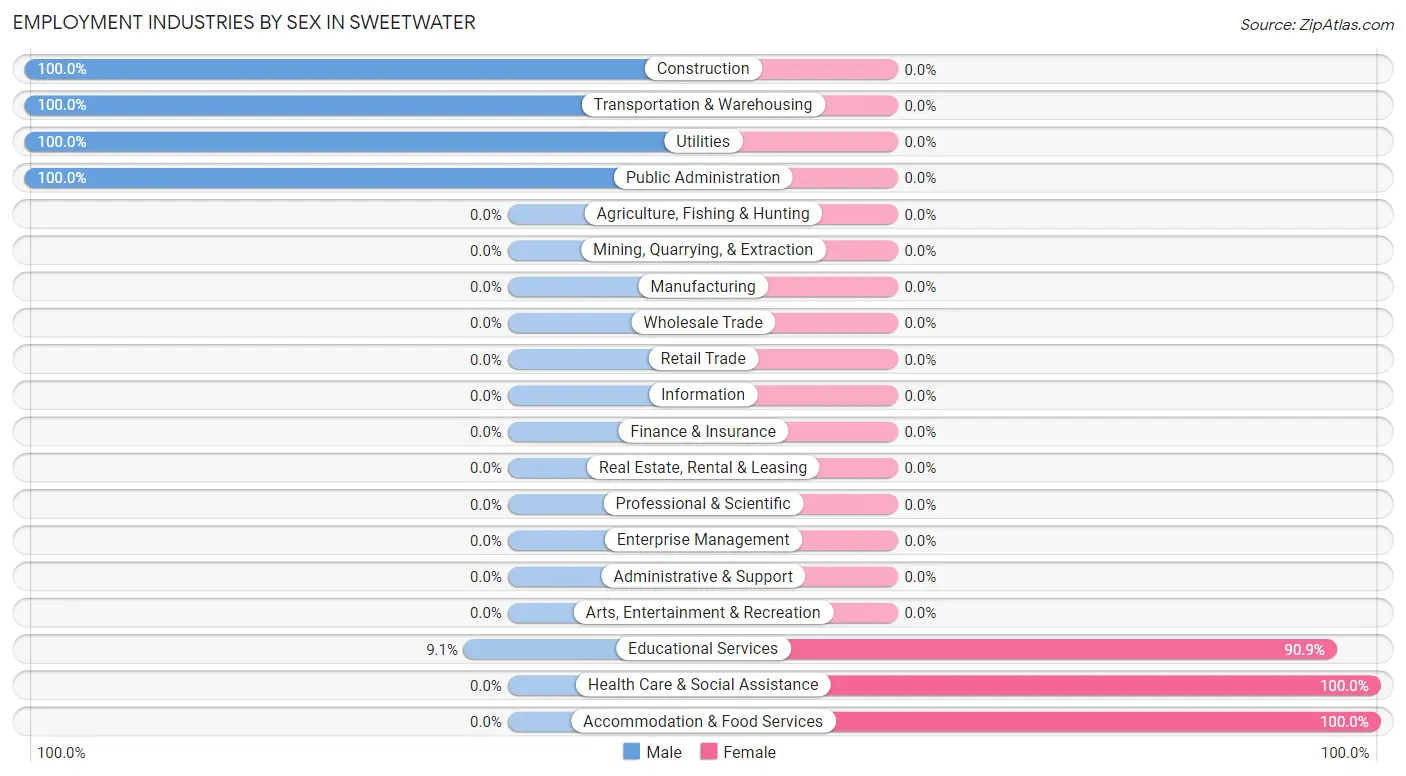
Employment Industries by Sex in Sweetwater
The Sweetwater industries that see more men than women are Construction (100.0%), Transportation & Warehousing (100.0%), and Utilities (100.0%), whereas the industries that tend to have a higher number of women are Health Care & Social Assistance (100.0%), Accommodation & Food Services (100.0%), and Educational Services (90.9%).
| Industry | Male | Female |
| Agriculture, Fishing & Hunting | 0 (0.0%) | 0 (0.0%) |
| Mining, Quarrying, & Extraction | 0 (0.0%) | 0 (0.0%) |
| Construction | 4 (100.0%) | 0 (0.0%) |
| Manufacturing | 0 (0.0%) | 0 (0.0%) |
| Wholesale Trade | 0 (0.0%) | 0 (0.0%) |
| Retail Trade | 0 (0.0%) | 0 (0.0%) |
| Transportation & Warehousing | 3 (100.0%) | 0 (0.0%) |
| Utilities | 7 (100.0%) | 0 (0.0%) |
| Information | 0 (0.0%) | 0 (0.0%) |
| Finance & Insurance | 0 (0.0%) | 0 (0.0%) |
| Real Estate, Rental & Leasing | 0 (0.0%) | 0 (0.0%) |
| Professional & Scientific | 0 (0.0%) | 0 (0.0%) |
| Enterprise Management | 0 (0.0%) | 0 (0.0%) |
| Administrative & Support | 0 (0.0%) | 0 (0.0%) |
| Educational Services | 2 (9.1%) | 20 (90.9%) |
| Health Care & Social Assistance | 0 (0.0%) | 6 (100.0%) |
| Arts, Entertainment & Recreation | 0 (0.0%) | 0 (0.0%) |
| Accommodation & Food Services | 0 (0.0%) | 4 (100.0%) |
| Public Administration | 20 (100.0%) | 0 (0.0%) |
| Total | 36 (54.5%) | 30 (45.5%) |
Education in Sweetwater
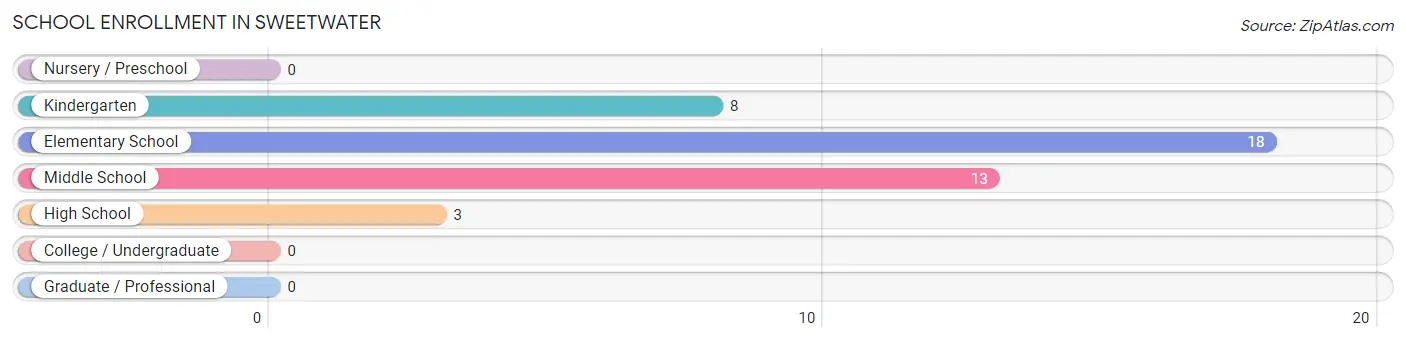
School Enrollment in Sweetwater
The most common levels of schooling among the 42 students in Sweetwater are elementary school (18 | 42.9%), middle school (13 | 30.9%), and kindergarten (8 | 19.1%).
| School Level | # Students | % Students |
| Nursery / Preschool | 0 | 0.0% |
| Kindergarten | 8 | 19.1% |
| Elementary School | 18 | 42.9% |
| Middle School | 13 | 30.9% |
| High School | 3 | 7.1% |
| College / Undergraduate | 0 | 0.0% |
| Graduate / Professional | 0 | 0.0% |
| Total | 42 | 100.0% |
School Enrollment by Age by Funding Source in Sweetwater
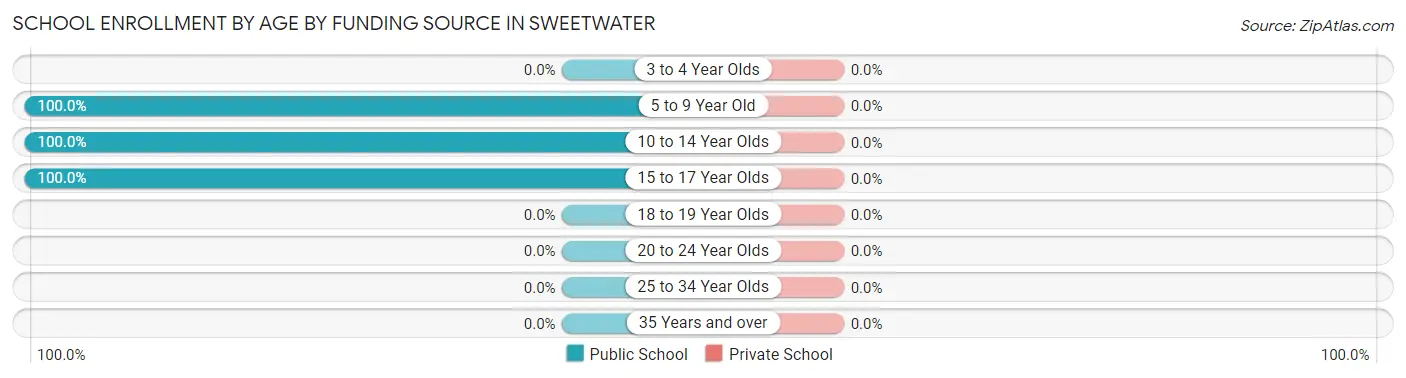
| Age Bracket | Public School | Private School |
| 3 to 4 Year Olds | 0 (0.0%) | 0 (0.0%) |
| 5 to 9 Year Old | 26 (100.0%) | 0 (0.0%) |
| 10 to 14 Year Olds | 13 (100.0%) | 0 (0.0%) |
| 15 to 17 Year Olds | 3 (100.0%) | 0 (0.0%) |
| 18 to 19 Year Olds | 0 (0.0%) | 0 (0.0%) |
| 20 to 24 Year Olds | 0 (0.0%) | 0 (0.0%) |
| 25 to 34 Year Olds | 0 (0.0%) | 0 (0.0%) |
| 35 Years and over | 0 (0.0%) | 0 (0.0%) |
| Total | 42 (100.0%) | 0 (0.0%) |
Educational Attainment by Field of Study in Sweetwater
Education (19 | 76.0%), physical & health sciences (2 | 8.0%), science & technology (2 | 8.0%), psychology (1 | 4.0%), and social sciences (1 | 4.0%) are the most common fields of study among 25 individuals in Sweetwater who have obtained a bachelor's degree or higher.
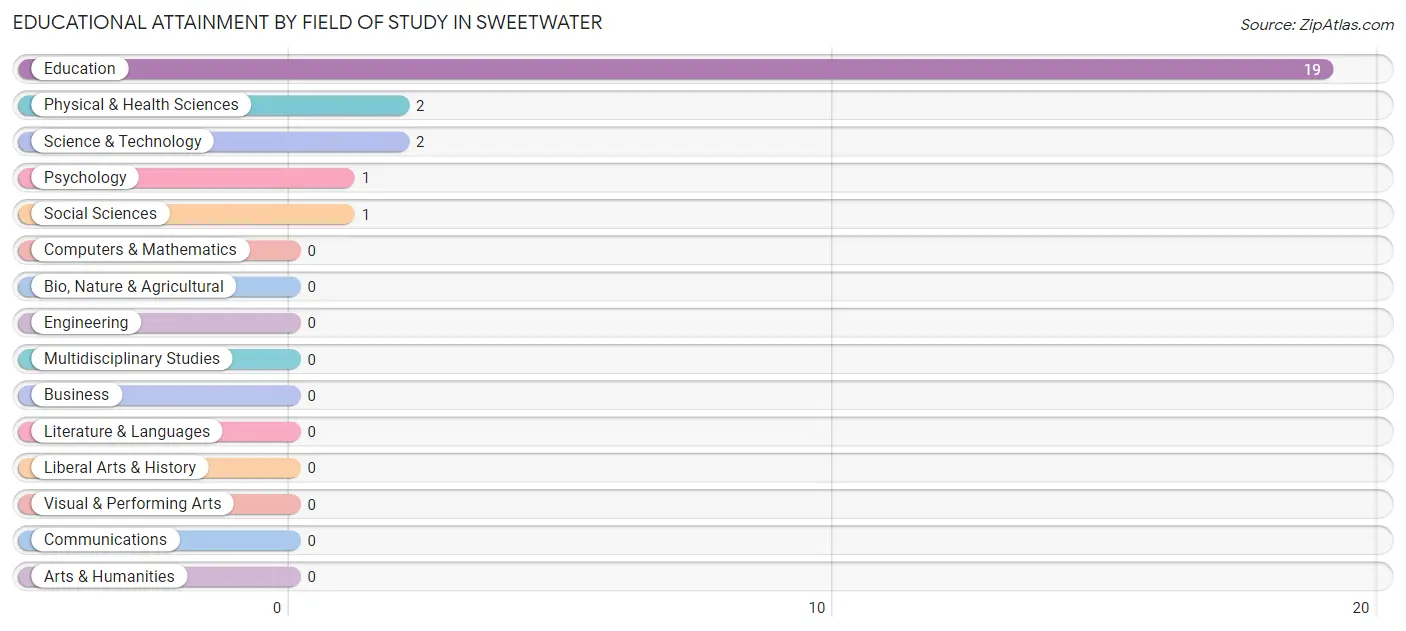
| Field of Study | # Graduates | % Graduates |
| Computers & Mathematics | 0 | 0.0% |
| Bio, Nature & Agricultural | 0 | 0.0% |
| Physical & Health Sciences | 2 | 8.0% |
| Psychology | 1 | 4.0% |
| Social Sciences | 1 | 4.0% |
| Engineering | 0 | 0.0% |
| Multidisciplinary Studies | 0 | 0.0% |
| Science & Technology | 2 | 8.0% |
| Business | 0 | 0.0% |
| Education | 19 | 76.0% |
| Literature & Languages | 0 | 0.0% |
| Liberal Arts & History | 0 | 0.0% |
| Visual & Performing Arts | 0 | 0.0% |
| Communications | 0 | 0.0% |
| Arts & Humanities | 0 | 0.0% |
| Total | 25 | 100.0% |
Transportation & Commute in Sweetwater
Vehicle Availability by Sex in Sweetwater
The most prevalent vehicle ownership categories in Sweetwater are males with 3 vehicles (33, accounting for 91.7%) and females with 3 vehicles (14, making up 110.0%).
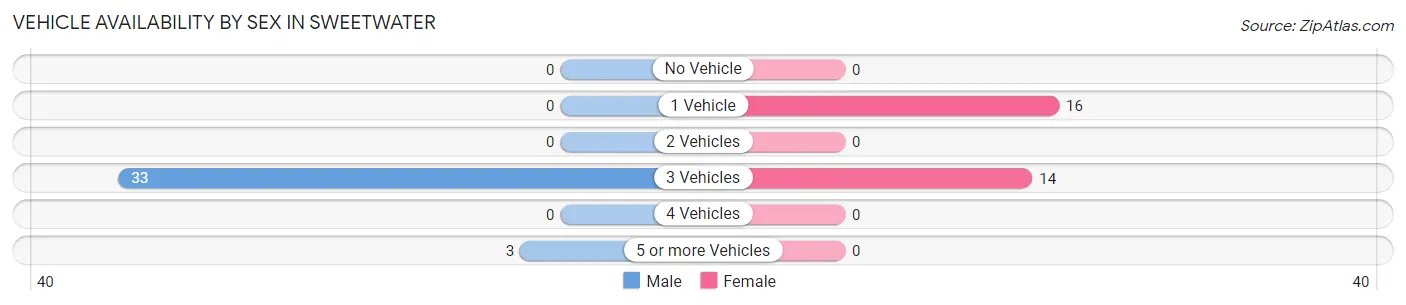
| Vehicles Available | Male | Female |
| No Vehicle | 0 (0.0%) | 0 (0.0%) |
| 1 Vehicle | 0 (0.0%) | 16 (53.3%) |
| 2 Vehicles | 0 (0.0%) | 0 (0.0%) |
| 3 Vehicles | 33 (91.7%) | 14 (46.7%) |
| 4 Vehicles | 0 (0.0%) | 0 (0.0%) |
| 5 or more Vehicles | 3 (8.3%) | 0 (0.0%) |
| Total | 36 (100.0%) | 30 (100.0%) |
Commute Time in Sweetwater
The most frequently occuring commute durations in Sweetwater are less than 5 minutes (34 commuters, 51.5%), 30 to 34 minutes (11 commuters, 16.7%), and 60 to 89 minutes (7 commuters, 10.6%).
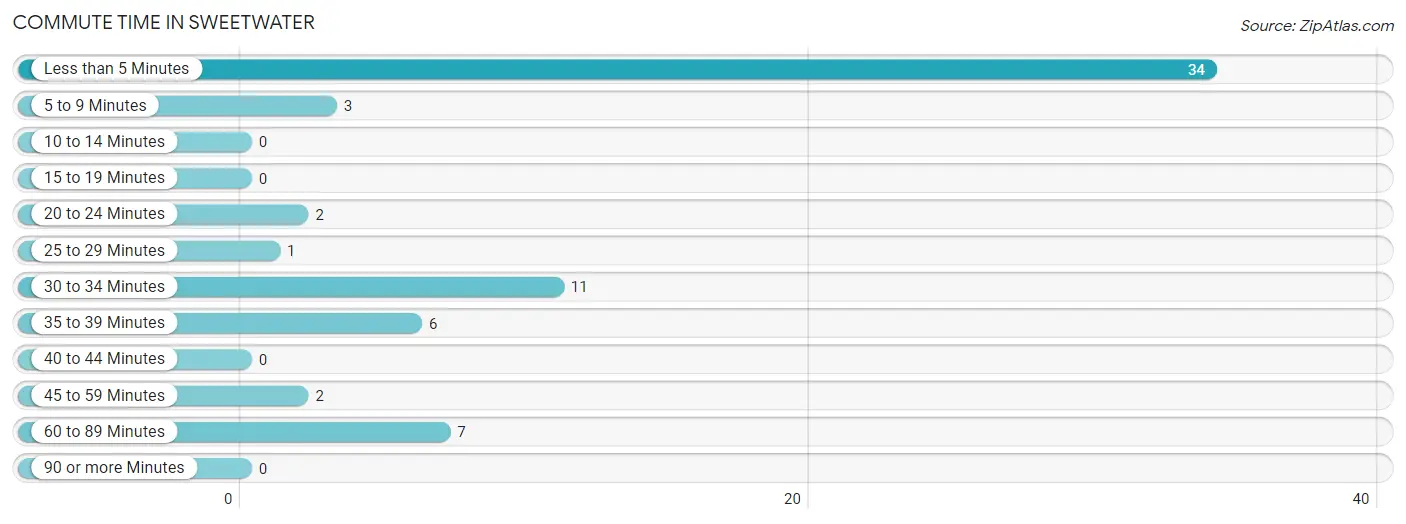
| Commute Time | # Commuters | % Commuters |
| Less than 5 Minutes | 34 | 51.5% |
| 5 to 9 Minutes | 3 | 4.5% |
| 10 to 14 Minutes | 0 | 0.0% |
| 15 to 19 Minutes | 0 | 0.0% |
| 20 to 24 Minutes | 2 | 3.0% |
| 25 to 29 Minutes | 1 | 1.5% |
| 30 to 34 Minutes | 11 | 16.7% |
| 35 to 39 Minutes | 6 | 9.1% |
| 40 to 44 Minutes | 0 | 0.0% |
| 45 to 59 Minutes | 2 | 3.0% |
| 60 to 89 Minutes | 7 | 10.6% |
| 90 or more Minutes | 0 | 0.0% |
Commute Time by Sex in Sweetwater
The most common commute times in Sweetwater are less than 5 minutes (17 commuters, 47.2%) for males and less than 5 minutes (17 commuters, 56.7%) for females.
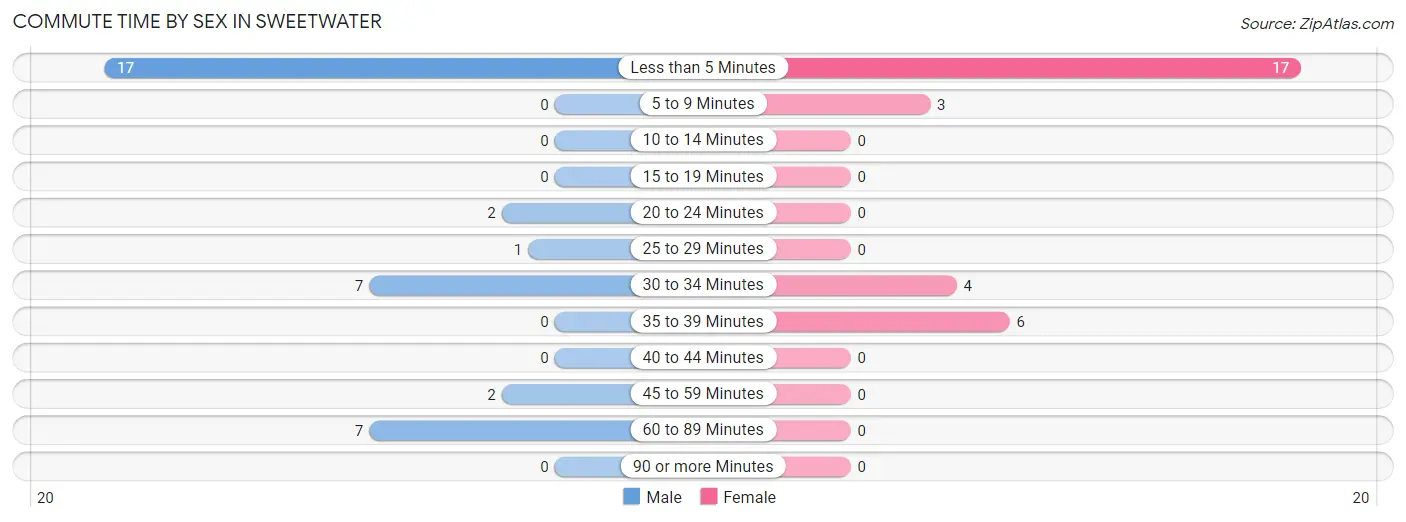
| Commute Time | Male | Female |
| Less than 5 Minutes | 17 (47.2%) | 17 (56.7%) |
| 5 to 9 Minutes | 0 (0.0%) | 3 (10.0%) |
| 10 to 14 Minutes | 0 (0.0%) | 0 (0.0%) |
| 15 to 19 Minutes | 0 (0.0%) | 0 (0.0%) |
| 20 to 24 Minutes | 2 (5.6%) | 0 (0.0%) |
| 25 to 29 Minutes | 1 (2.8%) | 0 (0.0%) |
| 30 to 34 Minutes | 7 (19.4%) | 4 (13.3%) |
| 35 to 39 Minutes | 0 (0.0%) | 6 (20.0%) |
| 40 to 44 Minutes | 0 (0.0%) | 0 (0.0%) |
| 45 to 59 Minutes | 2 (5.6%) | 0 (0.0%) |
| 60 to 89 Minutes | 7 (19.4%) | 0 (0.0%) |
| 90 or more Minutes | 0 (0.0%) | 0 (0.0%) |
Time of Departure to Work by Sex in Sweetwater
The most frequent times of departure to work in Sweetwater are 9:00 AM to 9:59 AM (15, 41.7%) for males and 7:30 AM to 7:59 AM (17, 56.7%) for females.
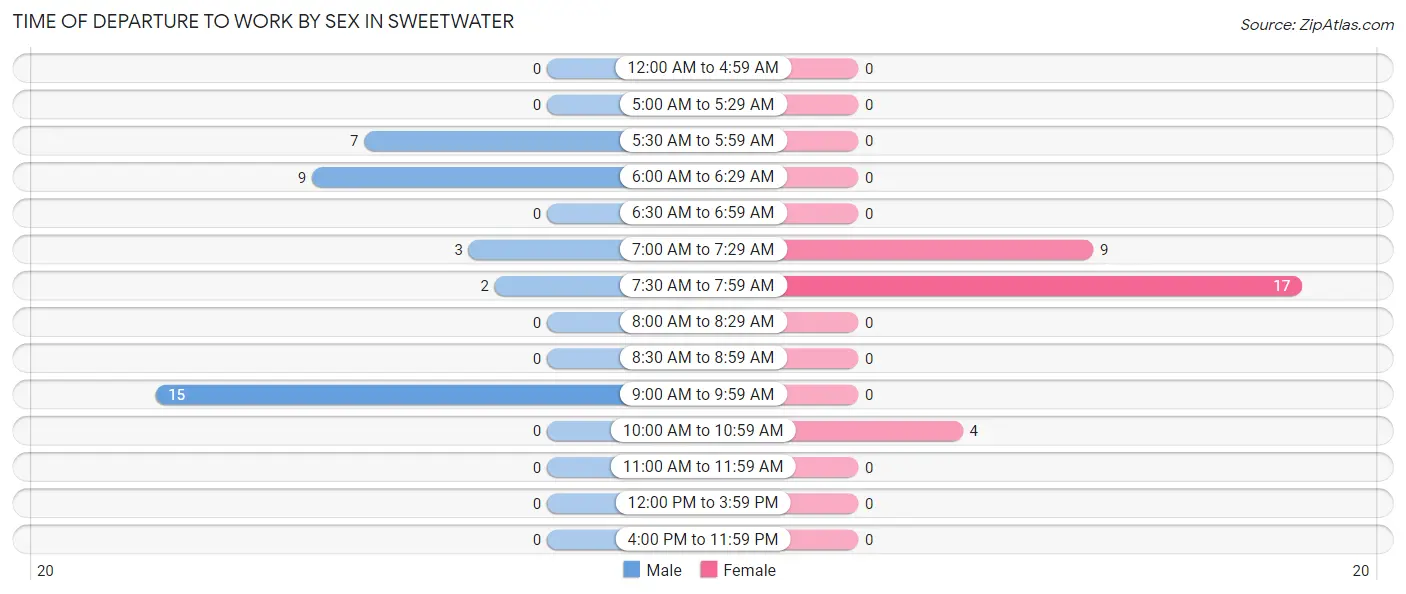
| Time of Departure | Male | Female |
| 12:00 AM to 4:59 AM | 0 (0.0%) | 0 (0.0%) |
| 5:00 AM to 5:29 AM | 0 (0.0%) | 0 (0.0%) |
| 5:30 AM to 5:59 AM | 7 (19.4%) | 0 (0.0%) |
| 6:00 AM to 6:29 AM | 9 (25.0%) | 0 (0.0%) |
| 6:30 AM to 6:59 AM | 0 (0.0%) | 0 (0.0%) |
| 7:00 AM to 7:29 AM | 3 (8.3%) | 9 (30.0%) |
| 7:30 AM to 7:59 AM | 2 (5.6%) | 17 (56.7%) |
| 8:00 AM to 8:29 AM | 0 (0.0%) | 0 (0.0%) |
| 8:30 AM to 8:59 AM | 0 (0.0%) | 0 (0.0%) |
| 9:00 AM to 9:59 AM | 15 (41.7%) | 0 (0.0%) |
| 10:00 AM to 10:59 AM | 0 (0.0%) | 4 (13.3%) |
| 11:00 AM to 11:59 AM | 0 (0.0%) | 0 (0.0%) |
| 12:00 PM to 3:59 PM | 0 (0.0%) | 0 (0.0%) |
| 4:00 PM to 11:59 PM | 0 (0.0%) | 0 (0.0%) |
| Total | 36 (100.0%) | 30 (100.0%) |
Housing Occupancy in Sweetwater
Occupancy by Ownership in Sweetwater
Of the total 72 dwellings in Sweetwater, owner-occupied units account for 26 (36.1%), while renter-occupied units make up 46 (63.9%).
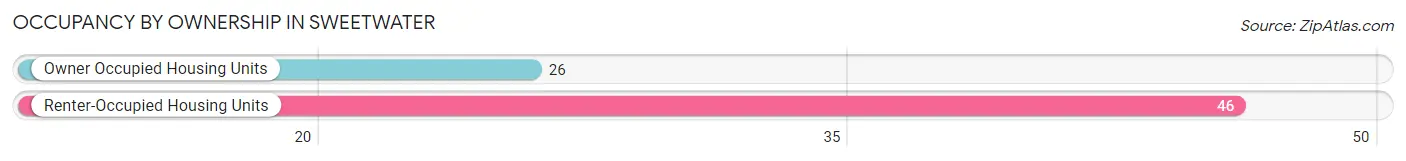
| Occupancy | # Housing Units | % Housing Units |
| Owner Occupied Housing Units | 26 | 36.1% |
| Renter-Occupied Housing Units | 46 | 63.9% |
| Total Occupied Housing Units | 72 | 100.0% |
Occupancy by Household Size in Sweetwater
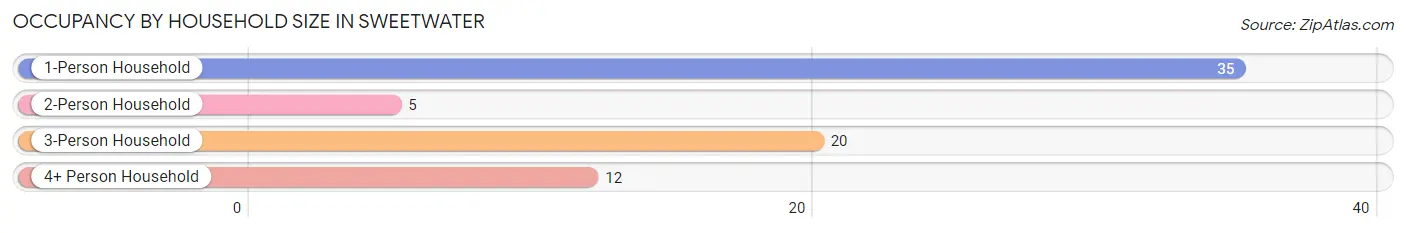
| Household Size | # Housing Units | % Housing Units |
| 1-Person Household | 35 | 48.6% |
| 2-Person Household | 5 | 6.9% |
| 3-Person Household | 20 | 27.8% |
| 4+ Person Household | 12 | 16.7% |
| Total Housing Units | 72 | 100.0% |
Occupancy by Ownership by Household Size in Sweetwater
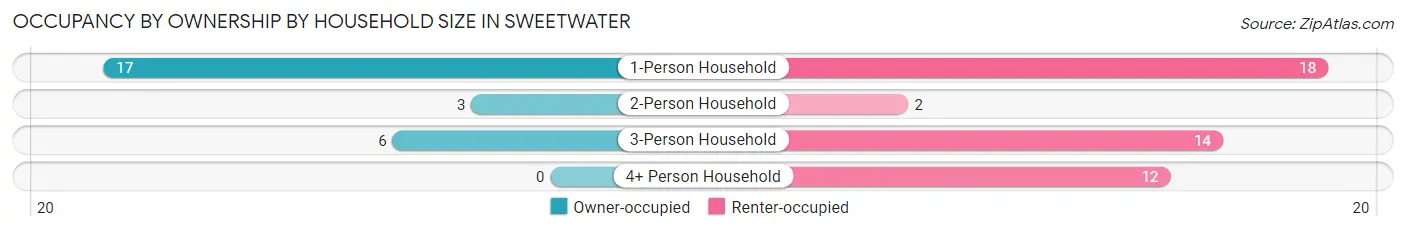
| Household Size | Owner-occupied | Renter-occupied |
| 1-Person Household | 17 (48.6%) | 18 (51.4%) |
| 2-Person Household | 3 (60.0%) | 2 (40.0%) |
| 3-Person Household | 6 (30.0%) | 14 (70.0%) |
| 4+ Person Household | 0 (0.0%) | 12 (100.0%) |
| Total Housing Units | 26 (36.1%) | 46 (63.9%) |
Occupancy by Educational Attainment in Sweetwater
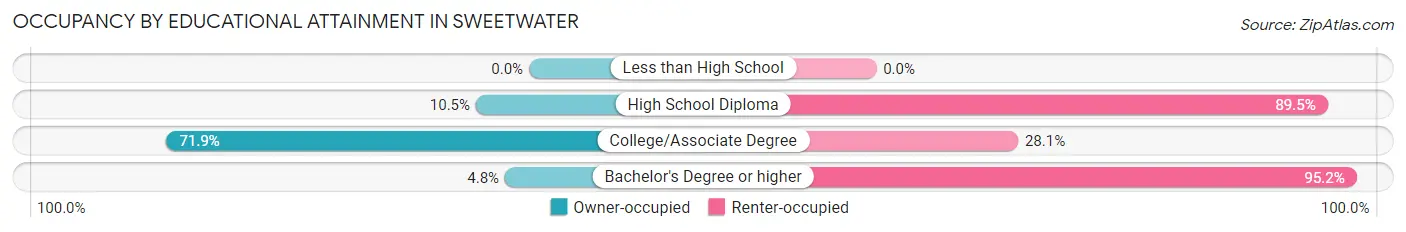
| Household Size | Owner-occupied | Renter-occupied |
| Less than High School | 0 (0.0%) | 0 (0.0%) |
| High School Diploma | 2 (10.5%) | 17 (89.5%) |
| College/Associate Degree | 23 (71.9%) | 9 (28.1%) |
| Bachelor's Degree or higher | 1 (4.8%) | 20 (95.2%) |
Occupancy by Age of Householder in Sweetwater
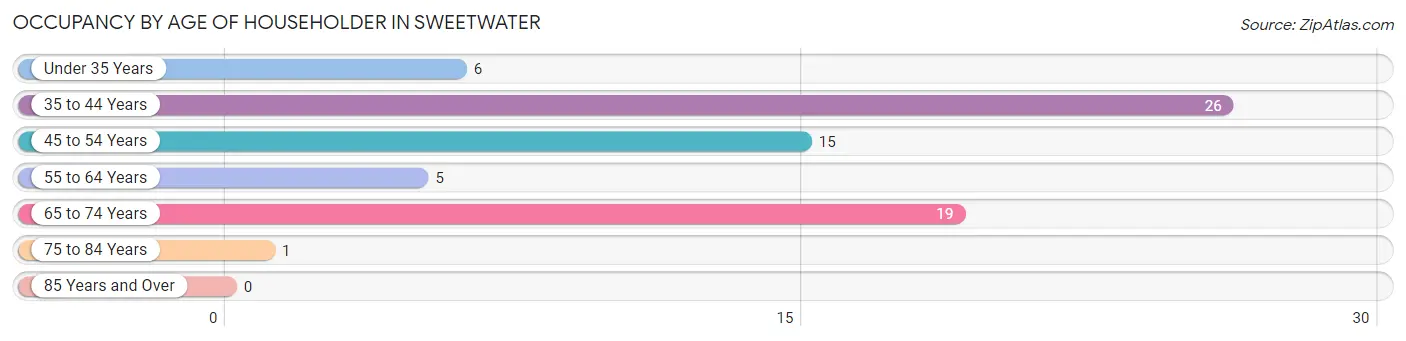
| Age Bracket | # Households | % Households |
| Under 35 Years | 6 | 8.3% |
| 35 to 44 Years | 26 | 36.1% |
| 45 to 54 Years | 15 | 20.8% |
| 55 to 64 Years | 5 | 6.9% |
| 65 to 74 Years | 19 | 26.4% |
| 75 to 84 Years | 1 | 1.4% |
| 85 Years and Over | 0 | 0.0% |
| Total | 72 | 100.0% |
Housing Finances in Sweetwater
Median Income by Occupancy in Sweetwater
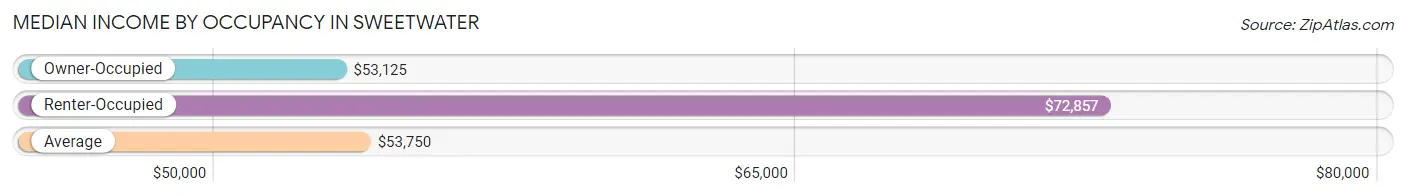
| Occupancy Type | # Households | Median Income |
| Owner-Occupied | 26 (36.1%) | $53,125 |
| Renter-Occupied | 46 (63.9%) | $72,857 |
| Average | 72 (100.0%) | $53,750 |
Occupancy by Householder Income Bracket in Sweetwater
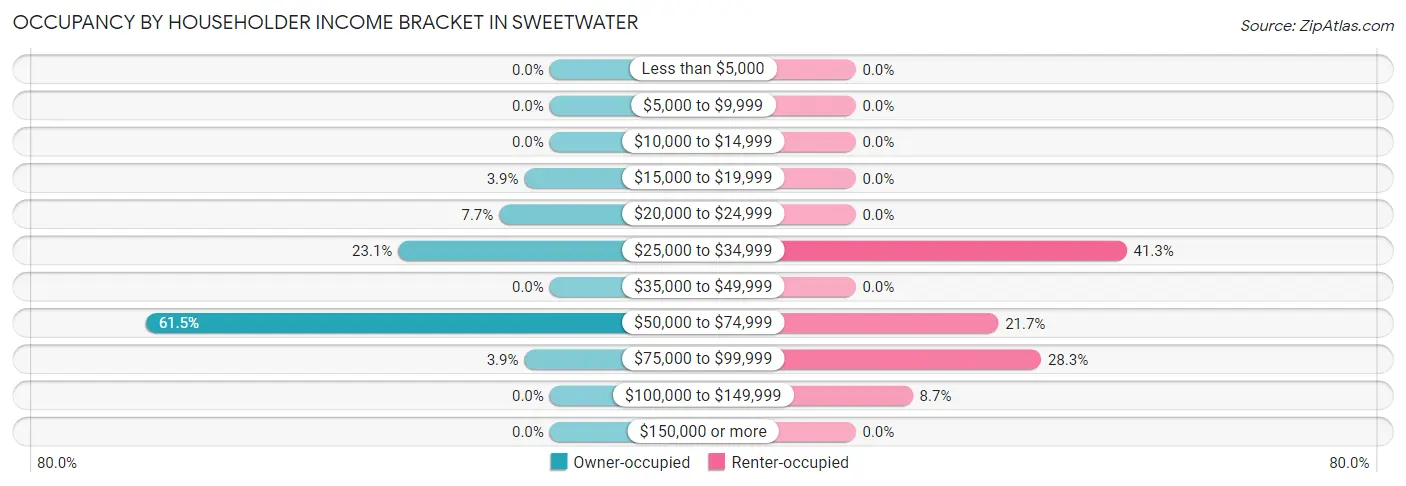
| Income Bracket | Owner-occupied | Renter-occupied |
| Less than $5,000 | 0 (0.0%) | 0 (0.0%) |
| $5,000 to $9,999 | 0 (0.0%) | 0 (0.0%) |
| $10,000 to $14,999 | 0 (0.0%) | 0 (0.0%) |
| $15,000 to $19,999 | 1 (3.8%) | 0 (0.0%) |
| $20,000 to $24,999 | 2 (7.7%) | 0 (0.0%) |
| $25,000 to $34,999 | 6 (23.1%) | 19 (41.3%) |
| $35,000 to $49,999 | 0 (0.0%) | 0 (0.0%) |
| $50,000 to $74,999 | 16 (61.5%) | 10 (21.7%) |
| $75,000 to $99,999 | 1 (3.8%) | 13 (28.3%) |
| $100,000 to $149,999 | 0 (0.0%) | 4 (8.7%) |
| $150,000 or more | 0 (0.0%) | 0 (0.0%) |
| Total | 26 (100.0%) | 46 (100.0%) |
Monthly Housing Cost Tiers in Sweetwater
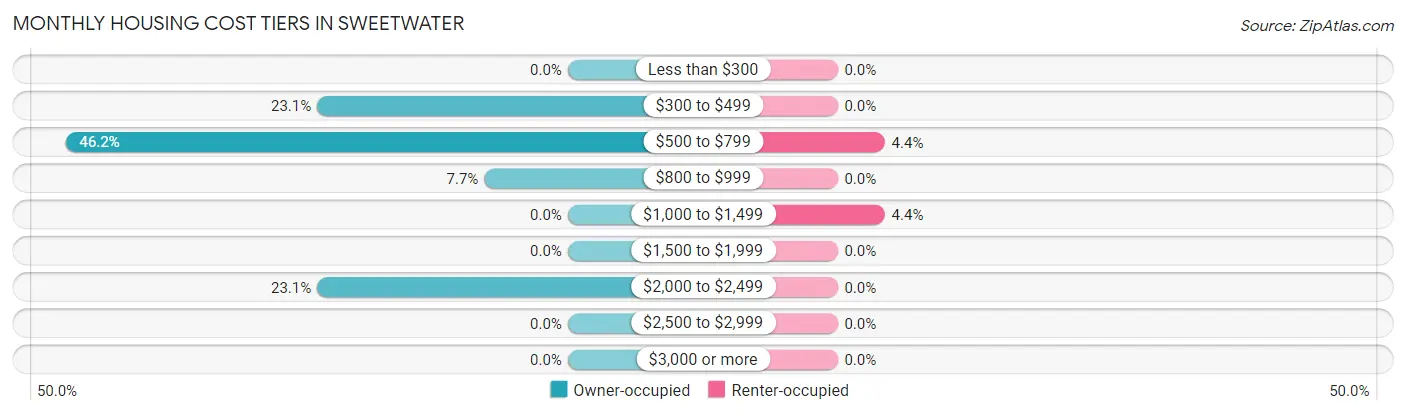
| Monthly Cost | Owner-occupied | Renter-occupied |
| Less than $300 | 0 (0.0%) | 0 (0.0%) |
| $300 to $499 | 6 (23.1%) | 0 (0.0%) |
| $500 to $799 | 12 (46.2%) | 2 (4.3%) |
| $800 to $999 | 2 (7.7%) | 0 (0.0%) |
| $1,000 to $1,499 | 0 (0.0%) | 2 (4.3%) |
| $1,500 to $1,999 | 0 (0.0%) | 0 (0.0%) |
| $2,000 to $2,499 | 6 (23.1%) | 0 (0.0%) |
| $2,500 to $2,999 | 0 (0.0%) | 0 (0.0%) |
| $3,000 or more | 0 (0.0%) | 0 (0.0%) |
| Total | 26 (100.0%) | 46 (100.0%) |
Physical Housing Characteristics in Sweetwater
Housing Structures in Sweetwater
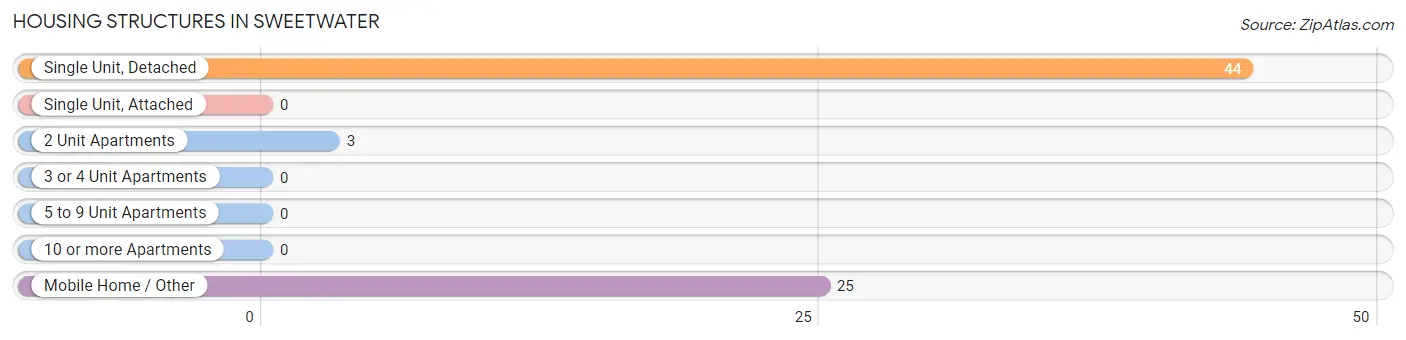
| Structure Type | # Housing Units | % Housing Units |
| Single Unit, Detached | 44 | 61.1% |
| Single Unit, Attached | 0 | 0.0% |
| 2 Unit Apartments | 3 | 4.2% |
| 3 or 4 Unit Apartments | 0 | 0.0% |
| 5 to 9 Unit Apartments | 0 | 0.0% |
| 10 or more Apartments | 0 | 0.0% |
| Mobile Home / Other | 25 | 34.7% |
| Total | 72 | 100.0% |
Housing Structures by Occupancy in Sweetwater
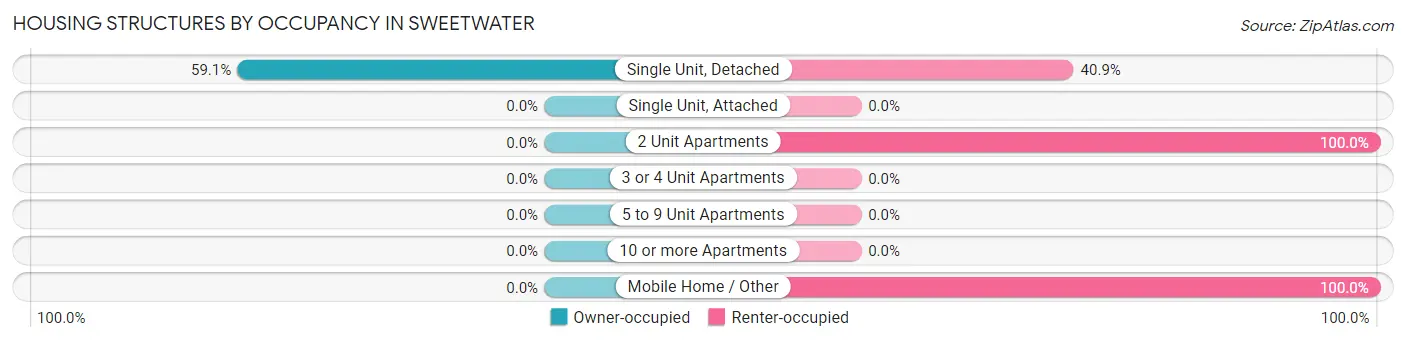
| Structure Type | Owner-occupied | Renter-occupied |
| Single Unit, Detached | 26 (59.1%) | 18 (40.9%) |
| Single Unit, Attached | 0 (0.0%) | 0 (0.0%) |
| 2 Unit Apartments | 0 (0.0%) | 3 (100.0%) |
| 3 or 4 Unit Apartments | 0 (0.0%) | 0 (0.0%) |
| 5 to 9 Unit Apartments | 0 (0.0%) | 0 (0.0%) |
| 10 or more Apartments | 0 (0.0%) | 0 (0.0%) |
| Mobile Home / Other | 0 (0.0%) | 25 (100.0%) |
| Total | 26 (36.1%) | 46 (63.9%) |
Housing Structures by Number of Rooms in Sweetwater
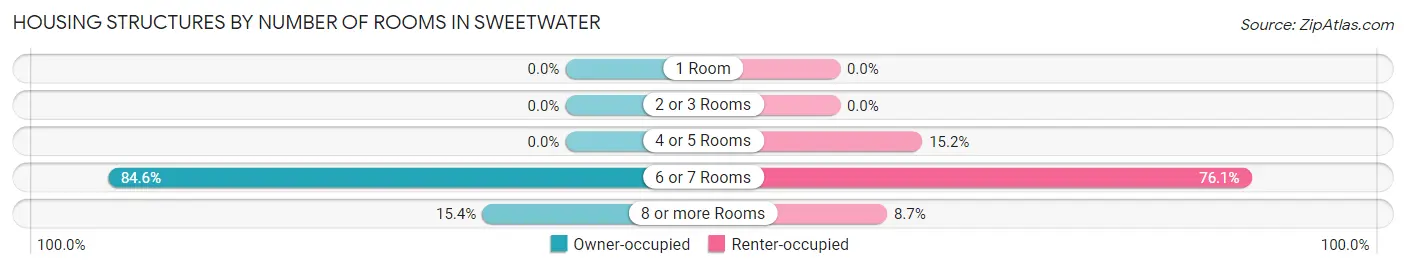
| Number of Rooms | Owner-occupied | Renter-occupied |
| 1 Room | 0 (0.0%) | 0 (0.0%) |
| 2 or 3 Rooms | 0 (0.0%) | 0 (0.0%) |
| 4 or 5 Rooms | 0 (0.0%) | 7 (15.2%) |
| 6 or 7 Rooms | 22 (84.6%) | 35 (76.1%) |
| 8 or more Rooms | 4 (15.4%) | 4 (8.7%) |
| Total | 26 (100.0%) | 46 (100.0%) |
Housing Structure by Heating Type in Sweetwater
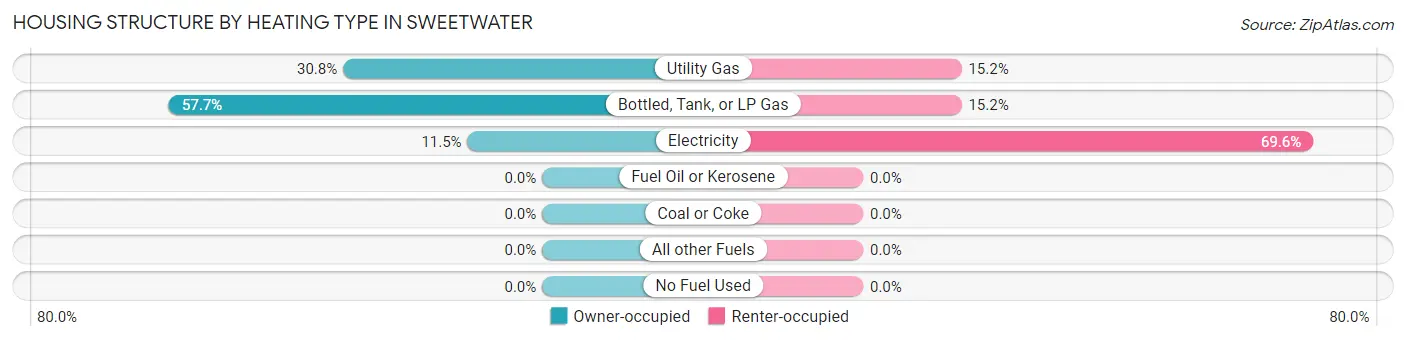
| Heating Type | Owner-occupied | Renter-occupied |
| Utility Gas | 8 (30.8%) | 7 (15.2%) |
| Bottled, Tank, or LP Gas | 15 (57.7%) | 7 (15.2%) |
| Electricity | 3 (11.5%) | 32 (69.6%) |
| Fuel Oil or Kerosene | 0 (0.0%) | 0 (0.0%) |
| Coal or Coke | 0 (0.0%) | 0 (0.0%) |
| All other Fuels | 0 (0.0%) | 0 (0.0%) |
| No Fuel Used | 0 (0.0%) | 0 (0.0%) |
| Total | 26 (100.0%) | 46 (100.0%) |
Household Vehicle Usage in Sweetwater
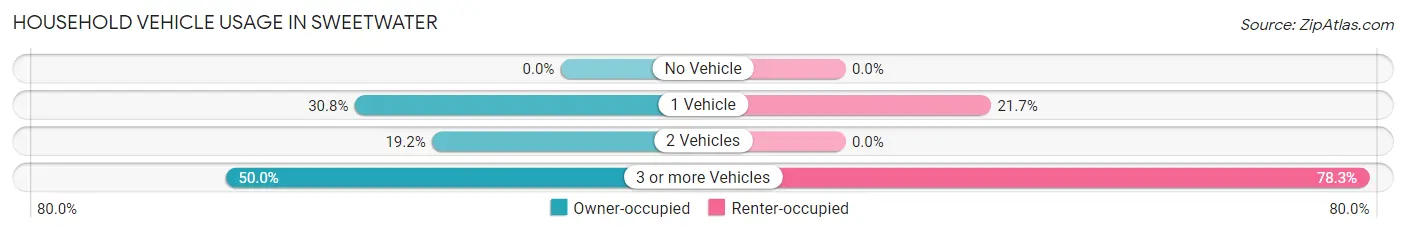
| Vehicles per Household | Owner-occupied | Renter-occupied |
| No Vehicle | 0 (0.0%) | 0 (0.0%) |
| 1 Vehicle | 8 (30.8%) | 10 (21.7%) |
| 2 Vehicles | 5 (19.2%) | 0 (0.0%) |
| 3 or more Vehicles | 13 (50.0%) | 36 (78.3%) |
| Total | 26 (100.0%) | 46 (100.0%) |
Real Estate & Mortgages in Sweetwater
Real Estate and Mortgage Overview in Sweetwater
| Characteristic | Without Mortgage | With Mortgage |
| Housing Units | 18 | 8 |
| Median Property Value | $157,500 | $0 |
| Median Household Income | $53,750 | $0 |
| Monthly Housing Costs | $730 | $0 |
| Real Estate Taxes | $1,250 | $0 |
Property Value by Mortgage Status in Sweetwater
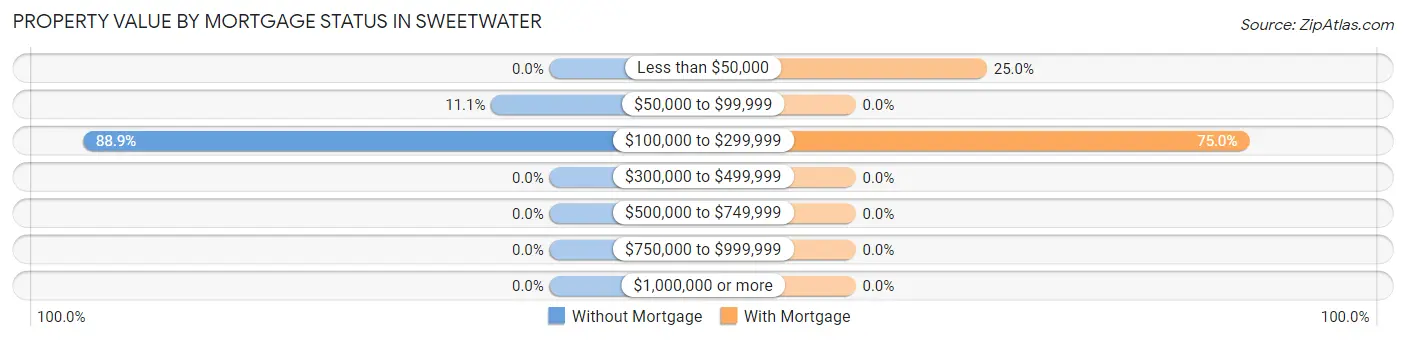
| Property Value | Without Mortgage | With Mortgage |
| Less than $50,000 | 0 (0.0%) | 2 (25.0%) |
| $50,000 to $99,999 | 2 (11.1%) | 0 (0.0%) |
| $100,000 to $299,999 | 16 (88.9%) | 6 (75.0%) |
| $300,000 to $499,999 | 0 (0.0%) | 0 (0.0%) |
| $500,000 to $749,999 | 0 (0.0%) | 0 (0.0%) |
| $750,000 to $999,999 | 0 (0.0%) | 0 (0.0%) |
| $1,000,000 or more | 0 (0.0%) | 0 (0.0%) |
| Total | 18 (100.0%) | 8 (100.0%) |
Household Income by Mortgage Status in Sweetwater
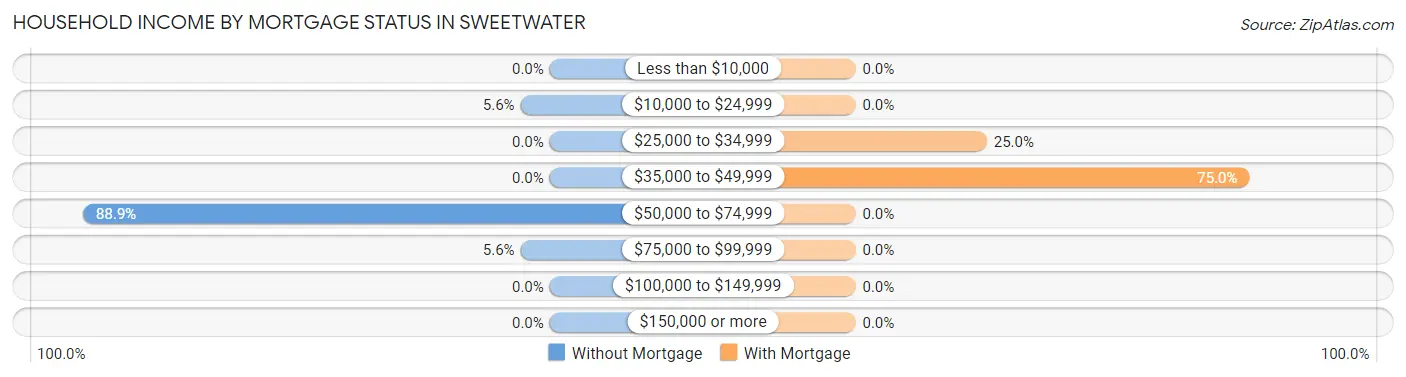
| Household Income | Without Mortgage | With Mortgage |
| Less than $10,000 | 0 (0.0%) | 0 (0.0%) |
| $10,000 to $24,999 | 1 (5.6%) | 0 (0.0%) |
| $25,000 to $34,999 | 0 (0.0%) | 2 (25.0%) |
| $35,000 to $49,999 | 0 (0.0%) | 6 (75.0%) |
| $50,000 to $74,999 | 16 (88.9%) | 0 (0.0%) |
| $75,000 to $99,999 | 1 (5.6%) | 0 (0.0%) |
| $100,000 to $149,999 | 0 (0.0%) | 0 (0.0%) |
| $150,000 or more | 0 (0.0%) | 0 (0.0%) |
| Total | 18 (100.0%) | 8 (100.0%) |
Property Value to Household Income Ratio in Sweetwater
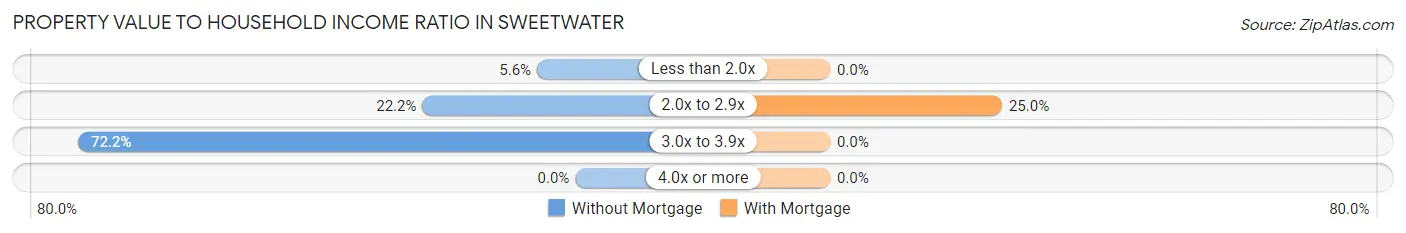
| Value-to-Income Ratio | Without Mortgage | With Mortgage |
| Less than 2.0x | 1 (5.6%) | 0 (0.0%) |
| 2.0x to 2.9x | 4 (22.2%) | 2 (25.0%) |
| 3.0x to 3.9x | 13 (72.2%) | 0 (0.0%) |
| 4.0x or more | 0 (0.0%) | 0 (0.0%) |
| Total | 18 (100.0%) | 8 (100.0%) |
Real Estate Taxes by Mortgage Status in Sweetwater
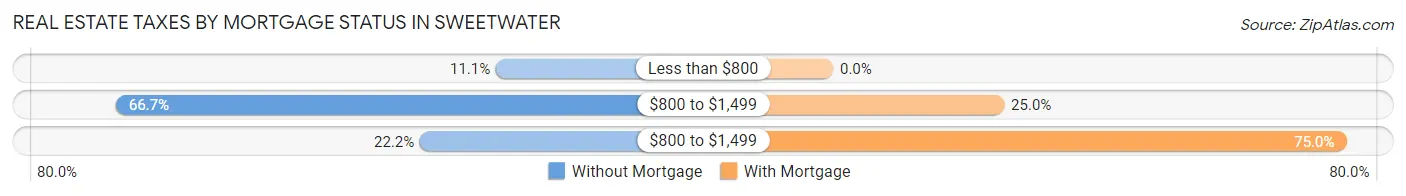
| Property Taxes | Without Mortgage | With Mortgage |
| Less than $800 | 2 (11.1%) | 0 (0.0%) |
| $800 to $1,499 | 12 (66.7%) | 2 (25.0%) |
| $800 to $1,499 | 4 (22.2%) | 6 (75.0%) |
| Total | 18 (100.0%) | 8 (100.0%) |
Health & Disability in Sweetwater
Health Insurance Coverage by Age in Sweetwater
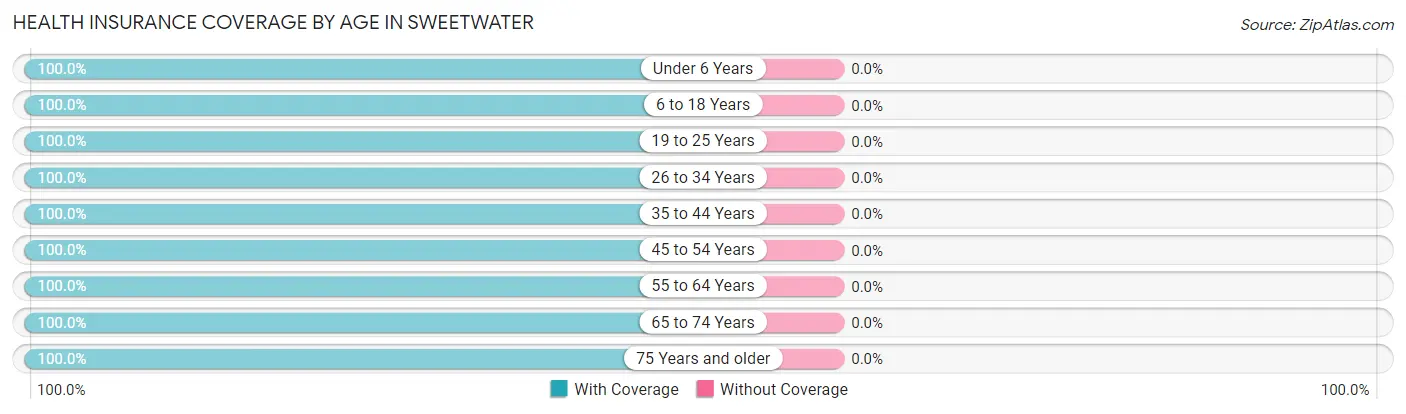
| Age Bracket | With Coverage | Without Coverage |
| Under 6 Years | 9 (100.0%) | 0 (0.0%) |
| 6 to 18 Years | 42 (100.0%) | 0 (0.0%) |
| 19 to 25 Years | 6 (100.0%) | 0 (0.0%) |
| 26 to 34 Years | 4 (100.0%) | 0 (0.0%) |
| 35 to 44 Years | 37 (100.0%) | 0 (0.0%) |
| 45 to 54 Years | 15 (100.0%) | 0 (0.0%) |
| 55 to 64 Years | 8 (100.0%) | 0 (0.0%) |
| 65 to 74 Years | 21 (100.0%) | 0 (0.0%) |
| 75 Years and older | 1 (100.0%) | 0 (0.0%) |
| Total | 143 (100.0%) | 0 (0.0%) |
Health Insurance Coverage by Citizenship Status in Sweetwater
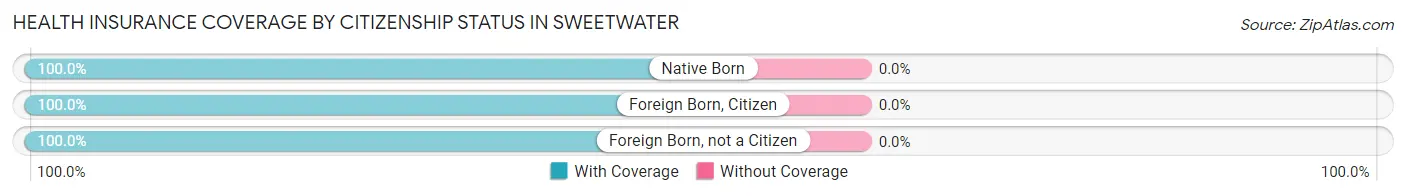
| Citizenship Status | With Coverage | Without Coverage |
| Native Born | 9 (100.0%) | 0 (0.0%) |
| Foreign Born, Citizen | 42 (100.0%) | 0 (0.0%) |
| Foreign Born, not a Citizen | 6 (100.0%) | 0 (0.0%) |
Health Insurance Coverage by Household Income in Sweetwater
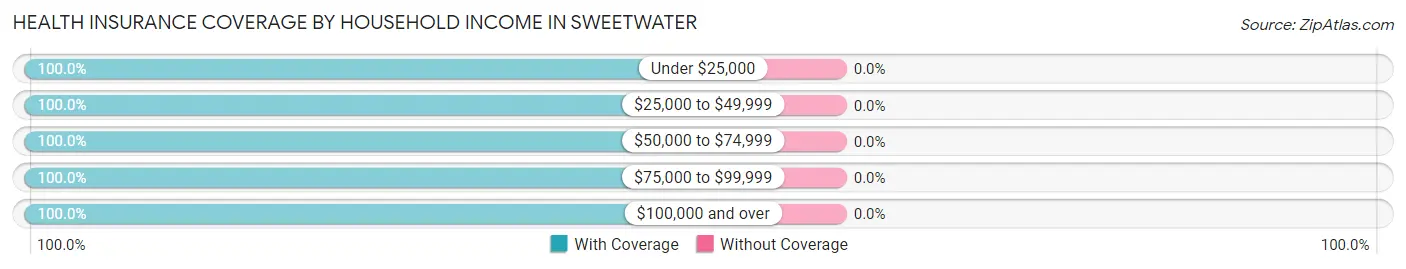
| Household Income | With Coverage | Without Coverage |
| Under $25,000 | 3 (100.0%) | 0 (0.0%) |
| $25,000 to $49,999 | 48 (100.0%) | 0 (0.0%) |
| $50,000 to $74,999 | 37 (100.0%) | 0 (0.0%) |
| $75,000 to $99,999 | 39 (100.0%) | 0 (0.0%) |
| $100,000 and over | 16 (100.0%) | 0 (0.0%) |
Public vs Private Health Insurance Coverage by Age in Sweetwater
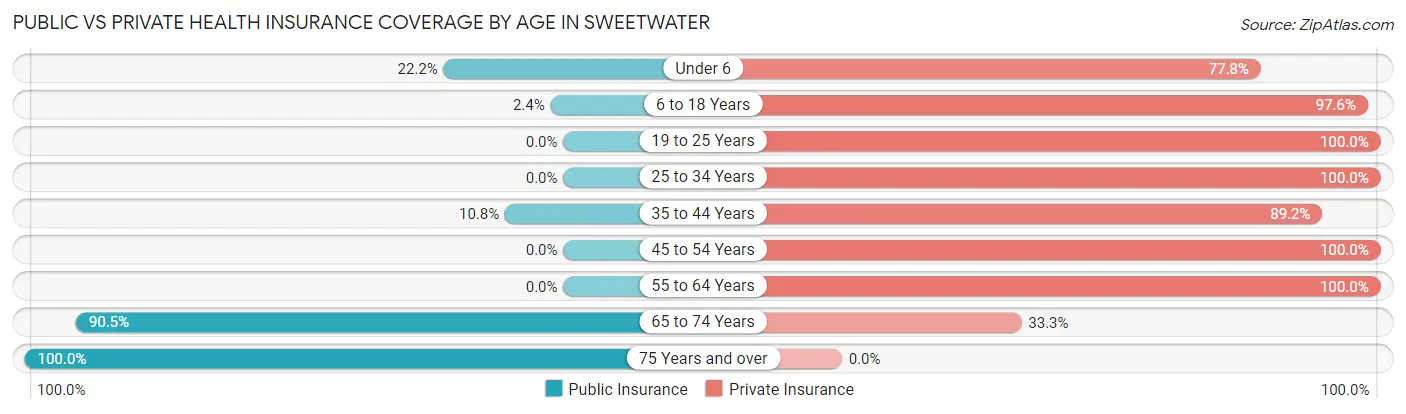
| Age Bracket | Public Insurance | Private Insurance |
| Under 6 | 2 (22.2%) | 7 (77.8%) |
| 6 to 18 Years | 1 (2.4%) | 41 (97.6%) |
| 19 to 25 Years | 0 (0.0%) | 6 (100.0%) |
| 25 to 34 Years | 0 (0.0%) | 4 (100.0%) |
| 35 to 44 Years | 4 (10.8%) | 33 (89.2%) |
| 45 to 54 Years | 0 (0.0%) | 15 (100.0%) |
| 55 to 64 Years | 0 (0.0%) | 8 (100.0%) |
| 65 to 74 Years | 19 (90.5%) | 7 (33.3%) |
| 75 Years and over | 1 (100.0%) | 0 (0.0%) |
| Total | 27 (18.9%) | 121 (84.6%) |
Disability Status by Sex by Age in Sweetwater
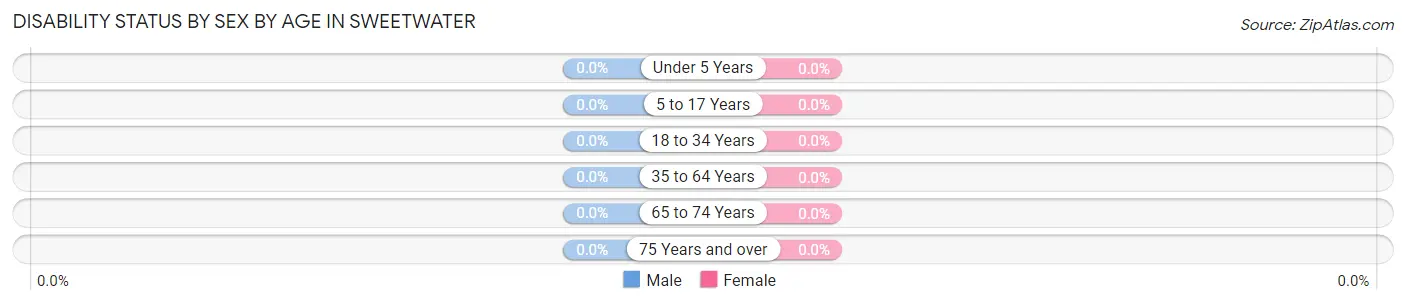
| Age Bracket | Male | Female |
| Under 5 Years | 0 (0.0%) | 0 (0.0%) |
| 5 to 17 Years | 0 (0.0%) | 0 (0.0%) |
| 18 to 34 Years | 0 (0.0%) | 0 (0.0%) |
| 35 to 64 Years | 0 (0.0%) | 0 (0.0%) |
| 65 to 74 Years | 0 (0.0%) | 0 (0.0%) |
| 75 Years and over | 0 (0.0%) | 0 (0.0%) |
Disability Class by Sex by Age in Sweetwater
Disability Class: Hearing Difficulty
| Age Bracket | Male | Female |
| Under 5 Years | 0 (0.0%) | 0 (0.0%) |
| 5 to 17 Years | 0 (0.0%) | 0 (0.0%) |
| 18 to 34 Years | 0 (0.0%) | 0 (0.0%) |
| 35 to 64 Years | 0 (0.0%) | 0 (0.0%) |
| 65 to 74 Years | 0 (0.0%) | 0 (0.0%) |
| 75 Years and over | 0 (0.0%) | 0 (0.0%) |
Disability Class: Vision Difficulty
| Age Bracket | Male | Female |
| Under 5 Years | 0 (0.0%) | 0 (0.0%) |
| 5 to 17 Years | 0 (0.0%) | 0 (0.0%) |
| 18 to 34 Years | 0 (0.0%) | 0 (0.0%) |
| 35 to 64 Years | 0 (0.0%) | 0 (0.0%) |
| 65 to 74 Years | 0 (0.0%) | 0 (0.0%) |
| 75 Years and over | 0 (0.0%) | 0 (0.0%) |
Disability Class: Cognitive Difficulty
| Age Bracket | Male | Female |
| 5 to 17 Years | 0 (0.0%) | 0 (0.0%) |
| 18 to 34 Years | 0 (0.0%) | 0 (0.0%) |
| 35 to 64 Years | 0 (0.0%) | 0 (0.0%) |
| 65 to 74 Years | 0 (0.0%) | 0 (0.0%) |
| 75 Years and over | 0 (0.0%) | 0 (0.0%) |
Disability Class: Ambulatory Difficulty
| Age Bracket | Male | Female |
| 5 to 17 Years | 0 (0.0%) | 0 (0.0%) |
| 18 to 34 Years | 0 (0.0%) | 0 (0.0%) |
| 35 to 64 Years | 0 (0.0%) | 0 (0.0%) |
| 65 to 74 Years | 0 (0.0%) | 0 (0.0%) |
| 75 Years and over | 0 (0.0%) | 0 (0.0%) |
Disability Class: Self-Care Difficulty
| Age Bracket | Male | Female |
| 5 to 17 Years | 0 (0.0%) | 0 (0.0%) |
| 18 to 34 Years | 0 (0.0%) | 0 (0.0%) |
| 35 to 64 Years | 0 (0.0%) | 0 (0.0%) |
| 65 to 74 Years | 0 (0.0%) | 0 (0.0%) |
| 75 Years and over | 0 (0.0%) | 0 (0.0%) |
Technology Access in Sweetwater
Computing Device Access in Sweetwater
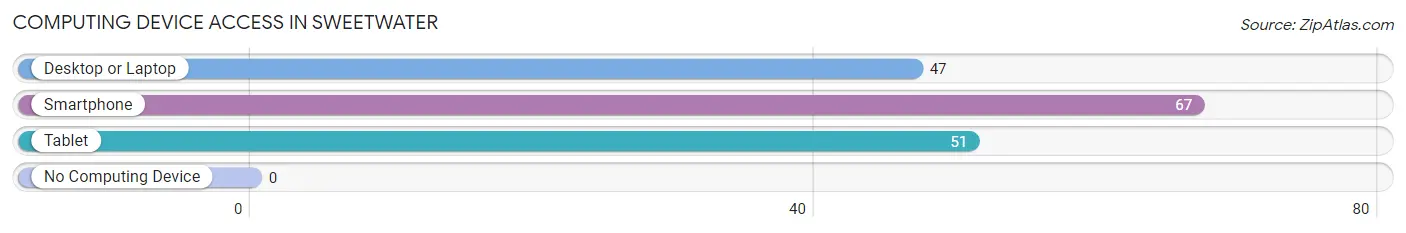
| Device Type | # Households | % Households |
| Desktop or Laptop | 47 | 65.3% |
| Smartphone | 67 | 93.1% |
| Tablet | 51 | 70.8% |
| No Computing Device | 0 | 0.0% |
| Total | 72 | 100.0% |
Internet Access in Sweetwater
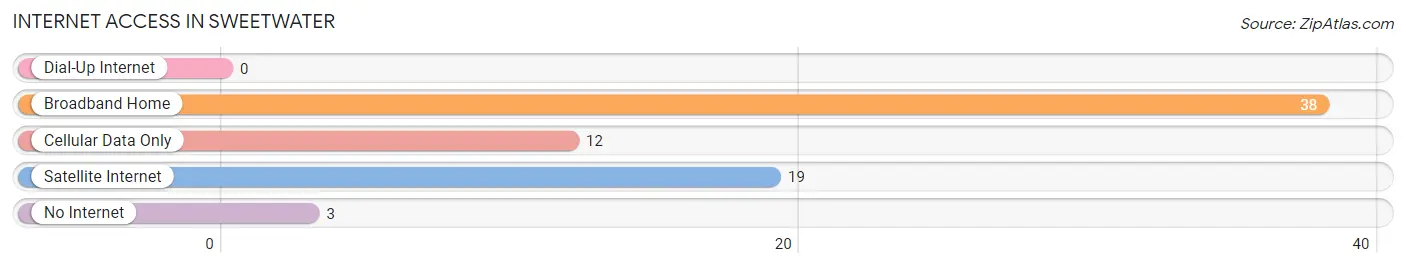
| Internet Type | # Households | % Households |
| Dial-Up Internet | 0 | 0.0% |
| Broadband Home | 38 | 52.8% |
| Cellular Data Only | 12 | 16.7% |
| Satellite Internet | 19 | 26.4% |
| No Internet | 3 | 4.2% |
| Total | 72 | 100.0% |
Sweetwater Summary
Watertown, Oklahoma is a small town located in the southwestern part of the state, in the county of Roger Mills. It is situated on the banks of the Sweetwater Creek, which is a tributary of the North Canadian River. The town was founded in 1892 and was named after the creek. It is located about 20 miles from the Oklahoma-Texas border and is part of the Cheyenne-Arapaho Indian Reservation.
History
The area around Sweetwater was first inhabited by the Cheyenne and Arapaho tribes, who had been living in the area since the 1700s. The first settlers to the area were ranchers, who began to move in during the late 1800s. The town was officially founded in 1892 and was named after the Sweetwater Creek. The town was originally a trading post for the local ranchers and farmers, and it quickly grew in size.
In the early 1900s, the town began to experience a period of growth and development. The first school was built in 1906, and the first bank opened in 1907. The town also had a post office, a hotel, and a general store. The town was also home to a number of churches, including the First Baptist Church, which was founded in 1908.
In the 1920s, the town experienced a period of decline, as the local economy began to suffer from the Great Depression. However, the town was able to recover and by the 1940s, it had become a thriving community. The town was also home to a number of businesses, including a cotton gin, a flour mill, and a lumber mill.
Geography
Sweetwater is located in the southwestern part of Oklahoma, in Roger Mills County. It is situated on the banks of the Sweetwater Creek, which is a tributary of the North Canadian River. The town is located about 20 miles from the Oklahoma-Texas border and is part of the Cheyenne-Arapaho Indian Reservation. The town is located in a semi-arid climate, with hot summers and mild winters. The average annual temperature is around 65 degrees Fahrenheit.
Economy
The economy of Sweetwater is largely based on agriculture and ranching. The town is home to a number of farms and ranches, which produce a variety of crops, including wheat, corn, and hay. The town is also home to a number of businesses, including a cotton gin, a flour mill, and a lumber mill. The town is also home to a number of retail stores, restaurants, and other businesses.
Demographics
As of the 2010 census, the population of Sweetwater was 1,093. The racial makeup of the town was 95.3% White, 0.7% African American, 0.7% Native American, 0.3% Asian, 0.1% Pacific Islander, and 2.0% from other races. The median household income was $30,938, and the median family income was $37,500. The per capita income was $15,945. The town had a poverty rate of 22.3%.
Conclusion
Sweetwater, Oklahoma is a small town located in the southwestern part of the state, in the county of Roger Mills. It is situated on the banks of the Sweetwater Creek, which is a tributary of the North Canadian River. The town was founded in 1892 and was named after the creek. The town has a long history of ranching and farming, and it is home to a number of businesses, including a cotton gin, a flour mill, and a lumber mill. The town has a population of 1,093, and the median household income is $30,938. Sweetwater is a small town with a rich history and a bright future.
Common Questions
What is Per Capita Income in Sweetwater?
Per Capita income in Sweetwater is $28,302.
What is the Median Family Income in Sweetwater?
Median Family Income in Sweetwater is $74,821.
What is the Median Household income in Sweetwater?
Median Household Income in Sweetwater is $53,750.
What is Income or Wage Gap in Sweetwater?
Income or Wage Gap in Sweetwater is 14.3%.
Women in Sweetwater earn 85.7 cents for every dollar earned by a man.
What is Inequality or Gini Index in Sweetwater?
Inequality or Gini Index in Sweetwater is 0.26.
What is the Total Population of Sweetwater?
Total Population of Sweetwater is 143.
What is the Total Male Population of Sweetwater?
Total Male Population of Sweetwater is 65.
What is the Total Female Population of Sweetwater?
Total Female Population of Sweetwater is 78.
What is the Ratio of Males per 100 Females in Sweetwater?
There are 83.33 Males per 100 Females in Sweetwater.
What is the Ratio of Females per 100 Males in Sweetwater?
There are 120.00 Females per 100 Males in Sweetwater.
What is the Median Population Age in Sweetwater?
Median Population Age in Sweetwater is 38.1 Years.
What is the Average Family Size in Sweetwater
Average Family Size in Sweetwater is 2.9 People.
What is the Average Household Size in Sweetwater
Average Household Size in Sweetwater is 2.0 People.
How Large is the Labor Force in Sweetwater?
There are 66 People in the Labor Forcein in Sweetwater.
What is the Percentage of People in the Labor Force in Sweetwater?
70.2% of People are in the Labor Force in Sweetwater.