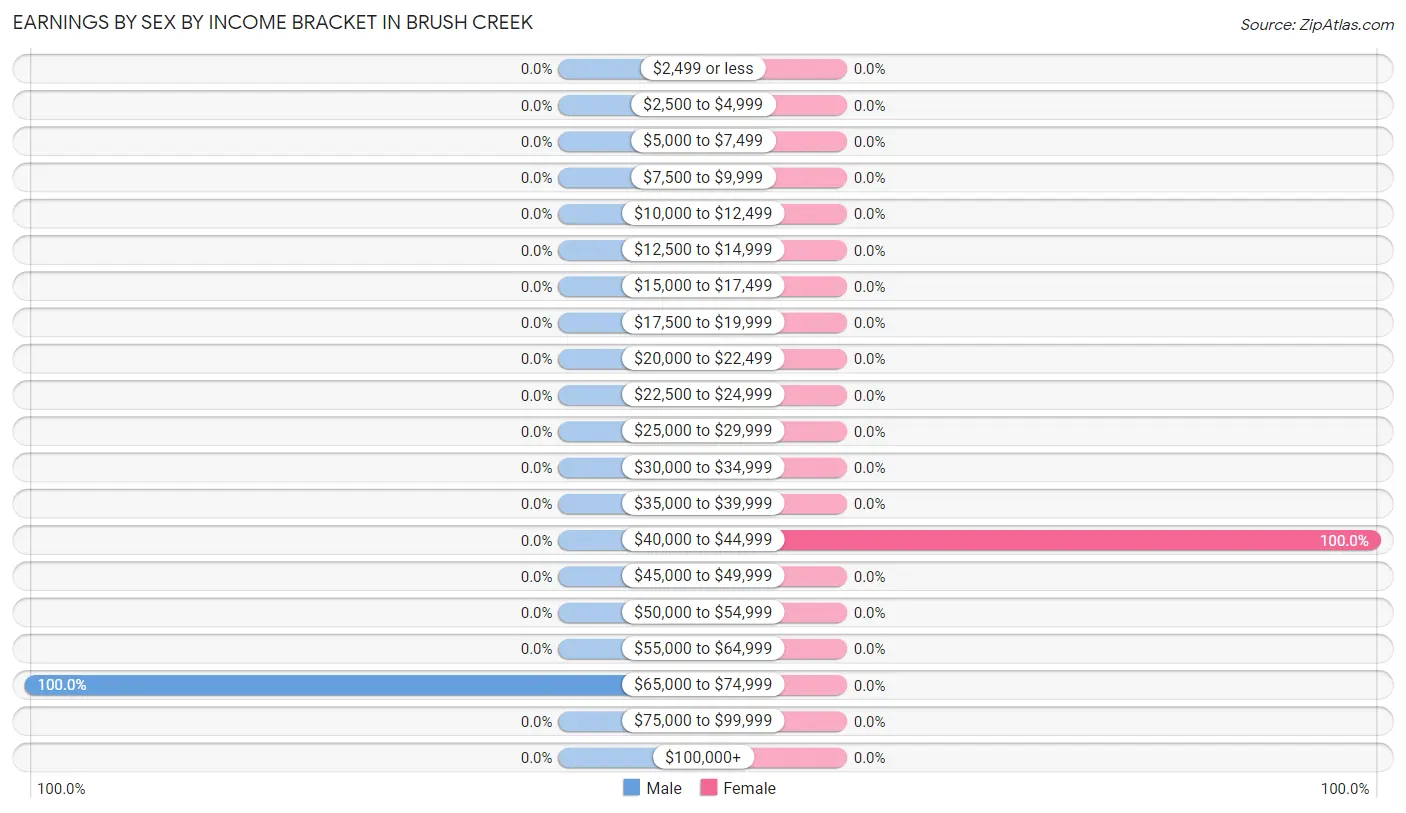
The most common earnings brackets in Brush Creek are $65,000 to $74,999 for men (41 | 100.0%) and $40,000 to $44,999 for women (61 | 100.0%).
Income
Male
Female
$2,499 or less
0 (0.0%)
0 (0.0%)
$2,500 to $4,999
0 (0.0%)
0 (0.0%)
$5,000 to $7,499
0 (0.0%)
0 (0.0%)
$7,500 to $9,999
0 (0.0%)
0 (0.0%)
$10,000 to $12,499
0 (0.0%)
0 (0.0%)
$12,500 to $14,999
0 (0.0%)
0 (0.0%)
$15,000 to $17,499
0 (0.0%)
0 (0.0%)
$17,500 to $19,999
0 (0.0%)
0 (0.0%)
$20,000 to $22,499
0 (0.0%)
0 (0.0%)
$22,500 to $24,999
0 (0.0%)
0 (0.0%)
$25,000 to $29,999
0 (0.0%)
0 (0.0%)
$30,000 to $34,999
0 (0.0%)
0 (0.0%)
$35,000 to $39,999
0 (0.0%)
0 (0.0%)
$40,000 to $44,999
0 (0.0%)
61 (100.0%)
$45,000 to $49,999
0 (0.0%)
0 (0.0%)
$50,000 to $54,999
0 (0.0%)
0 (0.0%)
$55,000 to $64,999
0 (0.0%)
0 (0.0%)
$65,000 to $74,999
41 (100.0%)
0 (0.0%)
$75,000 to $99,999
0 (0.0%)
0 (0.0%)
$100,000+
0 (0.0%)
0 (0.0%)
Total
41 (100.0%)
61 (100.0%)
Earnings by Sex by Educational Attainment in Brush Creek
Educational Attainment
Male Income
Female Income
Less than High School
-
-
High School Diploma
-
-
College or Associate's Degree
-
-
Bachelor's Degree
-
-
Graduate Degree
-
-
Total
-
-
Family Income in Brush Creek
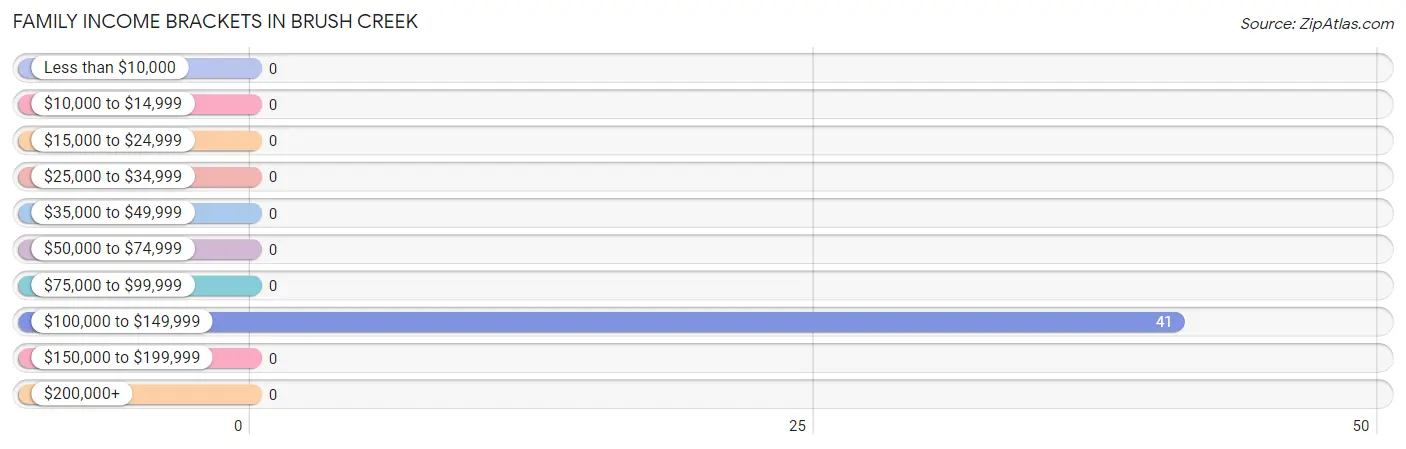
Family Income Brackets in Brush Creek
According to the Brush Creek family income data, there are 41 families falling into the $100,000 to $149,999 income range, which is the most common income bracket and makes up 100.0% of all families.
Income Bracket
# Families
% Families
Less than $10,000
0
0.0%
$10,000 to $14,999
0
0.0%
$15,000 to $24,999
0
0.0%
$25,000 to $34,999
0
0.0%
$35,000 to $49,999
0
0.0%
$50,000 to $74,999
0
0.0%
$75,000 to $99,999
0
0.0%
$100,000 to $149,999
41
100.0%
$150,000 to $199,999
0
0.0%
$200,000+
0
0.0%
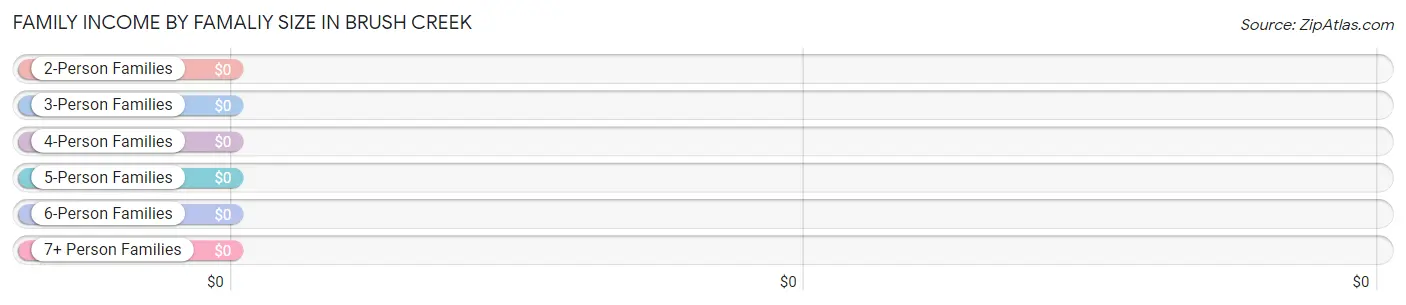
Family Income by Famaliy Size in Brush Creek
Income Bracket
# Families
Median Income
2-Person Families
41 (100.0%)
$0
3-Person Families
0 (0.0%)
$0
4-Person Families
0 (0.0%)
$0
5-Person Families
0 (0.0%)
$0
6-Person Families
0 (0.0%)
$0
7+ Person Families
0 (0.0%)
$0
Total
41 (100.0%)
$0
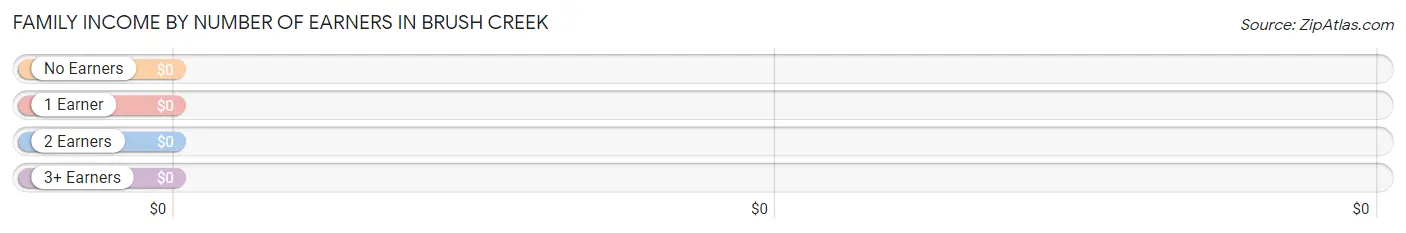
Family Income by Number of Earners in Brush Creek
Number of Earners
# Families
Median Income
No Earners
0 (0.0%)
$0
1 Earner
0 (0.0%)
$0
2 Earners
41 (100.0%)
$0
3+ Earners
0 (0.0%)
$0
Total
41 (100.0%)
$0
Household Income in Brush Creek
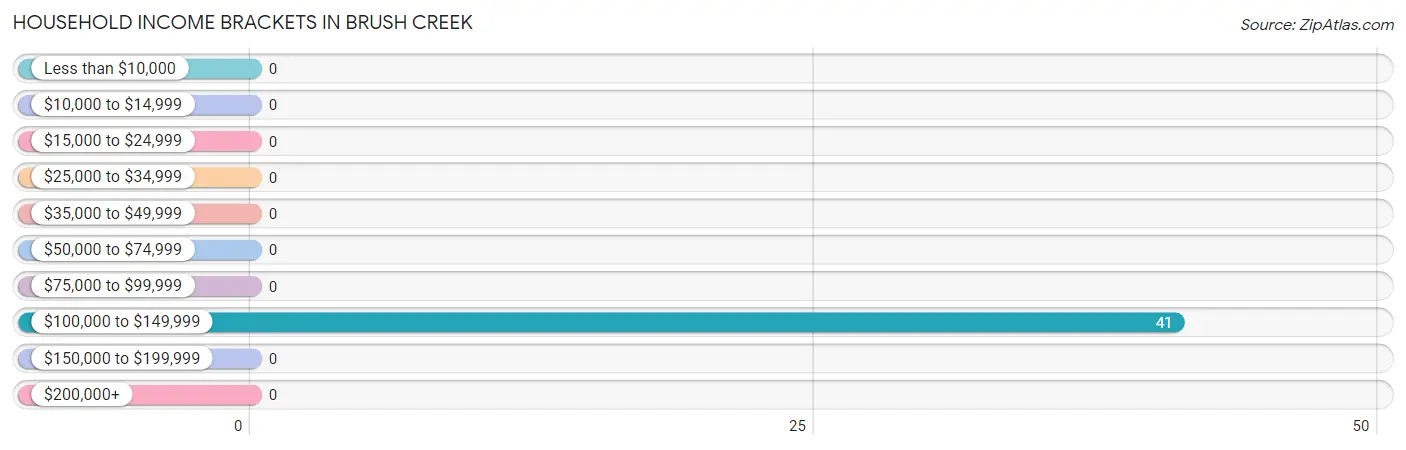
Household Income Brackets in Brush Creek
With 41 households falling in the category, the $100,000 to $149,999 income range is the most frequent in Brush Creek, accounting for 100.0% of all households.
Income Bracket
# Households
% Households
Less than $10,000
0
0.0%
$10,000 to $14,999
0
0.0%
$15,000 to $24,999
0
0.0%
$25,000 to $34,999
0
0.0%
$35,000 to $49,999
0
0.0%
$50,000 to $74,999
0
0.0%
$75,000 to $99,999
0
0.0%
$100,000 to $149,999
41
100.0%
$150,000 to $199,999
0
0.0%
$200,000+
0
0.0%
Household Income by Householder Age in Brush Creek
Income Bracket
# Households
Median Income
15 to 24 Years
0 (0.0%)
$0
25 to 44 Years
0 (0.0%)
$0
45 to 64 Years
41 (100.0%)
$0
65+ Years
0 (0.0%)
$0
Total
41 (100.0%)
$0
Poverty in Brush Creek
Income Below Poverty by Sex and Age in Brush Creek
Age Bracket
Male
Female
Under 5 Years
0 (0.0%)
0 (0.0%)
5 Years
0 (0.0%)
0 (0.0%)
6 to 11 Years
0 (0.0%)
0 (0.0%)
12 to 14 Years
0 (0.0%)
0 (0.0%)
15 Years
0 (0.0%)
0 (0.0%)
16 and 17 Years
0 (0.0%)
0 (0.0%)
18 to 24 Years
0 (0.0%)
0 (0.0%)
25 to 34 Years
0 (0.0%)
0 (0.0%)
35 to 44 Years
0 (0.0%)
0 (0.0%)
45 to 54 Years
0 (0.0%)
0 (0.0%)
55 to 64 Years
0 (0.0%)
0 (0.0%)
65 to 74 Years
0 (0.0%)
0 (0.0%)
75 Years and over
0 (0.0%)
0 (0.0%)
Total
0 (0.0%)
0 (0.0%)
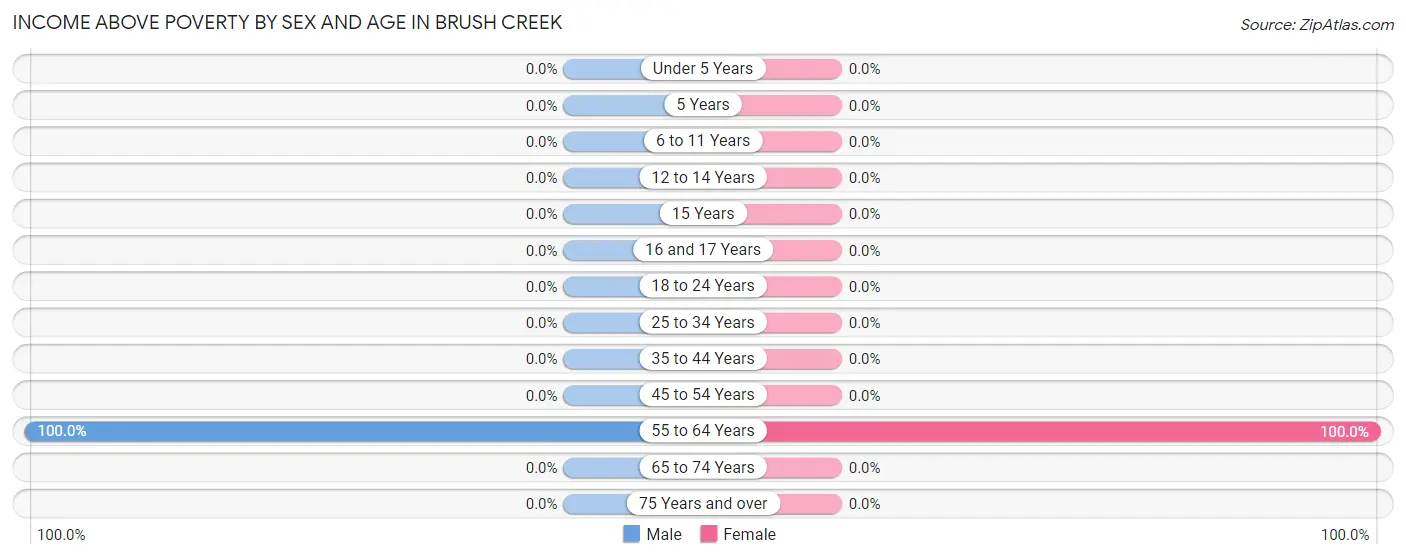
Income Above Poverty by Sex and Age in Brush Creek
According to the poverty statistics in Brush Creek, males aged 55 to 64 years and females aged 55 to 64 years are the age groups that are most secure financially, with 100.0% of males and 100.0% of females in these age groups living above the poverty line.
Age Bracket
Male
Female
Under 5 Years
0 (0.0%)
0 (0.0%)
5 Years
0 (0.0%)
0 (0.0%)
6 to 11 Years
0 (0.0%)
0 (0.0%)
12 to 14 Years
0 (0.0%)
0 (0.0%)
15 Years
0 (0.0%)
0 (0.0%)
16 and 17 Years
0 (0.0%)
0 (0.0%)
18 to 24 Years
0 (0.0%)
0 (0.0%)
25 to 34 Years
0 (0.0%)
0 (0.0%)
35 to 44 Years
0 (0.0%)
0 (0.0%)
45 to 54 Years
0 (0.0%)
0 (0.0%)
55 to 64 Years
41 (100.0%)
61 (100.0%)
65 to 74 Years
0 (0.0%)
0 (0.0%)
75 Years and over
0 (0.0%)
0 (0.0%)
Total
41 (100.0%)
61 (100.0%)
Income Below Poverty Among Married-Couple Families in Brush Creek
Children
Above Poverty
Below Poverty
No Children
41 (100.0%)
0 (0.0%)
1 or 2 Children
0 (0.0%)
0 (0.0%)
3 or 4 Children
0 (0.0%)
0 (0.0%)
5 or more Children
0 (0.0%)
0 (0.0%)
Total
41 (100.0%)
0 (0.0%)
Income Below Poverty Among Single-Parent Households in Brush Creek
Children
Single Father
Single Mother
No Children
0 (0.0%)
0 (0.0%)
1 or 2 Children
0 (0.0%)
0 (0.0%)
3 or 4 Children
0 (0.0%)
0 (0.0%)
5 or more Children
0 (0.0%)
0 (0.0%)
Total
0 (0.0%)
0 (0.0%)
Income Below Poverty Among Married-Couple vs Single-Parent Households in Brush Creek
Children
Married-Couple Families
Single-Parent Households
No Children
0 (0.0%)
0 (0.0%)
1 or 2 Children
0 (0.0%)
0 (0.0%)
3 or 4 Children
0 (0.0%)
0 (0.0%)
5 or more Children
0 (0.0%)
0 (0.0%)
Total
0 (0.0%)
0 (0.0%)
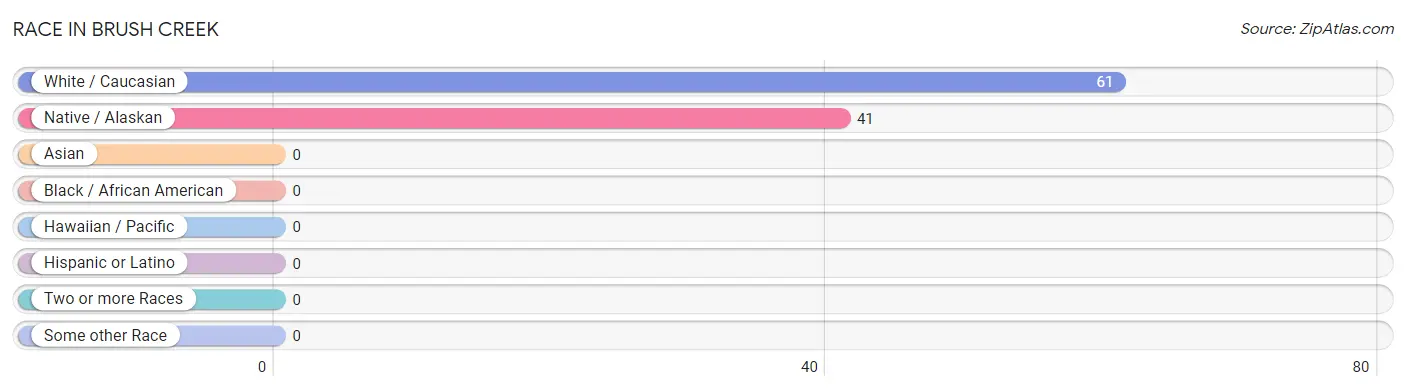
Race in Brush Creek
The most populous races in Brush Creek are White / Caucasian (61 | 59.8%), and Native / Alaskan (41 | 40.2%).
Race
# Population
% Population
Asian
0
0.0%
Black / African American
0
0.0%
Hawaiian / Pacific
0
0.0%
Hispanic or Latino
0
0.0%
Native / Alaskan
41
40.2%
White / Caucasian
61
59.8%
Two or more Races
0
0.0%
Some other Race
0
0.0%
Total
102
100.0%
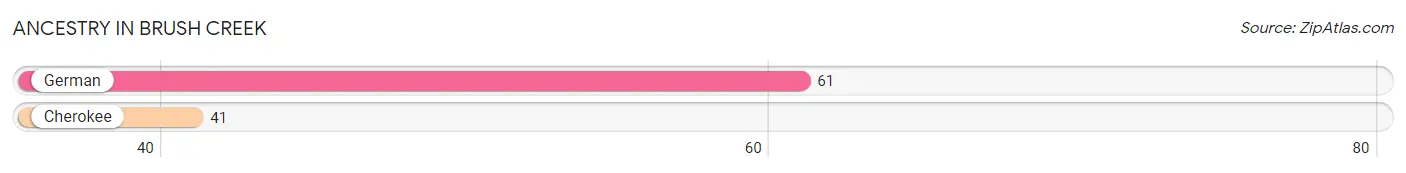
Ancestry in Brush Creek
The most populous ancestries reported in Brush Creek are German (61 | 59.8%), and Cherokee (41 | 40.2%), together accounting for 100.0% of all Brush Creek residents.
Ancestry
# Population
% Population
Cherokee
41
40.2%
German
61
59.8%
View All 2 Rows
Immigrants in Brush Creek
Immigration Origin
# Population
% Population
View All 0 Rows
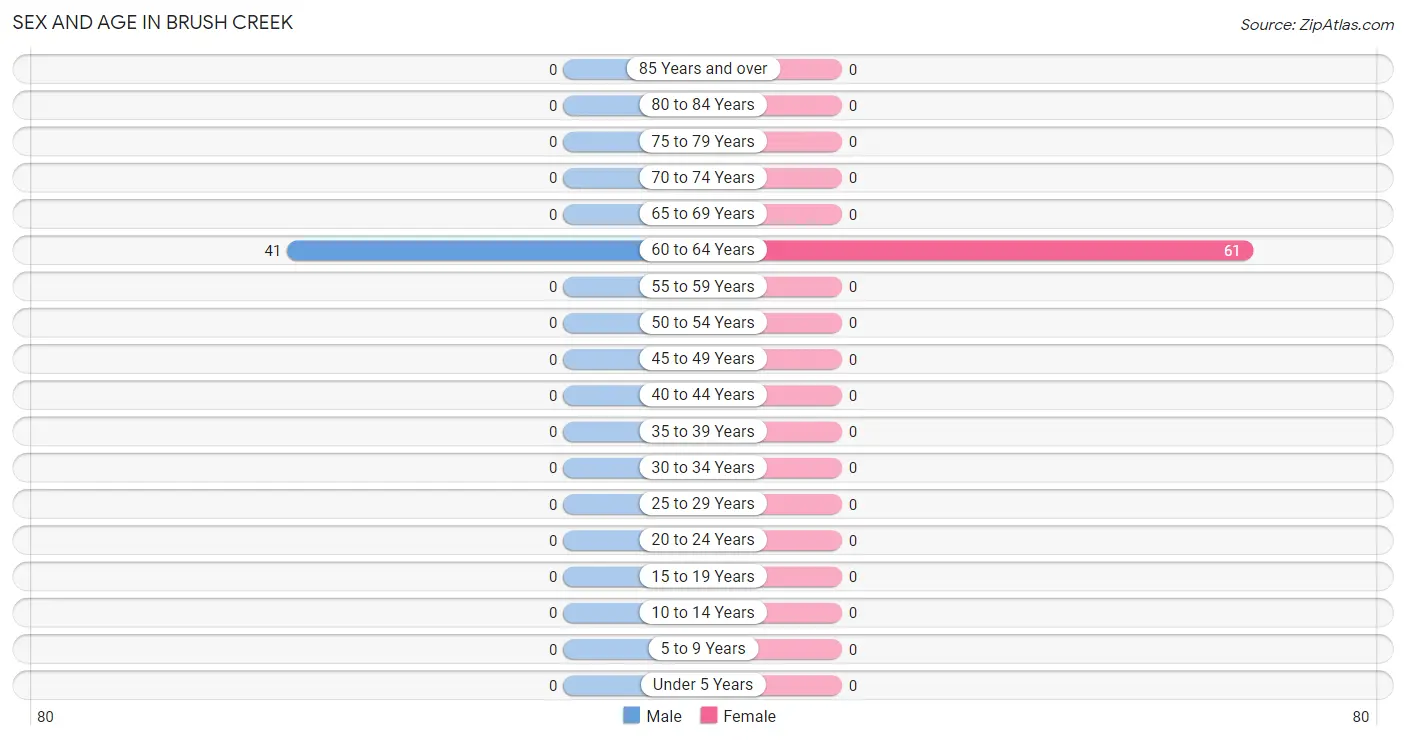
Sex and Age in Brush Creek
Sex and Age in Brush Creek
The most populous age groups in Brush Creek are 60 to 64 Years (41 | 100.0%) for men and 60 to 64 Years (61 | 100.0%) for women.
Age Bracket
Male
Female
Under 5 Years
0 (0.0%)
0 (0.0%)
5 to 9 Years
0 (0.0%)
0 (0.0%)
10 to 14 Years
0 (0.0%)
0 (0.0%)
15 to 19 Years
0 (0.0%)
0 (0.0%)
20 to 24 Years
0 (0.0%)
0 (0.0%)
25 to 29 Years
0 (0.0%)
0 (0.0%)
30 to 34 Years
0 (0.0%)
0 (0.0%)
35 to 39 Years
0 (0.0%)
0 (0.0%)
40 to 44 Years
0 (0.0%)
0 (0.0%)
45 to 49 Years
0 (0.0%)
0 (0.0%)
50 to 54 Years
0 (0.0%)
0 (0.0%)
55 to 59 Years
0 (0.0%)
0 (0.0%)
60 to 64 Years
41 (100.0%)
61 (100.0%)
65 to 69 Years
0 (0.0%)
0 (0.0%)
70 to 74 Years
0 (0.0%)
0 (0.0%)
75 to 79 Years
0 (0.0%)
0 (0.0%)
80 to 84 Years
0 (0.0%)
0 (0.0%)
85 Years and over
0 (0.0%)
0 (0.0%)
Total
41 (100.0%)
61 (100.0%)
Families and Households in Brush Creek
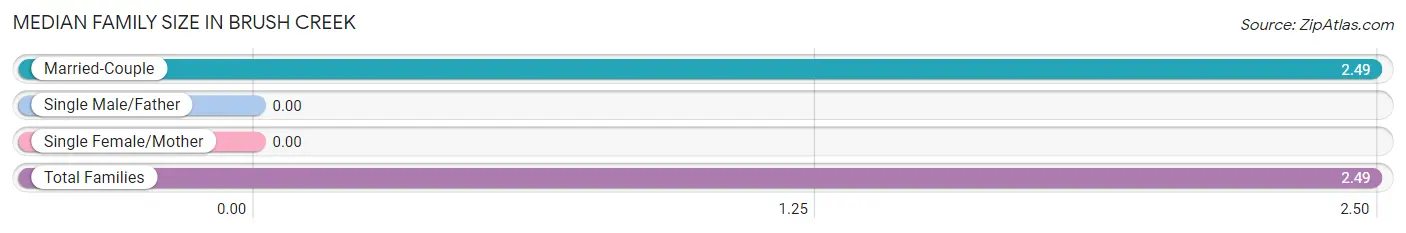
Median Family Size in Brush Creek
Family Type
# Families
Family Size
Married-Couple
41 (100.0%)
2.49
Single Male/Father
0 (0.0%)
-
Single Female/Mother
0 (0.0%)
-
Total Families
41 (100.0%)
2.49
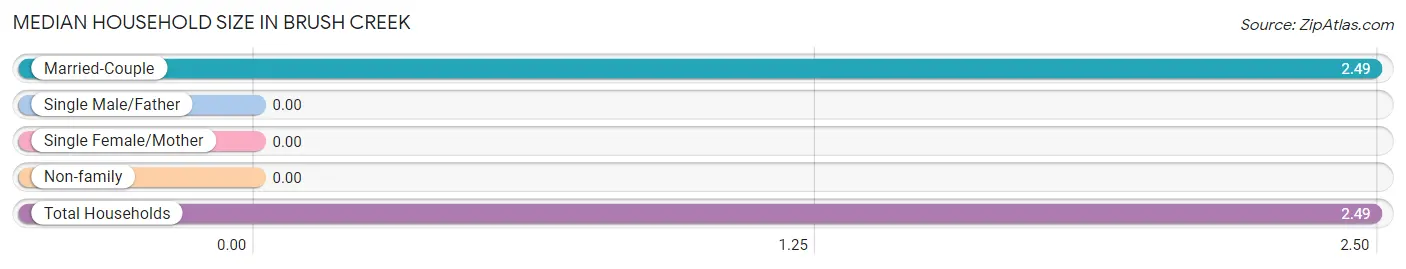
Median Household Size in Brush Creek
Household Type
# Households
Household Size
Married-Couple
41 (100.0%)
2.49
Single Male/Father
0 (0.0%)
-
Single Female/Mother
0 (0.0%)
-
Non-family
0 (0.0%)
-
Total Households
41 (100.0%)
2.49
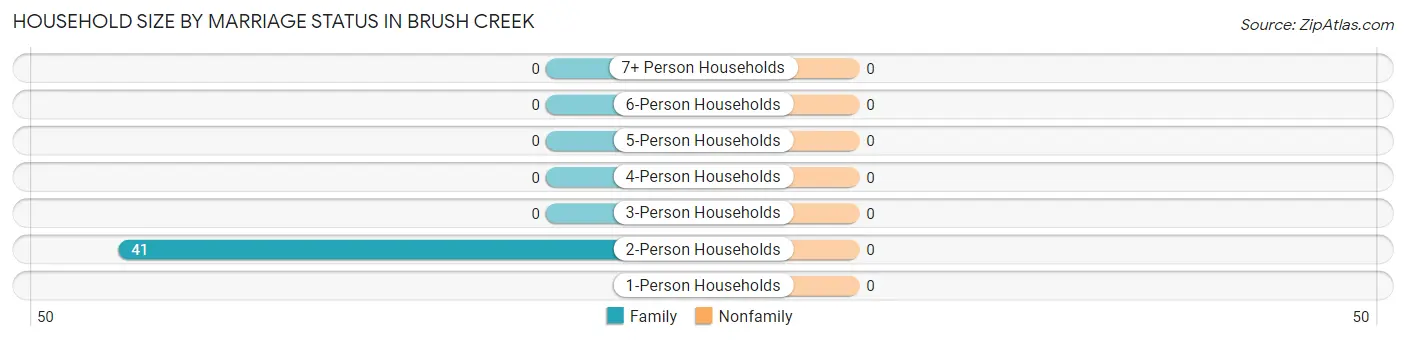
Household Size by Marriage Status in Brush Creek
Household Size
Family Households
Nonfamily Households
1-Person Households
-
0 (0.0%)
2-Person Households
41 (100.0%)
0 (0.0%)
3-Person Households
0 (0.0%)
0 (0.0%)
4-Person Households
0 (0.0%)
0 (0.0%)
5-Person Households
0 (0.0%)
0 (0.0%)
6-Person Households
0 (0.0%)
0 (0.0%)
7+ Person Households
0 (0.0%)
0 (0.0%)
Total
41 (100.0%)
0 (0.0%)
Female Fertility in Brush Creek
Fertility by Age in Brush Creek
Age Bracket
Women with Births
Births / 1,000 Women
15 to 19 years
0 (0.0%)
0.0
20 to 34 years
0 (0.0%)
0.0
35 to 50 years
0 (0.0%)
0.0
Total
0 (0.0%)
0.0
Fertility by Age by Marriage Status in Brush Creek
Age Bracket
Married
Unmarried
15 to 19 years
0 (0.0%)
0 (0.0%)
20 to 34 years
0 (0.0%)
0 (0.0%)
35 to 50 years
0 (0.0%)
0 (0.0%)
Total
0 (0.0%)
0 (0.0%)
Fertility by Education in Brush Creek
Educational Attainment
Women with Births
Births / 1,000 Women
Less than High School
0 (0.0%)
0.0
High School Diploma
0 (0.0%)
0.0
College or Associate's Degree
0 (0.0%)
0.0
Bachelor's Degree
0 (0.0%)
0.0
Graduate Degree
0 (0.0%)
0.0
Total
0 (0.0%)
0.0
Fertility by Education by Marriage Status in Brush Creek
Educational Attainment
Married
Unmarried
Less than High School
0 (0.0%)
0 (0.0%)
High School Diploma
0 (0.0%)
0 (0.0%)
College or Associate's Degree
0 (0.0%)
0 (0.0%)
Bachelor's Degree
0 (0.0%)
0 (0.0%)
Graduate Degree
0 (0.0%)
0 (0.0%)
Total
0 (0.0%)
0 (0.0%)
Employment Characteristics in Brush Creek
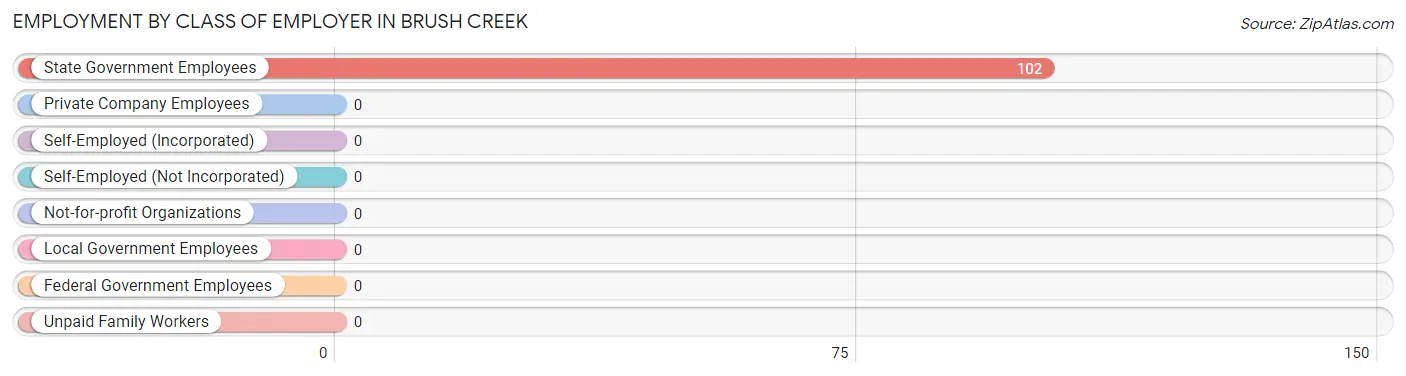
Employment by Class of Employer in Brush Creek
Among the 102 employed individuals in Brush Creek, , and state government employees (102 | 100.0%) make up the most common classes of employment.
Employer Class
# Employees
% Employees
Private Company Employees
0
0.0%
Self-Employed (Incorporated)
0
0.0%
Self-Employed (Not Incorporated)
0
0.0%
Not-for-profit Organizations
0
0.0%
Local Government Employees
0
0.0%
State Government Employees
102
100.0%
Federal Government Employees
0
0.0%
Unpaid Family Workers
0
0.0%
Total
102
100.0%
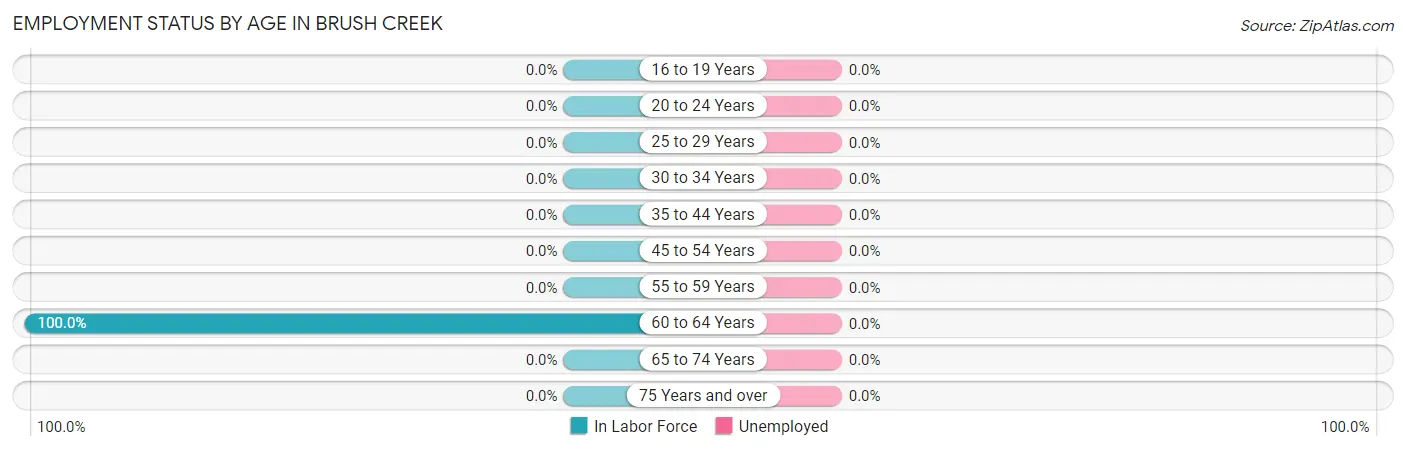
Employment Status by Age in Brush Creek
Age Bracket
In Labor Force
Unemployed
16 to 19 Years
0 (0.0%)
0 (0.0%)
20 to 24 Years
0 (0.0%)
0 (0.0%)
25 to 29 Years
0 (0.0%)
0 (0.0%)
30 to 34 Years
0 (0.0%)
0 (0.0%)
35 to 44 Years
0 (0.0%)
0 (0.0%)
45 to 54 Years
0 (0.0%)
0 (0.0%)
55 to 59 Years
0 (0.0%)
0 (0.0%)
60 to 64 Years
102 (100.0%)
0 (0.0%)
65 to 74 Years
0 (0.0%)
0 (0.0%)
75 Years and over
0 (0.0%)
0 (0.0%)
Total
102 (100.0%)
0 (0.0%)
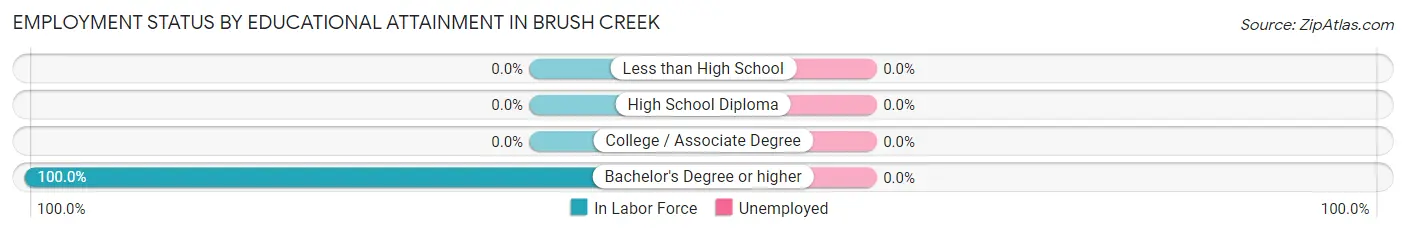
Employment Status by Educational Attainment in Brush Creek
Educational Attainment
In Labor Force
Unemployed
Less than High School
0 (0.0%)
0 (0.0%)
High School Diploma
0 (0.0%)
0 (0.0%)
College / Associate Degree
0 (0.0%)
0 (0.0%)
Bachelor's Degree or higher
102 (100.0%)
0 (0.0%)
Total
102 (100.0%)
0 (0.0%)
Employment Occupations by Sex in Brush Creek
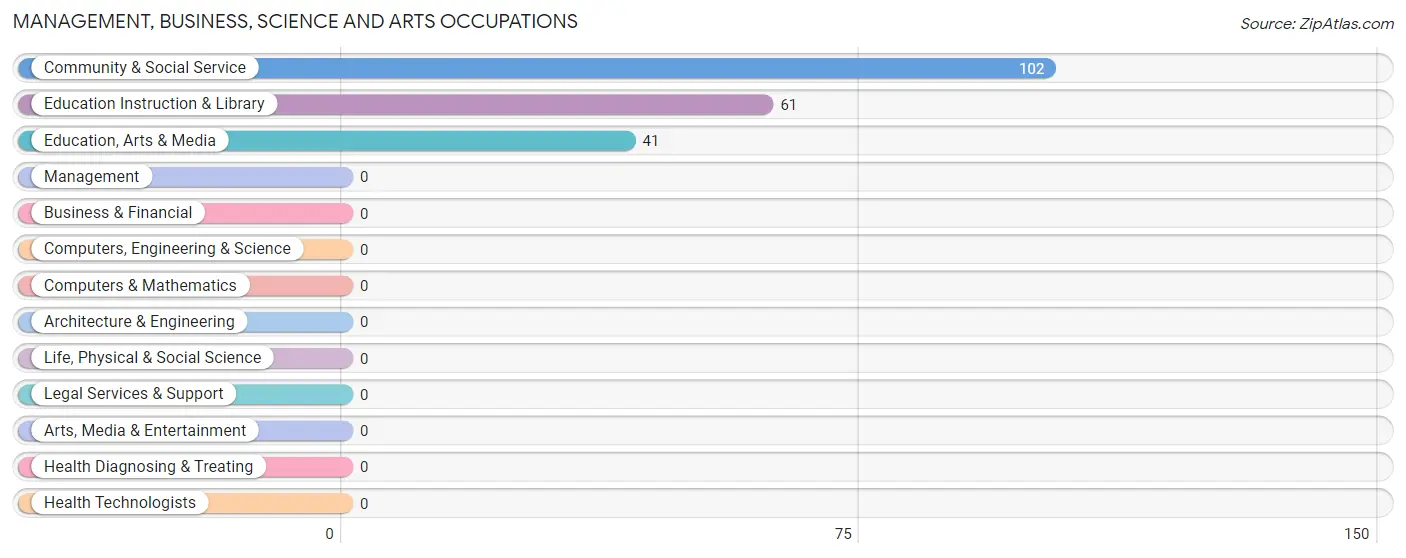
Management, Business, Science and Arts Occupations
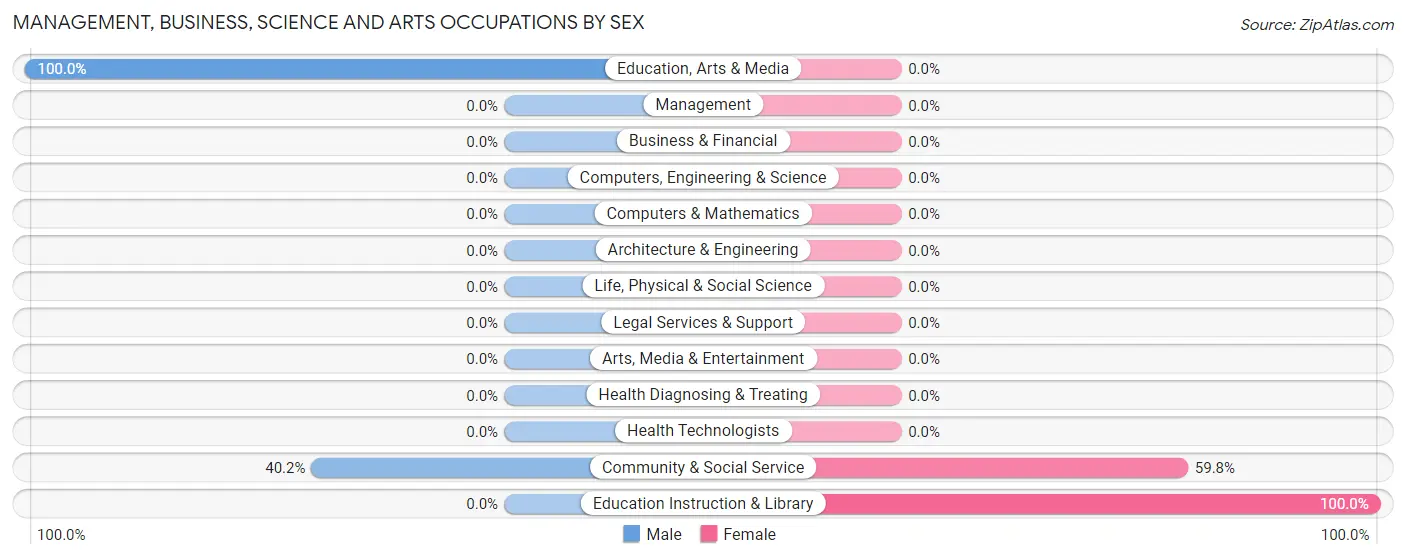
The most common Management, Business, Science and Arts occupations in Brush Creek are Community & Social Service (102 | 100.0%), Education Instruction & Library (61 | 59.8%), and Education, Arts & Media (41 | 40.2%).
Management, Business, Science and Arts Occupations by Sex
Within the Management, Business, Science and Arts occupations in Brush Creek, the most male-oriented occupations are Education, Arts & Media (100.0%), and Community & Social Service (40.2%), while the most female-oriented occupations are Education Instruction & Library (100.0%), and Community & Social Service (59.8%).
Occupation
Male
Female
Management
0 (0.0%)
0 (0.0%)
Business & Financial
0 (0.0%)
0 (0.0%)
Computers, Engineering & Science
0 (0.0%)
0 (0.0%)
Computers & Mathematics
0 (0.0%)
0 (0.0%)
Architecture & Engineering
0 (0.0%)
0 (0.0%)
Life, Physical & Social Science
0 (0.0%)
0 (0.0%)
Community & Social Service
41 (40.2%)
61 (59.8%)
Education, Arts & Media
41 (100.0%)
0 (0.0%)
Legal Services & Support
0 (0.0%)
0 (0.0%)
Education Instruction & Library
0 (0.0%)
61 (100.0%)
Arts, Media & Entertainment
0 (0.0%)
0 (0.0%)
Health Diagnosing & Treating
0 (0.0%)
0 (0.0%)
Health Technologists
0 (0.0%)
0 (0.0%)
Total (Category)
41 (40.2%)
61 (59.8%)
Total (Overall)
41 (40.2%)
61 (59.8%)
Services Occupations
Services Occupations by Sex
Occupation
Male
Female
Healthcare Support
0 (0.0%)
0 (0.0%)
Security & Protection
0 (0.0%)
0 (0.0%)
Firefighting & Prevention
0 (0.0%)
0 (0.0%)
Law Enforcement
0 (0.0%)
0 (0.0%)
Food Preparation & Serving
0 (0.0%)
0 (0.0%)
Cleaning & Maintenance
0 (0.0%)
0 (0.0%)
Personal Care & Service
0 (0.0%)
0 (0.0%)
Total (Category)
0 (0.0%)
0 (0.0%)
Total (Overall)
41 (40.2%)
61 (59.8%)
Sales and Office Occupations
Sales and Office Occupations by Sex
Occupation
Male
Female
Sales & Related
0 (0.0%)
0 (0.0%)
Office & Administration
0 (0.0%)
0 (0.0%)
Total (Category)
0 (0.0%)
0 (0.0%)
Total (Overall)
41 (40.2%)
61 (59.8%)
Natural Resources, Construction and Maintenance Occupations
Natural Resources, Construction and Maintenance Occupations by Sex
Occupation
Male
Female
Farming, Fishing & Forestry
0 (0.0%)
0 (0.0%)
Construction & Extraction
0 (0.0%)
0 (0.0%)
Installation, Maintenance & Repair
0 (0.0%)
0 (0.0%)
Total (Category)
0 (0.0%)
0 (0.0%)
Total (Overall)
41 (40.2%)
61 (59.8%)
Production, Transportation and Moving Occupations
Production, Transportation and Moving Occupations by Sex
Occupation
Male
Female
Production
0 (0.0%)
0 (0.0%)
Transportation
0 (0.0%)
0 (0.0%)
Material Moving
0 (0.0%)
0 (0.0%)
Total (Category)
0 (0.0%)
0 (0.0%)
Total (Overall)
41 (40.2%)
61 (59.8%)
Employment Industries by Sex in Brush Creek
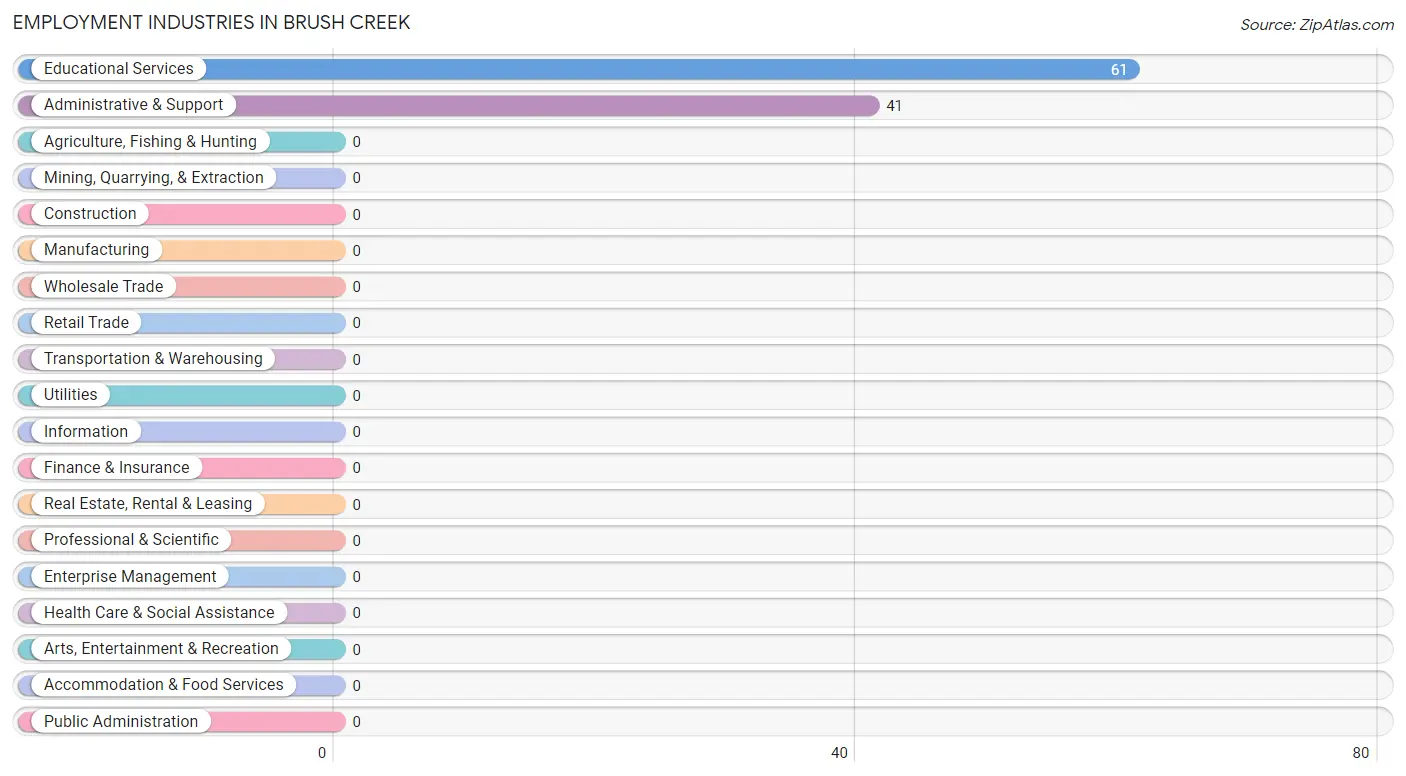
Employment Industries in Brush Creek
The major employment industries in Brush Creek include Educational Services (61 | 59.8%), and Administrative & Support (41 | 40.2%).
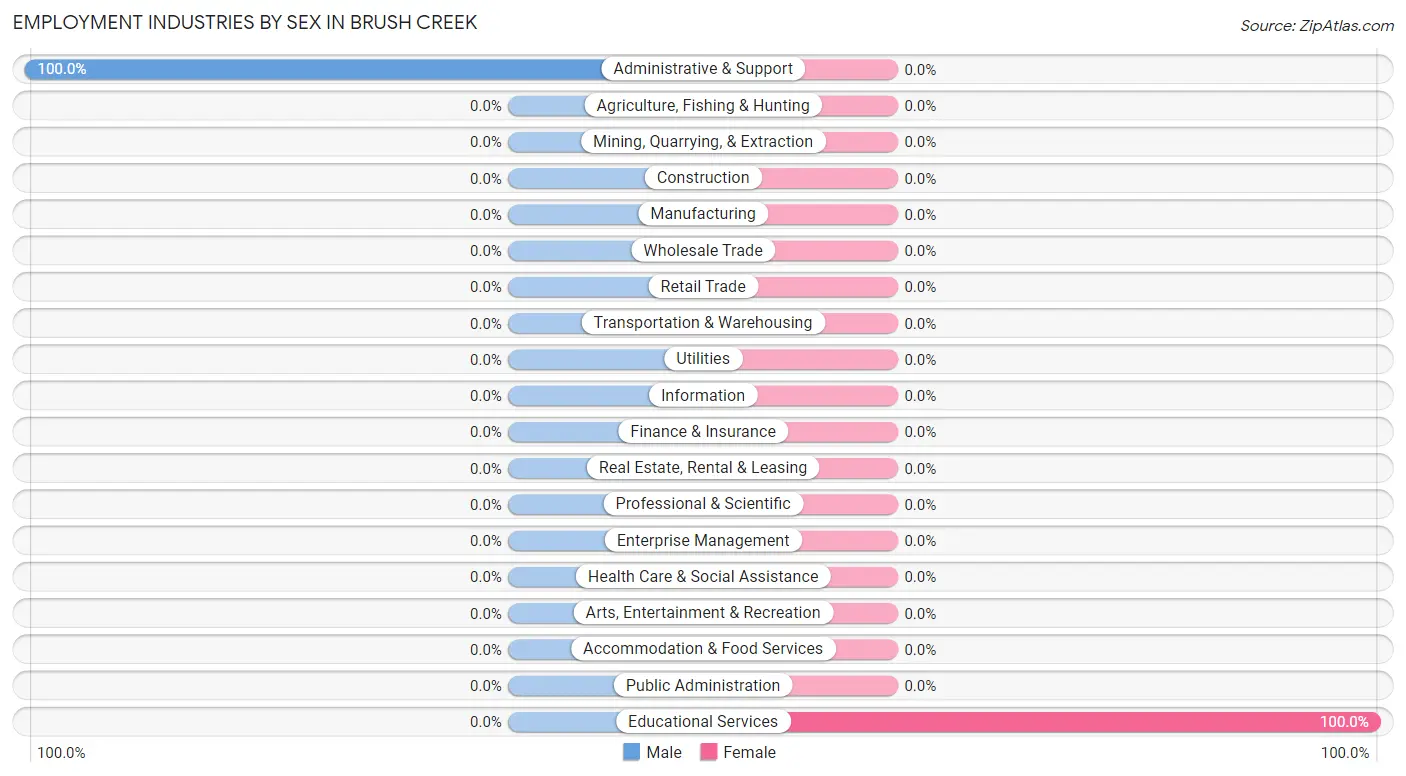
Employment Industries by Sex in Brush Creek
Industry
Male
Female
Agriculture, Fishing & Hunting
0 (0.0%)
0 (0.0%)
Mining, Quarrying, & Extraction
0 (0.0%)
0 (0.0%)
Construction
0 (0.0%)
0 (0.0%)
Manufacturing
0 (0.0%)
0 (0.0%)
Wholesale Trade
0 (0.0%)
0 (0.0%)
Retail Trade
0 (0.0%)
0 (0.0%)
Transportation & Warehousing
0 (0.0%)
0 (0.0%)
Utilities
0 (0.0%)
0 (0.0%)
Information
0 (0.0%)
0 (0.0%)
Finance & Insurance
0 (0.0%)
0 (0.0%)
Real Estate, Rental & Leasing
0 (0.0%)
0 (0.0%)
Professional & Scientific
0 (0.0%)
0 (0.0%)
Enterprise Management
0 (0.0%)
0 (0.0%)
Administrative & Support
41 (100.0%)
0 (0.0%)
Educational Services
0 (0.0%)
61 (100.0%)
Health Care & Social Assistance
0 (0.0%)
0 (0.0%)
Arts, Entertainment & Recreation
0 (0.0%)
0 (0.0%)
Accommodation & Food Services
0 (0.0%)
0 (0.0%)
Public Administration
0 (0.0%)
0 (0.0%)
Total
41 (40.2%)
61 (59.8%)
Education in Brush Creek
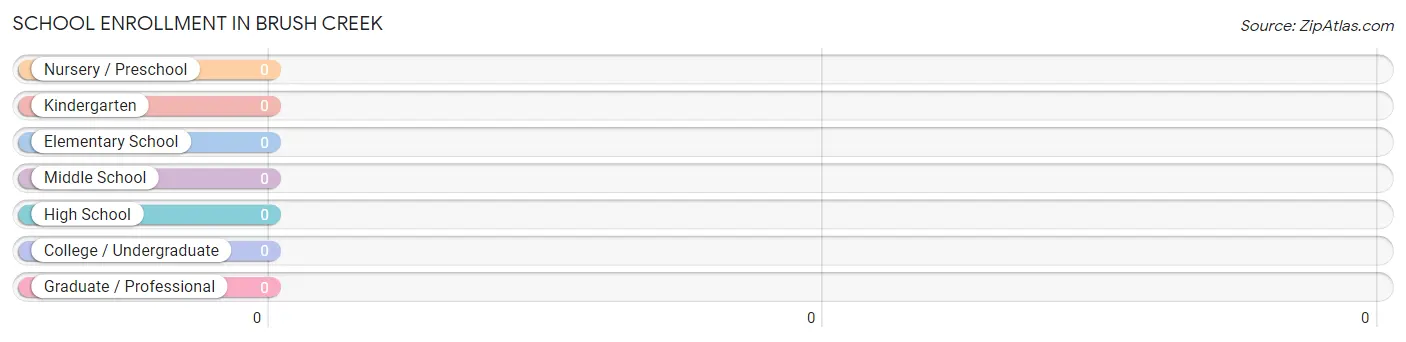
School Enrollment in Brush Creek
School Level
# Students
% Students
Nursery / Preschool
0
0.0%
Kindergarten
0
0.0%
Elementary School
0
0.0%
Middle School
0
0.0%
High School
0
0.0%
College / Undergraduate
0
0.0%
Graduate / Professional
0
0.0%
Total
0
0.0%
School Enrollment by Age by Funding Source in Brush Creek
Age Bracket
Public School
Private School
3 to 4 Year Olds
0 (0.0%)
0 (0.0%)
5 to 9 Year Old
0 (0.0%)
0 (0.0%)
10 to 14 Year Olds
0 (0.0%)
0 (0.0%)
15 to 17 Year Olds
0 (0.0%)
0 (0.0%)
18 to 19 Year Olds
0 (0.0%)
0 (0.0%)
20 to 24 Year Olds
0 (0.0%)
0 (0.0%)
25 to 34 Year Olds
0 (0.0%)
0 (0.0%)
35 Years and over
0 (0.0%)
0 (0.0%)
Total
0 (0.0%)
0 (0.0%)
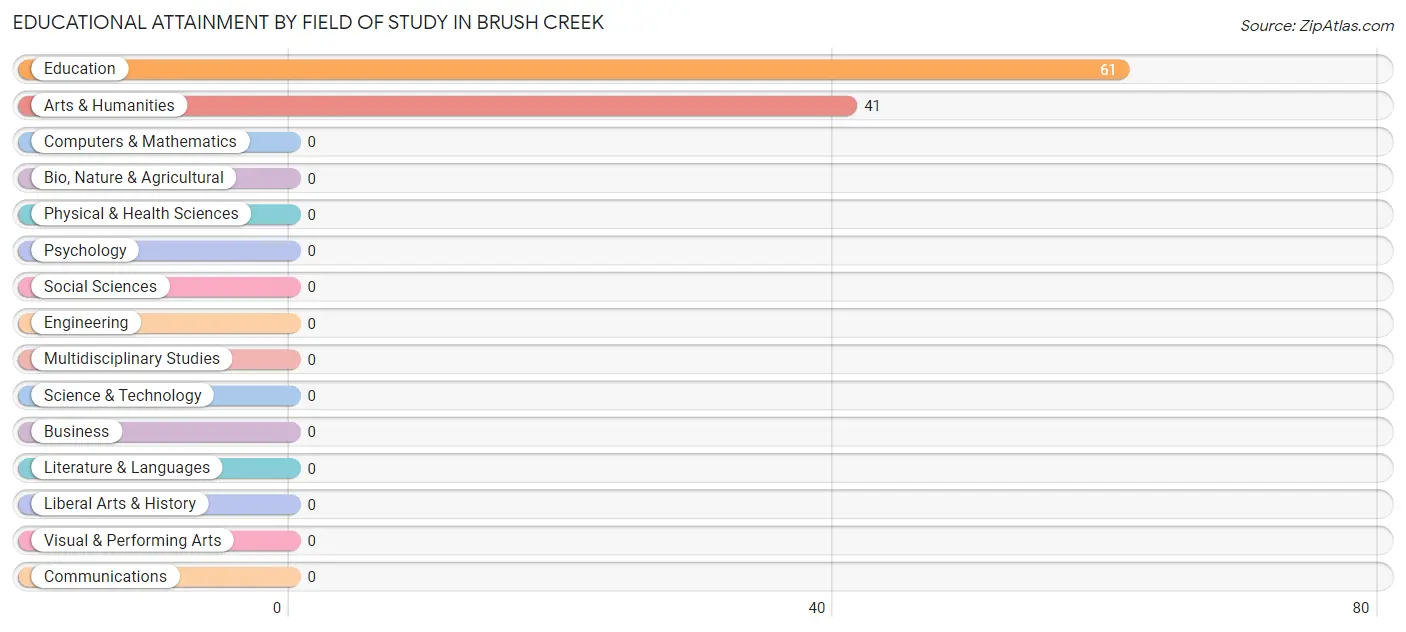
Educational Attainment by Field of Study in Brush Creek
Education (61 | 59.8%), and arts & humanities (41 | 40.2%) are the most common fields of study among 102 individuals in Brush Creek who have obtained a bachelor's degree or higher.
Field of Study
# Graduates
% Graduates
Computers & Mathematics
0
0.0%
Bio, Nature & Agricultural
0
0.0%
Physical & Health Sciences
0
0.0%
Psychology
0
0.0%
Social Sciences
0
0.0%
Engineering
0
0.0%
Multidisciplinary Studies
0
0.0%
Science & Technology
0
0.0%
Business
0
0.0%
Education
61
59.8%
Literature & Languages
0
0.0%
Liberal Arts & History
0
0.0%
Visual & Performing Arts
0
0.0%
Communications
0
0.0%
Arts & Humanities
41
40.2%
Total
102
100.0%
Transportation & Commute in Brush Creek
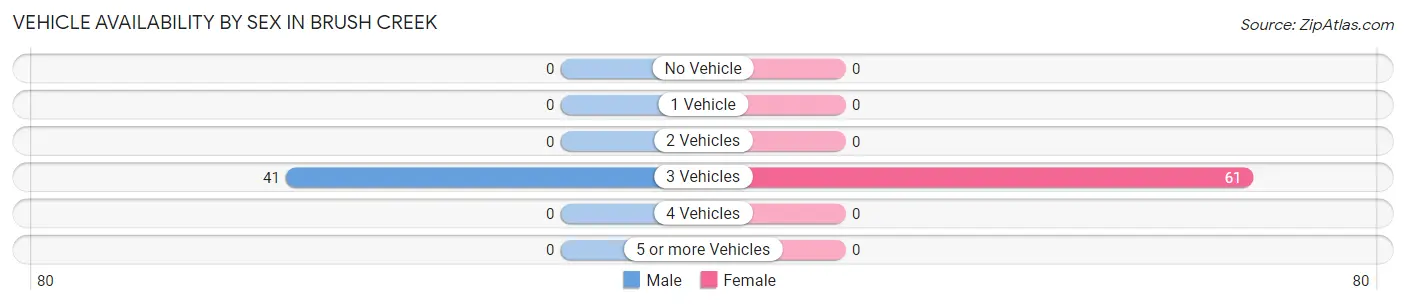
Vehicle Availability by Sex in Brush Creek
The most prevalent vehicle ownership categories in Brush Creek are males with 3 vehicles (41, accounting for 100.0%) and females with 3 vehicles (61, making up 67.2%).
Vehicles Available
Male
Female
No Vehicle
0 (0.0%)
0 (0.0%)
1 Vehicle
0 (0.0%)
0 (0.0%)
2 Vehicles
0 (0.0%)
0 (0.0%)
3 Vehicles
41 (100.0%)
61 (100.0%)
4 Vehicles
0 (0.0%)
0 (0.0%)
5 or more Vehicles
0 (0.0%)
0 (0.0%)
Total
41 (100.0%)
61 (100.0%)
Commute Time in Brush Creek
Commute Time
# Commuters
% Commuters
Less than 5 Minutes
0
0.0%
5 to 9 Minutes
0
0.0%
10 to 14 Minutes
0
0.0%
15 to 19 Minutes
0
0.0%
20 to 24 Minutes
0
0.0%
25 to 29 Minutes
0
0.0%
30 to 34 Minutes
0
0.0%
35 to 39 Minutes
0
0.0%
40 to 44 Minutes
0
0.0%
45 to 59 Minutes
0
0.0%
60 to 89 Minutes
0
0.0%
90 or more Minutes
0
0.0%
Commute Time by Sex in Brush Creek
Commute Time
Male
Female
Less than 5 Minutes
0 (0.0%)
0 (0.0%)
5 to 9 Minutes
0 (0.0%)
0 (0.0%)
10 to 14 Minutes
0 (0.0%)
0 (0.0%)
15 to 19 Minutes
0 (0.0%)
0 (0.0%)
20 to 24 Minutes
0 (0.0%)
0 (0.0%)
25 to 29 Minutes
0 (0.0%)
0 (0.0%)
30 to 34 Minutes
0 (0.0%)
0 (0.0%)
35 to 39 Minutes
0 (0.0%)
0 (0.0%)
40 to 44 Minutes
0 (0.0%)
0 (0.0%)
45 to 59 Minutes
0 (0.0%)
0 (0.0%)
60 to 89 Minutes
0 (0.0%)
0 (0.0%)
90 or more Minutes
0 (0.0%)
0 (0.0%)
Time of Departure to Work by Sex in Brush Creek
Time of Departure
Male
Female
12:00 AM to 4:59 AM
0 (0.0%)
0 (0.0%)
5:00 AM to 5:29 AM
0 (0.0%)
0 (0.0%)
5:30 AM to 5:59 AM
0 (0.0%)
0 (0.0%)
6:00 AM to 6:29 AM
0 (0.0%)
0 (0.0%)
6:30 AM to 6:59 AM
0 (0.0%)
0 (0.0%)
7:00 AM to 7:29 AM
0 (0.0%)
0 (0.0%)
7:30 AM to 7:59 AM
0 (0.0%)
0 (0.0%)
8:00 AM to 8:29 AM
0 (0.0%)
0 (0.0%)
8:30 AM to 8:59 AM
0 (0.0%)
0 (0.0%)
9:00 AM to 9:59 AM
0 (0.0%)
0 (0.0%)
10:00 AM to 10:59 AM
0 (0.0%)
0 (0.0%)
11:00 AM to 11:59 AM
0 (0.0%)
0 (0.0%)
12:00 PM to 3:59 PM
0 (0.0%)
0 (0.0%)
4:00 PM to 11:59 PM
0 (0.0%)
0 (0.0%)
Total
0 (0.0%)
0 (0.0%)
Housing Occupancy in Brush Creek
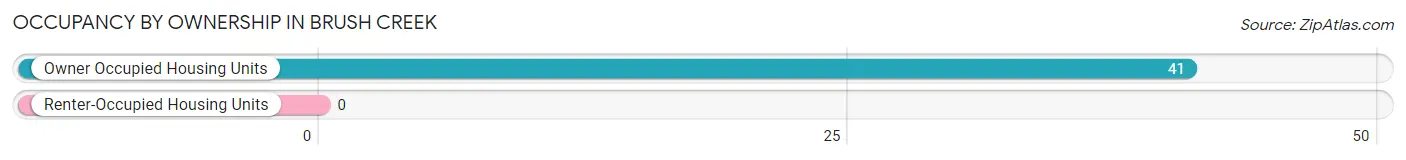
Occupancy by Ownership in Brush Creek
Of the total 41 dwellings in Brush Creek, owner-occupied units account for 41 (100.0%), while renter-occupied units make up 0 (0.0%).
Occupancy
# Housing Units
% Housing Units
Owner Occupied Housing Units
41
100.0%
Renter-Occupied Housing Units
0
0.0%
Total Occupied Housing Units
41
100.0%
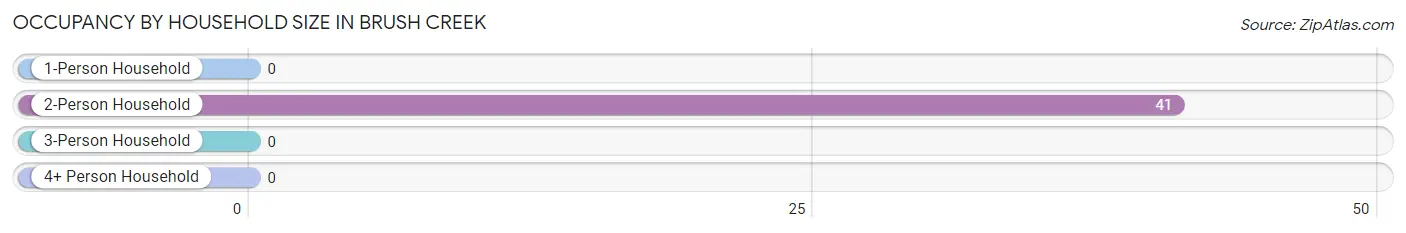
Occupancy by Household Size in Brush Creek
Household Size
# Housing Units
% Housing Units
1-Person Household
0
0.0%
2-Person Household
41
100.0%
3-Person Household
0
0.0%
4+ Person Household
0
0.0%
Total Housing Units
41
100.0%
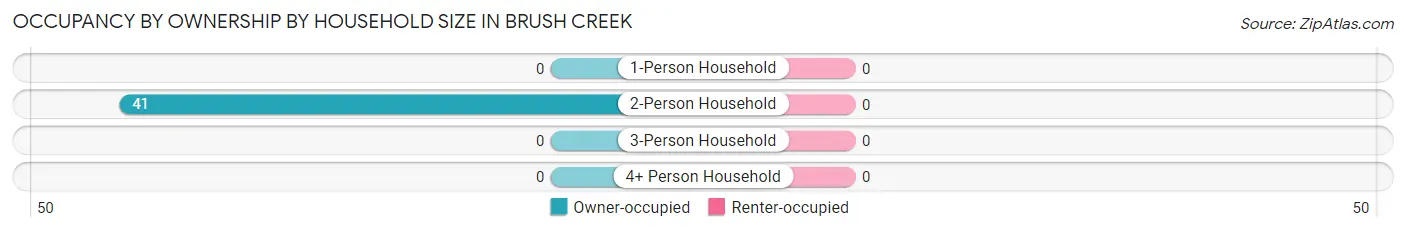
Occupancy by Ownership by Household Size in Brush Creek
Household Size
Owner-occupied
Renter-occupied
1-Person Household
0 (0.0%)
0 (0.0%)
2-Person Household
41 (100.0%)
0 (0.0%)
3-Person Household
0 (0.0%)
0 (0.0%)
4+ Person Household
0 (0.0%)
0 (0.0%)
Total Housing Units
41 (100.0%)
0 (0.0%)
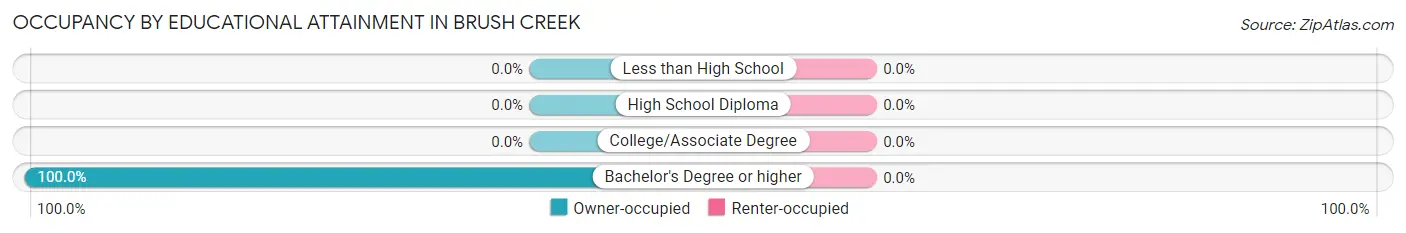
Occupancy by Educational Attainment in Brush Creek
Household Size
Owner-occupied
Renter-occupied
Less than High School
0 (0.0%)
0 (0.0%)
High School Diploma
0 (0.0%)
0 (0.0%)
College/Associate Degree
0 (0.0%)
0 (0.0%)
Bachelor's Degree or higher
41 (100.0%)
0 (0.0%)
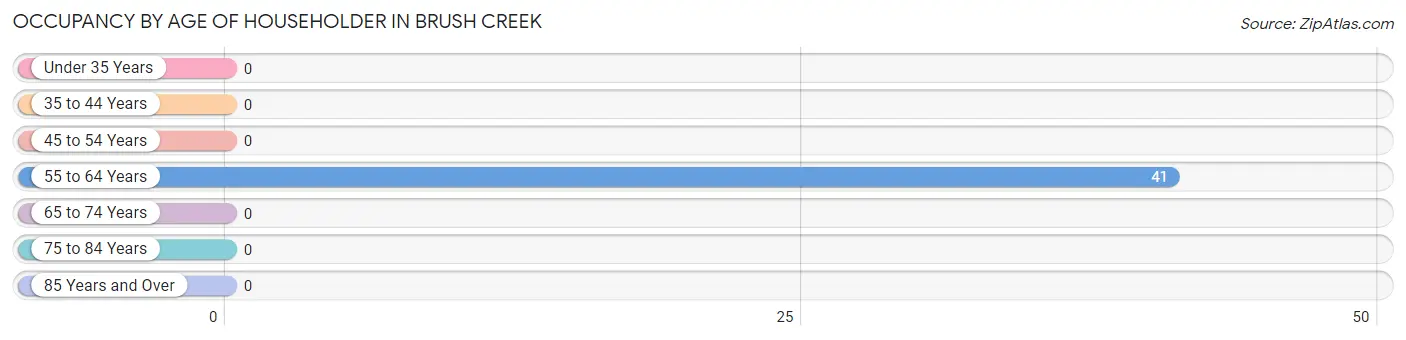
Occupancy by Age of Householder in Brush Creek
Age Bracket
# Households
% Households
Under 35 Years
0
0.0%
35 to 44 Years
0
0.0%
45 to 54 Years
0
0.0%
55 to 64 Years
41
100.0%
65 to 74 Years
0
0.0%
75 to 84 Years
0
0.0%
85 Years and Over
0
0.0%
Total
41
100.0%
Housing Finances in Brush Creek
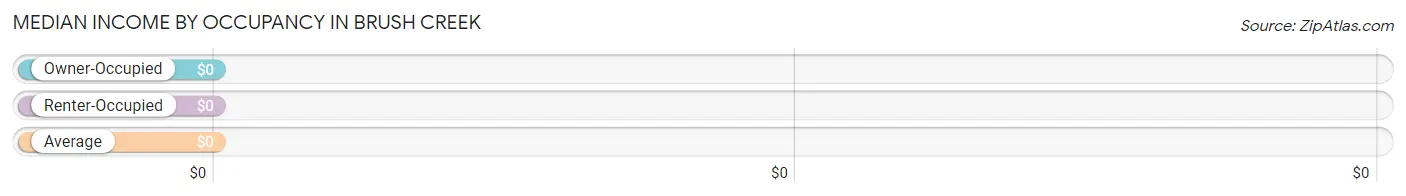
Median Income by Occupancy in Brush Creek
Occupancy Type
# Households
Median Income
Owner-Occupied
41 (100.0%)
$0
Renter-Occupied
0 (0.0%)
$0
Average
41 (100.0%)
$0
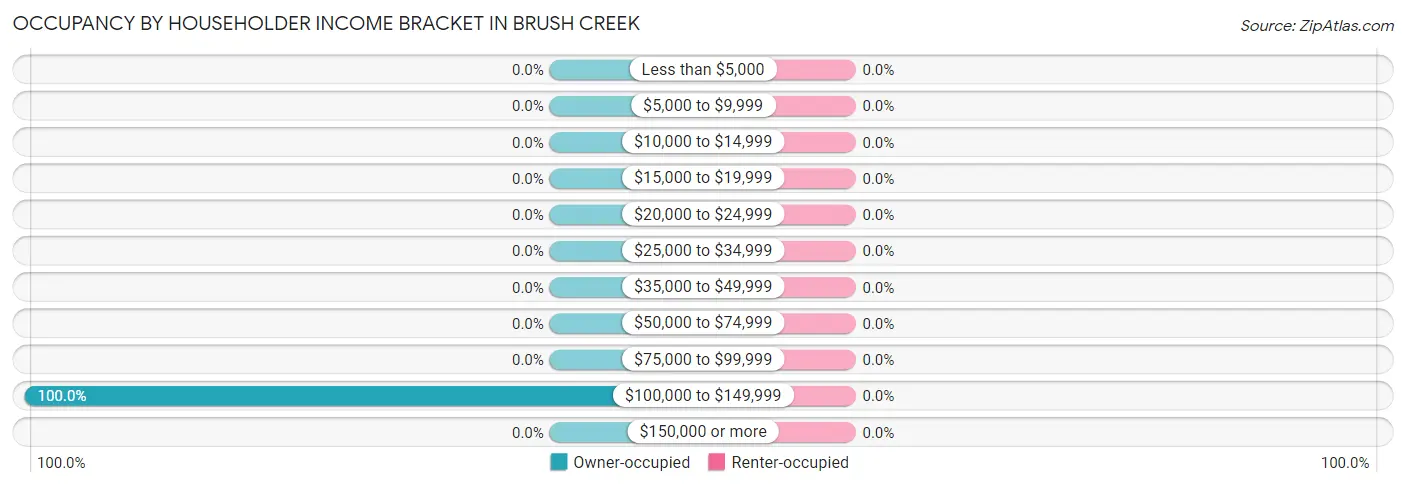
Occupancy by Householder Income Bracket in Brush Creek
Income Bracket
Owner-occupied
Renter-occupied
Less than $5,000
0 (0.0%)
0 (0.0%)
$5,000 to $9,999
0 (0.0%)
0 (0.0%)
$10,000 to $14,999
0 (0.0%)
0 (0.0%)
$15,000 to $19,999
0 (0.0%)
0 (0.0%)
$20,000 to $24,999
0 (0.0%)
0 (0.0%)
$25,000 to $34,999
0 (0.0%)
0 (0.0%)
$35,000 to $49,999
0 (0.0%)
0 (0.0%)
$50,000 to $74,999
0 (0.0%)
0 (0.0%)
$75,000 to $99,999
0 (0.0%)
0 (0.0%)
$100,000 to $149,999
41 (100.0%)
0 (0.0%)
$150,000 or more
0 (0.0%)
0 (0.0%)
Total
41 (100.0%)
0 (0.0%)
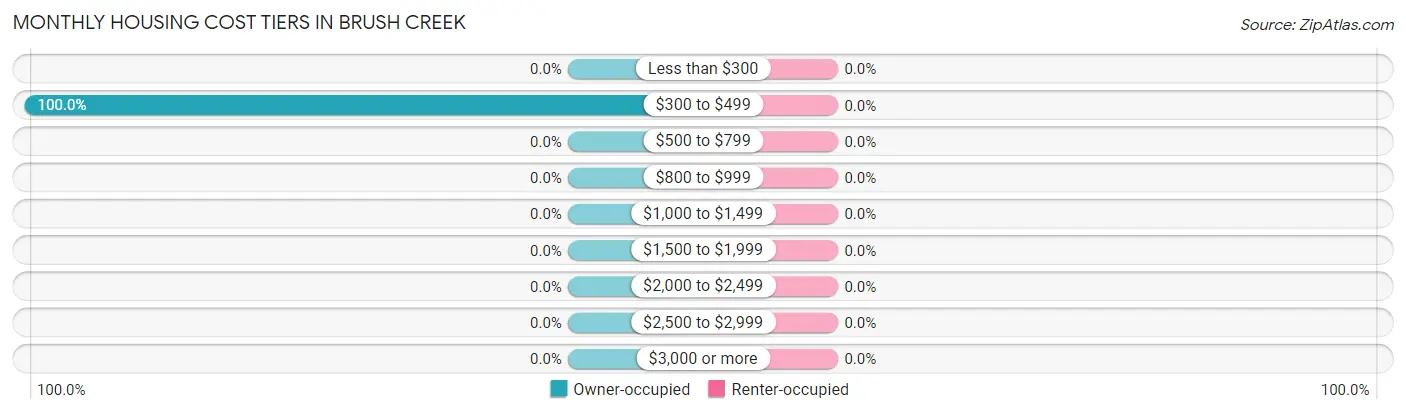
Monthly Housing Cost Tiers in Brush Creek
Monthly Cost
Owner-occupied
Renter-occupied
Less than $300
0 (0.0%)
0 (0.0%)
$300 to $499
41 (100.0%)
0 (0.0%)
$500 to $799
0 (0.0%)
0 (0.0%)
$800 to $999
0 (0.0%)
0 (0.0%)
$1,000 to $1,499
0 (0.0%)
0 (0.0%)
$1,500 to $1,999
0 (0.0%)
0 (0.0%)
$2,000 to $2,499
0 (0.0%)
0 (0.0%)
$2,500 to $2,999
0 (0.0%)
0 (0.0%)
$3,000 or more
0 (0.0%)
0 (0.0%)
Total
41 (100.0%)
0 (0.0%)
Physical Housing Characteristics in Brush Creek
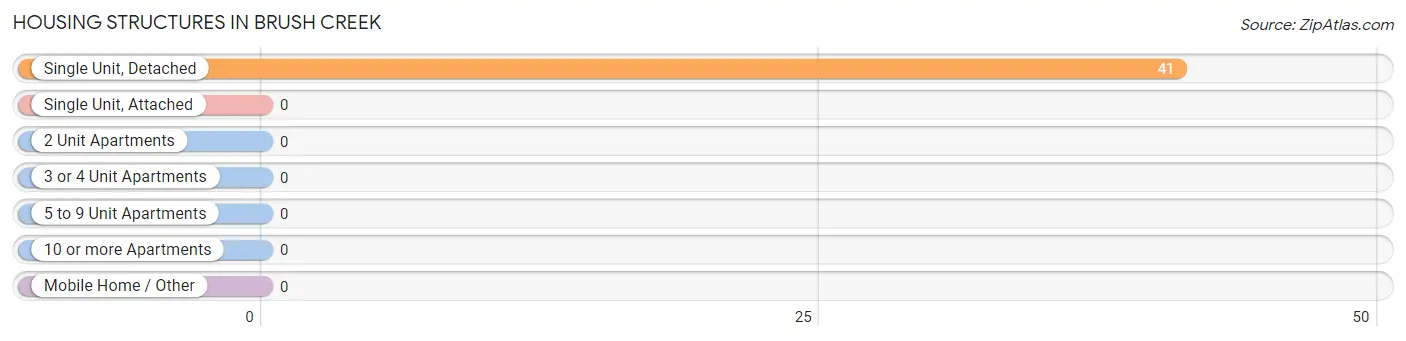
Housing Structures in Brush Creek
Structure Type
# Housing Units
% Housing Units
Single Unit, Detached
41
100.0%
Single Unit, Attached
0
0.0%
2 Unit Apartments
0
0.0%
3 or 4 Unit Apartments
0
0.0%
5 to 9 Unit Apartments
0
0.0%
10 or more Apartments
0
0.0%
Mobile Home / Other
0
0.0%
Total
41
100.0%
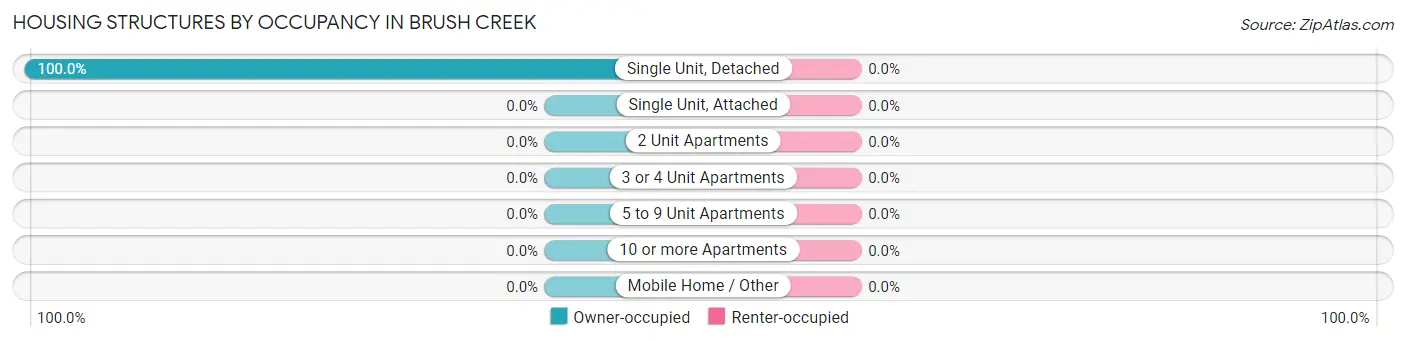
Housing Structures by Occupancy in Brush Creek
Structure Type
Owner-occupied
Renter-occupied
Single Unit, Detached
41 (100.0%)
0 (0.0%)
Single Unit, Attached
0 (0.0%)
0 (0.0%)
2 Unit Apartments
0 (0.0%)
0 (0.0%)
3 or 4 Unit Apartments
0 (0.0%)
0 (0.0%)
5 to 9 Unit Apartments
0 (0.0%)
0 (0.0%)
10 or more Apartments
0 (0.0%)
0 (0.0%)
Mobile Home / Other
0 (0.0%)
0 (0.0%)
Total
41 (100.0%)
0 (0.0%)
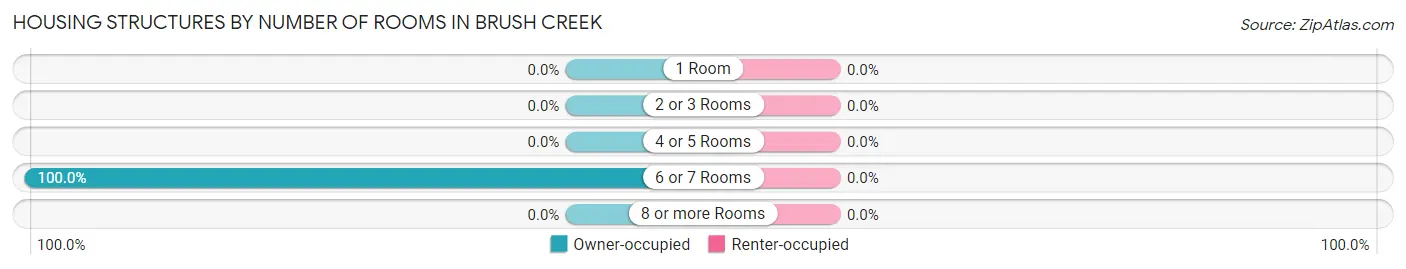
Housing Structures by Number of Rooms in Brush Creek
Number of Rooms
Owner-occupied
Renter-occupied
1 Room
0 (0.0%)
0 (0.0%)
2 or 3 Rooms
0 (0.0%)
0 (0.0%)
4 or 5 Rooms
0 (0.0%)
0 (0.0%)
6 or 7 Rooms
41 (100.0%)
0 (0.0%)
8 or more Rooms
0 (0.0%)
0 (0.0%)
Total
41 (100.0%)
0 (0.0%)
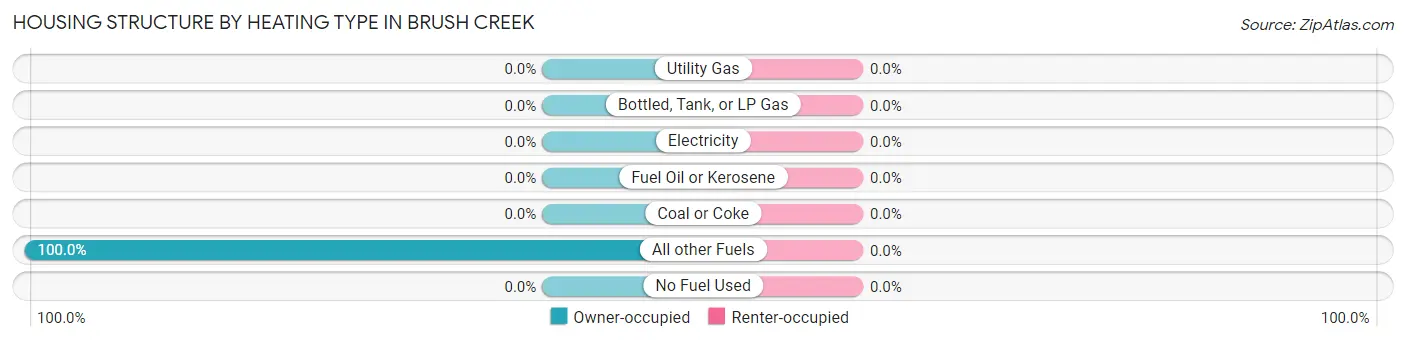
Housing Structure by Heating Type in Brush Creek
Heating Type
Owner-occupied
Renter-occupied
Utility Gas
0 (0.0%)
0 (0.0%)
Bottled, Tank, or LP Gas
0 (0.0%)
0 (0.0%)
Electricity
0 (0.0%)
0 (0.0%)
Fuel Oil or Kerosene
0 (0.0%)
0 (0.0%)
Coal or Coke
0 (0.0%)
0 (0.0%)
All other Fuels
41 (100.0%)
0 (0.0%)
No Fuel Used
0 (0.0%)
0 (0.0%)
Total
41 (100.0%)
0 (0.0%)
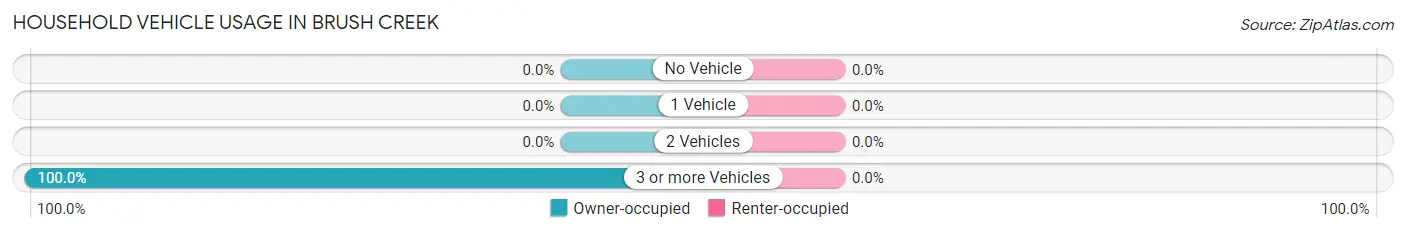
Household Vehicle Usage in Brush Creek
Vehicles per Household
Owner-occupied
Renter-occupied
No Vehicle
0 (0.0%)
0 (0.0%)
1 Vehicle
0 (0.0%)
0 (0.0%)
2 Vehicles
0 (0.0%)
0 (0.0%)
3 or more Vehicles
41 (100.0%)
0 (0.0%)
Total
41 (100.0%)
0 (0.0%)
Real Estate & Mortgages in Brush Creek
Real Estate and Mortgage Overview in Brush Creek
Characteristic
Without Mortgage
With Mortgage
Housing Units
41
0
Median Property Value
-
-
Median Household Income
-
-
Monthly Housing Costs
-
-
Real Estate Taxes
-
-
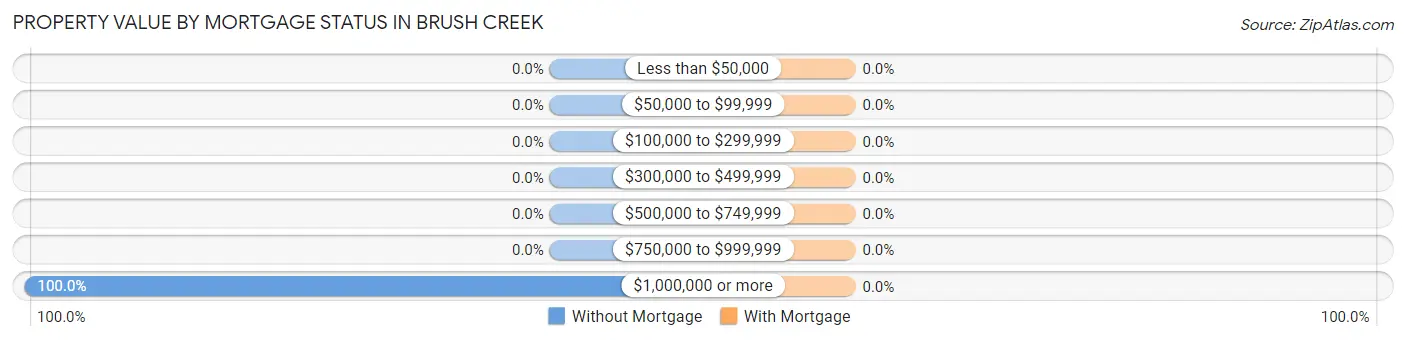
Property Value by Mortgage Status in Brush Creek
Property Value
Without Mortgage
With Mortgage
Less than $50,000
0 (0.0%)
0 (0.0%)
$50,000 to $99,999
0 (0.0%)
0 (0.0%)
$100,000 to $299,999
0 (0.0%)
0 (0.0%)
$300,000 to $499,999
0 (0.0%)
0 (0.0%)
$500,000 to $749,999
0 (0.0%)
0 (0.0%)
$750,000 to $999,999
0 (0.0%)
0 (0.0%)
$1,000,000 or more
41 (100.0%)
0 (0.0%)
Total
41 (100.0%)
0 (0.0%)
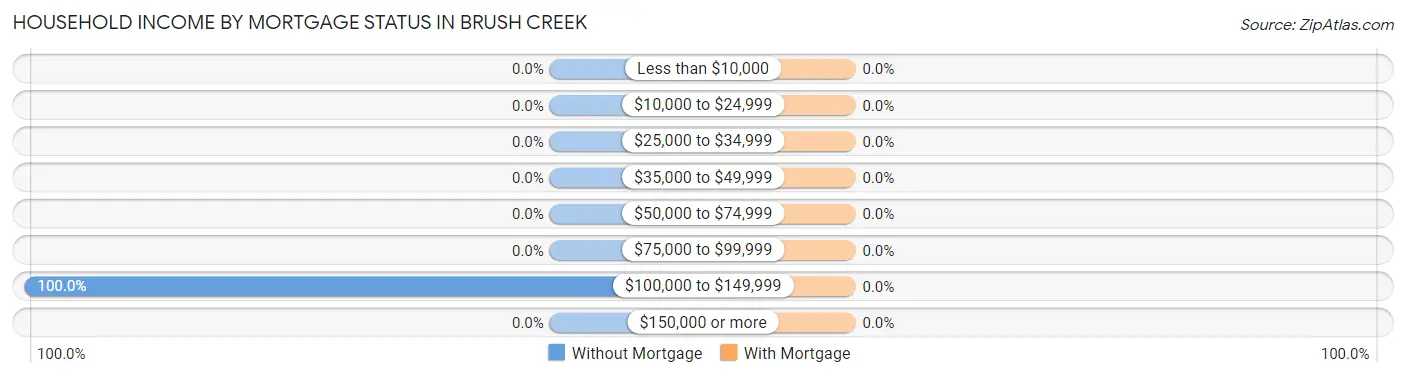
Household Income by Mortgage Status in Brush Creek
Household Income
Without Mortgage
With Mortgage
Less than $10,000
0 (0.0%)
0 (0.0%)
$10,000 to $24,999
0 (0.0%)
0 (0.0%)
$25,000 to $34,999
0 (0.0%)
0 (0.0%)
$35,000 to $49,999
0 (0.0%)
0 (0.0%)
$50,000 to $74,999
0 (0.0%)
0 (0.0%)
$75,000 to $99,999
0 (0.0%)
0 (0.0%)
$100,000 to $149,999
41 (100.0%)
0 (0.0%)
$150,000 or more
0 (0.0%)
0 (0.0%)
Total
41 (100.0%)
0 (0.0%)
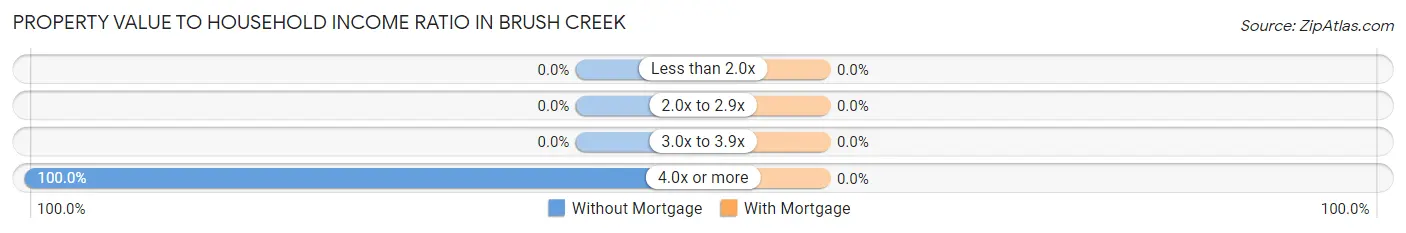
Property Value to Household Income Ratio in Brush Creek
Value-to-Income Ratio
Without Mortgage
With Mortgage
Less than 2.0x
0 (0.0%)
0 (0.0%)
2.0x to 2.9x
0 (0.0%)
0 (0.0%)
3.0x to 3.9x
0 (0.0%)
0 (0.0%)
4.0x or more
41 (100.0%)
0 (0.0%)
Total
41 (100.0%)
0 (0.0%)
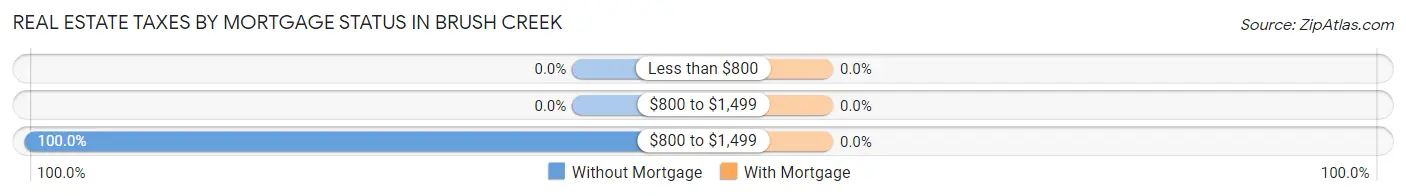
Real Estate Taxes by Mortgage Status in Brush Creek
Property Taxes
Without Mortgage
With Mortgage
Less than $800
0 (0.0%)
0 (0.0%)
$800 to $1,499
0 (0.0%)
0 (0.0%)
$800 to $1,499
41 (100.0%)
0 (0.0%)
Total
41 (100.0%)
0 (0.0%)
Health & Disability in Brush Creek
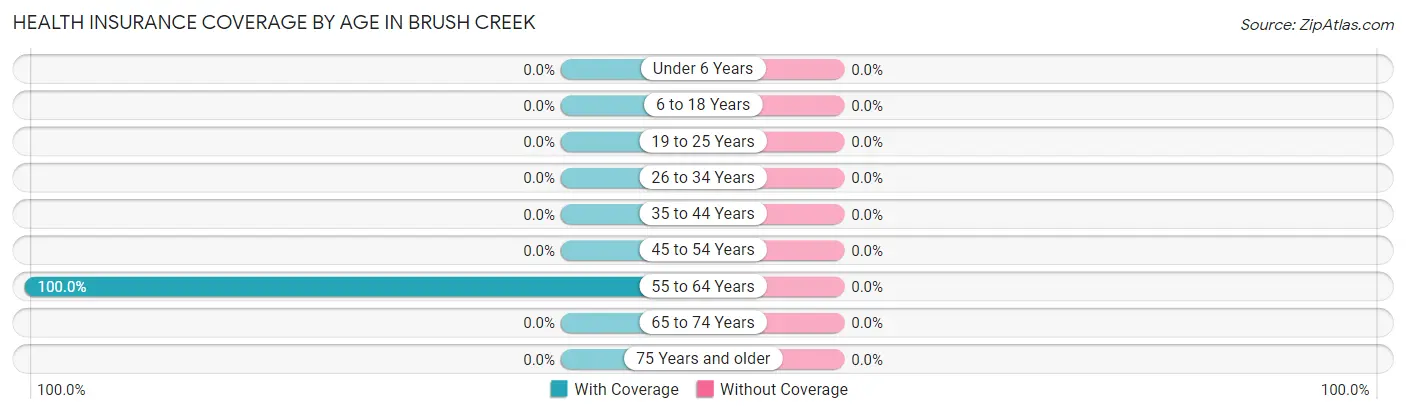
Health Insurance Coverage by Age in Brush Creek
Age Bracket
With Coverage
Without Coverage
Under 6 Years
0 (0.0%)
0 (0.0%)
6 to 18 Years
0 (0.0%)
0 (0.0%)
19 to 25 Years
0 (0.0%)
0 (0.0%)
26 to 34 Years
0 (0.0%)
0 (0.0%)
35 to 44 Years
0 (0.0%)
0 (0.0%)
45 to 54 Years
0 (0.0%)
0 (0.0%)
55 to 64 Years
102 (100.0%)
0 (0.0%)
65 to 74 Years
0 (0.0%)
0 (0.0%)
75 Years and older
0 (0.0%)
0 (0.0%)
Total
102 (100.0%)
0 (0.0%)
Health Insurance Coverage by Citizenship Status in Brush Creek
Citizenship Status
With Coverage
Without Coverage
Native Born
0 (0.0%)
0 (0.0%)
Foreign Born, Citizen
0 (0.0%)
0 (0.0%)
Foreign Born, not a Citizen
0 (0.0%)
0 (0.0%)
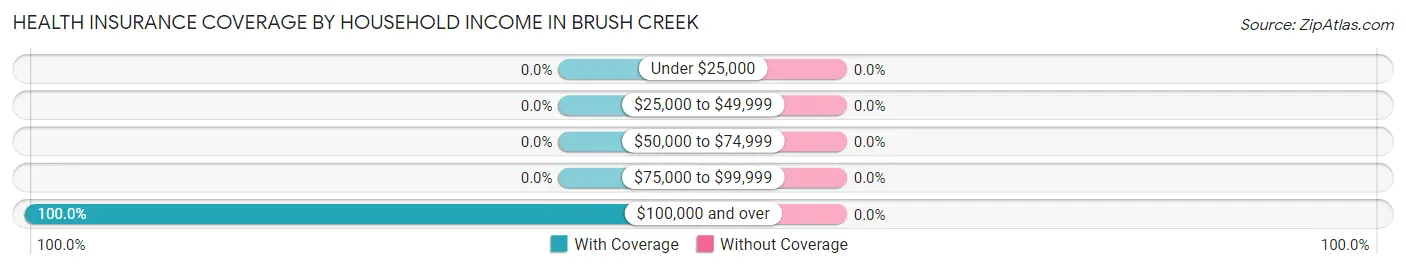
Health Insurance Coverage by Household Income in Brush Creek
Household Income
With Coverage
Without Coverage
Under $25,000
0 (0.0%)
0 (0.0%)
$25,000 to $49,999
0 (0.0%)
0 (0.0%)
$50,000 to $74,999
0 (0.0%)
0 (0.0%)
$75,000 to $99,999
0 (0.0%)
0 (0.0%)
$100,000 and over
102 (100.0%)
0 (0.0%)
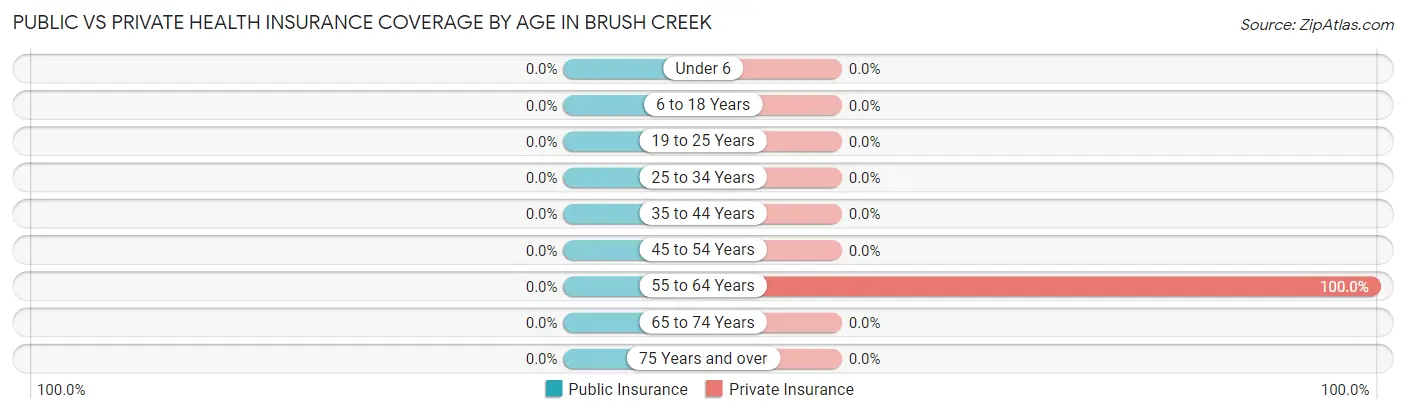
Public vs Private Health Insurance Coverage by Age in Brush Creek
Age Bracket
Public Insurance
Private Insurance
Under 6
0 (0.0%)
0 (0.0%)
6 to 18 Years
0 (0.0%)
0 (0.0%)
19 to 25 Years
0 (0.0%)
0 (0.0%)
25 to 34 Years
0 (0.0%)
0 (0.0%)
35 to 44 Years
0 (0.0%)
0 (0.0%)
45 to 54 Years
0 (0.0%)
0 (0.0%)
55 to 64 Years
0 (0.0%)
102 (100.0%)
65 to 74 Years
0 (0.0%)
0 (0.0%)
75 Years and over
0 (0.0%)
0 (0.0%)
Total
0 (0.0%)
102 (100.0%)
Disability Status by Sex by Age in Brush Creek
Age Bracket
Male
Female
Under 5 Years
0 (0.0%)
0 (0.0%)
5 to 17 Years
0 (0.0%)
0 (0.0%)
18 to 34 Years
0 (0.0%)
0 (0.0%)
35 to 64 Years
0 (0.0%)
0 (0.0%)
65 to 74 Years
0 (0.0%)
0 (0.0%)
75 Years and over
0 (0.0%)
0 (0.0%)
Disability Class by Sex by Age in Brush Creek
Disability Class: Hearing Difficulty
Age Bracket
Male
Female
Under 5 Years
0 (0.0%)
0 (0.0%)
5 to 17 Years
0 (0.0%)
0 (0.0%)
18 to 34 Years
0 (0.0%)
0 (0.0%)
35 to 64 Years
0 (0.0%)
0 (0.0%)
65 to 74 Years
0 (0.0%)
0 (0.0%)
75 Years and over
0 (0.0%)
0 (0.0%)
Disability Class: Vision Difficulty
Age Bracket
Male
Female
Under 5 Years
0 (0.0%)
0 (0.0%)
5 to 17 Years
0 (0.0%)
0 (0.0%)
18 to 34 Years
0 (0.0%)
0 (0.0%)
35 to 64 Years
0 (0.0%)
0 (0.0%)
65 to 74 Years
0 (0.0%)
0 (0.0%)
75 Years and over
0 (0.0%)
0 (0.0%)
Disability Class: Cognitive Difficulty
Age Bracket
Male
Female
5 to 17 Years
0 (0.0%)
0 (0.0%)
18 to 34 Years
0 (0.0%)
0 (0.0%)
35 to 64 Years
0 (0.0%)
0 (0.0%)
65 to 74 Years
0 (0.0%)
0 (0.0%)
75 Years and over
0 (0.0%)
0 (0.0%)
Disability Class: Ambulatory Difficulty
Age Bracket
Male
Female
5 to 17 Years
0 (0.0%)
0 (0.0%)
18 to 34 Years
0 (0.0%)
0 (0.0%)
35 to 64 Years
0 (0.0%)
0 (0.0%)
65 to 74 Years
0 (0.0%)
0 (0.0%)
75 Years and over
0 (0.0%)
0 (0.0%)
Disability Class: Self-Care Difficulty
Age Bracket
Male
Female
5 to 17 Years
0 (0.0%)
0 (0.0%)
18 to 34 Years
0 (0.0%)
0 (0.0%)
35 to 64 Years
0 (0.0%)
0 (0.0%)
65 to 74 Years
0 (0.0%)
0 (0.0%)
75 Years and over
0 (0.0%)
0 (0.0%)
Technology Access in Brush Creek
Computing Device Access in Brush Creek
Device Type
# Households
% Households
Desktop or Laptop
41
100.0%
Smartphone
41
100.0%
Tablet
41
100.0%
No Computing Device
0
0.0%
Total
41
100.0%
Internet Access in Brush Creek
Internet Type
# Households
% Households
Dial-Up Internet
0
0.0%
Broadband Home
41
100.0%
Cellular Data Only
0
0.0%
Satellite Internet
0
0.0%
No Internet
0
0.0%
Total
41
100.0%
Brush Creek Summary
Brush Creek is a small unincorporated community located in the southeastern corner of Oklahoma, in the United States. It is situated in the foothills of the Ouachita Mountains, in the foothills of the Kiamichi Mountains. The community is located in Pushmataha County, and is approximately 10 miles south of the county seat of Antlers.
History
The area that is now Brush Creek was first settled in the late 1800s by a group of settlers from Arkansas. The settlers were attracted to the area by the abundance of timber and the fertile soil. The community was originally known as Brushy Creek, but the name was later changed to Brush Creek.
The first post office in the area was established in 1891, and the community was officially incorporated in 1895. The town was named after the nearby creek, which was named for the abundance of brush along its banks.
The town grew slowly, but steadily, and by the early 1900s, it had become a thriving community. The town had a general store, a blacksmith shop, a school, and several churches. The town also had a cotton gin, a grist mill, and a sawmill.
In the early 1900s, the town was also home to a number of businesses, including a hotel, a bank, a drug store, and a livery stable. The town also had a newspaper, the Brush Creek News, which was published from 1906 to 1915.
Geography
Brush Creek is located in the southeastern corner of Oklahoma, in the foothills of the Ouachita Mountains. The town is situated in Pushmataha County, and is approximately 10 miles south of the county seat of Antlers.
The town is located at the intersection of State Highway 3 and County Road E-14. The town is surrounded by rolling hills and forests, and is located near the Kiamichi River.
Economy
The economy of Brush Creek is largely based on agriculture and forestry. The town is home to a number of farms, and the surrounding area is home to a number of timber companies.
The town also has a number of small businesses, including a general store, a hardware store, and a restaurant. The town also has a post office, a bank, and a library.
Demographics
As of the 2010 census, the population of Brush Creek was 545. The town has a total area of 0.7 square miles, all of which is land. The population density is 790.7 people per square mile.
The racial makeup of the town is 97.3% White, 0.2% African American, 0.2% Native American, 0.2% Asian, 0.2% from other races, and 1.9% from two or more races. Hispanic or Latino of any race were 1.3% of the population.
The median income for a household in the town was $30,000, and the median income for a family was $35,000. The per capita income for the town was $14,000. About 17.3% of the population was below the poverty line.
Common Questions
What is the Total Population of Brush Creek?
Total Population of Brush Creek is 102.
What is the Total Male Population of Brush Creek?
Total Male Population of Brush Creek is 41.
What is the Total Female Population of Brush Creek?
Total Female Population of Brush Creek is 61.
What is the Ratio of Males per 100 Females in Brush Creek?
There are 67.21 Males per 100 Females in Brush Creek.
What is the Ratio of Females per 100 Males in Brush Creek?
There are 148.78 Females per 100 Males in Brush Creek.
What is the Average Family Size in Brush Creek
Average Family Size in Brush Creek is 2.5 People.
What is the Average Household Size in Brush Creek
Average Household Size in Brush Creek is 2.5 People.
How Large is the Labor Force in Brush Creek?
There are 102 People in the Labor Forcein in Brush Creek.
What is the Percentage of People in the Labor Force in Brush Creek?
100.0% of People are in the Labor Force in Brush Creek.
Report Title
Report Link
HTML Copy & Paste Link
Social Media
Copy and paste the folowing code into any webpage where you would like this interactive chart to display