Gerty, OK Map & Demographics
Gerty Map
Gerty Overview
$25,486
PER CAPITA INCOME
0.37
INEQUALITY / GINI INDEX
81
TOTAL POPULATION
46
MALE POPULATION
35
FEMALE POPULATION
131.43
MALES / 100 FEMALES
76.09
FEMALES / 100 MALES
53.2
MEDIAN AGE
2.7
AVG FAMILY SIZE
2.9
AVG HOUSEHOLD SIZE
27
LABOR FORCE [ PEOPLE ]
35.1%
PERCENT IN LABOR FORCE
3.7%
UNEMPLOYMENT RATE
Income in Gerty
Income Overview in Gerty
| Characteristic | Number | Measure |
| Per Capita Income | 81 | $25,486 |
| Median Family Income | 23 | $0 |
| Mean Family Income | 23 | $79,222 |
| Median Household Income | 28 | $0 |
| Mean Household Income | 28 | $71,414 |
| Income Deficit | 23 | $0 |
| Wage / Income Gap (%) | 81 | 0.00% |
| Wage / Income Gap ($) | 81 | 100.00¢ per $1 |
| Gini / Inequality Index | 81 | 0.37 |
Earnings by Sex in Gerty
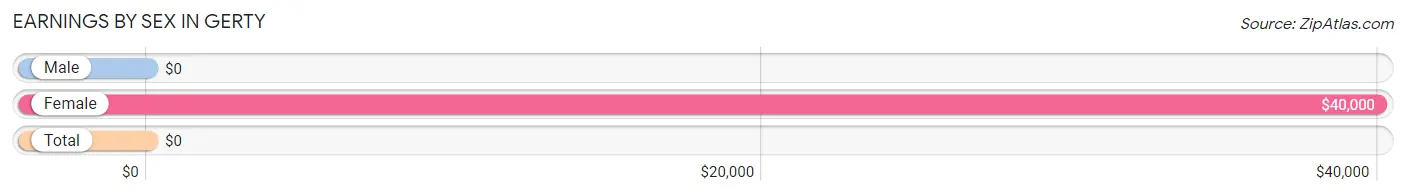
| Sex | Number | Average Earnings |
| Male | 19 (61.3%) | $0 |
| Female | 12 (38.7%) | $40,000 |
| Total | 31 (100.0%) | $0 |
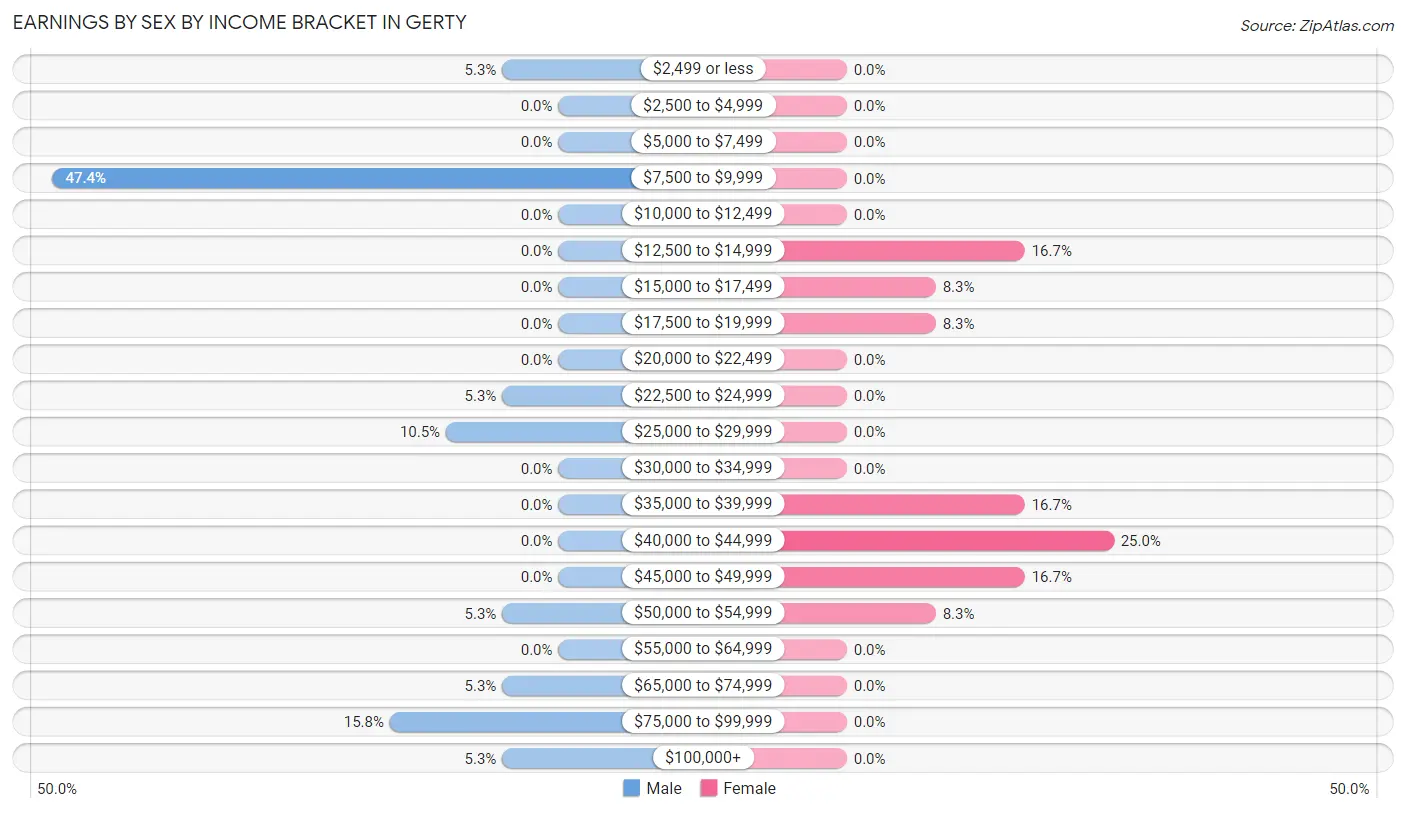
Earnings by Sex by Income Bracket in Gerty
The most common earnings brackets in Gerty are $7,500 to $9,999 for men (9 | 47.4%) and $40,000 to $44,999 for women (3 | 25.0%).
| Income | Male | Female |
| $2,499 or less | 1 (5.3%) | 0 (0.0%) |
| $2,500 to $4,999 | 0 (0.0%) | 0 (0.0%) |
| $5,000 to $7,499 | 0 (0.0%) | 0 (0.0%) |
| $7,500 to $9,999 | 9 (47.4%) | 0 (0.0%) |
| $10,000 to $12,499 | 0 (0.0%) | 0 (0.0%) |
| $12,500 to $14,999 | 0 (0.0%) | 2 (16.7%) |
| $15,000 to $17,499 | 0 (0.0%) | 1 (8.3%) |
| $17,500 to $19,999 | 0 (0.0%) | 1 (8.3%) |
| $20,000 to $22,499 | 0 (0.0%) | 0 (0.0%) |
| $22,500 to $24,999 | 1 (5.3%) | 0 (0.0%) |
| $25,000 to $29,999 | 2 (10.5%) | 0 (0.0%) |
| $30,000 to $34,999 | 0 (0.0%) | 0 (0.0%) |
| $35,000 to $39,999 | 0 (0.0%) | 2 (16.7%) |
| $40,000 to $44,999 | 0 (0.0%) | 3 (25.0%) |
| $45,000 to $49,999 | 0 (0.0%) | 2 (16.7%) |
| $50,000 to $54,999 | 1 (5.3%) | 1 (8.3%) |
| $55,000 to $64,999 | 0 (0.0%) | 0 (0.0%) |
| $65,000 to $74,999 | 1 (5.3%) | 0 (0.0%) |
| $75,000 to $99,999 | 3 (15.8%) | 0 (0.0%) |
| $100,000+ | 1 (5.3%) | 0 (0.0%) |
| Total | 19 (100.0%) | 12 (100.0%) |
Earnings by Sex by Educational Attainment in Gerty
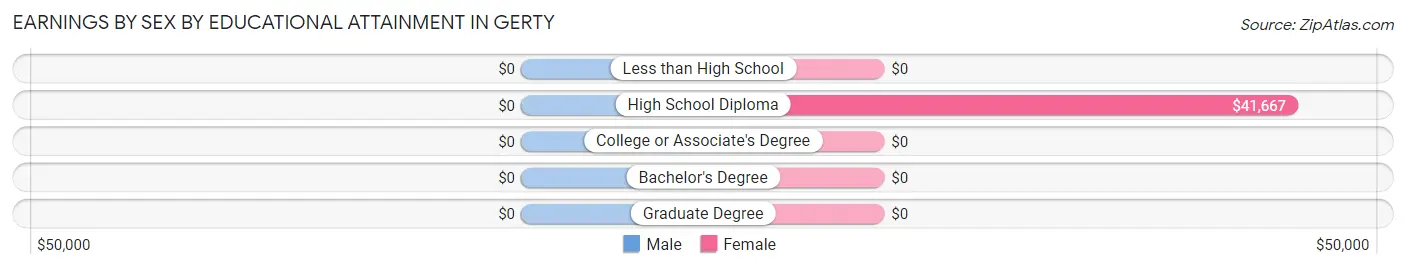
| Educational Attainment | Male Income | Female Income |
| Less than High School | - | - |
| High School Diploma | - | - |
| College or Associate's Degree | - | - |
| Bachelor's Degree | - | - |
| Graduate Degree | - | - |
| Total | - | - |
Family Income in Gerty
Family Income Brackets in Gerty
According to the Gerty family income data, there are 10 families falling into the $100,000 to $149,999 income range, which is the most common income bracket and makes up 43.5% of all families.
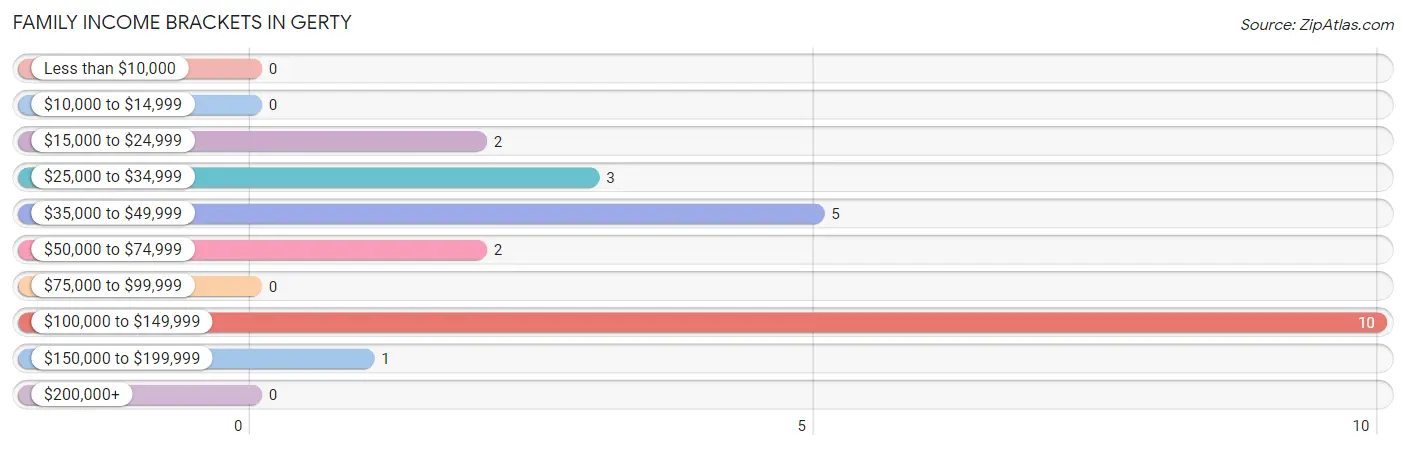
| Income Bracket | # Families | % Families |
| Less than $10,000 | 0 | 0.0% |
| $10,000 to $14,999 | 0 | 0.0% |
| $15,000 to $24,999 | 2 | 8.7% |
| $25,000 to $34,999 | 3 | 13.0% |
| $35,000 to $49,999 | 5 | 21.7% |
| $50,000 to $74,999 | 2 | 8.7% |
| $75,000 to $99,999 | 0 | 0.0% |
| $100,000 to $149,999 | 10 | 43.5% |
| $150,000 to $199,999 | 1 | 4.3% |
| $200,000+ | 0 | 0.0% |
Family Income by Famaliy Size in Gerty
2-person families (12 | 52.2%) account for the highest median family income in Gerty with $115,625 per family, while 2-person families (12 | 52.2%) have the highest median income of $57,812 per family member.
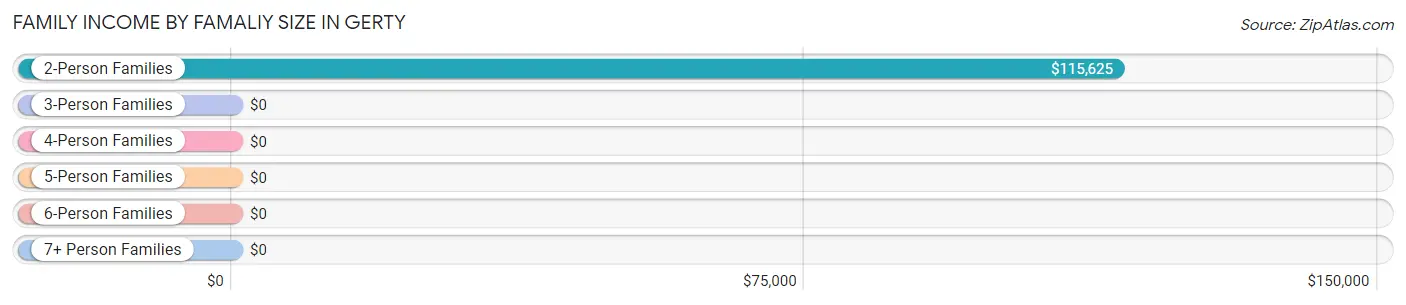
| Income Bracket | # Families | Median Income |
| 2-Person Families | 12 (52.2%) | $115,625 |
| 3-Person Families | 9 (39.1%) | $0 |
| 4-Person Families | 2 (8.7%) | $0 |
| 5-Person Families | 0 (0.0%) | $0 |
| 6-Person Families | 0 (0.0%) | $0 |
| 7+ Person Families | 0 (0.0%) | $0 |
| Total | 23 (100.0%) | $0 |
Family Income by Number of Earners in Gerty
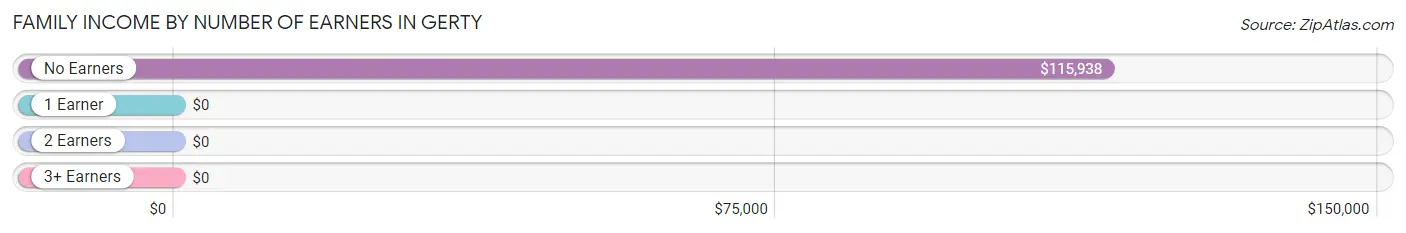
| Number of Earners | # Families | Median Income |
| No Earners | 9 (39.1%) | $115,938 |
| 1 Earner | 5 (21.7%) | $0 |
| 2 Earners | 7 (30.4%) | $0 |
| 3+ Earners | 2 (8.7%) | $0 |
| Total | 23 (100.0%) | $0 |
Household Income in Gerty
Household Income Brackets in Gerty
With 10 households falling in the category, the $100,000 to $149,999 income range is the most frequent in Gerty, accounting for 35.7% of all households.
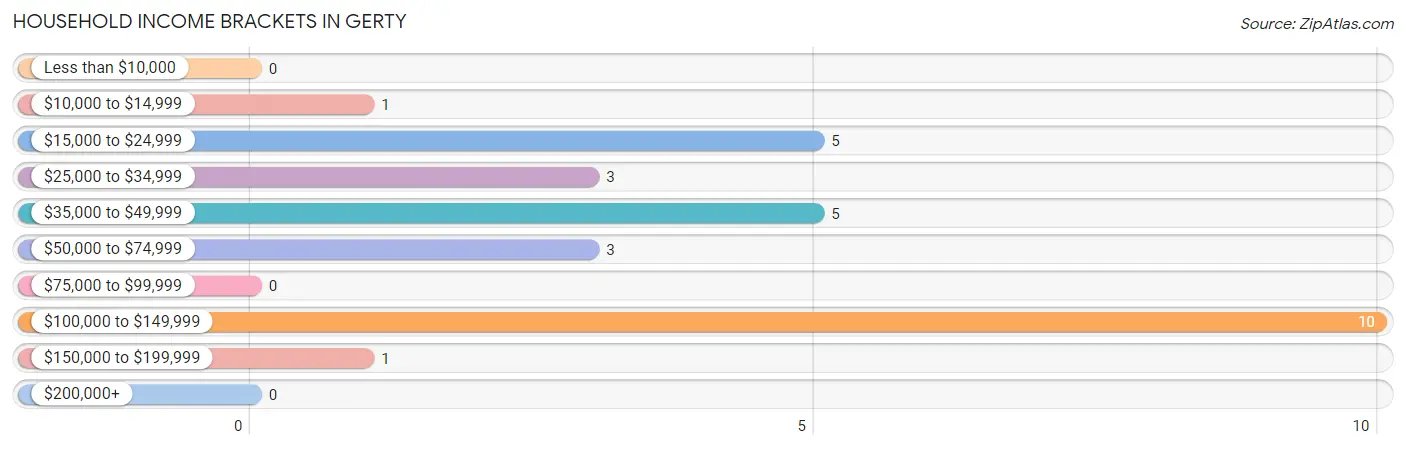
| Income Bracket | # Households | % Households |
| Less than $10,000 | 0 | 0.0% |
| $10,000 to $14,999 | 1 | 3.6% |
| $15,000 to $24,999 | 5 | 17.9% |
| $25,000 to $34,999 | 3 | 10.7% |
| $35,000 to $49,999 | 5 | 17.9% |
| $50,000 to $74,999 | 3 | 10.7% |
| $75,000 to $99,999 | 0 | 0.0% |
| $100,000 to $149,999 | 10 | 35.7% |
| $150,000 to $199,999 | 1 | 3.6% |
| $200,000+ | 0 | 0.0% |
Household Income by Householder Age in Gerty
| Income Bracket | # Households | Median Income |
| 15 to 24 Years | 0 (0.0%) | $0 |
| 25 to 44 Years | 3 (10.7%) | $0 |
| 45 to 64 Years | 13 (46.4%) | $0 |
| 65+ Years | 12 (42.9%) | $0 |
| Total | 28 (100.0%) | $0 |
Poverty in Gerty
Income Below Poverty by Sex and Age in Gerty
With 17.4% poverty level for males and 17.1% for females among the residents of Gerty, 75 year old and over males and 75 year old and over females are the most vulnerable to poverty, with 8 males (61.5%) and 6 females (75.0%) in their respective age groups living below the poverty level.
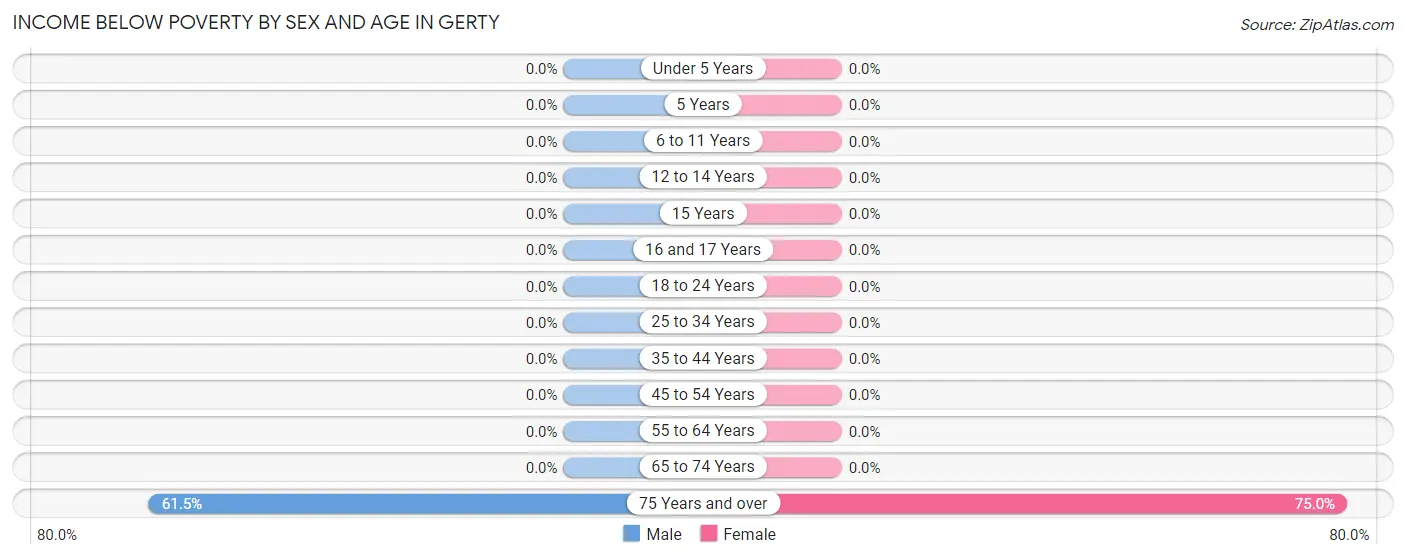
| Age Bracket | Male | Female |
| Under 5 Years | 0 (0.0%) | 0 (0.0%) |
| 5 Years | 0 (0.0%) | 0 (0.0%) |
| 6 to 11 Years | 0 (0.0%) | 0 (0.0%) |
| 12 to 14 Years | 0 (0.0%) | 0 (0.0%) |
| 15 Years | 0 (0.0%) | 0 (0.0%) |
| 16 and 17 Years | 0 (0.0%) | 0 (0.0%) |
| 18 to 24 Years | 0 (0.0%) | 0 (0.0%) |
| 25 to 34 Years | 0 (0.0%) | 0 (0.0%) |
| 35 to 44 Years | 0 (0.0%) | 0 (0.0%) |
| 45 to 54 Years | 0 (0.0%) | 0 (0.0%) |
| 55 to 64 Years | 0 (0.0%) | 0 (0.0%) |
| 65 to 74 Years | 0 (0.0%) | 0 (0.0%) |
| 75 Years and over | 8 (61.5%) | 6 (75.0%) |
| Total | 8 (17.4%) | 6 (17.1%) |
Income Above Poverty by Sex and Age in Gerty
According to the poverty statistics in Gerty, males aged 5 years and females aged under 5 years are the age groups that are most secure financially, with 100.0% of males and 100.0% of females in these age groups living above the poverty line.
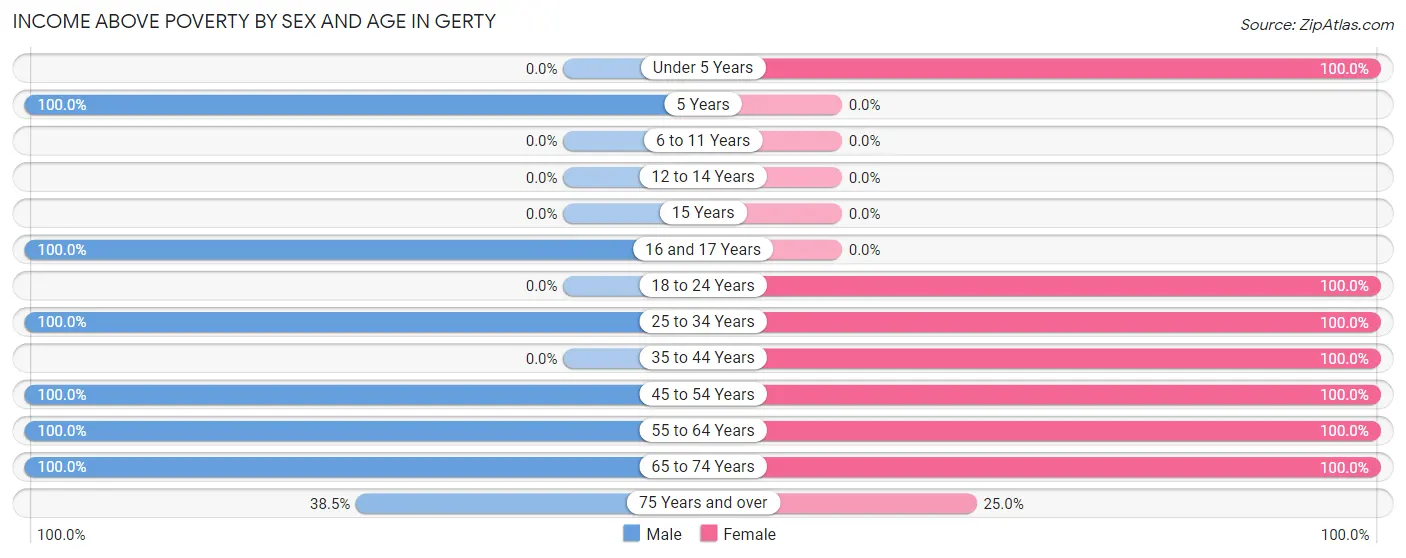
| Age Bracket | Male | Female |
| Under 5 Years | 0 (0.0%) | 2 (100.0%) |
| 5 Years | 2 (100.0%) | 0 (0.0%) |
| 6 to 11 Years | 0 (0.0%) | 0 (0.0%) |
| 12 to 14 Years | 0 (0.0%) | 0 (0.0%) |
| 15 Years | 0 (0.0%) | 0 (0.0%) |
| 16 and 17 Years | 3 (100.0%) | 0 (0.0%) |
| 18 to 24 Years | 0 (0.0%) | 2 (100.0%) |
| 25 to 34 Years | 15 (100.0%) | 6 (100.0%) |
| 35 to 44 Years | 0 (0.0%) | 5 (100.0%) |
| 45 to 54 Years | 5 (100.0%) | 3 (100.0%) |
| 55 to 64 Years | 4 (100.0%) | 4 (100.0%) |
| 65 to 74 Years | 4 (100.0%) | 5 (100.0%) |
| 75 Years and over | 5 (38.5%) | 2 (25.0%) |
| Total | 38 (82.6%) | 29 (82.9%) |
Income Below Poverty Among Married-Couple Families in Gerty
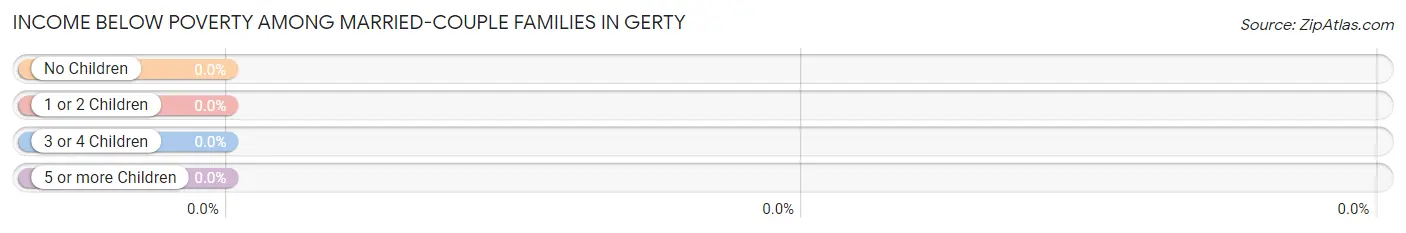
| Children | Above Poverty | Below Poverty |
| No Children | 13 (100.0%) | 0 (0.0%) |
| 1 or 2 Children | 5 (100.0%) | 0 (0.0%) |
| 3 or 4 Children | 0 (0.0%) | 0 (0.0%) |
| 5 or more Children | 0 (0.0%) | 0 (0.0%) |
| Total | 18 (100.0%) | 0 (0.0%) |
Income Below Poverty Among Single-Parent Households in Gerty
| Children | Single Father | Single Mother |
| No Children | 0 (0.0%) | 0 (0.0%) |
| 1 or 2 Children | 0 (0.0%) | 0 (0.0%) |
| 3 or 4 Children | 0 (0.0%) | 0 (0.0%) |
| 5 or more Children | 0 (0.0%) | 0 (0.0%) |
| Total | 0 (0.0%) | 0 (0.0%) |
Income Below Poverty Among Married-Couple vs Single-Parent Households in Gerty
| Children | Married-Couple Families | Single-Parent Households |
| No Children | 0 (0.0%) | 0 (0.0%) |
| 1 or 2 Children | 0 (0.0%) | 0 (0.0%) |
| 3 or 4 Children | 0 (0.0%) | 0 (0.0%) |
| 5 or more Children | 0 (0.0%) | 0 (0.0%) |
| Total | 0 (0.0%) | 0 (0.0%) |
Race in Gerty
The most populous races in Gerty are White / Caucasian (73 | 90.1%), Hispanic or Latino (9 | 11.1%), and Native / Alaskan (6 | 7.4%).
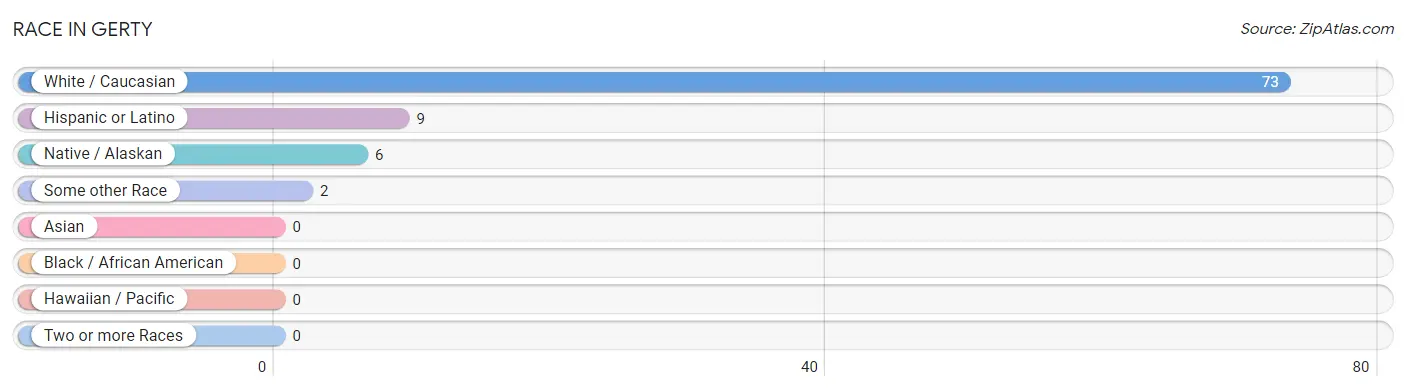
| Race | # Population | % Population |
| Asian | 0 | 0.0% |
| Black / African American | 0 | 0.0% |
| Hawaiian / Pacific | 0 | 0.0% |
| Hispanic or Latino | 9 | 11.1% |
| Native / Alaskan | 6 | 7.4% |
| White / Caucasian | 73 | 90.1% |
| Two or more Races | 0 | 0.0% |
| Some other Race | 2 | 2.5% |
| Total | 81 | 100.0% |
Ancestry in Gerty
The most populous ancestries reported in Gerty are American (28 | 34.6%), Mexican (8 | 9.9%), Choctaw (6 | 7.4%), British (2 | 2.5%), and Czech (2 | 2.5%), together accounting for 56.8% of all Gerty residents.
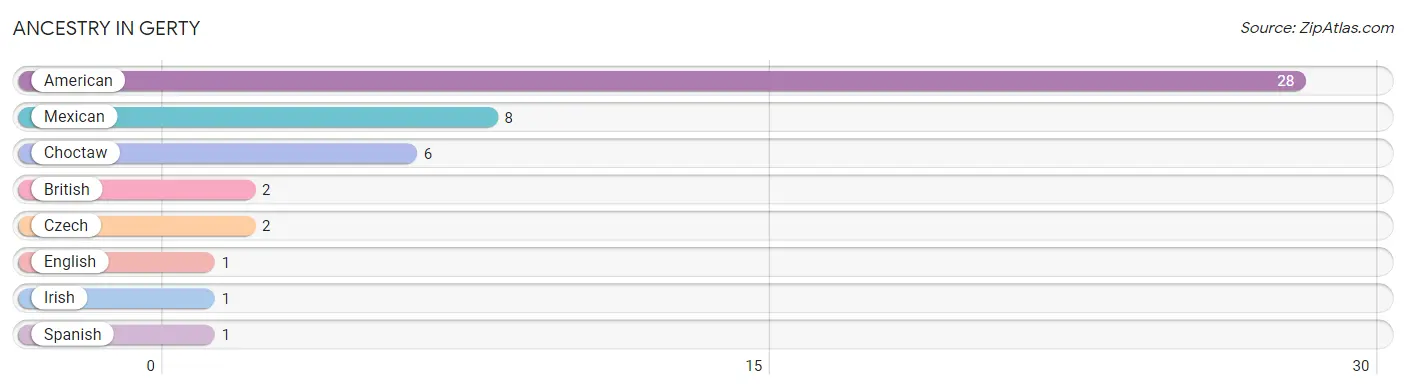
| Ancestry | # Population | % Population |
| American | 28 | 34.6% |
| British | 2 | 2.5% |
| Choctaw | 6 | 7.4% |
| Czech | 2 | 2.5% |
| English | 1 | 1.2% |
| Irish | 1 | 1.2% |
| Mexican | 8 | 9.9% |
| Spanish | 1 | 1.2% | View All 8 Rows |
Immigrants in Gerty

| Immigration Origin | # Population | % Population | View All 0 Rows |
Sex and Age in Gerty
Sex and Age in Gerty
The most populous age groups in Gerty are 25 to 29 Years (12 | 26.1%) for men and 30 to 34 Years (6 | 17.1%) for women.
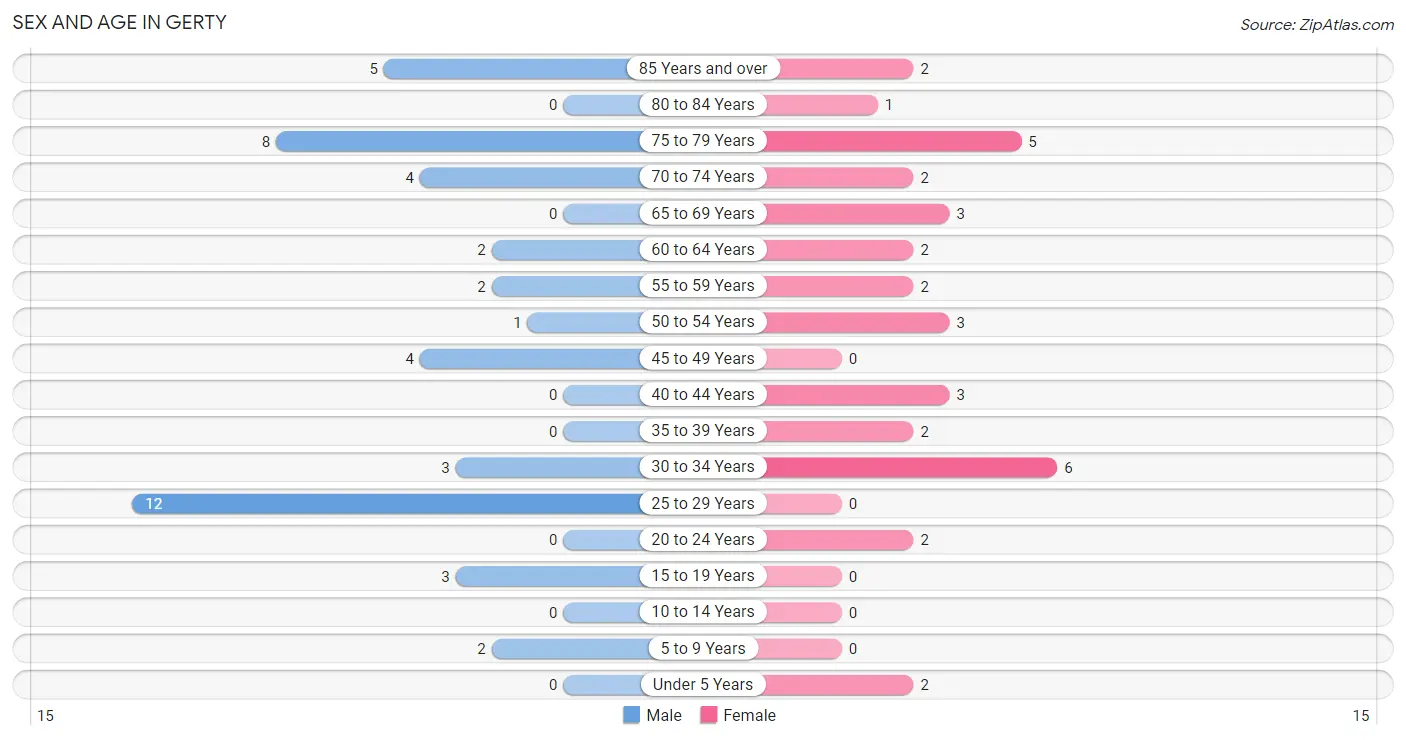
| Age Bracket | Male | Female |
| Under 5 Years | 0 (0.0%) | 2 (5.7%) |
| 5 to 9 Years | 2 (4.3%) | 0 (0.0%) |
| 10 to 14 Years | 0 (0.0%) | 0 (0.0%) |
| 15 to 19 Years | 3 (6.5%) | 0 (0.0%) |
| 20 to 24 Years | 0 (0.0%) | 2 (5.7%) |
| 25 to 29 Years | 12 (26.1%) | 0 (0.0%) |
| 30 to 34 Years | 3 (6.5%) | 6 (17.1%) |
| 35 to 39 Years | 0 (0.0%) | 2 (5.7%) |
| 40 to 44 Years | 0 (0.0%) | 3 (8.6%) |
| 45 to 49 Years | 4 (8.7%) | 0 (0.0%) |
| 50 to 54 Years | 1 (2.2%) | 3 (8.6%) |
| 55 to 59 Years | 2 (4.3%) | 2 (5.7%) |
| 60 to 64 Years | 2 (4.3%) | 2 (5.7%) |
| 65 to 69 Years | 0 (0.0%) | 3 (8.6%) |
| 70 to 74 Years | 4 (8.7%) | 2 (5.7%) |
| 75 to 79 Years | 8 (17.4%) | 5 (14.3%) |
| 80 to 84 Years | 0 (0.0%) | 1 (2.9%) |
| 85 Years and over | 5 (10.9%) | 2 (5.7%) |
| Total | 46 (100.0%) | 35 (100.0%) |
Families and Households in Gerty
Median Family Size in Gerty
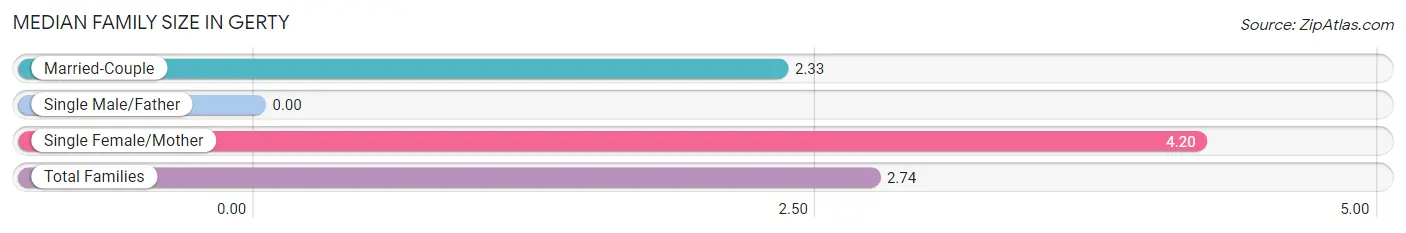
| Family Type | # Families | Family Size |
| Married-Couple | 18 (78.3%) | 2.33 |
| Single Male/Father | 0 (0.0%) | - |
| Single Female/Mother | 5 (21.7%) | 4.20 |
| Total Families | 23 (100.0%) | 2.74 |
Median Household Size in Gerty
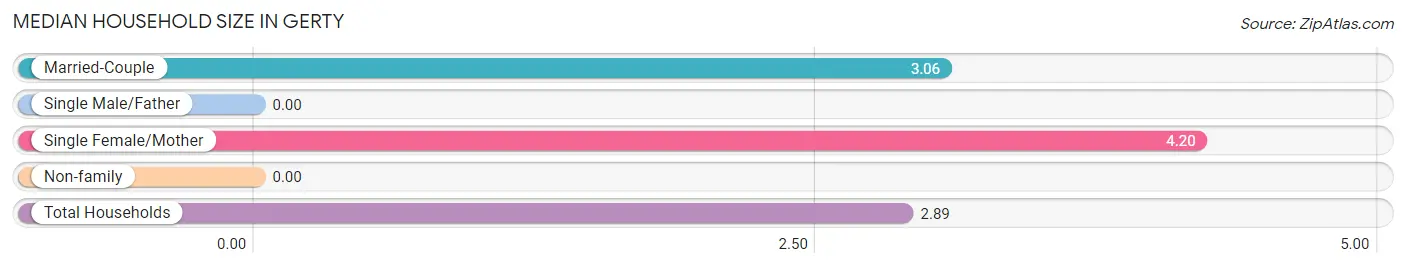
| Household Type | # Households | Household Size |
| Married-Couple | 18 (64.3%) | 3.06 |
| Single Male/Father | 0 (0.0%) | - |
| Single Female/Mother | 5 (17.9%) | 4.20 |
| Non-family | 5 (17.9%) | - |
| Total Households | 28 (100.0%) | 2.89 |
Household Size by Marriage Status in Gerty
Out of a total of 28 households in Gerty, 23 (82.1%) are family households, while 5 (17.9%) are nonfamily households. The most numerous type of family households are 2-person households, comprising 12, and the most common type of nonfamily households are 1-person households, comprising 5.
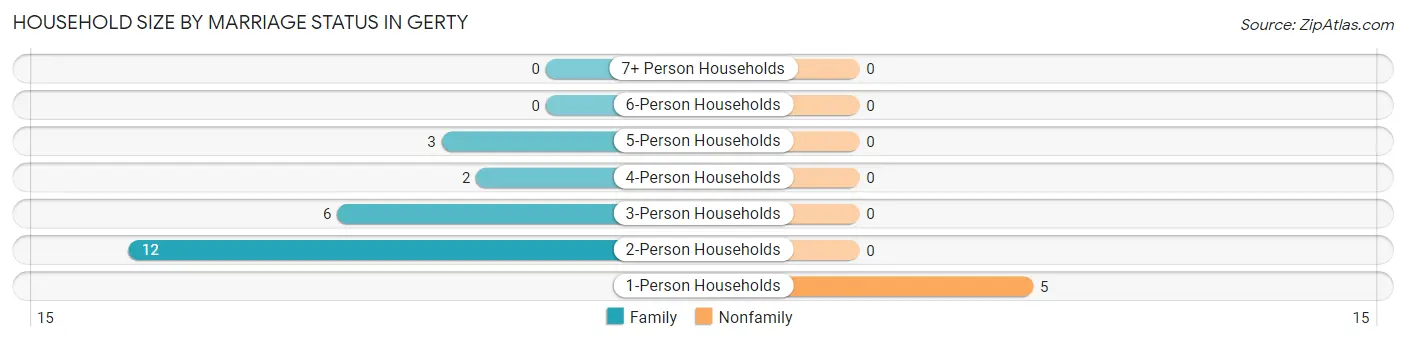
| Household Size | Family Households | Nonfamily Households |
| 1-Person Households | - | 5 (17.9%) |
| 2-Person Households | 12 (42.9%) | 0 (0.0%) |
| 3-Person Households | 6 (21.4%) | 0 (0.0%) |
| 4-Person Households | 2 (7.1%) | 0 (0.0%) |
| 5-Person Households | 3 (10.7%) | 0 (0.0%) |
| 6-Person Households | 0 (0.0%) | 0 (0.0%) |
| 7+ Person Households | 0 (0.0%) | 0 (0.0%) |
| Total | 23 (82.1%) | 5 (17.9%) |
Female Fertility in Gerty
Fertility by Age in Gerty
Average fertility rate in Gerty is 77.0 births per 1,000 women. Women in the age bracket of 20 to 34 years have the highest fertility rate with 125.0 births per 1,000 women. Women in the age bracket of 20 to 34 years acount for 100.0% of all women with births.
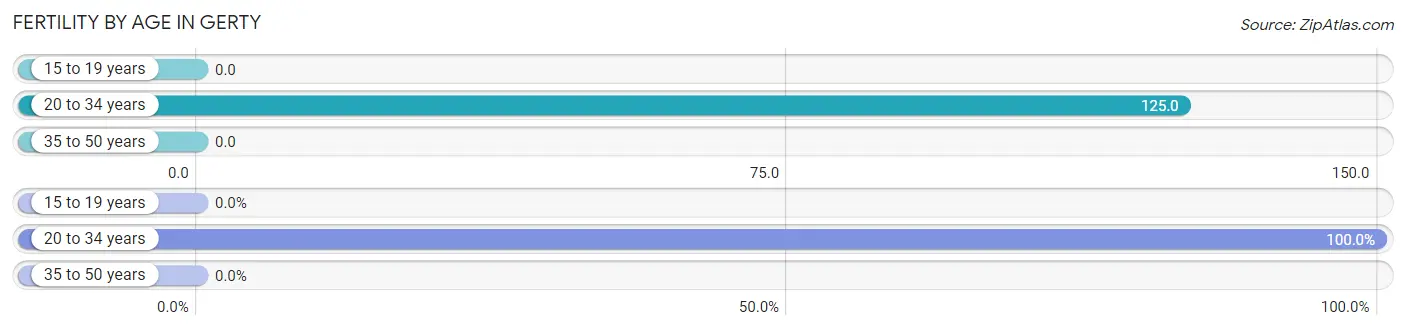
| Age Bracket | Women with Births | Births / 1,000 Women |
| 15 to 19 years | 0 (0.0%) | 0.0 |
| 20 to 34 years | 1 (100.0%) | 125.0 |
| 35 to 50 years | 0 (0.0%) | 0.0 |
| Total | 1 (100.0%) | 77.0 |
Fertility by Age by Marriage Status in Gerty
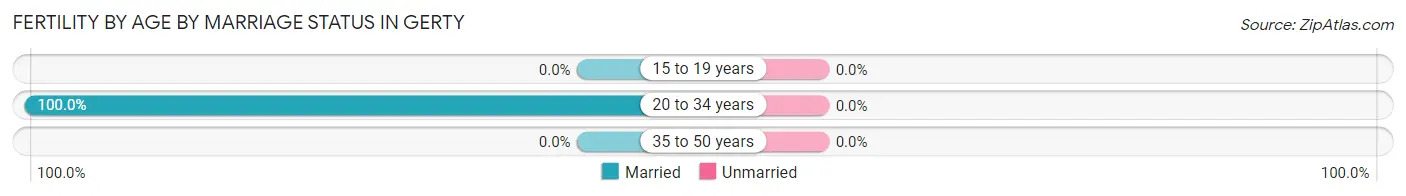
| Age Bracket | Married | Unmarried |
| 15 to 19 years | 0 (0.0%) | 0 (0.0%) |
| 20 to 34 years | 1 (100.0%) | 0 (0.0%) |
| 35 to 50 years | 0 (0.0%) | 0 (0.0%) |
| Total | 1 (100.0%) | 0 (0.0%) |
Fertility by Education in Gerty
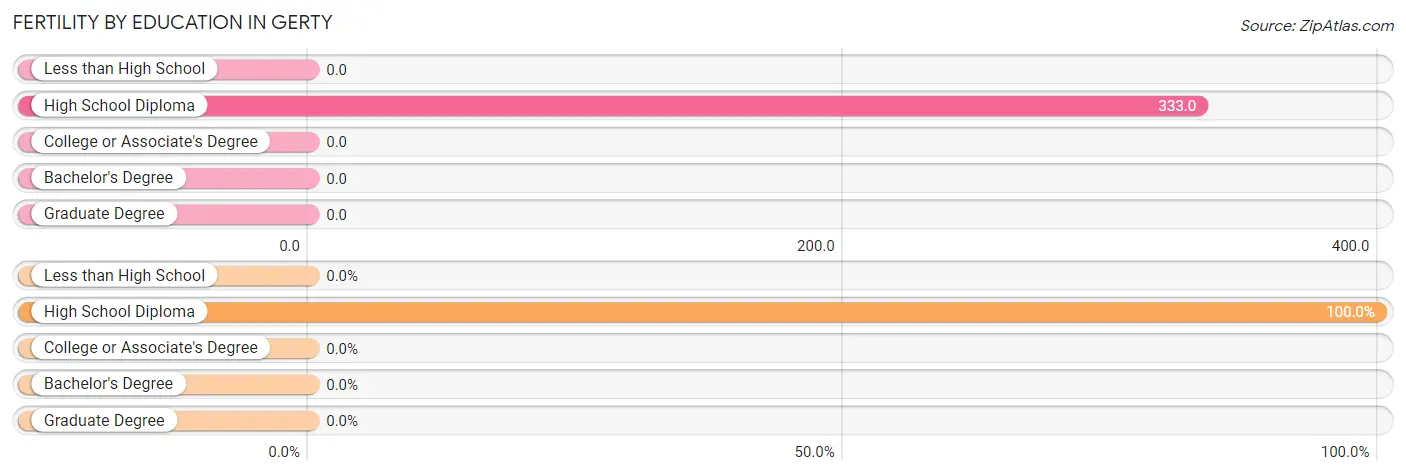
| Educational Attainment | Women with Births | Births / 1,000 Women |
| Less than High School | 0 (0.0%) | 0.0 |
| High School Diploma | 1 (100.0%) | 333.0 |
| College or Associate's Degree | 0 (0.0%) | 0.0 |
| Bachelor's Degree | 0 (0.0%) | 0.0 |
| Graduate Degree | 0 (0.0%) | 0.0 |
| Total | 1 (100.0%) | 77.0 |
Fertility by Education by Marriage Status in Gerty
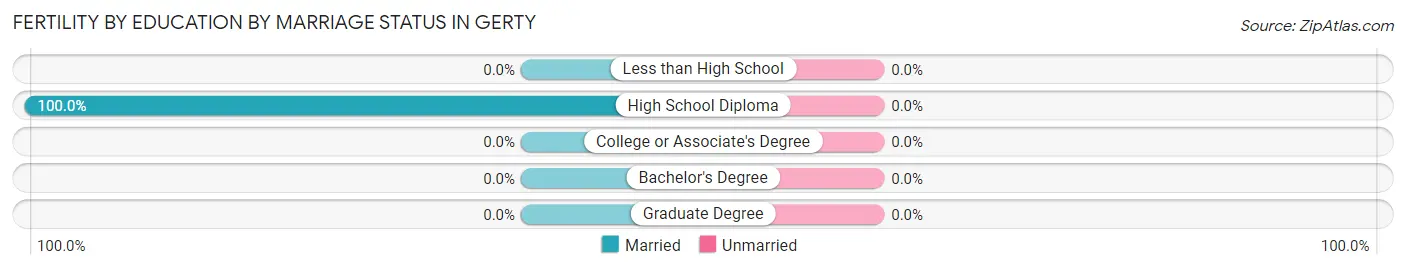
| Educational Attainment | Married | Unmarried |
| Less than High School | 0 (0.0%) | 0 (0.0%) |
| High School Diploma | 1 (100.0%) | 0 (0.0%) |
| College or Associate's Degree | 0 (0.0%) | 0 (0.0%) |
| Bachelor's Degree | 0 (0.0%) | 0 (0.0%) |
| Graduate Degree | 0 (0.0%) | 0 (0.0%) |
| Total | 1 (100.0%) | 0 (0.0%) |
Employment Characteristics in Gerty
Employment by Class of Employer in Gerty
Among the 26 employed individuals in Gerty, private company employees (21 | 80.8%), local government employees (2 | 7.7%), and state government employees (2 | 7.7%) make up the most common classes of employment.
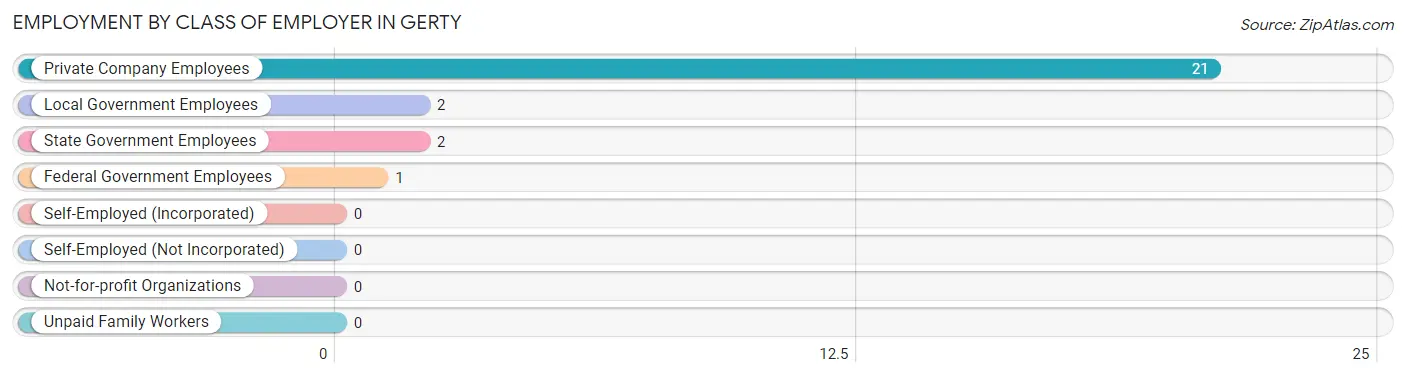
| Employer Class | # Employees | % Employees |
| Private Company Employees | 21 | 80.8% |
| Self-Employed (Incorporated) | 0 | 0.0% |
| Self-Employed (Not Incorporated) | 0 | 0.0% |
| Not-for-profit Organizations | 0 | 0.0% |
| Local Government Employees | 2 | 7.7% |
| State Government Employees | 2 | 7.7% |
| Federal Government Employees | 1 | 3.8% |
| Unpaid Family Workers | 0 | 0.0% |
| Total | 26 | 100.0% |
Employment Status by Age in Gerty
According to the labor force statistics for Gerty, out of the total population over 16 years of age (77), 35.1% or 27 individuals are in the labor force, with 3.7% or 1 of them unemployed. The age group with the highest labor force participation rate is 35 to 44 years, with 100.0% or 5 individuals in the labor force. Within the labor force, the 45 to 54 years age range has the highest percentage of unemployed individuals, with 12.5% or 1 of them being unemployed.
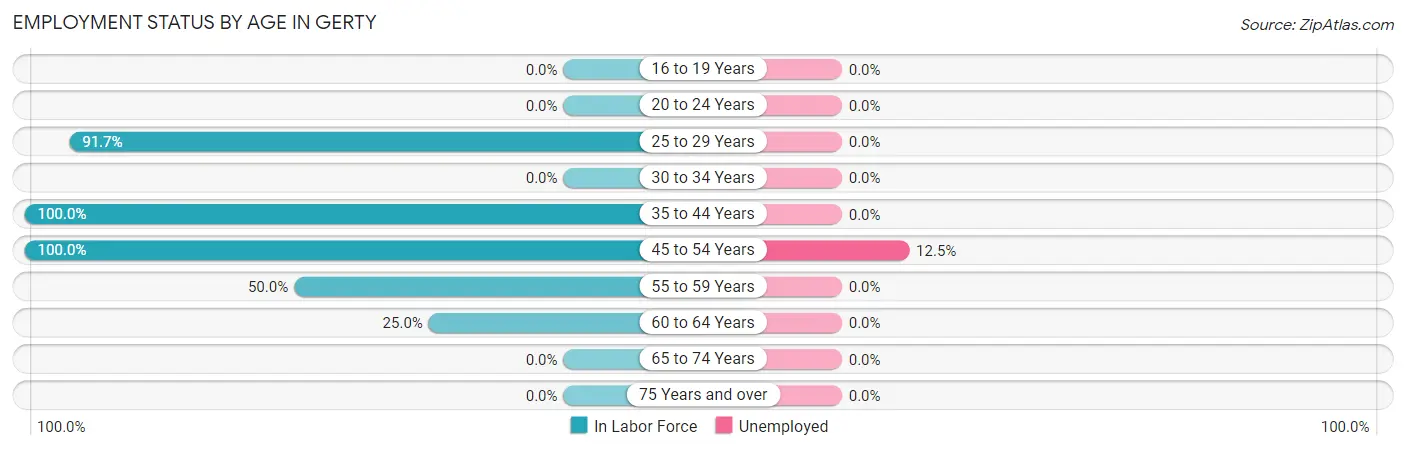
| Age Bracket | In Labor Force | Unemployed |
| 16 to 19 Years | 0 (0.0%) | 0 (0.0%) |
| 20 to 24 Years | 0 (0.0%) | 0 (0.0%) |
| 25 to 29 Years | 11 (91.7%) | 0 (0.0%) |
| 30 to 34 Years | 0 (0.0%) | 0 (0.0%) |
| 35 to 44 Years | 5 (100.0%) | 0 (0.0%) |
| 45 to 54 Years | 8 (100.0%) | 1 (12.5%) |
| 55 to 59 Years | 2 (50.0%) | 0 (0.0%) |
| 60 to 64 Years | 1 (25.0%) | 0 (0.0%) |
| 65 to 74 Years | 0 (0.0%) | 0 (0.0%) |
| 75 Years and over | 0 (0.0%) | 0 (0.0%) |
| Total | 27 (35.1%) | 1 (3.7%) |
Employment Status by Educational Attainment in Gerty
According to labor force statistics for Gerty, 64.3% of individuals (27) out of the total population between 25 and 64 years of age (42) are in the labor force, with 3.7% or 1 of them being unemployed. The group with the highest labor force participation rate are those with the educational attainment of bachelor's degree or higher, with 100.0% or 4 individuals in the labor force. Within the labor force, individuals with college / associate degree education have the highest percentage of unemployment, with 20.0% or 1 of them being unemployed.
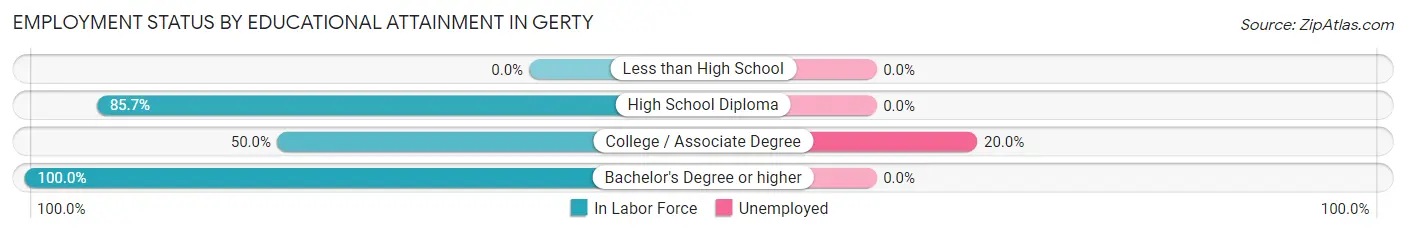
| Educational Attainment | In Labor Force | Unemployed |
| Less than High School | 0 (0.0%) | 0 (0.0%) |
| High School Diploma | 18 (85.7%) | 0 (0.0%) |
| College / Associate Degree | 5 (50.0%) | 2 (20.0%) |
| Bachelor's Degree or higher | 4 (100.0%) | 0 (0.0%) |
| Total | 27 (64.3%) | 2 (3.7%) |
Employment Occupations by Sex in Gerty
Management, Business, Science and Arts Occupations
The most common Management, Business, Science and Arts occupations in Gerty are Management (2 | 7.7%), Community & Social Service (1 | 3.8%), and Education Instruction & Library (1 | 3.8%).
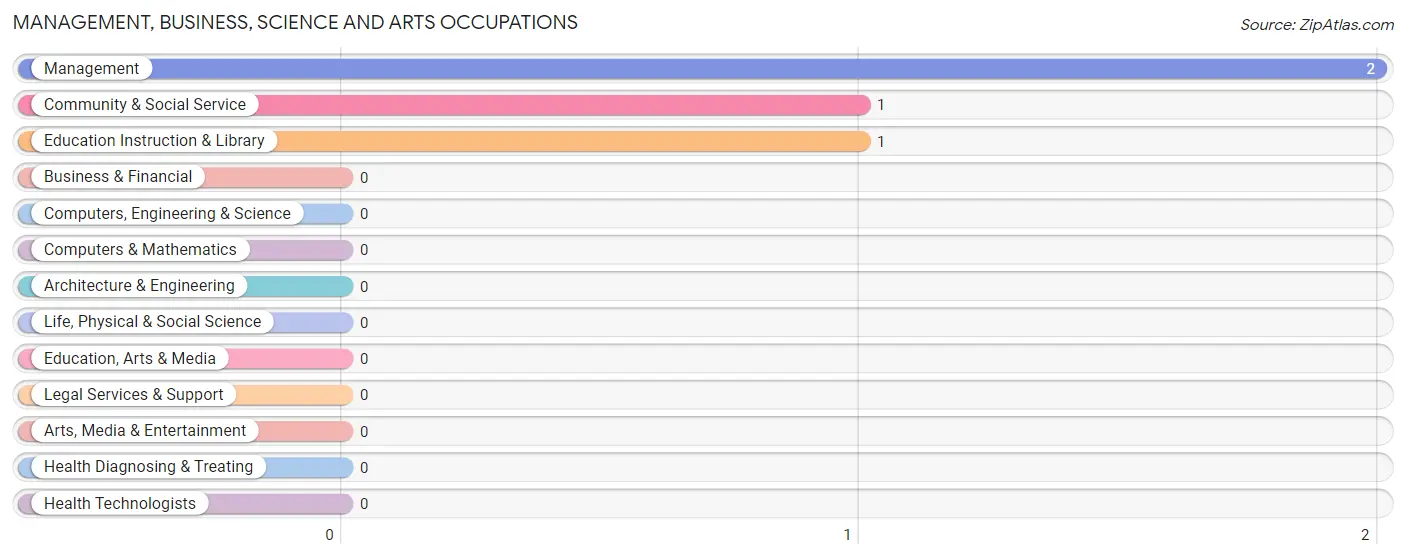
Management, Business, Science and Arts Occupations by Sex
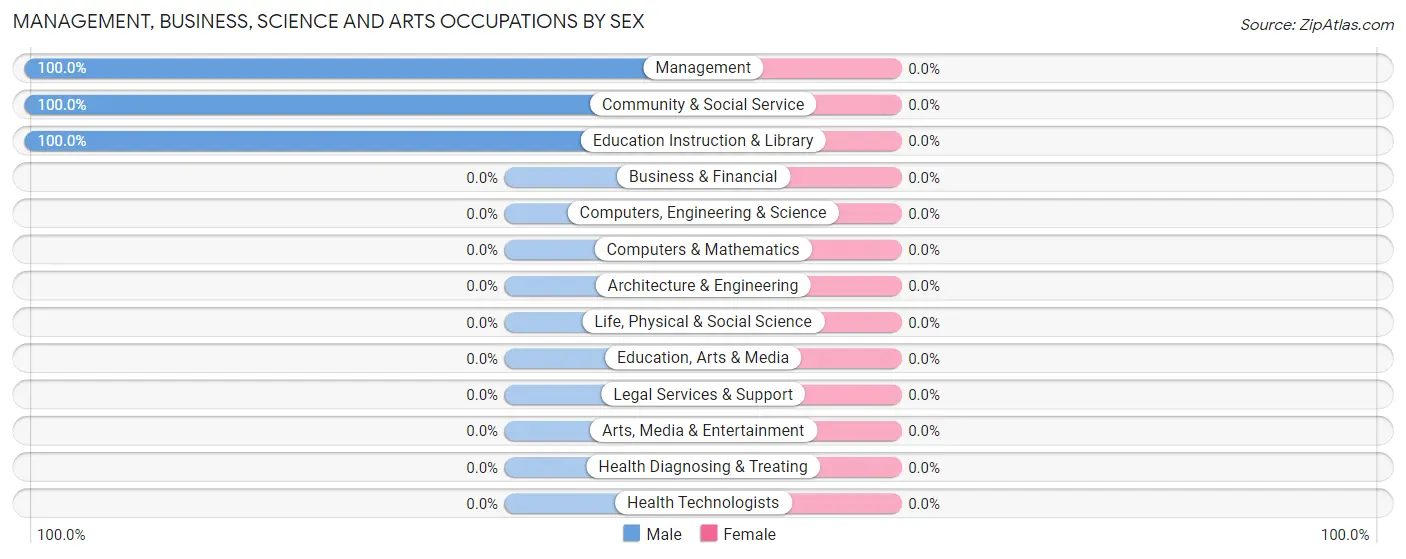
| Occupation | Male | Female |
| Management | 2 (100.0%) | 0 (0.0%) |
| Business & Financial | 0 (0.0%) | 0 (0.0%) |
| Computers, Engineering & Science | 0 (0.0%) | 0 (0.0%) |
| Computers & Mathematics | 0 (0.0%) | 0 (0.0%) |
| Architecture & Engineering | 0 (0.0%) | 0 (0.0%) |
| Life, Physical & Social Science | 0 (0.0%) | 0 (0.0%) |
| Community & Social Service | 1 (100.0%) | 0 (0.0%) |
| Education, Arts & Media | 0 (0.0%) | 0 (0.0%) |
| Legal Services & Support | 0 (0.0%) | 0 (0.0%) |
| Education Instruction & Library | 1 (100.0%) | 0 (0.0%) |
| Arts, Media & Entertainment | 0 (0.0%) | 0 (0.0%) |
| Health Diagnosing & Treating | 0 (0.0%) | 0 (0.0%) |
| Health Technologists | 0 (0.0%) | 0 (0.0%) |
| Total (Category) | 3 (100.0%) | 0 (0.0%) |
| Total (Overall) | 17 (65.4%) | 9 (34.6%) |
Services Occupations
Services Occupations by Sex
| Occupation | Male | Female |
| Healthcare Support | 0 (0.0%) | 0 (0.0%) |
| Security & Protection | 0 (0.0%) | 0 (0.0%) |
| Firefighting & Prevention | 0 (0.0%) | 0 (0.0%) |
| Law Enforcement | 0 (0.0%) | 0 (0.0%) |
| Food Preparation & Serving | 0 (0.0%) | 0 (0.0%) |
| Cleaning & Maintenance | 0 (0.0%) | 0 (0.0%) |
| Personal Care & Service | 0 (0.0%) | 0 (0.0%) |
| Total (Category) | 0 (0.0%) | 0 (0.0%) |
| Total (Overall) | 17 (65.4%) | 9 (34.6%) |
Sales and Office Occupations
The most common Sales and Office occupations in Gerty are Sales & Related (5 | 19.2%), and Office & Administration (4 | 15.4%).
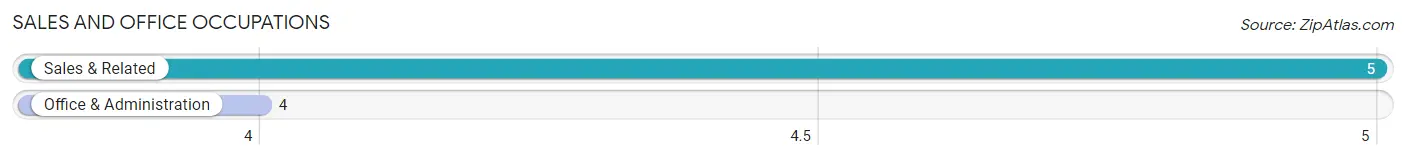
Sales and Office Occupations by Sex
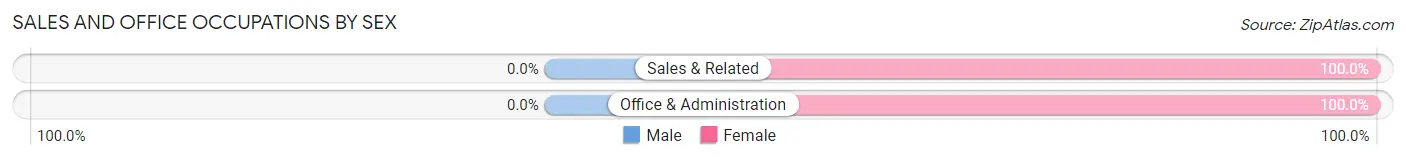
| Occupation | Male | Female |
| Sales & Related | 0 (0.0%) | 5 (100.0%) |
| Office & Administration | 0 (0.0%) | 4 (100.0%) |
| Total (Category) | 0 (0.0%) | 9 (100.0%) |
| Total (Overall) | 17 (65.4%) | 9 (34.6%) |
Natural Resources, Construction and Maintenance Occupations
The most common Natural Resources, Construction and Maintenance occupations in Gerty are , and Farming, Fishing & Forestry (11 | 42.3%).
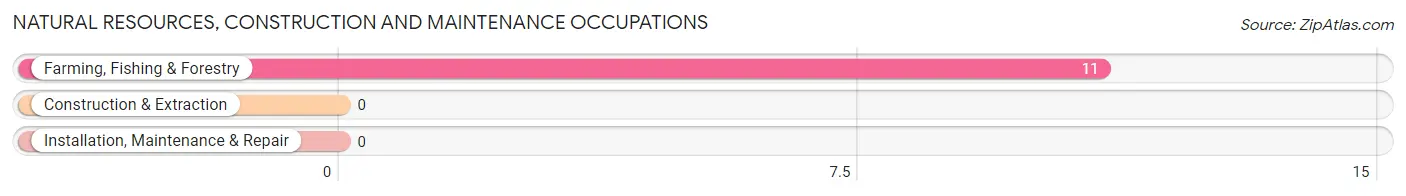
Natural Resources, Construction and Maintenance Occupations by Sex
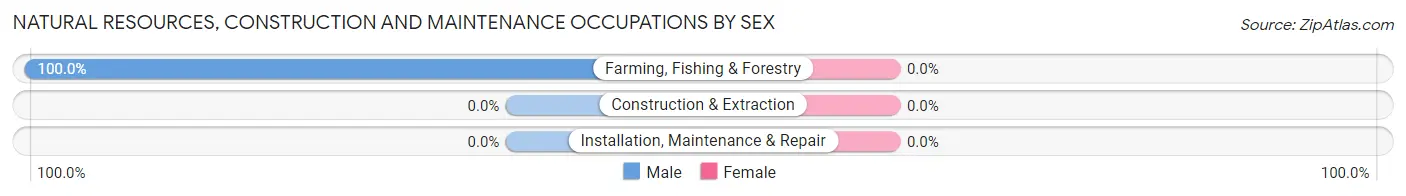
| Occupation | Male | Female |
| Farming, Fishing & Forestry | 11 (100.0%) | 0 (0.0%) |
| Construction & Extraction | 0 (0.0%) | 0 (0.0%) |
| Installation, Maintenance & Repair | 0 (0.0%) | 0 (0.0%) |
| Total (Category) | 11 (100.0%) | 0 (0.0%) |
| Total (Overall) | 17 (65.4%) | 9 (34.6%) |
Production, Transportation and Moving Occupations
The most common Production, Transportation and Moving occupations in Gerty are , and Transportation (3 | 11.5%).
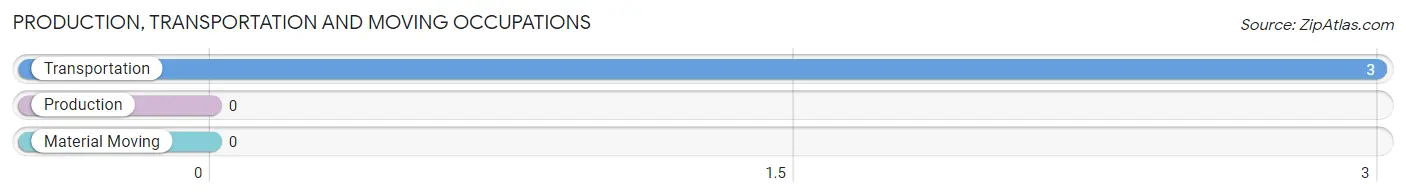
Production, Transportation and Moving Occupations by Sex
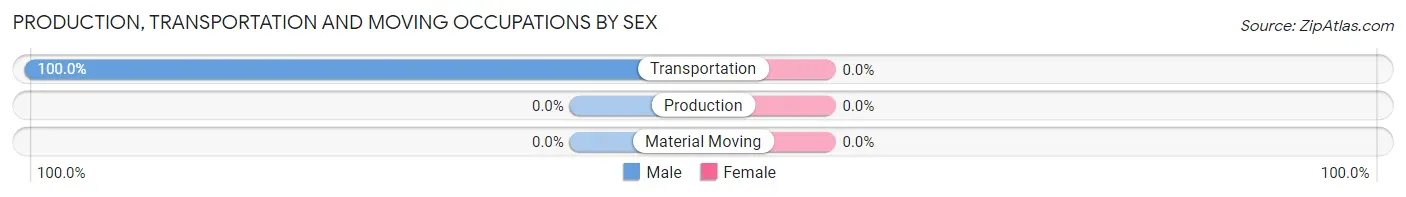
| Occupation | Male | Female |
| Production | 0 (0.0%) | 0 (0.0%) |
| Transportation | 3 (100.0%) | 0 (0.0%) |
| Material Moving | 0 (0.0%) | 0 (0.0%) |
| Total (Category) | 3 (100.0%) | 0 (0.0%) |
| Total (Overall) | 17 (65.4%) | 9 (34.6%) |
Employment Industries by Sex in Gerty
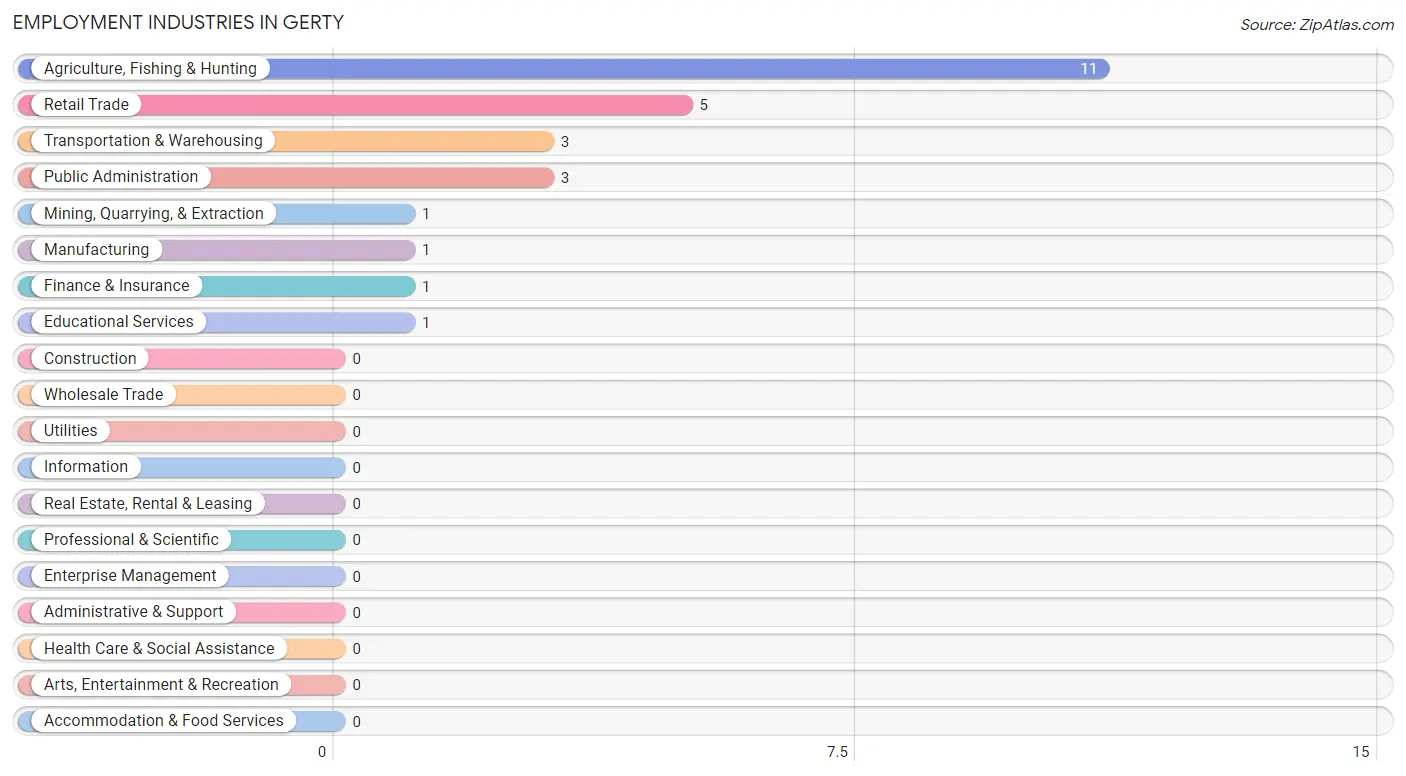
Employment Industries in Gerty
The major employment industries in Gerty include Agriculture, Fishing & Hunting (11 | 42.3%), Retail Trade (5 | 19.2%), Transportation & Warehousing (3 | 11.5%), Public Administration (3 | 11.5%), and Mining, Quarrying, & Extraction (1 | 3.8%).
Employment Industries by Sex in Gerty
The Gerty industries that see more men than women are Agriculture, Fishing & Hunting (100.0%), Mining, Quarrying, & Extraction (100.0%), and Manufacturing (100.0%), whereas the industries that tend to have a higher number of women are Retail Trade (100.0%), Finance & Insurance (100.0%), and Public Administration (100.0%).
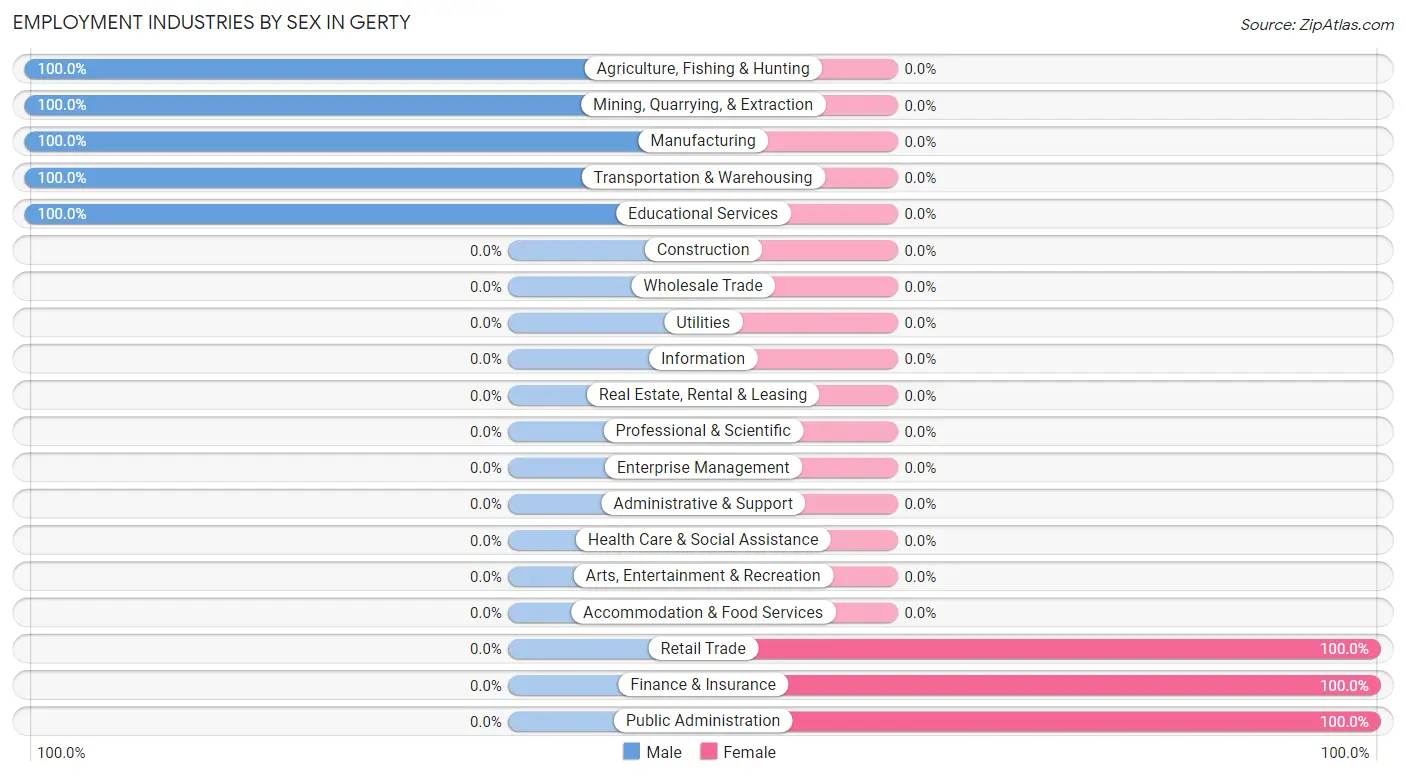
| Industry | Male | Female |
| Agriculture, Fishing & Hunting | 11 (100.0%) | 0 (0.0%) |
| Mining, Quarrying, & Extraction | 1 (100.0%) | 0 (0.0%) |
| Construction | 0 (0.0%) | 0 (0.0%) |
| Manufacturing | 1 (100.0%) | 0 (0.0%) |
| Wholesale Trade | 0 (0.0%) | 0 (0.0%) |
| Retail Trade | 0 (0.0%) | 5 (100.0%) |
| Transportation & Warehousing | 3 (100.0%) | 0 (0.0%) |
| Utilities | 0 (0.0%) | 0 (0.0%) |
| Information | 0 (0.0%) | 0 (0.0%) |
| Finance & Insurance | 0 (0.0%) | 1 (100.0%) |
| Real Estate, Rental & Leasing | 0 (0.0%) | 0 (0.0%) |
| Professional & Scientific | 0 (0.0%) | 0 (0.0%) |
| Enterprise Management | 0 (0.0%) | 0 (0.0%) |
| Administrative & Support | 0 (0.0%) | 0 (0.0%) |
| Educational Services | 1 (100.0%) | 0 (0.0%) |
| Health Care & Social Assistance | 0 (0.0%) | 0 (0.0%) |
| Arts, Entertainment & Recreation | 0 (0.0%) | 0 (0.0%) |
| Accommodation & Food Services | 0 (0.0%) | 0 (0.0%) |
| Public Administration | 0 (0.0%) | 3 (100.0%) |
| Total | 17 (65.4%) | 9 (34.6%) |
Education in Gerty
School Enrollment in Gerty
The most common levels of schooling among the 6 students in Gerty are high school (3 | 50.0%), kindergarten (2 | 33.3%), and college / undergraduate (1 | 16.7%).
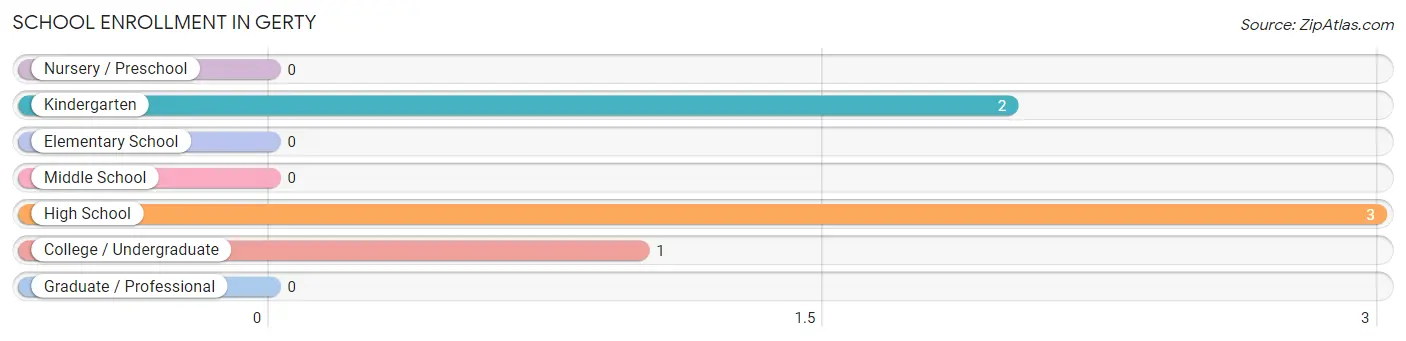
| School Level | # Students | % Students |
| Nursery / Preschool | 0 | 0.0% |
| Kindergarten | 2 | 33.3% |
| Elementary School | 0 | 0.0% |
| Middle School | 0 | 0.0% |
| High School | 3 | 50.0% |
| College / Undergraduate | 1 | 16.7% |
| Graduate / Professional | 0 | 0.0% |
| Total | 6 | 100.0% |
School Enrollment by Age by Funding Source in Gerty
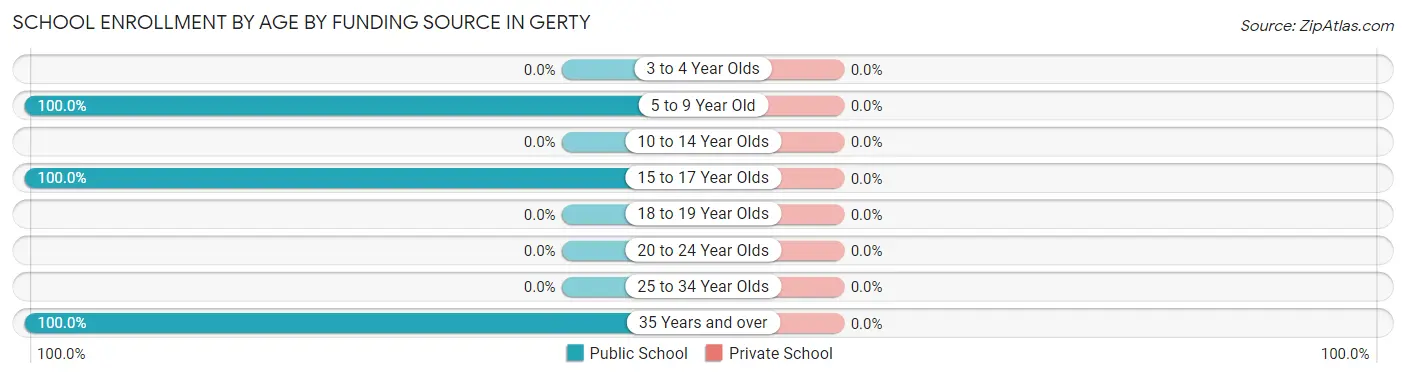
| Age Bracket | Public School | Private School |
| 3 to 4 Year Olds | 0 (0.0%) | 0 (0.0%) |
| 5 to 9 Year Old | 2 (100.0%) | 0 (0.0%) |
| 10 to 14 Year Olds | 0 (0.0%) | 0 (0.0%) |
| 15 to 17 Year Olds | 3 (100.0%) | 0 (0.0%) |
| 18 to 19 Year Olds | 0 (0.0%) | 0 (0.0%) |
| 20 to 24 Year Olds | 0 (0.0%) | 0 (0.0%) |
| 25 to 34 Year Olds | 0 (0.0%) | 0 (0.0%) |
| 35 Years and over | 1 (100.0%) | 0 (0.0%) |
| Total | 6 (100.0%) | 0 (0.0%) |
Educational Attainment by Field of Study in Gerty
Education (2 | 50.0%), science & technology (1 | 25.0%), and business (1 | 25.0%) are the most common fields of study among 4 individuals in Gerty who have obtained a bachelor's degree or higher.
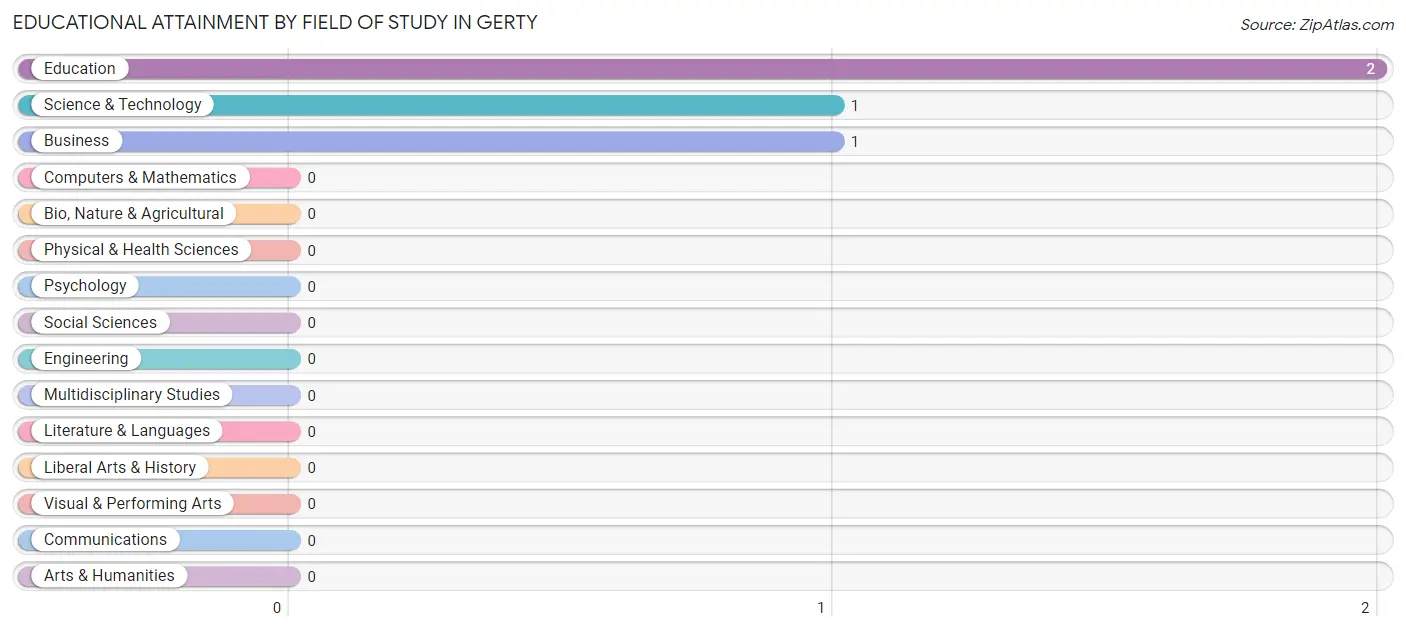
| Field of Study | # Graduates | % Graduates |
| Computers & Mathematics | 0 | 0.0% |
| Bio, Nature & Agricultural | 0 | 0.0% |
| Physical & Health Sciences | 0 | 0.0% |
| Psychology | 0 | 0.0% |
| Social Sciences | 0 | 0.0% |
| Engineering | 0 | 0.0% |
| Multidisciplinary Studies | 0 | 0.0% |
| Science & Technology | 1 | 25.0% |
| Business | 1 | 25.0% |
| Education | 2 | 50.0% |
| Literature & Languages | 0 | 0.0% |
| Liberal Arts & History | 0 | 0.0% |
| Visual & Performing Arts | 0 | 0.0% |
| Communications | 0 | 0.0% |
| Arts & Humanities | 0 | 0.0% |
| Total | 4 | 100.0% |
Transportation & Commute in Gerty
Vehicle Availability by Sex in Gerty
The most prevalent vehicle ownership categories in Gerty are males with 2 vehicles (10, accounting for 58.8%) and females with 2 vehicles (5, making up 111.1%).
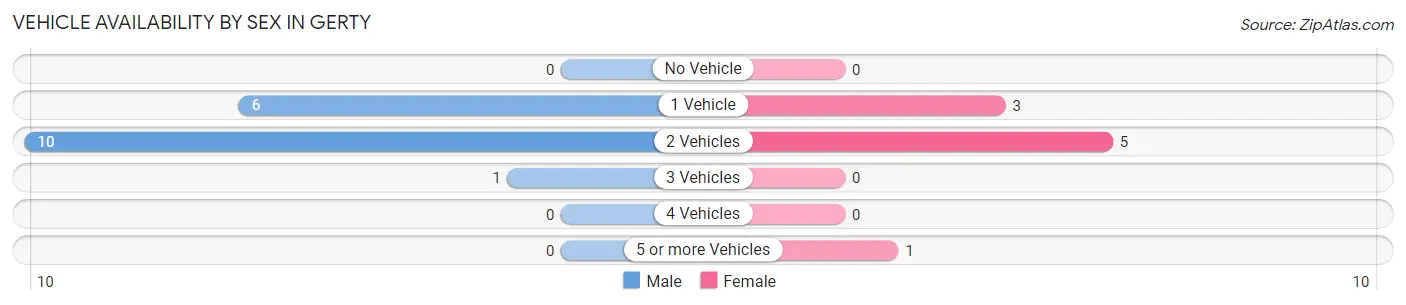
| Vehicles Available | Male | Female |
| No Vehicle | 0 (0.0%) | 0 (0.0%) |
| 1 Vehicle | 6 (35.3%) | 3 (33.3%) |
| 2 Vehicles | 10 (58.8%) | 5 (55.6%) |
| 3 Vehicles | 1 (5.9%) | 0 (0.0%) |
| 4 Vehicles | 0 (0.0%) | 0 (0.0%) |
| 5 or more Vehicles | 0 (0.0%) | 1 (11.1%) |
| Total | 17 (100.0%) | 9 (100.0%) |
Commute Time in Gerty
The most frequently occuring commute durations in Gerty are 10 to 14 minutes (11 commuters, 47.8%), 5 to 9 minutes (3 commuters, 13.0%), and 35 to 39 minutes (3 commuters, 13.0%).
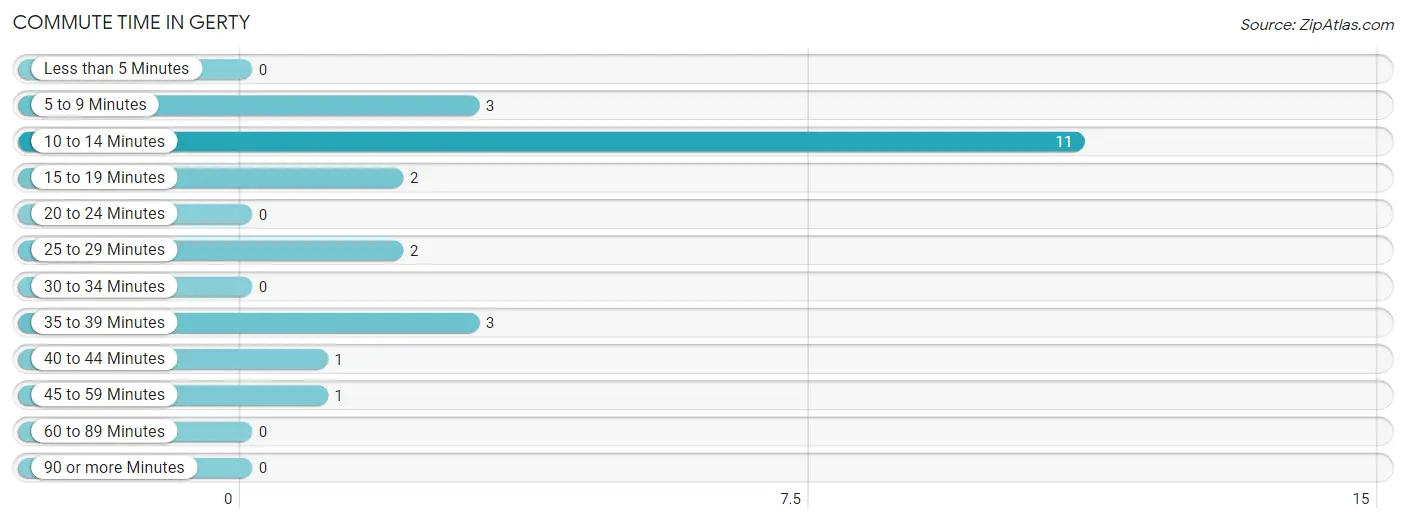
| Commute Time | # Commuters | % Commuters |
| Less than 5 Minutes | 0 | 0.0% |
| 5 to 9 Minutes | 3 | 13.0% |
| 10 to 14 Minutes | 11 | 47.8% |
| 15 to 19 Minutes | 2 | 8.7% |
| 20 to 24 Minutes | 0 | 0.0% |
| 25 to 29 Minutes | 2 | 8.7% |
| 30 to 34 Minutes | 0 | 0.0% |
| 35 to 39 Minutes | 3 | 13.0% |
| 40 to 44 Minutes | 1 | 4.3% |
| 45 to 59 Minutes | 1 | 4.3% |
| 60 to 89 Minutes | 0 | 0.0% |
| 90 or more Minutes | 0 | 0.0% |
Commute Time by Sex in Gerty
The most common commute times in Gerty are 10 to 14 minutes (9 commuters, 64.3%) for males and 5 to 9 minutes (3 commuters, 33.3%) for females.
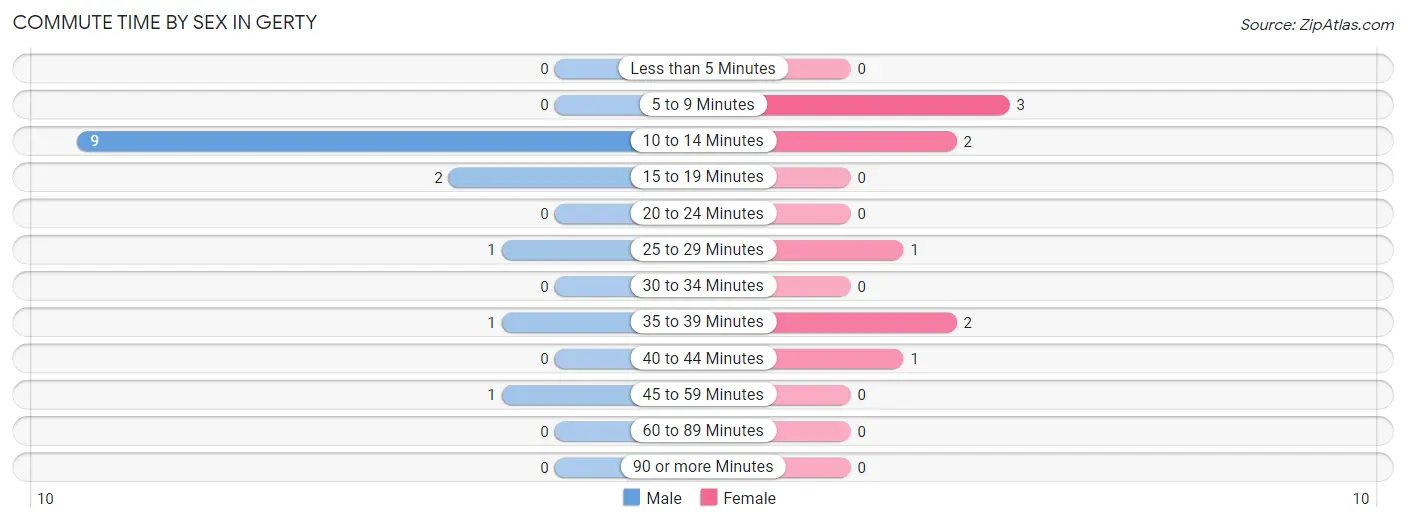
| Commute Time | Male | Female |
| Less than 5 Minutes | 0 (0.0%) | 0 (0.0%) |
| 5 to 9 Minutes | 0 (0.0%) | 3 (33.3%) |
| 10 to 14 Minutes | 9 (64.3%) | 2 (22.2%) |
| 15 to 19 Minutes | 2 (14.3%) | 0 (0.0%) |
| 20 to 24 Minutes | 0 (0.0%) | 0 (0.0%) |
| 25 to 29 Minutes | 1 (7.1%) | 1 (11.1%) |
| 30 to 34 Minutes | 0 (0.0%) | 0 (0.0%) |
| 35 to 39 Minutes | 1 (7.1%) | 2 (22.2%) |
| 40 to 44 Minutes | 0 (0.0%) | 1 (11.1%) |
| 45 to 59 Minutes | 1 (7.1%) | 0 (0.0%) |
| 60 to 89 Minutes | 0 (0.0%) | 0 (0.0%) |
| 90 or more Minutes | 0 (0.0%) | 0 (0.0%) |
Time of Departure to Work by Sex in Gerty
The most frequent times of departure to work in Gerty are 7:00 AM to 7:29 AM (10, 71.4%) for males and 7:00 AM to 7:29 AM (6, 66.7%) for females.
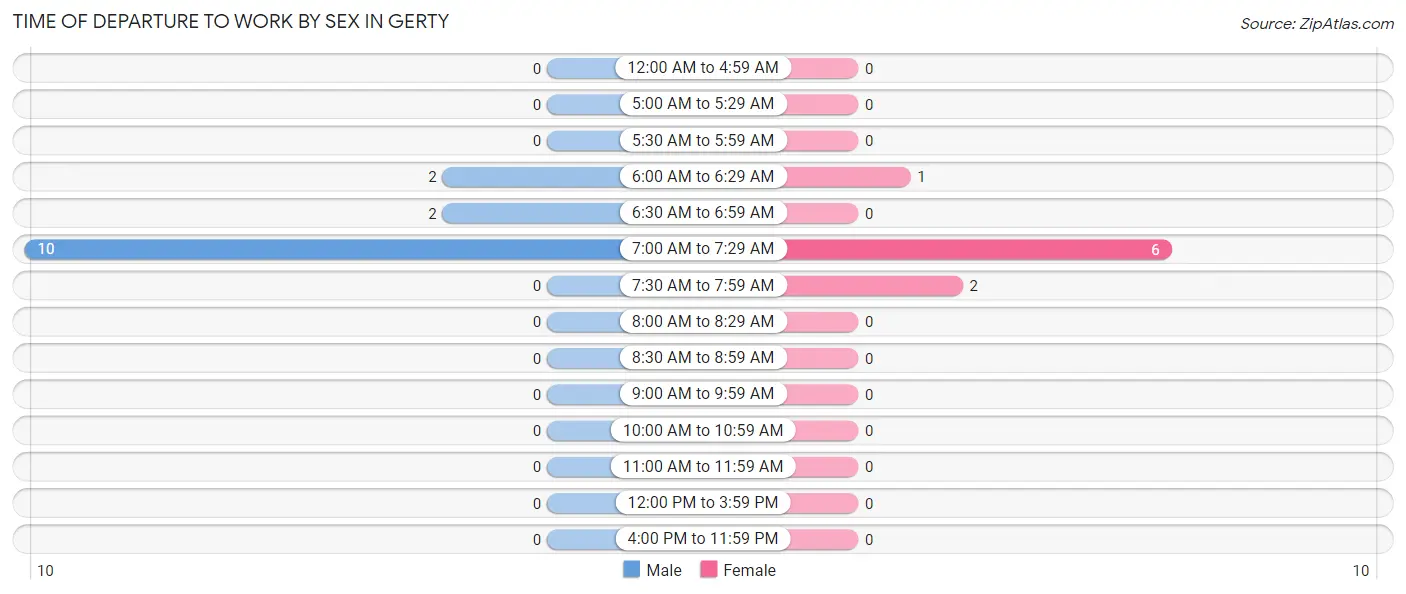
| Time of Departure | Male | Female |
| 12:00 AM to 4:59 AM | 0 (0.0%) | 0 (0.0%) |
| 5:00 AM to 5:29 AM | 0 (0.0%) | 0 (0.0%) |
| 5:30 AM to 5:59 AM | 0 (0.0%) | 0 (0.0%) |
| 6:00 AM to 6:29 AM | 2 (14.3%) | 1 (11.1%) |
| 6:30 AM to 6:59 AM | 2 (14.3%) | 0 (0.0%) |
| 7:00 AM to 7:29 AM | 10 (71.4%) | 6 (66.7%) |
| 7:30 AM to 7:59 AM | 0 (0.0%) | 2 (22.2%) |
| 8:00 AM to 8:29 AM | 0 (0.0%) | 0 (0.0%) |
| 8:30 AM to 8:59 AM | 0 (0.0%) | 0 (0.0%) |
| 9:00 AM to 9:59 AM | 0 (0.0%) | 0 (0.0%) |
| 10:00 AM to 10:59 AM | 0 (0.0%) | 0 (0.0%) |
| 11:00 AM to 11:59 AM | 0 (0.0%) | 0 (0.0%) |
| 12:00 PM to 3:59 PM | 0 (0.0%) | 0 (0.0%) |
| 4:00 PM to 11:59 PM | 0 (0.0%) | 0 (0.0%) |
| Total | 14 (100.0%) | 9 (100.0%) |
Housing Occupancy in Gerty
Occupancy by Ownership in Gerty
Of the total 28 dwellings in Gerty, owner-occupied units account for 26 (92.9%), while renter-occupied units make up 2 (7.1%).
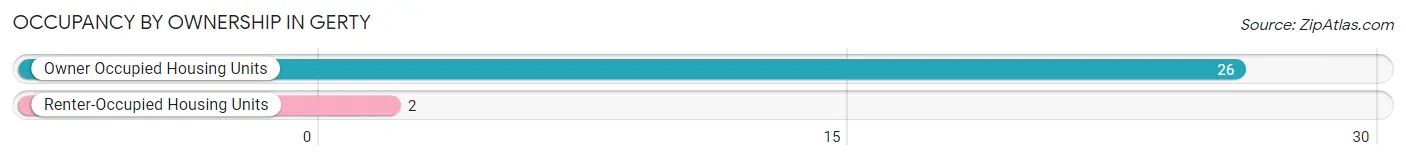
| Occupancy | # Housing Units | % Housing Units |
| Owner Occupied Housing Units | 26 | 92.9% |
| Renter-Occupied Housing Units | 2 | 7.1% |
| Total Occupied Housing Units | 28 | 100.0% |
Occupancy by Household Size in Gerty
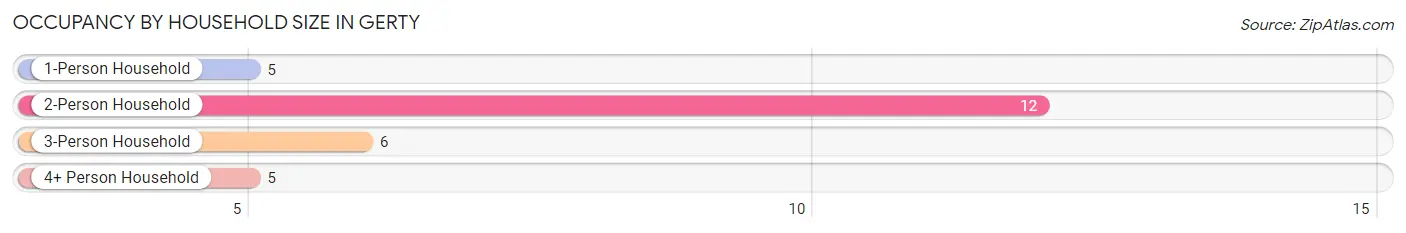
| Household Size | # Housing Units | % Housing Units |
| 1-Person Household | 5 | 17.9% |
| 2-Person Household | 12 | 42.9% |
| 3-Person Household | 6 | 21.4% |
| 4+ Person Household | 5 | 17.9% |
| Total Housing Units | 28 | 100.0% |
Occupancy by Ownership by Household Size in Gerty
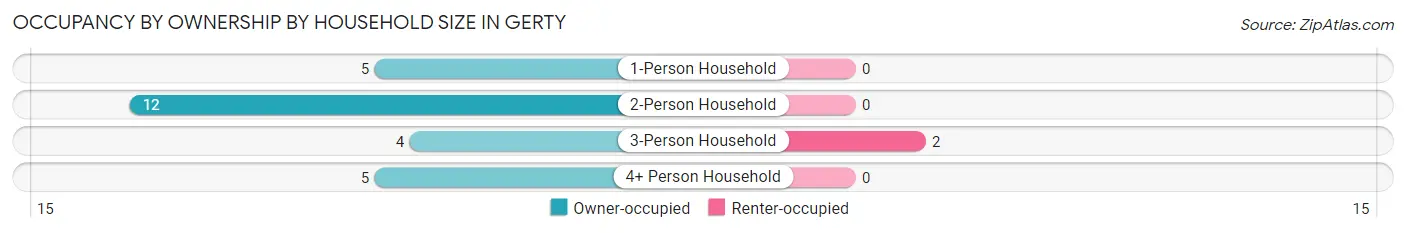
| Household Size | Owner-occupied | Renter-occupied |
| 1-Person Household | 5 (100.0%) | 0 (0.0%) |
| 2-Person Household | 12 (100.0%) | 0 (0.0%) |
| 3-Person Household | 4 (66.7%) | 2 (33.3%) |
| 4+ Person Household | 5 (100.0%) | 0 (0.0%) |
| Total Housing Units | 26 (92.9%) | 2 (7.1%) |
Occupancy by Educational Attainment in Gerty
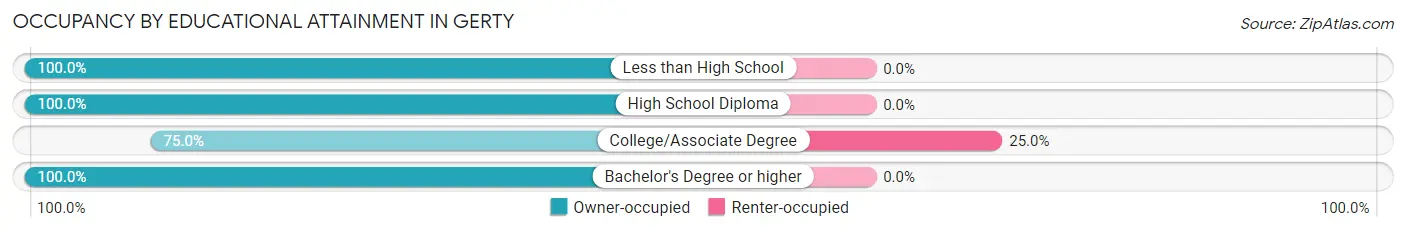
| Household Size | Owner-occupied | Renter-occupied |
| Less than High School | 4 (100.0%) | 0 (0.0%) |
| High School Diploma | 14 (100.0%) | 0 (0.0%) |
| College/Associate Degree | 6 (75.0%) | 2 (25.0%) |
| Bachelor's Degree or higher | 2 (100.0%) | 0 (0.0%) |
Occupancy by Age of Householder in Gerty
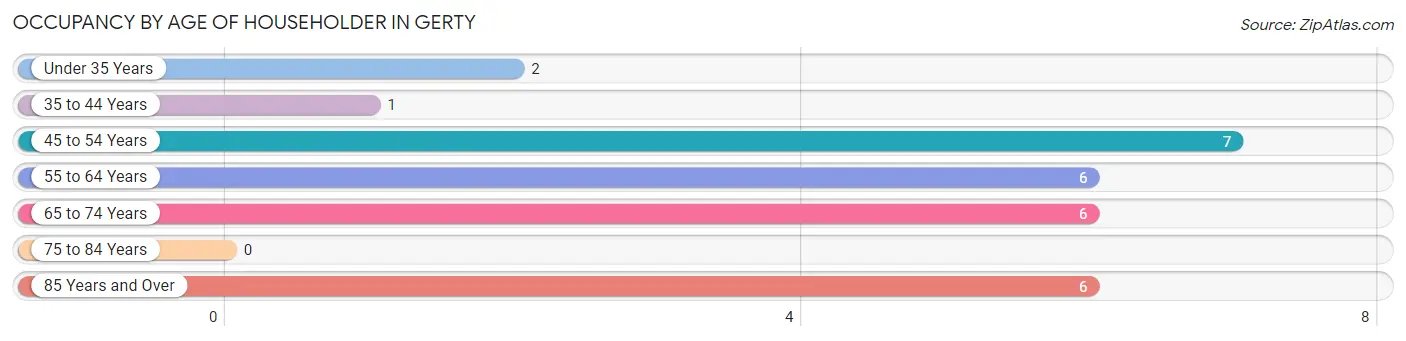
| Age Bracket | # Households | % Households |
| Under 35 Years | 2 | 7.1% |
| 35 to 44 Years | 1 | 3.6% |
| 45 to 54 Years | 7 | 25.0% |
| 55 to 64 Years | 6 | 21.4% |
| 65 to 74 Years | 6 | 21.4% |
| 75 to 84 Years | 0 | 0.0% |
| 85 Years and Over | 6 | 21.4% |
| Total | 28 | 100.0% |
Housing Finances in Gerty
Median Income by Occupancy in Gerty
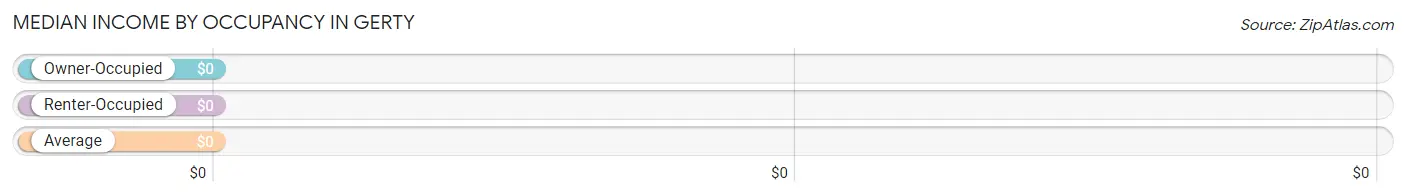
| Occupancy Type | # Households | Median Income |
| Owner-Occupied | 26 (92.9%) | $0 |
| Renter-Occupied | 2 (7.1%) | $0 |
| Average | 28 (100.0%) | $0 |
Occupancy by Householder Income Bracket in Gerty
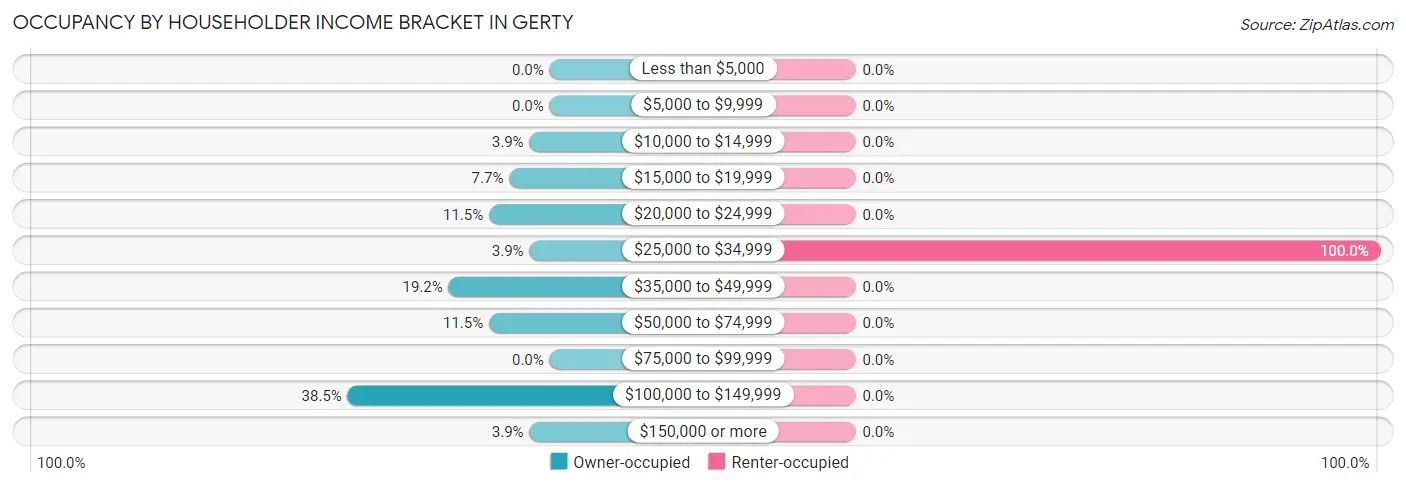
| Income Bracket | Owner-occupied | Renter-occupied |
| Less than $5,000 | 0 (0.0%) | 0 (0.0%) |
| $5,000 to $9,999 | 0 (0.0%) | 0 (0.0%) |
| $10,000 to $14,999 | 1 (3.8%) | 0 (0.0%) |
| $15,000 to $19,999 | 2 (7.7%) | 0 (0.0%) |
| $20,000 to $24,999 | 3 (11.5%) | 0 (0.0%) |
| $25,000 to $34,999 | 1 (3.8%) | 2 (100.0%) |
| $35,000 to $49,999 | 5 (19.2%) | 0 (0.0%) |
| $50,000 to $74,999 | 3 (11.5%) | 0 (0.0%) |
| $75,000 to $99,999 | 0 (0.0%) | 0 (0.0%) |
| $100,000 to $149,999 | 10 (38.5%) | 0 (0.0%) |
| $150,000 or more | 1 (3.8%) | 0 (0.0%) |
| Total | 26 (100.0%) | 2 (100.0%) |
Monthly Housing Cost Tiers in Gerty
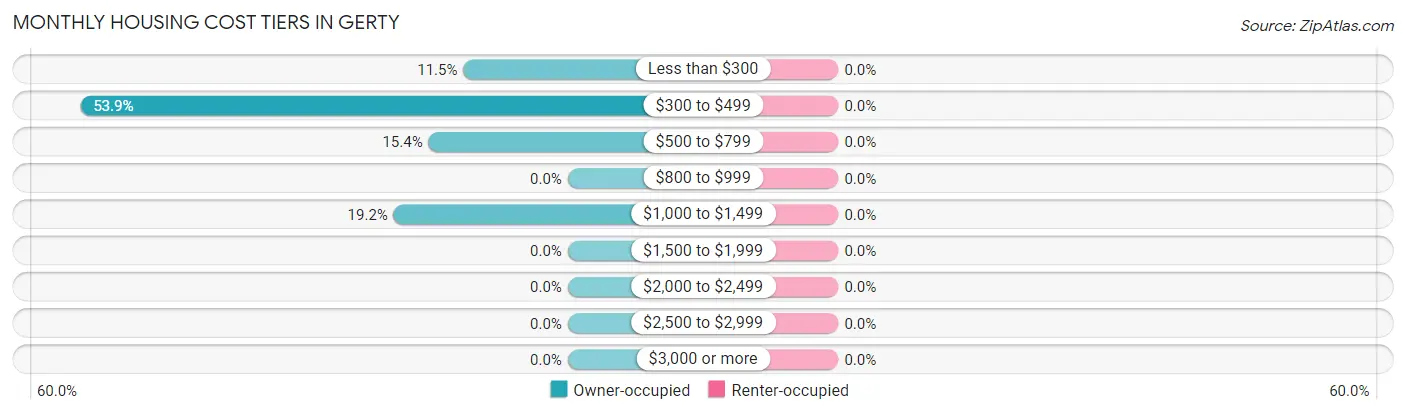
| Monthly Cost | Owner-occupied | Renter-occupied |
| Less than $300 | 3 (11.5%) | 0 (0.0%) |
| $300 to $499 | 14 (53.8%) | 0 (0.0%) |
| $500 to $799 | 4 (15.4%) | 0 (0.0%) |
| $800 to $999 | 0 (0.0%) | 0 (0.0%) |
| $1,000 to $1,499 | 5 (19.2%) | 0 (0.0%) |
| $1,500 to $1,999 | 0 (0.0%) | 0 (0.0%) |
| $2,000 to $2,499 | 0 (0.0%) | 0 (0.0%) |
| $2,500 to $2,999 | 0 (0.0%) | 0 (0.0%) |
| $3,000 or more | 0 (0.0%) | 0 (0.0%) |
| Total | 26 (100.0%) | 2 (100.0%) |
Physical Housing Characteristics in Gerty
Housing Structures in Gerty
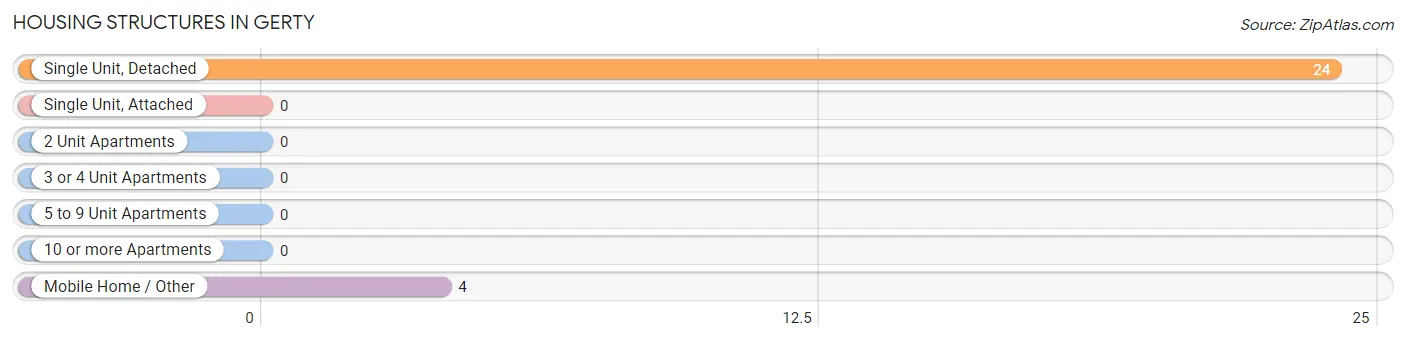
| Structure Type | # Housing Units | % Housing Units |
| Single Unit, Detached | 24 | 85.7% |
| Single Unit, Attached | 0 | 0.0% |
| 2 Unit Apartments | 0 | 0.0% |
| 3 or 4 Unit Apartments | 0 | 0.0% |
| 5 to 9 Unit Apartments | 0 | 0.0% |
| 10 or more Apartments | 0 | 0.0% |
| Mobile Home / Other | 4 | 14.3% |
| Total | 28 | 100.0% |
Housing Structures by Occupancy in Gerty
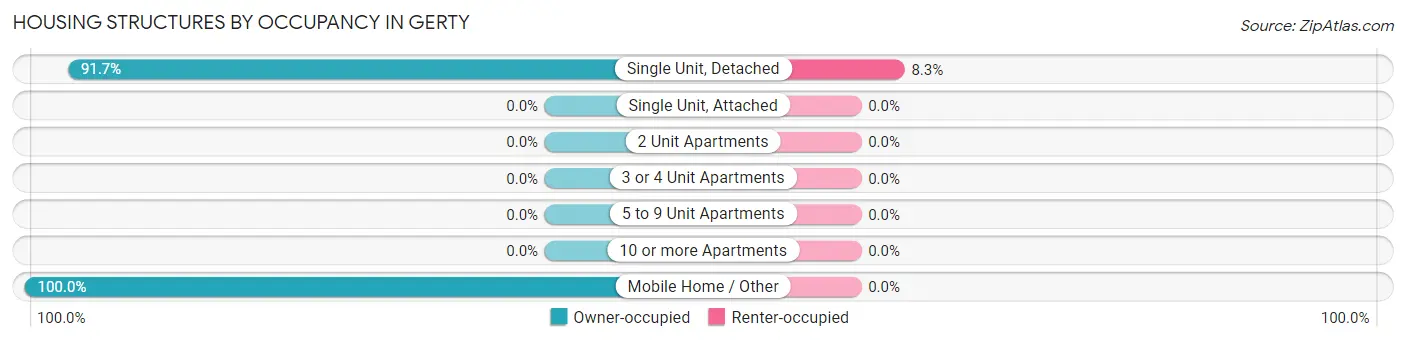
| Structure Type | Owner-occupied | Renter-occupied |
| Single Unit, Detached | 22 (91.7%) | 2 (8.3%) |
| Single Unit, Attached | 0 (0.0%) | 0 (0.0%) |
| 2 Unit Apartments | 0 (0.0%) | 0 (0.0%) |
| 3 or 4 Unit Apartments | 0 (0.0%) | 0 (0.0%) |
| 5 to 9 Unit Apartments | 0 (0.0%) | 0 (0.0%) |
| 10 or more Apartments | 0 (0.0%) | 0 (0.0%) |
| Mobile Home / Other | 4 (100.0%) | 0 (0.0%) |
| Total | 26 (92.9%) | 2 (7.1%) |
Housing Structures by Number of Rooms in Gerty
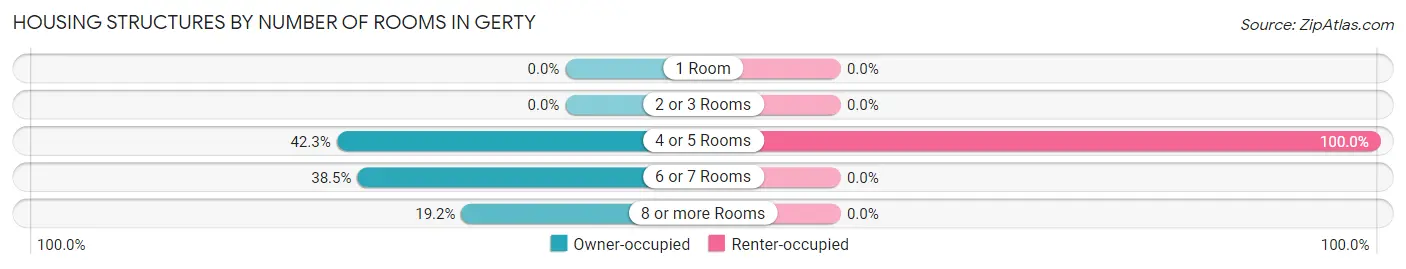
| Number of Rooms | Owner-occupied | Renter-occupied |
| 1 Room | 0 (0.0%) | 0 (0.0%) |
| 2 or 3 Rooms | 0 (0.0%) | 0 (0.0%) |
| 4 or 5 Rooms | 11 (42.3%) | 2 (100.0%) |
| 6 or 7 Rooms | 10 (38.5%) | 0 (0.0%) |
| 8 or more Rooms | 5 (19.2%) | 0 (0.0%) |
| Total | 26 (100.0%) | 2 (100.0%) |
Housing Structure by Heating Type in Gerty
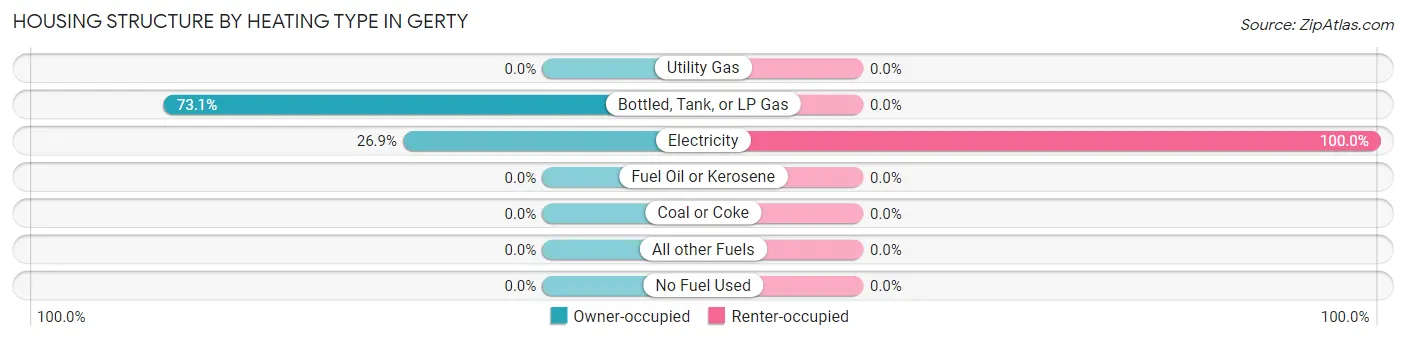
| Heating Type | Owner-occupied | Renter-occupied |
| Utility Gas | 0 (0.0%) | 0 (0.0%) |
| Bottled, Tank, or LP Gas | 19 (73.1%) | 0 (0.0%) |
| Electricity | 7 (26.9%) | 2 (100.0%) |
| Fuel Oil or Kerosene | 0 (0.0%) | 0 (0.0%) |
| Coal or Coke | 0 (0.0%) | 0 (0.0%) |
| All other Fuels | 0 (0.0%) | 0 (0.0%) |
| No Fuel Used | 0 (0.0%) | 0 (0.0%) |
| Total | 26 (100.0%) | 2 (100.0%) |
Household Vehicle Usage in Gerty
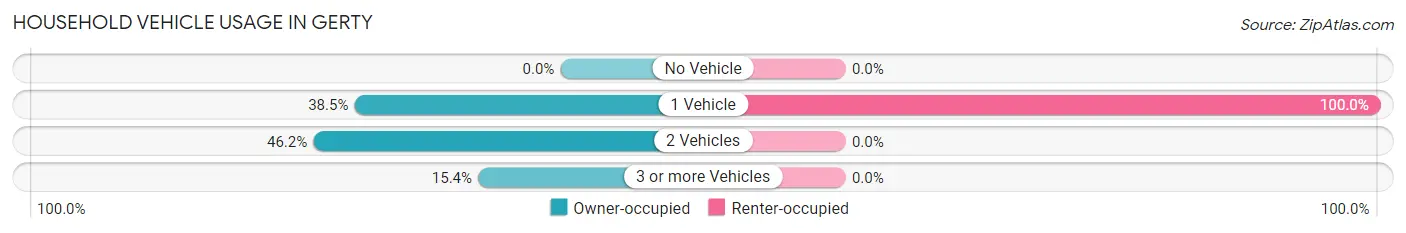
| Vehicles per Household | Owner-occupied | Renter-occupied |
| No Vehicle | 0 (0.0%) | 0 (0.0%) |
| 1 Vehicle | 10 (38.5%) | 2 (100.0%) |
| 2 Vehicles | 12 (46.2%) | 0 (0.0%) |
| 3 or more Vehicles | 4 (15.4%) | 0 (0.0%) |
| Total | 26 (100.0%) | 2 (100.0%) |
Real Estate & Mortgages in Gerty
Real Estate and Mortgage Overview in Gerty
| Characteristic | Without Mortgage | With Mortgage |
| Housing Units | 18 | 8 |
| Median Property Value | $60,000 | $112,500 |
| Median Household Income | $111,250 | $1 |
| Monthly Housing Costs | $433 | $0 |
| Real Estate Taxes | $271 | $2 |
Property Value by Mortgage Status in Gerty
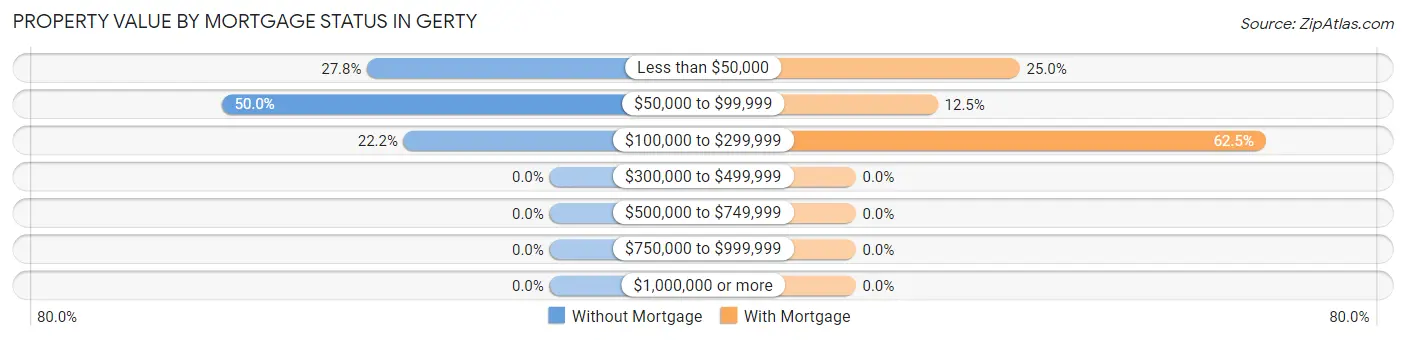
| Property Value | Without Mortgage | With Mortgage |
| Less than $50,000 | 5 (27.8%) | 2 (25.0%) |
| $50,000 to $99,999 | 9 (50.0%) | 1 (12.5%) |
| $100,000 to $299,999 | 4 (22.2%) | 5 (62.5%) |
| $300,000 to $499,999 | 0 (0.0%) | 0 (0.0%) |
| $500,000 to $749,999 | 0 (0.0%) | 0 (0.0%) |
| $750,000 to $999,999 | 0 (0.0%) | 0 (0.0%) |
| $1,000,000 or more | 0 (0.0%) | 0 (0.0%) |
| Total | 18 (100.0%) | 8 (100.0%) |
Household Income by Mortgage Status in Gerty
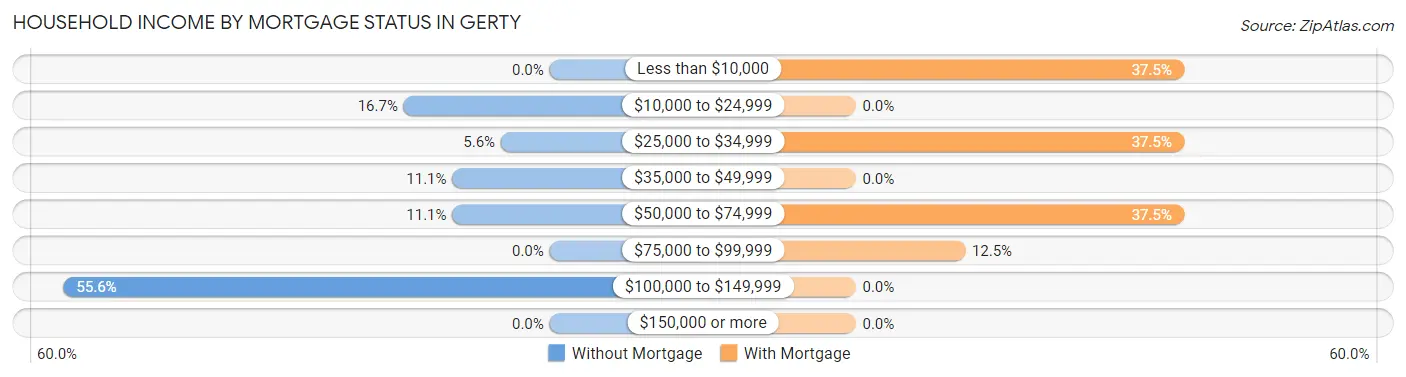
| Household Income | Without Mortgage | With Mortgage |
| Less than $10,000 | 0 (0.0%) | 3 (37.5%) |
| $10,000 to $24,999 | 3 (16.7%) | 0 (0.0%) |
| $25,000 to $34,999 | 1 (5.6%) | 3 (37.5%) |
| $35,000 to $49,999 | 2 (11.1%) | 0 (0.0%) |
| $50,000 to $74,999 | 2 (11.1%) | 3 (37.5%) |
| $75,000 to $99,999 | 0 (0.0%) | 1 (12.5%) |
| $100,000 to $149,999 | 10 (55.6%) | 0 (0.0%) |
| $150,000 or more | 0 (0.0%) | 0 (0.0%) |
| Total | 18 (100.0%) | 8 (100.0%) |
Property Value to Household Income Ratio in Gerty
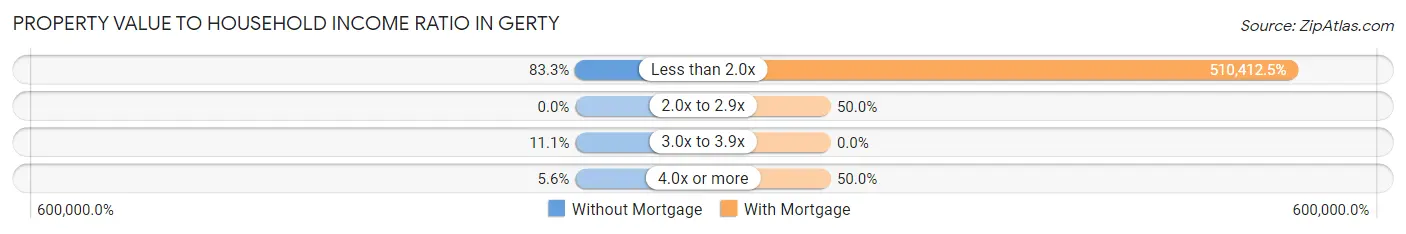
| Value-to-Income Ratio | Without Mortgage | With Mortgage |
| Less than 2.0x | 15 (83.3%) | 40,833 (510,412.5%) |
| 2.0x to 2.9x | 0 (0.0%) | 4 (50.0%) |
| 3.0x to 3.9x | 2 (11.1%) | 0 (0.0%) |
| 4.0x or more | 1 (5.6%) | 4 (50.0%) |
| Total | 18 (100.0%) | 8 (100.0%) |
Real Estate Taxes by Mortgage Status in Gerty
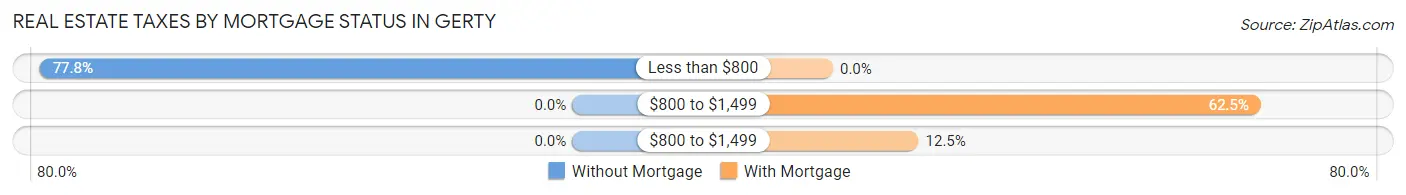
| Property Taxes | Without Mortgage | With Mortgage |
| Less than $800 | 14 (77.8%) | 0 (0.0%) |
| $800 to $1,499 | 0 (0.0%) | 5 (62.5%) |
| $800 to $1,499 | 0 (0.0%) | 1 (12.5%) |
| Total | 18 (100.0%) | 8 (100.0%) |
Health & Disability in Gerty
Health Insurance Coverage by Age in Gerty
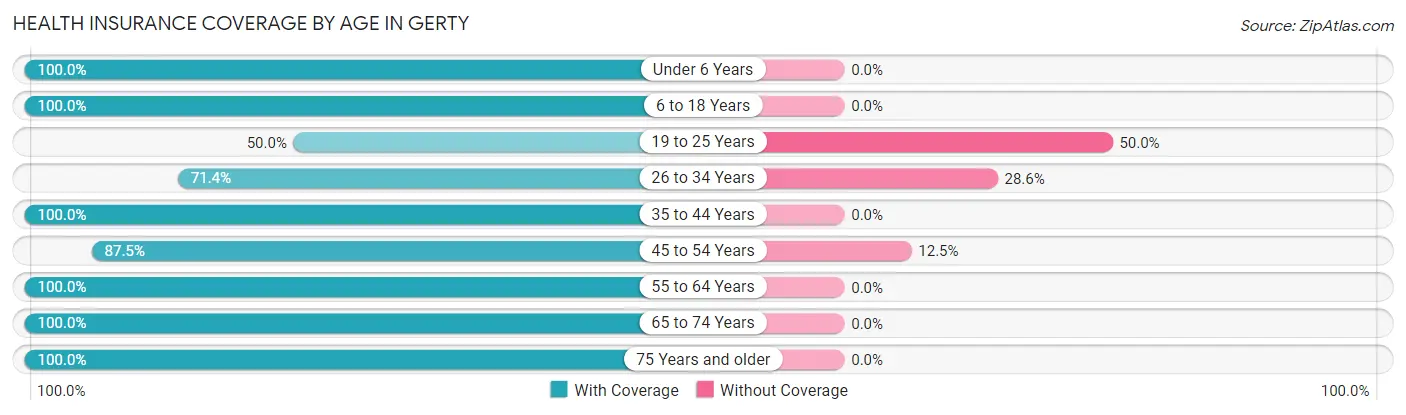
| Age Bracket | With Coverage | Without Coverage |
| Under 6 Years | 4 (100.0%) | 0 (0.0%) |
| 6 to 18 Years | 3 (100.0%) | 0 (0.0%) |
| 19 to 25 Years | 1 (50.0%) | 1 (50.0%) |
| 26 to 34 Years | 15 (71.4%) | 6 (28.6%) |
| 35 to 44 Years | 5 (100.0%) | 0 (0.0%) |
| 45 to 54 Years | 7 (87.5%) | 1 (12.5%) |
| 55 to 64 Years | 8 (100.0%) | 0 (0.0%) |
| 65 to 74 Years | 9 (100.0%) | 0 (0.0%) |
| 75 Years and older | 21 (100.0%) | 0 (0.0%) |
| Total | 73 (90.1%) | 8 (9.9%) |
Health Insurance Coverage by Citizenship Status in Gerty
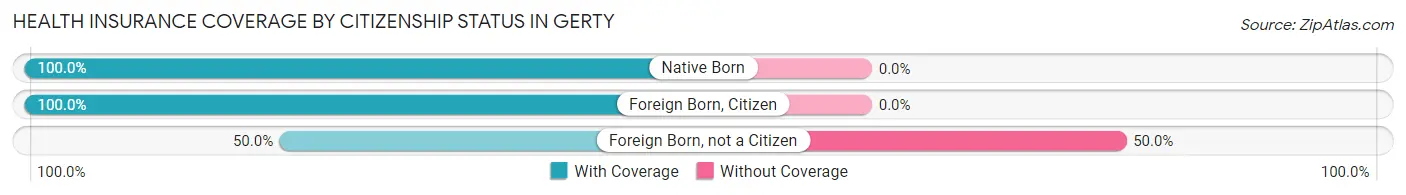
| Citizenship Status | With Coverage | Without Coverage |
| Native Born | 4 (100.0%) | 0 (0.0%) |
| Foreign Born, Citizen | 3 (100.0%) | 0 (0.0%) |
| Foreign Born, not a Citizen | 1 (50.0%) | 1 (50.0%) |
Health Insurance Coverage by Household Income in Gerty
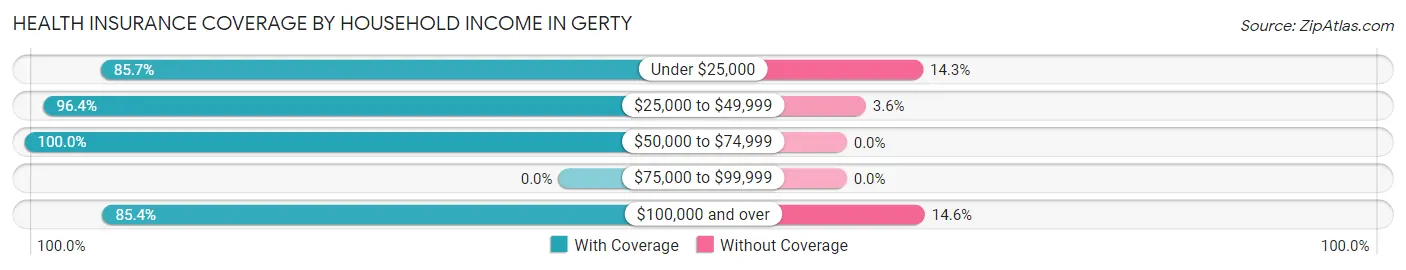
| Household Income | With Coverage | Without Coverage |
| Under $25,000 | 6 (85.7%) | 1 (14.3%) |
| $25,000 to $49,999 | 27 (96.4%) | 1 (3.6%) |
| $50,000 to $74,999 | 5 (100.0%) | 0 (0.0%) |
| $75,000 to $99,999 | 0 (0.0%) | 0 (0.0%) |
| $100,000 and over | 35 (85.4%) | 6 (14.6%) |
Public vs Private Health Insurance Coverage by Age in Gerty
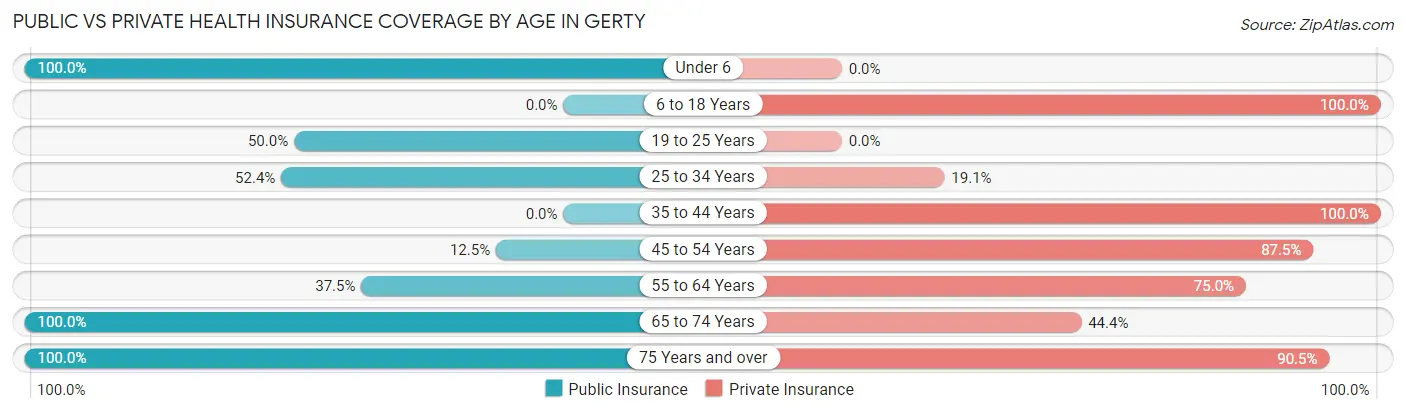
| Age Bracket | Public Insurance | Private Insurance |
| Under 6 | 4 (100.0%) | 0 (0.0%) |
| 6 to 18 Years | 0 (0.0%) | 3 (100.0%) |
| 19 to 25 Years | 1 (50.0%) | 0 (0.0%) |
| 25 to 34 Years | 11 (52.4%) | 4 (19.1%) |
| 35 to 44 Years | 0 (0.0%) | 5 (100.0%) |
| 45 to 54 Years | 1 (12.5%) | 7 (87.5%) |
| 55 to 64 Years | 3 (37.5%) | 6 (75.0%) |
| 65 to 74 Years | 9 (100.0%) | 4 (44.4%) |
| 75 Years and over | 21 (100.0%) | 19 (90.5%) |
| Total | 50 (61.7%) | 48 (59.3%) |
Disability Status by Sex by Age in Gerty
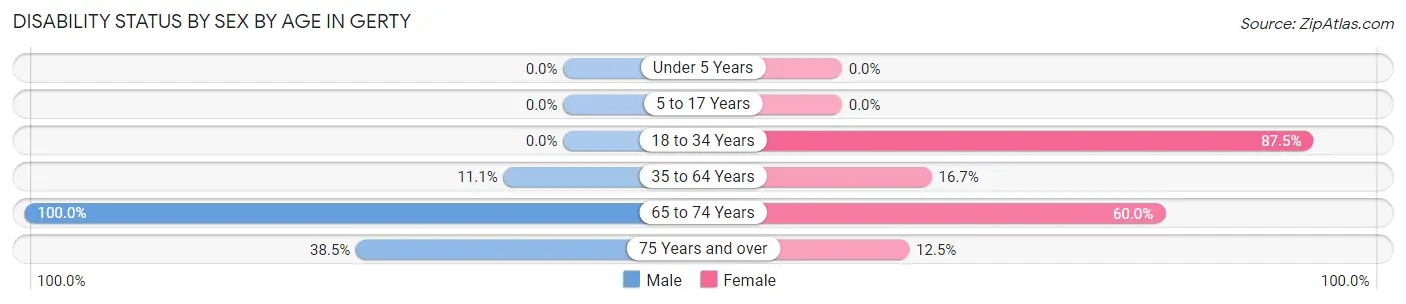
| Age Bracket | Male | Female |
| Under 5 Years | 0 (0.0%) | 0 (0.0%) |
| 5 to 17 Years | 0 (0.0%) | 0 (0.0%) |
| 18 to 34 Years | 0 (0.0%) | 7 (87.5%) |
| 35 to 64 Years | 1 (11.1%) | 2 (16.7%) |
| 65 to 74 Years | 4 (100.0%) | 3 (60.0%) |
| 75 Years and over | 5 (38.5%) | 1 (12.5%) |
Disability Class by Sex by Age in Gerty
Disability Class: Hearing Difficulty
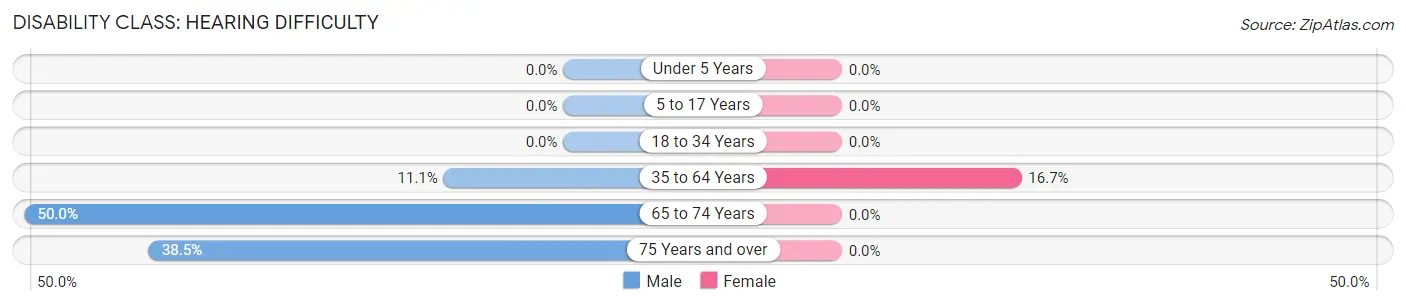
| Age Bracket | Male | Female |
| Under 5 Years | 0 (0.0%) | 0 (0.0%) |
| 5 to 17 Years | 0 (0.0%) | 0 (0.0%) |
| 18 to 34 Years | 0 (0.0%) | 0 (0.0%) |
| 35 to 64 Years | 1 (11.1%) | 2 (16.7%) |
| 65 to 74 Years | 2 (50.0%) | 0 (0.0%) |
| 75 Years and over | 5 (38.5%) | 0 (0.0%) |
Disability Class: Vision Difficulty
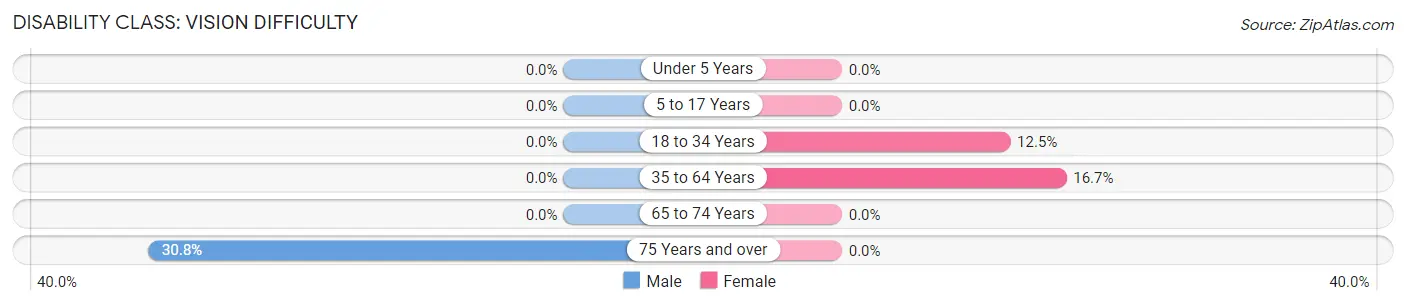
| Age Bracket | Male | Female |
| Under 5 Years | 0 (0.0%) | 0 (0.0%) |
| 5 to 17 Years | 0 (0.0%) | 0 (0.0%) |
| 18 to 34 Years | 0 (0.0%) | 1 (12.5%) |
| 35 to 64 Years | 0 (0.0%) | 2 (16.7%) |
| 65 to 74 Years | 0 (0.0%) | 0 (0.0%) |
| 75 Years and over | 4 (30.8%) | 0 (0.0%) |
Disability Class: Cognitive Difficulty
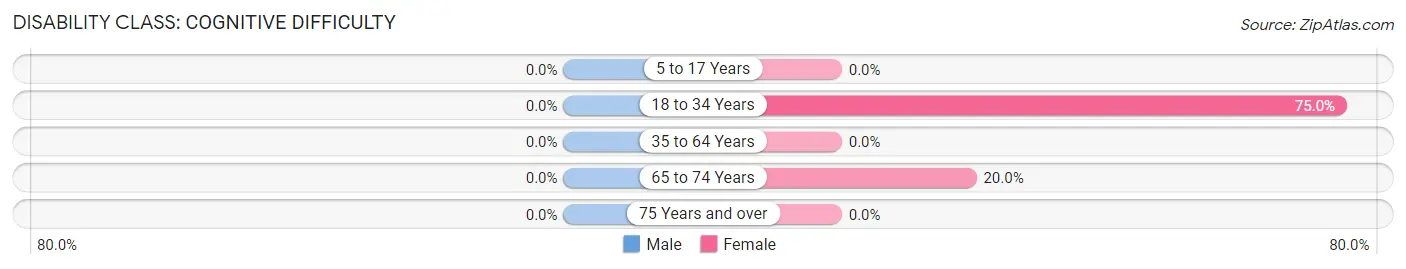
| Age Bracket | Male | Female |
| 5 to 17 Years | 0 (0.0%) | 0 (0.0%) |
| 18 to 34 Years | 0 (0.0%) | 6 (75.0%) |
| 35 to 64 Years | 0 (0.0%) | 0 (0.0%) |
| 65 to 74 Years | 0 (0.0%) | 1 (20.0%) |
| 75 Years and over | 0 (0.0%) | 0 (0.0%) |
Disability Class: Ambulatory Difficulty
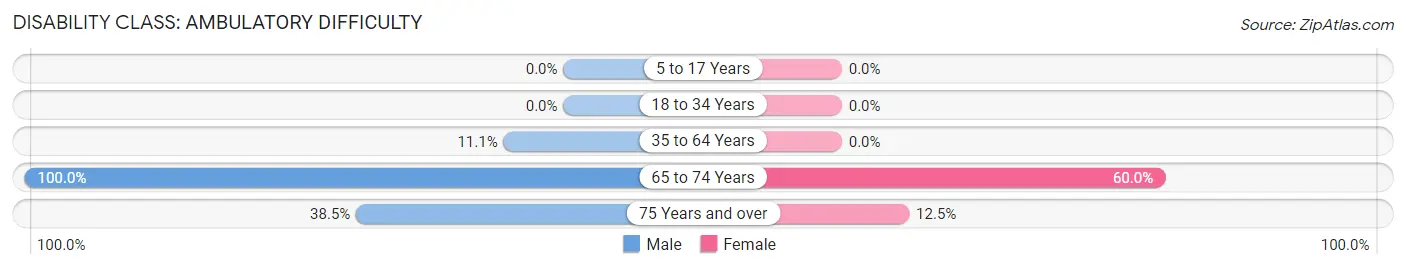
| Age Bracket | Male | Female |
| 5 to 17 Years | 0 (0.0%) | 0 (0.0%) |
| 18 to 34 Years | 0 (0.0%) | 0 (0.0%) |
| 35 to 64 Years | 1 (11.1%) | 0 (0.0%) |
| 65 to 74 Years | 4 (100.0%) | 3 (60.0%) |
| 75 Years and over | 5 (38.5%) | 1 (12.5%) |
Disability Class: Self-Care Difficulty
| Age Bracket | Male | Female |
| 5 to 17 Years | 0 (0.0%) | 0 (0.0%) |
| 18 to 34 Years | 0 (0.0%) | 0 (0.0%) |
| 35 to 64 Years | 0 (0.0%) | 0 (0.0%) |
| 65 to 74 Years | 0 (0.0%) | 0 (0.0%) |
| 75 Years and over | 0 (0.0%) | 0 (0.0%) |
Technology Access in Gerty
Computing Device Access in Gerty
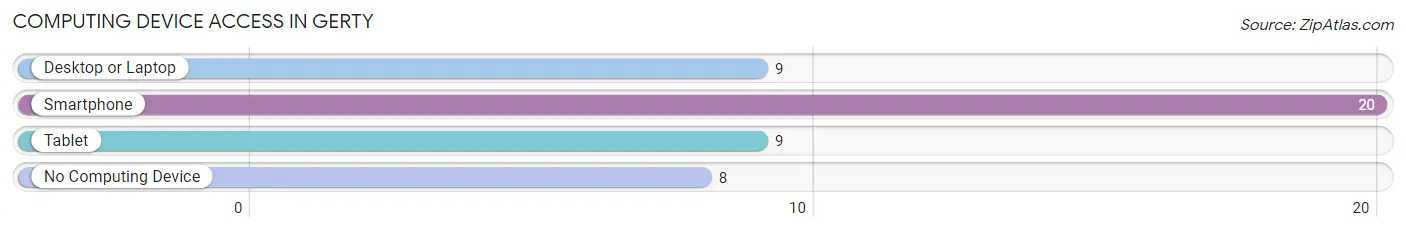
| Device Type | # Households | % Households |
| Desktop or Laptop | 9 | 32.1% |
| Smartphone | 20 | 71.4% |
| Tablet | 9 | 32.1% |
| No Computing Device | 8 | 28.6% |
| Total | 28 | 100.0% |
Internet Access in Gerty
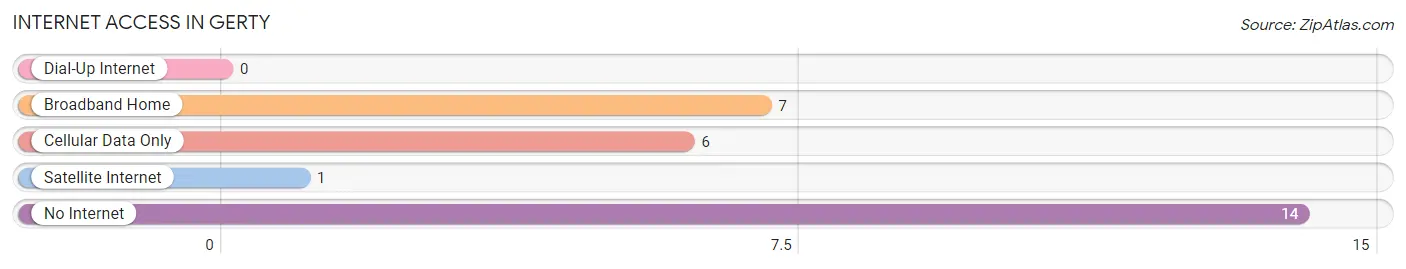
| Internet Type | # Households | % Households |
| Dial-Up Internet | 0 | 0.0% |
| Broadband Home | 7 | 25.0% |
| Cellular Data Only | 6 | 21.4% |
| Satellite Internet | 1 | 3.6% |
| No Internet | 14 | 50.0% |
| Total | 28 | 100.0% |
Gerty Summary
Oklahoma is a state located in the South Central region of the United States. It is bordered by Texas to the south, Arkansas to the east, Kansas to the north, and Colorado and New Mexico to the west. Oklahoma is the 20th most extensive and the 28th most populous of the 50 United States. The state's name is derived from the Choctaw words okla and humma, meaning "red people". It is also known informally by its nickname, The Sooner State, in reference to the non-Native settlers who staked their claims on the choicest pieces of land before the official opening date of lands in the western Oklahoma Territory or before the Indian Appropriations Act of 1889, which increased European-American settlement in the eastern Indian Territory.
History
Oklahoma has a rich and varied history. The area was first inhabited by Native American tribes, including the Caddo, Comanche, Osage, and Quapaw. The first European to visit the area was Spanish explorer Francisco Vásquez de Coronado in 1541. In the early 1800s, the area was part of the Louisiana Purchase, and in 1803, the United States acquired the area from France.
In 1819, the United States established the Arkansas Territory, which included the area that would become Oklahoma. In 1834, the Choctaw Nation was established in the area, and in 1866, the United States established the Indian Territory, which included the area that would become Oklahoma.
In 1889, the United States opened the area to non-Native settlers, and the Oklahoma Territory was established. In 1907, Oklahoma became the 46th state in the Union.
Geography
Oklahoma is located in the South Central region of the United States. It is bordered by Texas to the south, Arkansas to the east, Kansas to the north, and Colorado and New Mexico to the west. Oklahoma is the 20th most extensive and the 28th most populous of the 50 United States.
The state is divided into 77 counties and contains five primary physiographic regions: the Ozark Mountains in the northeast, the Ouachita Mountains in the southeast, the Arbuckle Mountains in the south-central region, the Wichita Mountains in the southwest, and the Great Plains in the northwest.
Economy
Oklahoma's economy is largely based on the energy industry, with oil and natural gas production being the largest contributors. Other major industries include agriculture, manufacturing, and tourism.
Agriculture is a major part of Oklahoma's economy, with wheat, cotton, hay, and sorghum being the state's top crops. Livestock production is also important, with cattle, hogs, and poultry being the top animals raised.
Manufacturing is also an important part of Oklahoma's economy, with food processing, aerospace, and transportation equipment being the top industries.
Tourism is also an important part of Oklahoma's economy, with attractions such as the Oklahoma City National Memorial, the National Cowboy & Western Heritage Museum, and the Tulsa Zoo.
Demographics
As of the 2010 census, Oklahoma had a population of 3,751,616. The state is divided into 77 counties and contains five primary physiographic regions.
The largest ethnic group in Oklahoma is White (72.1%), followed by American Indian and Alaska Native (10.9%), Hispanic or Latino (8.2%), Black or African American (7.3%), and Asian (2.2%). The state's population is also diverse in terms of religion, with Protestant (50.2%), Catholic (20.2%), and Other (29.6%) being the top three religious affiliations.
The median household income in Oklahoma is $48,568, and the median age is 36.7. The state's poverty rate is 16.2%, and the unemployment rate is 4.2%.
Common Questions
What is Per Capita Income in Gerty?
Per Capita income in Gerty is $25,486.
What is Inequality or Gini Index in Gerty?
Inequality or Gini Index in Gerty is 0.37.
What is the Total Population of Gerty?
Total Population of Gerty is 81.
What is the Total Male Population of Gerty?
Total Male Population of Gerty is 46.
What is the Total Female Population of Gerty?
Total Female Population of Gerty is 35.
What is the Ratio of Males per 100 Females in Gerty?
There are 131.43 Males per 100 Females in Gerty.
What is the Ratio of Females per 100 Males in Gerty?
There are 76.09 Females per 100 Males in Gerty.
What is the Median Population Age in Gerty?
Median Population Age in Gerty is 53.2 Years.
What is the Average Family Size in Gerty
Average Family Size in Gerty is 2.7 People.
What is the Average Household Size in Gerty
Average Household Size in Gerty is 2.9 People.
How Large is the Labor Force in Gerty?
There are 27 People in the Labor Forcein in Gerty.
What is the Percentage of People in the Labor Force in Gerty?
35.1% of People are in the Labor Force in Gerty.
What is the Unemployment Rate in Gerty?
Unemployment Rate in Gerty is 3.7%.