Zip Codes with the Highest Percentage of Population with a Degree in Education in Oklahoma City, OK

RELATED REPORTS & OPTIONS

Education
Population
Families and Households
Female Fertility
Female Fertility (Unmarried)
Race (Community Size)
Race (Percentage)
Ancestry (Community Size)
AfricanAlaska NativeAlbanianAmericanApacheArabArapahoArgentineanArmenianAustralianAustrianBahamianBangladeshiBarbadianBasqueBelgianBhutaneseBlackfeetBolivianBrazilianBritishBritish West IndianBulgarianBurmeseCajunCambodianCanadianCelticCentral AmericanCentral American IndianCherokeeCheyenneChickasawChileanChippewaChoctawColombianComancheCreeCreekCroatianCubanCzechCzechoslovakianDanishDelawareDominicanDutchDutch West IndianEastern EuropeanEcuadorianEgyptianEnglishEstonianEthiopianEuropeanFijianFilipinoFinnishFrenchFrench American IndianFrench CanadianGermanGerman RussianGhanaianGreekGuamanian / ChamorroGuatemalanGuyaneseHaitianHonduranHopiHungarianIcelanderIndian (Asian)IndonesianInupiatIranianIraqiIrishIroquoisIsraeliItalianJamaicanJapaneseJordanianKenyanKiowaKoreanLaotianLatvianLebaneseLiberianLithuanianLuxembourgerMalaysianMexicanMexican American IndianMongolianMoroccanNative HawaiianNavajoNew ZealanderNicaraguanNigerianNorthern EuropeanNorwegianOkinawanOsagePakistaniPalestinianPanamanianPennsylvania GermanPeruvianPimaPolishPortuguesePotawatomiPuebloPuerto RicanRomanianRussianSalvadoranSamoanScandinavianScotch-IrishScottishSeminoleSerbianSiouxSlavicSlovakSloveneSouth AfricanSouth AmericanSouth American IndianSpaniardSpanishSpanish American IndianSri LankanSubsaharan AfricanSudaneseSwedishSwissSyrianThaiTlingit-HaidaTonganTrinidadian and TobagonianTurkishU.S. Virgin IslanderUkrainianUruguayanVenezuelanVietnameseWelshWest IndianYugoslavianZimbabwean
Ancestry (Percentage)
AfricanAlaska NativeAlbanianAmericanApacheArabArapahoArgentineanArmenianAustralianAustrianBahamianBangladeshiBarbadianBasqueBelgianBhutaneseBlackfeetBolivianBrazilianBritishBritish West IndianBulgarianBurmeseCajunCambodianCanadianCelticCentral AmericanCentral American IndianCherokeeCheyenneChickasawChileanChippewaChoctawColombianComancheCreeCreekCroatianCubanCzechCzechoslovakianDanishDelawareDominicanDutchDutch West IndianEastern EuropeanEcuadorianEgyptianEnglishEstonianEthiopianEuropeanFijianFilipinoFinnishFrenchFrench American IndianFrench CanadianGermanGerman RussianGhanaianGreekGuamanian / ChamorroGuatemalanGuyaneseHaitianHonduranHopiHungarianIcelanderIndian (Asian)IndonesianInupiatIranianIraqiIrishIroquoisIsraeliItalianJamaicanJapaneseJordanianKenyanKiowaKoreanLaotianLatvianLebaneseLiberianLithuanianLuxembourgerMalaysianMexicanMexican American IndianMongolianMoroccanNative HawaiianNavajoNew ZealanderNicaraguanNigerianNorthern EuropeanNorwegianOkinawanOsagePakistaniPalestinianPanamanianPennsylvania GermanPeruvianPimaPolishPortuguesePotawatomiPuebloPuerto RicanRomanianRussianSalvadoranSamoanScandinavianScotch-IrishScottishSeminoleSerbianSiouxSlavicSlovakSloveneSouth AfricanSouth AmericanSouth American IndianSpaniardSpanishSpanish American IndianSri LankanSubsaharan AfricanSudaneseSwedishSwissSyrianThaiTlingit-HaidaTonganTrinidadian and TobagonianTurkishU.S. Virgin IslanderUkrainianUruguayanVenezuelanVietnameseWelshWest IndianYugoslavianZimbabwean
Immigrant Origin (Total)
AfricaArgentinaAsiaAustraliaAustriaBahamasBangladeshBosnia and HerzegovinaBrazilBulgariaBurma / MyanmarCambodiaCameroonCanadaCaribbeanCentral AmericaChileChinaColombiaCubaDominican RepublicEastern AfricaEastern AsiaEastern EuropeEcuadorEgyptEl SalvadorEnglandEritreaEthiopiaEuropeFranceGermanyGhanaGreeceGuatemalaHondurasHong KongIndiaIndonesiaIranIraqIrelandItalyJamaicaJapanJordanKazakhstanKenyaKoreaKuwaitLaosLatin AmericaLebanonLiberiaMalaysiaMexicoMiddle AfricaMoroccoNepalNetherlandsNicaraguaNigeriaNorthern AfricaNorthern EuropeNorwayOceaniaPakistanPanamaPeruPhilippinesPolandPortugalRussiaSaudi ArabiaScotlandSingaporeSouth AfricaSouth AmericaSouth Central AsiaSouth Eastern AsiaSouthern EuropeSpainSudanSyriaTaiwanThailandTrinidad and TobagoTurkeyUkraineVenezuelaVietnamWestern AfricaWestern AsiaWestern EuropeZaireZimbabwe
Immigrant Origin (Percentage)
AfricaArgentinaAsiaAustraliaAustriaBahamasBangladeshBosnia and HerzegovinaBrazilBulgariaBurma / MyanmarCambodiaCameroonCanadaCaribbeanCentral AmericaChileChinaColombiaCubaDominican RepublicEastern AfricaEastern AsiaEastern EuropeEcuadorEgyptEl SalvadorEnglandEritreaEthiopiaEuropeFranceGermanyGhanaGreeceGuatemalaHondurasHong KongIndiaIndonesiaIranIraqIrelandItalyJamaicaJapanJordanKazakhstanKenyaKoreaKuwaitLaosLatin AmericaLebanonLiberiaMalaysiaMexicoMiddle AfricaMoroccoNepalNetherlandsNicaraguaNigeriaNorthern AfricaNorthern EuropeNorwayOceaniaPakistanPanamaPeruPhilippinesPolandPortugalRussiaSaudi ArabiaScotlandSingaporeSouth AfricaSouth AmericaSouth Central AsiaSouth Eastern AsiaSouthern EuropeSpainSudanSyriaTaiwanThailandTrinidad and TobagoTurkeyUkraineVenezuelaVietnamWestern AfricaWestern AsiaWestern EuropeZaireZimbabwe
Income
Income (Families)
Income (Households)
Poverty
Poverty (Families)
Unemployment
Employment Occupations
Employment Industries
Employer Class
Commute Time
Commute Means
School Enrollment
Education by Degree Field
Occupancy
Finances
Physical Characteristics
Oklahoma City
Compare Zip Codes
Comparison Subject

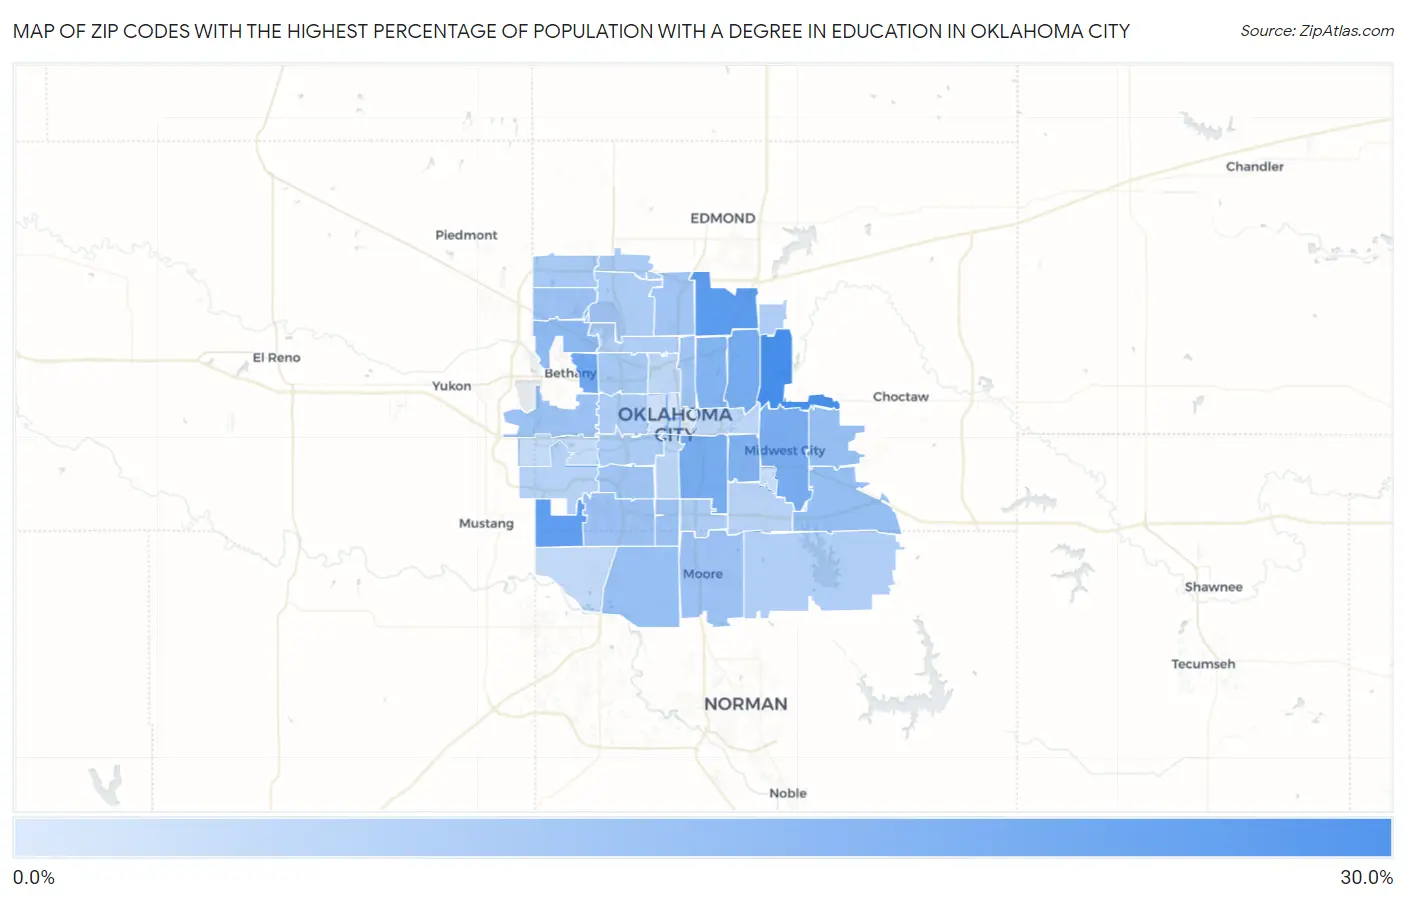
Map of Zip Codes with the Highest Percentage of Population with a Degree in Education in Oklahoma City

0.0%
30.0%
Zip Codes with the Highest Percentage of Population with a Degree in Education in Oklahoma City Map

Zip Codes with the Highest Percentage of Population with a Degree in Education in Oklahoma City, OK

Zip Code % Graduates vs State vs National
1.7314126.7%16.7%(+10.1)#25011.1%(+15.7)#5,910
2.7313123.6%16.7%(+6.90)#31511.1%(+12.5)#7,812
3.7316922.5%16.7%(+5.82)#33111.1%(+11.4)#8,561
4.7312219.5%16.7%(+2.80)#39311.1%(+8.42)#11,004
5.7312119.0%16.7%(+2.28)#40411.1%(+7.91)#11,429
6.7312918.4%16.7%(+1.70)#41211.1%(+7.32)#12,000
7.7311018.2%16.7%(+1.54)#41511.1%(+7.17)#12,149
8.7311517.0%16.7%(+0.285)#43811.1%(+5.91)#13,457
9.7311116.6%16.7%(-0.072)#44311.1%(+5.55)#13,885
10.7313214.6%16.7%(-2.09)#47611.1%(+3.54)#16,199
11.7315013.6%16.7%(-3.08)#49811.1%(+2.55)#17,525
12.7313013.4%16.7%(-3.28)#50111.1%(+2.35)#17,751
13.7317013.2%16.7%(-3.46)#50911.1%(+2.17)#17,971
14.7315912.8%16.7%(-3.84)#51811.1%(+1.79)#18,453
15.7316212.7%16.7%(-4.03)#52211.1%(+1.59)#18,695
16.7312712.6%16.7%(-4.08)#52411.1%(+1.55)#18,757
17.7313912.4%16.7%(-4.26)#52711.1%(+1.37)#19,027
18.7316012.4%16.7%(-4.27)#52811.1%(+1.36)#19,046
19.7310512.0%16.7%(-4.68)#53711.1%(+0.946)#19,613
20.7311411.8%16.7%(-4.87)#54011.1%(+0.759)#19,873
21.7311911.8%16.7%(-4.87)#54111.1%(+0.757)#19,876
22.7311210.8%16.7%(-5.85)#55211.1%(-0.223)#21,176
23.7314210.8%16.7%(-5.87)#55311.1%(-0.242)#21,205
24.7313410.5%16.7%(-6.21)#55711.1%(-0.579)#21,690
25.7310710.1%16.7%(-6.58)#56211.1%(-0.954)#22,194
26.7312010.0%16.7%(-6.68)#56311.1%(-1.06)#22,321
27.7310810.0%16.7%(-6.69)#56411.1%(-1.06)#22,325
28.7314910.0%16.7%(-6.69)#56511.1%(-1.06)#22,327
29.731169.7%16.7%(-6.95)#57011.1%(-1.33)#22,703
30.731519.5%16.7%(-7.15)#57411.1%(-1.53)#22,970
31.731659.3%16.7%(-7.36)#57811.1%(-1.74)#23,275
32.731798.5%16.7%(-8.21)#58511.1%(-2.58)#24,307
33.731358.2%16.7%(-8.47)#58911.1%(-2.85)#24,624
34.731097.9%16.7%(-8.75)#59211.1%(-3.12)#24,954
35.731187.7%16.7%(-8.97)#59411.1%(-3.34)#25,166
36.731177.6%16.7%(-9.08)#59611.1%(-3.45)#25,269
37.731736.7%16.7%(-9.95)#60211.1%(-4.32)#26,182
38.731286.3%16.7%(-10.3)#60411.1%(-4.72)#26,525
39.731456.1%16.7%(-10.6)#60611.1%(-5.01)#26,790
40.731025.4%16.7%(-11.3)#60911.1%(-5.63)#27,263
41.731064.8%16.7%(-11.9)#61111.1%(-6.27)#27,693
42.731034.2%16.7%(-12.5)#61411.1%(-6.84)#28,049
43.731042.8%16.7%(-13.8)#61611.1%(-8.21)#28,751

Common Questions

What are the Top 10 Zip Codes with the Highest Percentage of Population with a Degree in Education in Oklahoma City, OK?
Top 10 Zip Codes with the Highest Percentage of Population with a Degree in Education in Oklahoma City, OK are:
#1
26.7%
#2
23.6%
#3
22.5%
#4
19.5%
#5
19.0%
#6
18.4%
#7
18.2%
#8
17.0%
#9
16.6%
#10
14.6%
What zip code has the Highest Percentage of Population with a Degree in Education in Oklahoma City, OK?
73141 has the Highest Percentage of Population with a Degree in Education in Oklahoma City, OK with 26.7%.
What is the Percentage of Population with a Degree in Education in Oklahoma City, OK?
Percentage of Population with a Degree in Education in Oklahoma City is 11.1%.
What is the Percentage of Population with a Degree in Education in Oklahoma?
Percentage of Population with a Degree in Education in Oklahoma is 16.7%.
What is the Percentage of Population with a Degree in Education in the United States?
Percentage of Population with a Degree in Education in the United States is 11.1%.