May, OK Map & Demographics
May Map
May Overview
$18,636
PER CAPITA INCOME
$31,000
AVG FAMILY INCOME
$40,750
AVG HOUSEHOLD INCOME
0.34
INEQUALITY / GINI INDEX
39
TOTAL POPULATION
17
MALE POPULATION
22
FEMALE POPULATION
77.27
MALES / 100 FEMALES
129.41
FEMALES / 100 MALES
34.1
MEDIAN AGE
3.2
AVG FAMILY SIZE
3.0
AVG HOUSEHOLD SIZE
13
LABOR FORCE [ PEOPLE ]
33.3%
PERCENT IN LABOR FORCE
38.5%
UNEMPLOYMENT RATE
May Zip Codes
May Area Codes
Income in May
Income Overview in May
Per Capita Income in May is $18,636, while median incomes of families and households are $31,000 and $40,750 respectively.
| Characteristic | Number | Measure |
| Per Capita Income | 39 | $18,636 |
| Median Family Income | 6 | $31,000 |
| Mean Family Income | 6 | $29,750 |
| Median Household Income | 13 | $40,750 |
| Mean Household Income | 13 | $51,115 |
| Income Deficit | 6 | $0 |
| Wage / Income Gap (%) | 39 | 0.00% |
| Wage / Income Gap ($) | 39 | 100.00¢ per $1 |
| Gini / Inequality Index | 39 | 0.34 |
Earnings by Sex in May
| Sex | Number | Average Earnings |
| Male | 5 (62.5%) | $0 |
| Female | 3 (37.5%) | $0 |
| Total | 8 (100.0%) | $0 |
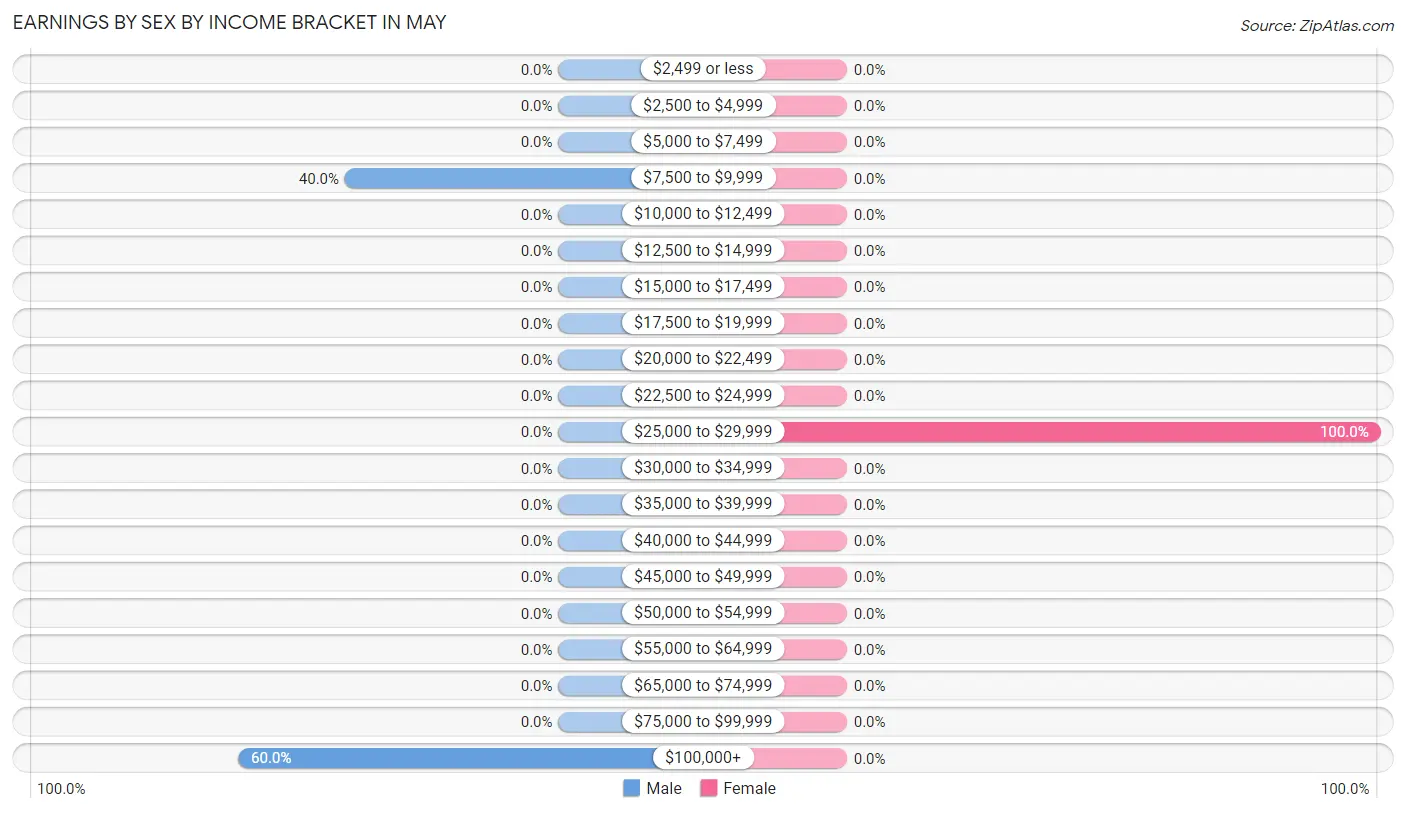
Earnings by Sex by Income Bracket in May
The most common earnings brackets in May are $100,000+ for men (3 | 60.0%) and $25,000 to $29,999 for women (3 | 100.0%).
| Income | Male | Female |
| $2,499 or less | 0 (0.0%) | 0 (0.0%) |
| $2,500 to $4,999 | 0 (0.0%) | 0 (0.0%) |
| $5,000 to $7,499 | 0 (0.0%) | 0 (0.0%) |
| $7,500 to $9,999 | 2 (40.0%) | 0 (0.0%) |
| $10,000 to $12,499 | 0 (0.0%) | 0 (0.0%) |
| $12,500 to $14,999 | 0 (0.0%) | 0 (0.0%) |
| $15,000 to $17,499 | 0 (0.0%) | 0 (0.0%) |
| $17,500 to $19,999 | 0 (0.0%) | 0 (0.0%) |
| $20,000 to $22,499 | 0 (0.0%) | 0 (0.0%) |
| $22,500 to $24,999 | 0 (0.0%) | 0 (0.0%) |
| $25,000 to $29,999 | 0 (0.0%) | 3 (100.0%) |
| $30,000 to $34,999 | 0 (0.0%) | 0 (0.0%) |
| $35,000 to $39,999 | 0 (0.0%) | 0 (0.0%) |
| $40,000 to $44,999 | 0 (0.0%) | 0 (0.0%) |
| $45,000 to $49,999 | 0 (0.0%) | 0 (0.0%) |
| $50,000 to $54,999 | 0 (0.0%) | 0 (0.0%) |
| $55,000 to $64,999 | 0 (0.0%) | 0 (0.0%) |
| $65,000 to $74,999 | 0 (0.0%) | 0 (0.0%) |
| $75,000 to $99,999 | 0 (0.0%) | 0 (0.0%) |
| $100,000+ | 3 (60.0%) | 0 (0.0%) |
| Total | 5 (100.0%) | 3 (100.0%) |
Earnings by Sex by Educational Attainment in May
| Educational Attainment | Male Income | Female Income |
| Less than High School | - | - |
| High School Diploma | - | - |
| College or Associate's Degree | - | - |
| Bachelor's Degree | - | - |
| Graduate Degree | - | - |
| Total | - | - |
Family Income in May
Family Income Brackets in May
According to the May family income data, there are 5 families falling into the $25,000 to $34,999 income range, which is the most common income bracket and makes up 83.3% of all families.
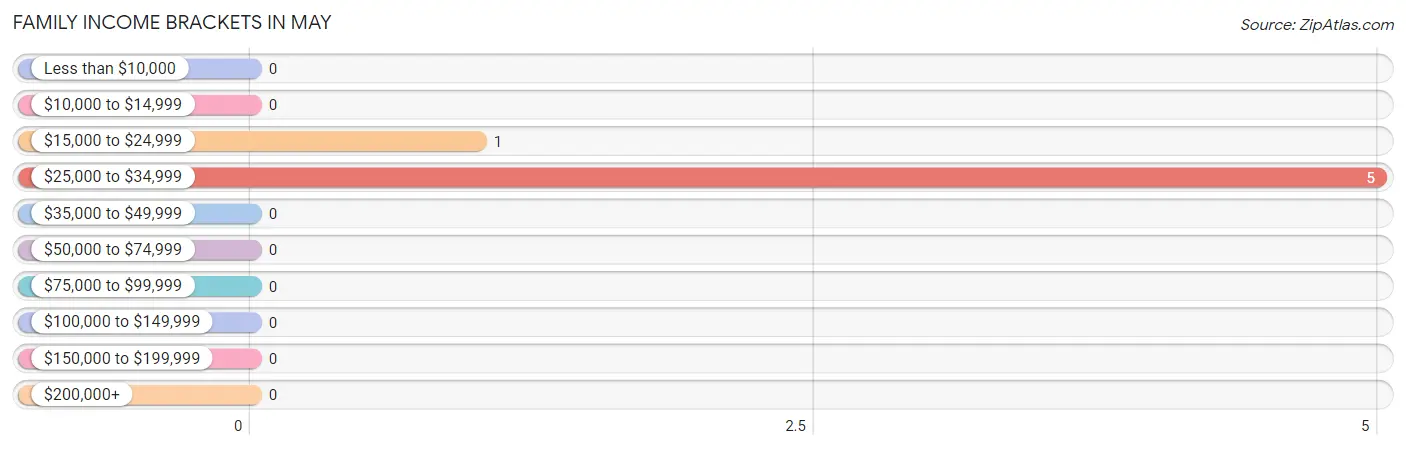
| Income Bracket | # Families | % Families |
| Less than $10,000 | 0 | 0.0% |
| $10,000 to $14,999 | 0 | 0.0% |
| $15,000 to $24,999 | 1 | 16.7% |
| $25,000 to $34,999 | 5 | 83.3% |
| $35,000 to $49,999 | 0 | 0.0% |
| $50,000 to $74,999 | 0 | 0.0% |
| $75,000 to $99,999 | 0 | 0.0% |
| $100,000 to $149,999 | 0 | 0.0% |
| $150,000 to $199,999 | 0 | 0.0% |
| $200,000+ | 0 | 0.0% |
Family Income by Famaliy Size in May
3-person families (6 | 100.0%) account for the highest median family income in May with $31,000 per family, while 3-person families (6 | 100.0%) have the highest median income of $10,333 per family member.
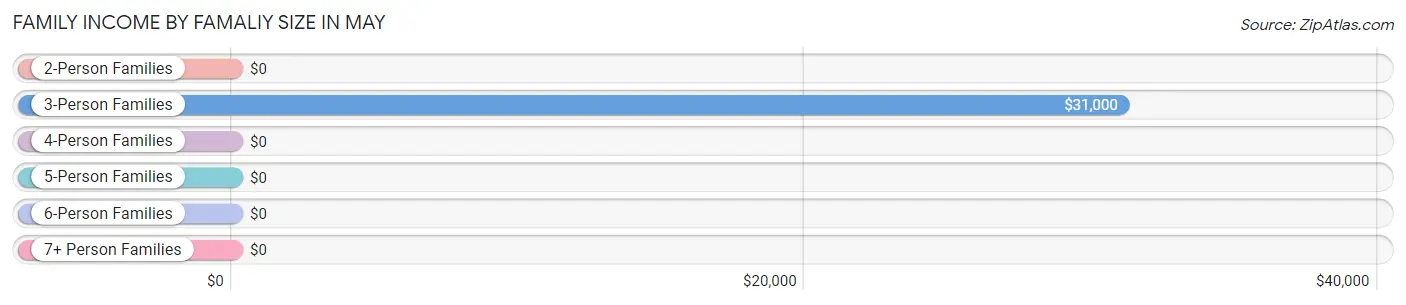
| Income Bracket | # Families | Median Income |
| 2-Person Families | 0 (0.0%) | $0 |
| 3-Person Families | 6 (100.0%) | $31,000 |
| 4-Person Families | 0 (0.0%) | $0 |
| 5-Person Families | 0 (0.0%) | $0 |
| 6-Person Families | 0 (0.0%) | $0 |
| 7+ Person Families | 0 (0.0%) | $0 |
| Total | 6 (100.0%) | $31,000 |
Family Income by Number of Earners in May
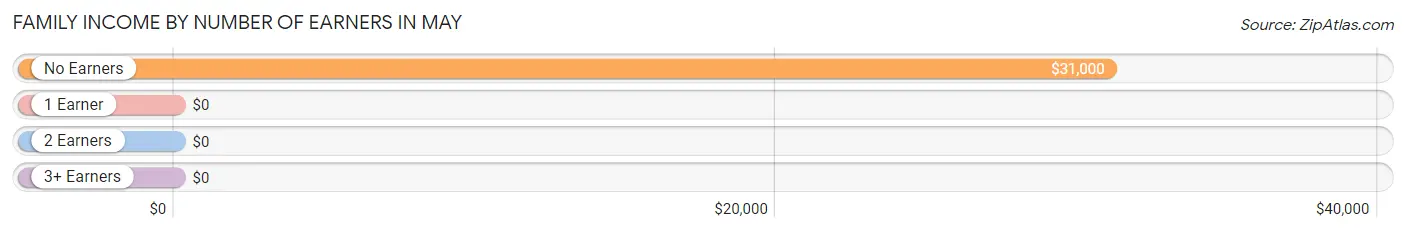
| Number of Earners | # Families | Median Income |
| No Earners | 6 (100.0%) | $31,000 |
| 1 Earner | 0 (0.0%) | $0 |
| 2 Earners | 0 (0.0%) | $0 |
| 3+ Earners | 0 (0.0%) | $0 |
| Total | 6 (100.0%) | $31,000 |
Household Income in May
Household Income Brackets in May
With 5 households falling in the category, the $35,000 to $49,999 income range is the most frequent in May, accounting for 38.5% of all households.
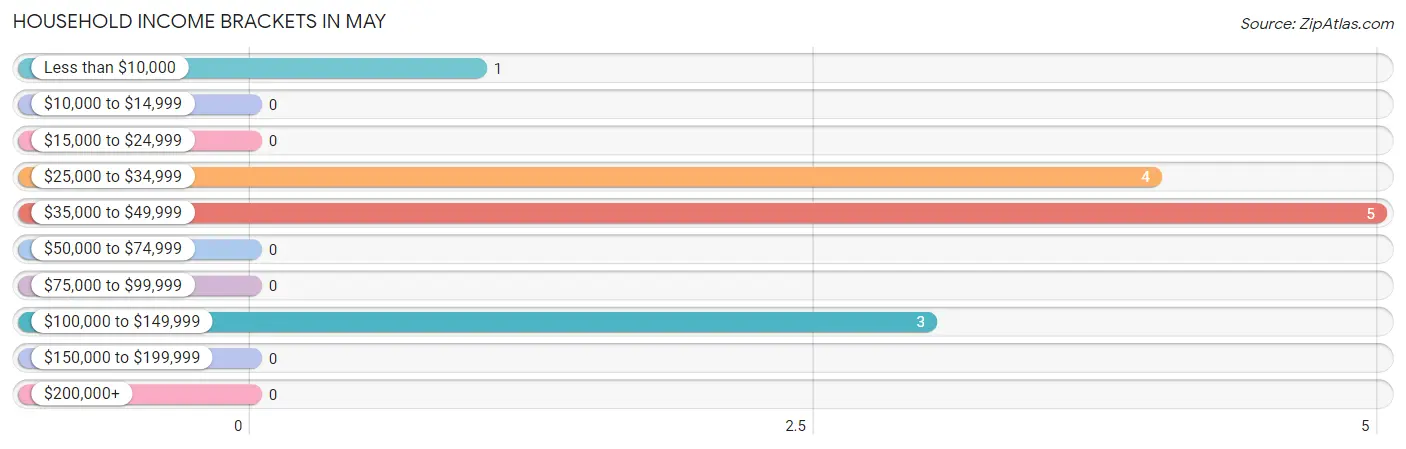
| Income Bracket | # Households | % Households |
| Less than $10,000 | 1 | 7.7% |
| $10,000 to $14,999 | 0 | 0.0% |
| $15,000 to $24,999 | 0 | 0.0% |
| $25,000 to $34,999 | 4 | 30.8% |
| $35,000 to $49,999 | 5 | 38.5% |
| $50,000 to $74,999 | 0 | 0.0% |
| $75,000 to $99,999 | 0 | 0.0% |
| $100,000 to $149,999 | 3 | 23.1% |
| $150,000 to $199,999 | 0 | 0.0% |
| $200,000+ | 0 | 0.0% |
Household Income by Householder Age in May
| Income Bracket | # Households | Median Income |
| 15 to 24 Years | 3 (23.1%) | $0 |
| 25 to 44 Years | 1 (7.7%) | $0 |
| 45 to 64 Years | 5 (38.5%) | $0 |
| 65+ Years | 4 (30.8%) | $0 |
| Total | 13 (100.0%) | $40,750 |
Poverty in May
Income Below Poverty by Sex and Age in May
With 11.8% poverty level for males and 54.5% for females among the residents of May, 25 to 34 year old males and 25 to 34 year old females are the most vulnerable to poverty, with 2 males (25.0%) and 12 females (100.0%) in their respective age groups living below the poverty level.
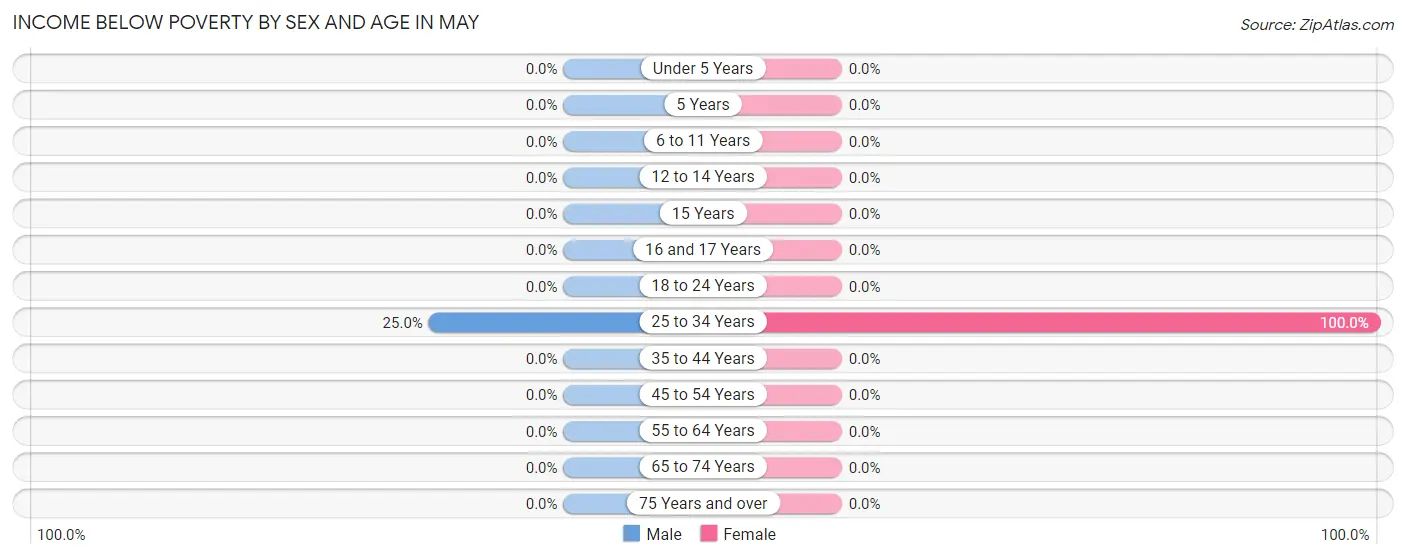
| Age Bracket | Male | Female |
| Under 5 Years | 0 (0.0%) | 0 (0.0%) |
| 5 Years | 0 (0.0%) | 0 (0.0%) |
| 6 to 11 Years | 0 (0.0%) | 0 (0.0%) |
| 12 to 14 Years | 0 (0.0%) | 0 (0.0%) |
| 15 Years | 0 (0.0%) | 0 (0.0%) |
| 16 and 17 Years | 0 (0.0%) | 0 (0.0%) |
| 18 to 24 Years | 0 (0.0%) | 0 (0.0%) |
| 25 to 34 Years | 2 (25.0%) | 12 (100.0%) |
| 35 to 44 Years | 0 (0.0%) | 0 (0.0%) |
| 45 to 54 Years | 0 (0.0%) | 0 (0.0%) |
| 55 to 64 Years | 0 (0.0%) | 0 (0.0%) |
| 65 to 74 Years | 0 (0.0%) | 0 (0.0%) |
| 75 Years and over | 0 (0.0%) | 0 (0.0%) |
| Total | 2 (11.8%) | 12 (54.5%) |
Income Above Poverty by Sex and Age in May
According to the poverty statistics in May, males aged 55 to 64 years and females aged 18 to 24 years are the age groups that are most secure financially, with 100.0% of males and 100.0% of females in these age groups living above the poverty line.
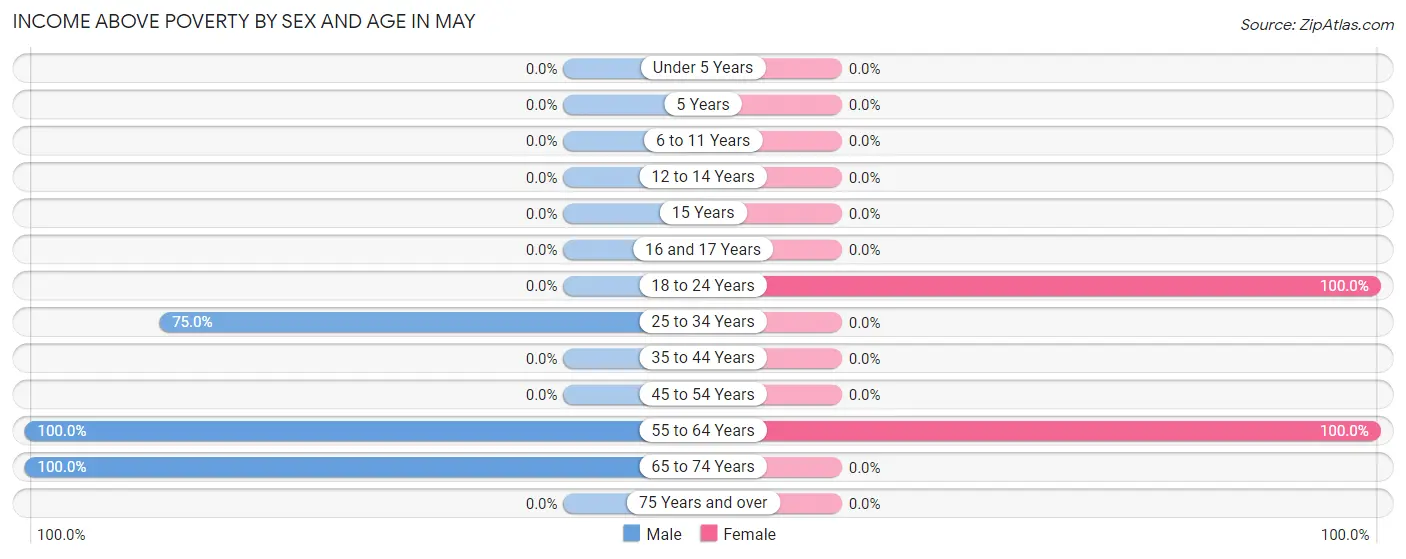
| Age Bracket | Male | Female |
| Under 5 Years | 0 (0.0%) | 0 (0.0%) |
| 5 Years | 0 (0.0%) | 0 (0.0%) |
| 6 to 11 Years | 0 (0.0%) | 0 (0.0%) |
| 12 to 14 Years | 0 (0.0%) | 0 (0.0%) |
| 15 Years | 0 (0.0%) | 0 (0.0%) |
| 16 and 17 Years | 0 (0.0%) | 0 (0.0%) |
| 18 to 24 Years | 0 (0.0%) | 3 (100.0%) |
| 25 to 34 Years | 6 (75.0%) | 0 (0.0%) |
| 35 to 44 Years | 0 (0.0%) | 0 (0.0%) |
| 45 to 54 Years | 0 (0.0%) | 0 (0.0%) |
| 55 to 64 Years | 5 (100.0%) | 7 (100.0%) |
| 65 to 74 Years | 4 (100.0%) | 0 (0.0%) |
| 75 Years and over | 0 (0.0%) | 0 (0.0%) |
| Total | 15 (88.2%) | 10 (45.5%) |
Income Below Poverty Among Married-Couple Families in May
| Children | Above Poverty | Below Poverty |
| No Children | 6 (100.0%) | 0 (0.0%) |
| 1 or 2 Children | 0 (0.0%) | 0 (0.0%) |
| 3 or 4 Children | 0 (0.0%) | 0 (0.0%) |
| 5 or more Children | 0 (0.0%) | 0 (0.0%) |
| Total | 6 (100.0%) | 0 (0.0%) |
Income Below Poverty Among Single-Parent Households in May
| Children | Single Father | Single Mother |
| No Children | 0 (0.0%) | 0 (0.0%) |
| 1 or 2 Children | 0 (0.0%) | 0 (0.0%) |
| 3 or 4 Children | 0 (0.0%) | 0 (0.0%) |
| 5 or more Children | 0 (0.0%) | 0 (0.0%) |
| Total | 0 (0.0%) | 0 (0.0%) |
Income Below Poverty Among Married-Couple vs Single-Parent Households in May
| Children | Married-Couple Families | Single-Parent Households |
| No Children | 0 (0.0%) | 0 (0.0%) |
| 1 or 2 Children | 0 (0.0%) | 0 (0.0%) |
| 3 or 4 Children | 0 (0.0%) | 0 (0.0%) |
| 5 or more Children | 0 (0.0%) | 0 (0.0%) |
| Total | 0 (0.0%) | 0 (0.0%) |
Race in May
The most populous races in May are White / Caucasian (37 | 94.9%), and Two or more Races (2 | 5.1%).
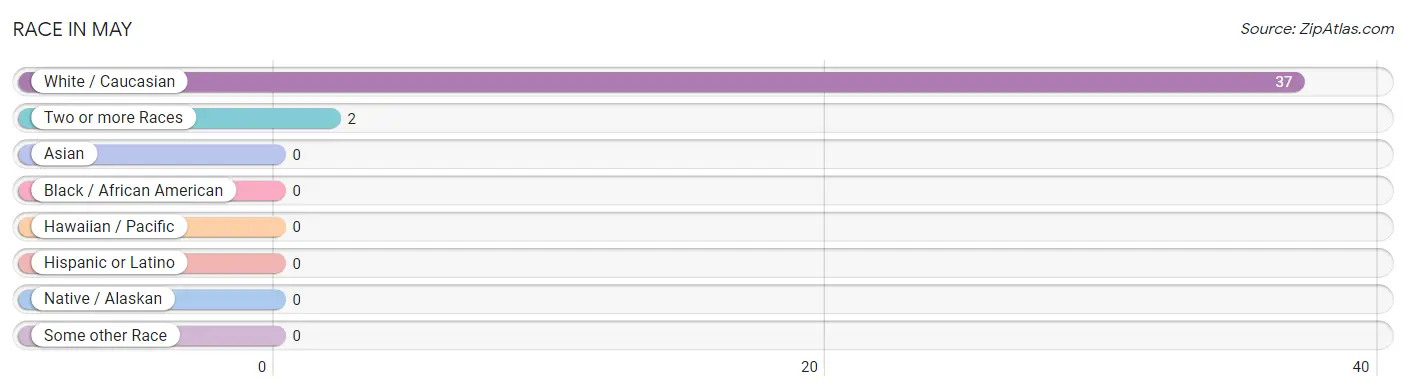
| Race | # Population | % Population |
| Asian | 0 | 0.0% |
| Black / African American | 0 | 0.0% |
| Hawaiian / Pacific | 0 | 0.0% |
| Hispanic or Latino | 0 | 0.0% |
| Native / Alaskan | 0 | 0.0% |
| White / Caucasian | 37 | 94.9% |
| Two or more Races | 2 | 5.1% |
| Some other Race | 0 | 0.0% |
| Total | 39 | 100.0% |
Ancestry in May
The most populous ancestries reported in May are American (30 | 76.9%), Irish (8 | 20.5%), English (5 | 12.8%), and German (3 | 7.7%), together accounting for 117.9% of all May residents.
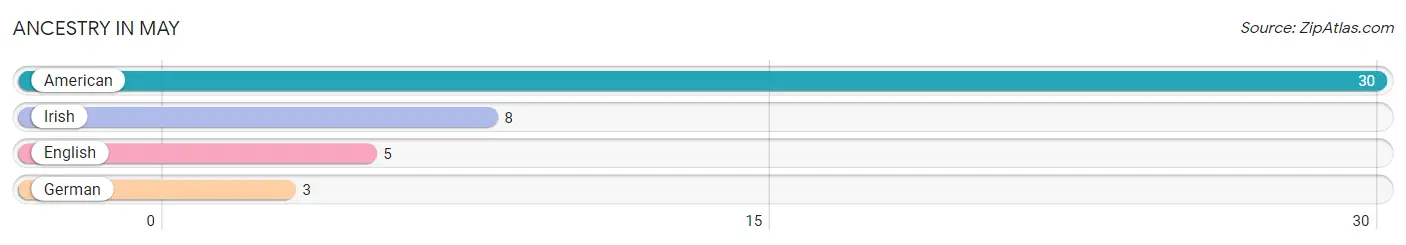
| Ancestry | # Population | % Population |
| American | 30 | 76.9% |
| English | 5 | 12.8% |
| German | 3 | 7.7% |
| Irish | 8 | 20.5% | View All 4 Rows |
Immigrants in May

| Immigration Origin | # Population | % Population | View All 0 Rows |
Sex and Age in May
Sex and Age in May
The most populous age groups in May are 25 to 29 Years (6 | 35.3%) for men and 30 to 34 Years (11 | 50.0%) for women.
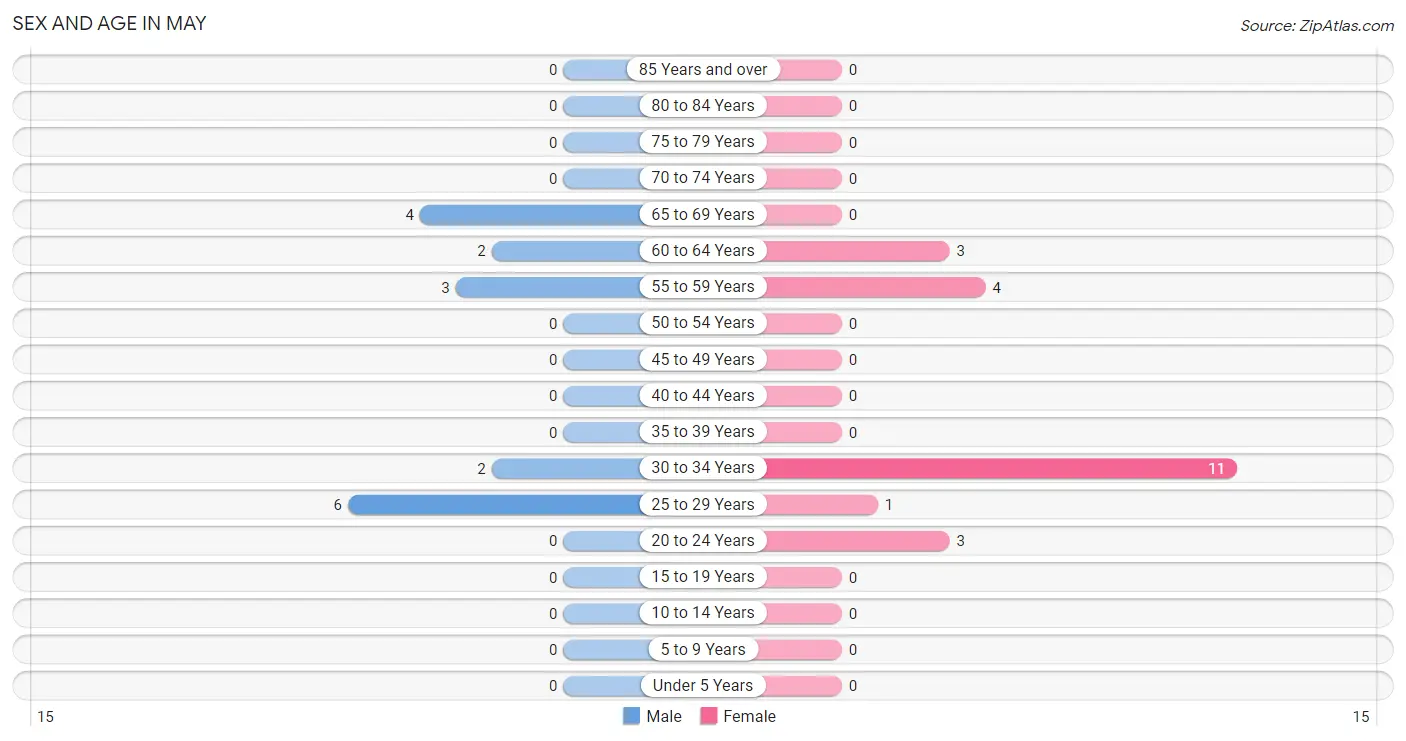
| Age Bracket | Male | Female |
| Under 5 Years | 0 (0.0%) | 0 (0.0%) |
| 5 to 9 Years | 0 (0.0%) | 0 (0.0%) |
| 10 to 14 Years | 0 (0.0%) | 0 (0.0%) |
| 15 to 19 Years | 0 (0.0%) | 0 (0.0%) |
| 20 to 24 Years | 0 (0.0%) | 3 (13.6%) |
| 25 to 29 Years | 6 (35.3%) | 1 (4.5%) |
| 30 to 34 Years | 2 (11.8%) | 11 (50.0%) |
| 35 to 39 Years | 0 (0.0%) | 0 (0.0%) |
| 40 to 44 Years | 0 (0.0%) | 0 (0.0%) |
| 45 to 49 Years | 0 (0.0%) | 0 (0.0%) |
| 50 to 54 Years | 0 (0.0%) | 0 (0.0%) |
| 55 to 59 Years | 3 (17.6%) | 4 (18.2%) |
| 60 to 64 Years | 2 (11.8%) | 3 (13.6%) |
| 65 to 69 Years | 4 (23.5%) | 0 (0.0%) |
| 70 to 74 Years | 0 (0.0%) | 0 (0.0%) |
| 75 to 79 Years | 0 (0.0%) | 0 (0.0%) |
| 80 to 84 Years | 0 (0.0%) | 0 (0.0%) |
| 85 Years and over | 0 (0.0%) | 0 (0.0%) |
| Total | 17 (100.0%) | 22 (100.0%) |
Families and Households in May
Median Family Size in May
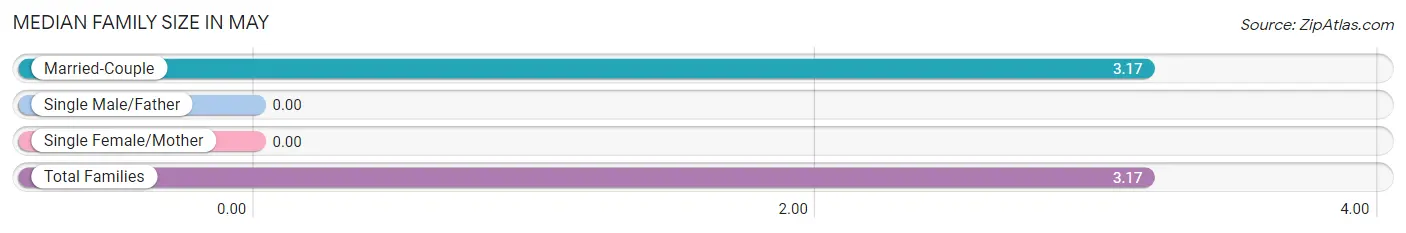
| Family Type | # Families | Family Size |
| Married-Couple | 6 (100.0%) | 3.17 |
| Single Male/Father | 0 (0.0%) | - |
| Single Female/Mother | 0 (0.0%) | - |
| Total Families | 6 (100.0%) | 3.17 |
Median Household Size in May
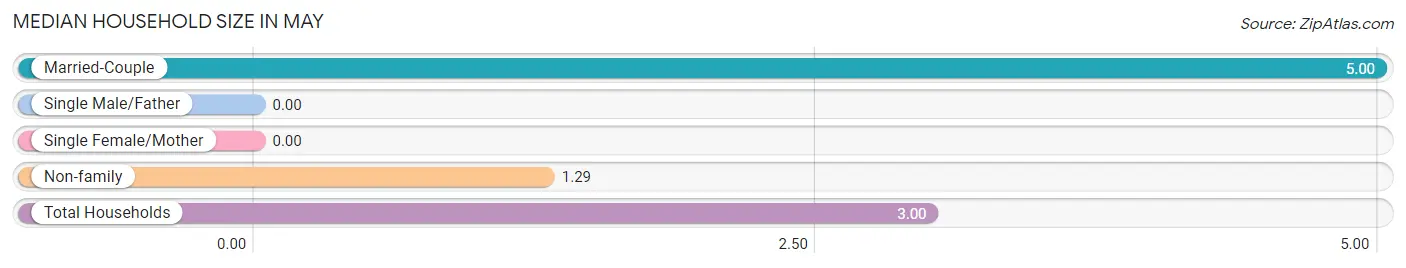
| Household Type | # Households | Household Size |
| Married-Couple | 6 (46.2%) | 5.00 |
| Single Male/Father | 0 (0.0%) | - |
| Single Female/Mother | 0 (0.0%) | - |
| Non-family | 7 (53.8%) | 1.29 |
| Total Households | 13 (100.0%) | 3.00 |
Household Size by Marriage Status in May
Out of a total of 13 households in May, 6 (46.2%) are family households, while 7 (53.8%) are nonfamily households. The most numerous type of family households are 4-person households, comprising 6, and the most common type of nonfamily households are 1-person households, comprising 6.
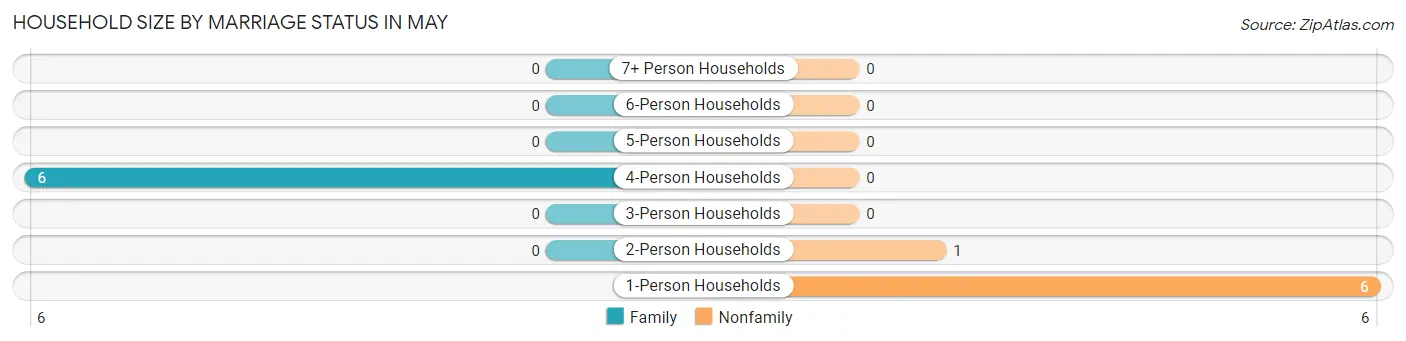
| Household Size | Family Households | Nonfamily Households |
| 1-Person Households | - | 6 (46.2%) |
| 2-Person Households | 0 (0.0%) | 1 (7.7%) |
| 3-Person Households | 0 (0.0%) | 0 (0.0%) |
| 4-Person Households | 6 (46.2%) | 0 (0.0%) |
| 5-Person Households | 0 (0.0%) | 0 (0.0%) |
| 6-Person Households | 0 (0.0%) | 0 (0.0%) |
| 7+ Person Households | 0 (0.0%) | 0 (0.0%) |
| Total | 6 (46.2%) | 7 (53.8%) |
Female Fertility in May
Fertility by Age in May
| Age Bracket | Women with Births | Births / 1,000 Women |
| 15 to 19 years | 0 (0.0%) | 0.0 |
| 20 to 34 years | 0 (0.0%) | 0.0 |
| 35 to 50 years | 0 (0.0%) | 0.0 |
| Total | 0 (0.0%) | 0.0 |
Fertility by Age by Marriage Status in May
| Age Bracket | Married | Unmarried |
| 15 to 19 years | 0 (0.0%) | 0 (0.0%) |
| 20 to 34 years | 0 (0.0%) | 0 (0.0%) |
| 35 to 50 years | 0 (0.0%) | 0 (0.0%) |
| Total | 0 (0.0%) | 0 (0.0%) |
Fertility by Education in May
| Educational Attainment | Women with Births | Births / 1,000 Women |
| Less than High School | 0 (0.0%) | 0.0 |
| High School Diploma | 0 (0.0%) | 0.0 |
| College or Associate's Degree | 0 (0.0%) | 0.0 |
| Bachelor's Degree | 0 (0.0%) | 0.0 |
| Graduate Degree | 0 (0.0%) | 0.0 |
| Total | 0 (0.0%) | 0.0 |
Fertility by Education by Marriage Status in May
| Educational Attainment | Married | Unmarried |
| Less than High School | 0 (0.0%) | 0 (0.0%) |
| High School Diploma | 0 (0.0%) | 0 (0.0%) |
| College or Associate's Degree | 0 (0.0%) | 0 (0.0%) |
| Bachelor's Degree | 0 (0.0%) | 0 (0.0%) |
| Graduate Degree | 0 (0.0%) | 0 (0.0%) |
| Total | 0 (0.0%) | 0 (0.0%) |
Employment Characteristics in May
Employment by Class of Employer in May
Among the 8 employed individuals in May, private company employees (5 | 62.5%), and not-for-profit organizations (3 | 37.5%) make up the most common classes of employment.
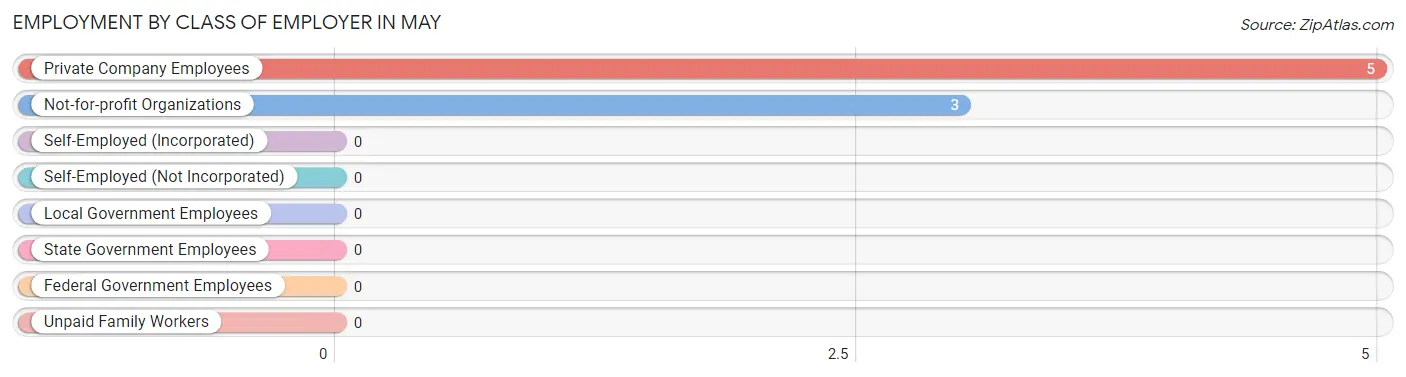
| Employer Class | # Employees | % Employees |
| Private Company Employees | 5 | 62.5% |
| Self-Employed (Incorporated) | 0 | 0.0% |
| Self-Employed (Not Incorporated) | 0 | 0.0% |
| Not-for-profit Organizations | 3 | 37.5% |
| Local Government Employees | 0 | 0.0% |
| State Government Employees | 0 | 0.0% |
| Federal Government Employees | 0 | 0.0% |
| Unpaid Family Workers | 0 | 0.0% |
| Total | 8 | 100.0% |
Employment Status by Age in May
According to the labor force statistics for May, out of the total population over 16 years of age (39), 33.3% or 13 individuals are in the labor force, with 38.5% or 5 of them unemployed. The age group with the highest labor force participation rate is 20 to 24 years, with 100.0% or 3 individuals in the labor force. Within the labor force, the 30 to 34 years age range has the highest percentage of unemployed individuals, with 100.0% or 2 of them being unemployed.
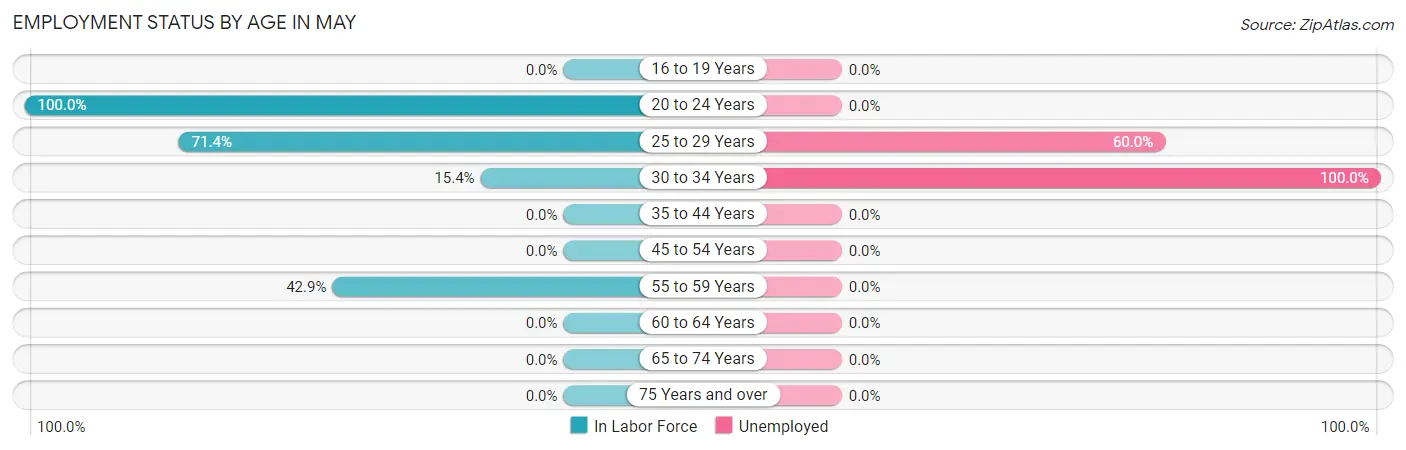
| Age Bracket | In Labor Force | Unemployed |
| 16 to 19 Years | 0 (0.0%) | 0 (0.0%) |
| 20 to 24 Years | 3 (100.0%) | 0 (0.0%) |
| 25 to 29 Years | 5 (71.4%) | 3 (60.0%) |
| 30 to 34 Years | 2 (15.4%) | 2 (100.0%) |
| 35 to 44 Years | 0 (0.0%) | 0 (0.0%) |
| 45 to 54 Years | 0 (0.0%) | 0 (0.0%) |
| 55 to 59 Years | 3 (42.9%) | 0 (0.0%) |
| 60 to 64 Years | 0 (0.0%) | 0 (0.0%) |
| 65 to 74 Years | 0 (0.0%) | 0 (0.0%) |
| 75 Years and over | 0 (0.0%) | 0 (0.0%) |
| Total | 13 (33.3%) | 5 (38.5%) |
Employment Status by Educational Attainment in May
According to labor force statistics for May, 31.3% of individuals (10) out of the total population between 25 and 64 years of age (32) are in the labor force, with 50.0% or 5 of them being unemployed. The group with the highest labor force participation rate are those with the educational attainment of college / associate degree, with 100.0% or 1 individuals in the labor force. Within the labor force, individuals with less than high school education have the highest percentage of unemployment, with 100.0% or 4 of them being unemployed.
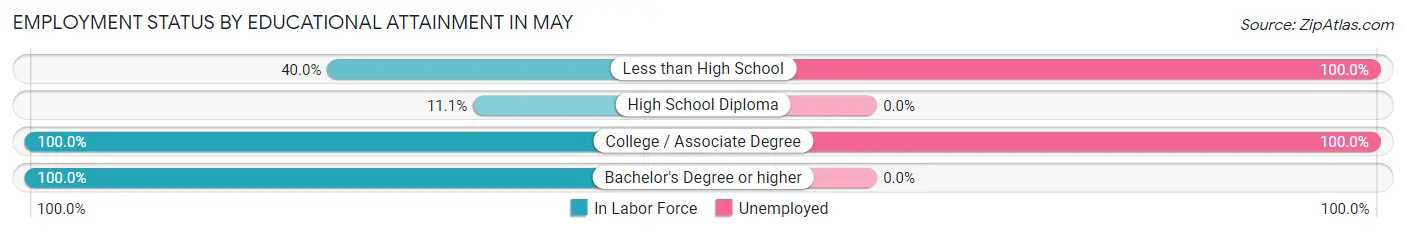
| Educational Attainment | In Labor Force | Unemployed |
| Less than High School | 4 (40.0%) | 10 (100.0%) |
| High School Diploma | 2 (11.1%) | 0 (0.0%) |
| College / Associate Degree | 1 (100.0%) | 1 (100.0%) |
| Bachelor's Degree or higher | 3 (100.0%) | 0 (0.0%) |
| Total | 10 (31.3%) | 16 (50.0%) |
Employment Occupations by Sex in May
Management, Business, Science and Arts Occupations
Management, Business, Science and Arts Occupations by Sex
| Occupation | Male | Female |
| Management | 0 (0.0%) | 0 (0.0%) |
| Business & Financial | 0 (0.0%) | 0 (0.0%) |
| Computers, Engineering & Science | 0 (0.0%) | 0 (0.0%) |
| Computers & Mathematics | 0 (0.0%) | 0 (0.0%) |
| Architecture & Engineering | 0 (0.0%) | 0 (0.0%) |
| Life, Physical & Social Science | 0 (0.0%) | 0 (0.0%) |
| Community & Social Service | 0 (0.0%) | 0 (0.0%) |
| Education, Arts & Media | 0 (0.0%) | 0 (0.0%) |
| Legal Services & Support | 0 (0.0%) | 0 (0.0%) |
| Education Instruction & Library | 0 (0.0%) | 0 (0.0%) |
| Arts, Media & Entertainment | 0 (0.0%) | 0 (0.0%) |
| Health Diagnosing & Treating | 0 (0.0%) | 0 (0.0%) |
| Health Technologists | 0 (0.0%) | 0 (0.0%) |
| Total (Category) | 0 (0.0%) | 0 (0.0%) |
| Total (Overall) | 5 (62.5%) | 3 (37.5%) |
Services Occupations
Services Occupations by Sex
| Occupation | Male | Female |
| Healthcare Support | 0 (0.0%) | 0 (0.0%) |
| Security & Protection | 0 (0.0%) | 0 (0.0%) |
| Firefighting & Prevention | 0 (0.0%) | 0 (0.0%) |
| Law Enforcement | 0 (0.0%) | 0 (0.0%) |
| Food Preparation & Serving | 0 (0.0%) | 0 (0.0%) |
| Cleaning & Maintenance | 0 (0.0%) | 0 (0.0%) |
| Personal Care & Service | 0 (0.0%) | 0 (0.0%) |
| Total (Category) | 0 (0.0%) | 0 (0.0%) |
| Total (Overall) | 5 (62.5%) | 3 (37.5%) |
Sales and Office Occupations
The most common Sales and Office occupations in May are , and Sales & Related (3 | 37.5%).
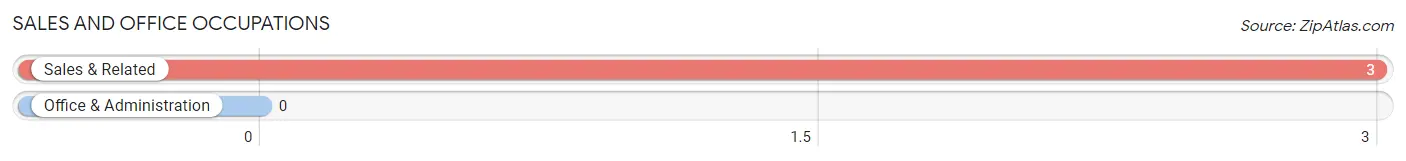
Sales and Office Occupations by Sex
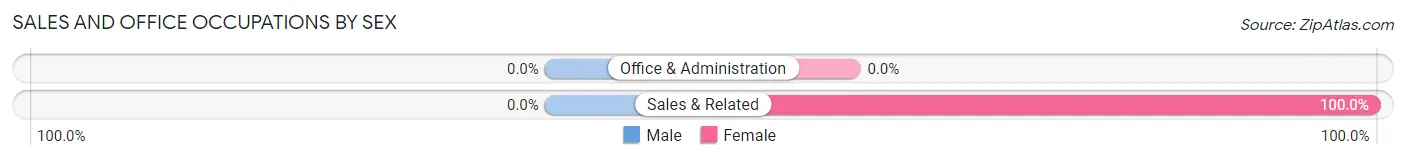
| Occupation | Male | Female |
| Sales & Related | 0 (0.0%) | 3 (100.0%) |
| Office & Administration | 0 (0.0%) | 0 (0.0%) |
| Total (Category) | 0 (0.0%) | 3 (100.0%) |
| Total (Overall) | 5 (62.5%) | 3 (37.5%) |
Natural Resources, Construction and Maintenance Occupations
The most common Natural Resources, Construction and Maintenance occupations in May are Installation, Maintenance & Repair (3 | 37.5%), and Construction & Extraction (2 | 25.0%).
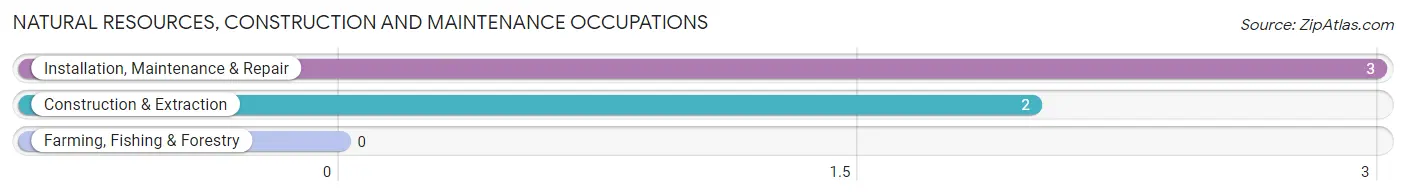
Natural Resources, Construction and Maintenance Occupations by Sex
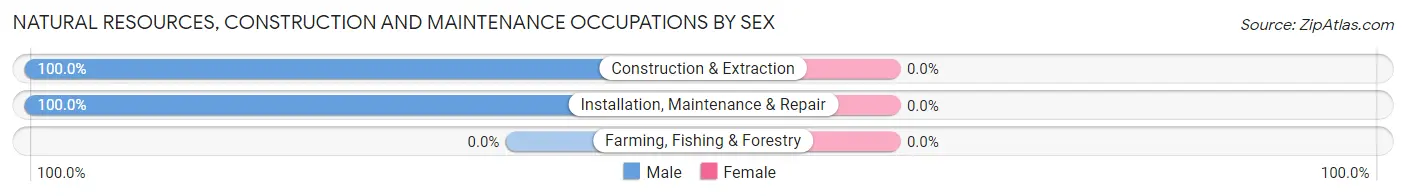
| Occupation | Male | Female |
| Farming, Fishing & Forestry | 0 (0.0%) | 0 (0.0%) |
| Construction & Extraction | 2 (100.0%) | 0 (0.0%) |
| Installation, Maintenance & Repair | 3 (100.0%) | 0 (0.0%) |
| Total (Category) | 5 (100.0%) | 0 (0.0%) |
| Total (Overall) | 5 (62.5%) | 3 (37.5%) |
Production, Transportation and Moving Occupations
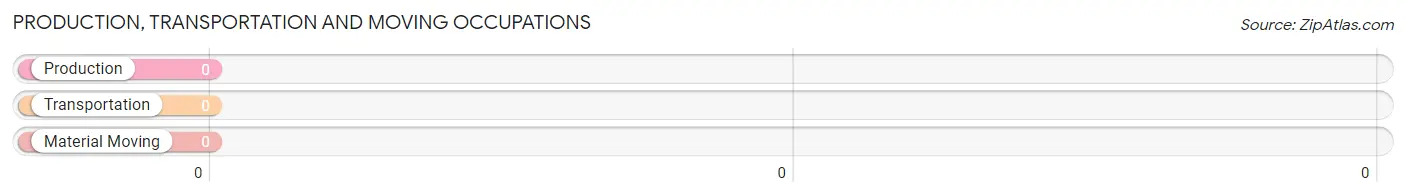
Production, Transportation and Moving Occupations by Sex
| Occupation | Male | Female |
| Production | 0 (0.0%) | 0 (0.0%) |
| Transportation | 0 (0.0%) | 0 (0.0%) |
| Material Moving | 0 (0.0%) | 0 (0.0%) |
| Total (Category) | 0 (0.0%) | 0 (0.0%) |
| Total (Overall) | 5 (62.5%) | 3 (37.5%) |
Employment Industries by Sex in May
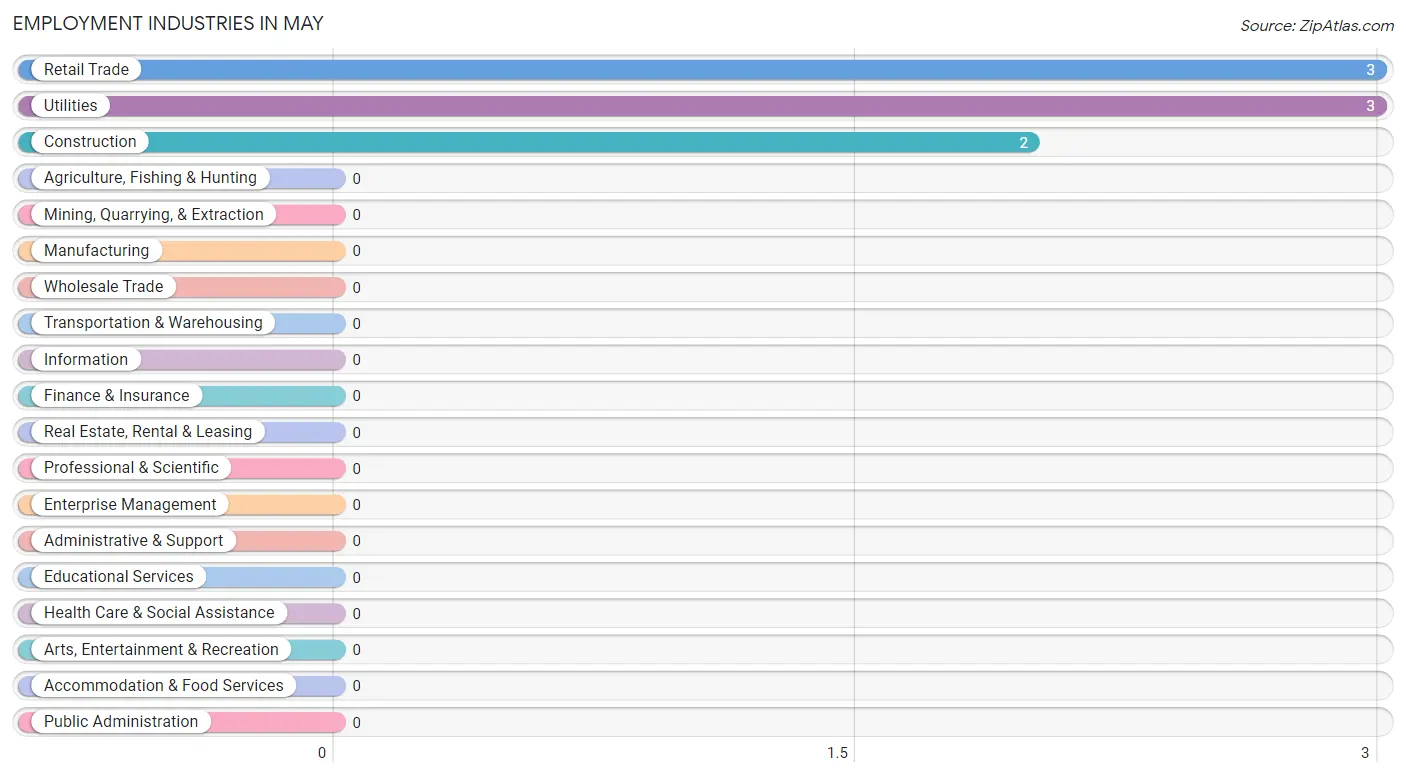
Employment Industries in May
The major employment industries in May include Retail Trade (3 | 37.5%), Utilities (3 | 37.5%), and Construction (2 | 25.0%).
Employment Industries by Sex in May
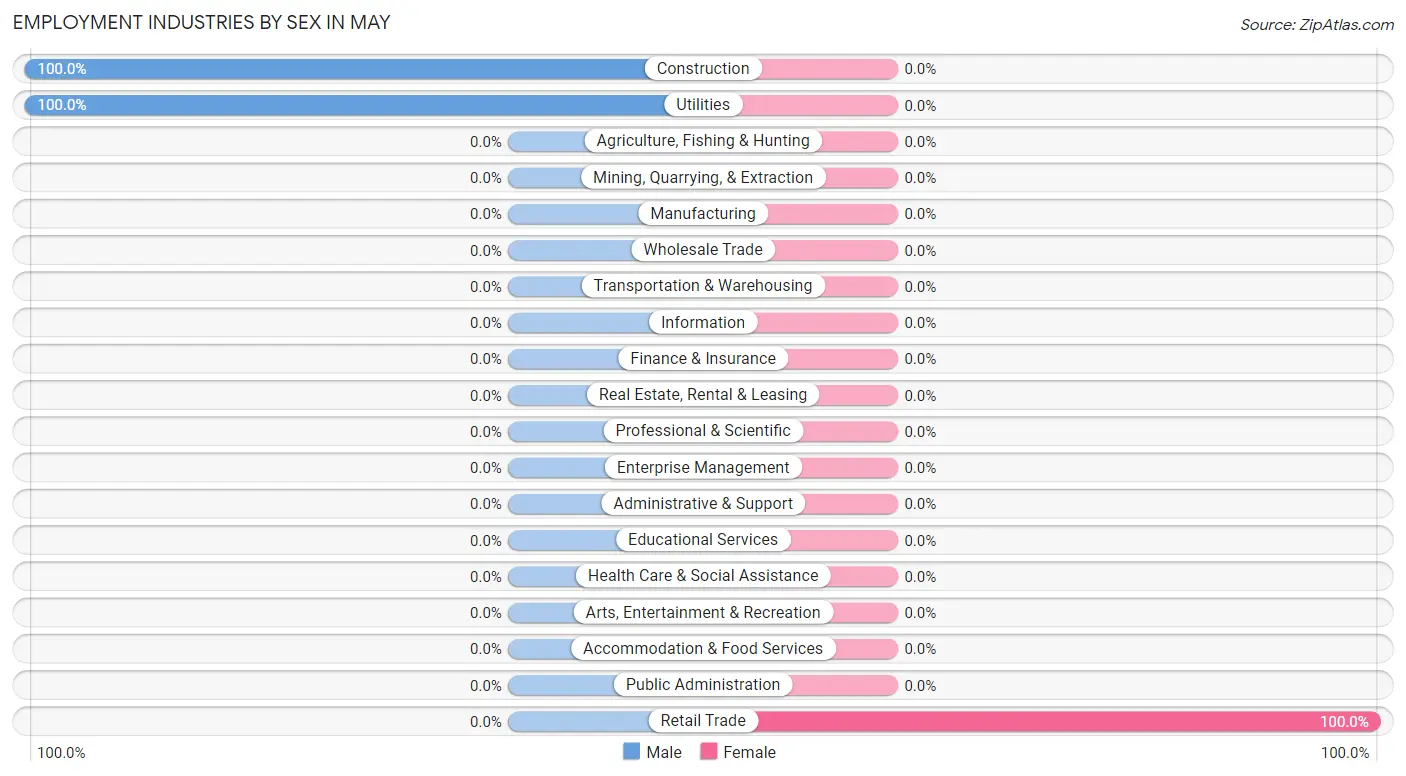
| Industry | Male | Female |
| Agriculture, Fishing & Hunting | 0 (0.0%) | 0 (0.0%) |
| Mining, Quarrying, & Extraction | 0 (0.0%) | 0 (0.0%) |
| Construction | 2 (100.0%) | 0 (0.0%) |
| Manufacturing | 0 (0.0%) | 0 (0.0%) |
| Wholesale Trade | 0 (0.0%) | 0 (0.0%) |
| Retail Trade | 0 (0.0%) | 3 (100.0%) |
| Transportation & Warehousing | 0 (0.0%) | 0 (0.0%) |
| Utilities | 3 (100.0%) | 0 (0.0%) |
| Information | 0 (0.0%) | 0 (0.0%) |
| Finance & Insurance | 0 (0.0%) | 0 (0.0%) |
| Real Estate, Rental & Leasing | 0 (0.0%) | 0 (0.0%) |
| Professional & Scientific | 0 (0.0%) | 0 (0.0%) |
| Enterprise Management | 0 (0.0%) | 0 (0.0%) |
| Administrative & Support | 0 (0.0%) | 0 (0.0%) |
| Educational Services | 0 (0.0%) | 0 (0.0%) |
| Health Care & Social Assistance | 0 (0.0%) | 0 (0.0%) |
| Arts, Entertainment & Recreation | 0 (0.0%) | 0 (0.0%) |
| Accommodation & Food Services | 0 (0.0%) | 0 (0.0%) |
| Public Administration | 0 (0.0%) | 0 (0.0%) |
| Total | 5 (62.5%) | 3 (37.5%) |
Education in May
School Enrollment in May
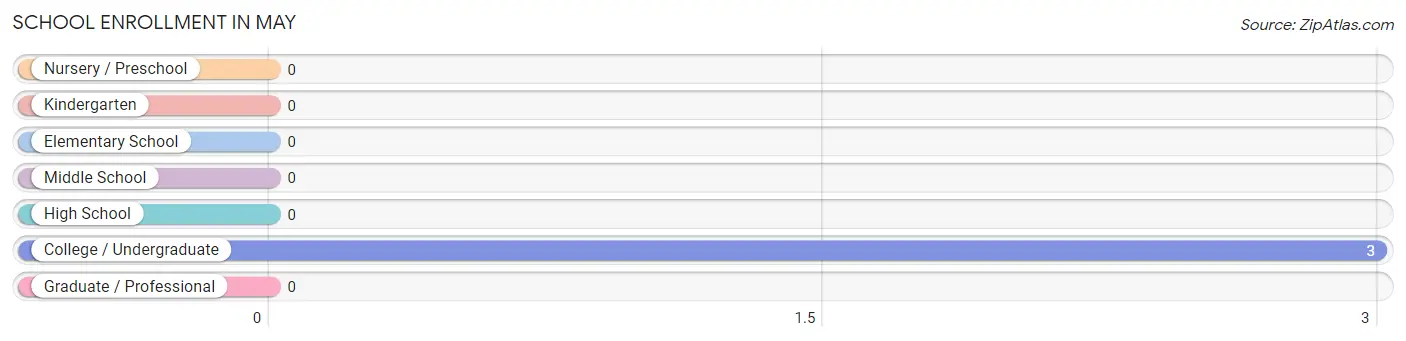
| School Level | # Students | % Students |
| Nursery / Preschool | 0 | 0.0% |
| Kindergarten | 0 | 0.0% |
| Elementary School | 0 | 0.0% |
| Middle School | 0 | 0.0% |
| High School | 0 | 0.0% |
| College / Undergraduate | 3 | 100.0% |
| Graduate / Professional | 0 | 0.0% |
| Total | 3 | 100.0% |
School Enrollment by Age by Funding Source in May
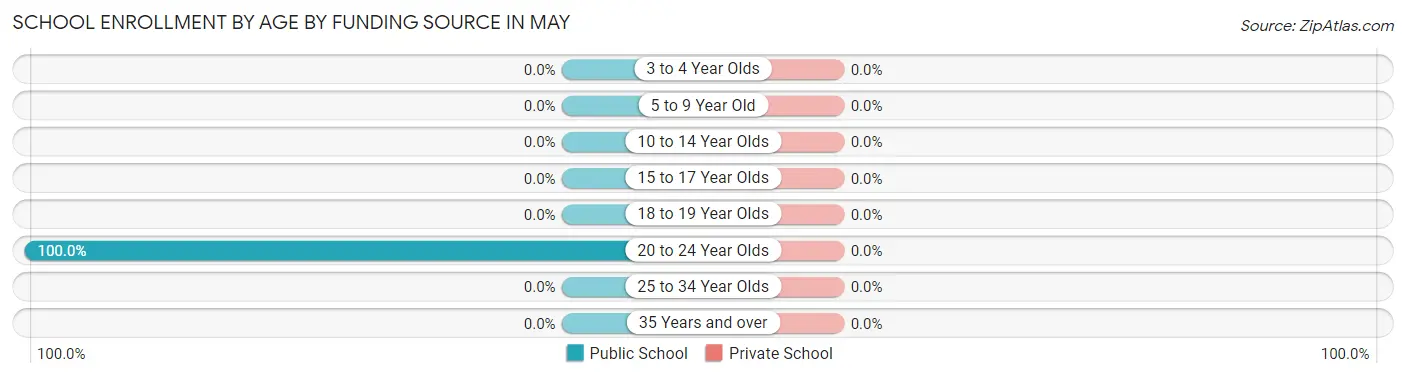
| Age Bracket | Public School | Private School |
| 3 to 4 Year Olds | 0 (0.0%) | 0 (0.0%) |
| 5 to 9 Year Old | 0 (0.0%) | 0 (0.0%) |
| 10 to 14 Year Olds | 0 (0.0%) | 0 (0.0%) |
| 15 to 17 Year Olds | 0 (0.0%) | 0 (0.0%) |
| 18 to 19 Year Olds | 0 (0.0%) | 0 (0.0%) |
| 20 to 24 Year Olds | 3 (100.0%) | 0 (0.0%) |
| 25 to 34 Year Olds | 0 (0.0%) | 0 (0.0%) |
| 35 Years and over | 0 (0.0%) | 0 (0.0%) |
| Total | 3 (100.0%) | 0 (0.0%) |
Educational Attainment by Field of Study in May
, and education (3 | 100.0%) are the most common fields of study among 3 individuals in May who have obtained a bachelor's degree or higher.
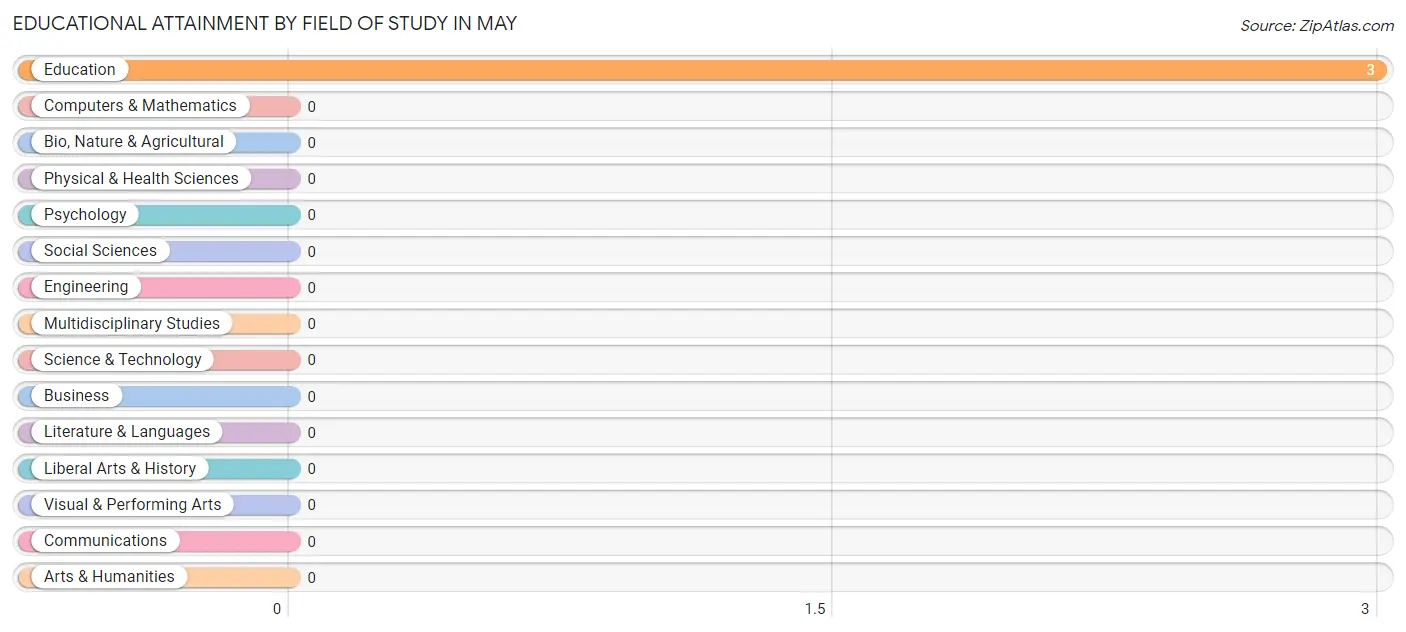
| Field of Study | # Graduates | % Graduates |
| Computers & Mathematics | 0 | 0.0% |
| Bio, Nature & Agricultural | 0 | 0.0% |
| Physical & Health Sciences | 0 | 0.0% |
| Psychology | 0 | 0.0% |
| Social Sciences | 0 | 0.0% |
| Engineering | 0 | 0.0% |
| Multidisciplinary Studies | 0 | 0.0% |
| Science & Technology | 0 | 0.0% |
| Business | 0 | 0.0% |
| Education | 3 | 100.0% |
| Literature & Languages | 0 | 0.0% |
| Liberal Arts & History | 0 | 0.0% |
| Visual & Performing Arts | 0 | 0.0% |
| Communications | 0 | 0.0% |
| Arts & Humanities | 0 | 0.0% |
| Total | 3 | 100.0% |
Transportation & Commute in May
Vehicle Availability by Sex in May
The most prevalent vehicle ownership categories in May are males with 5 or more vehicles (3, accounting for 60.0%) and females with 5 or more vehicles (0, making up 100.0%).
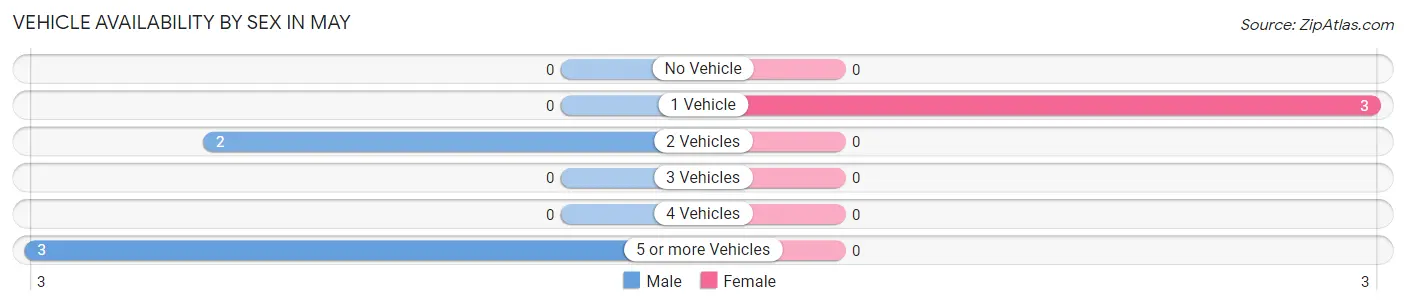
| Vehicles Available | Male | Female |
| No Vehicle | 0 (0.0%) | 0 (0.0%) |
| 1 Vehicle | 0 (0.0%) | 3 (100.0%) |
| 2 Vehicles | 2 (40.0%) | 0 (0.0%) |
| 3 Vehicles | 0 (0.0%) | 0 (0.0%) |
| 4 Vehicles | 0 (0.0%) | 0 (0.0%) |
| 5 or more Vehicles | 3 (60.0%) | 0 (0.0%) |
| Total | 5 (100.0%) | 3 (100.0%) |
Commute Time in May
The most frequently occuring commute durations in May are 20 to 24 minutes (3 commuters, 37.5%), 40 to 44 minutes (3 commuters, 37.5%), and 25 to 29 minutes (2 commuters, 25.0%).
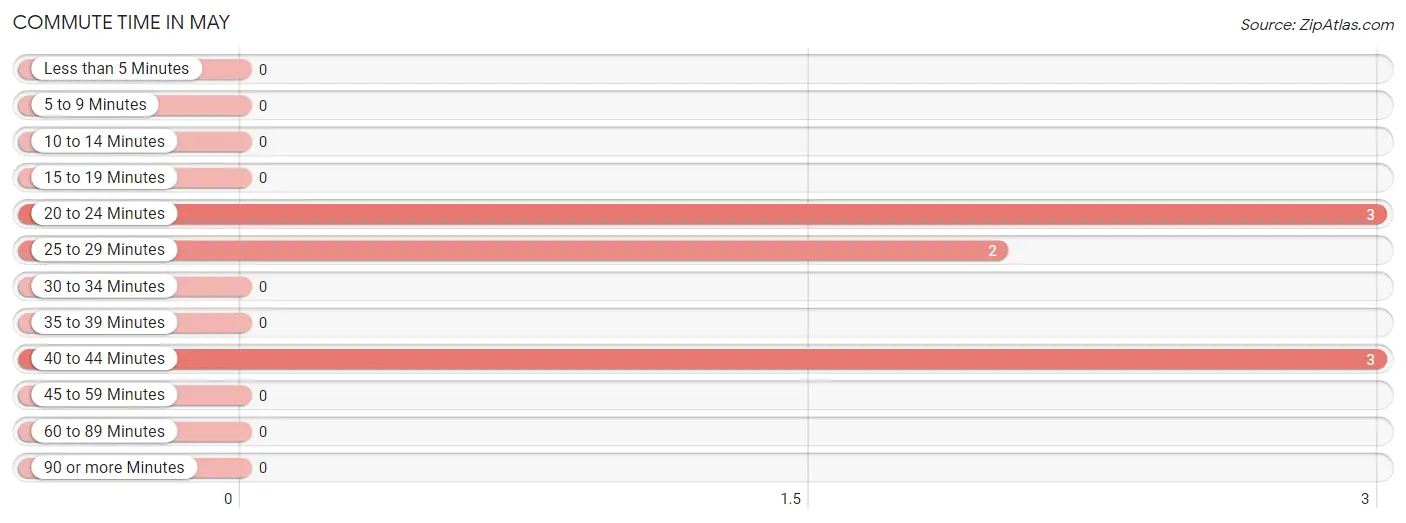
| Commute Time | # Commuters | % Commuters |
| Less than 5 Minutes | 0 | 0.0% |
| 5 to 9 Minutes | 0 | 0.0% |
| 10 to 14 Minutes | 0 | 0.0% |
| 15 to 19 Minutes | 0 | 0.0% |
| 20 to 24 Minutes | 3 | 37.5% |
| 25 to 29 Minutes | 2 | 25.0% |
| 30 to 34 Minutes | 0 | 0.0% |
| 35 to 39 Minutes | 0 | 0.0% |
| 40 to 44 Minutes | 3 | 37.5% |
| 45 to 59 Minutes | 0 | 0.0% |
| 60 to 89 Minutes | 0 | 0.0% |
| 90 or more Minutes | 0 | 0.0% |
Commute Time by Sex in May
The most common commute times in May are 20 to 24 minutes (3 commuters, 60.0%) for males and 40 to 44 minutes (3 commuters, 100.0%) for females.
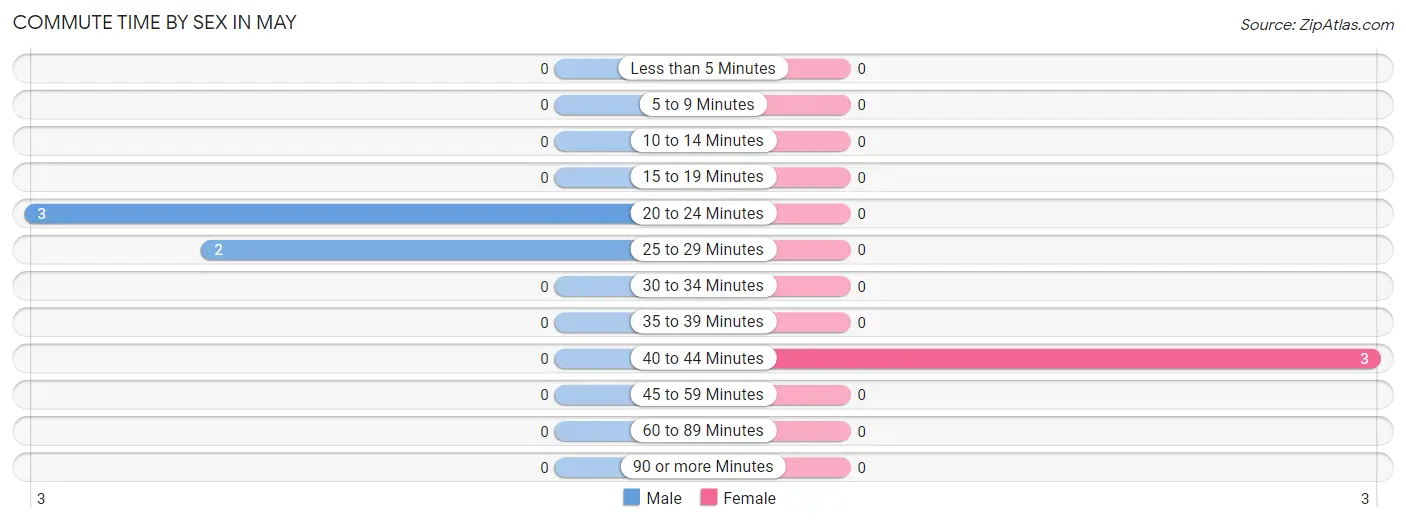
| Commute Time | Male | Female |
| Less than 5 Minutes | 0 (0.0%) | 0 (0.0%) |
| 5 to 9 Minutes | 0 (0.0%) | 0 (0.0%) |
| 10 to 14 Minutes | 0 (0.0%) | 0 (0.0%) |
| 15 to 19 Minutes | 0 (0.0%) | 0 (0.0%) |
| 20 to 24 Minutes | 3 (60.0%) | 0 (0.0%) |
| 25 to 29 Minutes | 2 (40.0%) | 0 (0.0%) |
| 30 to 34 Minutes | 0 (0.0%) | 0 (0.0%) |
| 35 to 39 Minutes | 0 (0.0%) | 0 (0.0%) |
| 40 to 44 Minutes | 0 (0.0%) | 3 (100.0%) |
| 45 to 59 Minutes | 0 (0.0%) | 0 (0.0%) |
| 60 to 89 Minutes | 0 (0.0%) | 0 (0.0%) |
| 90 or more Minutes | 0 (0.0%) | 0 (0.0%) |
Time of Departure to Work by Sex in May
The most frequent times of departure to work in May are 6:00 AM to 6:29 AM (3, 60.0%) for males and 7:00 AM to 7:29 AM (3, 100.0%) for females.
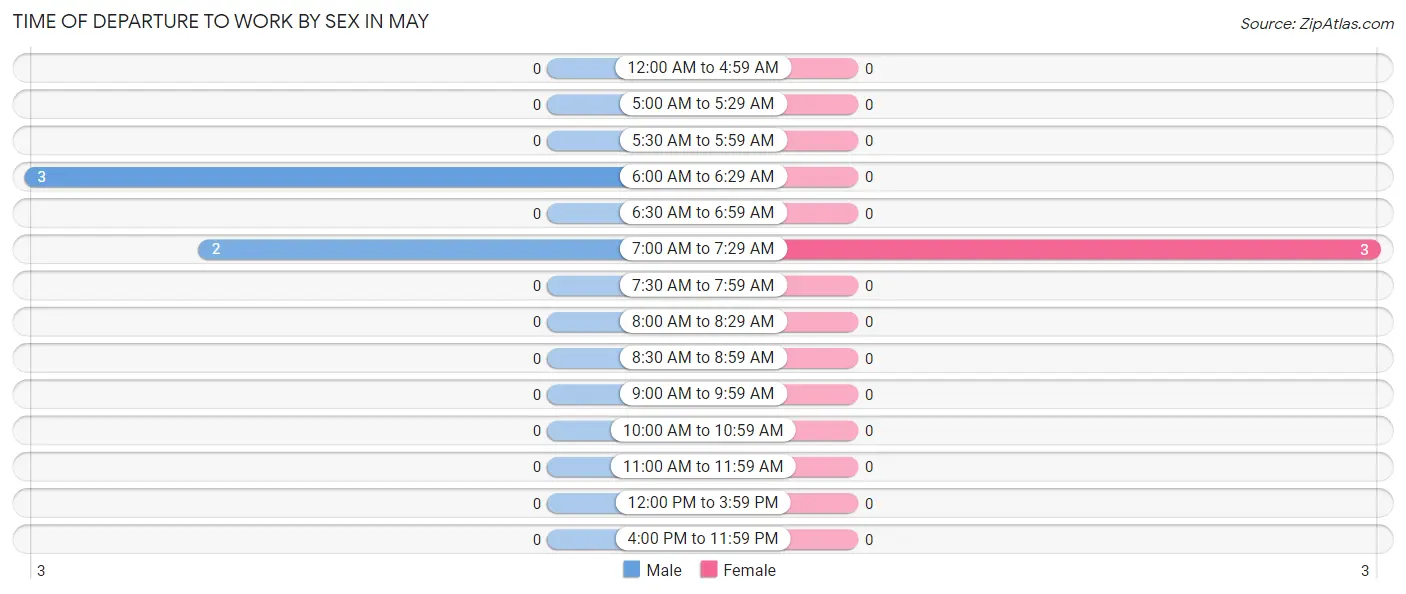
| Time of Departure | Male | Female |
| 12:00 AM to 4:59 AM | 0 (0.0%) | 0 (0.0%) |
| 5:00 AM to 5:29 AM | 0 (0.0%) | 0 (0.0%) |
| 5:30 AM to 5:59 AM | 0 (0.0%) | 0 (0.0%) |
| 6:00 AM to 6:29 AM | 3 (60.0%) | 0 (0.0%) |
| 6:30 AM to 6:59 AM | 0 (0.0%) | 0 (0.0%) |
| 7:00 AM to 7:29 AM | 2 (40.0%) | 3 (100.0%) |
| 7:30 AM to 7:59 AM | 0 (0.0%) | 0 (0.0%) |
| 8:00 AM to 8:29 AM | 0 (0.0%) | 0 (0.0%) |
| 8:30 AM to 8:59 AM | 0 (0.0%) | 0 (0.0%) |
| 9:00 AM to 9:59 AM | 0 (0.0%) | 0 (0.0%) |
| 10:00 AM to 10:59 AM | 0 (0.0%) | 0 (0.0%) |
| 11:00 AM to 11:59 AM | 0 (0.0%) | 0 (0.0%) |
| 12:00 PM to 3:59 PM | 0 (0.0%) | 0 (0.0%) |
| 4:00 PM to 11:59 PM | 0 (0.0%) | 0 (0.0%) |
| Total | 5 (100.0%) | 3 (100.0%) |
Housing Occupancy in May
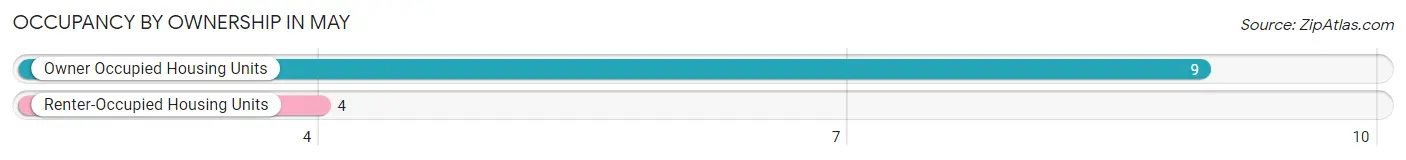
Occupancy by Ownership in May
Of the total 13 dwellings in May, owner-occupied units account for 9 (69.2%), while renter-occupied units make up 4 (30.8%).
| Occupancy | # Housing Units | % Housing Units |
| Owner Occupied Housing Units | 9 | 69.2% |
| Renter-Occupied Housing Units | 4 | 30.8% |
| Total Occupied Housing Units | 13 | 100.0% |
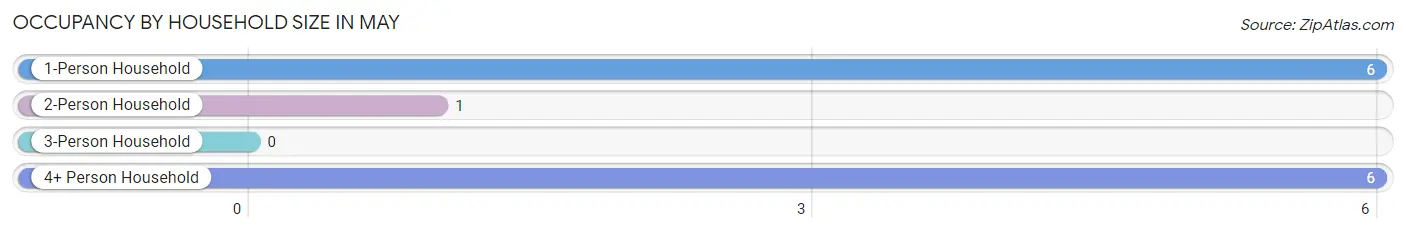
Occupancy by Household Size in May
| Household Size | # Housing Units | % Housing Units |
| 1-Person Household | 6 | 46.2% |
| 2-Person Household | 1 | 7.7% |
| 3-Person Household | 0 | 0.0% |
| 4+ Person Household | 6 | 46.2% |
| Total Housing Units | 13 | 100.0% |
Occupancy by Ownership by Household Size in May
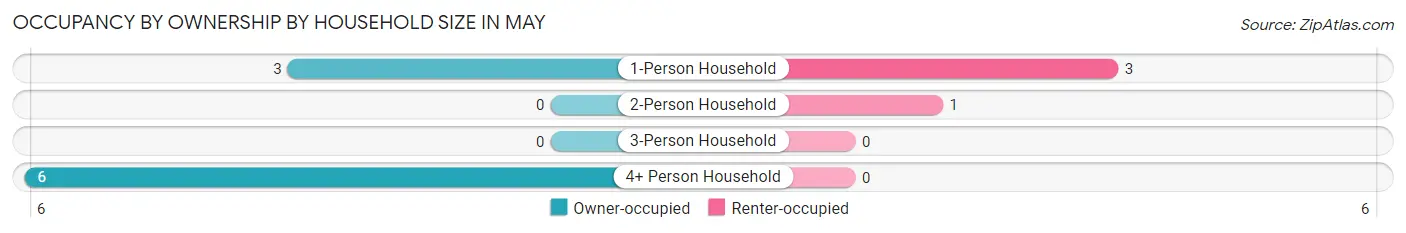
| Household Size | Owner-occupied | Renter-occupied |
| 1-Person Household | 3 (50.0%) | 3 (50.0%) |
| 2-Person Household | 0 (0.0%) | 1 (100.0%) |
| 3-Person Household | 0 (0.0%) | 0 (0.0%) |
| 4+ Person Household | 6 (100.0%) | 0 (0.0%) |
| Total Housing Units | 9 (69.2%) | 4 (30.8%) |
Occupancy by Educational Attainment in May
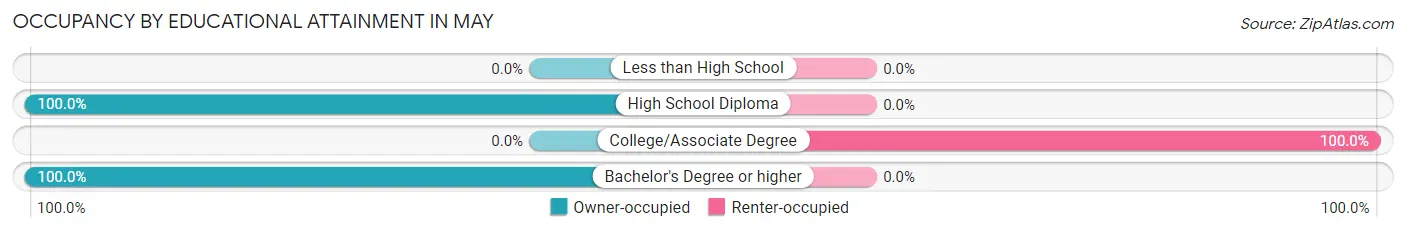
| Household Size | Owner-occupied | Renter-occupied |
| Less than High School | 0 (0.0%) | 0 (0.0%) |
| High School Diploma | 6 (100.0%) | 0 (0.0%) |
| College/Associate Degree | 0 (0.0%) | 4 (100.0%) |
| Bachelor's Degree or higher | 3 (100.0%) | 0 (0.0%) |
Occupancy by Age of Householder in May
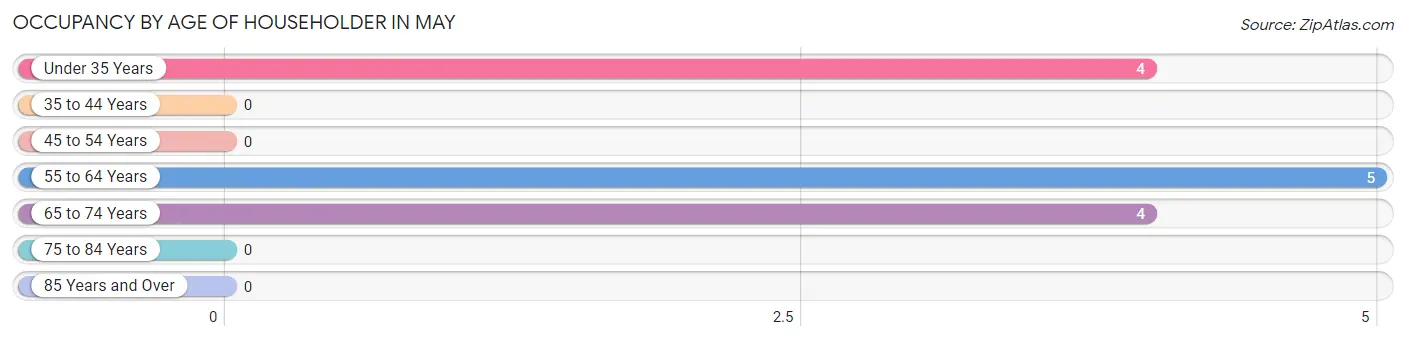
| Age Bracket | # Households | % Households |
| Under 35 Years | 4 | 30.8% |
| 35 to 44 Years | 0 | 0.0% |
| 45 to 54 Years | 0 | 0.0% |
| 55 to 64 Years | 5 | 38.5% |
| 65 to 74 Years | 4 | 30.8% |
| 75 to 84 Years | 0 | 0.0% |
| 85 Years and Over | 0 | 0.0% |
| Total | 13 | 100.0% |
Housing Finances in May
Median Income by Occupancy in May
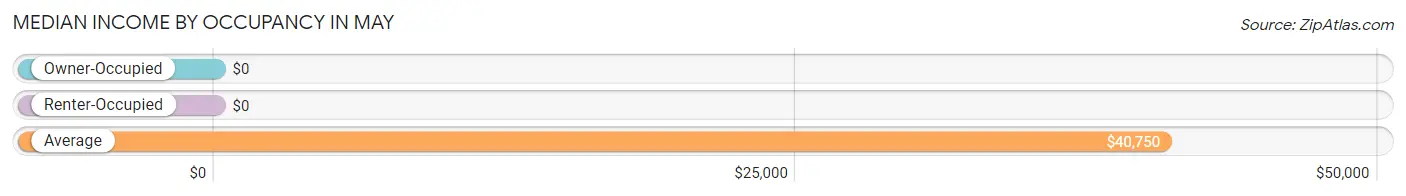
| Occupancy Type | # Households | Median Income |
| Owner-Occupied | 9 (69.2%) | $0 |
| Renter-Occupied | 4 (30.8%) | $0 |
| Average | 13 (100.0%) | $40,750 |
Occupancy by Householder Income Bracket in May
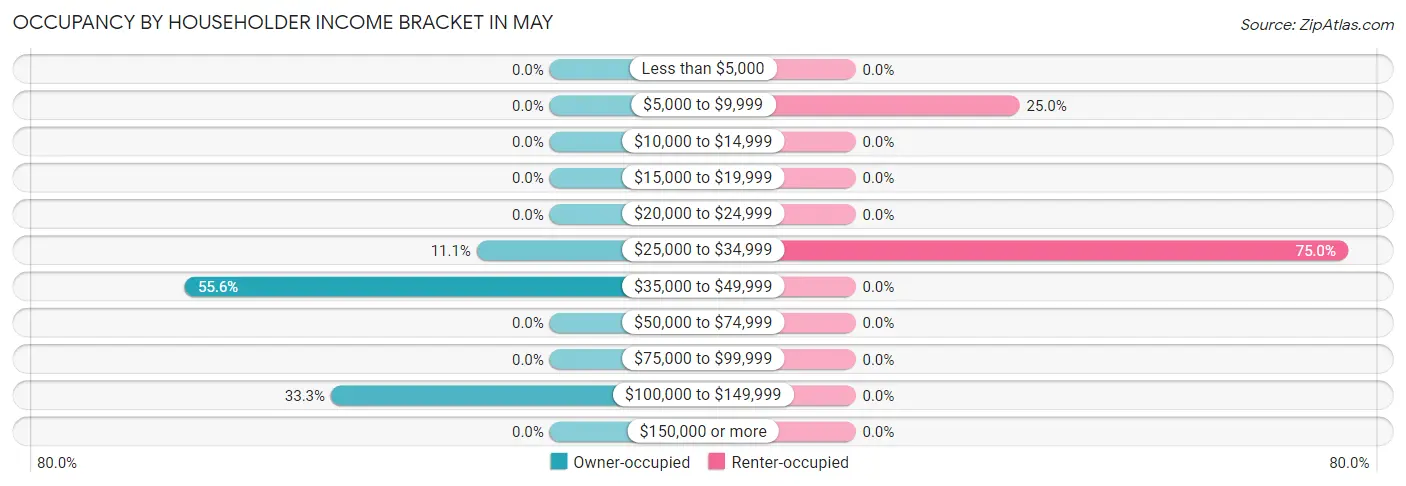
| Income Bracket | Owner-occupied | Renter-occupied |
| Less than $5,000 | 0 (0.0%) | 0 (0.0%) |
| $5,000 to $9,999 | 0 (0.0%) | 1 (25.0%) |
| $10,000 to $14,999 | 0 (0.0%) | 0 (0.0%) |
| $15,000 to $19,999 | 0 (0.0%) | 0 (0.0%) |
| $20,000 to $24,999 | 0 (0.0%) | 0 (0.0%) |
| $25,000 to $34,999 | 1 (11.1%) | 3 (75.0%) |
| $35,000 to $49,999 | 5 (55.6%) | 0 (0.0%) |
| $50,000 to $74,999 | 0 (0.0%) | 0 (0.0%) |
| $75,000 to $99,999 | 0 (0.0%) | 0 (0.0%) |
| $100,000 to $149,999 | 3 (33.3%) | 0 (0.0%) |
| $150,000 or more | 0 (0.0%) | 0 (0.0%) |
| Total | 9 (100.0%) | 4 (100.0%) |
Monthly Housing Cost Tiers in May
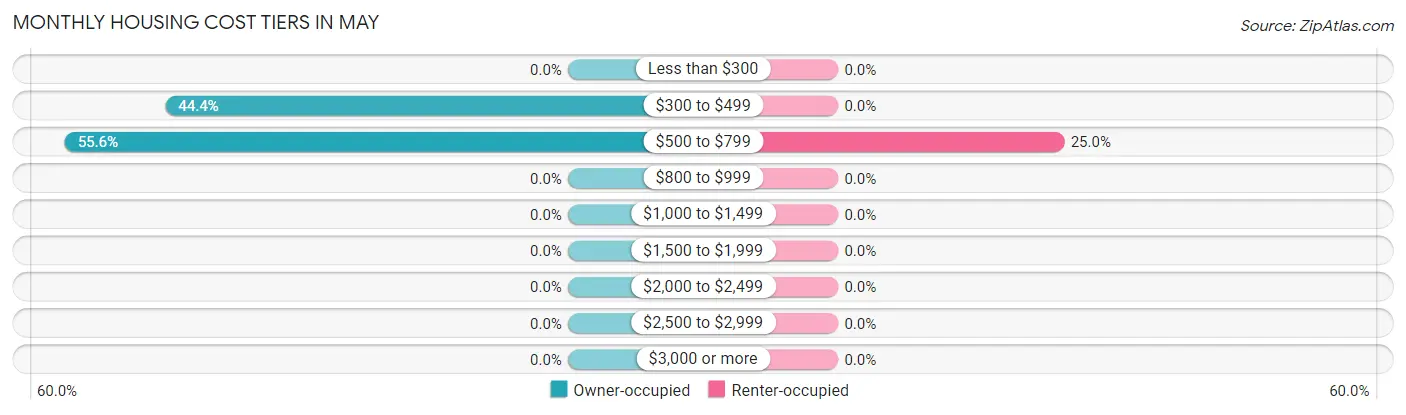
| Monthly Cost | Owner-occupied | Renter-occupied |
| Less than $300 | 0 (0.0%) | 0 (0.0%) |
| $300 to $499 | 4 (44.4%) | 0 (0.0%) |
| $500 to $799 | 5 (55.6%) | 1 (25.0%) |
| $800 to $999 | 0 (0.0%) | 0 (0.0%) |
| $1,000 to $1,499 | 0 (0.0%) | 0 (0.0%) |
| $1,500 to $1,999 | 0 (0.0%) | 0 (0.0%) |
| $2,000 to $2,499 | 0 (0.0%) | 0 (0.0%) |
| $2,500 to $2,999 | 0 (0.0%) | 0 (0.0%) |
| $3,000 or more | 0 (0.0%) | 0 (0.0%) |
| Total | 9 (100.0%) | 4 (100.0%) |
Physical Housing Characteristics in May
Housing Structures in May
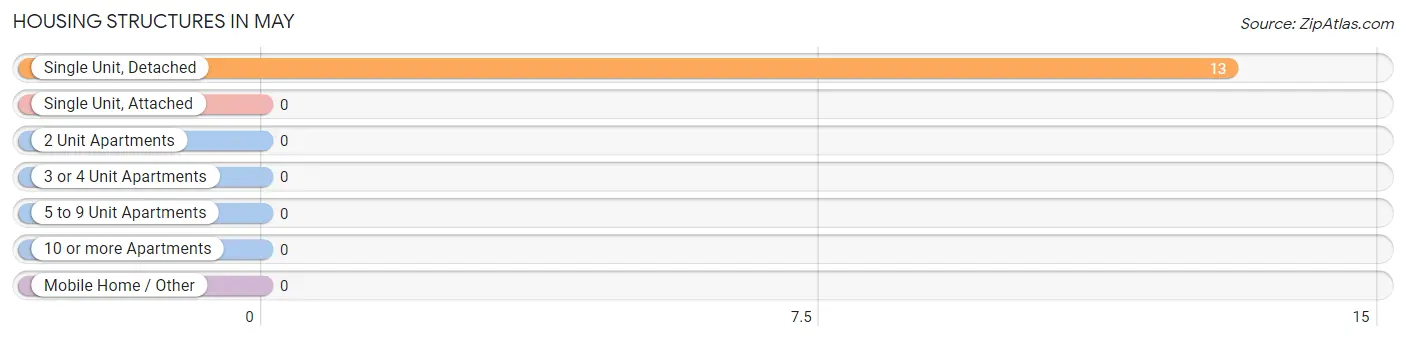
| Structure Type | # Housing Units | % Housing Units |
| Single Unit, Detached | 13 | 100.0% |
| Single Unit, Attached | 0 | 0.0% |
| 2 Unit Apartments | 0 | 0.0% |
| 3 or 4 Unit Apartments | 0 | 0.0% |
| 5 to 9 Unit Apartments | 0 | 0.0% |
| 10 or more Apartments | 0 | 0.0% |
| Mobile Home / Other | 0 | 0.0% |
| Total | 13 | 100.0% |
Housing Structures by Occupancy in May
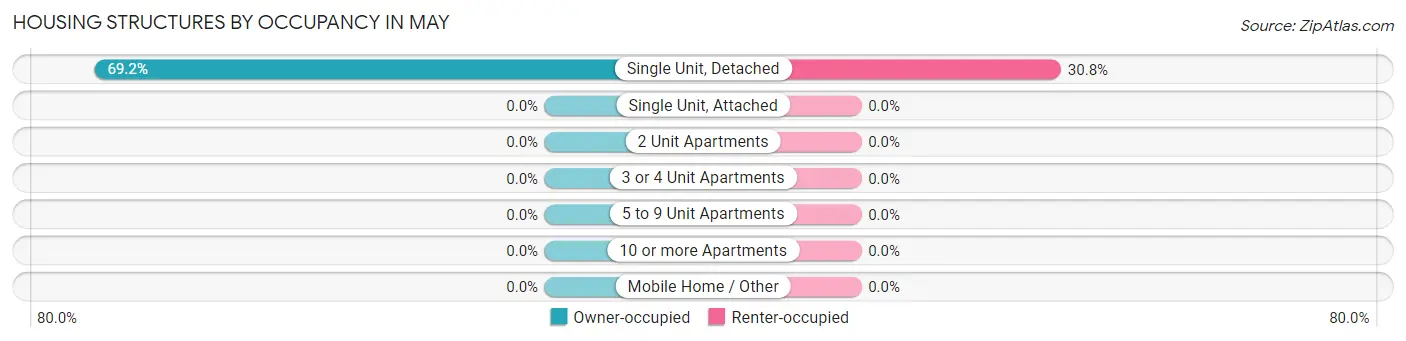
| Structure Type | Owner-occupied | Renter-occupied |
| Single Unit, Detached | 9 (69.2%) | 4 (30.8%) |
| Single Unit, Attached | 0 (0.0%) | 0 (0.0%) |
| 2 Unit Apartments | 0 (0.0%) | 0 (0.0%) |
| 3 or 4 Unit Apartments | 0 (0.0%) | 0 (0.0%) |
| 5 to 9 Unit Apartments | 0 (0.0%) | 0 (0.0%) |
| 10 or more Apartments | 0 (0.0%) | 0 (0.0%) |
| Mobile Home / Other | 0 (0.0%) | 0 (0.0%) |
| Total | 9 (69.2%) | 4 (30.8%) |
Housing Structures by Number of Rooms in May
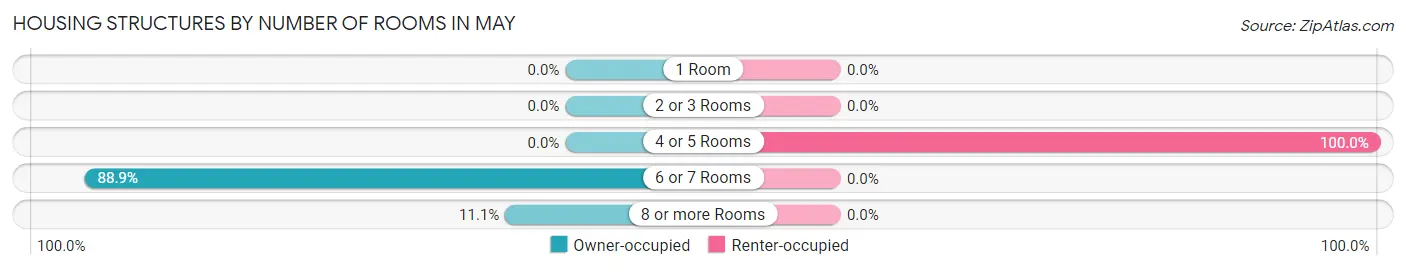
| Number of Rooms | Owner-occupied | Renter-occupied |
| 1 Room | 0 (0.0%) | 0 (0.0%) |
| 2 or 3 Rooms | 0 (0.0%) | 0 (0.0%) |
| 4 or 5 Rooms | 0 (0.0%) | 4 (100.0%) |
| 6 or 7 Rooms | 8 (88.9%) | 0 (0.0%) |
| 8 or more Rooms | 1 (11.1%) | 0 (0.0%) |
| Total | 9 (100.0%) | 4 (100.0%) |
Housing Structure by Heating Type in May
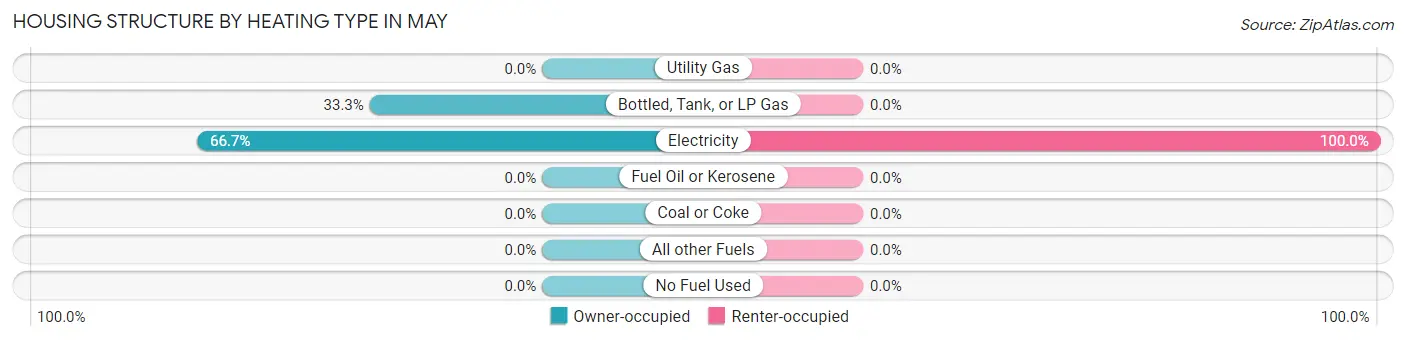
| Heating Type | Owner-occupied | Renter-occupied |
| Utility Gas | 0 (0.0%) | 0 (0.0%) |
| Bottled, Tank, or LP Gas | 3 (33.3%) | 0 (0.0%) |
| Electricity | 6 (66.7%) | 4 (100.0%) |
| Fuel Oil or Kerosene | 0 (0.0%) | 0 (0.0%) |
| Coal or Coke | 0 (0.0%) | 0 (0.0%) |
| All other Fuels | 0 (0.0%) | 0 (0.0%) |
| No Fuel Used | 0 (0.0%) | 0 (0.0%) |
| Total | 9 (100.0%) | 4 (100.0%) |
Household Vehicle Usage in May
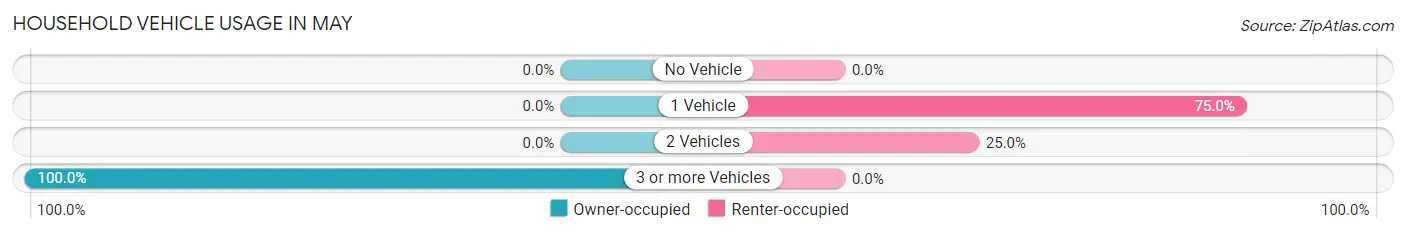
| Vehicles per Household | Owner-occupied | Renter-occupied |
| No Vehicle | 0 (0.0%) | 0 (0.0%) |
| 1 Vehicle | 0 (0.0%) | 3 (75.0%) |
| 2 Vehicles | 0 (0.0%) | 1 (25.0%) |
| 3 or more Vehicles | 9 (100.0%) | 0 (0.0%) |
| Total | 9 (100.0%) | 4 (100.0%) |
Real Estate & Mortgages in May
Real Estate and Mortgage Overview in May
| Characteristic | Without Mortgage | With Mortgage |
| Housing Units | 9 | 0 |
| Median Property Value | - | - |
| Median Household Income | - | - |
| Monthly Housing Costs | $510 | $0 |
| Real Estate Taxes | $290 | $0 |
Property Value by Mortgage Status in May
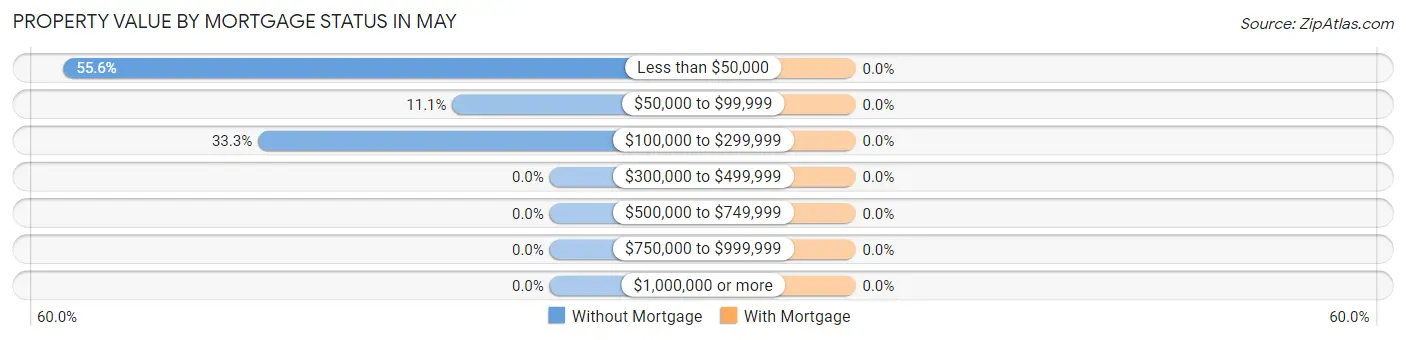
| Property Value | Without Mortgage | With Mortgage |
| Less than $50,000 | 5 (55.6%) | 0 (0.0%) |
| $50,000 to $99,999 | 1 (11.1%) | 0 (0.0%) |
| $100,000 to $299,999 | 3 (33.3%) | 0 (0.0%) |
| $300,000 to $499,999 | 0 (0.0%) | 0 (0.0%) |
| $500,000 to $749,999 | 0 (0.0%) | 0 (0.0%) |
| $750,000 to $999,999 | 0 (0.0%) | 0 (0.0%) |
| $1,000,000 or more | 0 (0.0%) | 0 (0.0%) |
| Total | 9 (100.0%) | 0 (0.0%) |
Household Income by Mortgage Status in May
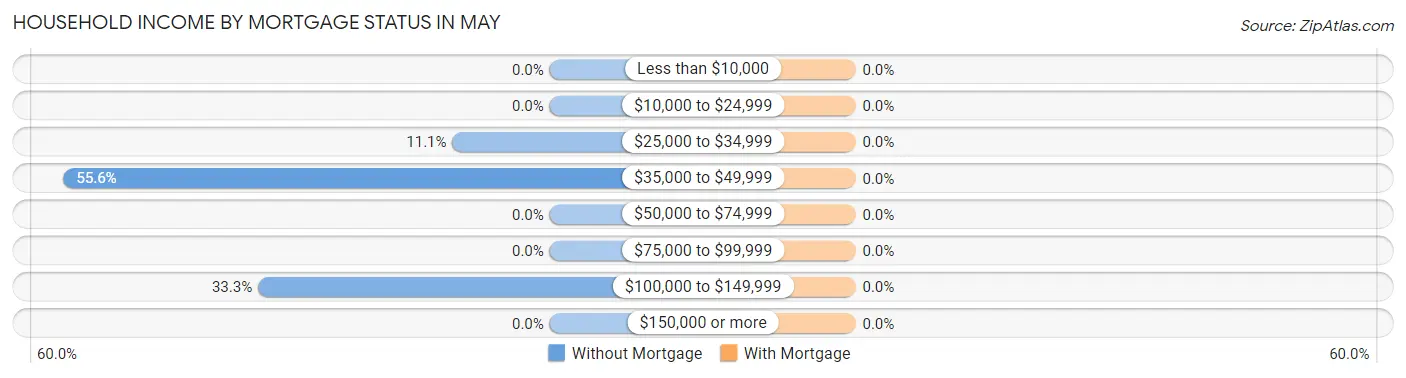
| Household Income | Without Mortgage | With Mortgage |
| Less than $10,000 | 0 (0.0%) | 0 (0.0%) |
| $10,000 to $24,999 | 0 (0.0%) | 0 (0.0%) |
| $25,000 to $34,999 | 1 (11.1%) | 0 (0.0%) |
| $35,000 to $49,999 | 5 (55.6%) | 0 (0.0%) |
| $50,000 to $74,999 | 0 (0.0%) | 0 (0.0%) |
| $75,000 to $99,999 | 0 (0.0%) | 0 (0.0%) |
| $100,000 to $149,999 | 3 (33.3%) | 0 (0.0%) |
| $150,000 or more | 0 (0.0%) | 0 (0.0%) |
| Total | 9 (100.0%) | 0 (0.0%) |
Property Value to Household Income Ratio in May
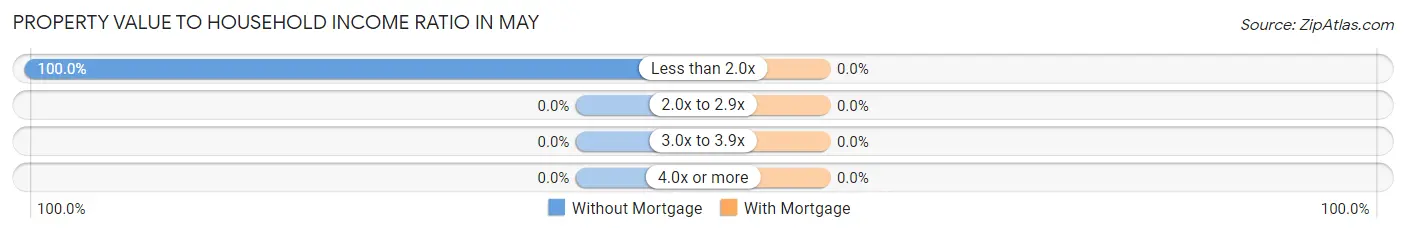
| Value-to-Income Ratio | Without Mortgage | With Mortgage |
| Less than 2.0x | 9 (100.0%) | 0 (0.0%) |
| 2.0x to 2.9x | 0 (0.0%) | 0 (0.0%) |
| 3.0x to 3.9x | 0 (0.0%) | 0 (0.0%) |
| 4.0x or more | 0 (0.0%) | 0 (0.0%) |
| Total | 9 (100.0%) | 0 (0.0%) |
Real Estate Taxes by Mortgage Status in May
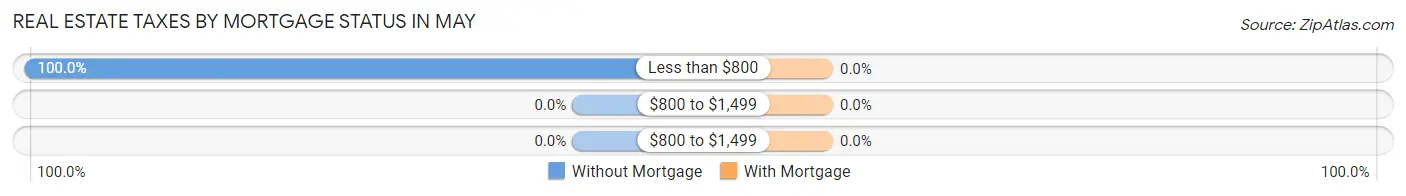
| Property Taxes | Without Mortgage | With Mortgage |
| Less than $800 | 9 (100.0%) | 0 (0.0%) |
| $800 to $1,499 | 0 (0.0%) | 0 (0.0%) |
| $800 to $1,499 | 0 (0.0%) | 0 (0.0%) |
| Total | 9 (100.0%) | 0 (0.0%) |
Health & Disability in May
Health Insurance Coverage by Age in May
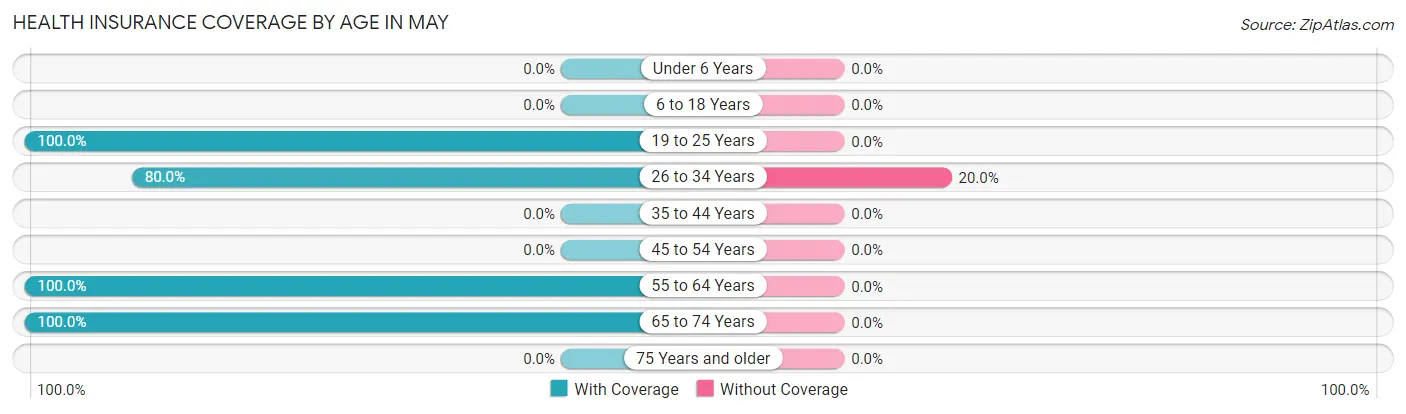
| Age Bracket | With Coverage | Without Coverage |
| Under 6 Years | 0 (0.0%) | 0 (0.0%) |
| 6 to 18 Years | 0 (0.0%) | 0 (0.0%) |
| 19 to 25 Years | 3 (100.0%) | 0 (0.0%) |
| 26 to 34 Years | 16 (80.0%) | 4 (20.0%) |
| 35 to 44 Years | 0 (0.0%) | 0 (0.0%) |
| 45 to 54 Years | 0 (0.0%) | 0 (0.0%) |
| 55 to 64 Years | 12 (100.0%) | 0 (0.0%) |
| 65 to 74 Years | 4 (100.0%) | 0 (0.0%) |
| 75 Years and older | 0 (0.0%) | 0 (0.0%) |
| Total | 35 (89.7%) | 4 (10.3%) |
Health Insurance Coverage by Citizenship Status in May
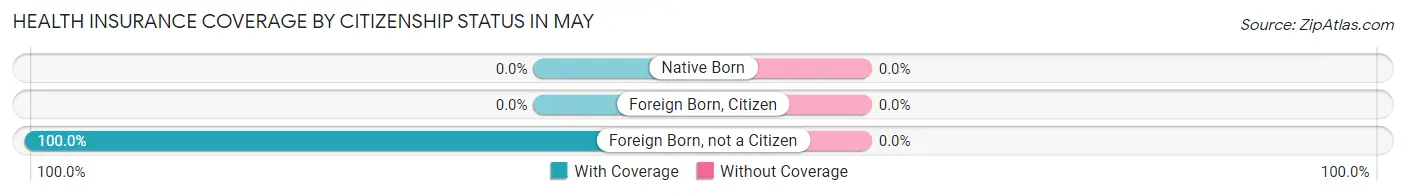
| Citizenship Status | With Coverage | Without Coverage |
| Native Born | 0 (0.0%) | 0 (0.0%) |
| Foreign Born, Citizen | 0 (0.0%) | 0 (0.0%) |
| Foreign Born, not a Citizen | 3 (100.0%) | 0 (0.0%) |
Health Insurance Coverage by Household Income in May
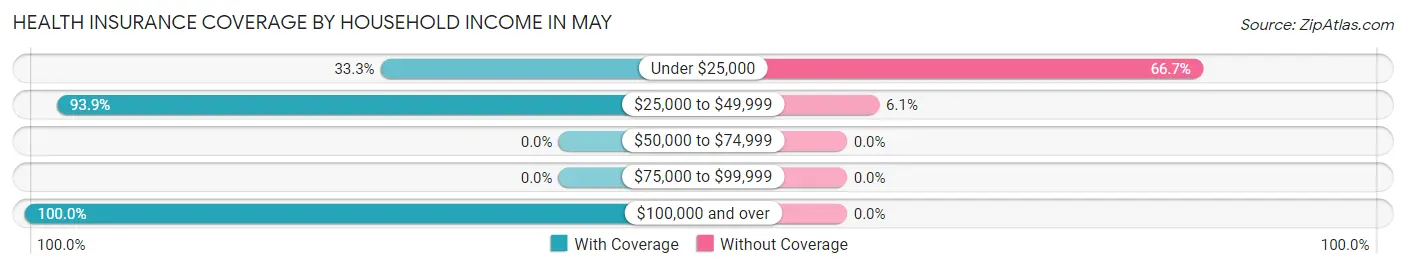
| Household Income | With Coverage | Without Coverage |
| Under $25,000 | 1 (33.3%) | 2 (66.7%) |
| $25,000 to $49,999 | 31 (93.9%) | 2 (6.1%) |
| $50,000 to $74,999 | 0 (0.0%) | 0 (0.0%) |
| $75,000 to $99,999 | 0 (0.0%) | 0 (0.0%) |
| $100,000 and over | 3 (100.0%) | 0 (0.0%) |
Public vs Private Health Insurance Coverage by Age in May
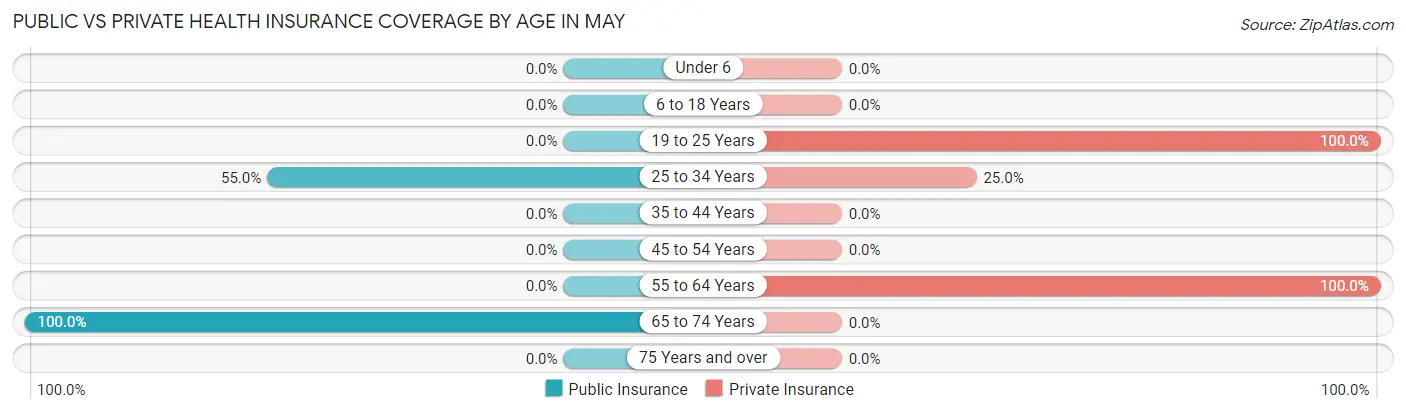
| Age Bracket | Public Insurance | Private Insurance |
| Under 6 | 0 (0.0%) | 0 (0.0%) |
| 6 to 18 Years | 0 (0.0%) | 0 (0.0%) |
| 19 to 25 Years | 0 (0.0%) | 3 (100.0%) |
| 25 to 34 Years | 11 (55.0%) | 5 (25.0%) |
| 35 to 44 Years | 0 (0.0%) | 0 (0.0%) |
| 45 to 54 Years | 0 (0.0%) | 0 (0.0%) |
| 55 to 64 Years | 0 (0.0%) | 12 (100.0%) |
| 65 to 74 Years | 4 (100.0%) | 0 (0.0%) |
| 75 Years and over | 0 (0.0%) | 0 (0.0%) |
| Total | 15 (38.5%) | 20 (51.3%) |
Disability Status by Sex by Age in May
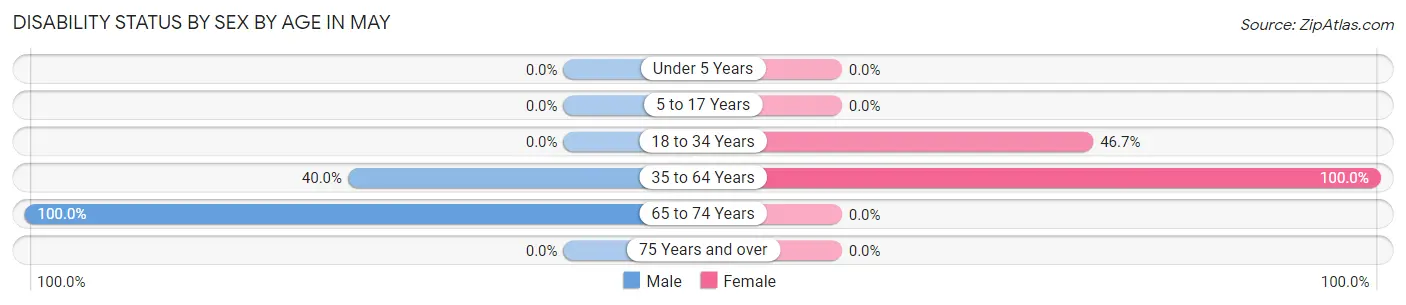
| Age Bracket | Male | Female |
| Under 5 Years | 0 (0.0%) | 0 (0.0%) |
| 5 to 17 Years | 0 (0.0%) | 0 (0.0%) |
| 18 to 34 Years | 0 (0.0%) | 7 (46.7%) |
| 35 to 64 Years | 2 (40.0%) | 7 (100.0%) |
| 65 to 74 Years | 4 (100.0%) | 0 (0.0%) |
| 75 Years and over | 0 (0.0%) | 0 (0.0%) |
Disability Class by Sex by Age in May
Disability Class: Hearing Difficulty
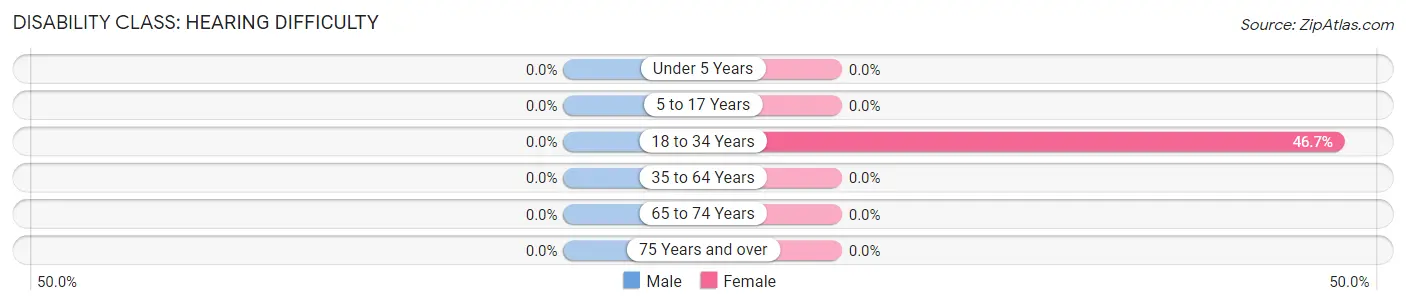
| Age Bracket | Male | Female |
| Under 5 Years | 0 (0.0%) | 0 (0.0%) |
| 5 to 17 Years | 0 (0.0%) | 0 (0.0%) |
| 18 to 34 Years | 0 (0.0%) | 7 (46.7%) |
| 35 to 64 Years | 0 (0.0%) | 0 (0.0%) |
| 65 to 74 Years | 0 (0.0%) | 0 (0.0%) |
| 75 Years and over | 0 (0.0%) | 0 (0.0%) |
Disability Class: Vision Difficulty
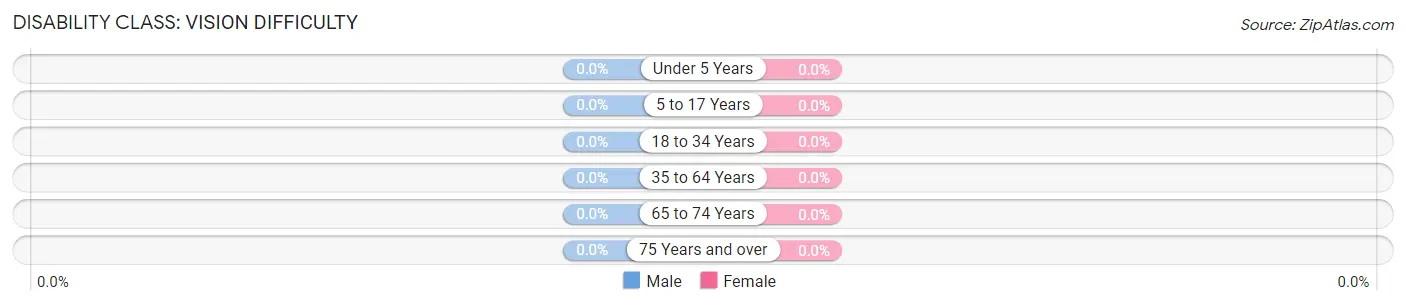
| Age Bracket | Male | Female |
| Under 5 Years | 0 (0.0%) | 0 (0.0%) |
| 5 to 17 Years | 0 (0.0%) | 0 (0.0%) |
| 18 to 34 Years | 0 (0.0%) | 0 (0.0%) |
| 35 to 64 Years | 0 (0.0%) | 0 (0.0%) |
| 65 to 74 Years | 0 (0.0%) | 0 (0.0%) |
| 75 Years and over | 0 (0.0%) | 0 (0.0%) |
Disability Class: Cognitive Difficulty
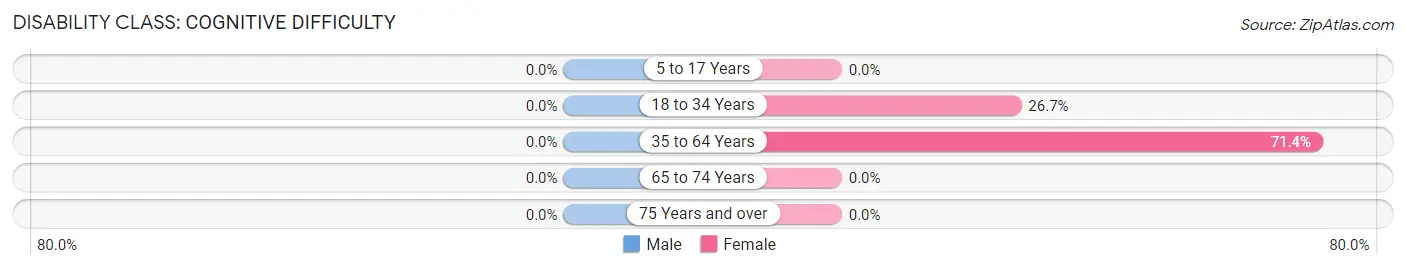
| Age Bracket | Male | Female |
| 5 to 17 Years | 0 (0.0%) | 0 (0.0%) |
| 18 to 34 Years | 0 (0.0%) | 4 (26.7%) |
| 35 to 64 Years | 0 (0.0%) | 5 (71.4%) |
| 65 to 74 Years | 0 (0.0%) | 0 (0.0%) |
| 75 Years and over | 0 (0.0%) | 0 (0.0%) |
Disability Class: Ambulatory Difficulty
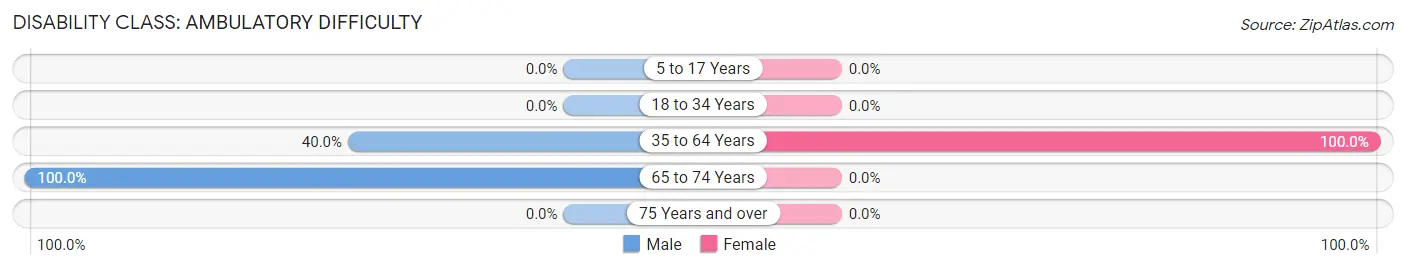
| Age Bracket | Male | Female |
| 5 to 17 Years | 0 (0.0%) | 0 (0.0%) |
| 18 to 34 Years | 0 (0.0%) | 0 (0.0%) |
| 35 to 64 Years | 2 (40.0%) | 7 (100.0%) |
| 65 to 74 Years | 4 (100.0%) | 0 (0.0%) |
| 75 Years and over | 0 (0.0%) | 0 (0.0%) |
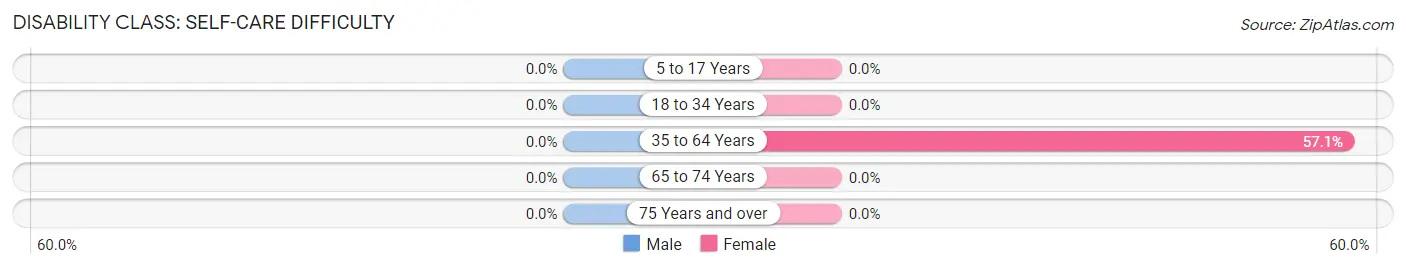
Disability Class: Self-Care Difficulty
| Age Bracket | Male | Female |
| 5 to 17 Years | 0 (0.0%) | 0 (0.0%) |
| 18 to 34 Years | 0 (0.0%) | 0 (0.0%) |
| 35 to 64 Years | 0 (0.0%) | 4 (57.1%) |
| 65 to 74 Years | 0 (0.0%) | 0 (0.0%) |
| 75 Years and over | 0 (0.0%) | 0 (0.0%) |
Technology Access in May
Computing Device Access in May
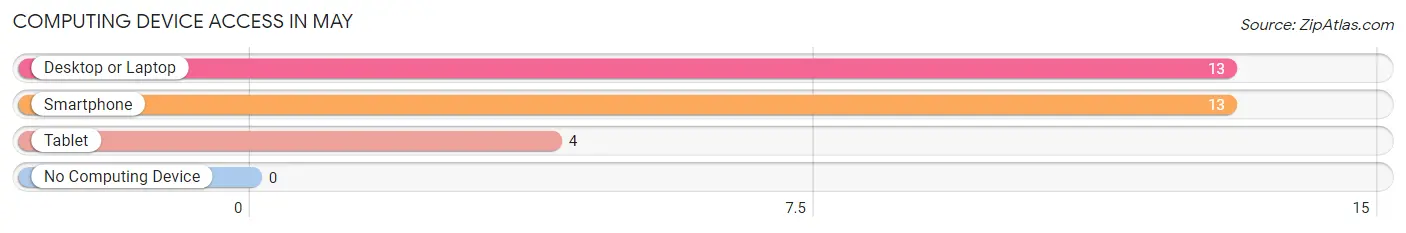
| Device Type | # Households | % Households |
| Desktop or Laptop | 13 | 100.0% |
| Smartphone | 13 | 100.0% |
| Tablet | 4 | 30.8% |
| No Computing Device | 0 | 0.0% |
| Total | 13 | 100.0% |
Internet Access in May
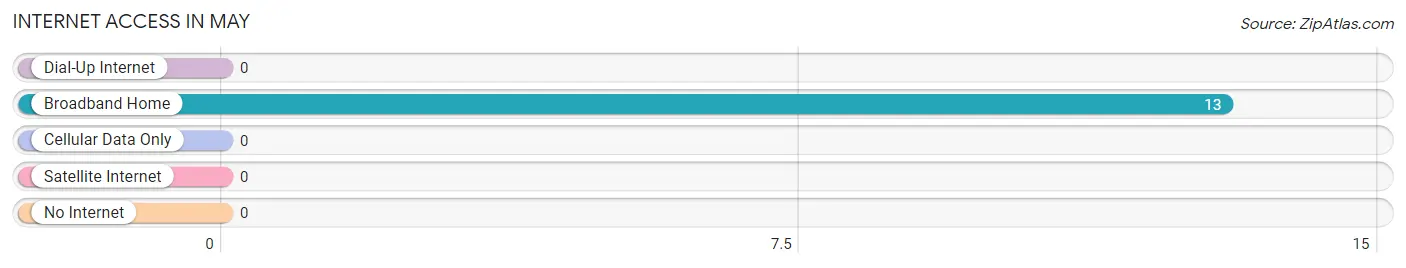
| Internet Type | # Households | % Households |
| Dial-Up Internet | 0 | 0.0% |
| Broadband Home | 13 | 100.0% |
| Cellular Data Only | 0 | 0.0% |
| Satellite Internet | 0 | 0.0% |
| No Internet | 0 | 0.0% |
| Total | 13 | 100.0% |
May Summary
Oklahoma is a state located in the South Central region of the United States. It is bordered by Texas to the south, Arkansas to the east, Kansas to the north, and Colorado and New Mexico to the west. Oklahoma is the 20th most extensive and the 28th most populous of the 50 United States. The state's name is derived from the Choctaw words okla and humma, meaning "red people". It is also known informally by its nickname, The Sooner State, in reference to the non-Native settlers who staked their claims on the choicest pieces of land before the official opening date of lands in the western Oklahoma Territory or before the Indian Appropriations Act of 1889, which increased European-American settlement in the eastern Indian Territory.
Geography
Oklahoma is located in the Great Plains and U.S. Interior Highlands—a region prone to severe weather. It is situated in the middle of an active oil field and contains seven primary physiographic regions: the Ozark and Ouachita Mountains, the Arkansas River Valley, the Red Bed Plains, the Granite Uplift, the Sandstone Hills, the Gypsum Hills, and the Cross Timbers. The state's highest peak is Black Mesa at 4,973 feet (1,516 m). The state has an area of 68,594 square miles (177,660 km2), making it the 20th largest state in the United States.
Economy
Oklahoma's economy is diverse and has grown rapidly in recent years. The state's gross domestic product (GDP) was estimated at $179 billion in 2018, making it the 28th largest economy in the United States. The state's economy is heavily reliant on the energy sector, with oil and natural gas production accounting for a large portion of the state's GDP. Other major industries include agriculture, manufacturing, aerospace, and tourism.
Demographics
As of the 2010 census, Oklahoma had a population of 3,751,616, making it the 28th most populous state in the United States. The state's population is composed of a variety of ethnic and racial groups. The largest racial group is White Americans, making up 66.3% of the population. African Americans make up 8.2% of the population, while Native Americans make up 8.9%. Hispanics and Latinos make up 8.9% of the population, and Asians make up 2.2%.
Oklahoma has a large Native American population, with 39 federally recognized tribes. The largest tribes are the Cherokee, Choctaw, Chickasaw, Creek, and Seminole. The state also has a large population of African Americans, many of whom are descendants of slaves brought to the state during the 19th century.
Conclusion
Oklahoma is a state located in the South Central region of the United States. It is bordered by Texas to the south, Arkansas to the east, Kansas to the north, and Colorado and New Mexico to the west. Oklahoma is the 20th most extensive and the 28th most populous of the 50 United States. The state's economy is heavily reliant on the energy sector, with oil and natural gas production accounting for a large portion of the state's GDP. The state's population is composed of a variety of ethnic and racial groups, with the largest being White Americans, making up 66.3% of the population. Oklahoma also has a large Native American population, with 39 federally recognized tribes.
Common Questions
What is Per Capita Income in May?
Per Capita income in May is $18,636.
What is the Median Family Income in May?
Median Family Income in May is $31,000.
What is the Median Household income in May?
Median Household Income in May is $40,750.
What is Inequality or Gini Index in May?
Inequality or Gini Index in May is 0.34.
What is the Total Population of May?
Total Population of May is 39.
What is the Total Male Population of May?
Total Male Population of May is 17.
What is the Total Female Population of May?
Total Female Population of May is 22.
What is the Ratio of Males per 100 Females in May?
There are 77.27 Males per 100 Females in May.
What is the Ratio of Females per 100 Males in May?
There are 129.41 Females per 100 Males in May.
What is the Median Population Age in May?
Median Population Age in May is 34.1 Years.
What is the Average Family Size in May
Average Family Size in May is 3.2 People.
What is the Average Household Size in May
Average Household Size in May is 3.0 People.
How Large is the Labor Force in May?
There are 13 People in the Labor Forcein in May.
What is the Percentage of People in the Labor Force in May?
33.3% of People are in the Labor Force in May.
What is the Unemployment Rate in May?
Unemployment Rate in May is 38.5%.