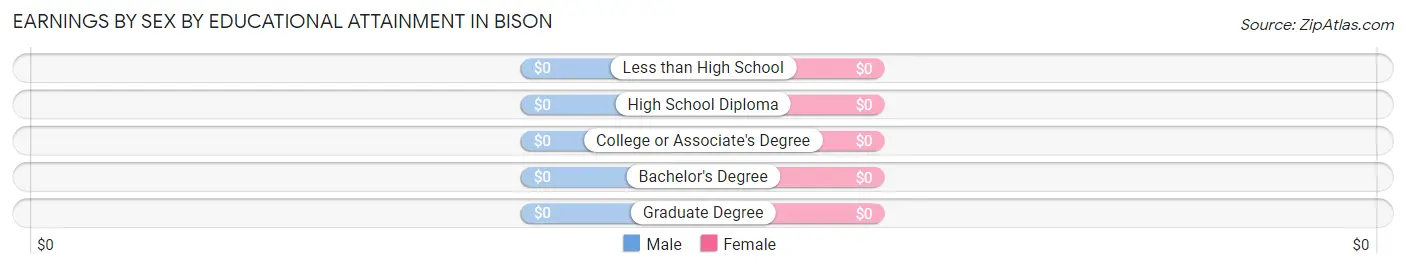
Earnings by Sex by Educational Attainment in Bison
Educational Attainment
Male Income
Female Income
Less than High School
-
-
High School Diploma
-
-
College or Associate's Degree
-
-
Bachelor's Degree
-
-
Graduate Degree
-
-
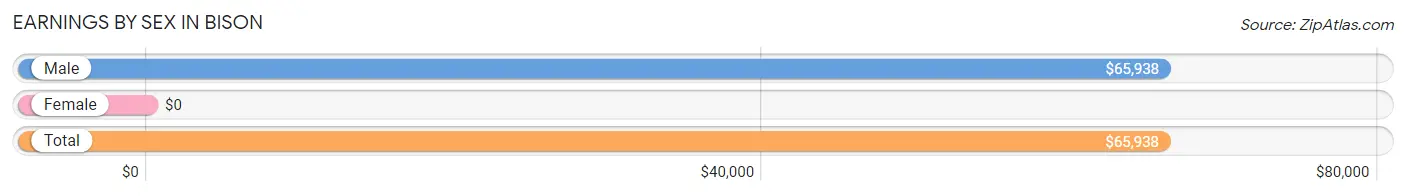
Total
$65,938
$0
Family Income in Bison
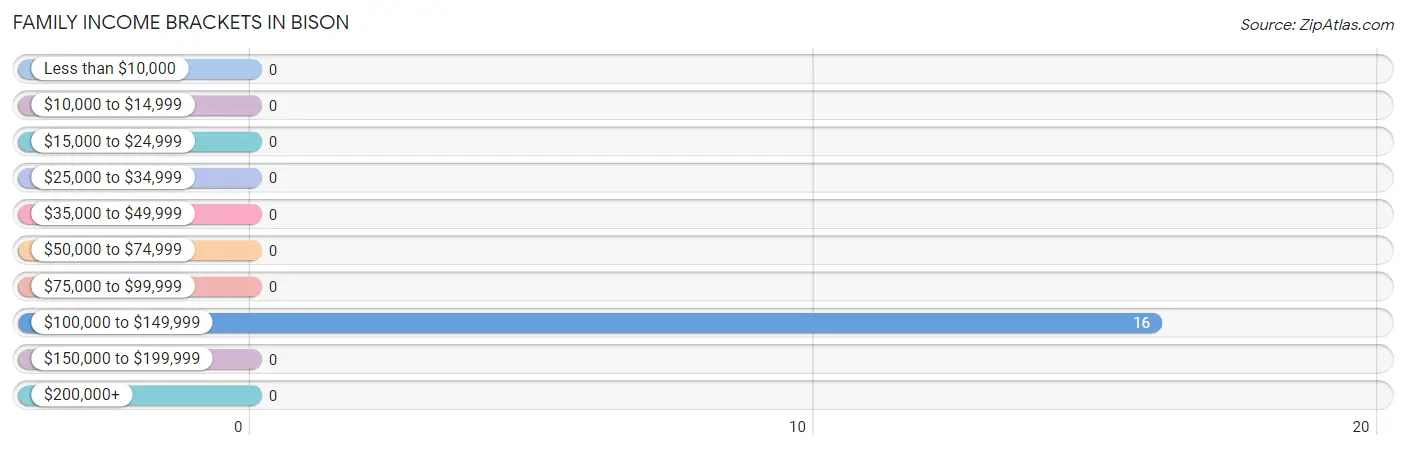
Family Income Brackets in Bison
According to the Bison family income data, there are 16 families falling into the $100,000 to $149,999 income range, which is the most common income bracket and makes up 100.0% of all families.
Income Bracket
# Families
% Families
Less than $10,000
0
0.0%
$10,000 to $14,999
0
0.0%
$15,000 to $24,999
0
0.0%
$25,000 to $34,999
0
0.0%
$35,000 to $49,999
0
0.0%
$50,000 to $74,999
0
0.0%
$75,000 to $99,999
0
0.0%
$100,000 to $149,999
16
100.0%
$150,000 to $199,999
0
0.0%
$200,000+
0
0.0%
Family Income by Famaliy Size in Bison
Income Bracket
# Families
Median Income
2-Person Families
16 (100.0%)
$0
3-Person Families
0 (0.0%)
$0
4-Person Families
0 (0.0%)
$0
5-Person Families
0 (0.0%)
$0
6-Person Families
0 (0.0%)
$0
7+ Person Families
0 (0.0%)
$0
Total
16 (100.0%)
$0
Family Income by Number of Earners in Bison
Number of Earners
# Families
Median Income
No Earners
0 (0.0%)
$0
1 Earner
16 (100.0%)
$0
2 Earners
0 (0.0%)
$0
3+ Earners
0 (0.0%)
$0
Total
16 (100.0%)
$0
Household Income in Bison
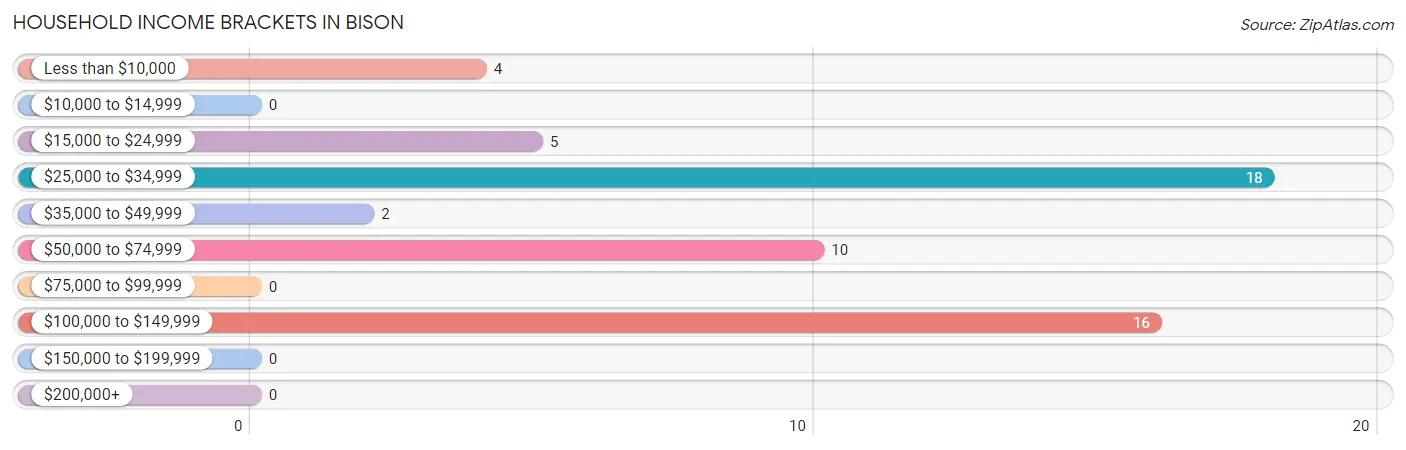
Household Income Brackets in Bison
With 18 households falling in the category, the $25,000 to $34,999 income range is the most frequent in Bison, accounting for 32.7% of all households.
Income Bracket
# Households
% Households
Less than $10,000
4
7.3%
$10,000 to $14,999
0
0.0%
$15,000 to $24,999
5
9.1%
$25,000 to $34,999
18
32.7%
$35,000 to $49,999
2
3.6%
$50,000 to $74,999
10
18.2%
$75,000 to $99,999
0
0.0%
$100,000 to $149,999
16
29.1%
$150,000 to $199,999
0
0.0%
$200,000+
0
0.0%
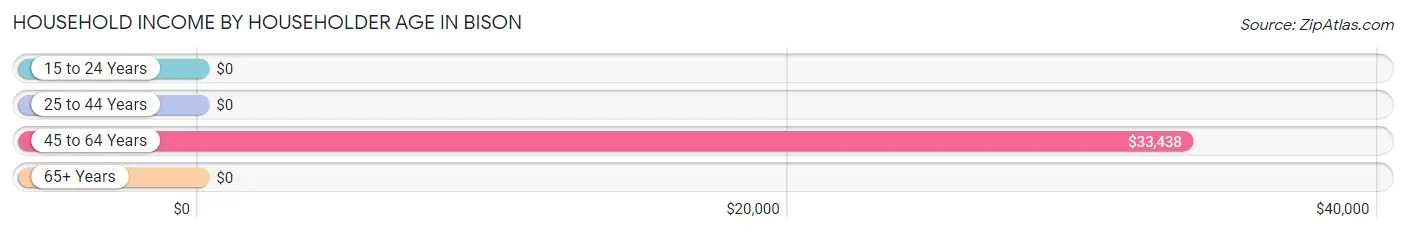
Household Income by Householder Age in Bison
The median household income in Bison is $0, with the highest median household income of $33,438 found in the 45 to 64 years age bracket for the primary householder. A total of 14 households (25.5%) fall into this category.
Income Bracket
# Households
Median Income
15 to 24 Years
0 (0.0%)
$0
25 to 44 Years
20 (36.4%)
$0
45 to 64 Years
14 (25.5%)
$33,438
65+ Years
21 (38.2%)
$0
Total
55 (100.0%)
$0
Poverty in Bison
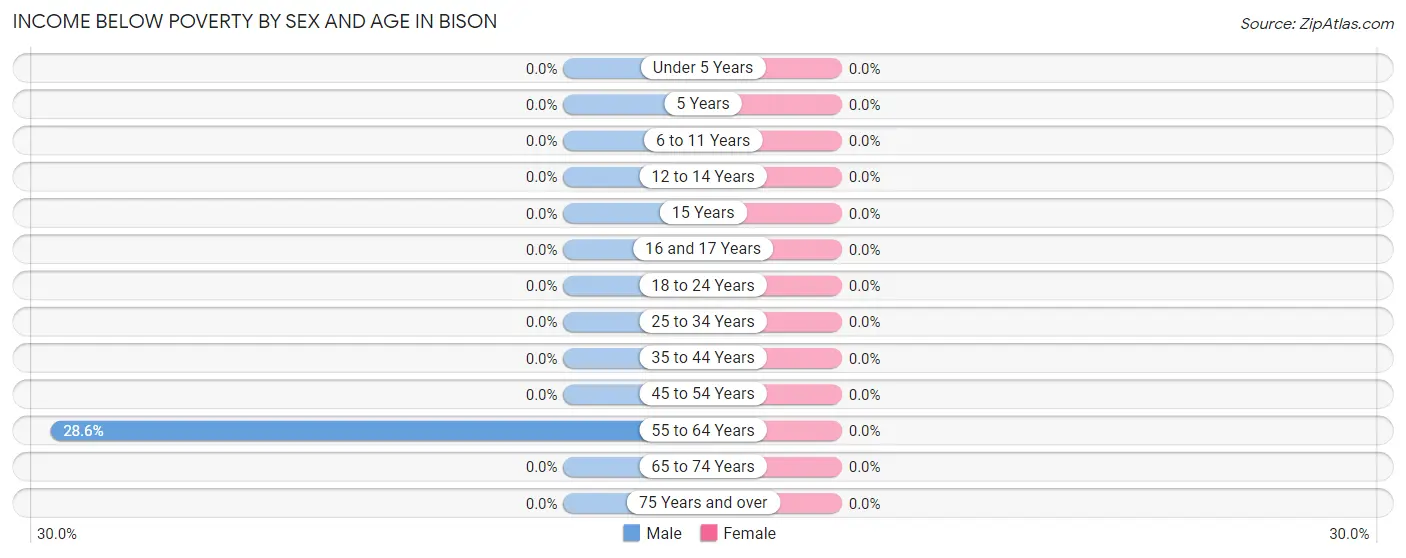
Income Below Poverty by Sex and Age in Bison
Age Bracket
Male
Female
Under 5 Years
0 (0.0%)
0 (0.0%)
5 Years
0 (0.0%)
0 (0.0%)
6 to 11 Years
0 (0.0%)
0 (0.0%)
12 to 14 Years
0 (0.0%)
0 (0.0%)
15 Years
0 (0.0%)
0 (0.0%)
16 and 17 Years
0 (0.0%)
0 (0.0%)
18 to 24 Years
0 (0.0%)
0 (0.0%)
25 to 34 Years
0 (0.0%)
0 (0.0%)
35 to 44 Years
0 (0.0%)
0 (0.0%)
45 to 54 Years
0 (0.0%)
0 (0.0%)
55 to 64 Years
4 (28.6%)
0 (0.0%)
65 to 74 Years
0 (0.0%)
0 (0.0%)
75 Years and over
0 (0.0%)
0 (0.0%)
Total
4 (8.0%)
0 (0.0%)
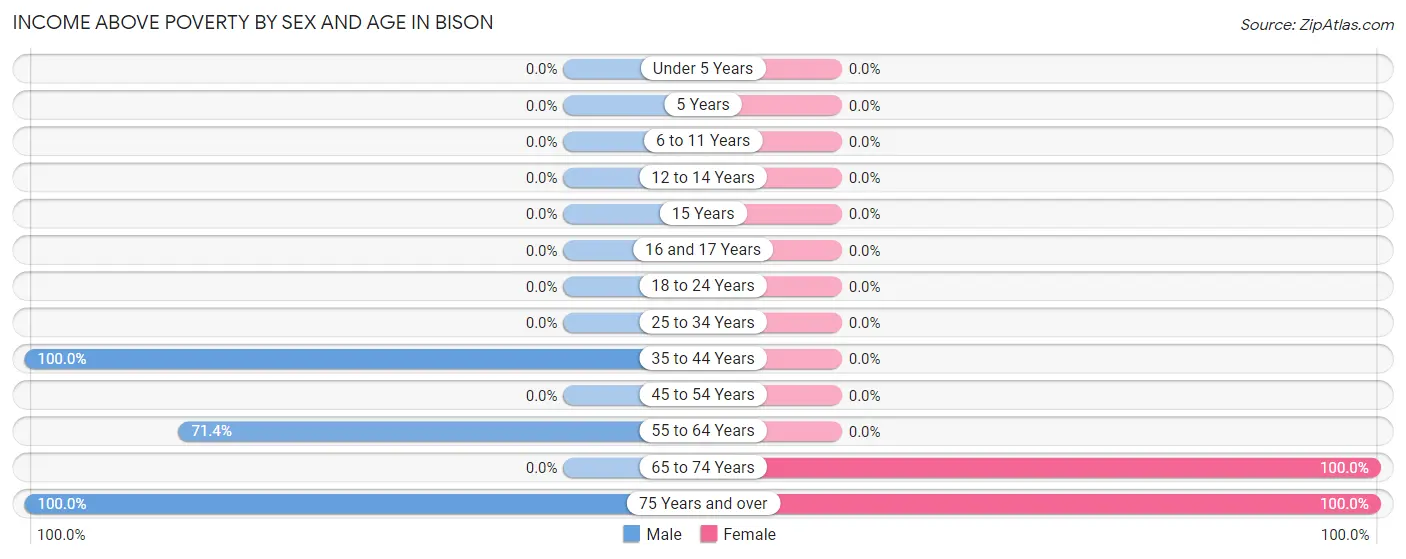
Income Above Poverty by Sex and Age in Bison
According to the poverty statistics in Bison, males aged 35 to 44 years and females aged 65 to 74 years are the age groups that are most secure financially, with 100.0% of males and 100.0% of females in these age groups living above the poverty line.
Age Bracket
Male
Female
Under 5 Years
0 (0.0%)
0 (0.0%)
5 Years
0 (0.0%)
0 (0.0%)
6 to 11 Years
0 (0.0%)
0 (0.0%)
12 to 14 Years
0 (0.0%)
0 (0.0%)
15 Years
0 (0.0%)
0 (0.0%)
16 and 17 Years
0 (0.0%)
0 (0.0%)
18 to 24 Years
0 (0.0%)
0 (0.0%)
25 to 34 Years
0 (0.0%)
0 (0.0%)
35 to 44 Years
20 (100.0%)
0 (0.0%)
45 to 54 Years
0 (0.0%)
0 (0.0%)
55 to 64 Years
10 (71.4%)
0 (0.0%)
65 to 74 Years
0 (0.0%)
5 (100.0%)
75 Years and over
16 (100.0%)
16 (100.0%)
Total
46 (92.0%)
21 (100.0%)
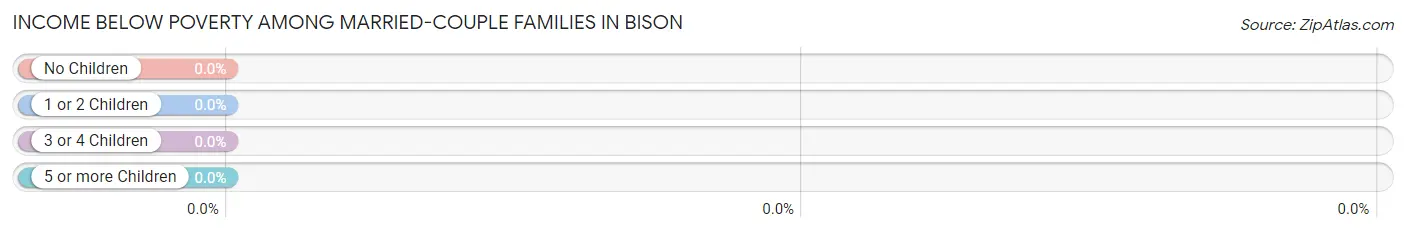
Income Below Poverty Among Married-Couple Families in Bison
Children
Above Poverty
Below Poverty
No Children
16 (100.0%)
0 (0.0%)
1 or 2 Children
0 (0.0%)
0 (0.0%)
3 or 4 Children
0 (0.0%)
0 (0.0%)
5 or more Children
0 (0.0%)
0 (0.0%)
Total
16 (100.0%)
0 (0.0%)
Income Below Poverty Among Single-Parent Households in Bison
Children
Single Father
Single Mother
No Children
0 (0.0%)
0 (0.0%)
1 or 2 Children
0 (0.0%)
0 (0.0%)
3 or 4 Children
0 (0.0%)
0 (0.0%)
5 or more Children
0 (0.0%)
0 (0.0%)
Total
0 (0.0%)
0 (0.0%)
Income Below Poverty Among Married-Couple vs Single-Parent Households in Bison
Children
Married-Couple Families
Single-Parent Households
No Children
0 (0.0%)
0 (0.0%)
1 or 2 Children
0 (0.0%)
0 (0.0%)
3 or 4 Children
0 (0.0%)
0 (0.0%)
5 or more Children
0 (0.0%)
0 (0.0%)
Total
0 (0.0%)
0 (0.0%)
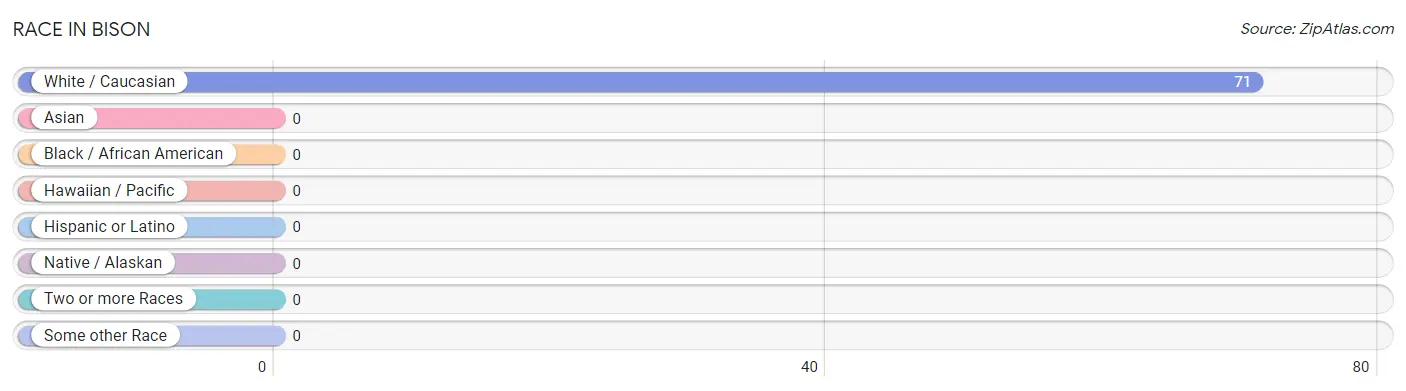
Race in Bison
The most populous races in Bison are , and White / Caucasian (71 | 100.0%).
Race
# Population
% Population
Asian
0
0.0%
Black / African American
0
0.0%
Hawaiian / Pacific
0
0.0%
Hispanic or Latino
0
0.0%
Native / Alaskan
0
0.0%
White / Caucasian
71
100.0%
Two or more Races
0
0.0%
Some other Race
0
0.0%
Total
71
100.0%
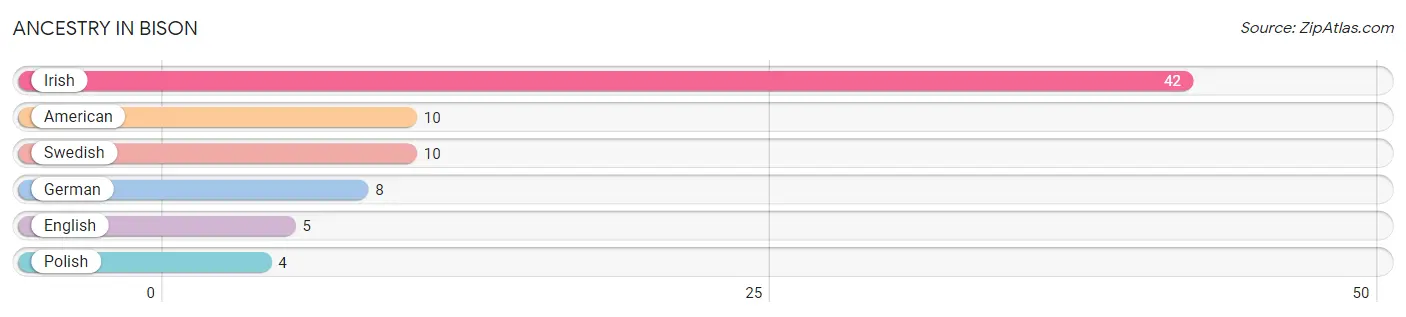
Ancestry in Bison
The most populous ancestries reported in Bison are Irish (42 | 59.2%), American (10 | 14.1%), Swedish (10 | 14.1%), German (8 | 11.3%), and English (5 | 7.0%), together accounting for 105.6% of all Bison residents.
Ancestry
# Population
% Population
American
10
14.1%
English
5
7.0%
German
8
11.3%
Irish
42
59.2%
Polish
4
5.6%
Swedish
10
14.1%
View All 6 Rows
Immigrants in Bison
Immigration Origin
# Population
% Population
View All 0 Rows
Sex and Age in Bison
Sex and Age in Bison
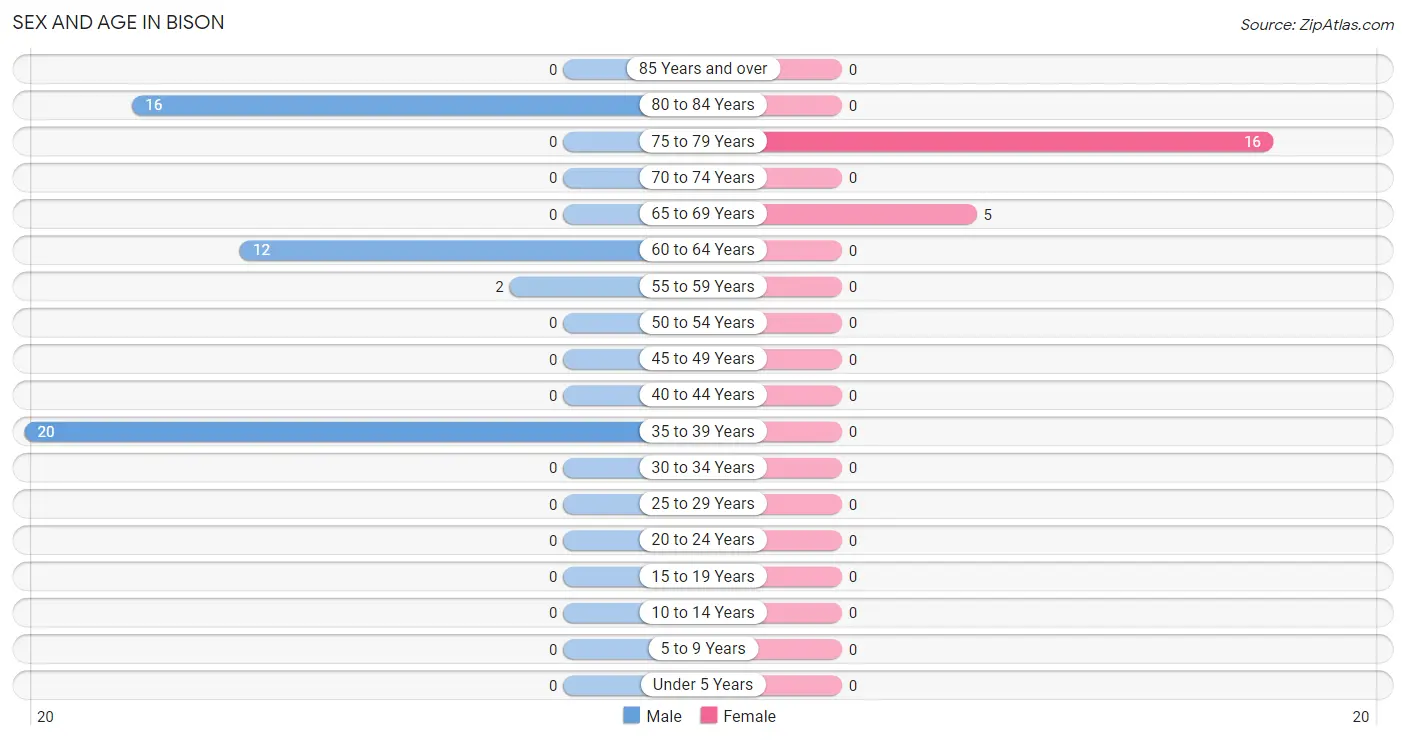
The most populous age groups in Bison are 35 to 39 Years (20 | 40.0%) for men and 75 to 79 Years (16 | 76.2%) for women.
Age Bracket
Male
Female
Under 5 Years
0 (0.0%)
0 (0.0%)
5 to 9 Years
0 (0.0%)
0 (0.0%)
10 to 14 Years
0 (0.0%)
0 (0.0%)
15 to 19 Years
0 (0.0%)
0 (0.0%)
20 to 24 Years
0 (0.0%)
0 (0.0%)
25 to 29 Years
0 (0.0%)
0 (0.0%)
30 to 34 Years
0 (0.0%)
0 (0.0%)
35 to 39 Years
20 (40.0%)
0 (0.0%)
40 to 44 Years
0 (0.0%)
0 (0.0%)
45 to 49 Years
0 (0.0%)
0 (0.0%)
50 to 54 Years
0 (0.0%)
0 (0.0%)
55 to 59 Years
2 (4.0%)
0 (0.0%)
60 to 64 Years
12 (24.0%)
0 (0.0%)
65 to 69 Years
0 (0.0%)
5 (23.8%)
70 to 74 Years
0 (0.0%)
0 (0.0%)
75 to 79 Years
0 (0.0%)
16 (76.2%)
80 to 84 Years
16 (32.0%)
0 (0.0%)
85 Years and over
0 (0.0%)
0 (0.0%)
Total
50 (100.0%)
21 (100.0%)
Families and Households in Bison
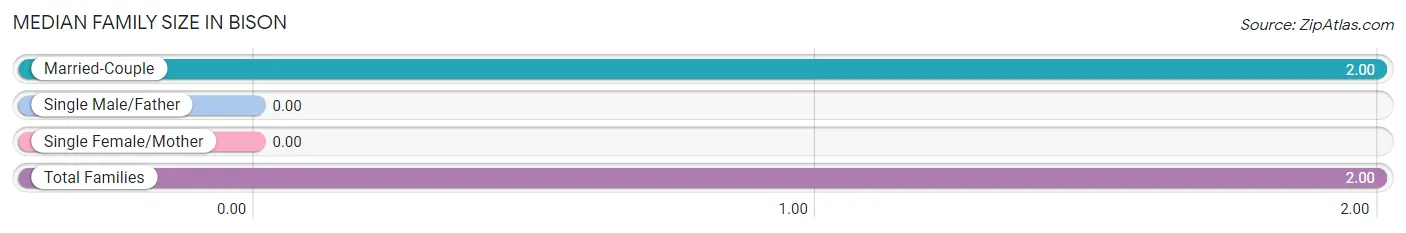
Median Family Size in Bison
Family Type
# Families
Family Size
Married-Couple
16 (100.0%)
2.00
Single Male/Father
0 (0.0%)
-
Single Female/Mother
0 (0.0%)
-
Total Families
16 (100.0%)
2.00
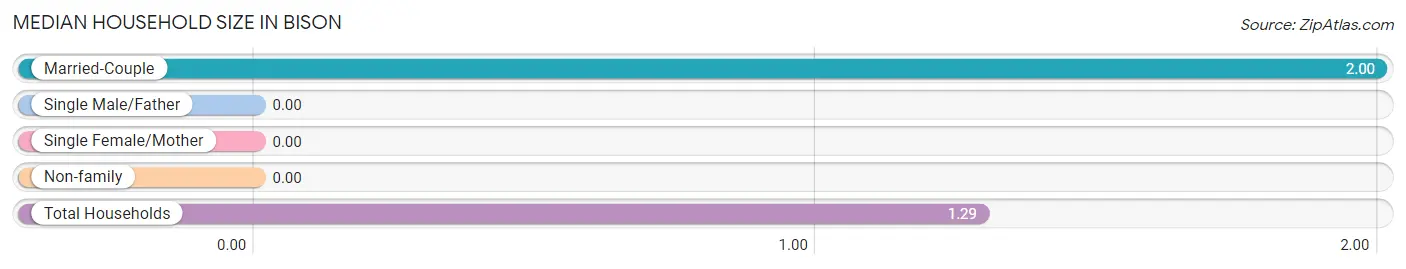
Median Household Size in Bison
Household Type
# Households
Household Size
Married-Couple
16 (29.1%)
2.00
Single Male/Father
0 (0.0%)
-
Single Female/Mother
0 (0.0%)
-
Non-family
39 (70.9%)
-
Total Households
55 (100.0%)
1.29
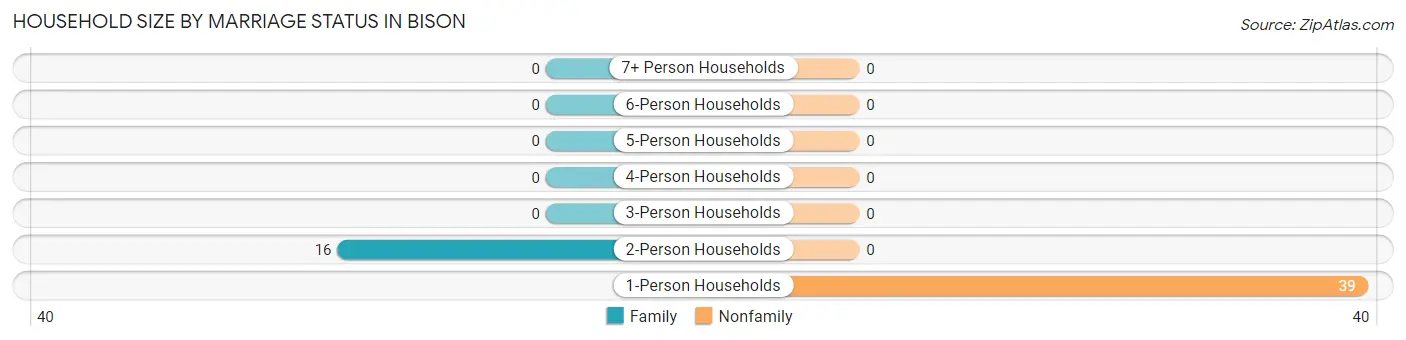
Household Size by Marriage Status in Bison
Out of a total of 55 households in Bison, 16 (29.1%) are family households, while 39 (70.9%) are nonfamily households. The most numerous type of family households are 2-person households, comprising 16, and the most common type of nonfamily households are 1-person households, comprising 39.
Household Size
Family Households
Nonfamily Households
1-Person Households
-
39 (70.9%)
2-Person Households
16 (29.1%)
0 (0.0%)
3-Person Households
0 (0.0%)
0 (0.0%)
4-Person Households
0 (0.0%)
0 (0.0%)
5-Person Households
0 (0.0%)
0 (0.0%)
6-Person Households
0 (0.0%)
0 (0.0%)
7+ Person Households
0 (0.0%)
0 (0.0%)
Total
16 (29.1%)
39 (70.9%)
Female Fertility in Bison
Fertility by Age in Bison
Age Bracket
Women with Births
Births / 1,000 Women
15 to 19 years
0 (0.0%)
0.0
20 to 34 years
0 (0.0%)
0.0
35 to 50 years
0 (0.0%)
0.0
Total
0 (0.0%)
0.0
Fertility by Age by Marriage Status in Bison
Age Bracket
Married
Unmarried
15 to 19 years
0 (0.0%)
0 (0.0%)
20 to 34 years
0 (0.0%)
0 (0.0%)
35 to 50 years
0 (0.0%)
0 (0.0%)
Total
0 (0.0%)
0 (0.0%)
Fertility by Education in Bison
Educational Attainment
Women with Births
Births / 1,000 Women
Less than High School
0 (0.0%)
0.0
High School Diploma
0 (0.0%)
0.0
College or Associate's Degree
0 (0.0%)
0.0
Bachelor's Degree
0 (0.0%)
0.0
Graduate Degree
0 (0.0%)
0.0
Total
0 (0.0%)
0.0
Fertility by Education by Marriage Status in Bison
Educational Attainment
Married
Unmarried
Less than High School
0 (0.0%)
0 (0.0%)
High School Diploma
0 (0.0%)
0 (0.0%)
College or Associate's Degree
0 (0.0%)
0 (0.0%)
Bachelor's Degree
0 (0.0%)
0 (0.0%)
Graduate Degree
0 (0.0%)
0 (0.0%)
Total
0 (0.0%)
0 (0.0%)
Employment Characteristics in Bison
Employment by Class of Employer in Bison
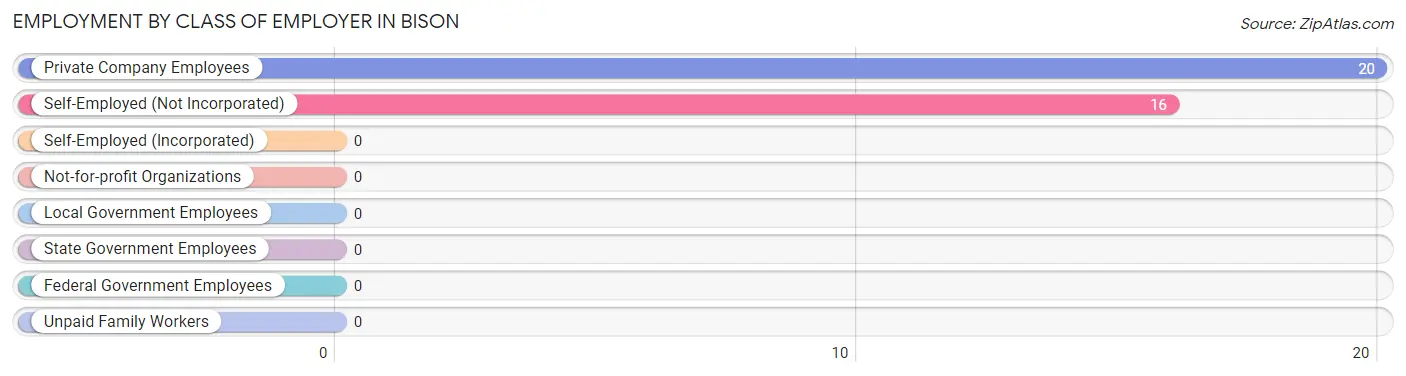
Among the 36 employed individuals in Bison, private company employees (20 | 55.6%), and self-employed (not incorporated) (16 | 44.4%) make up the most common classes of employment.
Employer Class
# Employees
% Employees
Private Company Employees
20
55.6%
Self-Employed (Incorporated)
0
0.0%
Self-Employed (Not Incorporated)
16
44.4%
Not-for-profit Organizations
0
0.0%
Local Government Employees
0
0.0%
State Government Employees
0
0.0%
Federal Government Employees
0
0.0%
Unpaid Family Workers
0
0.0%
Total
36
100.0%
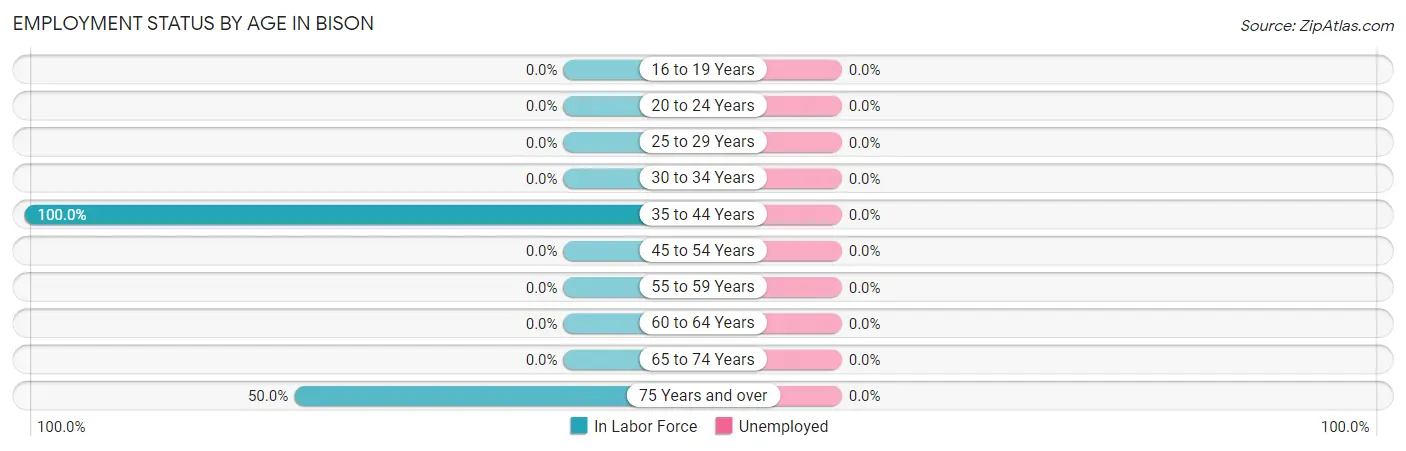
Employment Status by Age in Bison
Age Bracket
In Labor Force
Unemployed
16 to 19 Years
0 (0.0%)
0 (0.0%)
20 to 24 Years
0 (0.0%)
0 (0.0%)
25 to 29 Years
0 (0.0%)
0 (0.0%)
30 to 34 Years
0 (0.0%)
0 (0.0%)
35 to 44 Years
20 (100.0%)
0 (0.0%)
45 to 54 Years
0 (0.0%)
0 (0.0%)
55 to 59 Years
0 (0.0%)
0 (0.0%)
60 to 64 Years
0 (0.0%)
0 (0.0%)
65 to 74 Years
0 (0.0%)
0 (0.0%)
75 Years and over
16 (50.0%)
0 (0.0%)
Total
36 (50.7%)
0 (0.0%)
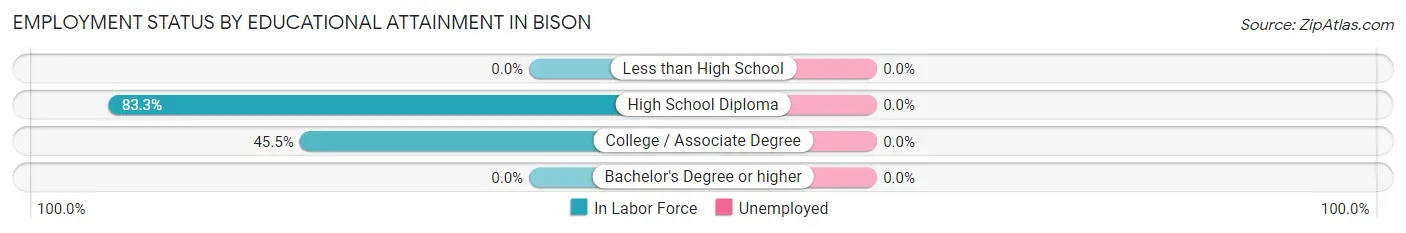
Employment Status by Educational Attainment in Bison
Educational Attainment
In Labor Force
Unemployed
Less than High School
0 (0.0%)
0 (0.0%)
High School Diploma
10 (83.3%)
0 (0.0%)
College / Associate Degree
10 (45.5%)
0 (0.0%)
Bachelor's Degree or higher
0 (0.0%)
0 (0.0%)
Total
20 (58.8%)
0 (0.0%)
Employment Occupations by Sex in Bison
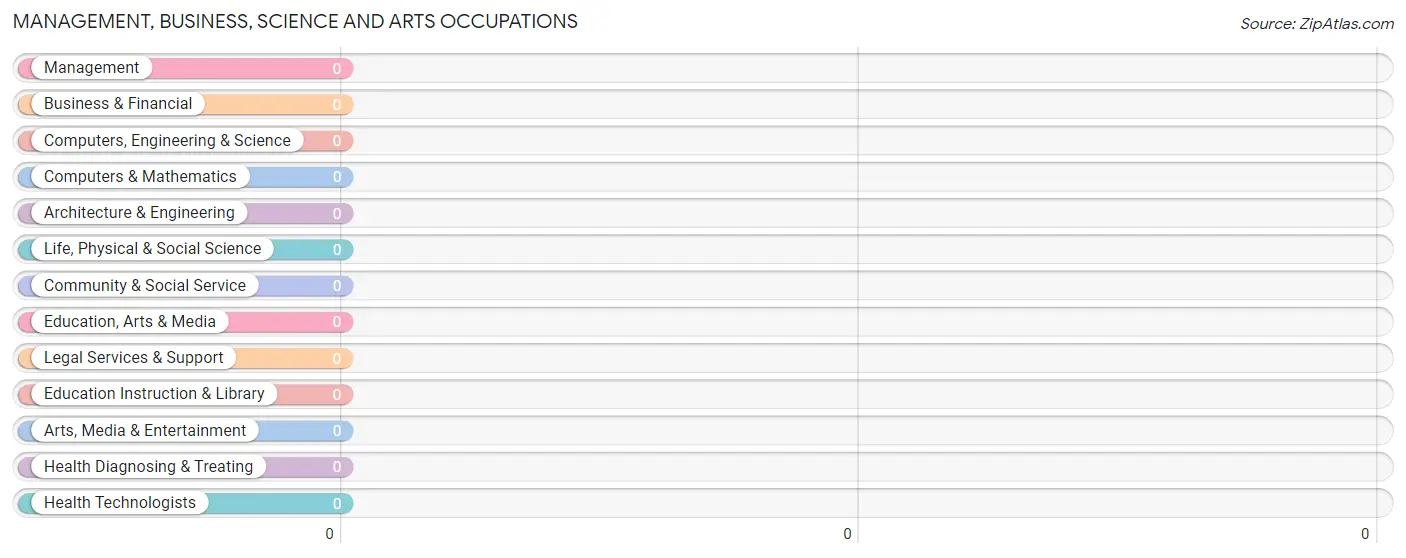
Management, Business, Science and Arts Occupations
Management, Business, Science and Arts Occupations by Sex
Occupation
Male
Female
Management
0 (0.0%)
0 (0.0%)
Business & Financial
0 (0.0%)
0 (0.0%)
Computers, Engineering & Science
0 (0.0%)
0 (0.0%)
Computers & Mathematics
0 (0.0%)
0 (0.0%)
Architecture & Engineering
0 (0.0%)
0 (0.0%)
Life, Physical & Social Science
0 (0.0%)
0 (0.0%)
Community & Social Service
0 (0.0%)
0 (0.0%)
Education, Arts & Media
0 (0.0%)
0 (0.0%)
Legal Services & Support
0 (0.0%)
0 (0.0%)
Education Instruction & Library
0 (0.0%)
0 (0.0%)
Arts, Media & Entertainment
0 (0.0%)
0 (0.0%)
Health Diagnosing & Treating
0 (0.0%)
0 (0.0%)
Health Technologists
0 (0.0%)
0 (0.0%)
Total (Category)
0 (0.0%)
0 (0.0%)
Total (Overall)
36 (100.0%)
0 (0.0%)
Services Occupations
Services Occupations by Sex
Occupation
Male
Female
Healthcare Support
0 (0.0%)
0 (0.0%)
Security & Protection
0 (0.0%)
0 (0.0%)
Firefighting & Prevention
0 (0.0%)
0 (0.0%)
Law Enforcement
0 (0.0%)
0 (0.0%)
Food Preparation & Serving
0 (0.0%)
0 (0.0%)
Cleaning & Maintenance
0 (0.0%)
0 (0.0%)
Personal Care & Service
0 (0.0%)
0 (0.0%)
Total (Category)
0 (0.0%)
0 (0.0%)
Total (Overall)
36 (100.0%)
0 (0.0%)
Sales and Office Occupations
Sales and Office Occupations by Sex
Occupation
Male
Female
Sales & Related
0 (0.0%)
0 (0.0%)
Office & Administration
0 (0.0%)
0 (0.0%)
Total (Category)
0 (0.0%)
0 (0.0%)
Total (Overall)
36 (100.0%)
0 (0.0%)
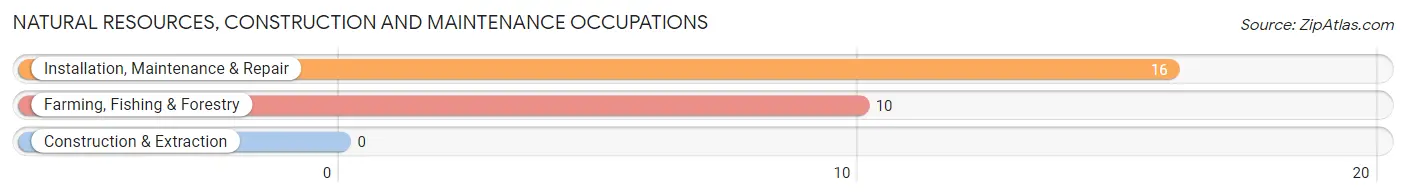
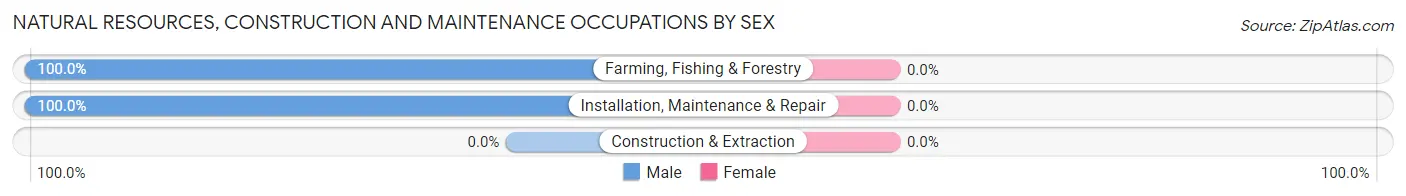
Natural Resources, Construction and Maintenance Occupations
The most common Natural Resources, Construction and Maintenance occupations in Bison are Installation, Maintenance & Repair (16 | 44.4%), and Farming, Fishing & Forestry (10 | 27.8%).
Natural Resources, Construction and Maintenance Occupations by Sex
Occupation
Male
Female
Farming, Fishing & Forestry
10 (100.0%)
0 (0.0%)
Construction & Extraction
0 (0.0%)
0 (0.0%)
Installation, Maintenance & Repair
16 (100.0%)
0 (0.0%)
Total (Category)
26 (100.0%)
0 (0.0%)
Total (Overall)
36 (100.0%)
0 (0.0%)
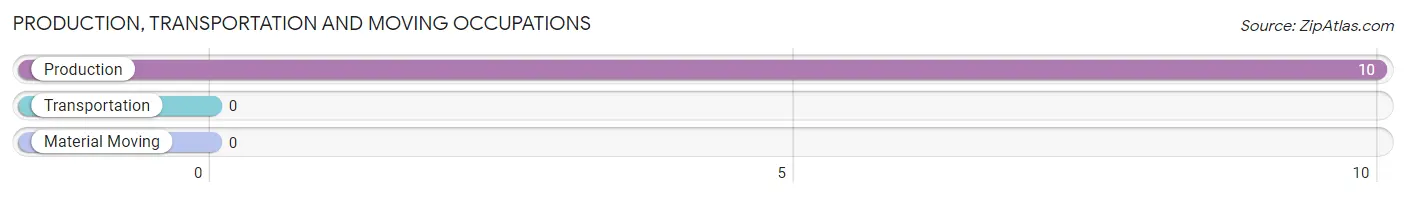
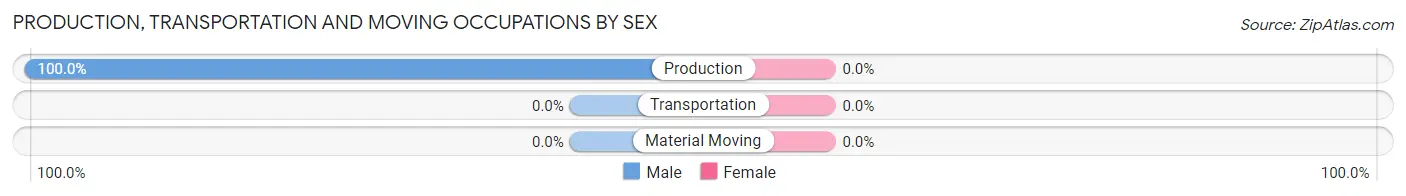
Production, Transportation and Moving Occupations
The most common Production, Transportation and Moving occupations in Bison are , and Production (10 | 27.8%).
Production, Transportation and Moving Occupations by Sex
Occupation
Male
Female
Production
10 (100.0%)
0 (0.0%)
Transportation
0 (0.0%)
0 (0.0%)
Material Moving
0 (0.0%)
0 (0.0%)
Total (Category)
10 (100.0%)
0 (0.0%)
Total (Overall)
36 (100.0%)
0 (0.0%)
Employment Industries by Sex in Bison
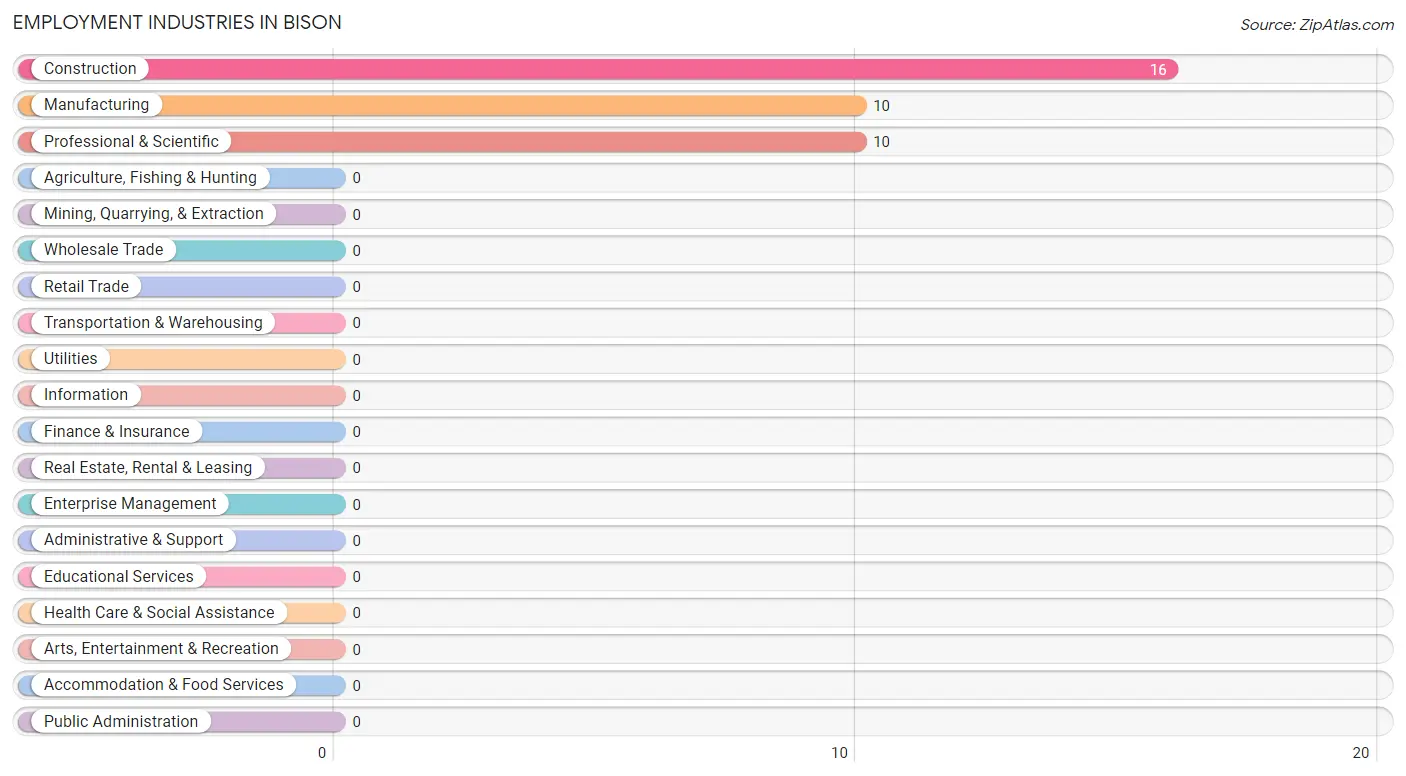
Employment Industries in Bison
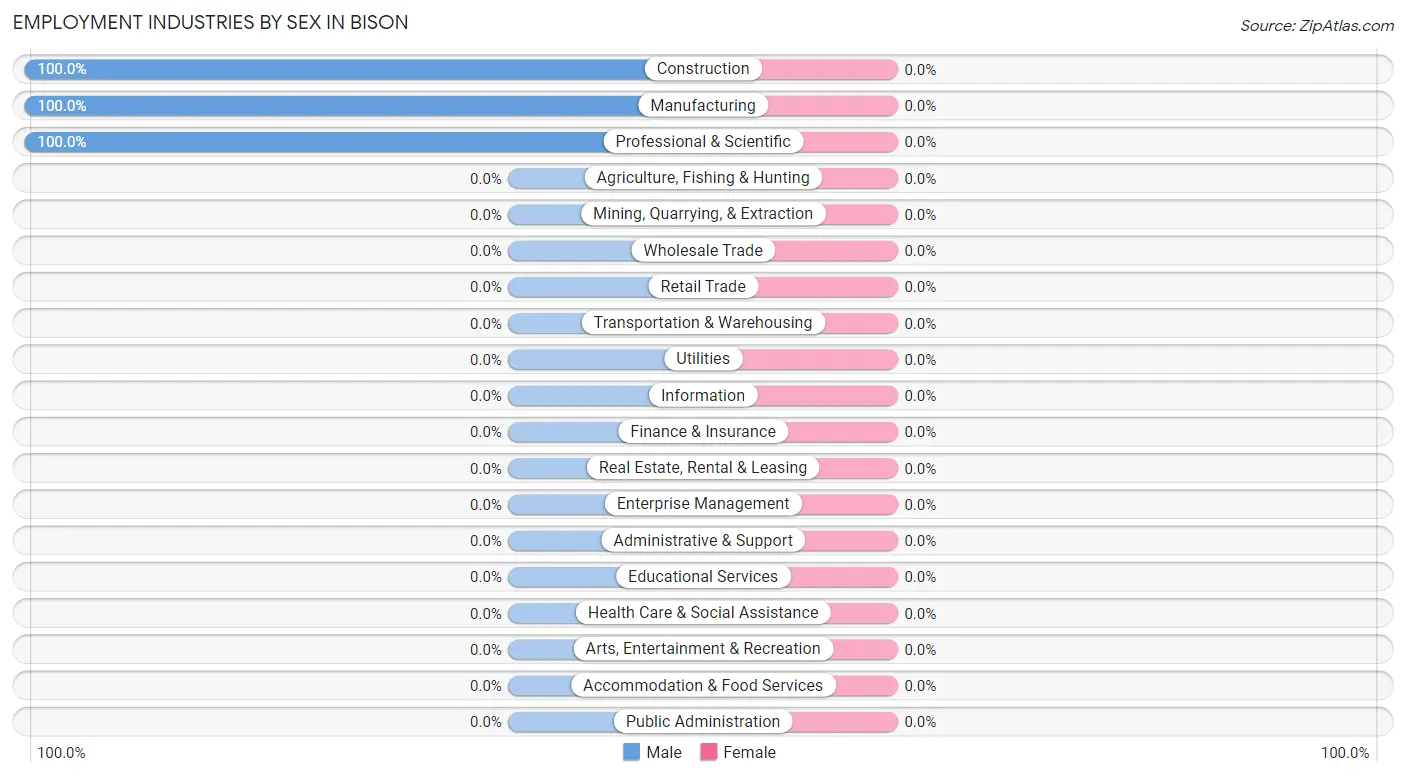
The major employment industries in Bison include Construction (16 | 44.4%), Manufacturing (10 | 27.8%), and Professional & Scientific (10 | 27.8%).
Employment Industries by Sex in Bison
Industry
Male
Female
Agriculture, Fishing & Hunting
0 (0.0%)
0 (0.0%)
Mining, Quarrying, & Extraction
0 (0.0%)
0 (0.0%)
Construction
16 (100.0%)
0 (0.0%)
Manufacturing
10 (100.0%)
0 (0.0%)
Wholesale Trade
0 (0.0%)
0 (0.0%)
Retail Trade
0 (0.0%)
0 (0.0%)
Transportation & Warehousing
0 (0.0%)
0 (0.0%)
Utilities
0 (0.0%)
0 (0.0%)
Information
0 (0.0%)
0 (0.0%)
Finance & Insurance
0 (0.0%)
0 (0.0%)
Real Estate, Rental & Leasing
0 (0.0%)
0 (0.0%)
Professional & Scientific
10 (100.0%)
0 (0.0%)
Enterprise Management
0 (0.0%)
0 (0.0%)
Administrative & Support
0 (0.0%)
0 (0.0%)
Educational Services
0 (0.0%)
0 (0.0%)
Health Care & Social Assistance
0 (0.0%)
0 (0.0%)
Arts, Entertainment & Recreation
0 (0.0%)
0 (0.0%)
Accommodation & Food Services
0 (0.0%)
0 (0.0%)
Public Administration
0 (0.0%)
0 (0.0%)
Total
36 (100.0%)
0 (0.0%)
Education in Bison
School Enrollment in Bison
School Level
# Students
% Students
Nursery / Preschool
0
0.0%
Kindergarten
0
0.0%
Elementary School
0
0.0%
Middle School
0
0.0%
High School
0
0.0%
College / Undergraduate
0
0.0%
Graduate / Professional
0
0.0%
Total
0
0.0%
School Enrollment by Age by Funding Source in Bison
Age Bracket
Public School
Private School
3 to 4 Year Olds
0 (0.0%)
0 (0.0%)
5 to 9 Year Old
0 (0.0%)
0 (0.0%)
10 to 14 Year Olds
0 (0.0%)
0 (0.0%)
15 to 17 Year Olds
0 (0.0%)
0 (0.0%)
18 to 19 Year Olds
0 (0.0%)
0 (0.0%)
20 to 24 Year Olds
0 (0.0%)
0 (0.0%)
25 to 34 Year Olds
0 (0.0%)
0 (0.0%)
35 Years and over
0 (0.0%)
0 (0.0%)
Total
0 (0.0%)
0 (0.0%)
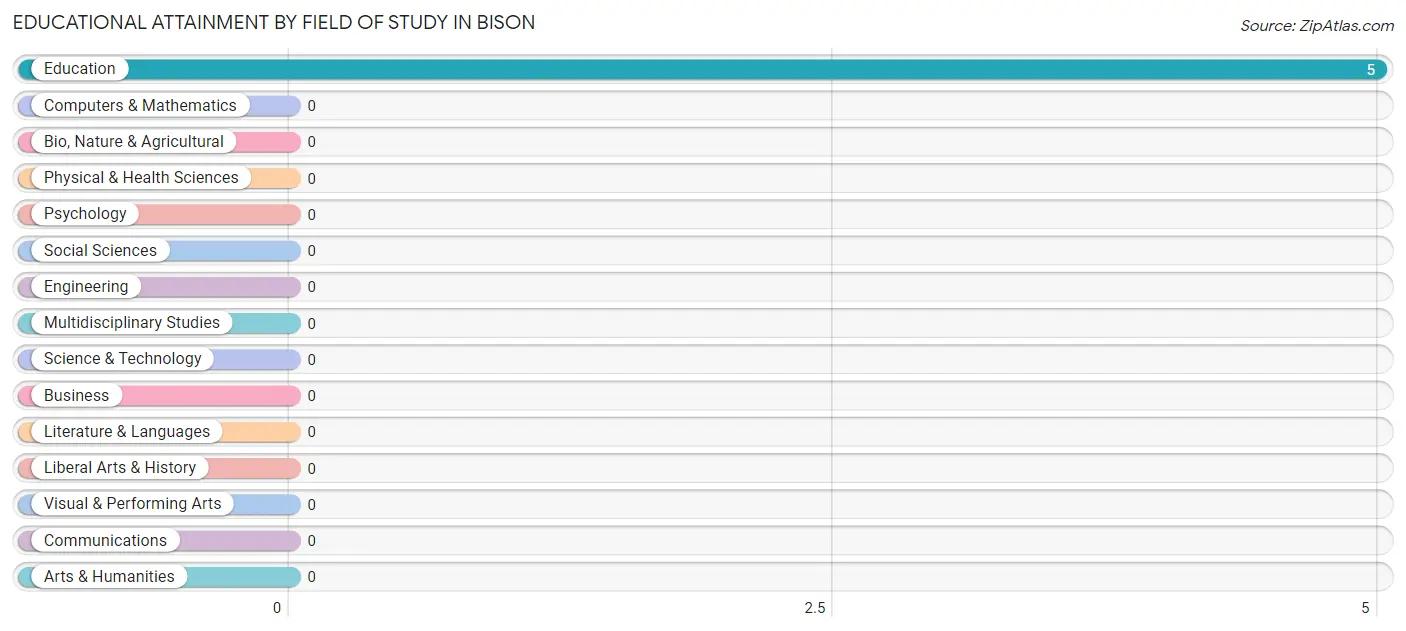
Educational Attainment by Field of Study in Bison
, and education (5 | 100.0%) are the most common fields of study among 5 individuals in Bison who have obtained a bachelor's degree or higher.
Field of Study
# Graduates
% Graduates
Computers & Mathematics
0
0.0%
Bio, Nature & Agricultural
0
0.0%
Physical & Health Sciences
0
0.0%
Psychology
0
0.0%
Social Sciences
0
0.0%
Engineering
0
0.0%
Multidisciplinary Studies
0
0.0%
Science & Technology
0
0.0%
Business
0
0.0%
Education
5
100.0%
Literature & Languages
0
0.0%
Liberal Arts & History
0
0.0%
Visual & Performing Arts
0
0.0%
Communications
0
0.0%
Arts & Humanities
0
0.0%
Total
5
100.0%
Transportation & Commute in Bison
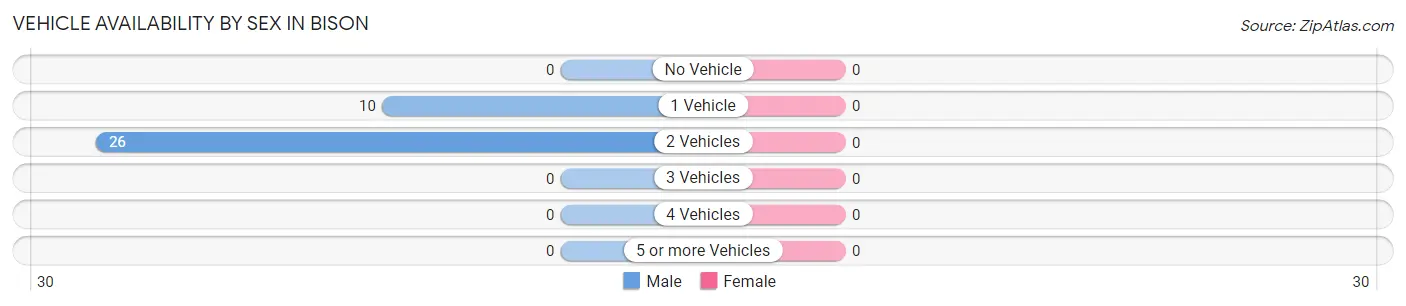
Vehicle Availability by Sex in Bison
Vehicles Available
Male
Female
No Vehicle
0 (0.0%)
0 (0.0%)
1 Vehicle
10 (27.8%)
0 (0.0%)
2 Vehicles
26 (72.2%)
0 (0.0%)
3 Vehicles
0 (0.0%)
0 (0.0%)
4 Vehicles
0 (0.0%)
0 (0.0%)
5 or more Vehicles
0 (0.0%)
0 (0.0%)
Total
36 (100.0%)
0 (0.0%)
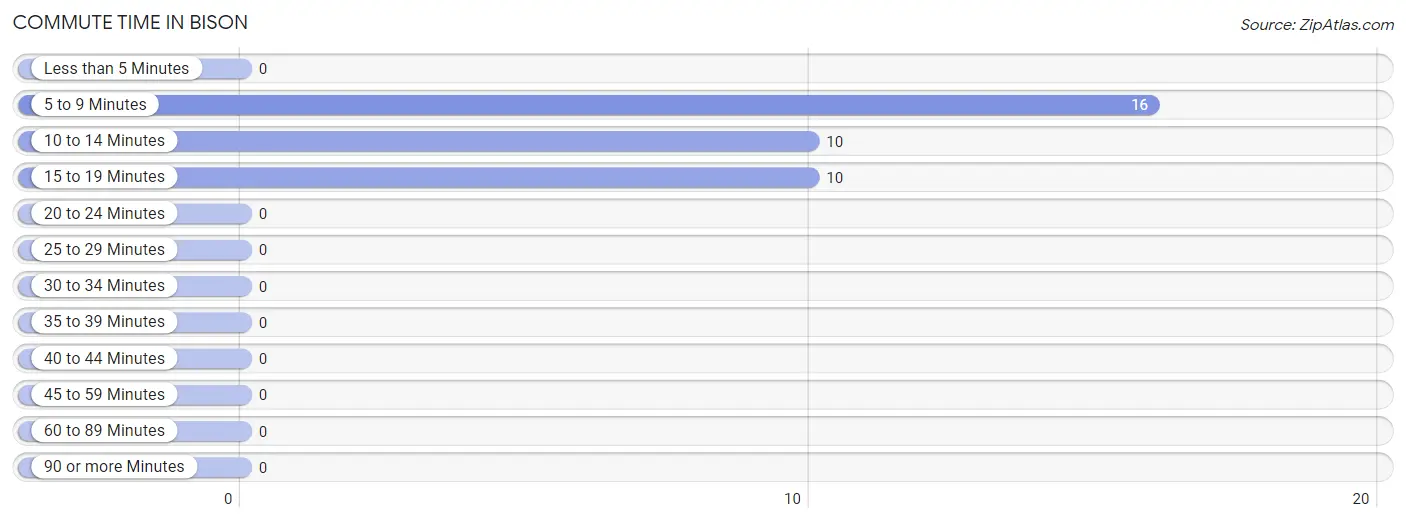
Commute Time in Bison
The most frequently occuring commute durations in Bison are 5 to 9 minutes (16 commuters, 44.4%), 10 to 14 minutes (10 commuters, 27.8%), and 15 to 19 minutes (10 commuters, 27.8%).
Commute Time
# Commuters
% Commuters
Less than 5 Minutes
0
0.0%
5 to 9 Minutes
16
44.4%
10 to 14 Minutes
10
27.8%
15 to 19 Minutes
10
27.8%
20 to 24 Minutes
0
0.0%
25 to 29 Minutes
0
0.0%
30 to 34 Minutes
0
0.0%
35 to 39 Minutes
0
0.0%
40 to 44 Minutes
0
0.0%
45 to 59 Minutes
0
0.0%
60 to 89 Minutes
0
0.0%
90 or more Minutes
0
0.0%
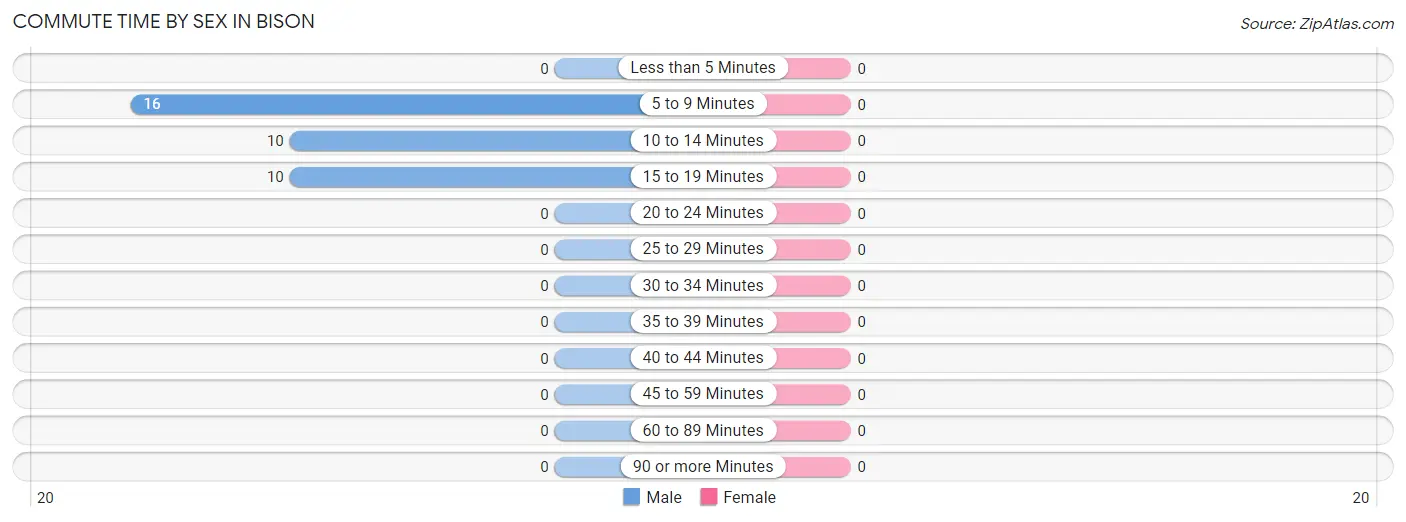
Commute Time by Sex in Bison
Commute Time
Male
Female
Less than 5 Minutes
0 (0.0%)
0 (0.0%)
5 to 9 Minutes
16 (44.4%)
0 (0.0%)
10 to 14 Minutes
10 (27.8%)
0 (0.0%)
15 to 19 Minutes
10 (27.8%)
0 (0.0%)
20 to 24 Minutes
0 (0.0%)
0 (0.0%)
25 to 29 Minutes
0 (0.0%)
0 (0.0%)
30 to 34 Minutes
0 (0.0%)
0 (0.0%)
35 to 39 Minutes
0 (0.0%)
0 (0.0%)
40 to 44 Minutes
0 (0.0%)
0 (0.0%)
45 to 59 Minutes
0 (0.0%)
0 (0.0%)
60 to 89 Minutes
0 (0.0%)
0 (0.0%)
90 or more Minutes
0 (0.0%)
0 (0.0%)
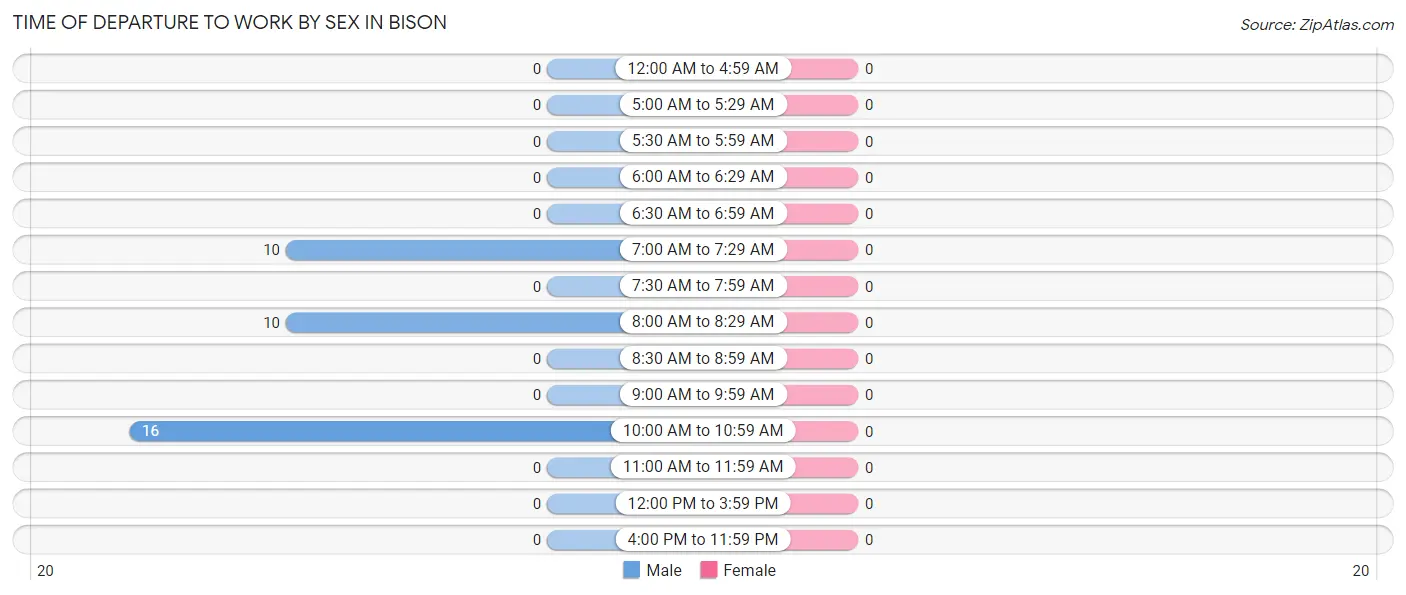
Time of Departure to Work by Sex in Bison
Time of Departure
Male
Female
12:00 AM to 4:59 AM
0 (0.0%)
0 (0.0%)
5:00 AM to 5:29 AM
0 (0.0%)
0 (0.0%)
5:30 AM to 5:59 AM
0 (0.0%)
0 (0.0%)
6:00 AM to 6:29 AM
0 (0.0%)
0 (0.0%)
6:30 AM to 6:59 AM
0 (0.0%)
0 (0.0%)
7:00 AM to 7:29 AM
10 (27.8%)
0 (0.0%)
7:30 AM to 7:59 AM
0 (0.0%)
0 (0.0%)
8:00 AM to 8:29 AM
10 (27.8%)
0 (0.0%)
8:30 AM to 8:59 AM
0 (0.0%)
0 (0.0%)
9:00 AM to 9:59 AM
0 (0.0%)
0 (0.0%)
10:00 AM to 10:59 AM
16 (44.4%)
0 (0.0%)
11:00 AM to 11:59 AM
0 (0.0%)
0 (0.0%)
12:00 PM to 3:59 PM
0 (0.0%)
0 (0.0%)
4:00 PM to 11:59 PM
0 (0.0%)
0 (0.0%)
Total
36 (100.0%)
0 (0.0%)
Housing Occupancy in Bison
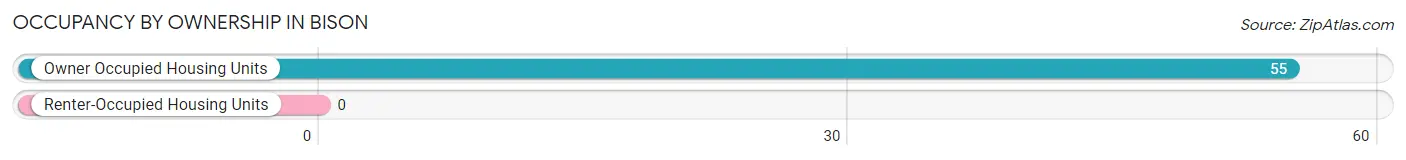
Occupancy by Ownership in Bison
Of the total 55 dwellings in Bison, owner-occupied units account for 55 (100.0%), while renter-occupied units make up 0 (0.0%).
Occupancy
# Housing Units
% Housing Units
Owner Occupied Housing Units
55
100.0%
Renter-Occupied Housing Units
0
0.0%
Total Occupied Housing Units
55
100.0%
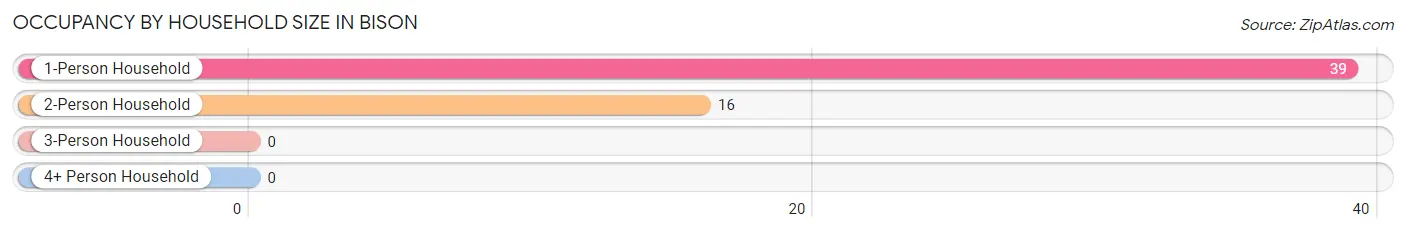
Occupancy by Household Size in Bison
Household Size
# Housing Units
% Housing Units
1-Person Household
39
70.9%
2-Person Household
16
29.1%
3-Person Household
0
0.0%
4+ Person Household
0
0.0%
Total Housing Units
55
100.0%
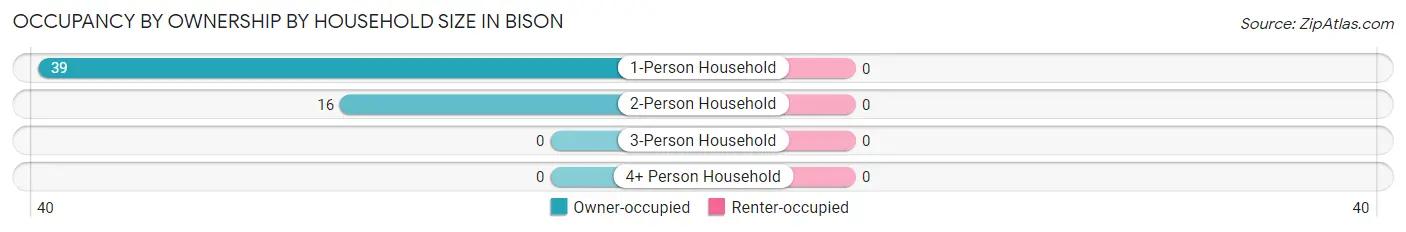
Occupancy by Ownership by Household Size in Bison
Household Size
Owner-occupied
Renter-occupied
1-Person Household
39 (100.0%)
0 (0.0%)
2-Person Household
16 (100.0%)
0 (0.0%)
3-Person Household
0 (0.0%)
0 (0.0%)
4+ Person Household
0 (0.0%)
0 (0.0%)
Total Housing Units
55 (100.0%)
0 (0.0%)
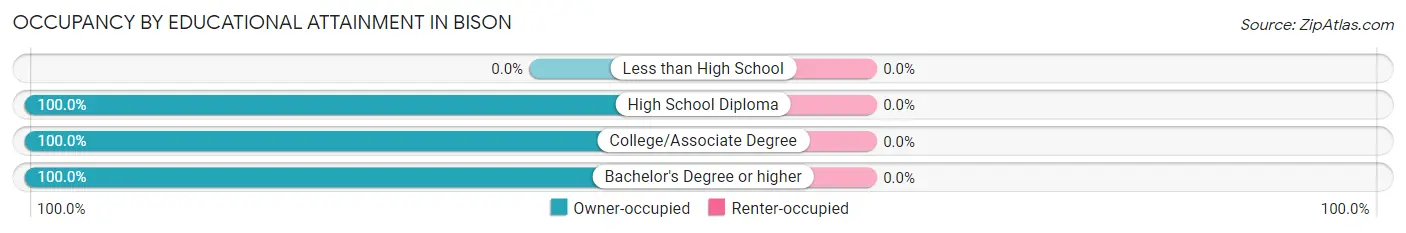
Occupancy by Educational Attainment in Bison
Household Size
Owner-occupied
Renter-occupied
Less than High School
0 (0.0%)
0 (0.0%)
High School Diploma
28 (100.0%)
0 (0.0%)
College/Associate Degree
22 (100.0%)
0 (0.0%)
Bachelor's Degree or higher
5 (100.0%)
0 (0.0%)
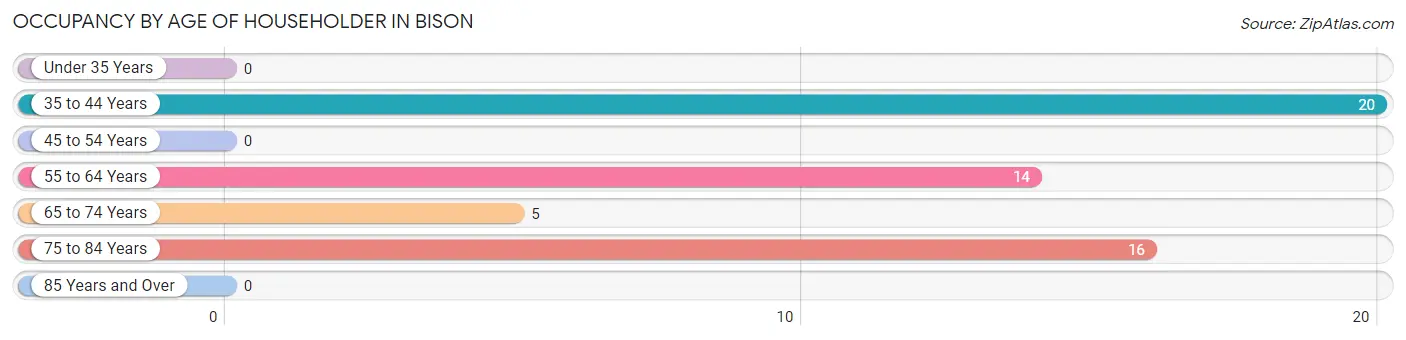
Occupancy by Age of Householder in Bison
Age Bracket
# Households
% Households
Under 35 Years
0
0.0%
35 to 44 Years
20
36.4%
45 to 54 Years
0
0.0%
55 to 64 Years
14
25.5%
65 to 74 Years
5
9.1%
75 to 84 Years
16
29.1%
85 Years and Over
0
0.0%
Total
55
100.0%
Housing Finances in Bison
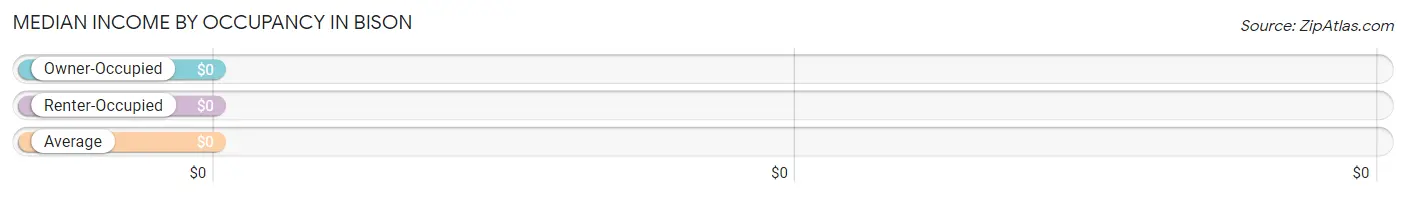
Median Income by Occupancy in Bison
Occupancy Type
# Households
Median Income
Owner-Occupied
55 (100.0%)
$0
Renter-Occupied
0 (0.0%)
$0
Average
55 (100.0%)
$0
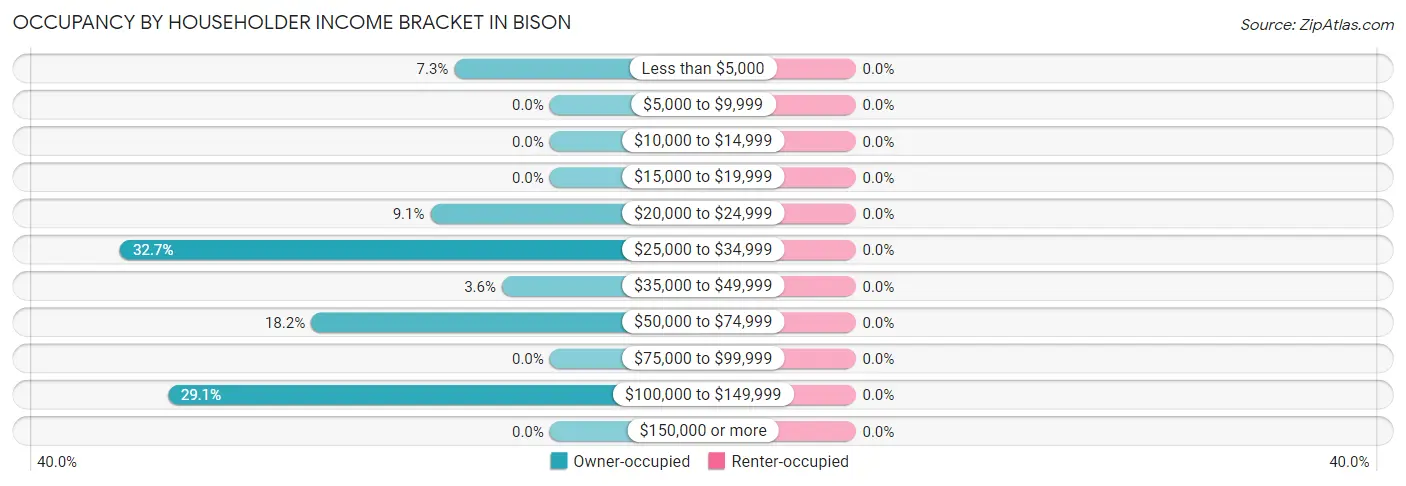
Occupancy by Householder Income Bracket in Bison
Income Bracket
Owner-occupied
Renter-occupied
Less than $5,000
4 (7.3%)
0 (0.0%)
$5,000 to $9,999
0 (0.0%)
0 (0.0%)
$10,000 to $14,999
0 (0.0%)
0 (0.0%)
$15,000 to $19,999
0 (0.0%)
0 (0.0%)
$20,000 to $24,999
5 (9.1%)
0 (0.0%)
$25,000 to $34,999
18 (32.7%)
0 (0.0%)
$35,000 to $49,999
2 (3.6%)
0 (0.0%)
$50,000 to $74,999
10 (18.2%)
0 (0.0%)
$75,000 to $99,999
0 (0.0%)
0 (0.0%)
$100,000 to $149,999
16 (29.1%)
0 (0.0%)
$150,000 or more
0 (0.0%)
0 (0.0%)
Total
55 (100.0%)
0 (0.0%)
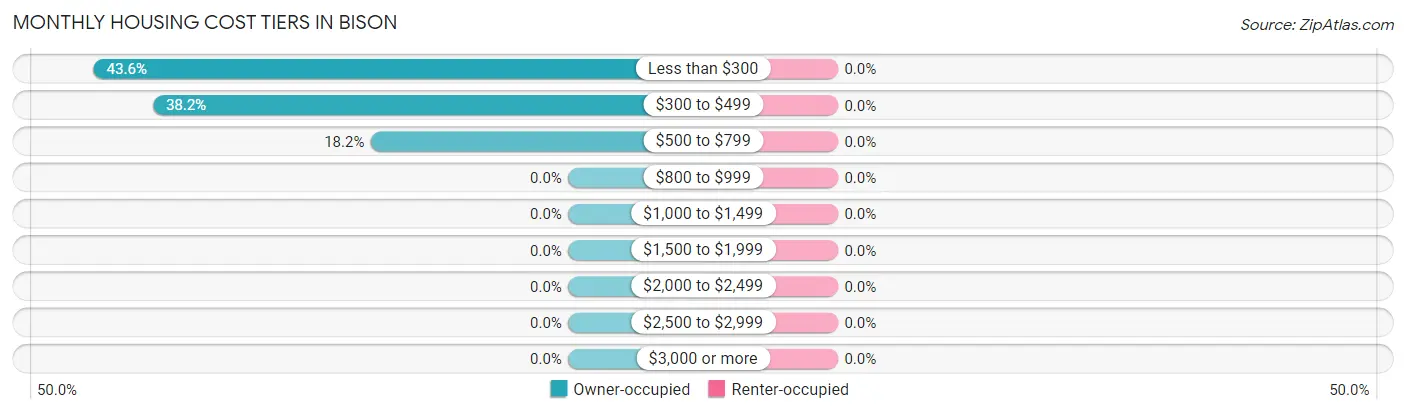
Monthly Housing Cost Tiers in Bison
Monthly Cost
Owner-occupied
Renter-occupied
Less than $300
24 (43.6%)
0 (0.0%)
$300 to $499
21 (38.2%)
0 (0.0%)
$500 to $799
10 (18.2%)
0 (0.0%)
$800 to $999
0 (0.0%)
0 (0.0%)
$1,000 to $1,499
0 (0.0%)
0 (0.0%)
$1,500 to $1,999
0 (0.0%)
0 (0.0%)
$2,000 to $2,499
0 (0.0%)
0 (0.0%)
$2,500 to $2,999
0 (0.0%)
0 (0.0%)
$3,000 or more
0 (0.0%)
0 (0.0%)
Total
55 (100.0%)
0 (0.0%)
Physical Housing Characteristics in Bison
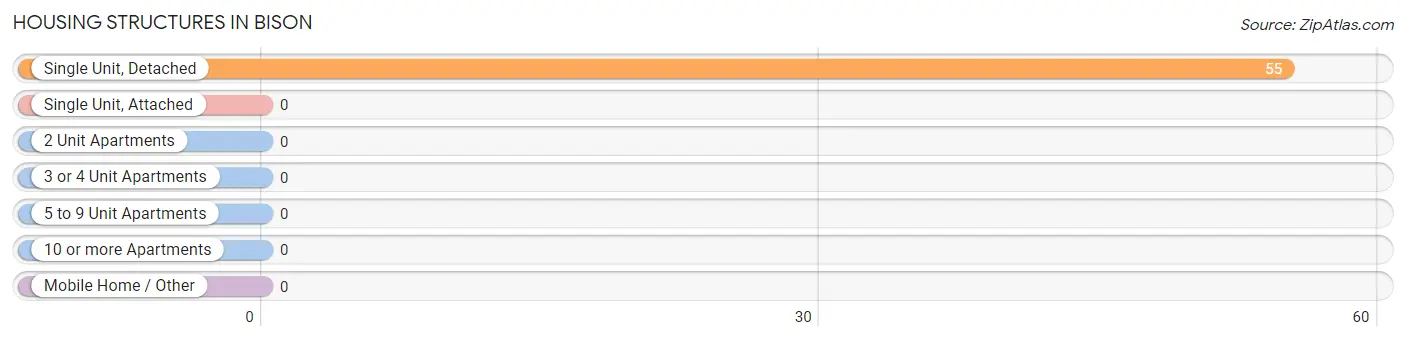
Housing Structures in Bison
Structure Type
# Housing Units
% Housing Units
Single Unit, Detached
55
100.0%
Single Unit, Attached
0
0.0%
2 Unit Apartments
0
0.0%
3 or 4 Unit Apartments
0
0.0%
5 to 9 Unit Apartments
0
0.0%
10 or more Apartments
0
0.0%
Mobile Home / Other
0
0.0%
Total
55
100.0%
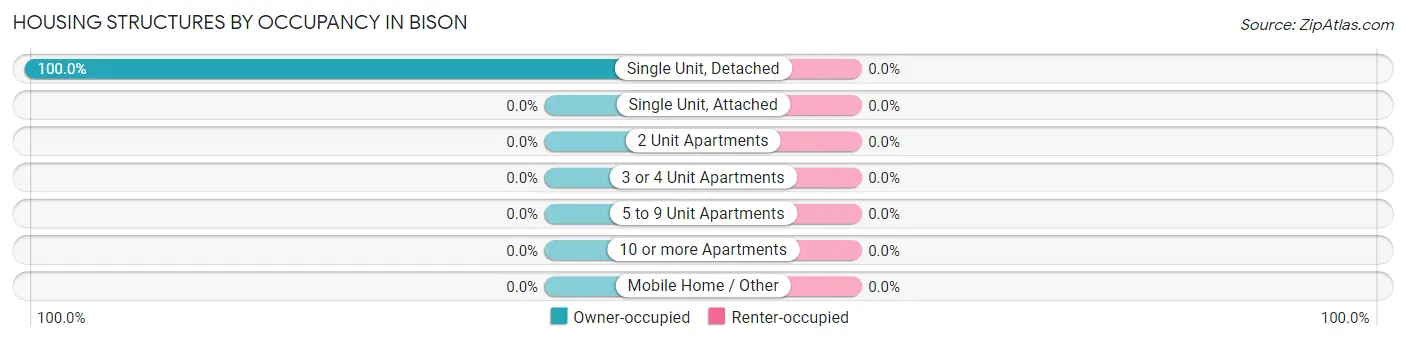
Housing Structures by Occupancy in Bison
Structure Type
Owner-occupied
Renter-occupied
Single Unit, Detached
55 (100.0%)
0 (0.0%)
Single Unit, Attached
0 (0.0%)
0 (0.0%)
2 Unit Apartments
0 (0.0%)
0 (0.0%)
3 or 4 Unit Apartments
0 (0.0%)
0 (0.0%)
5 to 9 Unit Apartments
0 (0.0%)
0 (0.0%)
10 or more Apartments
0 (0.0%)
0 (0.0%)
Mobile Home / Other
0 (0.0%)
0 (0.0%)
Total
55 (100.0%)
0 (0.0%)
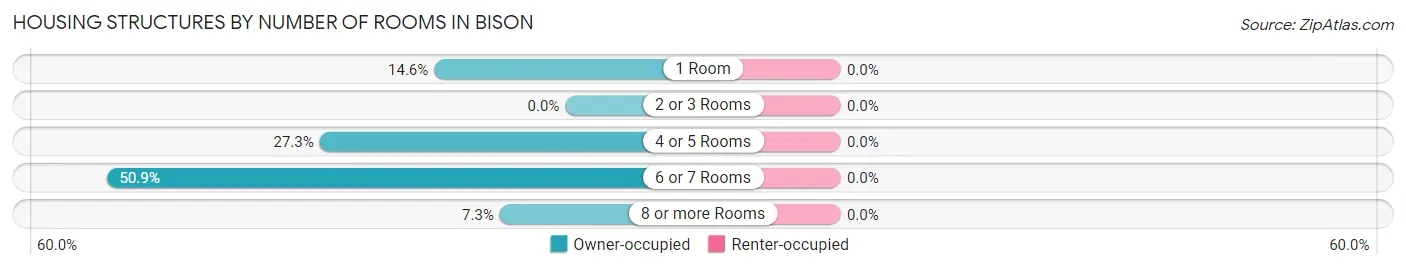
Housing Structures by Number of Rooms in Bison
Number of Rooms
Owner-occupied
Renter-occupied
1 Room
8 (14.5%)
0 (0.0%)
2 or 3 Rooms
0 (0.0%)
0 (0.0%)
4 or 5 Rooms
15 (27.3%)
0 (0.0%)
6 or 7 Rooms
28 (50.9%)
0 (0.0%)
8 or more Rooms
4 (7.3%)
0 (0.0%)
Total
55 (100.0%)
0 (0.0%)
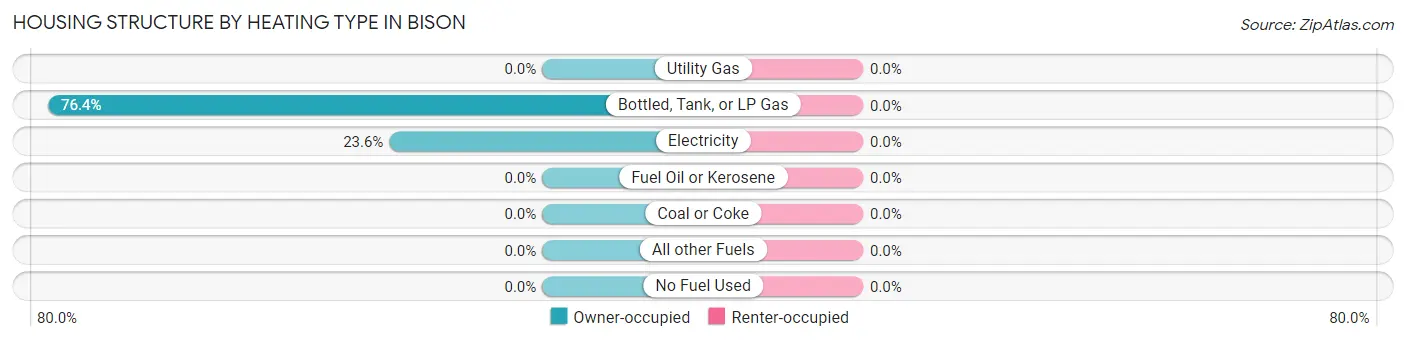
Housing Structure by Heating Type in Bison
Heating Type
Owner-occupied
Renter-occupied
Utility Gas
0 (0.0%)
0 (0.0%)
Bottled, Tank, or LP Gas
42 (76.4%)
0 (0.0%)
Electricity
13 (23.6%)
0 (0.0%)
Fuel Oil or Kerosene
0 (0.0%)
0 (0.0%)
Coal or Coke
0 (0.0%)
0 (0.0%)
All other Fuels
0 (0.0%)
0 (0.0%)
No Fuel Used
0 (0.0%)
0 (0.0%)
Total
55 (100.0%)
0 (0.0%)
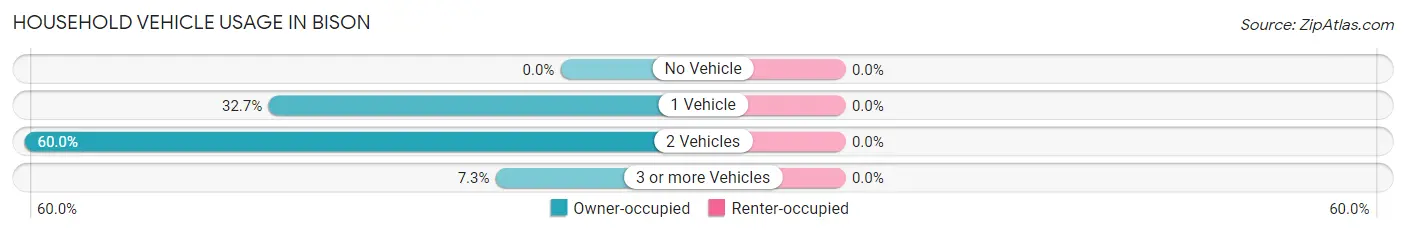
Household Vehicle Usage in Bison
Vehicles per Household
Owner-occupied
Renter-occupied
No Vehicle
0 (0.0%)
0 (0.0%)
1 Vehicle
18 (32.7%)
0 (0.0%)
2 Vehicles
33 (60.0%)
0 (0.0%)
3 or more Vehicles
4 (7.3%)
0 (0.0%)
Total
55 (100.0%)
0 (0.0%)
Real Estate & Mortgages in Bison
Real Estate and Mortgage Overview in Bison
Characteristic
Without Mortgage
With Mortgage
Housing Units
45
10
Median Property Value
$68,100
$0
Median Household Income
$68,375
$0
Monthly Housing Costs
-
-
Real Estate Taxes
-
-
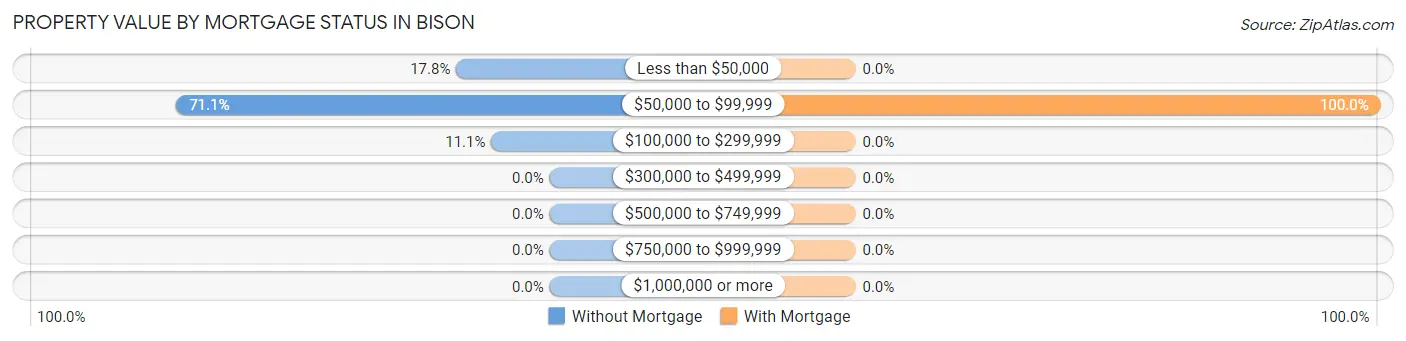
Property Value by Mortgage Status in Bison
Property Value
Without Mortgage
With Mortgage
Less than $50,000
8 (17.8%)
0 (0.0%)
$50,000 to $99,999
32 (71.1%)
10 (100.0%)
$100,000 to $299,999
5 (11.1%)
0 (0.0%)
$300,000 to $499,999
0 (0.0%)
0 (0.0%)
$500,000 to $749,999
0 (0.0%)
0 (0.0%)
$750,000 to $999,999
0 (0.0%)
0 (0.0%)
$1,000,000 or more
0 (0.0%)
0 (0.0%)
Total
45 (100.0%)
10 (100.0%)
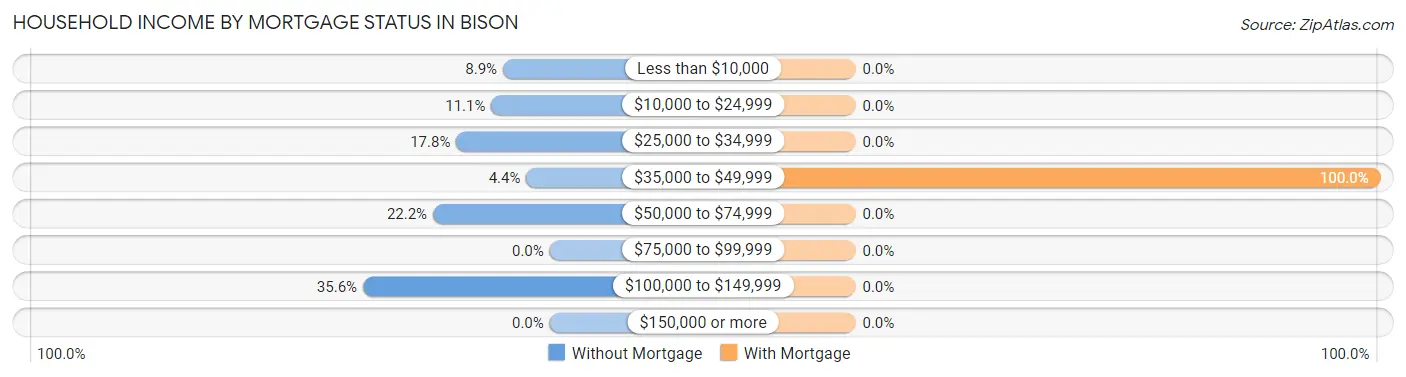
Household Income by Mortgage Status in Bison
Household Income
Without Mortgage
With Mortgage
Less than $10,000
4 (8.9%)
0 (0.0%)
$10,000 to $24,999
5 (11.1%)
0 (0.0%)
$25,000 to $34,999
8 (17.8%)
0 (0.0%)
$35,000 to $49,999
2 (4.4%)
10 (100.0%)
$50,000 to $74,999
10 (22.2%)
0 (0.0%)
$75,000 to $99,999
0 (0.0%)
0 (0.0%)
$100,000 to $149,999
16 (35.6%)
0 (0.0%)
$150,000 or more
0 (0.0%)
0 (0.0%)
Total
45 (100.0%)
10 (100.0%)
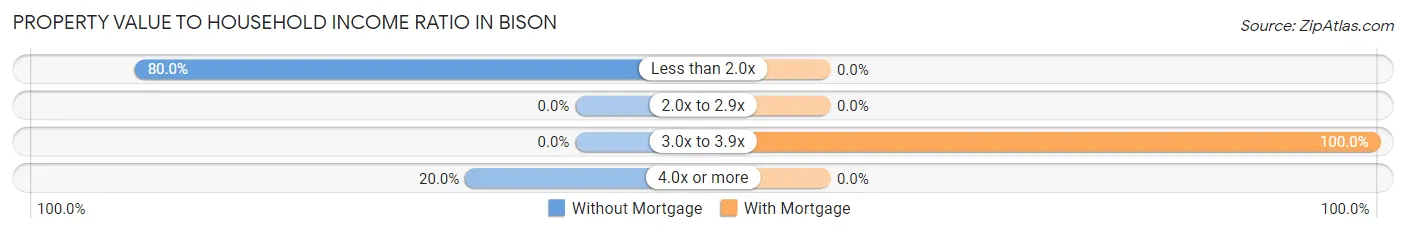
Property Value to Household Income Ratio in Bison
Value-to-Income Ratio
Without Mortgage
With Mortgage
Less than 2.0x
36 (80.0%)
0 (0.0%)
2.0x to 2.9x
0 (0.0%)
0 (0.0%)
3.0x to 3.9x
0 (0.0%)
10 (100.0%)
4.0x or more
9 (20.0%)
0 (0.0%)
Total
45 (100.0%)
10 (100.0%)
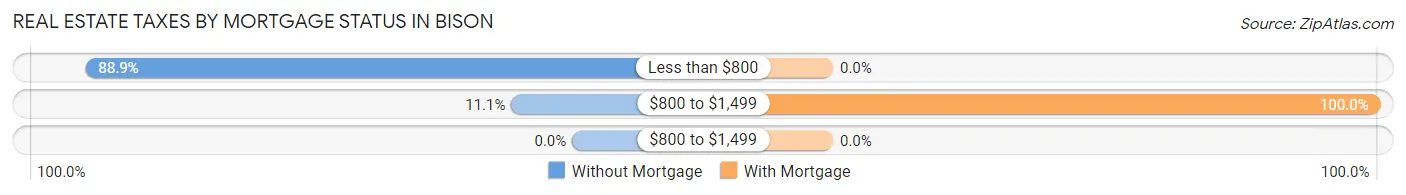
Real Estate Taxes by Mortgage Status in Bison
Property Taxes
Without Mortgage
With Mortgage
Less than $800
40 (88.9%)
0 (0.0%)
$800 to $1,499
5 (11.1%)
10 (100.0%)
$800 to $1,499
0 (0.0%)
0 (0.0%)
Total
45 (100.0%)
10 (100.0%)
Health & Disability in Bison
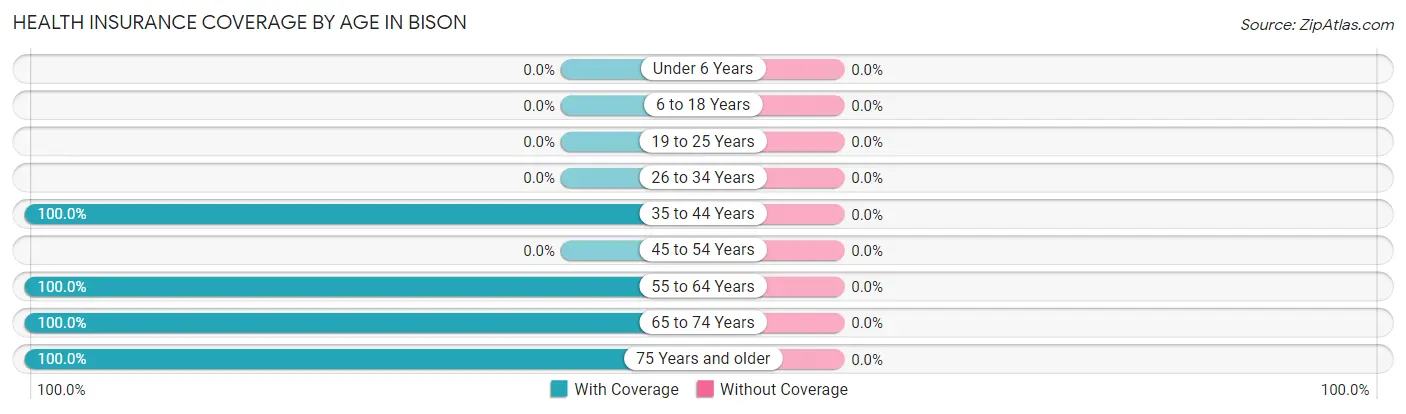
Health Insurance Coverage by Age in Bison
Age Bracket
With Coverage
Without Coverage
Under 6 Years
0 (0.0%)
0 (0.0%)
6 to 18 Years
0 (0.0%)
0 (0.0%)
19 to 25 Years
0 (0.0%)
0 (0.0%)
26 to 34 Years
0 (0.0%)
0 (0.0%)
35 to 44 Years
20 (100.0%)
0 (0.0%)
45 to 54 Years
0 (0.0%)
0 (0.0%)
55 to 64 Years
14 (100.0%)
0 (0.0%)
65 to 74 Years
5 (100.0%)
0 (0.0%)
75 Years and older
32 (100.0%)
0 (0.0%)
Total
71 (100.0%)
0 (0.0%)
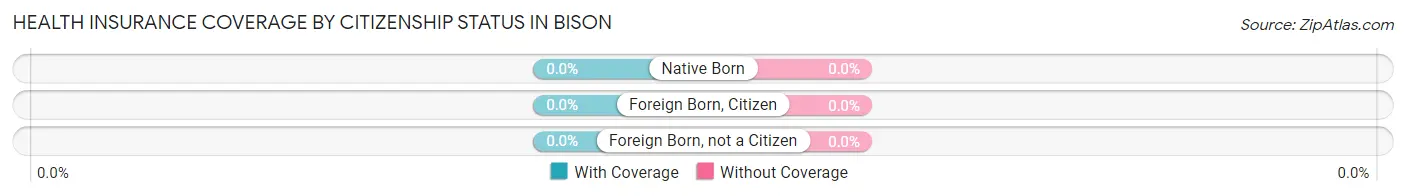
Health Insurance Coverage by Citizenship Status in Bison
Citizenship Status
With Coverage
Without Coverage
Native Born
0 (0.0%)
0 (0.0%)
Foreign Born, Citizen
0 (0.0%)
0 (0.0%)
Foreign Born, not a Citizen
0 (0.0%)
0 (0.0%)
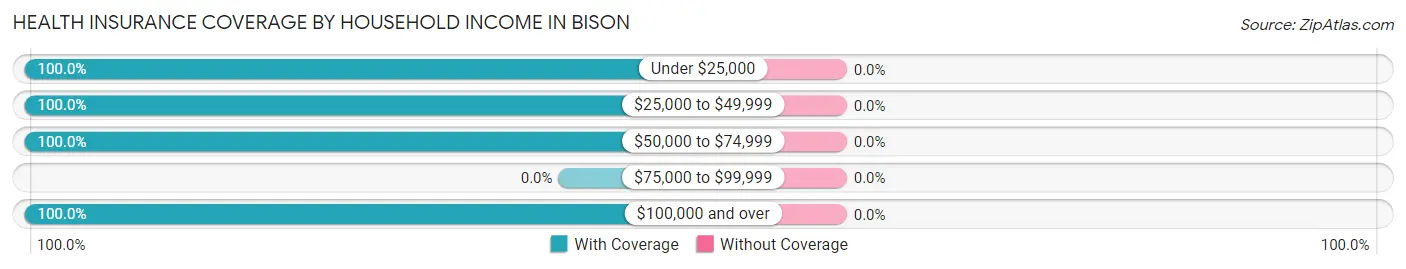
Health Insurance Coverage by Household Income in Bison
Household Income
With Coverage
Without Coverage
Under $25,000
9 (100.0%)
0 (0.0%)
$25,000 to $49,999
20 (100.0%)
0 (0.0%)
$50,000 to $74,999
10 (100.0%)
0 (0.0%)
$75,000 to $99,999
0 (0.0%)
0 (0.0%)
$100,000 and over
32 (100.0%)
0 (0.0%)
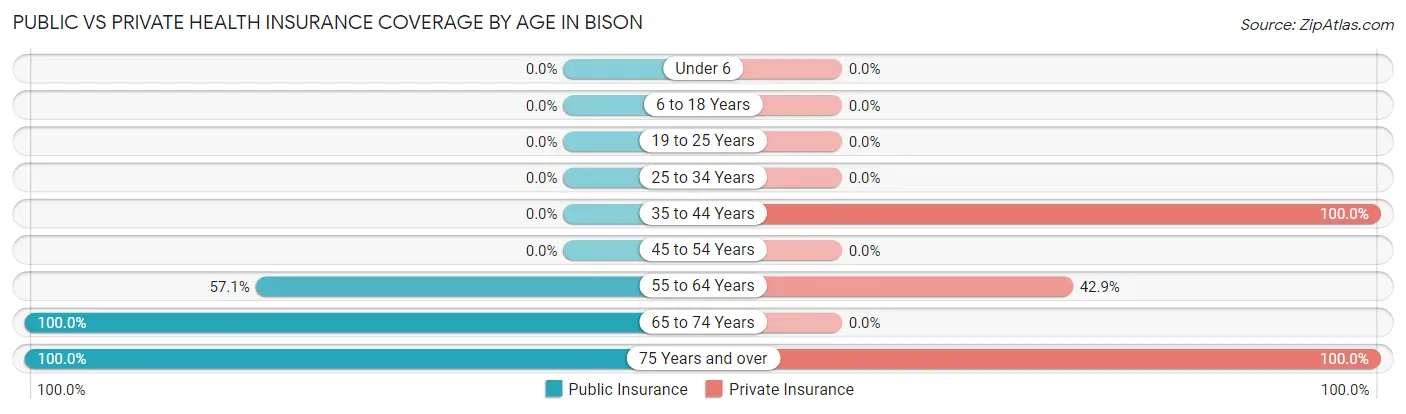
Public vs Private Health Insurance Coverage by Age in Bison
Age Bracket
Public Insurance
Private Insurance
Under 6
0 (0.0%)
0 (0.0%)
6 to 18 Years
0 (0.0%)
0 (0.0%)
19 to 25 Years
0 (0.0%)
0 (0.0%)
25 to 34 Years
0 (0.0%)
0 (0.0%)
35 to 44 Years
0 (0.0%)
20 (100.0%)
45 to 54 Years
0 (0.0%)
0 (0.0%)
55 to 64 Years
8 (57.1%)
6 (42.9%)
65 to 74 Years
5 (100.0%)
0 (0.0%)
75 Years and over
32 (100.0%)
32 (100.0%)
Total
45 (63.4%)
58 (81.7%)
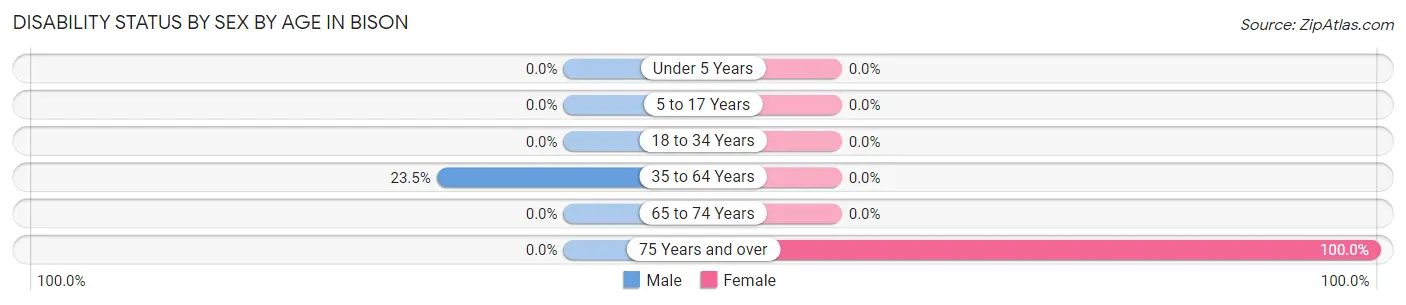
Disability Status by Sex by Age in Bison
Age Bracket
Male
Female
Under 5 Years
0 (0.0%)
0 (0.0%)
5 to 17 Years
0 (0.0%)
0 (0.0%)
18 to 34 Years
0 (0.0%)
0 (0.0%)
35 to 64 Years
8 (23.5%)
0 (0.0%)
65 to 74 Years
0 (0.0%)
0 (0.0%)
75 Years and over
0 (0.0%)
16 (100.0%)
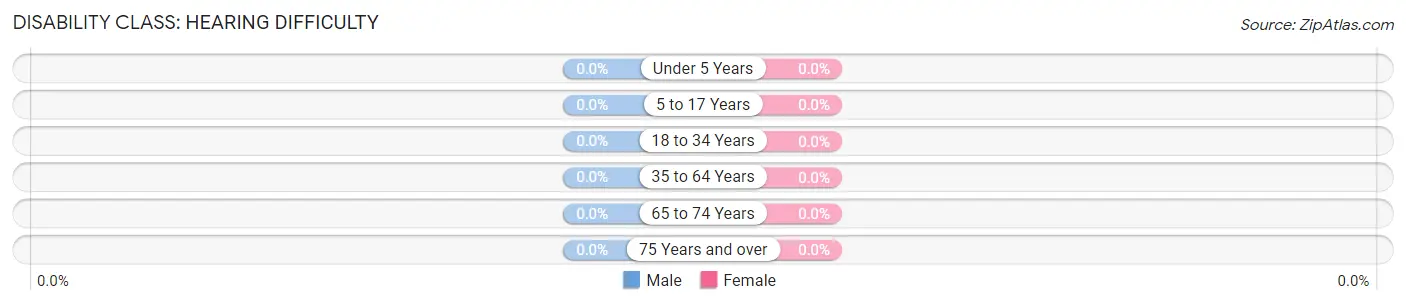
Disability Class by Sex by Age in Bison
Disability Class: Hearing Difficulty
Age Bracket
Male
Female
Under 5 Years
0 (0.0%)
0 (0.0%)
5 to 17 Years
0 (0.0%)
0 (0.0%)
18 to 34 Years
0 (0.0%)
0 (0.0%)
35 to 64 Years
0 (0.0%)
0 (0.0%)
65 to 74 Years
0 (0.0%)
0 (0.0%)
75 Years and over
0 (0.0%)
0 (0.0%)
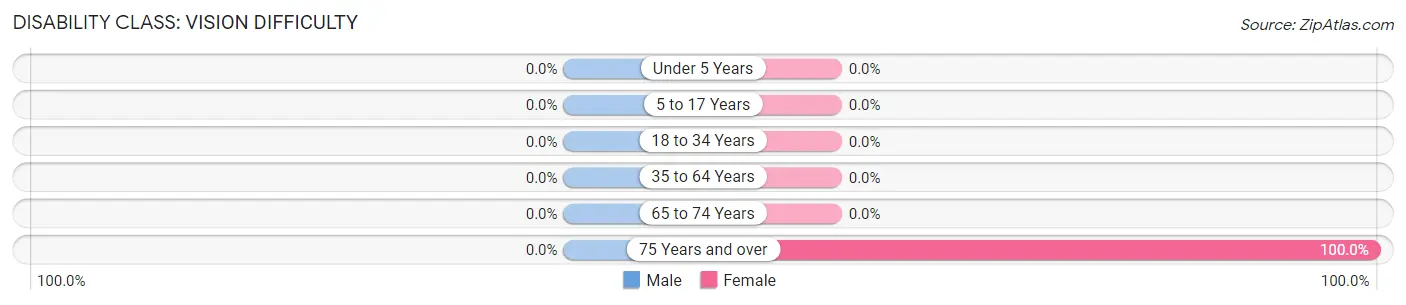
Disability Class: Vision Difficulty
Age Bracket
Male
Female
Under 5 Years
0 (0.0%)
0 (0.0%)
5 to 17 Years
0 (0.0%)
0 (0.0%)
18 to 34 Years
0 (0.0%)
0 (0.0%)
35 to 64 Years
0 (0.0%)
0 (0.0%)
65 to 74 Years
0 (0.0%)
0 (0.0%)
75 Years and over
0 (0.0%)
16 (100.0%)
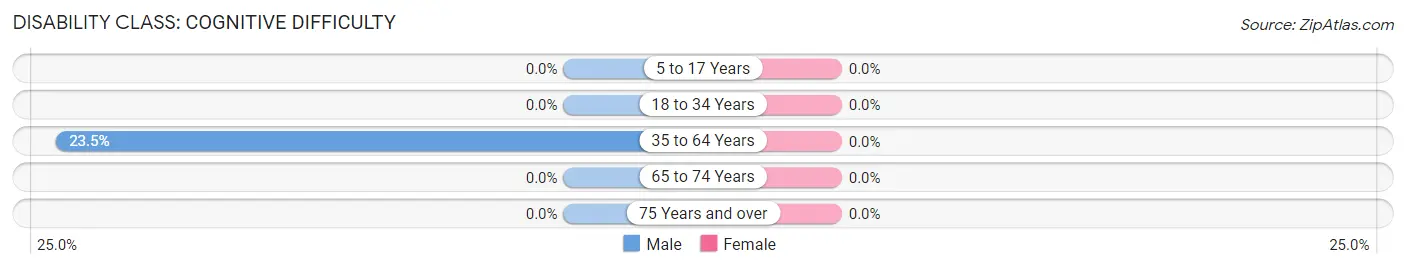
Disability Class: Cognitive Difficulty
Age Bracket
Male
Female
5 to 17 Years
0 (0.0%)
0 (0.0%)
18 to 34 Years
0 (0.0%)
0 (0.0%)
35 to 64 Years
8 (23.5%)
0 (0.0%)
65 to 74 Years
0 (0.0%)
0 (0.0%)
75 Years and over
0 (0.0%)
0 (0.0%)
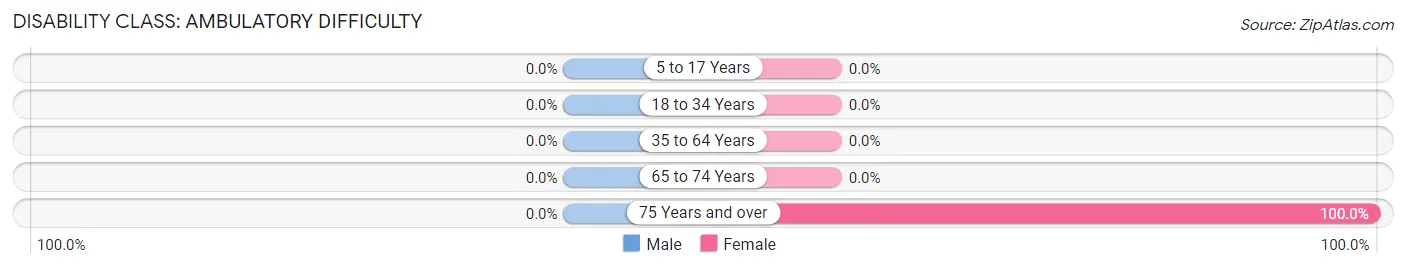
Disability Class: Ambulatory Difficulty
Age Bracket
Male
Female
5 to 17 Years
0 (0.0%)
0 (0.0%)
18 to 34 Years
0 (0.0%)
0 (0.0%)
35 to 64 Years
0 (0.0%)
0 (0.0%)
65 to 74 Years
0 (0.0%)
0 (0.0%)
75 Years and over
0 (0.0%)
16 (100.0%)
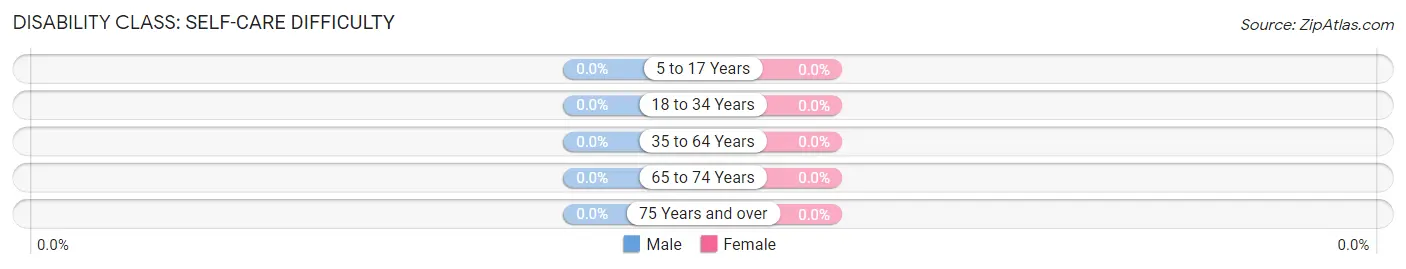
Disability Class: Self-Care Difficulty
Age Bracket
Male
Female
5 to 17 Years
0 (0.0%)
0 (0.0%)
18 to 34 Years
0 (0.0%)
0 (0.0%)
35 to 64 Years
0 (0.0%)
0 (0.0%)
65 to 74 Years
0 (0.0%)
0 (0.0%)
75 Years and over
0 (0.0%)
0 (0.0%)
Technology Access in Bison
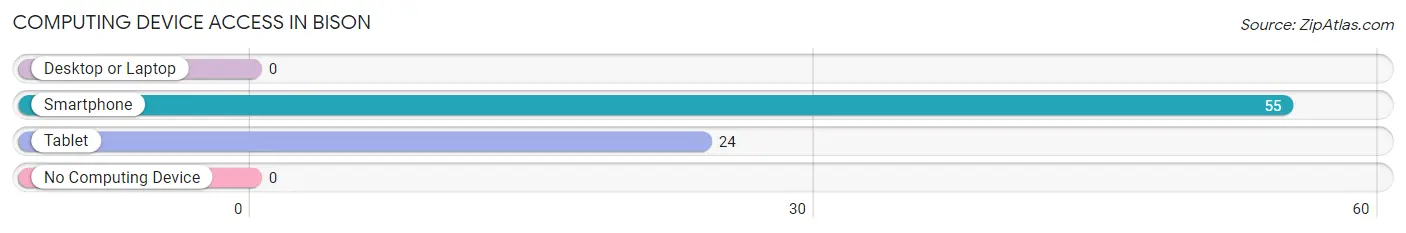
Computing Device Access in Bison
Device Type
# Households
% Households
Desktop or Laptop
0
0.0%
Smartphone
55
100.0%
Tablet
24
43.6%
No Computing Device
0
0.0%
Total
55
100.0%
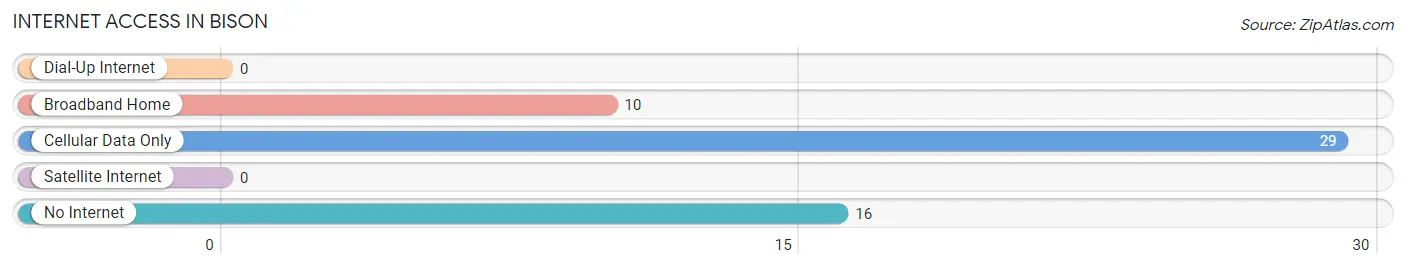
Internet Access in Bison
Internet Type
# Households
% Households
Dial-Up Internet
0
0.0%
Broadband Home
10
18.2%
Cellular Data Only
29
52.7%
Satellite Internet
0
0.0%
No Internet
16
29.1%
Total
55
100.0%
Bison Summary
Bison is a small town located in the northwest corner of Oklahoma, in the county of Harper. It is situated on the banks of the Cimarron River, and is surrounded by rolling hills and prairies. The town was founded in 1892, and was named after the large herds of bison that roamed the area.
Geography
Bison is located in the northwest corner of Oklahoma, in the county of Harper. It is situated on the banks of the Cimarron River, and is surrounded by rolling hills and prairies. The town is located at an elevation of 1,845 feet, and has a total area of 0.7 square miles. The climate is semi-arid, with hot summers and cold winters.
Economy
The economy of Bison is largely based on agriculture. The town is home to several farms, which produce a variety of crops, including wheat, corn, and hay. The town also has a small manufacturing sector, which produces a variety of products, including furniture, clothing, and tools.
Demographics
As of the 2010 census, the population of Bison was 545. The racial makeup of the town was 95.2% White, 0.7% African American, 0.4% Native American, 0.2% Asian, 0.1% Pacific Islander, and 3.4% from other races. The median household income was $31,250, and the median family income was $37,500.
The town is served by the Bison Public School District, which consists of one elementary school, one middle school, and one high school. The town also has a library, a post office, and a few small businesses.
Conclusion
Bison is a small town located in the northwest corner of Oklahoma, in the county of Harper. It is situated on the banks of the Cimarron River, and is surrounded by rolling hills and prairies. The town was founded in 1892, and was named after the large herds of bison that roamed the area. The economy of Bison is largely based on agriculture, and the town is home to several farms. The population of Bison was 545 as of the 2010 census, and the median household income was $31,250. The town is served by the Bison Public School District, and has a library, a post office, and a few small businesses.
Common Questions
What is Per Capita Income in Bison?
Per Capita income in Bison is $46,876.
What is Inequality or Gini Index in Bison?
Inequality or Gini Index in Bison is 0.36.
What is the Total Population of Bison?
Total Population of Bison is 71.
What is the Total Male Population of Bison?
Total Male Population of Bison is 50.
What is the Total Female Population of Bison?
Total Female Population of Bison is 21.
What is the Ratio of Males per 100 Females in Bison?
There are 238.10 Males per 100 Females in Bison.
What is the Ratio of Females per 100 Males in Bison?
There are 42.00 Females per 100 Males in Bison.
What is the Median Population Age in Bison?
Median Population Age in Bison is 65.3 Years.
What is the Average Family Size in Bison
Average Family Size in Bison is 2.0 People.
What is the Average Household Size in Bison
Average Household Size in Bison is 1.3 People.
How Large is the Labor Force in Bison?
There are 36 People in the Labor Forcein in Bison.
What is the Percentage of People in the Labor Force in Bison?
50.7% of People are in the Labor Force in Bison.
Report Title
Report Link
HTML Copy & Paste Link
Social Media
Copy and paste the folowing code into any webpage where you would like this interactive chart to display