Zip Codes with the Highest Percentage of Population Employed in Education Instruction & Library in Oklahoma City, OK

RELATED REPORTS & OPTIONS

Education Instruction & Library
Population
Families and Households
Female Fertility
Female Fertility (Unmarried)
Race (Community Size)
Race (Percentage)
Ancestry (Community Size)
AfricanAlaska NativeAlbanianAmericanApacheArabArapahoArgentineanArmenianAustralianAustrianBahamianBangladeshiBarbadianBasqueBelgianBhutaneseBlackfeetBolivianBrazilianBritishBritish West IndianBulgarianBurmeseCajunCambodianCanadianCelticCentral AmericanCentral American IndianCherokeeCheyenneChickasawChileanChippewaChoctawColombianComancheCreeCreekCroatianCubanCzechCzechoslovakianDanishDelawareDominicanDutchDutch West IndianEastern EuropeanEcuadorianEgyptianEnglishEstonianEthiopianEuropeanFijianFilipinoFinnishFrenchFrench American IndianFrench CanadianGermanGerman RussianGhanaianGreekGuamanian / ChamorroGuatemalanGuyaneseHaitianHonduranHopiHungarianIcelanderIndian (Asian)IndonesianInupiatIranianIraqiIrishIroquoisIsraeliItalianJamaicanJapaneseJordanianKenyanKiowaKoreanLaotianLatvianLebaneseLiberianLithuanianLuxembourgerMalaysianMexicanMexican American IndianMongolianMoroccanNative HawaiianNavajoNew ZealanderNicaraguanNigerianNorthern EuropeanNorwegianOkinawanOsagePakistaniPalestinianPanamanianPennsylvania GermanPeruvianPimaPolishPortuguesePotawatomiPuebloPuerto RicanRomanianRussianSalvadoranSamoanScandinavianScotch-IrishScottishSeminoleSerbianSiouxSlavicSlovakSloveneSouth AfricanSouth AmericanSouth American IndianSpaniardSpanishSpanish American IndianSri LankanSubsaharan AfricanSudaneseSwedishSwissSyrianThaiTlingit-HaidaTonganTrinidadian and TobagonianTurkishU.S. Virgin IslanderUkrainianUruguayanVenezuelanVietnameseWelshWest IndianYugoslavianZimbabwean
Ancestry (Percentage)
AfricanAlaska NativeAlbanianAmericanApacheArabArapahoArgentineanArmenianAustralianAustrianBahamianBangladeshiBarbadianBasqueBelgianBhutaneseBlackfeetBolivianBrazilianBritishBritish West IndianBulgarianBurmeseCajunCambodianCanadianCelticCentral AmericanCentral American IndianCherokeeCheyenneChickasawChileanChippewaChoctawColombianComancheCreeCreekCroatianCubanCzechCzechoslovakianDanishDelawareDominicanDutchDutch West IndianEastern EuropeanEcuadorianEgyptianEnglishEstonianEthiopianEuropeanFijianFilipinoFinnishFrenchFrench American IndianFrench CanadianGermanGerman RussianGhanaianGreekGuamanian / ChamorroGuatemalanGuyaneseHaitianHonduranHopiHungarianIcelanderIndian (Asian)IndonesianInupiatIranianIraqiIrishIroquoisIsraeliItalianJamaicanJapaneseJordanianKenyanKiowaKoreanLaotianLatvianLebaneseLiberianLithuanianLuxembourgerMalaysianMexicanMexican American IndianMongolianMoroccanNative HawaiianNavajoNew ZealanderNicaraguanNigerianNorthern EuropeanNorwegianOkinawanOsagePakistaniPalestinianPanamanianPennsylvania GermanPeruvianPimaPolishPortuguesePotawatomiPuebloPuerto RicanRomanianRussianSalvadoranSamoanScandinavianScotch-IrishScottishSeminoleSerbianSiouxSlavicSlovakSloveneSouth AfricanSouth AmericanSouth American IndianSpaniardSpanishSpanish American IndianSri LankanSubsaharan AfricanSudaneseSwedishSwissSyrianThaiTlingit-HaidaTonganTrinidadian and TobagonianTurkishU.S. Virgin IslanderUkrainianUruguayanVenezuelanVietnameseWelshWest IndianYugoslavianZimbabwean
Immigrant Origin (Total)
AfricaArgentinaAsiaAustraliaAustriaBahamasBangladeshBosnia and HerzegovinaBrazilBulgariaBurma / MyanmarCambodiaCameroonCanadaCaribbeanCentral AmericaChileChinaColombiaCubaDominican RepublicEastern AfricaEastern AsiaEastern EuropeEcuadorEgyptEl SalvadorEnglandEritreaEthiopiaEuropeFranceGermanyGhanaGreeceGuatemalaHondurasHong KongIndiaIndonesiaIranIraqIrelandItalyJamaicaJapanJordanKazakhstanKenyaKoreaKuwaitLaosLatin AmericaLebanonLiberiaMalaysiaMexicoMiddle AfricaMoroccoNepalNetherlandsNicaraguaNigeriaNorthern AfricaNorthern EuropeNorwayOceaniaPakistanPanamaPeruPhilippinesPolandPortugalRussiaSaudi ArabiaScotlandSingaporeSouth AfricaSouth AmericaSouth Central AsiaSouth Eastern AsiaSouthern EuropeSpainSudanSyriaTaiwanThailandTrinidad and TobagoTurkeyUkraineVenezuelaVietnamWestern AfricaWestern AsiaWestern EuropeZaireZimbabwe
Immigrant Origin (Percentage)
AfricaArgentinaAsiaAustraliaAustriaBahamasBangladeshBosnia and HerzegovinaBrazilBulgariaBurma / MyanmarCambodiaCameroonCanadaCaribbeanCentral AmericaChileChinaColombiaCubaDominican RepublicEastern AfricaEastern AsiaEastern EuropeEcuadorEgyptEl SalvadorEnglandEritreaEthiopiaEuropeFranceGermanyGhanaGreeceGuatemalaHondurasHong KongIndiaIndonesiaIranIraqIrelandItalyJamaicaJapanJordanKazakhstanKenyaKoreaKuwaitLaosLatin AmericaLebanonLiberiaMalaysiaMexicoMiddle AfricaMoroccoNepalNetherlandsNicaraguaNigeriaNorthern AfricaNorthern EuropeNorwayOceaniaPakistanPanamaPeruPhilippinesPolandPortugalRussiaSaudi ArabiaScotlandSingaporeSouth AfricaSouth AmericaSouth Central AsiaSouth Eastern AsiaSouthern EuropeSpainSudanSyriaTaiwanThailandTrinidad and TobagoTurkeyUkraineVenezuelaVietnamWestern AfricaWestern AsiaWestern EuropeZaireZimbabwe
Income
Income (Families)
Income (Households)
Poverty
Poverty (Families)
Unemployment
Employment Occupations
Employment Industries
Employer Class
Commute Time
Commute Means
School Enrollment
Education by Degree Field
Occupancy
Finances
Physical Characteristics
Oklahoma City
Compare Zip Codes
Comparison Subject

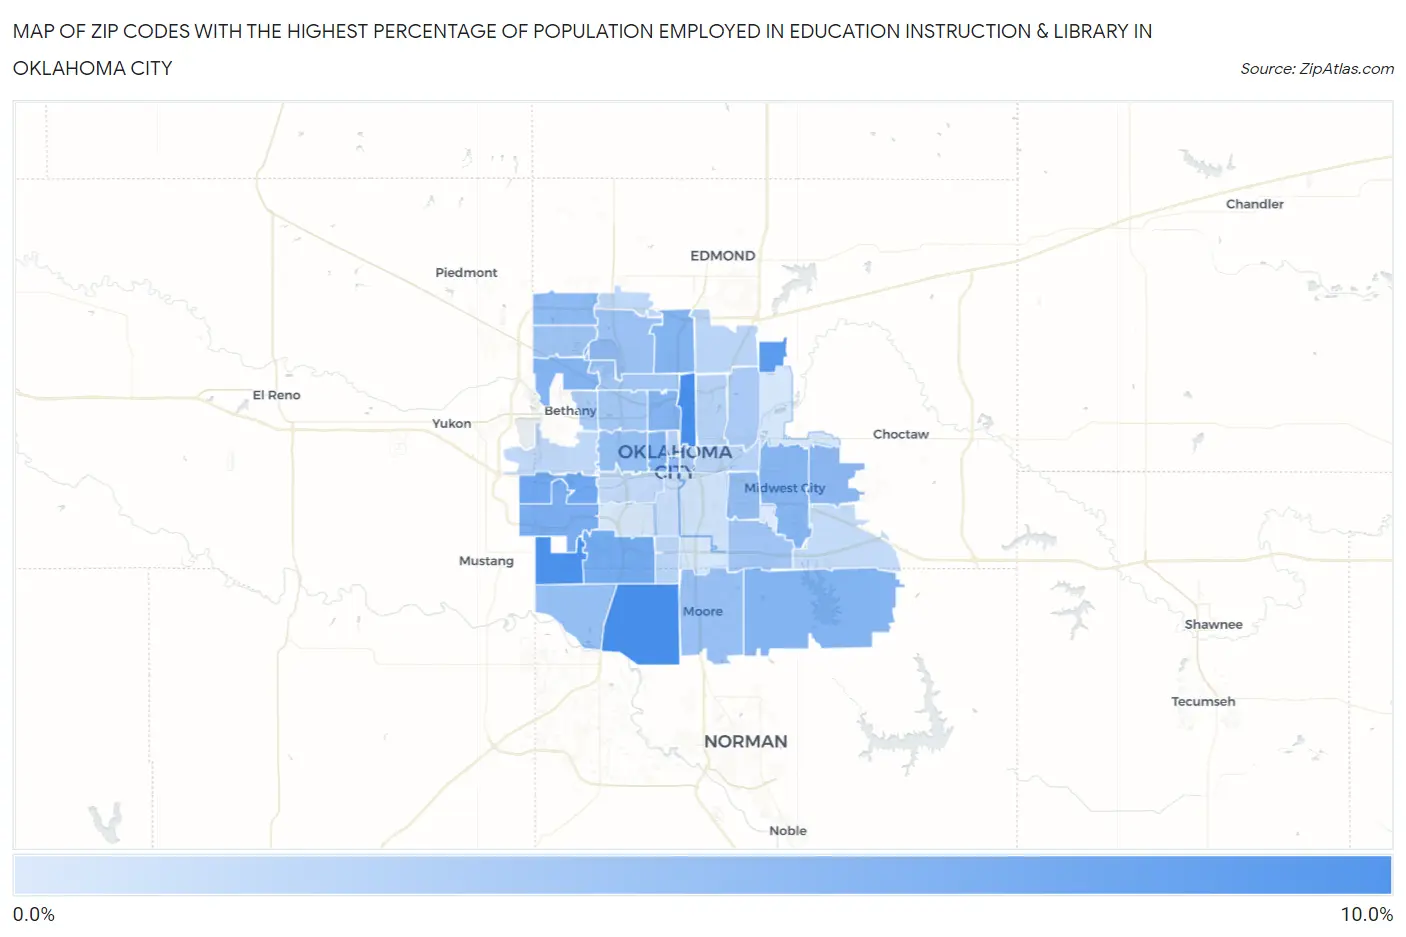
Map of Zip Codes with the Highest Percentage of Population Employed in Education Instruction & Library in Oklahoma City

0.0%
10.0%
Zip Codes with the Highest Percentage of Population Employed in Education Instruction & Library in Oklahoma City Map

Zip Codes with the Highest Percentage of Population Employed in Education Instruction & Library in Oklahoma City, OK

Zip Code % Employed vs State vs National
1.731058.9%6.2%(+2.71)#1096.2%(+2.76)#5,312
2.731708.9%6.2%(+2.67)#1126.2%(+2.73)#5,380
3.731698.7%6.2%(+2.48)#1186.2%(+2.54)#5,685
4.731517.8%6.2%(+1.60)#1566.2%(+1.65)#7,546
5.731286.7%6.2%(+0.506)#2306.2%(+0.560)#10,757
6.731596.6%6.2%(+0.345)#2376.2%(+0.400)#11,321
7.731796.3%6.2%(+0.069)#2606.2%(+0.123)#12,334
8.731145.9%6.2%(-0.382)#3036.2%(-0.328)#14,080
9.731655.8%6.2%(-0.411)#3056.2%(-0.356)#14,204
10.731185.8%6.2%(-0.428)#3066.2%(-0.374)#14,273
11.731325.7%6.2%(-0.510)#3146.2%(-0.455)#14,619
12.731065.7%6.2%(-0.513)#3156.2%(-0.459)#14,634
13.731105.7%6.2%(-0.557)#3206.2%(-0.502)#14,820
14.731305.4%6.2%(-0.807)#3456.2%(-0.752)#15,851
15.731425.3%6.2%(-0.983)#3556.2%(-0.928)#16,571
16.731025.2%6.2%(-1.07)#3626.2%(-1.02)#16,907
17.731155.0%6.2%(-1.21)#3836.2%(-1.15)#17,517
18.731735.0%6.2%(-1.25)#3866.2%(-1.20)#17,716
19.731075.0%6.2%(-1.26)#3876.2%(-1.20)#17,725
20.731604.8%6.2%(-1.42)#3996.2%(-1.36)#18,408
21.731204.6%6.2%(-1.62)#4096.2%(-1.56)#19,249
22.731624.5%6.2%(-1.75)#4206.2%(-1.70)#19,779
23.731354.4%6.2%(-1.88)#4326.2%(-1.83)#20,289
24.731124.3%6.2%(-1.95)#4426.2%(-1.90)#20,562
25.731164.3%6.2%(-1.97)#4446.2%(-1.91)#20,634
26.731213.9%6.2%(-2.34)#4646.2%(-2.28)#22,014
27.731223.9%6.2%(-2.39)#4706.2%(-2.33)#22,212
28.731043.8%6.2%(-2.48)#4806.2%(-2.43)#22,530
29.731033.5%6.2%(-2.76)#4976.2%(-2.71)#23,442
30.731113.3%6.2%(-2.98)#5126.2%(-2.92)#24,168
31.731173.2%6.2%(-3.01)#5136.2%(-2.95)#24,240
32.731313.1%6.2%(-3.10)#5186.2%(-3.05)#24,505
33.731393.1%6.2%(-3.15)#5216.2%(-3.09)#24,627
34.731342.9%6.2%(-3.38)#5326.2%(-3.33)#25,176
35.731272.9%6.2%(-3.39)#5336.2%(-3.33)#25,181
36.731082.8%6.2%(-3.47)#5356.2%(-3.41)#25,375
37.731502.6%6.2%(-3.59)#5406.2%(-3.53)#25,669
38.731092.4%6.2%(-3.79)#5536.2%(-3.74)#26,114
39.731292.1%6.2%(-4.13)#5656.2%(-4.07)#26,764
40.731191.7%6.2%(-4.49)#5716.2%(-4.44)#27,321
41.731491.7%6.2%(-4.50)#5726.2%(-4.44)#27,334
42.731411.7%6.2%(-4.54)#5766.2%(-4.49)#27,394
43.731451.4%6.2%(-4.85)#5826.2%(-4.79)#27,814

Common Questions

What are the Top 10 Zip Codes with the Highest Percentage of Population Employed in Education Instruction & Library in Oklahoma City, OK?
Top 10 Zip Codes with the Highest Percentage of Population Employed in Education Instruction & Library in Oklahoma City, OK are:
#1
8.9%
#2
8.9%
#3
8.7%
#4
7.8%
#5
6.7%
#6
6.6%
#7
6.3%
#8
5.9%
#9
5.8%
#10
5.8%
What zip code has the Highest Percentage of Population Employed in Education Instruction & Library in Oklahoma City, OK?
73105 has the Highest Percentage of Population Employed in Education Instruction & Library in Oklahoma City, OK with 8.9%.
What is the Percentage of Population Employed in Education Instruction & Library in Oklahoma City, OK?
Percentage of Population Employed in Education Instruction & Library in Oklahoma City is 5.2%.
What is the Percentage of Population Employed in Education Instruction & Library in Oklahoma?
Percentage of Population Employed in Education Instruction & Library in Oklahoma is 6.2%.
What is the Percentage of Population Employed in Education Instruction & Library in the United States?
Percentage of Population Employed in Education Instruction & Library in the United States is 6.2%.