Zip Codes with the Highest Percentage of Population Employed in Education Instruction & Library in Oklahoma
RELATED REPORTS & OPTIONS
Education Instruction & Library
Oklahoma
Compare Zip Codes
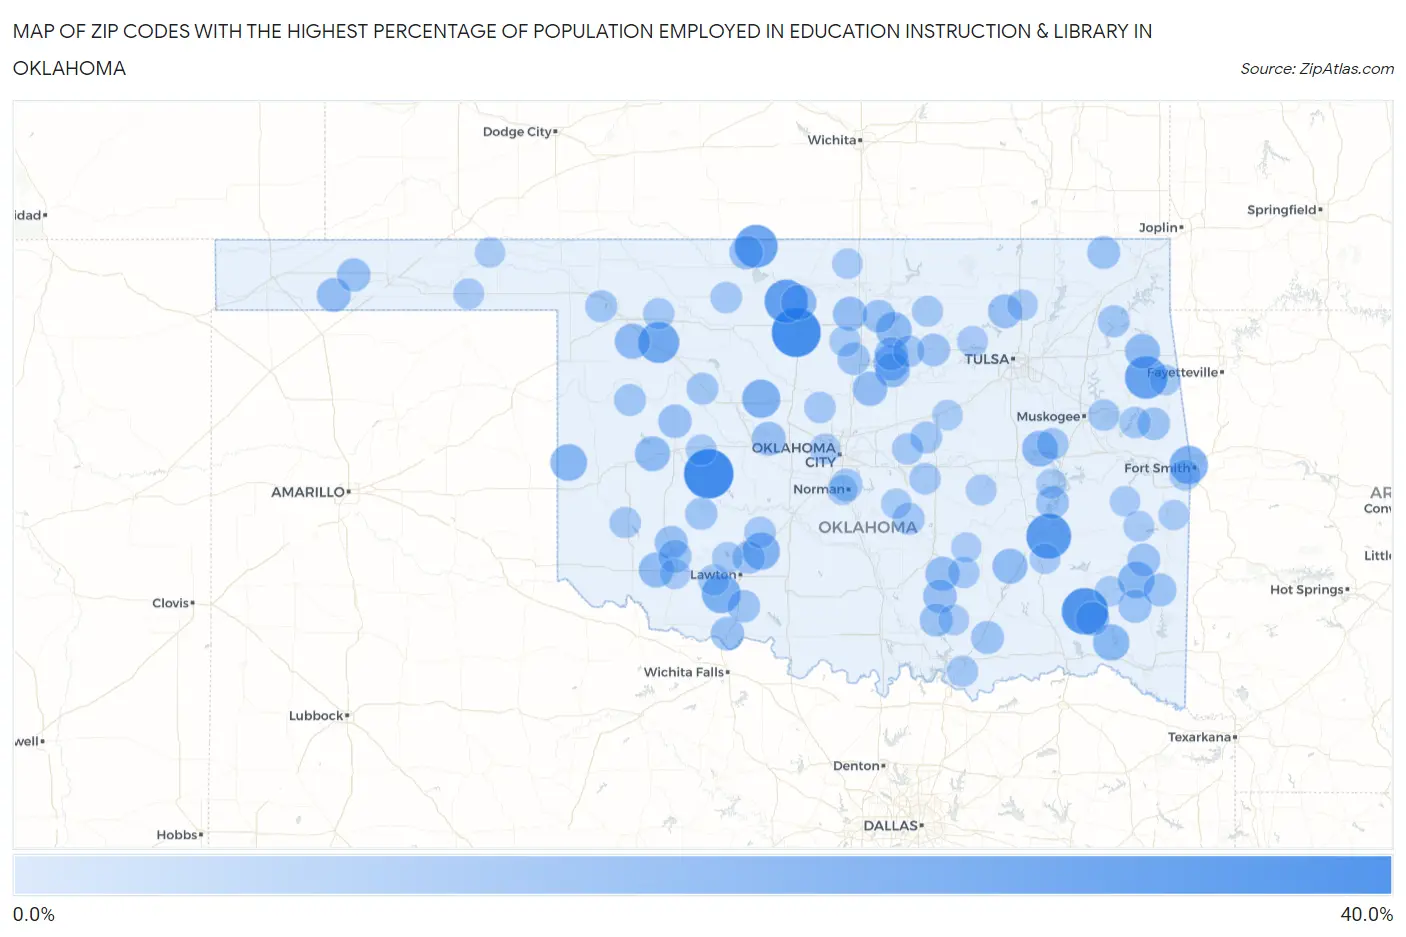
Map of Zip Codes with the Highest Percentage of Population Employed in Education Instruction & Library in Oklahoma
0.0%
40.0%
Zip Codes with the Highest Percentage of Population Employed in Education Instruction & Library in Oklahoma
| Zip Code | % Employed | vs State | vs National | |
| 1. | 73021 | 35.3% | 6.2%(+29.1)#1 | 6.2%(+29.2)#177 |
| 2. | 73705 | 34.6% | 6.2%(+28.4)#2 | 6.2%(+28.4)#190 |
| 3. | 74543 | 31.0% | 6.2%(+24.8)#3 | 6.2%(+24.9)#250 |
| 4. | 74522 | 28.9% | 6.2%(+22.7)#4 | 6.2%(+22.7)#276 |
| 5. | 73743 | 27.0% | 6.2%(+20.8)#5 | 6.2%(+20.8)#312 |
| 6. | 73719 | 26.2% | 6.2%(+20.0)#6 | 6.2%(+20.0)#337 |
| 7. | 74457 | 25.8% | 6.2%(+19.6)#7 | 6.2%(+19.7)#345 |
| 8. | 73853 | 23.5% | 6.2%(+17.3)#8 | 6.2%(+17.3)#437 |
| 9. | 73540 | 20.7% | 6.2%(+14.5)#9 | 6.2%(+14.5)#586 |
| 10. | 74946 | 20.0% | 6.2%(+13.8)#10 | 6.2%(+13.8)#657 |
| 11. | 73764 | 19.7% | 6.2%(+13.5)#11 | 6.2%(+13.6)#670 |
| 12. | 73541 | 18.6% | 6.2%(+12.4)#12 | 6.2%(+12.4)#776 |
| 13. | 73666 | 17.9% | 6.2%(+11.7)#13 | 6.2%(+11.7)#847 |
| 14. | 74549 | 17.5% | 6.2%(+11.2)#14 | 6.2%(+11.3)#897 |
| 15. | 74755 | 17.4% | 6.2%(+11.2)#15 | 6.2%(+11.2)#903 |
| 16. | 74438 | 16.7% | 6.2%(+10.4)#16 | 6.2%(+10.5)#997 |
| 17. | 73061 | 16.6% | 6.2%(+10.4)#17 | 6.2%(+10.4)#1,014 |
| 18. | 74077 | 16.4% | 6.2%(+10.2)#18 | 6.2%(+10.2)#1,035 |
| 19. | 73857 | 16.0% | 6.2%(+9.73)#19 | 6.2%(+9.79)#1,101 |
| 20. | 73753 | 15.9% | 6.2%(+9.70)#20 | 6.2%(+9.76)#1,104 |
| 21. | 73549 | 15.8% | 6.2%(+9.52)#21 | 6.2%(+9.57)#1,142 |
| 22. | 73647 | 15.7% | 6.2%(+9.44)#22 | 6.2%(+9.49)#1,155 |
| 23. | 74576 | 15.6% | 6.2%(+9.39)#23 | 6.2%(+9.44)#1,167 |
| 24. | 74368 | 15.4% | 6.2%(+9.15)#24 | 6.2%(+9.20)#1,216 |
| 25. | 74074 | 15.0% | 6.2%(+8.74)#25 | 6.2%(+8.80)#1,285 |
| 26. | 73050 | 14.8% | 6.2%(+8.56)#26 | 6.2%(+8.61)#1,322 |
| 27. | 74842 | 14.4% | 6.2%(+8.19)#27 | 6.2%(+8.24)#1,412 |
| 28. | 73949 | 14.3% | 6.2%(+8.05)#28 | 6.2%(+8.10)#1,445 |
| 29. | 74630 | 14.3% | 6.2%(+8.05)#29 | 6.2%(+8.10)#1,447 |
| 30. | 73014 | 14.2% | 6.2%(+8.00)#30 | 6.2%(+8.05)#1,473 |
| 31. | 74001 | 14.1% | 6.2%(+7.85)#31 | 6.2%(+7.90)#1,523 |
| 32. | 74562 | 14.0% | 6.2%(+7.74)#32 | 6.2%(+7.79)#1,547 |
| 33. | 73722 | 13.8% | 6.2%(+7.57)#33 | 6.2%(+7.63)#1,601 |
| 34. | 74836 | 13.8% | 6.2%(+7.56)#34 | 6.2%(+7.61)#1,617 |
| 35. | 73531 | 13.5% | 6.2%(+7.25)#35 | 6.2%(+7.30)#1,713 |
| 36. | 73639 | 13.5% | 6.2%(+7.24)#36 | 6.2%(+7.29)#1,716 |
| 37. | 73939 | 13.4% | 6.2%(+7.16)#37 | 6.2%(+7.21)#1,747 |
| 38. | 74075 | 13.4% | 6.2%(+7.15)#38 | 6.2%(+7.20)#1,755 |
| 39. | 73564 | 13.2% | 6.2%(+7.00)#39 | 6.2%(+7.05)#1,806 |
| 40. | 73460 | 13.1% | 6.2%(+6.91)#40 | 6.2%(+6.96)#1,849 |
| 41. | 74722 | 13.0% | 6.2%(+6.81)#41 | 6.2%(+6.86)#1,888 |
| 42. | 73559 | 12.9% | 6.2%(+6.71)#42 | 6.2%(+6.77)#1,920 |
| 43. | 74957 | 12.9% | 6.2%(+6.68)#43 | 6.2%(+6.73)#1,941 |
| 44. | 74729 | 12.9% | 6.2%(+6.65)#44 | 6.2%(+6.71)#1,952 |
| 45. | 74430 | 12.8% | 6.2%(+6.54)#45 | 6.2%(+6.59)#1,983 |
| 46. | 74369 | 12.7% | 6.2%(+6.51)#46 | 6.2%(+6.56)#1,996 |
| 47. | 74577 | 12.7% | 6.2%(+6.49)#47 | 6.2%(+6.54)#2,007 |
| 48. | 74651 | 12.7% | 6.2%(+6.48)#48 | 6.2%(+6.53)#2,013 |
| 49. | 74045 | 12.5% | 6.2%(+6.26)#49 | 6.2%(+6.32)#2,121 |
| 50. | 73572 | 12.4% | 6.2%(+6.15)#50 | 6.2%(+6.20)#2,179 |
| 51. | 74931 | 12.4% | 6.2%(+6.14)#51 | 6.2%(+6.19)#2,184 |
| 52. | 73073 | 12.3% | 6.2%(+6.09)#52 | 6.2%(+6.15)#2,221 |
| 53. | 73538 | 12.3% | 6.2%(+6.07)#53 | 6.2%(+6.12)#2,233 |
| 54. | 73069 | 12.1% | 6.2%(+5.90)#54 | 6.2%(+5.95)#2,316 |
| 55. | 73062 | 11.9% | 6.2%(+5.69)#55 | 6.2%(+5.75)#2,422 |
| 56. | 74826 | 11.6% | 6.2%(+5.38)#56 | 6.2%(+5.43)#2,619 |
| 57. | 73658 | 11.5% | 6.2%(+5.30)#57 | 6.2%(+5.36)#2,667 |
| 58. | 73654 | 11.5% | 6.2%(+5.29)#58 | 6.2%(+5.34)#2,679 |
| 59. | 73841 | 11.5% | 6.2%(+5.23)#59 | 6.2%(+5.28)#2,727 |
| 60. | 74367 | 11.4% | 6.2%(+5.15)#60 | 6.2%(+5.21)#2,787 |
| 61. | 74869 | 11.3% | 6.2%(+5.08)#61 | 6.2%(+5.13)#2,838 |
| 62. | 74428 | 11.2% | 6.2%(+4.94)#62 | 6.2%(+4.99)#2,931 |
| 63. | 74032 | 11.1% | 6.2%(+4.91)#63 | 6.2%(+4.97)#2,946 |
| 64. | 73726 | 11.1% | 6.2%(+4.87)#64 | 6.2%(+4.93)#2,980 |
| 65. | 73029 | 11.1% | 6.2%(+4.83)#65 | 6.2%(+4.89)#3,013 |
| 66. | 73016 | 11.1% | 6.2%(+4.82)#66 | 6.2%(+4.88)#3,020 |
| 67. | 74840 | 11.0% | 6.2%(+4.77)#67 | 6.2%(+4.83)#3,049 |
| 68. | 74434 | 11.0% | 6.2%(+4.73)#68 | 6.2%(+4.78)#3,081 |
| 69. | 73852 | 10.8% | 6.2%(+4.59)#69 | 6.2%(+4.65)#3,184 |
| 70. | 74427 | 10.8% | 6.2%(+4.57)#70 | 6.2%(+4.62)#3,204 |
| 71. | 73527 | 10.8% | 6.2%(+4.55)#71 | 6.2%(+4.61)#3,213 |
| 72. | 74855 | 10.8% | 6.2%(+4.52)#72 | 6.2%(+4.58)#3,234 |
| 73. | 74572 | 10.7% | 6.2%(+4.48)#73 | 6.2%(+4.53)#3,263 |
| 74. | 74730 | 10.7% | 6.2%(+4.46)#74 | 6.2%(+4.51)#3,277 |
| 75. | 73547 | 10.7% | 6.2%(+4.43)#75 | 6.2%(+4.48)#3,303 |
| 76. | 74901 | 10.5% | 6.2%(+4.30)#76 | 6.2%(+4.35)#3,422 |
| 77. | 73757 | 10.5% | 6.2%(+4.24)#77 | 6.2%(+4.29)#3,478 |
| 78. | 73557 | 10.4% | 6.2%(+4.20)#78 | 6.2%(+4.25)#3,520 |
| 79. | 74650 | 10.4% | 6.2%(+4.16)#79 | 6.2%(+4.21)#3,558 |
| 80. | 73096 | 10.2% | 6.2%(+3.98)#80 | 6.2%(+4.03)#3,724 |
| 81. | 74965 | 10.1% | 6.2%(+3.91)#81 | 6.2%(+3.97)#3,781 |
| 82. | 74061 | 10.1% | 6.2%(+3.86)#82 | 6.2%(+3.92)#3,832 |
| 83. | 73450 | 10.1% | 6.2%(+3.82)#83 | 6.2%(+3.87)#3,874 |
| 84. | 74883 | 10.0% | 6.2%(+3.79)#84 | 6.2%(+3.84)#3,899 |
| 85. | 74935 | 10.0% | 6.2%(+3.76)#85 | 6.2%(+3.82)#3,926 |
| 86. | 74054 | 10.0% | 6.2%(+3.73)#86 | 6.2%(+3.78)#3,973 |
| 87. | 73931 | 10.0% | 6.2%(+3.72)#87 | 6.2%(+3.78)#3,983 |
| 88. | 73008 | 9.9% | 6.2%(+3.62)#88 | 6.2%(+3.68)#4,107 |
| 89. | 73566 | 9.9% | 6.2%(+3.62)#89 | 6.2%(+3.67)#4,115 |
| 90. | 74528 | 9.8% | 6.2%(+3.52)#90 | 6.2%(+3.57)#4,217 |
| 91. | 74646 | 9.7% | 6.2%(+3.44)#91 | 6.2%(+3.49)#4,309 |
| 92. | 74944 | 9.7% | 6.2%(+3.43)#92 | 6.2%(+3.49)#4,318 |
| 93. | 74852 | 9.6% | 6.2%(+3.35)#93 | 6.2%(+3.41)#4,416 |
| 94. | 74558 | 9.5% | 6.2%(+3.29)#94 | 6.2%(+3.34)#4,497 |
| 95. | 74046 | 9.5% | 6.2%(+3.29)#95 | 6.2%(+3.34)#4,498 |
| 96. | 74953 | 9.5% | 6.2%(+3.25)#96 | 6.2%(+3.30)#4,542 |
| 97. | 73938 | 9.4% | 6.2%(+3.17)#97 | 6.2%(+3.23)#4,634 |
| 98. | 73072 | 9.4% | 6.2%(+3.11)#98 | 6.2%(+3.17)#4,711 |
| 99. | 74432 | 9.3% | 6.2%(+3.09)#99 | 6.2%(+3.15)#4,747 |
| 100. | 74825 | 9.3% | 6.2%(+3.09)#100 | 6.2%(+3.14)#4,751 |
Common Questions
What are the Top 10 Zip Codes with the Highest Percentage of Population Employed in Education Instruction & Library in Oklahoma?
Top 10 Zip Codes with the Highest Percentage of Population Employed in Education Instruction & Library in Oklahoma are:
What zip code has the Highest Percentage of Population Employed in Education Instruction & Library in Oklahoma?
73021 has the Highest Percentage of Population Employed in Education Instruction & Library in Oklahoma with 35.3%.
What is the Percentage of Population Employed in Education Instruction & Library in the State of Oklahoma?
Percentage of Population Employed in Education Instruction & Library in Oklahoma is 6.2%.
What is the Percentage of Population Employed in Education Instruction & Library in the United States?
Percentage of Population Employed in Education Instruction & Library in the United States is 6.2%.