South Henderson, NC Map & Demographics
South Henderson Map
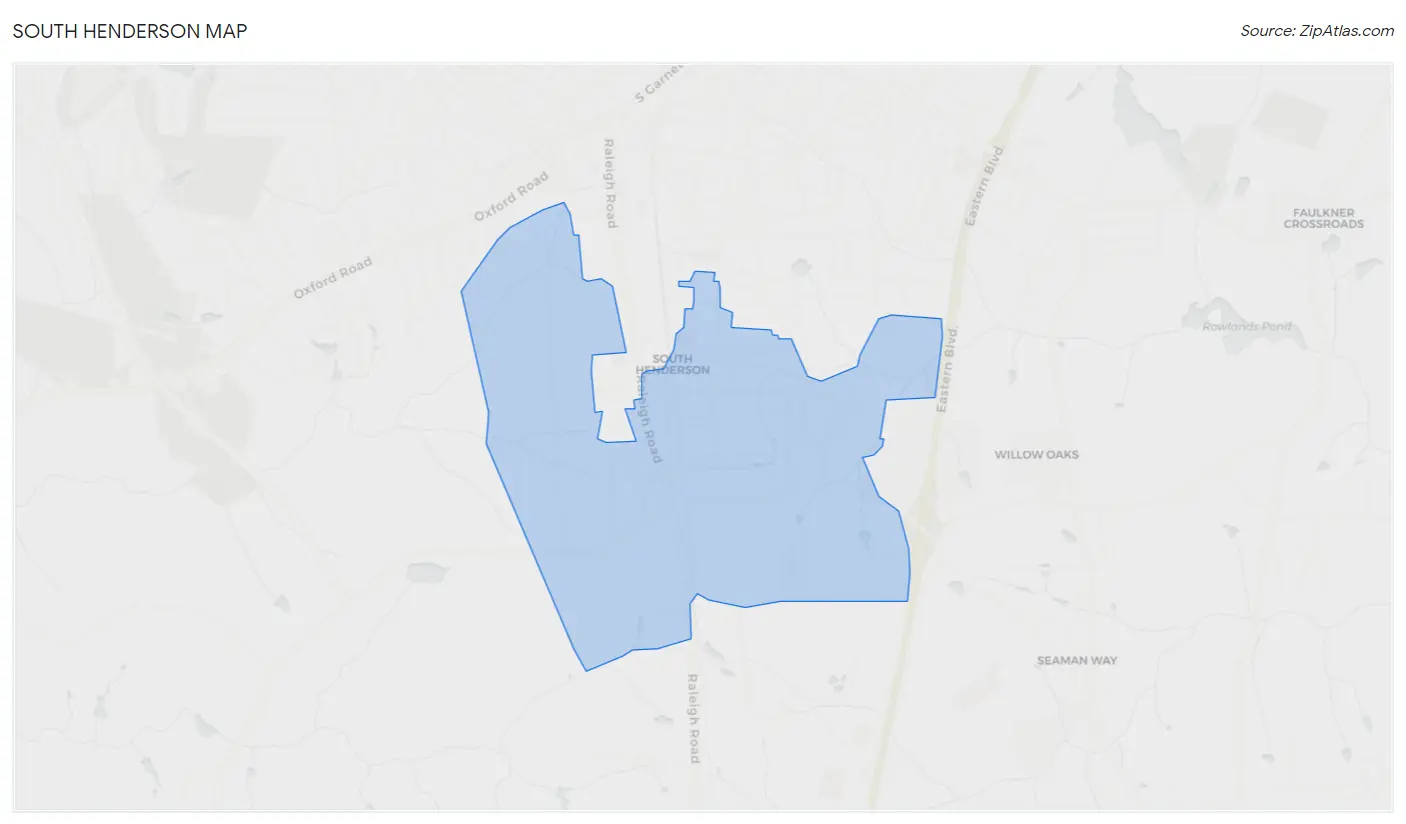
South Henderson Overview
$13,779
PER CAPITA INCOME
$38,690
AVG FAMILY INCOME
$35,341
AVG HOUSEHOLD INCOME
8.6%
WAGE / INCOME GAP [ % ]
91.4¢/ $1
WAGE / INCOME GAP [ $ ]
$10,802
FAMILY INCOME DEFICIT
0.46
INEQUALITY / GINI INDEX
1,187
TOTAL POPULATION
577
MALE POPULATION
610
FEMALE POPULATION
94.59
MALES / 100 FEMALES
105.72
FEMALES / 100 MALES
32.3
MEDIAN AGE
3.5
AVG FAMILY SIZE
3.1
AVG HOUSEHOLD SIZE
550
LABOR FORCE [ PEOPLE ]
63.0%
PERCENT IN LABOR FORCE
23.1%
UNEMPLOYMENT RATE
Income in South Henderson
Income Overview in South Henderson
Per Capita Income in South Henderson is $13,779, while median incomes of families and households are $38,690 and $35,341 respectively.
| Characteristic | Number | Measure |
| Per Capita Income | 1,187 | $13,779 |
| Median Family Income | 262 | $38,690 |
| Mean Family Income | 262 | $48,487 |
| Median Household Income | 378 | $35,341 |
| Mean Household Income | 378 | $41,714 |
| Income Deficit | 262 | $10,802 |
| Wage / Income Gap (%) | 1,187 | 8.57% |
| Wage / Income Gap ($) | 1,187 | 91.43¢ per $1 |
| Gini / Inequality Index | 1,187 | 0.46 |
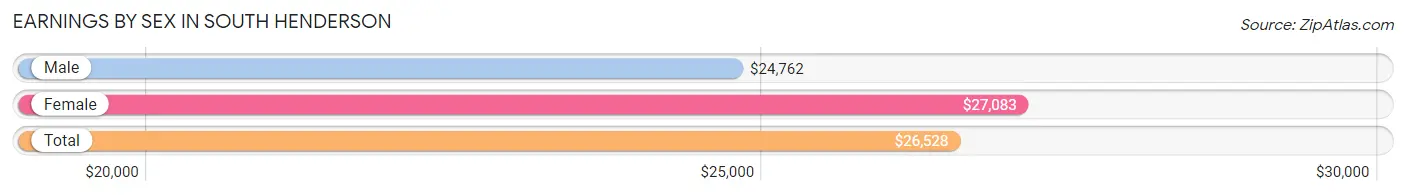
Earnings by Sex in South Henderson
Average Earnings in South Henderson are $26,528, $24,762 for men and $27,083 for women, a difference of 8.6%.
| Sex | Number | Average Earnings |
| Male | 176 (38.2%) | $24,762 |
| Female | 285 (61.8%) | $27,083 |
| Total | 461 (100.0%) | $26,528 |
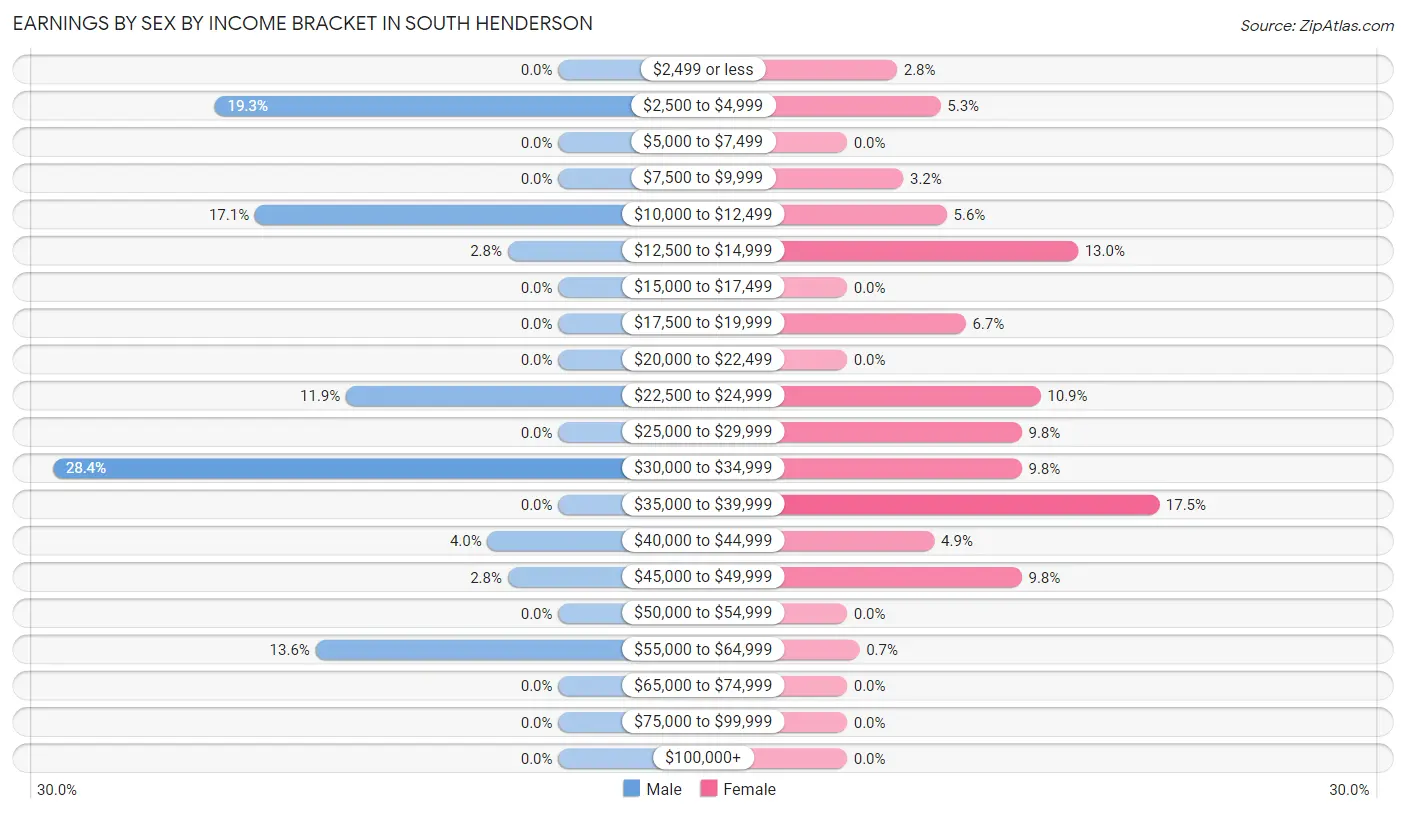
Earnings by Sex by Income Bracket in South Henderson
The most common earnings brackets in South Henderson are $30,000 to $34,999 for men (50 | 28.4%) and $35,000 to $39,999 for women (50 | 17.5%).
| Income | Male | Female |
| $2,499 or less | 0 (0.0%) | 8 (2.8%) |
| $2,500 to $4,999 | 34 (19.3%) | 15 (5.3%) |
| $5,000 to $7,499 | 0 (0.0%) | 0 (0.0%) |
| $7,500 to $9,999 | 0 (0.0%) | 9 (3.2%) |
| $10,000 to $12,499 | 30 (17.1%) | 16 (5.6%) |
| $12,500 to $14,999 | 5 (2.8%) | 37 (13.0%) |
| $15,000 to $17,499 | 0 (0.0%) | 0 (0.0%) |
| $17,500 to $19,999 | 0 (0.0%) | 19 (6.7%) |
| $20,000 to $22,499 | 0 (0.0%) | 0 (0.0%) |
| $22,500 to $24,999 | 21 (11.9%) | 31 (10.9%) |
| $25,000 to $29,999 | 0 (0.0%) | 28 (9.8%) |
| $30,000 to $34,999 | 50 (28.4%) | 28 (9.8%) |
| $35,000 to $39,999 | 0 (0.0%) | 50 (17.5%) |
| $40,000 to $44,999 | 7 (4.0%) | 14 (4.9%) |
| $45,000 to $49,999 | 5 (2.8%) | 28 (9.8%) |
| $50,000 to $54,999 | 0 (0.0%) | 0 (0.0%) |
| $55,000 to $64,999 | 24 (13.6%) | 2 (0.7%) |
| $65,000 to $74,999 | 0 (0.0%) | 0 (0.0%) |
| $75,000 to $99,999 | 0 (0.0%) | 0 (0.0%) |
| $100,000+ | 0 (0.0%) | 0 (0.0%) |
| Total | 176 (100.0%) | 285 (100.0%) |
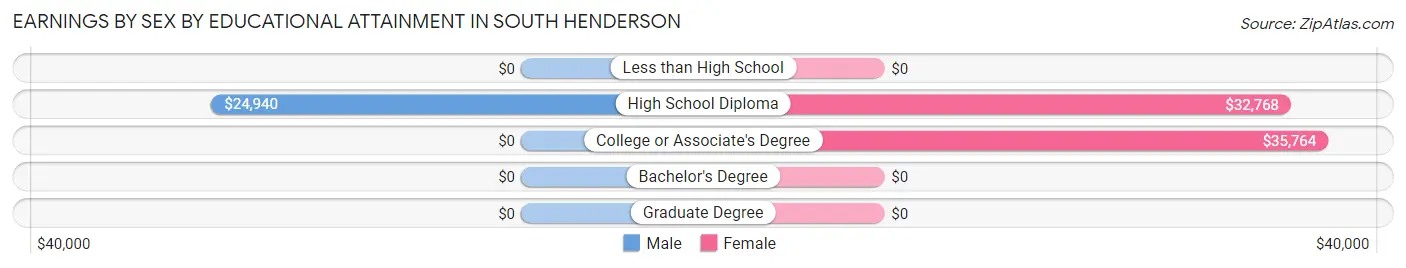
Earnings by Sex by Educational Attainment in South Henderson
Average earnings in South Henderson are $27,500 for men and $29,408 for women, a difference of 6.5%. Men with an educational attainment of high school diploma enjoy the highest average annual earnings of $24,940, while those with high school diploma education earn the least with $24,940. Women with an educational attainment of college or associate's degree earn the most with the average annual earnings of $35,764, while those with high school diploma education have the smallest earnings of $32,768.
| Educational Attainment | Male Income | Female Income |
| Less than High School | - | - |
| High School Diploma | $24,940 | $32,768 |
| College or Associate's Degree | - | - |
| Bachelor's Degree | - | - |
| Graduate Degree | - | - |
| Total | $27,500 | $29,408 |
Family Income in South Henderson
Family Income Brackets in South Henderson
According to the South Henderson family income data, there are 58 families falling into the $35,000 to $49,999 income range, which is the most common income bracket and makes up 22.1% of all families.
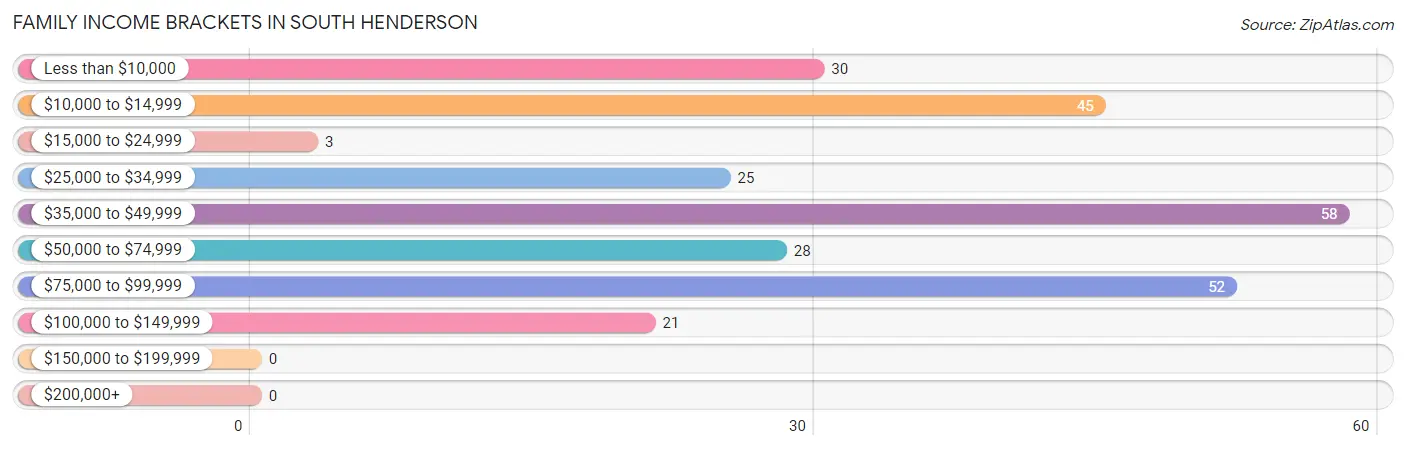
| Income Bracket | # Families | % Families |
| Less than $10,000 | 30 | 11.5% |
| $10,000 to $14,999 | 45 | 17.2% |
| $15,000 to $24,999 | 3 | 1.1% |
| $25,000 to $34,999 | 25 | 9.5% |
| $35,000 to $49,999 | 58 | 22.1% |
| $50,000 to $74,999 | 28 | 10.7% |
| $75,000 to $99,999 | 52 | 19.8% |
| $100,000 to $149,999 | 21 | 8.0% |
| $150,000 to $199,999 | 0 | 0.0% |
| $200,000+ | 0 | 0.0% |
Family Income by Famaliy Size in South Henderson
4-person families (123 | 46.9%) account for the highest median family income in South Henderson with $63,125 per family, while 4-person families (123 | 46.9%) have the highest median income of $15,781 per family member.
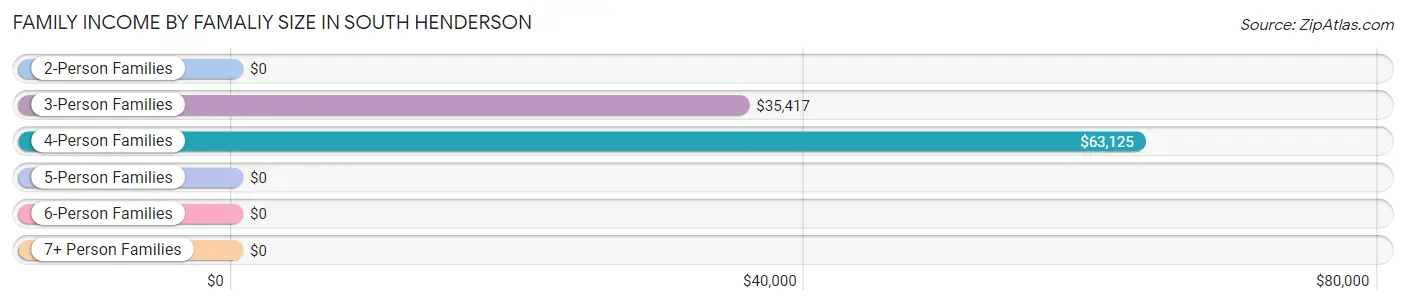
| Income Bracket | # Families | Median Income |
| 2-Person Families | 61 (23.3%) | $0 |
| 3-Person Families | 68 (26.0%) | $35,417 |
| 4-Person Families | 123 (46.9%) | $63,125 |
| 5-Person Families | 0 (0.0%) | $0 |
| 6-Person Families | 5 (1.9%) | $0 |
| 7+ Person Families | 5 (1.9%) | $0 |
| Total | 262 (100.0%) | $38,690 |
Family Income by Number of Earners in South Henderson
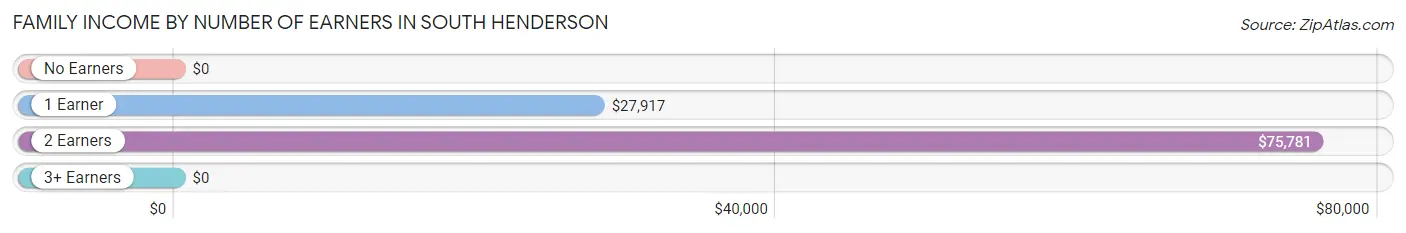
| Number of Earners | # Families | Median Income |
| No Earners | 20 (7.6%) | $0 |
| 1 Earner | 141 (53.8%) | $27,917 |
| 2 Earners | 89 (34.0%) | $75,781 |
| 3+ Earners | 12 (4.6%) | $0 |
| Total | 262 (100.0%) | $38,690 |
Household Income in South Henderson
Household Income Brackets in South Henderson
With 83 households falling in the category, the $10,000 to $14,999 income range is the most frequent in South Henderson, accounting for 22.0% of all households.
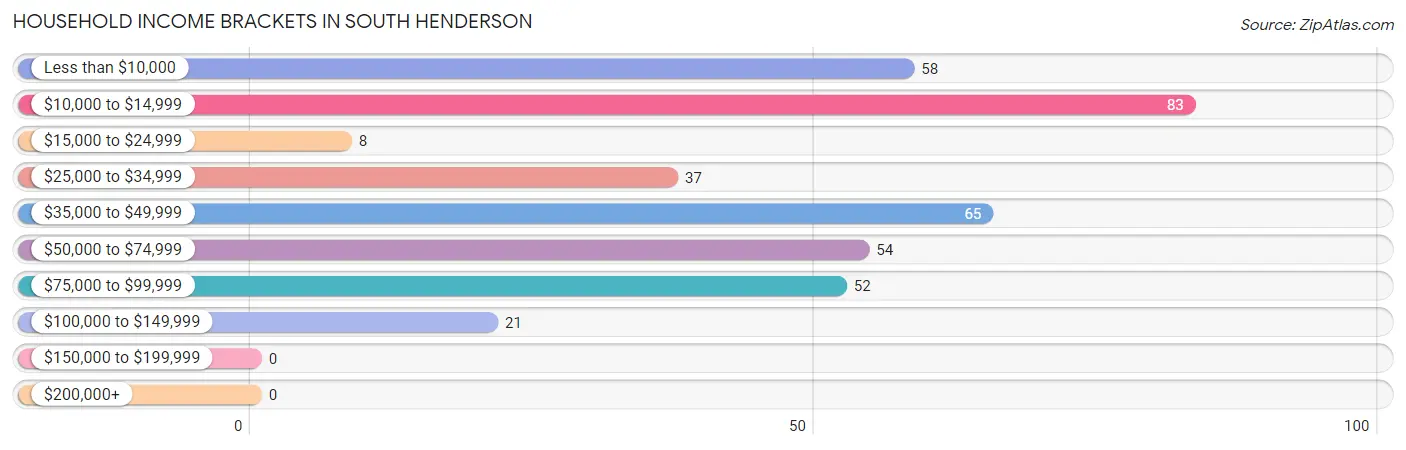
| Income Bracket | # Households | % Households |
| Less than $10,000 | 58 | 15.3% |
| $10,000 to $14,999 | 83 | 22.0% |
| $15,000 to $24,999 | 8 | 2.1% |
| $25,000 to $34,999 | 37 | 9.8% |
| $35,000 to $49,999 | 65 | 17.2% |
| $50,000 to $74,999 | 54 | 14.3% |
| $75,000 to $99,999 | 52 | 13.8% |
| $100,000 to $149,999 | 21 | 5.6% |
| $150,000 to $199,999 | 0 | 0.0% |
| $200,000+ | 0 | 0.0% |
Household Income by Householder Age in South Henderson
The median household income in South Henderson is $35,341, with the highest median household income of $48,750 found in the 65+ years age bracket for the primary householder. A total of 63 households (16.7%) fall into this category. Meanwhile, the 15 to 24 years age bracket for the primary householder has the lowest median household income of $0, with 31 households (8.2%) in this group.
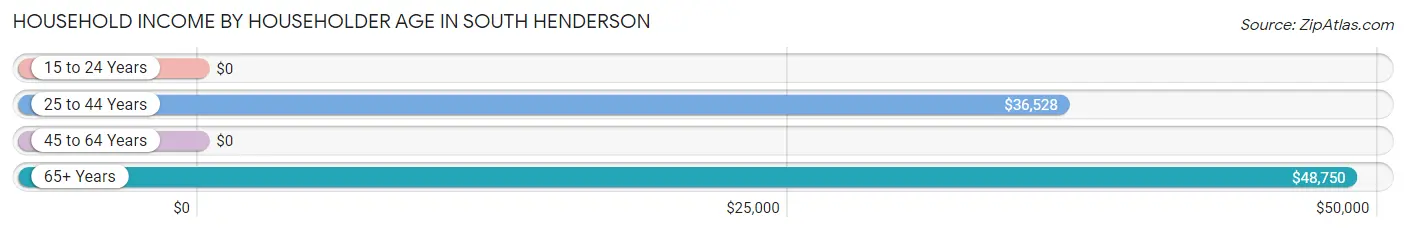
| Income Bracket | # Households | Median Income |
| 15 to 24 Years | 31 (8.2%) | $0 |
| 25 to 44 Years | 118 (31.2%) | $36,528 |
| 45 to 64 Years | 166 (43.9%) | $0 |
| 65+ Years | 63 (16.7%) | $48,750 |
| Total | 378 (100.0%) | $35,341 |
Poverty in South Henderson
Income Below Poverty by Sex and Age in South Henderson
With 42.1% poverty level for males and 36.7% for females among the residents of South Henderson, 16 and 17 year old males and 15 year old females are the most vulnerable to poverty, with 4 males (100.0%) and 20 females (100.0%) in their respective age groups living below the poverty level.
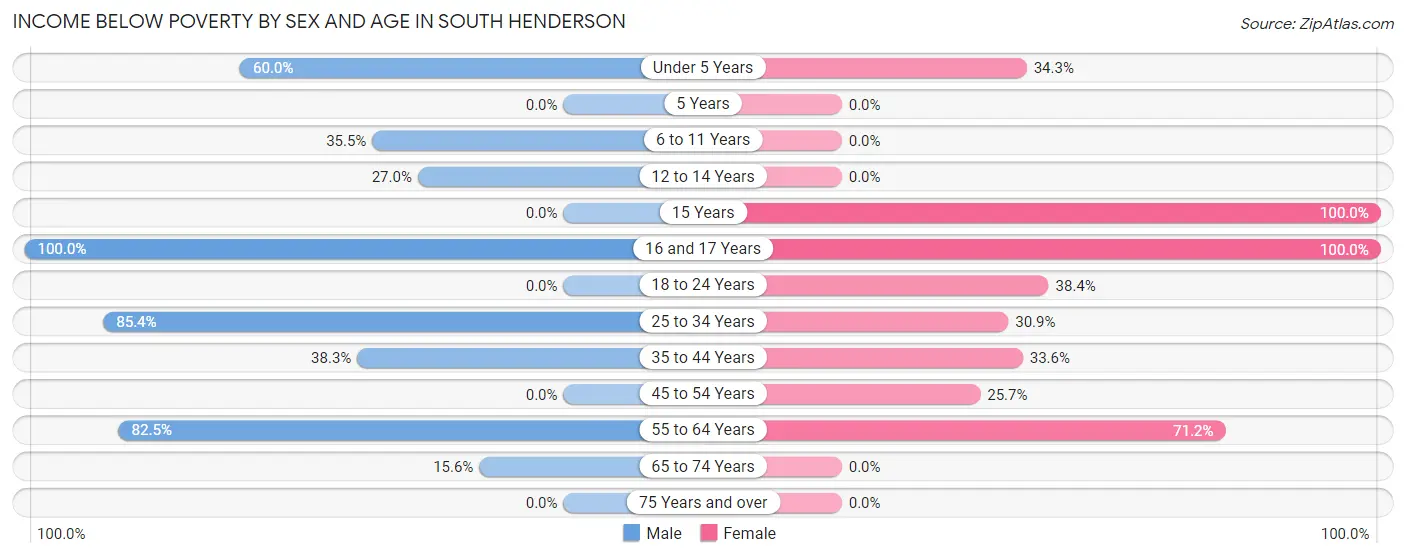
| Age Bracket | Male | Female |
| Under 5 Years | 51 (60.0%) | 23 (34.3%) |
| 5 Years | 0 (0.0%) | 0 (0.0%) |
| 6 to 11 Years | 11 (35.5%) | 0 (0.0%) |
| 12 to 14 Years | 10 (27.0%) | 0 (0.0%) |
| 15 Years | 0 (0.0%) | 20 (100.0%) |
| 16 and 17 Years | 4 (100.0%) | 27 (100.0%) |
| 18 to 24 Years | 0 (0.0%) | 43 (38.4%) |
| 25 to 34 Years | 70 (85.4%) | 17 (30.9%) |
| 35 to 44 Years | 31 (38.3%) | 43 (33.6%) |
| 45 to 54 Years | 0 (0.0%) | 9 (25.7%) |
| 55 to 64 Years | 52 (82.5%) | 42 (71.2%) |
| 65 to 74 Years | 5 (15.6%) | 0 (0.0%) |
| 75 Years and over | 0 (0.0%) | 0 (0.0%) |
| Total | 234 (42.1%) | 224 (36.7%) |
Income Above Poverty by Sex and Age in South Henderson
According to the poverty statistics in South Henderson, males aged 18 to 24 years and females aged 6 to 11 years are the age groups that are most secure financially, with 100.0% of males and 100.0% of females in these age groups living above the poverty line.
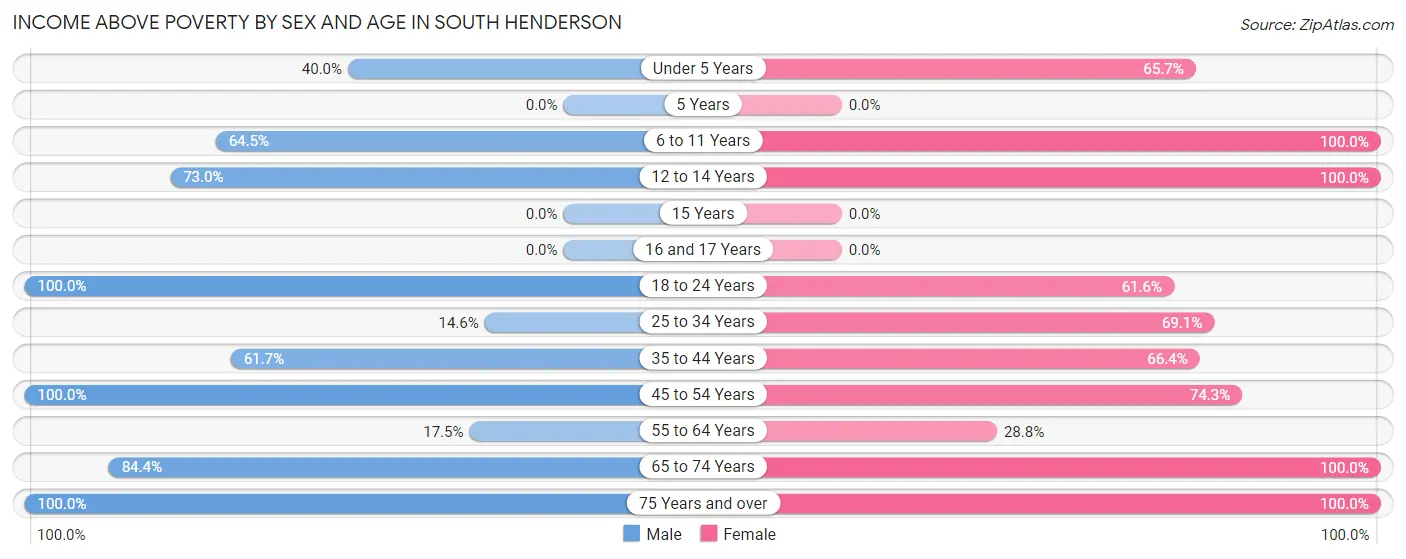
| Age Bracket | Male | Female |
| Under 5 Years | 34 (40.0%) | 44 (65.7%) |
| 5 Years | 0 (0.0%) | 0 (0.0%) |
| 6 to 11 Years | 20 (64.5%) | 3 (100.0%) |
| 12 to 14 Years | 27 (73.0%) | 50 (100.0%) |
| 15 Years | 0 (0.0%) | 0 (0.0%) |
| 16 and 17 Years | 0 (0.0%) | 0 (0.0%) |
| 18 to 24 Years | 49 (100.0%) | 69 (61.6%) |
| 25 to 34 Years | 12 (14.6%) | 38 (69.1%) |
| 35 to 44 Years | 50 (61.7%) | 85 (66.4%) |
| 45 to 54 Years | 84 (100.0%) | 26 (74.3%) |
| 55 to 64 Years | 11 (17.5%) | 17 (28.8%) |
| 65 to 74 Years | 27 (84.4%) | 37 (100.0%) |
| 75 Years and over | 8 (100.0%) | 17 (100.0%) |
| Total | 322 (57.9%) | 386 (63.3%) |
Income Below Poverty Among Married-Couple Families in South Henderson
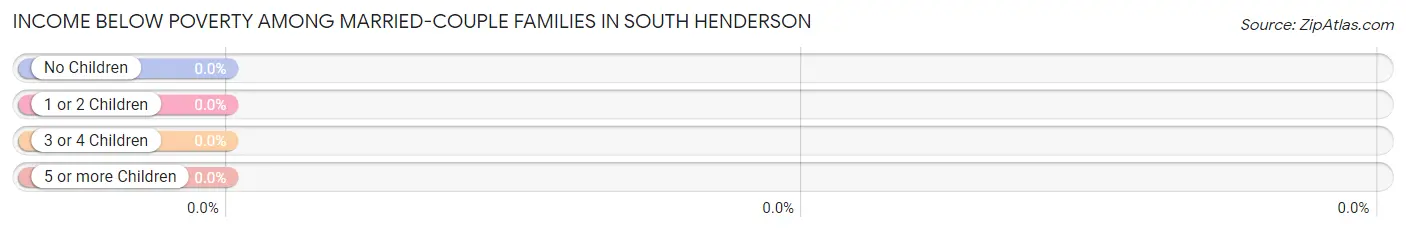
| Children | Above Poverty | Below Poverty |
| No Children | 28 (100.0%) | 0 (0.0%) |
| 1 or 2 Children | 82 (100.0%) | 0 (0.0%) |
| 3 or 4 Children | 0 (0.0%) | 0 (0.0%) |
| 5 or more Children | 0 (0.0%) | 0 (0.0%) |
| Total | 110 (100.0%) | 0 (0.0%) |
Income Below Poverty Among Single-Parent Households in South Henderson
According to the poverty data in South Henderson, 100.0% or 25 single-father households and 53.5% or 68 single-mother households are living below the poverty line. Among single-father households, those with 1 or 2 children have the highest poverty rate, with 25 households (100.0%) experiencing poverty. Likewise, among single-mother households, those with 3 or 4 children have the highest poverty rate, with 17 households (100.0%) falling below the poverty line.
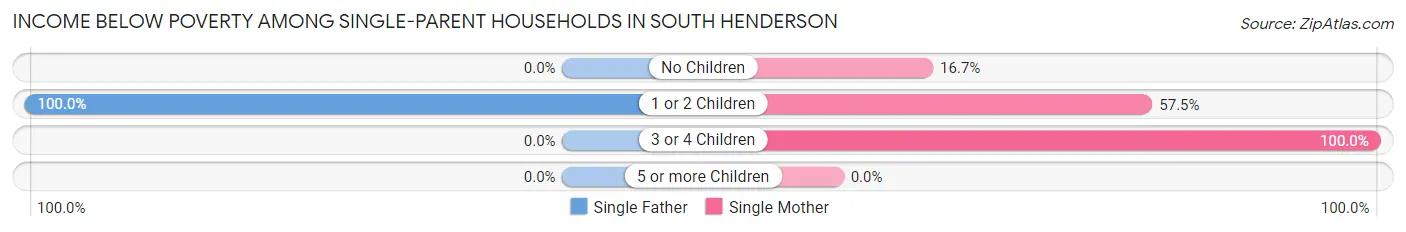
| Children | Single Father | Single Mother |
| No Children | 0 (0.0%) | 5 (16.7%) |
| 1 or 2 Children | 25 (100.0%) | 46 (57.5%) |
| 3 or 4 Children | 0 (0.0%) | 17 (100.0%) |
| 5 or more Children | 0 (0.0%) | 0 (0.0%) |
| Total | 25 (100.0%) | 68 (53.5%) |
Income Below Poverty Among Married-Couple vs Single-Parent Households in South Henderson
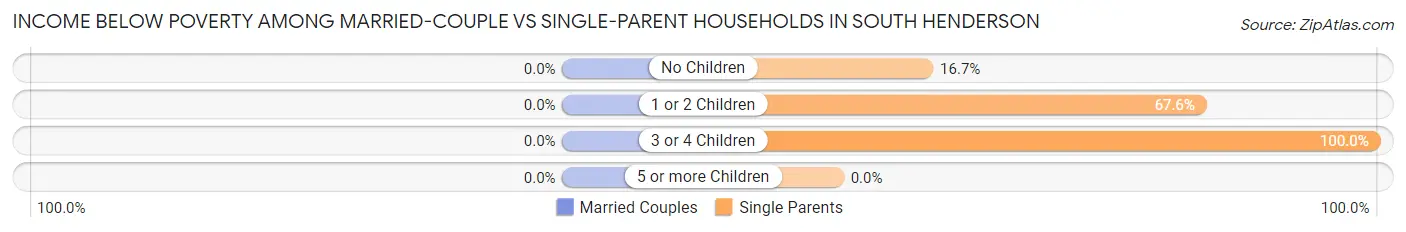
| Children | Married-Couple Families | Single-Parent Households |
| No Children | 0 (0.0%) | 5 (16.7%) |
| 1 or 2 Children | 0 (0.0%) | 71 (67.6%) |
| 3 or 4 Children | 0 (0.0%) | 17 (100.0%) |
| 5 or more Children | 0 (0.0%) | 0 (0.0%) |
| Total | 0 (0.0%) | 93 (61.2%) |
Race in South Henderson
The most populous races in South Henderson are Black / African American (722 | 60.8%), Hispanic or Latino (254 | 21.4%), and White / Caucasian (249 | 21.0%).
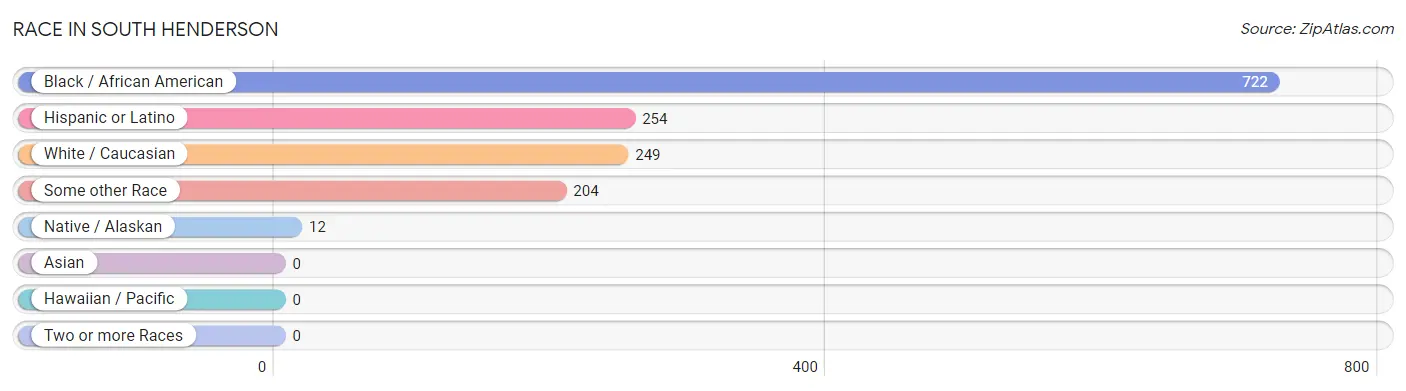
| Race | # Population | % Population |
| Asian | 0 | 0.0% |
| Black / African American | 722 | 60.8% |
| Hawaiian / Pacific | 0 | 0.0% |
| Hispanic or Latino | 254 | 21.4% |
| Native / Alaskan | 12 | 1.0% |
| White / Caucasian | 249 | 21.0% |
| Two or more Races | 0 | 0.0% |
| Some other Race | 204 | 17.2% |
| Total | 1,187 | 100.0% |
Ancestry in South Henderson
The most populous ancestries reported in South Henderson are Mexican (218 | 18.4%), American (38 | 3.2%), African (9 | 0.8%), Subsaharan African (9 | 0.8%), and Irish (5 | 0.4%), together accounting for 23.5% of all South Henderson residents.
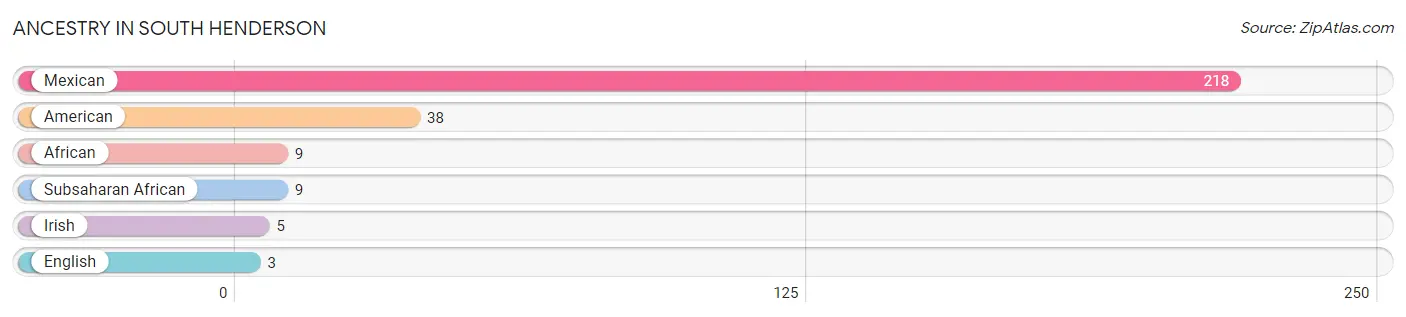
| Ancestry | # Population | % Population |
| African | 9 | 0.8% |
| American | 38 | 3.2% |
| English | 3 | 0.3% |
| Irish | 5 | 0.4% |
| Mexican | 218 | 18.4% |
| Subsaharan African | 9 | 0.8% | View All 6 Rows |
Immigrants in South Henderson
The most numerous immigrant groups reported in South Henderson came from Central America (133 | 11.2%), Latin America (133 | 11.2%), Mexico (125 | 10.5%), and Guatemala (8 | 0.7%), together accounting for 33.6% of all South Henderson residents.
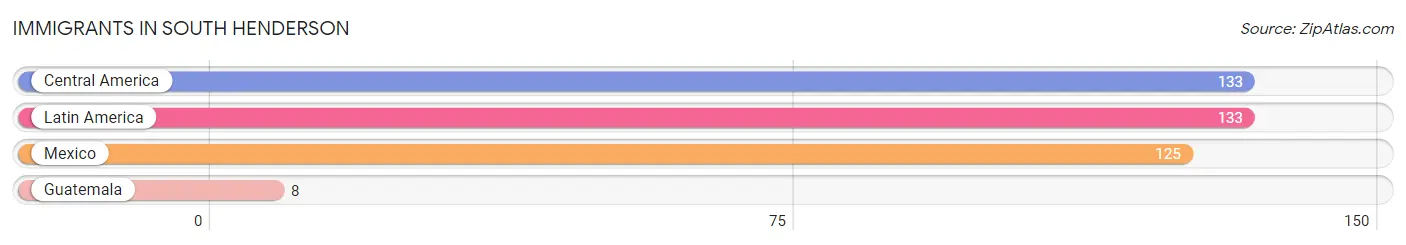
| Immigration Origin | # Population | % Population |
| Central America | 133 | 11.2% |
| Guatemala | 8 | 0.7% |
| Latin America | 133 | 11.2% |
| Mexico | 125 | 10.5% | View All 4 Rows |
Sex and Age in South Henderson
Sex and Age in South Henderson
The most populous age groups in South Henderson are Under 5 Years (106 | 18.4%) for men and 40 to 44 Years (119 | 19.5%) for women.
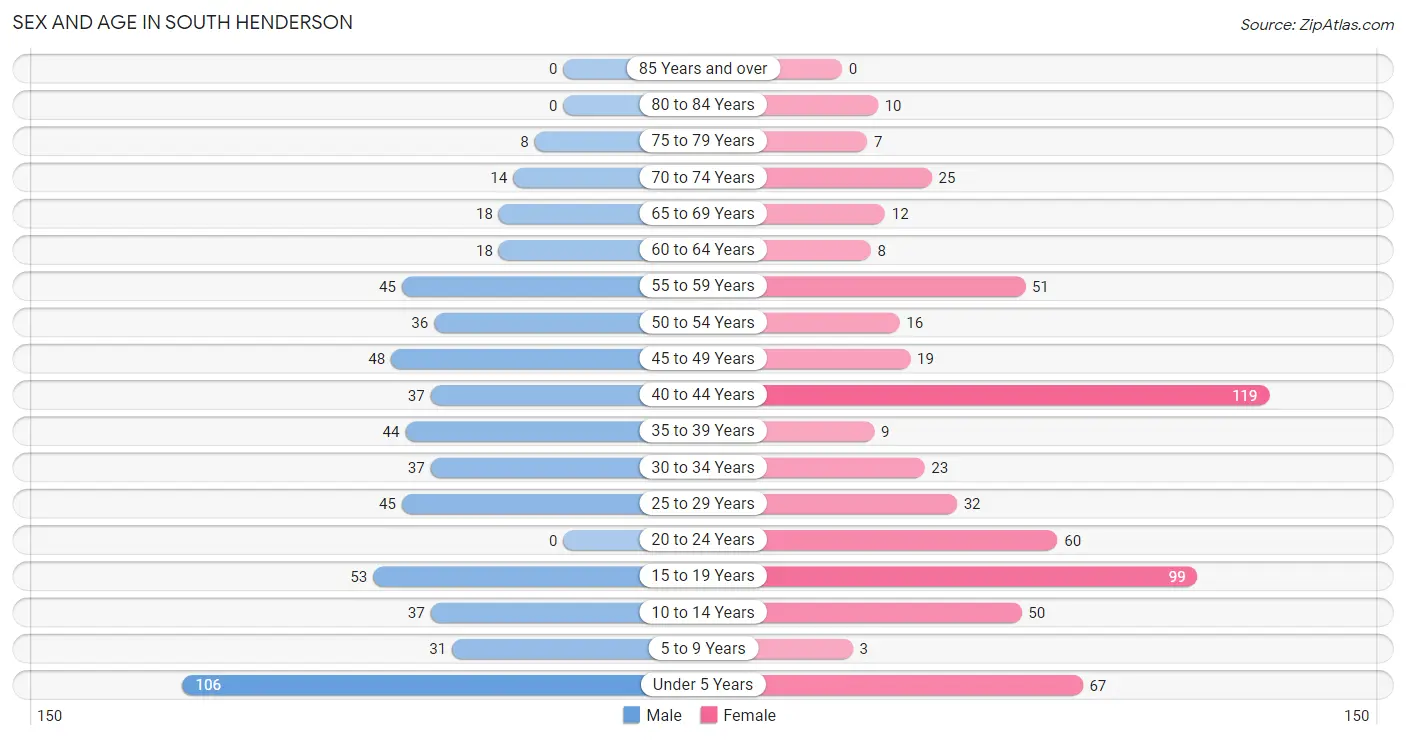
| Age Bracket | Male | Female |
| Under 5 Years | 106 (18.4%) | 67 (11.0%) |
| 5 to 9 Years | 31 (5.4%) | 3 (0.5%) |
| 10 to 14 Years | 37 (6.4%) | 50 (8.2%) |
| 15 to 19 Years | 53 (9.2%) | 99 (16.2%) |
| 20 to 24 Years | 0 (0.0%) | 60 (9.8%) |
| 25 to 29 Years | 45 (7.8%) | 32 (5.2%) |
| 30 to 34 Years | 37 (6.4%) | 23 (3.8%) |
| 35 to 39 Years | 44 (7.6%) | 9 (1.5%) |
| 40 to 44 Years | 37 (6.4%) | 119 (19.5%) |
| 45 to 49 Years | 48 (8.3%) | 19 (3.1%) |
| 50 to 54 Years | 36 (6.2%) | 16 (2.6%) |
| 55 to 59 Years | 45 (7.8%) | 51 (8.4%) |
| 60 to 64 Years | 18 (3.1%) | 8 (1.3%) |
| 65 to 69 Years | 18 (3.1%) | 12 (2.0%) |
| 70 to 74 Years | 14 (2.4%) | 25 (4.1%) |
| 75 to 79 Years | 8 (1.4%) | 7 (1.1%) |
| 80 to 84 Years | 0 (0.0%) | 10 (1.6%) |
| 85 Years and over | 0 (0.0%) | 0 (0.0%) |
| Total | 577 (100.0%) | 610 (100.0%) |
Families and Households in South Henderson
Median Family Size in South Henderson
The median family size in South Henderson is 3.54 persons per family, with married-couple families (110 | 42.0%) accounting for the largest median family size of 3.85 persons per family. On the other hand, single male/father families (25 | 9.5%) represent the smallest median family size with 2.08 persons per family.
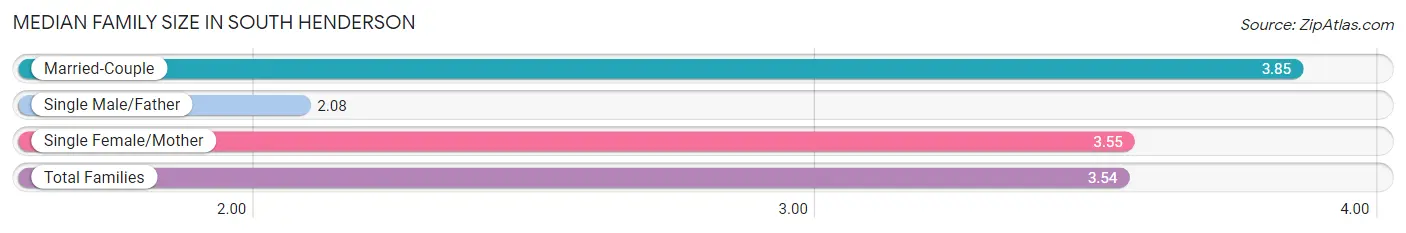
| Family Type | # Families | Family Size |
| Married-Couple | 110 (42.0%) | 3.85 |
| Single Male/Father | 25 (9.5%) | 2.08 |
| Single Female/Mother | 127 (48.5%) | 3.55 |
| Total Families | 262 (100.0%) | 3.54 |
Median Household Size in South Henderson
The median household size in South Henderson is 3.06 persons per household, with single male/father households (25 | 6.6%) accounting for the largest median household size of 4.24 persons per household. non-family households (116 | 30.7%) represent the smallest median household size with 1.52 persons per household.
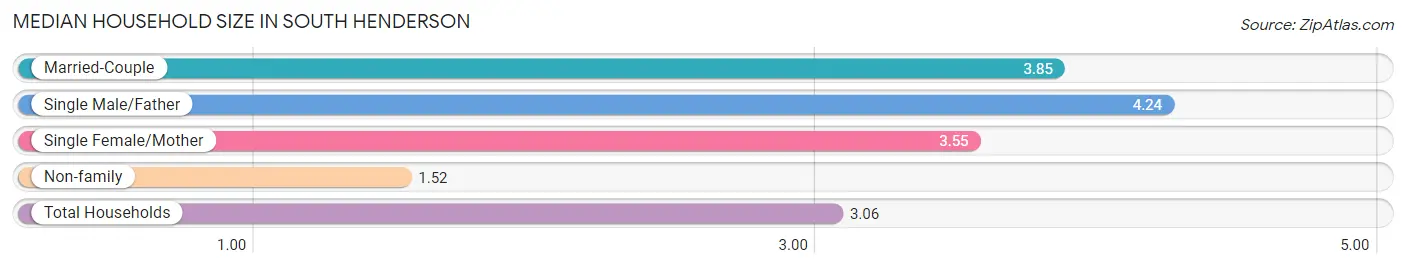
| Household Type | # Households | Household Size |
| Married-Couple | 110 (29.1%) | 3.85 |
| Single Male/Father | 25 (6.6%) | 4.24 |
| Single Female/Mother | 127 (33.6%) | 3.55 |
| Non-family | 116 (30.7%) | 1.52 |
| Total Households | 378 (100.0%) | 3.06 |
Household Size by Marriage Status in South Henderson
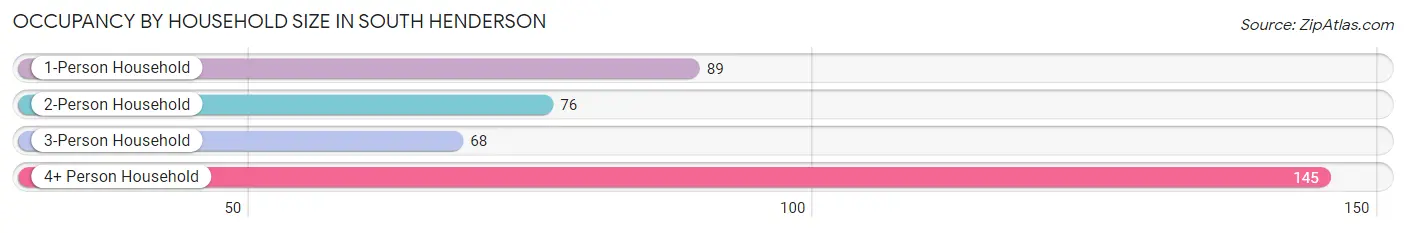
Out of a total of 378 households in South Henderson, 262 (69.3%) are family households, while 116 (30.7%) are nonfamily households. The most numerous type of family households are 4-person households, comprising 123, and the most common type of nonfamily households are 1-person households, comprising 89.
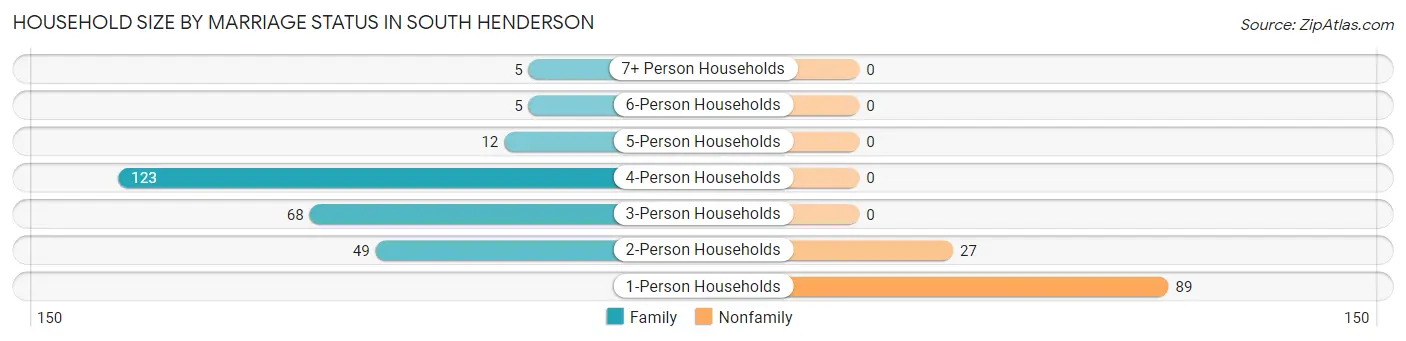
| Household Size | Family Households | Nonfamily Households |
| 1-Person Households | - | 89 (23.5%) |
| 2-Person Households | 49 (13.0%) | 27 (7.1%) |
| 3-Person Households | 68 (18.0%) | 0 (0.0%) |
| 4-Person Households | 123 (32.5%) | 0 (0.0%) |
| 5-Person Households | 12 (3.2%) | 0 (0.0%) |
| 6-Person Households | 5 (1.3%) | 0 (0.0%) |
| 7+ Person Households | 5 (1.3%) | 0 (0.0%) |
| Total | 262 (69.3%) | 116 (30.7%) |
Female Fertility in South Henderson
Fertility by Age in South Henderson
Average fertility rate in South Henderson is 180.0 births per 1,000 women. Women in the age bracket of 20 to 34 years have the highest fertility rate with 565.0 births per 1,000 women. Women in the age bracket of 20 to 34 years acount for 100.0% of all women with births.
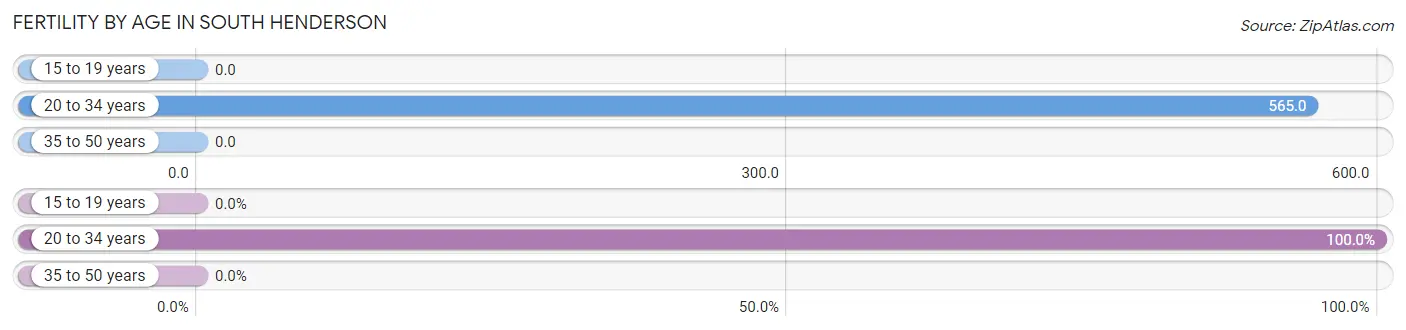
| Age Bracket | Women with Births | Births / 1,000 Women |
| 15 to 19 years | 0 (0.0%) | 0.0 |
| 20 to 34 years | 65 (100.0%) | 565.0 |
| 35 to 50 years | 0 (0.0%) | 0.0 |
| Total | 65 (100.0%) | 180.0 |
Fertility by Age by Marriage Status in South Henderson
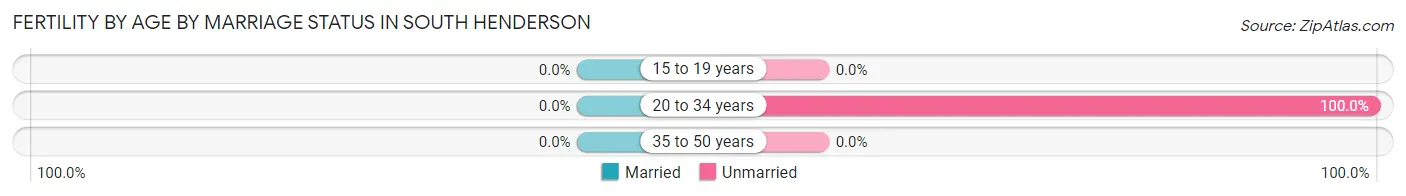
| Age Bracket | Married | Unmarried |
| 15 to 19 years | 0 (0.0%) | 0 (0.0%) |
| 20 to 34 years | 0 (0.0%) | 65 (100.0%) |
| 35 to 50 years | 0 (0.0%) | 0 (0.0%) |
| Total | 0 (0.0%) | 65 (100.0%) |
Fertility by Education in South Henderson
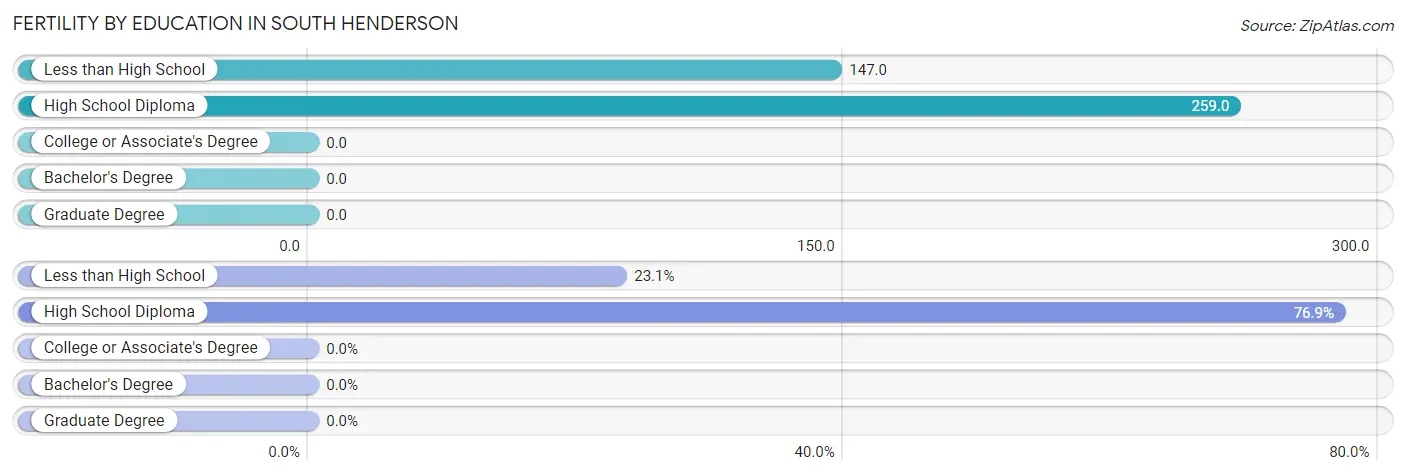
| Educational Attainment | Women with Births | Births / 1,000 Women |
| Less than High School | 15 (23.1%) | 147.0 |
| High School Diploma | 50 (76.9%) | 259.0 |
| College or Associate's Degree | 0 (0.0%) | 0.0 |
| Bachelor's Degree | 0 (0.0%) | 0.0 |
| Graduate Degree | 0 (0.0%) | 0.0 |
| Total | 65 (100.0%) | 180.0 |
Fertility by Education by Marriage Status in South Henderson
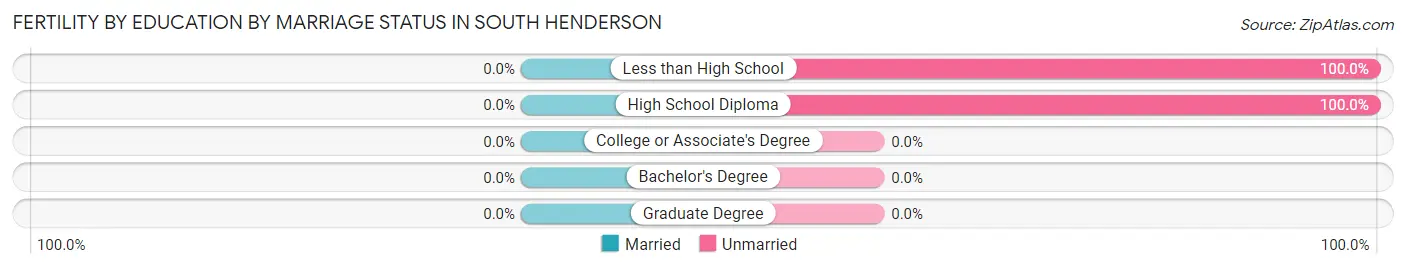
| Educational Attainment | Married | Unmarried |
| Less than High School | 0 (0.0%) | 15 (100.0%) |
| High School Diploma | 0 (0.0%) | 50 (100.0%) |
| College or Associate's Degree | 0 (0.0%) | 0 (0.0%) |
| Bachelor's Degree | 0 (0.0%) | 0 (0.0%) |
| Graduate Degree | 0 (0.0%) | 0 (0.0%) |
| Total | 0 (0.0%) | 65 (100.0%) |
Employment Characteristics in South Henderson
Employment by Class of Employer in South Henderson
Among the 423 employed individuals in South Henderson, private company employees (343 | 81.1%), state government employees (41 | 9.7%), and local government employees (28 | 6.6%) make up the most common classes of employment.
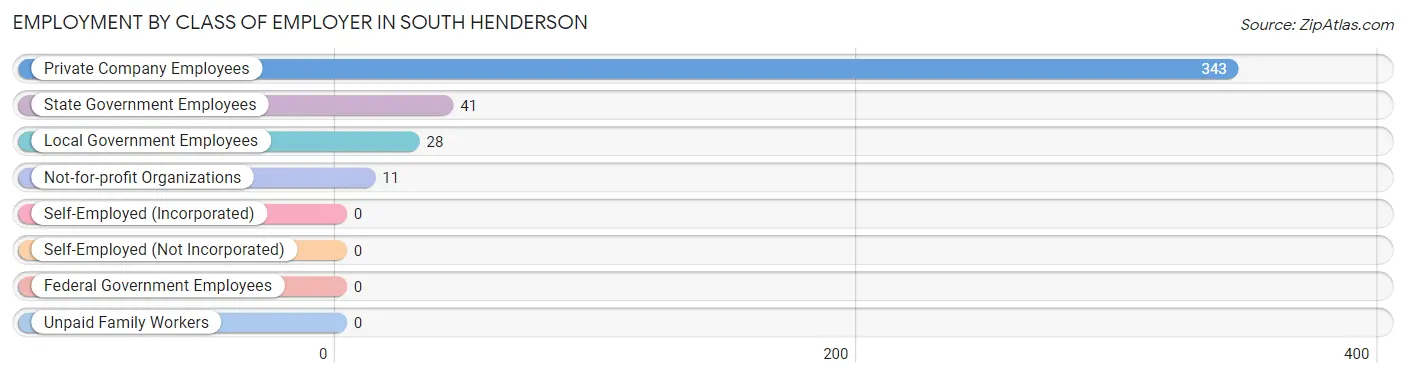
| Employer Class | # Employees | % Employees |
| Private Company Employees | 343 | 81.1% |
| Self-Employed (Incorporated) | 0 | 0.0% |
| Self-Employed (Not Incorporated) | 0 | 0.0% |
| Not-for-profit Organizations | 11 | 2.6% |
| Local Government Employees | 28 | 6.6% |
| State Government Employees | 41 | 9.7% |
| Federal Government Employees | 0 | 0.0% |
| Unpaid Family Workers | 0 | 0.0% |
| Total | 423 | 100.0% |
Employment Status by Age in South Henderson
According to the labor force statistics for South Henderson, out of the total population over 16 years of age (873), 63.0% or 550 individuals are in the labor force, with 23.1% or 127 of them unemployed. The age group with the highest labor force participation rate is 30 to 34 years, with 100.0% or 60 individuals in the labor force. Within the labor force, the 55 to 59 years age range has the highest percentage of unemployed individuals, with 75.7% or 28 of them being unemployed.
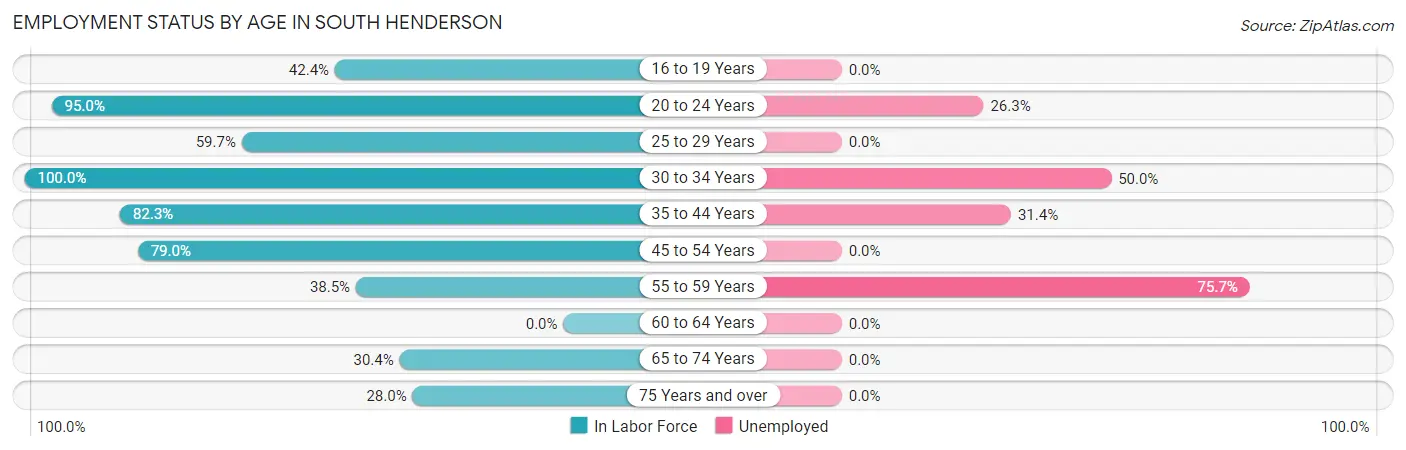
| Age Bracket | In Labor Force | Unemployed |
| 16 to 19 Years | 56 (42.4%) | 0 (0.0%) |
| 20 to 24 Years | 57 (95.0%) | 15 (26.3%) |
| 25 to 29 Years | 46 (59.7%) | 0 (0.0%) |
| 30 to 34 Years | 60 (100.0%) | 30 (50.0%) |
| 35 to 44 Years | 172 (82.3%) | 54 (31.4%) |
| 45 to 54 Years | 94 (79.0%) | 0 (0.0%) |
| 55 to 59 Years | 37 (38.5%) | 28 (75.7%) |
| 60 to 64 Years | 0 (0.0%) | 0 (0.0%) |
| 65 to 74 Years | 21 (30.4%) | 0 (0.0%) |
| 75 Years and over | 7 (28.0%) | 0 (0.0%) |
| Total | 550 (63.0%) | 127 (23.1%) |
Employment Status by Educational Attainment in South Henderson
According to labor force statistics for South Henderson, 69.7% of individuals (409) out of the total population between 25 and 64 years of age (587) are in the labor force, with 27.4% or 112 of them being unemployed. The group with the highest labor force participation rate are those with the educational attainment of bachelor's degree or higher, with 83.0% or 39 individuals in the labor force. Within the labor force, individuals with bachelor's degree or higher education have the highest percentage of unemployment, with 100.0% or 39 of them being unemployed.
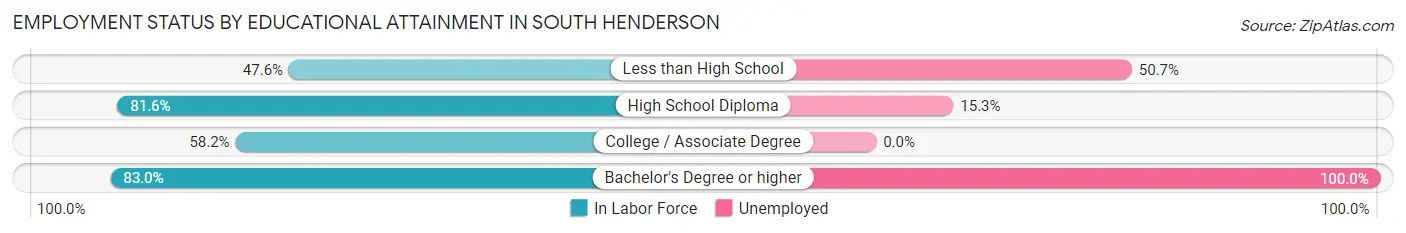
| Educational Attainment | In Labor Force | Unemployed |
| Less than High School | 69 (47.6%) | 74 (50.7%) |
| High School Diploma | 248 (81.6%) | 47 (15.3%) |
| College / Associate Degree | 53 (58.2%) | 0 (0.0%) |
| Bachelor's Degree or higher | 39 (83.0%) | 47 (100.0%) |
| Total | 409 (69.7%) | 161 (27.4%) |
Employment Occupations by Sex in South Henderson
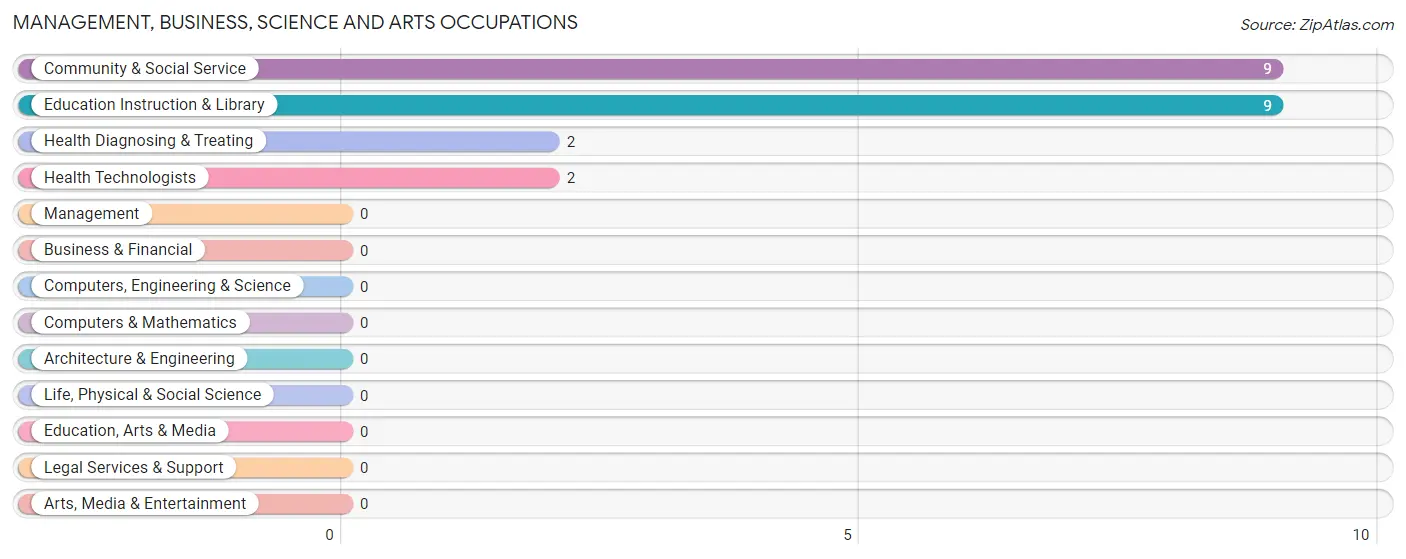
Management, Business, Science and Arts Occupations
The most common Management, Business, Science and Arts occupations in South Henderson are Community & Social Service (9 | 2.1%), Education Instruction & Library (9 | 2.1%), Health Diagnosing & Treating (2 | 0.5%), and Health Technologists (2 | 0.5%).
Management, Business, Science and Arts Occupations by Sex
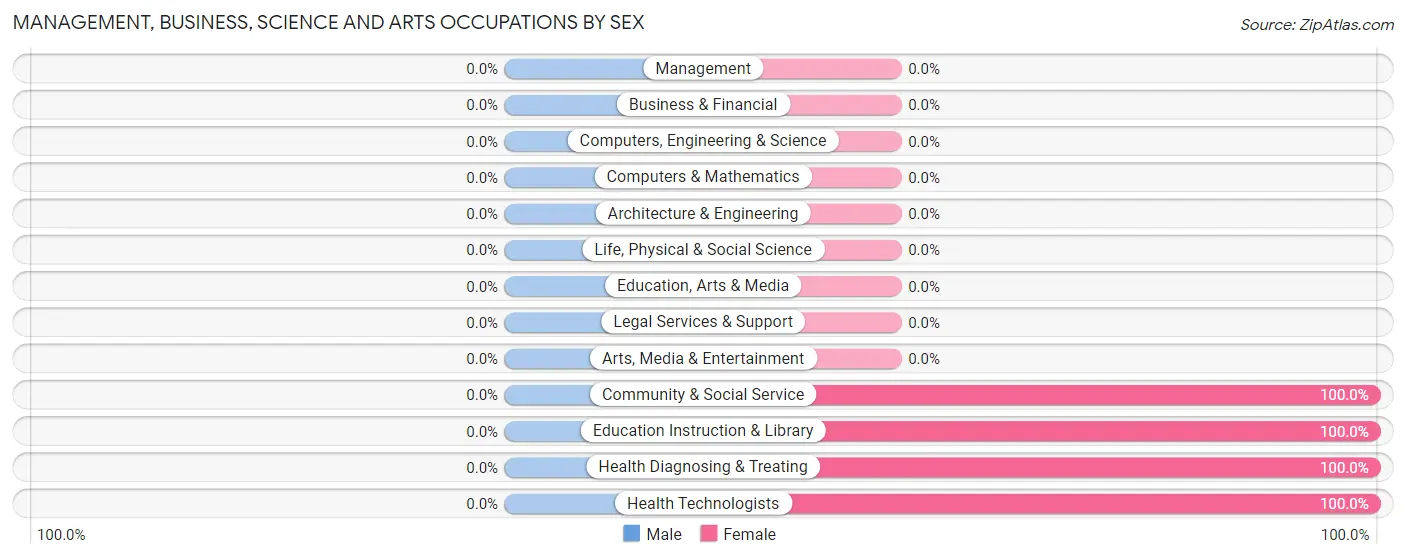
| Occupation | Male | Female |
| Management | 0 (0.0%) | 0 (0.0%) |
| Business & Financial | 0 (0.0%) | 0 (0.0%) |
| Computers, Engineering & Science | 0 (0.0%) | 0 (0.0%) |
| Computers & Mathematics | 0 (0.0%) | 0 (0.0%) |
| Architecture & Engineering | 0 (0.0%) | 0 (0.0%) |
| Life, Physical & Social Science | 0 (0.0%) | 0 (0.0%) |
| Community & Social Service | 0 (0.0%) | 9 (100.0%) |
| Education, Arts & Media | 0 (0.0%) | 0 (0.0%) |
| Legal Services & Support | 0 (0.0%) | 0 (0.0%) |
| Education Instruction & Library | 0 (0.0%) | 9 (100.0%) |
| Arts, Media & Entertainment | 0 (0.0%) | 0 (0.0%) |
| Health Diagnosing & Treating | 0 (0.0%) | 2 (100.0%) |
| Health Technologists | 0 (0.0%) | 2 (100.0%) |
| Total (Category) | 0 (0.0%) | 11 (100.0%) |
| Total (Overall) | 146 (34.5%) | 277 (65.5%) |
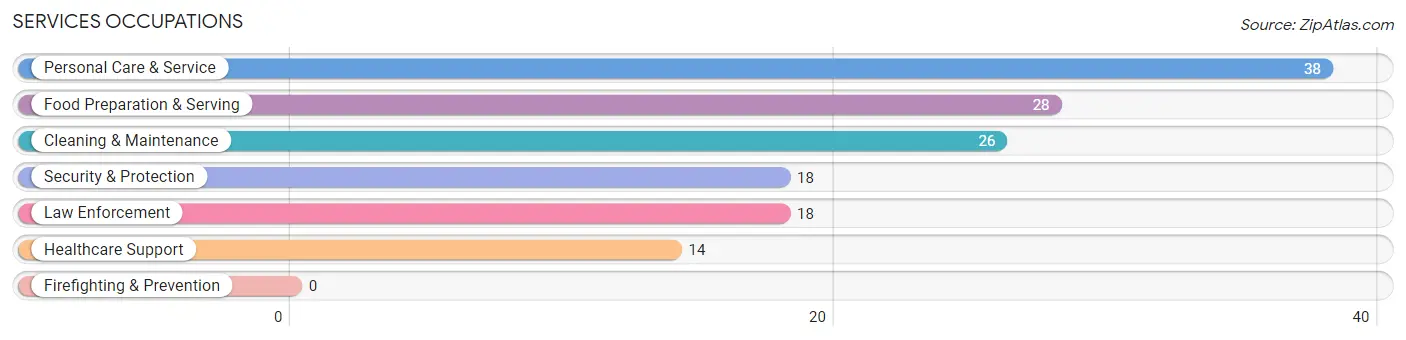
Services Occupations
The most common Services occupations in South Henderson are Personal Care & Service (38 | 9.0%), Food Preparation & Serving (28 | 6.6%), Cleaning & Maintenance (26 | 6.1%), Security & Protection (18 | 4.3%), and Law Enforcement (18 | 4.3%).
Services Occupations by Sex
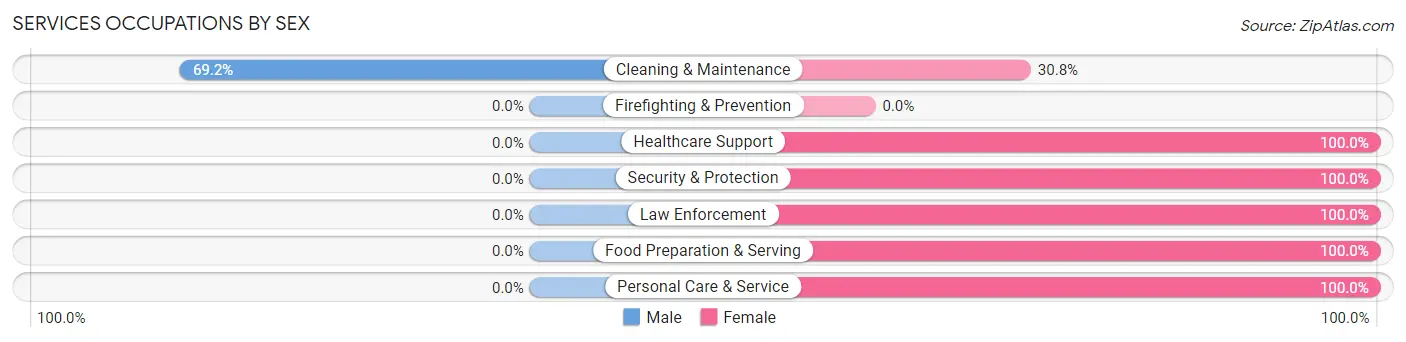
| Occupation | Male | Female |
| Healthcare Support | 0 (0.0%) | 14 (100.0%) |
| Security & Protection | 0 (0.0%) | 18 (100.0%) |
| Firefighting & Prevention | 0 (0.0%) | 0 (0.0%) |
| Law Enforcement | 0 (0.0%) | 18 (100.0%) |
| Food Preparation & Serving | 0 (0.0%) | 28 (100.0%) |
| Cleaning & Maintenance | 18 (69.2%) | 8 (30.8%) |
| Personal Care & Service | 0 (0.0%) | 38 (100.0%) |
| Total (Category) | 18 (14.5%) | 106 (85.5%) |
| Total (Overall) | 146 (34.5%) | 277 (65.5%) |
Sales and Office Occupations
The most common Sales and Office occupations in South Henderson are Sales & Related (94 | 22.2%), and Office & Administration (56 | 13.2%).
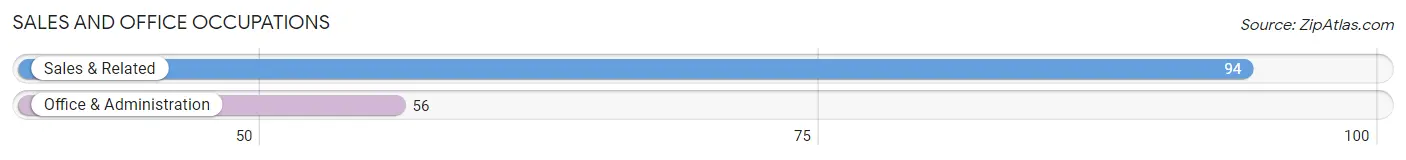
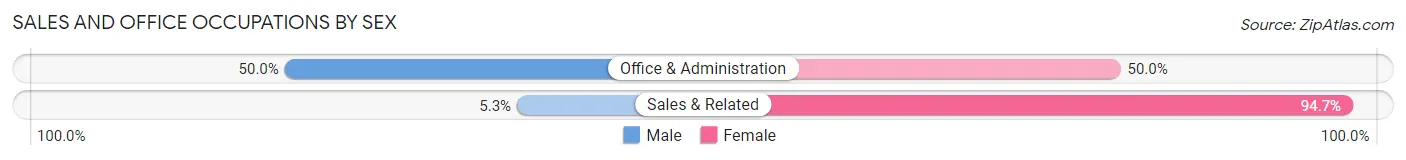
Sales and Office Occupations by Sex
| Occupation | Male | Female |
| Sales & Related | 5 (5.3%) | 89 (94.7%) |
| Office & Administration | 28 (50.0%) | 28 (50.0%) |
| Total (Category) | 33 (22.0%) | 117 (78.0%) |
| Total (Overall) | 146 (34.5%) | 277 (65.5%) |
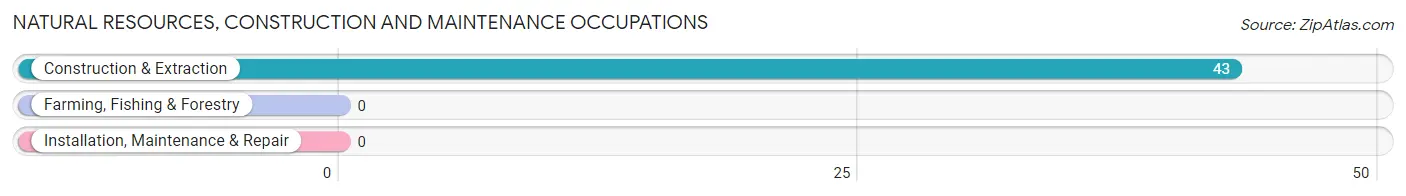
Natural Resources, Construction and Maintenance Occupations
The most common Natural Resources, Construction and Maintenance occupations in South Henderson are , and Construction & Extraction (43 | 10.2%).
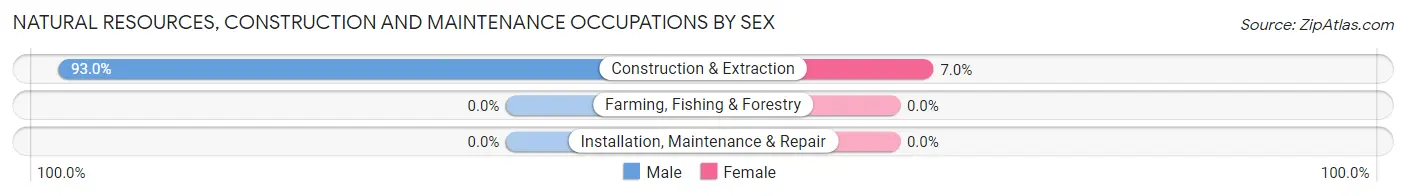
Natural Resources, Construction and Maintenance Occupations by Sex
| Occupation | Male | Female |
| Farming, Fishing & Forestry | 0 (0.0%) | 0 (0.0%) |
| Construction & Extraction | 40 (93.0%) | 3 (7.0%) |
| Installation, Maintenance & Repair | 0 (0.0%) | 0 (0.0%) |
| Total (Category) | 40 (93.0%) | 3 (7.0%) |
| Total (Overall) | 146 (34.5%) | 277 (65.5%) |
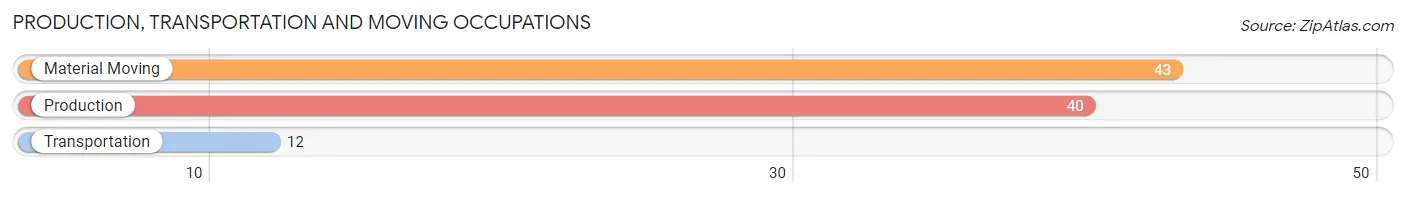
Production, Transportation and Moving Occupations
The most common Production, Transportation and Moving occupations in South Henderson are Material Moving (43 | 10.2%), Production (40 | 9.5%), and Transportation (12 | 2.8%).
Production, Transportation and Moving Occupations by Sex
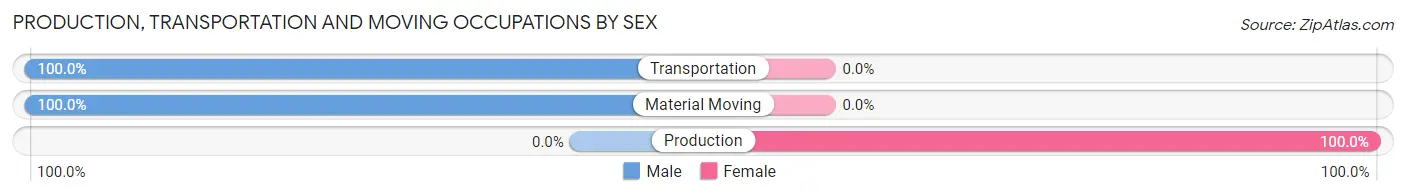
| Occupation | Male | Female |
| Production | 0 (0.0%) | 40 (100.0%) |
| Transportation | 12 (100.0%) | 0 (0.0%) |
| Material Moving | 43 (100.0%) | 0 (0.0%) |
| Total (Category) | 55 (57.9%) | 40 (42.1%) |
| Total (Overall) | 146 (34.5%) | 277 (65.5%) |
Employment Industries by Sex in South Henderson
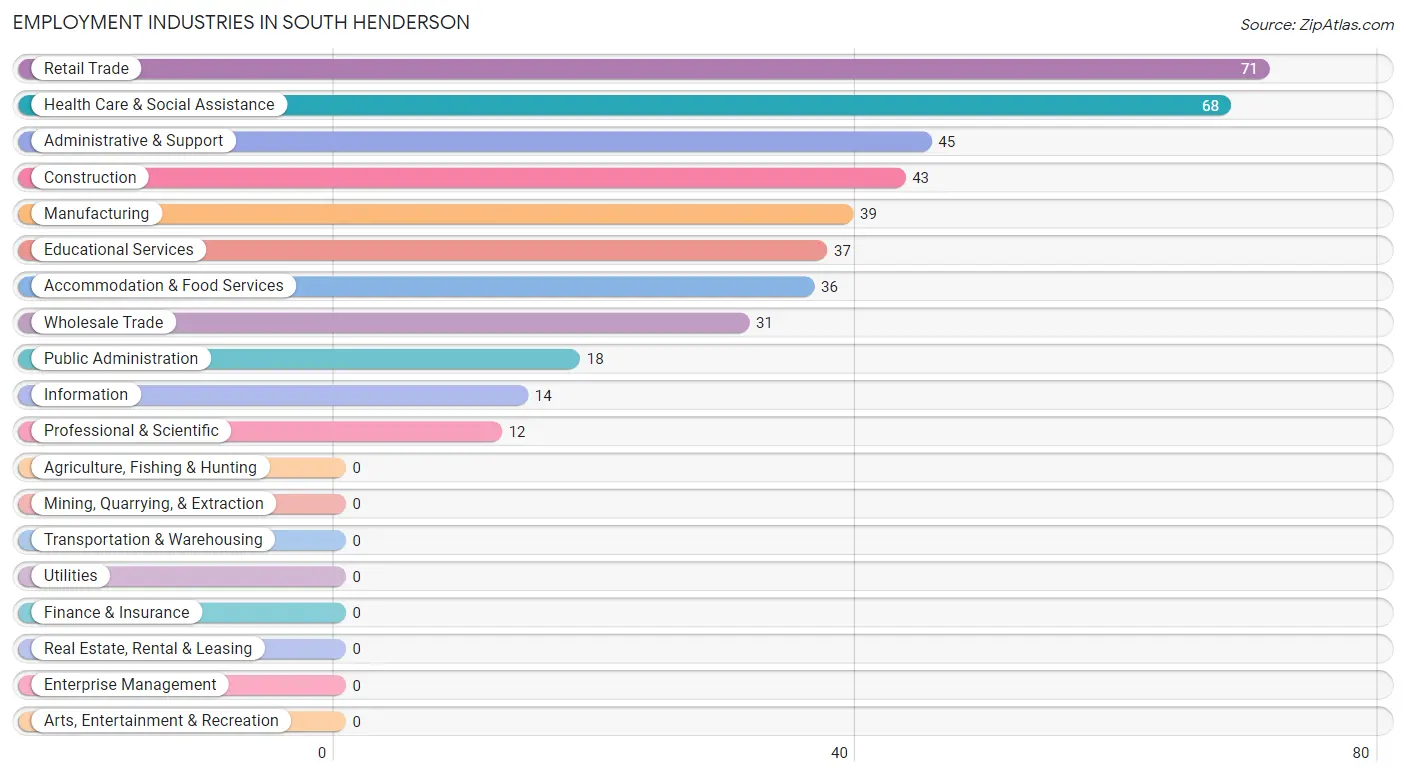
Employment Industries in South Henderson
The major employment industries in South Henderson include Retail Trade (71 | 16.8%), Health Care & Social Assistance (68 | 16.1%), Administrative & Support (45 | 10.6%), Construction (43 | 10.2%), and Manufacturing (39 | 9.2%).
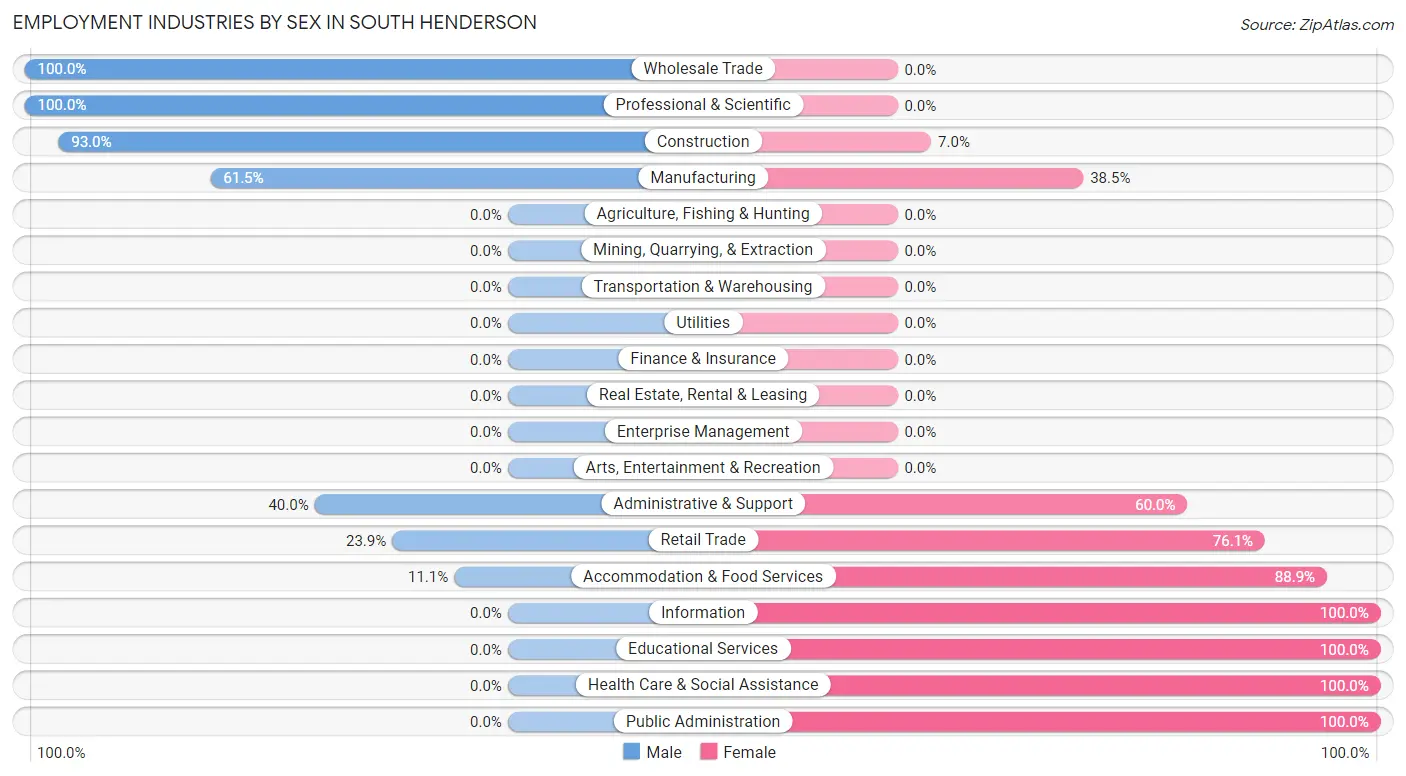
Employment Industries by Sex in South Henderson
The South Henderson industries that see more men than women are Wholesale Trade (100.0%), Professional & Scientific (100.0%), and Construction (93.0%), whereas the industries that tend to have a higher number of women are Information (100.0%), Educational Services (100.0%), and Health Care & Social Assistance (100.0%).
| Industry | Male | Female |
| Agriculture, Fishing & Hunting | 0 (0.0%) | 0 (0.0%) |
| Mining, Quarrying, & Extraction | 0 (0.0%) | 0 (0.0%) |
| Construction | 40 (93.0%) | 3 (7.0%) |
| Manufacturing | 24 (61.5%) | 15 (38.5%) |
| Wholesale Trade | 31 (100.0%) | 0 (0.0%) |
| Retail Trade | 17 (23.9%) | 54 (76.1%) |
| Transportation & Warehousing | 0 (0.0%) | 0 (0.0%) |
| Utilities | 0 (0.0%) | 0 (0.0%) |
| Information | 0 (0.0%) | 14 (100.0%) |
| Finance & Insurance | 0 (0.0%) | 0 (0.0%) |
| Real Estate, Rental & Leasing | 0 (0.0%) | 0 (0.0%) |
| Professional & Scientific | 12 (100.0%) | 0 (0.0%) |
| Enterprise Management | 0 (0.0%) | 0 (0.0%) |
| Administrative & Support | 18 (40.0%) | 27 (60.0%) |
| Educational Services | 0 (0.0%) | 37 (100.0%) |
| Health Care & Social Assistance | 0 (0.0%) | 68 (100.0%) |
| Arts, Entertainment & Recreation | 0 (0.0%) | 0 (0.0%) |
| Accommodation & Food Services | 4 (11.1%) | 32 (88.9%) |
| Public Administration | 0 (0.0%) | 18 (100.0%) |
| Total | 146 (34.5%) | 277 (65.5%) |
Education in South Henderson
School Enrollment in South Henderson
The most common levels of schooling among the 305 students in South Henderson are high school (113 | 37.0%), middle school (87 | 28.5%), and nursery / preschool (62 | 20.3%).
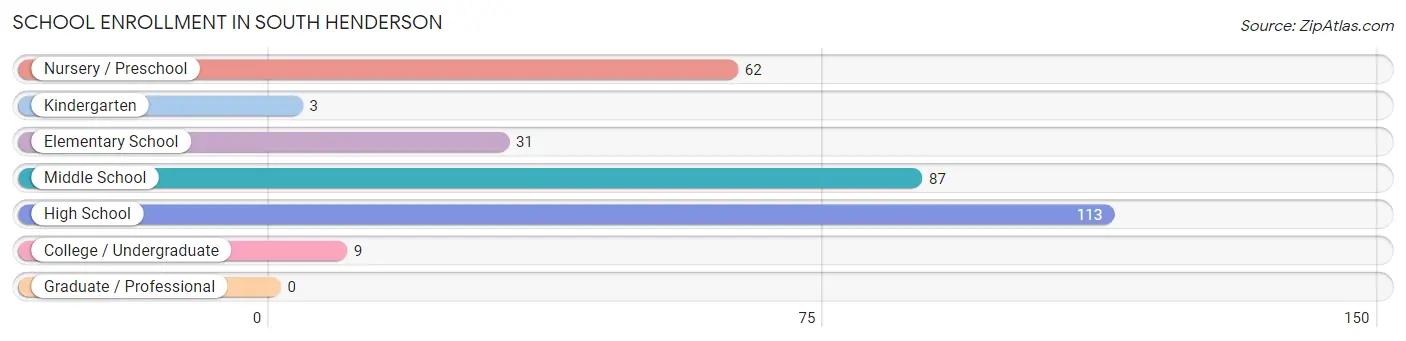
| School Level | # Students | % Students |
| Nursery / Preschool | 62 | 20.3% |
| Kindergarten | 3 | 1.0% |
| Elementary School | 31 | 10.2% |
| Middle School | 87 | 28.5% |
| High School | 113 | 37.0% |
| College / Undergraduate | 9 | 2.9% |
| Graduate / Professional | 0 | 0.0% |
| Total | 305 | 100.0% |
School Enrollment by Age by Funding Source in South Henderson
Out of a total of 305 students who are enrolled in schools in South Henderson, 11 (3.6%) attend a private institution, while the remaining 294 (96.4%) are enrolled in public schools. The age group of 15 to 17 year olds has the highest likelihood of being enrolled in private schools, with 11 (21.6% in the age bracket) enrolled. Conversely, the age group of 3 to 4 year olds has the lowest likelihood of being enrolled in a private school, with 62 (100.0% in the age bracket) attending a public institution.
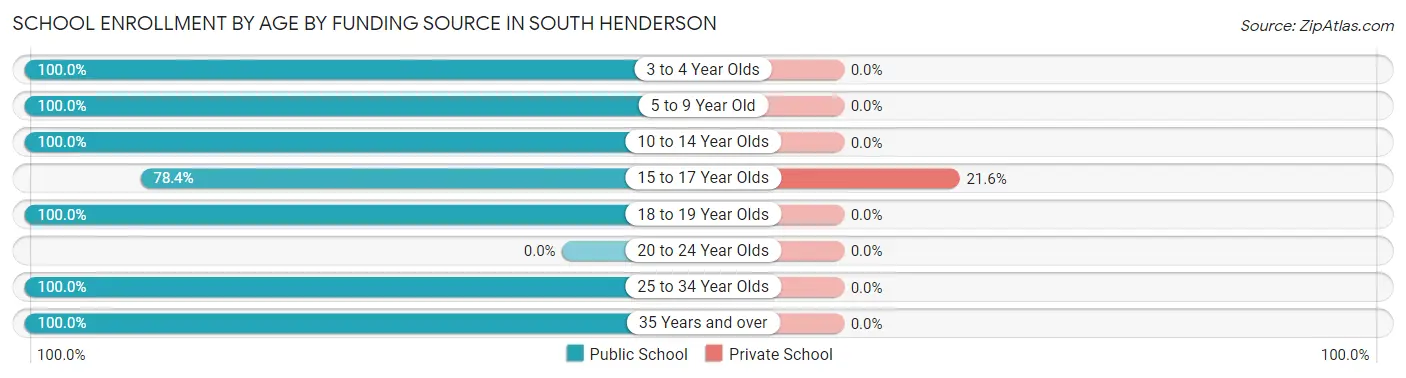
| Age Bracket | Public School | Private School |
| 3 to 4 Year Olds | 62 (100.0%) | 0 (0.0%) |
| 5 to 9 Year Old | 34 (100.0%) | 0 (0.0%) |
| 10 to 14 Year Olds | 87 (100.0%) | 0 (0.0%) |
| 15 to 17 Year Olds | 40 (78.4%) | 11 (21.6%) |
| 18 to 19 Year Olds | 59 (100.0%) | 0 (0.0%) |
| 20 to 24 Year Olds | 0 (0.0%) | 0 (0.0%) |
| 25 to 34 Year Olds | 3 (100.0%) | 0 (0.0%) |
| 35 Years and over | 9 (100.0%) | 0 (0.0%) |
| Total | 294 (96.4%) | 11 (3.6%) |
Educational Attainment by Field of Study in South Henderson
Liberal arts & history (44 | 44.0%), psychology (16 | 16.0%), science & technology (16 | 16.0%), arts & humanities (16 | 16.0%), and education (8 | 8.0%) are the most common fields of study among 100 individuals in South Henderson who have obtained a bachelor's degree or higher.
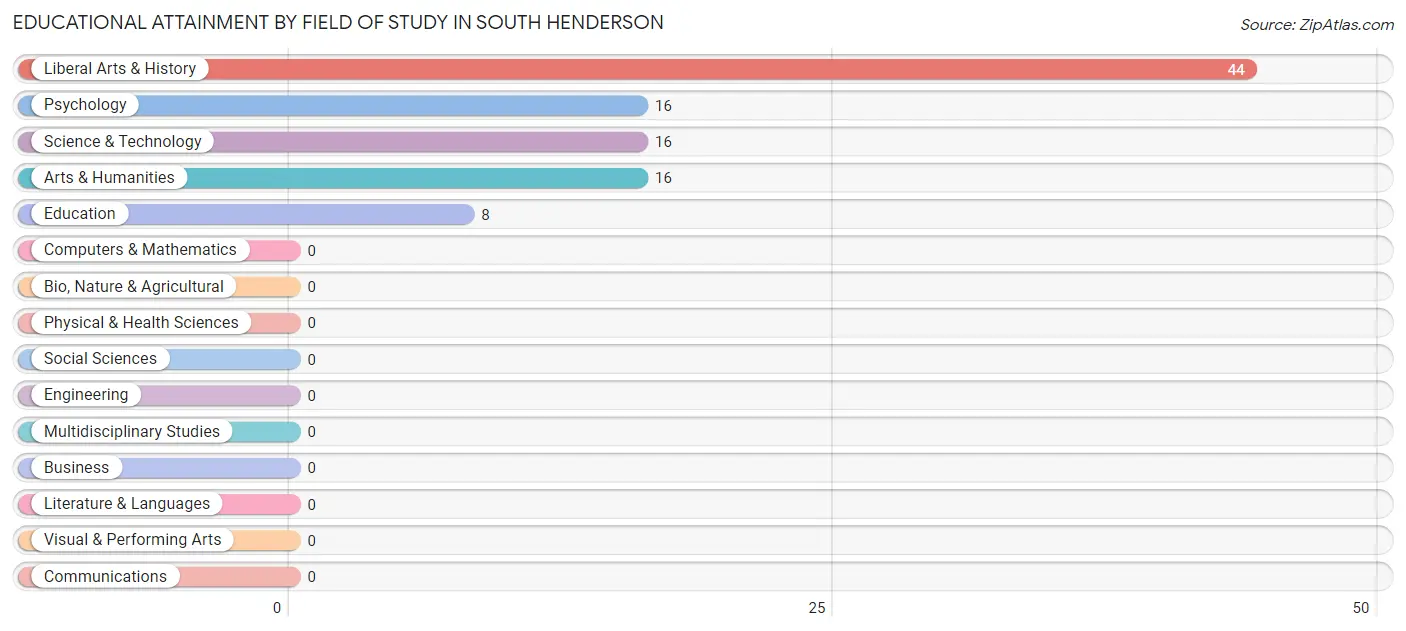
| Field of Study | # Graduates | % Graduates |
| Computers & Mathematics | 0 | 0.0% |
| Bio, Nature & Agricultural | 0 | 0.0% |
| Physical & Health Sciences | 0 | 0.0% |
| Psychology | 16 | 16.0% |
| Social Sciences | 0 | 0.0% |
| Engineering | 0 | 0.0% |
| Multidisciplinary Studies | 0 | 0.0% |
| Science & Technology | 16 | 16.0% |
| Business | 0 | 0.0% |
| Education | 8 | 8.0% |
| Literature & Languages | 0 | 0.0% |
| Liberal Arts & History | 44 | 44.0% |
| Visual & Performing Arts | 0 | 0.0% |
| Communications | 0 | 0.0% |
| Arts & Humanities | 16 | 16.0% |
| Total | 100 | 100.0% |
Transportation & Commute in South Henderson
Vehicle Availability by Sex in South Henderson
The most prevalent vehicle ownership categories in South Henderson are males with 1 vehicle (59, accounting for 40.4%) and females with 1 vehicle (170, making up 21.3%).
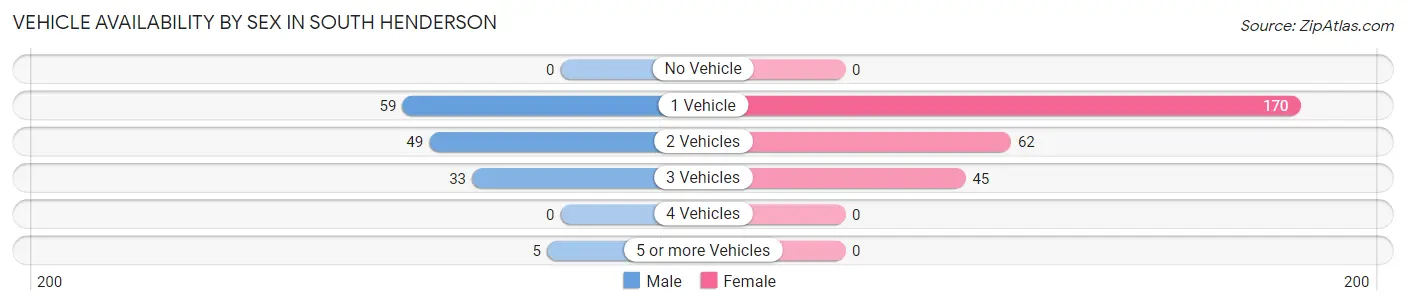
| Vehicles Available | Male | Female |
| No Vehicle | 0 (0.0%) | 0 (0.0%) |
| 1 Vehicle | 59 (40.4%) | 170 (61.4%) |
| 2 Vehicles | 49 (33.6%) | 62 (22.4%) |
| 3 Vehicles | 33 (22.6%) | 45 (16.3%) |
| 4 Vehicles | 0 (0.0%) | 0 (0.0%) |
| 5 or more Vehicles | 5 (3.4%) | 0 (0.0%) |
| Total | 146 (100.0%) | 277 (100.0%) |
Commute Time in South Henderson
The most frequently occuring commute durations in South Henderson are 5 to 9 minutes (95 commuters, 22.5%), 60 to 89 minutes (72 commuters, 17.0%), and 10 to 14 minutes (69 commuters, 16.3%).
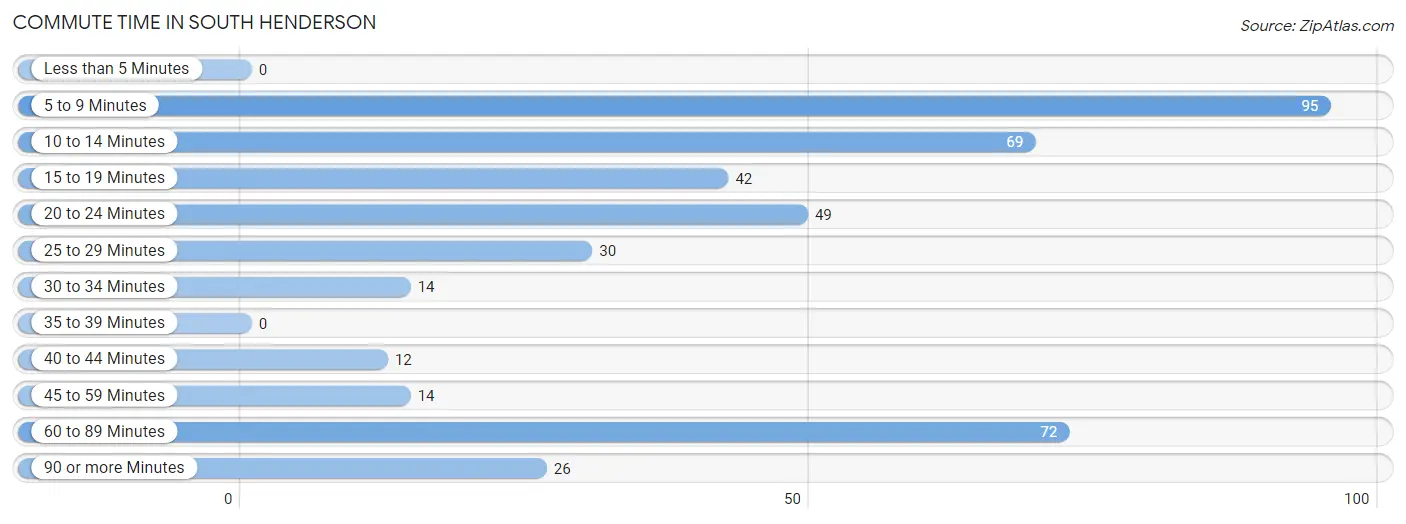
| Commute Time | # Commuters | % Commuters |
| Less than 5 Minutes | 0 | 0.0% |
| 5 to 9 Minutes | 95 | 22.5% |
| 10 to 14 Minutes | 69 | 16.3% |
| 15 to 19 Minutes | 42 | 9.9% |
| 20 to 24 Minutes | 49 | 11.6% |
| 25 to 29 Minutes | 30 | 7.1% |
| 30 to 34 Minutes | 14 | 3.3% |
| 35 to 39 Minutes | 0 | 0.0% |
| 40 to 44 Minutes | 12 | 2.8% |
| 45 to 59 Minutes | 14 | 3.3% |
| 60 to 89 Minutes | 72 | 17.0% |
| 90 or more Minutes | 26 | 6.1% |
Commute Time by Sex in South Henderson
The most common commute times in South Henderson are 5 to 9 minutes (45 commuters, 30.8%) for males and 60 to 89 minutes (58 commuters, 20.9%) for females.
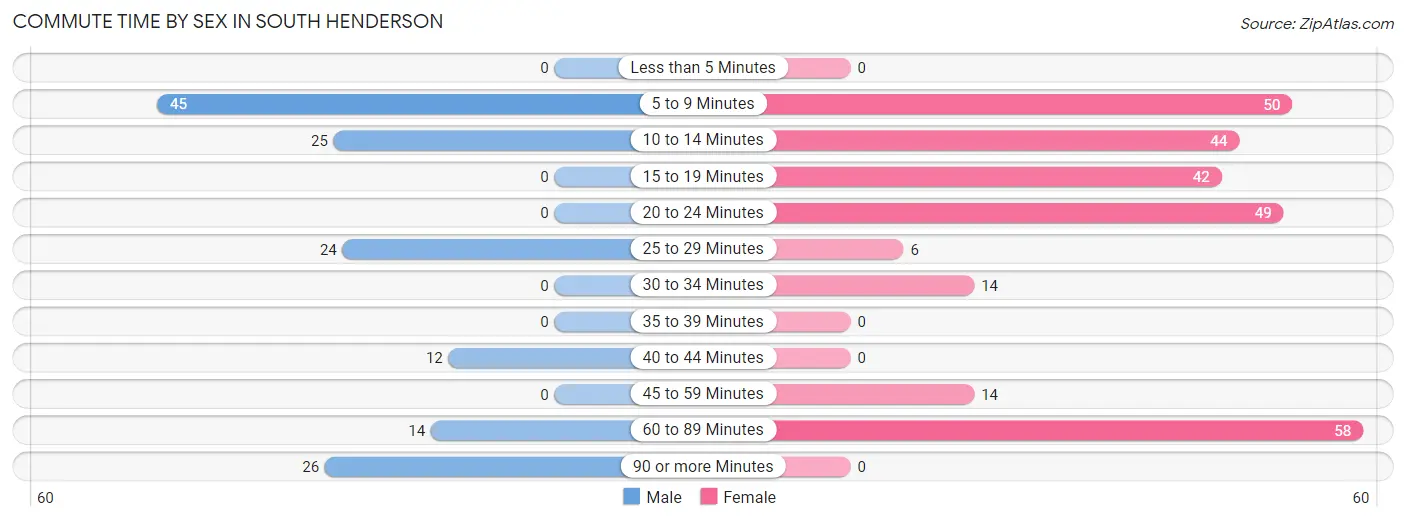
| Commute Time | Male | Female |
| Less than 5 Minutes | 0 (0.0%) | 0 (0.0%) |
| 5 to 9 Minutes | 45 (30.8%) | 50 (18.0%) |
| 10 to 14 Minutes | 25 (17.1%) | 44 (15.9%) |
| 15 to 19 Minutes | 0 (0.0%) | 42 (15.2%) |
| 20 to 24 Minutes | 0 (0.0%) | 49 (17.7%) |
| 25 to 29 Minutes | 24 (16.4%) | 6 (2.2%) |
| 30 to 34 Minutes | 0 (0.0%) | 14 (5.1%) |
| 35 to 39 Minutes | 0 (0.0%) | 0 (0.0%) |
| 40 to 44 Minutes | 12 (8.2%) | 0 (0.0%) |
| 45 to 59 Minutes | 0 (0.0%) | 14 (5.1%) |
| 60 to 89 Minutes | 14 (9.6%) | 58 (20.9%) |
| 90 or more Minutes | 26 (17.8%) | 0 (0.0%) |
Time of Departure to Work by Sex in South Henderson
The most frequent times of departure to work in South Henderson are 6:30 AM to 6:59 AM (38, 26.0%) for males and 6:00 AM to 6:29 AM (49, 17.7%) for females.
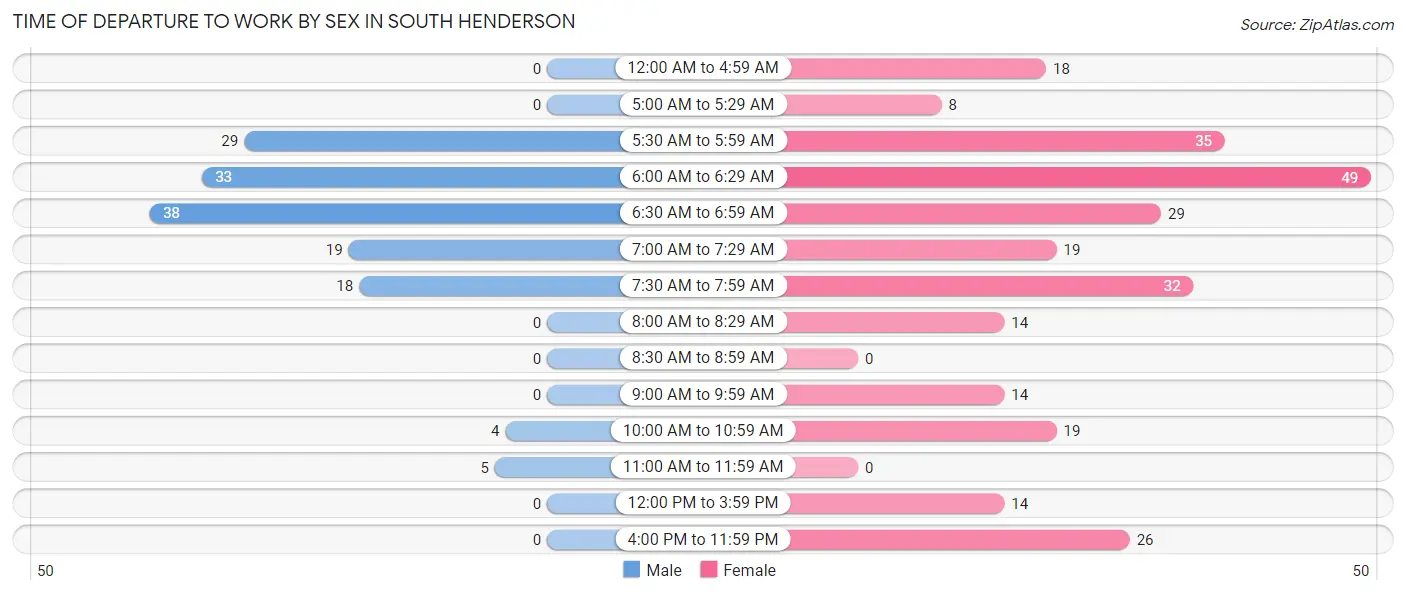
| Time of Departure | Male | Female |
| 12:00 AM to 4:59 AM | 0 (0.0%) | 18 (6.5%) |
| 5:00 AM to 5:29 AM | 0 (0.0%) | 8 (2.9%) |
| 5:30 AM to 5:59 AM | 29 (19.9%) | 35 (12.6%) |
| 6:00 AM to 6:29 AM | 33 (22.6%) | 49 (17.7%) |
| 6:30 AM to 6:59 AM | 38 (26.0%) | 29 (10.5%) |
| 7:00 AM to 7:29 AM | 19 (13.0%) | 19 (6.9%) |
| 7:30 AM to 7:59 AM | 18 (12.3%) | 32 (11.6%) |
| 8:00 AM to 8:29 AM | 0 (0.0%) | 14 (5.1%) |
| 8:30 AM to 8:59 AM | 0 (0.0%) | 0 (0.0%) |
| 9:00 AM to 9:59 AM | 0 (0.0%) | 14 (5.1%) |
| 10:00 AM to 10:59 AM | 4 (2.7%) | 19 (6.9%) |
| 11:00 AM to 11:59 AM | 5 (3.4%) | 0 (0.0%) |
| 12:00 PM to 3:59 PM | 0 (0.0%) | 14 (5.1%) |
| 4:00 PM to 11:59 PM | 0 (0.0%) | 26 (9.4%) |
| Total | 146 (100.0%) | 277 (100.0%) |
Housing Occupancy in South Henderson
Occupancy by Ownership in South Henderson
Of the total 378 dwellings in South Henderson, owner-occupied units account for 202 (53.4%), while renter-occupied units make up 176 (46.6%).
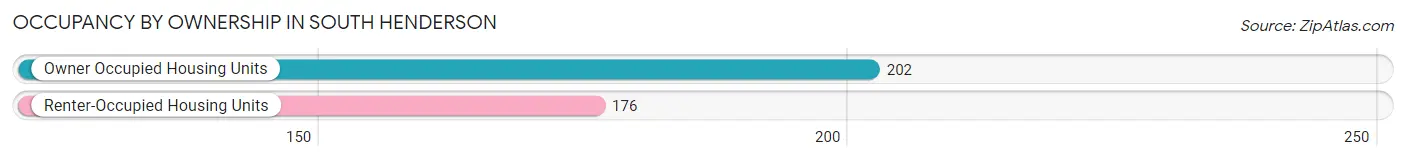
| Occupancy | # Housing Units | % Housing Units |
| Owner Occupied Housing Units | 202 | 53.4% |
| Renter-Occupied Housing Units | 176 | 46.6% |
| Total Occupied Housing Units | 378 | 100.0% |
Occupancy by Household Size in South Henderson
| Household Size | # Housing Units | % Housing Units |
| 1-Person Household | 89 | 23.5% |
| 2-Person Household | 76 | 20.1% |
| 3-Person Household | 68 | 18.0% |
| 4+ Person Household | 145 | 38.4% |
| Total Housing Units | 378 | 100.0% |
Occupancy by Ownership by Household Size in South Henderson
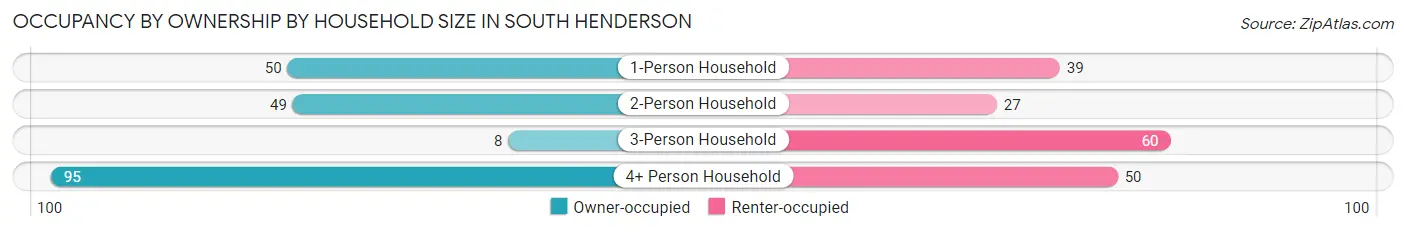
| Household Size | Owner-occupied | Renter-occupied |
| 1-Person Household | 50 (56.2%) | 39 (43.8%) |
| 2-Person Household | 49 (64.5%) | 27 (35.5%) |
| 3-Person Household | 8 (11.8%) | 60 (88.2%) |
| 4+ Person Household | 95 (65.5%) | 50 (34.5%) |
| Total Housing Units | 202 (53.4%) | 176 (46.6%) |
Occupancy by Educational Attainment in South Henderson
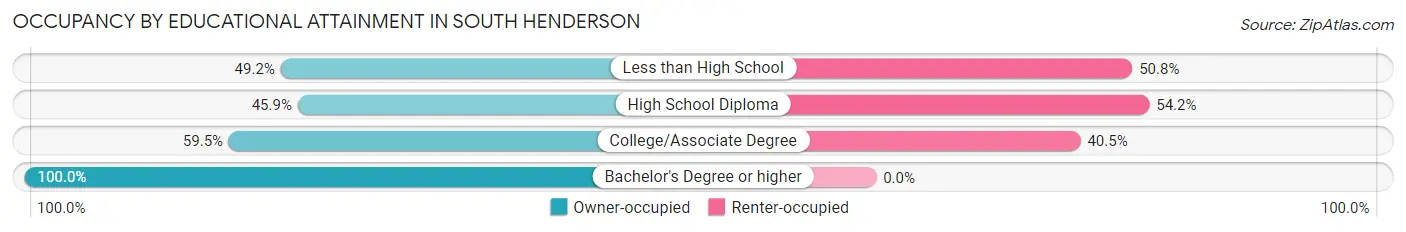
| Household Size | Owner-occupied | Renter-occupied |
| Less than High School | 32 (49.2%) | 33 (50.8%) |
| High School Diploma | 94 (45.9%) | 111 (54.1%) |
| College/Associate Degree | 47 (59.5%) | 32 (40.5%) |
| Bachelor's Degree or higher | 29 (100.0%) | 0 (0.0%) |
Occupancy by Age of Householder in South Henderson
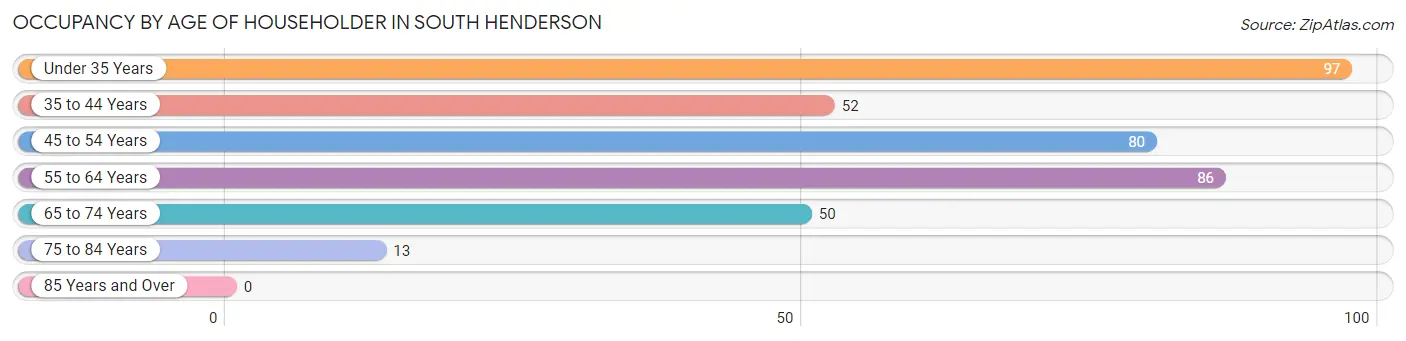
| Age Bracket | # Households | % Households |
| Under 35 Years | 97 | 25.7% |
| 35 to 44 Years | 52 | 13.8% |
| 45 to 54 Years | 80 | 21.2% |
| 55 to 64 Years | 86 | 22.8% |
| 65 to 74 Years | 50 | 13.2% |
| 75 to 84 Years | 13 | 3.4% |
| 85 Years and Over | 0 | 0.0% |
| Total | 378 | 100.0% |
Housing Finances in South Henderson
Median Income by Occupancy in South Henderson
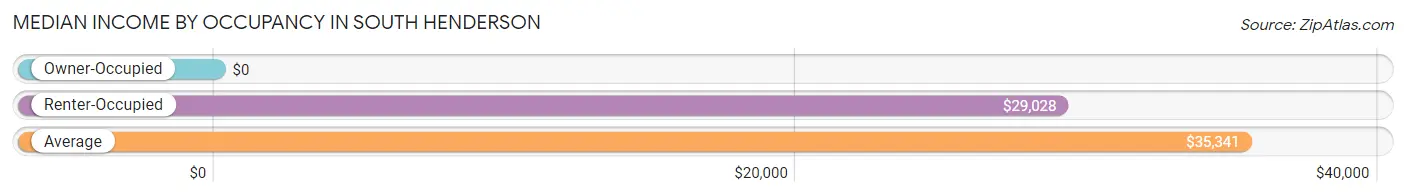
| Occupancy Type | # Households | Median Income |
| Owner-Occupied | 202 (53.4%) | $0 |
| Renter-Occupied | 176 (46.6%) | $29,028 |
| Average | 378 (100.0%) | $35,341 |
Occupancy by Householder Income Bracket in South Henderson
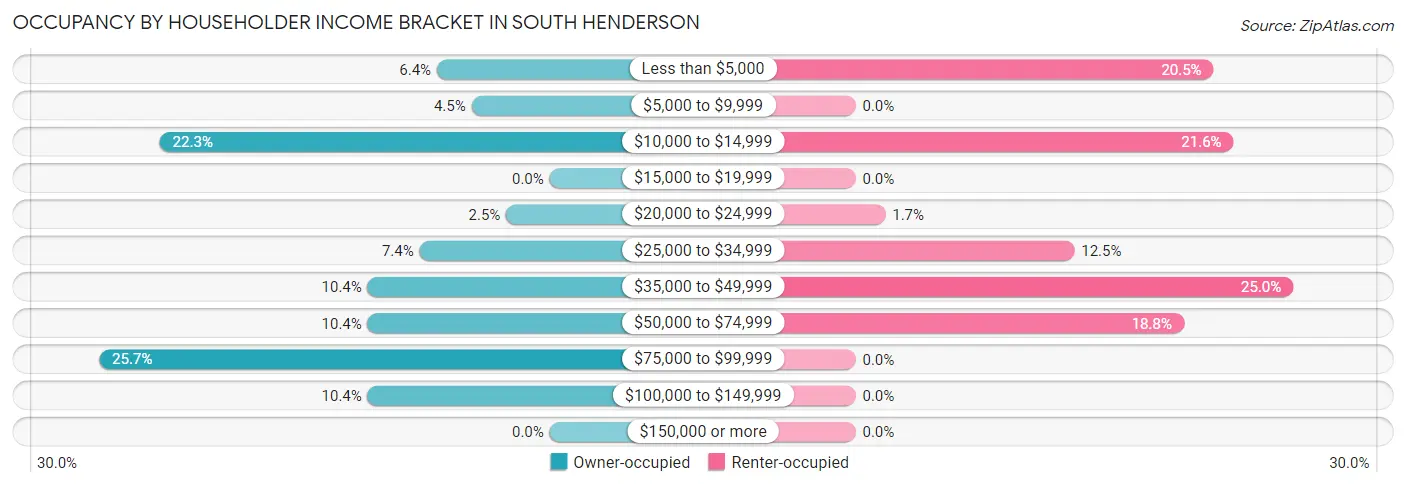
| Income Bracket | Owner-occupied | Renter-occupied |
| Less than $5,000 | 13 (6.4%) | 36 (20.4%) |
| $5,000 to $9,999 | 9 (4.5%) | 0 (0.0%) |
| $10,000 to $14,999 | 45 (22.3%) | 38 (21.6%) |
| $15,000 to $19,999 | 0 (0.0%) | 0 (0.0%) |
| $20,000 to $24,999 | 5 (2.5%) | 3 (1.7%) |
| $25,000 to $34,999 | 15 (7.4%) | 22 (12.5%) |
| $35,000 to $49,999 | 21 (10.4%) | 44 (25.0%) |
| $50,000 to $74,999 | 21 (10.4%) | 33 (18.8%) |
| $75,000 to $99,999 | 52 (25.7%) | 0 (0.0%) |
| $100,000 to $149,999 | 21 (10.4%) | 0 (0.0%) |
| $150,000 or more | 0 (0.0%) | 0 (0.0%) |
| Total | 202 (100.0%) | 176 (100.0%) |
Monthly Housing Cost Tiers in South Henderson
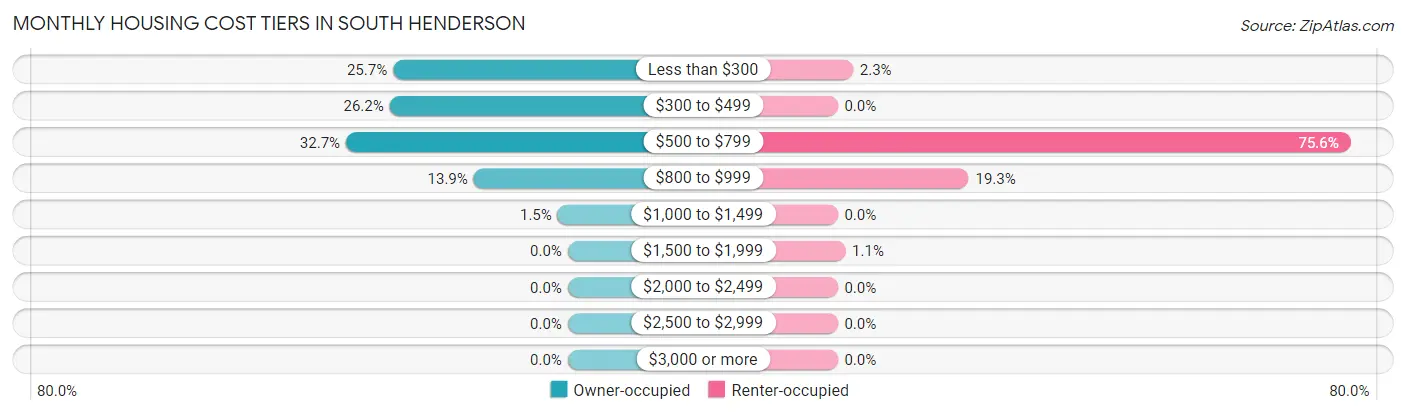
| Monthly Cost | Owner-occupied | Renter-occupied |
| Less than $300 | 52 (25.7%) | 4 (2.3%) |
| $300 to $499 | 53 (26.2%) | 0 (0.0%) |
| $500 to $799 | 66 (32.7%) | 133 (75.6%) |
| $800 to $999 | 28 (13.9%) | 34 (19.3%) |
| $1,000 to $1,499 | 3 (1.5%) | 0 (0.0%) |
| $1,500 to $1,999 | 0 (0.0%) | 2 (1.1%) |
| $2,000 to $2,499 | 0 (0.0%) | 0 (0.0%) |
| $2,500 to $2,999 | 0 (0.0%) | 0 (0.0%) |
| $3,000 or more | 0 (0.0%) | 0 (0.0%) |
| Total | 202 (100.0%) | 176 (100.0%) |
Physical Housing Characteristics in South Henderson
Housing Structures in South Henderson
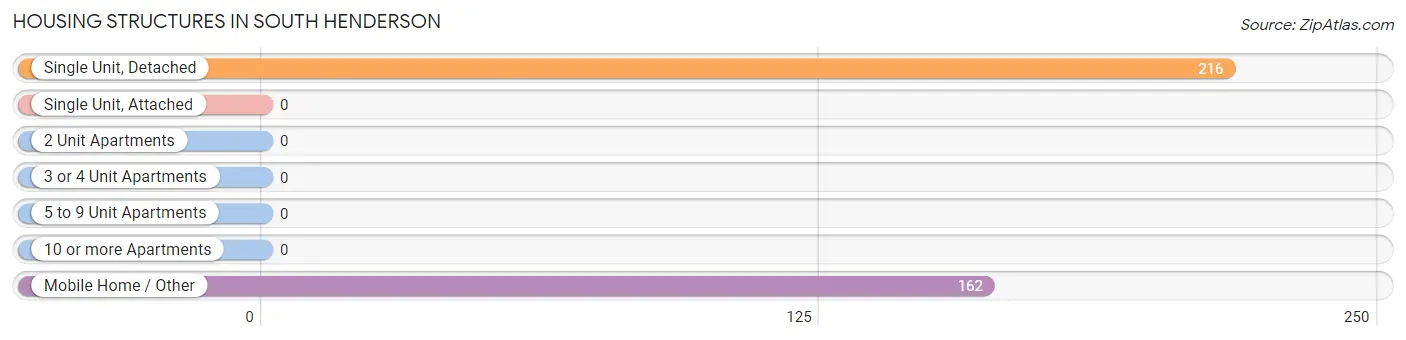
| Structure Type | # Housing Units | % Housing Units |
| Single Unit, Detached | 216 | 57.1% |
| Single Unit, Attached | 0 | 0.0% |
| 2 Unit Apartments | 0 | 0.0% |
| 3 or 4 Unit Apartments | 0 | 0.0% |
| 5 to 9 Unit Apartments | 0 | 0.0% |
| 10 or more Apartments | 0 | 0.0% |
| Mobile Home / Other | 162 | 42.9% |
| Total | 378 | 100.0% |
Housing Structures by Occupancy in South Henderson
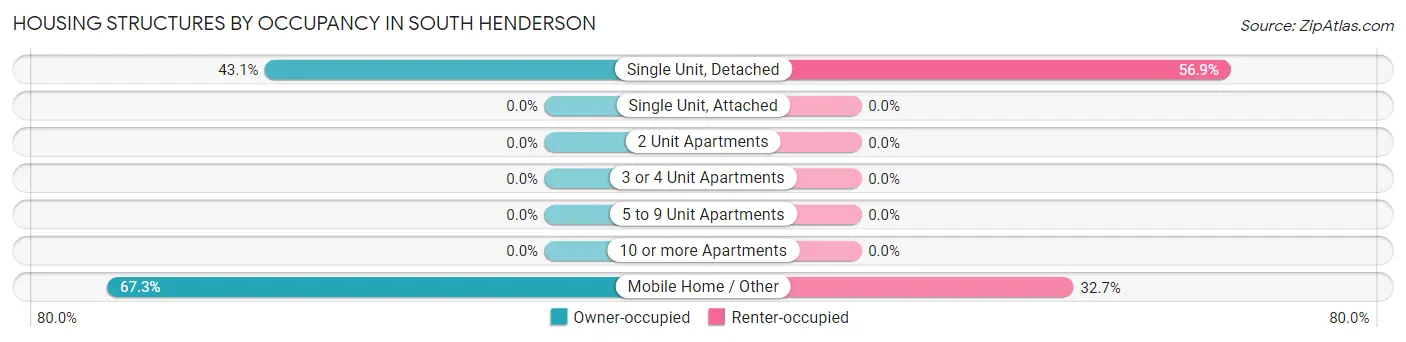
| Structure Type | Owner-occupied | Renter-occupied |
| Single Unit, Detached | 93 (43.1%) | 123 (56.9%) |
| Single Unit, Attached | 0 (0.0%) | 0 (0.0%) |
| 2 Unit Apartments | 0 (0.0%) | 0 (0.0%) |
| 3 or 4 Unit Apartments | 0 (0.0%) | 0 (0.0%) |
| 5 to 9 Unit Apartments | 0 (0.0%) | 0 (0.0%) |
| 10 or more Apartments | 0 (0.0%) | 0 (0.0%) |
| Mobile Home / Other | 109 (67.3%) | 53 (32.7%) |
| Total | 202 (53.4%) | 176 (46.6%) |
Housing Structures by Number of Rooms in South Henderson
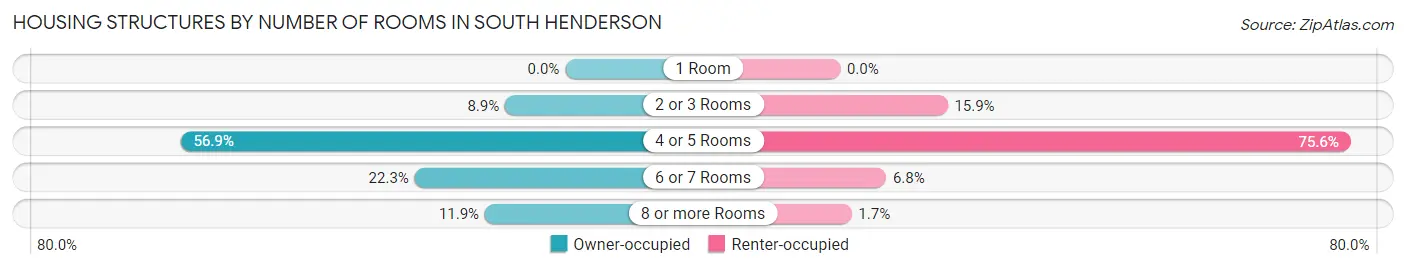
| Number of Rooms | Owner-occupied | Renter-occupied |
| 1 Room | 0 (0.0%) | 0 (0.0%) |
| 2 or 3 Rooms | 18 (8.9%) | 28 (15.9%) |
| 4 or 5 Rooms | 115 (56.9%) | 133 (75.6%) |
| 6 or 7 Rooms | 45 (22.3%) | 12 (6.8%) |
| 8 or more Rooms | 24 (11.9%) | 3 (1.7%) |
| Total | 202 (100.0%) | 176 (100.0%) |
Housing Structure by Heating Type in South Henderson
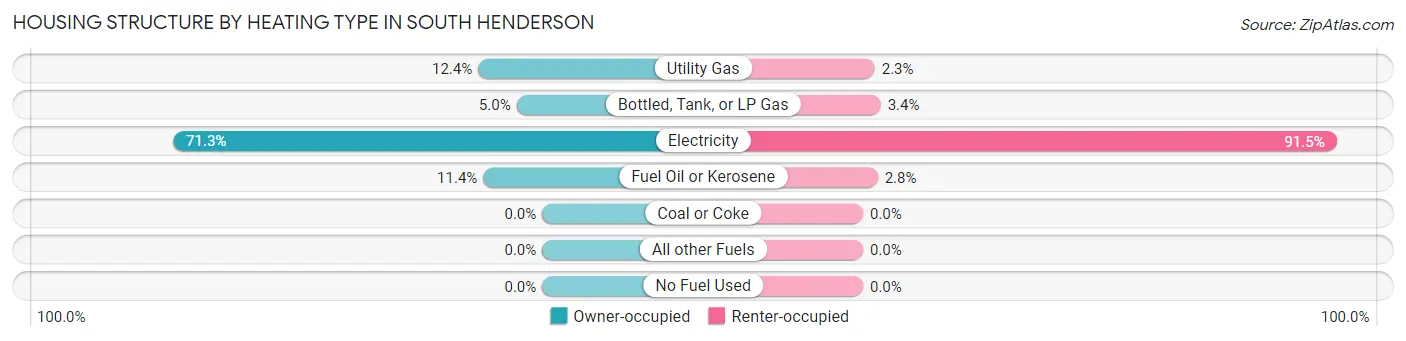
| Heating Type | Owner-occupied | Renter-occupied |
| Utility Gas | 25 (12.4%) | 4 (2.3%) |
| Bottled, Tank, or LP Gas | 10 (5.0%) | 6 (3.4%) |
| Electricity | 144 (71.3%) | 161 (91.5%) |
| Fuel Oil or Kerosene | 23 (11.4%) | 5 (2.8%) |
| Coal or Coke | 0 (0.0%) | 0 (0.0%) |
| All other Fuels | 0 (0.0%) | 0 (0.0%) |
| No Fuel Used | 0 (0.0%) | 0 (0.0%) |
| Total | 202 (100.0%) | 176 (100.0%) |
Household Vehicle Usage in South Henderson
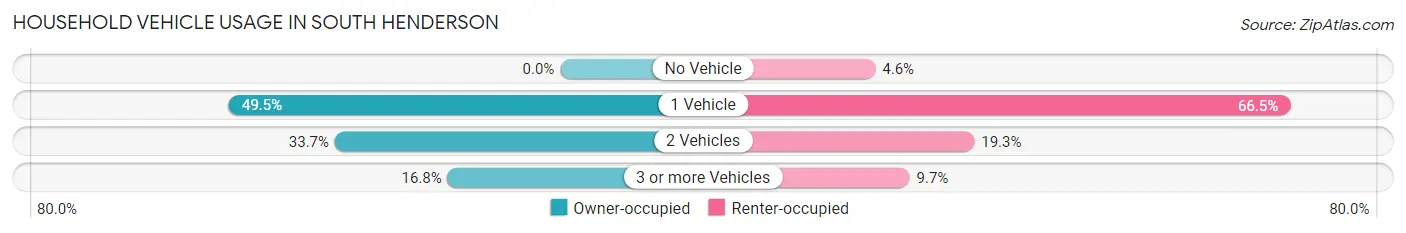
| Vehicles per Household | Owner-occupied | Renter-occupied |
| No Vehicle | 0 (0.0%) | 8 (4.5%) |
| 1 Vehicle | 100 (49.5%) | 117 (66.5%) |
| 2 Vehicles | 68 (33.7%) | 34 (19.3%) |
| 3 or more Vehicles | 34 (16.8%) | 17 (9.7%) |
| Total | 202 (100.0%) | 176 (100.0%) |
Real Estate & Mortgages in South Henderson
Real Estate and Mortgage Overview in South Henderson
| Characteristic | Without Mortgage | With Mortgage |
| Housing Units | 143 | 59 |
| Median Property Value | $9,999 | $92,900 |
| Median Household Income | $38,274 | $0 |
| Monthly Housing Costs | $414 | $0 |
| Real Estate Taxes | $265 | $5 |
Property Value by Mortgage Status in South Henderson
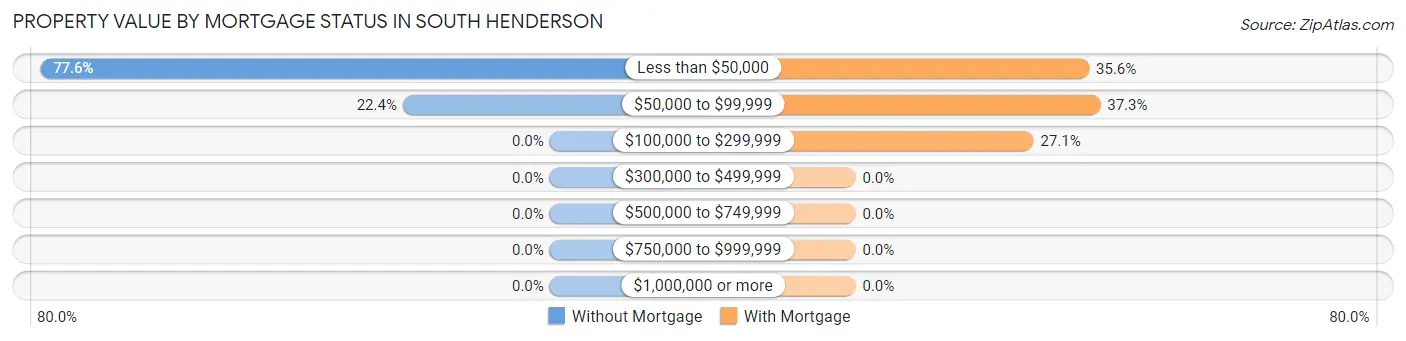
| Property Value | Without Mortgage | With Mortgage |
| Less than $50,000 | 111 (77.6%) | 21 (35.6%) |
| $50,000 to $99,999 | 32 (22.4%) | 22 (37.3%) |
| $100,000 to $299,999 | 0 (0.0%) | 16 (27.1%) |
| $300,000 to $499,999 | 0 (0.0%) | 0 (0.0%) |
| $500,000 to $749,999 | 0 (0.0%) | 0 (0.0%) |
| $750,000 to $999,999 | 0 (0.0%) | 0 (0.0%) |
| $1,000,000 or more | 0 (0.0%) | 0 (0.0%) |
| Total | 143 (100.0%) | 59 (100.0%) |
Household Income by Mortgage Status in South Henderson
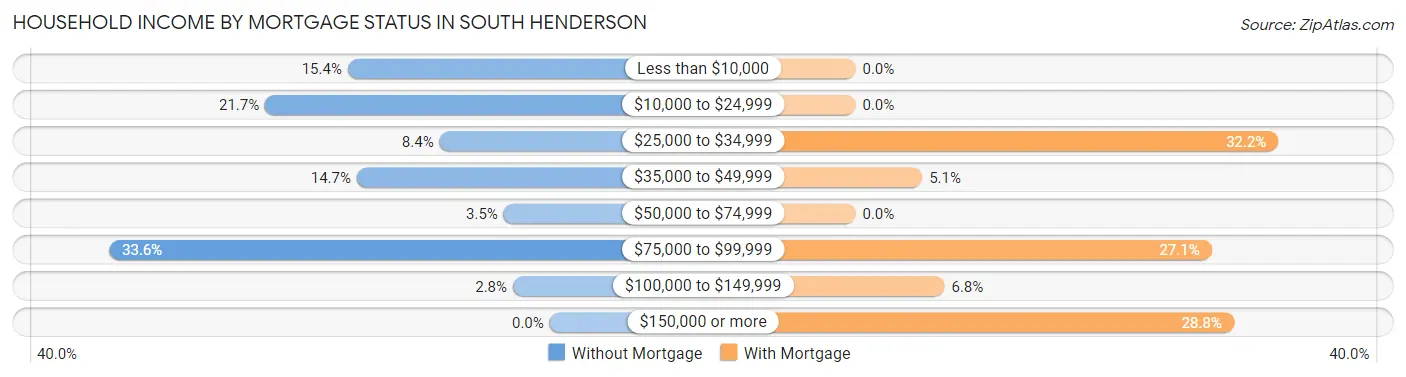
| Household Income | Without Mortgage | With Mortgage |
| Less than $10,000 | 22 (15.4%) | 0 (0.0%) |
| $10,000 to $24,999 | 31 (21.7%) | 0 (0.0%) |
| $25,000 to $34,999 | 12 (8.4%) | 19 (32.2%) |
| $35,000 to $49,999 | 21 (14.7%) | 3 (5.1%) |
| $50,000 to $74,999 | 5 (3.5%) | 0 (0.0%) |
| $75,000 to $99,999 | 48 (33.6%) | 16 (27.1%) |
| $100,000 to $149,999 | 4 (2.8%) | 4 (6.8%) |
| $150,000 or more | 0 (0.0%) | 17 (28.8%) |
| Total | 143 (100.0%) | 59 (100.0%) |
Property Value to Household Income Ratio in South Henderson
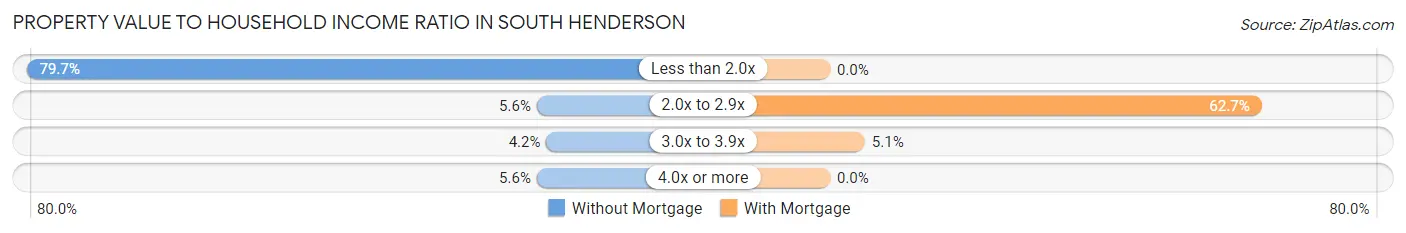
| Value-to-Income Ratio | Without Mortgage | With Mortgage |
| Less than 2.0x | 114 (79.7%) | 0 (0.0%) |
| 2.0x to 2.9x | 8 (5.6%) | 37 (62.7%) |
| 3.0x to 3.9x | 6 (4.2%) | 3 (5.1%) |
| 4.0x or more | 8 (5.6%) | 0 (0.0%) |
| Total | 143 (100.0%) | 59 (100.0%) |
Real Estate Taxes by Mortgage Status in South Henderson
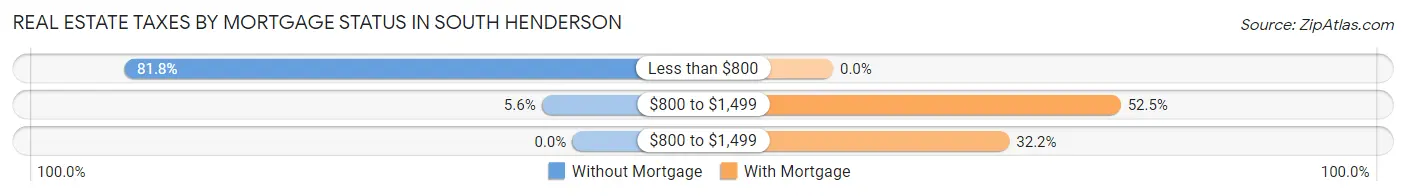
| Property Taxes | Without Mortgage | With Mortgage |
| Less than $800 | 117 (81.8%) | 0 (0.0%) |
| $800 to $1,499 | 8 (5.6%) | 31 (52.5%) |
| $800 to $1,499 | 0 (0.0%) | 19 (32.2%) |
| Total | 143 (100.0%) | 59 (100.0%) |
Health & Disability in South Henderson
Health Insurance Coverage by Age in South Henderson
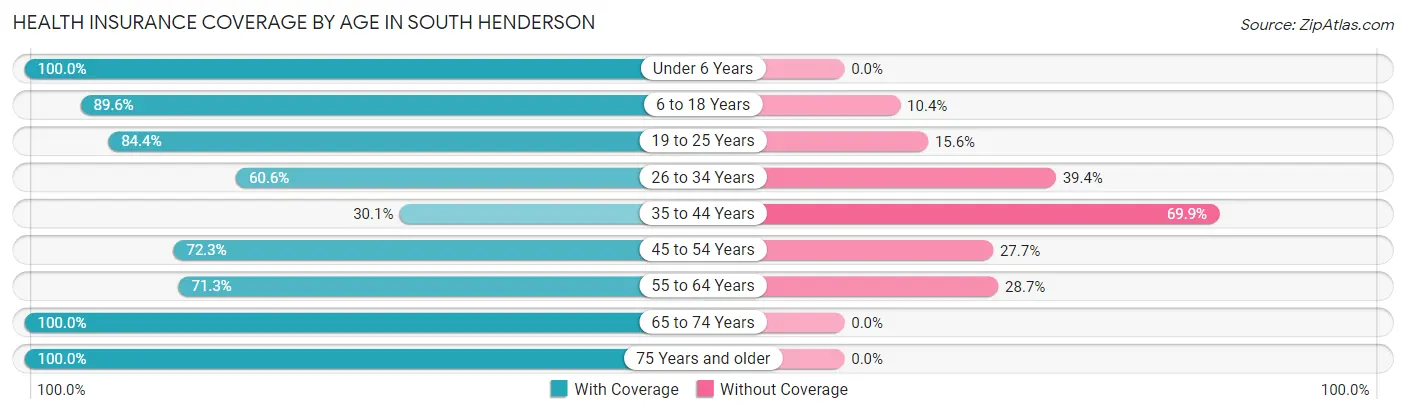
| Age Bracket | With Coverage | Without Coverage |
| Under 6 Years | 173 (100.0%) | 0 (0.0%) |
| 6 to 18 Years | 172 (89.6%) | 20 (10.4%) |
| 19 to 25 Years | 119 (84.4%) | 22 (15.6%) |
| 26 to 34 Years | 83 (60.6%) | 54 (39.4%) |
| 35 to 44 Years | 63 (30.1%) | 146 (69.9%) |
| 45 to 54 Years | 86 (72.3%) | 33 (27.7%) |
| 55 to 64 Years | 87 (71.3%) | 35 (28.7%) |
| 65 to 74 Years | 69 (100.0%) | 0 (0.0%) |
| 75 Years and older | 25 (100.0%) | 0 (0.0%) |
| Total | 877 (73.9%) | 310 (26.1%) |
Health Insurance Coverage by Citizenship Status in South Henderson
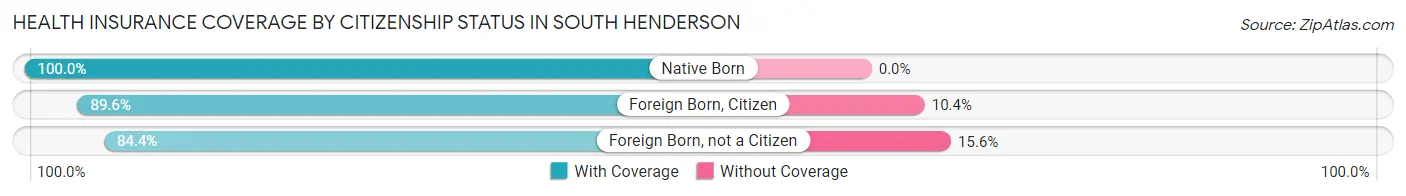
| Citizenship Status | With Coverage | Without Coverage |
| Native Born | 173 (100.0%) | 0 (0.0%) |
| Foreign Born, Citizen | 172 (89.6%) | 20 (10.4%) |
| Foreign Born, not a Citizen | 119 (84.4%) | 22 (15.6%) |
Health Insurance Coverage by Household Income in South Henderson
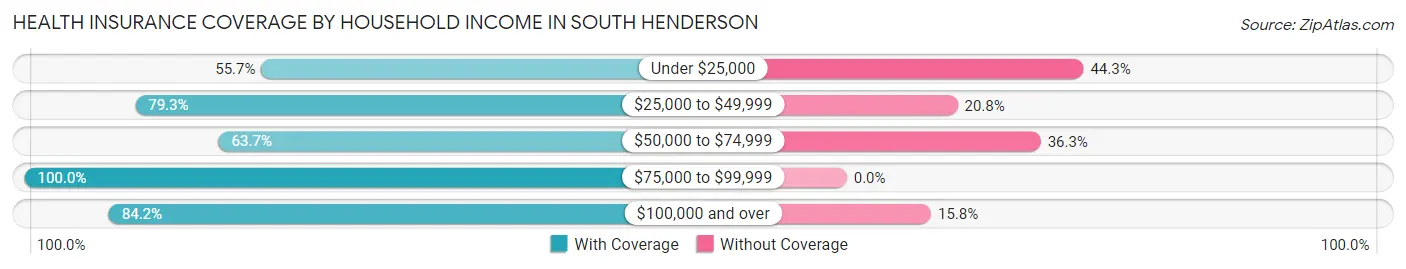
| Household Income | With Coverage | Without Coverage |
| Under $25,000 | 177 (55.7%) | 141 (44.3%) |
| $25,000 to $49,999 | 252 (79.2%) | 66 (20.7%) |
| $50,000 to $74,999 | 156 (63.7%) | 89 (36.3%) |
| $75,000 to $99,999 | 200 (100.0%) | 0 (0.0%) |
| $100,000 and over | 64 (84.2%) | 12 (15.8%) |
Public vs Private Health Insurance Coverage by Age in South Henderson
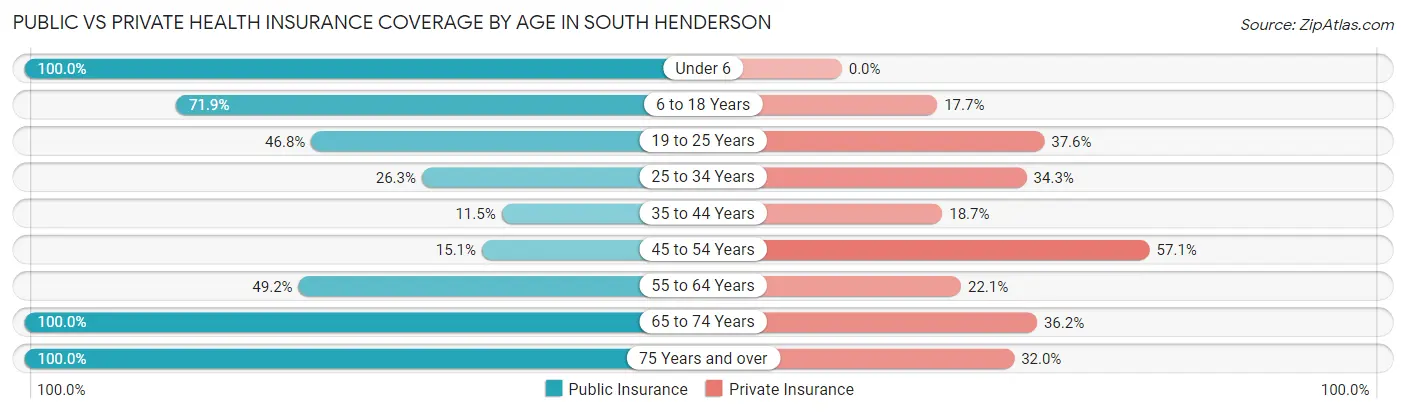
| Age Bracket | Public Insurance | Private Insurance |
| Under 6 | 173 (100.0%) | 0 (0.0%) |
| 6 to 18 Years | 138 (71.9%) | 34 (17.7%) |
| 19 to 25 Years | 66 (46.8%) | 53 (37.6%) |
| 25 to 34 Years | 36 (26.3%) | 47 (34.3%) |
| 35 to 44 Years | 24 (11.5%) | 39 (18.7%) |
| 45 to 54 Years | 18 (15.1%) | 68 (57.1%) |
| 55 to 64 Years | 60 (49.2%) | 27 (22.1%) |
| 65 to 74 Years | 69 (100.0%) | 25 (36.2%) |
| 75 Years and over | 25 (100.0%) | 8 (32.0%) |
| Total | 609 (51.3%) | 301 (25.4%) |
Disability Status by Sex by Age in South Henderson
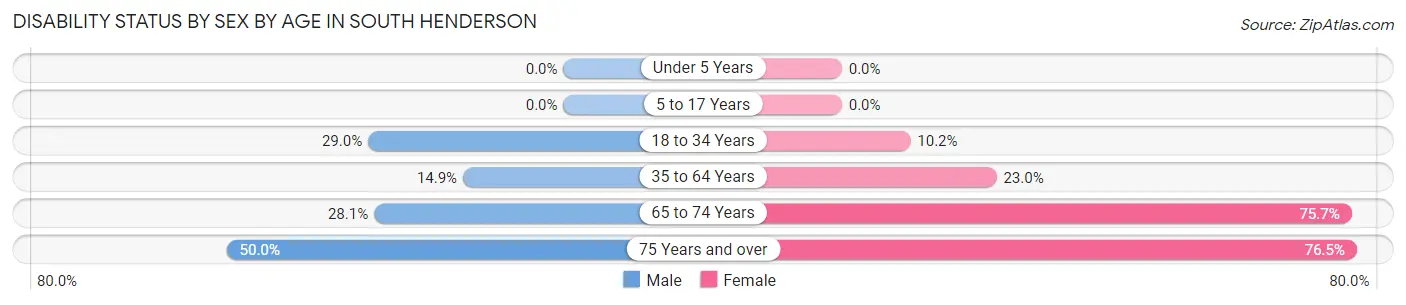
| Age Bracket | Male | Female |
| Under 5 Years | 0 (0.0%) | 0 (0.0%) |
| 5 to 17 Years | 0 (0.0%) | 0 (0.0%) |
| 18 to 34 Years | 38 (29.0%) | 17 (10.2%) |
| 35 to 64 Years | 34 (14.9%) | 51 (23.0%) |
| 65 to 74 Years | 9 (28.1%) | 28 (75.7%) |
| 75 Years and over | 4 (50.0%) | 13 (76.5%) |
Disability Class by Sex by Age in South Henderson
Disability Class: Hearing Difficulty
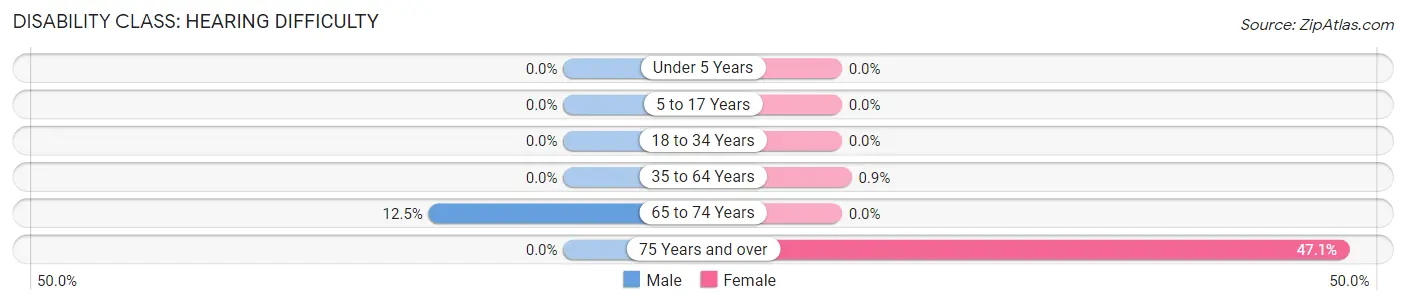
| Age Bracket | Male | Female |
| Under 5 Years | 0 (0.0%) | 0 (0.0%) |
| 5 to 17 Years | 0 (0.0%) | 0 (0.0%) |
| 18 to 34 Years | 0 (0.0%) | 0 (0.0%) |
| 35 to 64 Years | 0 (0.0%) | 2 (0.9%) |
| 65 to 74 Years | 4 (12.5%) | 0 (0.0%) |
| 75 Years and over | 0 (0.0%) | 8 (47.1%) |
Disability Class: Vision Difficulty
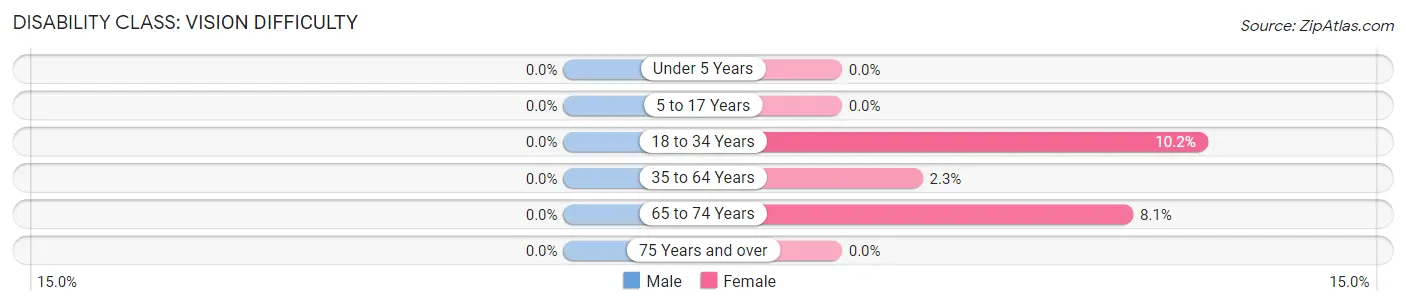
| Age Bracket | Male | Female |
| Under 5 Years | 0 (0.0%) | 0 (0.0%) |
| 5 to 17 Years | 0 (0.0%) | 0 (0.0%) |
| 18 to 34 Years | 0 (0.0%) | 17 (10.2%) |
| 35 to 64 Years | 0 (0.0%) | 5 (2.2%) |
| 65 to 74 Years | 0 (0.0%) | 3 (8.1%) |
| 75 Years and over | 0 (0.0%) | 0 (0.0%) |
Disability Class: Cognitive Difficulty
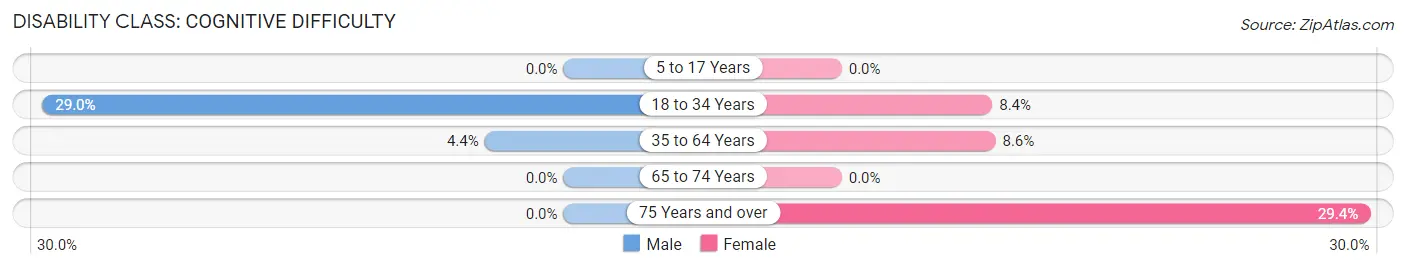
| Age Bracket | Male | Female |
| 5 to 17 Years | 0 (0.0%) | 0 (0.0%) |
| 18 to 34 Years | 38 (29.0%) | 14 (8.4%) |
| 35 to 64 Years | 10 (4.4%) | 19 (8.6%) |
| 65 to 74 Years | 0 (0.0%) | 0 (0.0%) |
| 75 Years and over | 0 (0.0%) | 5 (29.4%) |
Disability Class: Ambulatory Difficulty
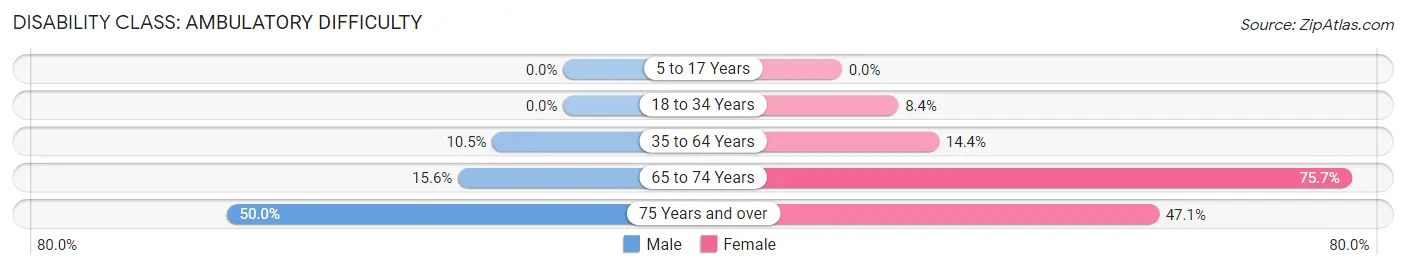
| Age Bracket | Male | Female |
| 5 to 17 Years | 0 (0.0%) | 0 (0.0%) |
| 18 to 34 Years | 0 (0.0%) | 14 (8.4%) |
| 35 to 64 Years | 24 (10.5%) | 32 (14.4%) |
| 65 to 74 Years | 5 (15.6%) | 28 (75.7%) |
| 75 Years and over | 4 (50.0%) | 8 (47.1%) |
Disability Class: Self-Care Difficulty
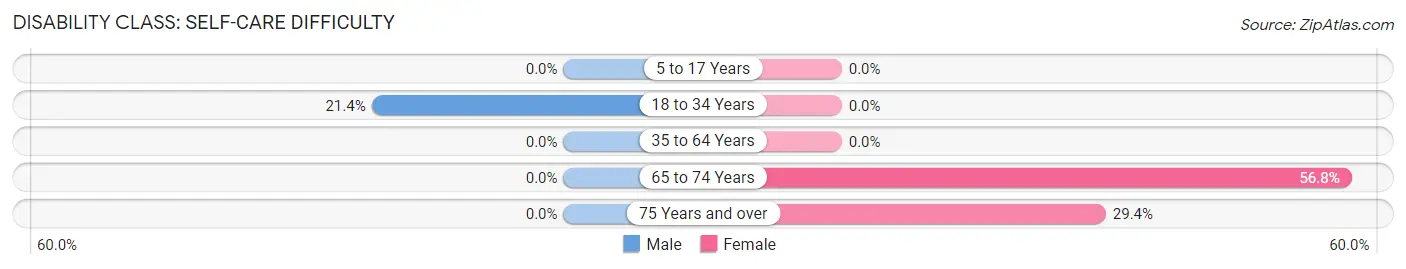
| Age Bracket | Male | Female |
| 5 to 17 Years | 0 (0.0%) | 0 (0.0%) |
| 18 to 34 Years | 28 (21.4%) | 0 (0.0%) |
| 35 to 64 Years | 0 (0.0%) | 0 (0.0%) |
| 65 to 74 Years | 0 (0.0%) | 21 (56.8%) |
| 75 Years and over | 0 (0.0%) | 5 (29.4%) |
Technology Access in South Henderson
Computing Device Access in South Henderson
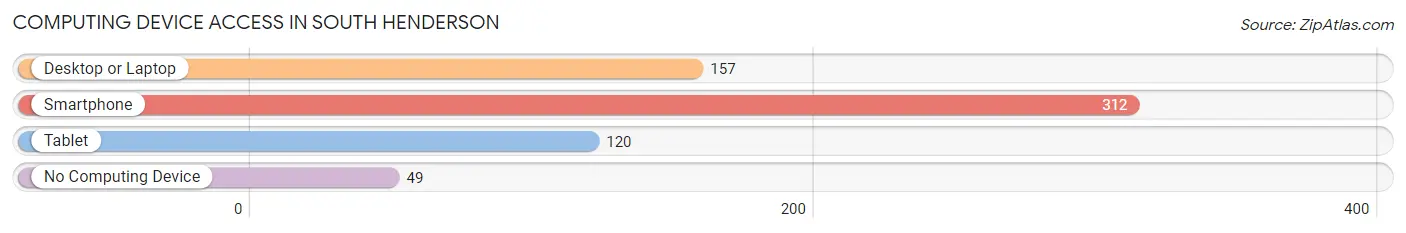
| Device Type | # Households | % Households |
| Desktop or Laptop | 157 | 41.5% |
| Smartphone | 312 | 82.5% |
| Tablet | 120 | 31.8% |
| No Computing Device | 49 | 13.0% |
| Total | 378 | 100.0% |
Internet Access in South Henderson
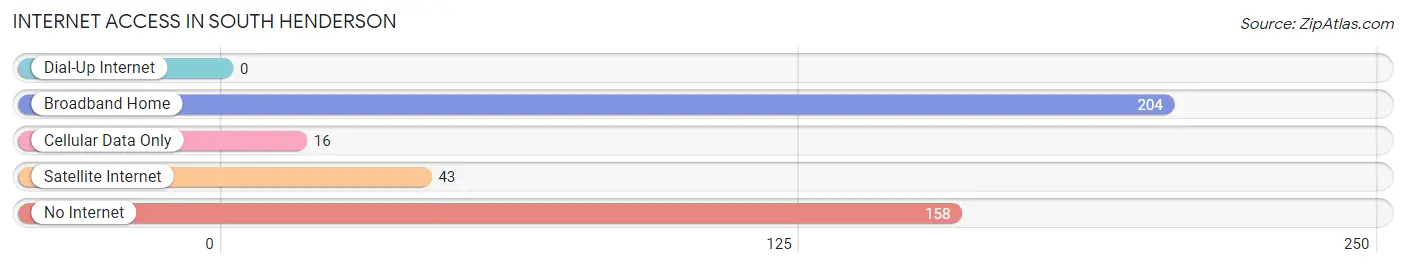
| Internet Type | # Households | % Households |
| Dial-Up Internet | 0 | 0.0% |
| Broadband Home | 204 | 54.0% |
| Cellular Data Only | 16 | 4.2% |
| Satellite Internet | 43 | 11.4% |
| No Internet | 158 | 41.8% |
| Total | 378 | 100.0% |
South Henderson Summary
Henderson County, North Carolina is located in the western part of the state and is home to the town of South Henderson. The town is situated in the foothills of the Blue Ridge Mountains and is part of the larger Asheville metropolitan area. South Henderson has a population of approximately 1,500 people and is a small, rural community.
History
South Henderson was first settled in the late 1700s by settlers from the nearby town of Hendersonville. The town was originally known as “Henderson’s Crossroads” and was a stop on the Buncombe Turnpike, a major thoroughfare connecting Asheville to the rest of the state. In 1875, the town was officially incorporated as South Henderson.
The town was a major agricultural center in the late 19th and early 20th centuries, with tobacco, cotton, and corn being the primary crops. The town also had a thriving timber industry, with several sawmills located in the area. In the early 20th century, the town began to diversify its economy, with the opening of several small businesses, including a furniture factory, a canning factory, and a brickyard.
Geography
South Henderson is located in the foothills of the Blue Ridge Mountains, approximately 20 miles south of Asheville. The town is situated at an elevation of 1,400 feet and is surrounded by rolling hills and forests. The town is located in the French Broad River Valley, which is a major agricultural region in the state.
The town is located in the Piedmont region of North Carolina, which is characterized by a humid subtropical climate. Summers are hot and humid, with temperatures reaching into the 90s, while winters are mild, with temperatures rarely dropping below freezing.
Economy
South Henderson’s economy is largely based on agriculture and tourism. The town is home to several farms, which produce a variety of crops, including tobacco, cotton, corn, and soybeans. The town is also home to several wineries, which produce a variety of wines.
The town is also a popular tourist destination, with several attractions, including the historic Hendersonville Courthouse, the Hendersonville Museum, and the South Henderson Historic District. The town is also home to several outdoor recreation areas, including the Pisgah National Forest and the DuPont State Forest.
Demographics
As of the 2010 census, South Henderson had a population of 1,500 people. The town is predominantly white, with approximately 90% of the population identifying as such. The town also has a small African American population, with approximately 5% of the population identifying as such. The town also has a small Hispanic population, with approximately 2% of the population identifying as such.
The median household income in South Henderson is approximately $35,000, which is slightly lower than the state average. The town also has a higher poverty rate than the state average, with approximately 20% of the population living below the poverty line.
Conclusion
South Henderson is a small, rural town located in the foothills of the Blue Ridge Mountains. The town has a population of approximately 1,500 people and is predominantly white. The town’s economy is largely based on agriculture and tourism, with several farms and wineries located in the area. The town also has a higher poverty rate than the state average, with approximately 20% of the population living below the poverty line.
Common Questions
What is Per Capita Income in South Henderson?
Per Capita income in South Henderson is $13,779.
What is the Median Family Income in South Henderson?
Median Family Income in South Henderson is $38,690.
What is the Median Household income in South Henderson?
Median Household Income in South Henderson is $35,341.
What is Income or Wage Gap in South Henderson?
Income or Wage Gap in South Henderson is 8.6%.
Women in South Henderson earn 91.4 cents for every dollar earned by a man.
What is Family Income Deficit in South Henderson?
Family Income Deficit in South Henderson is $10,802.
Families that are below poverty line in South Henderson earn $10,802 less on average than the poverty threshold level.
What is Inequality or Gini Index in South Henderson?
Inequality or Gini Index in South Henderson is 0.46.
What is the Total Population of South Henderson?
Total Population of South Henderson is 1,187.
What is the Total Male Population of South Henderson?
Total Male Population of South Henderson is 577.
What is the Total Female Population of South Henderson?
Total Female Population of South Henderson is 610.
What is the Ratio of Males per 100 Females in South Henderson?
There are 94.59 Males per 100 Females in South Henderson.
What is the Ratio of Females per 100 Males in South Henderson?
There are 105.72 Females per 100 Males in South Henderson.
What is the Median Population Age in South Henderson?
Median Population Age in South Henderson is 32.3 Years.
What is the Average Family Size in South Henderson
Average Family Size in South Henderson is 3.5 People.
What is the Average Household Size in South Henderson
Average Household Size in South Henderson is 3.1 People.
How Large is the Labor Force in South Henderson?
There are 550 People in the Labor Forcein in South Henderson.
What is the Percentage of People in the Labor Force in South Henderson?
63.0% of People are in the Labor Force in South Henderson.
What is the Unemployment Rate in South Henderson?
Unemployment Rate in South Henderson is 23.1%.