East Arcadia, NC Map & Demographics
East Arcadia Map
East Arcadia Overview
$26,894
PER CAPITA INCOME
$49,539
AVG FAMILY INCOME
$31,731
AVG HOUSEHOLD INCOME
6.8%
WAGE / INCOME GAP [ % ]
93.2¢/ $1
WAGE / INCOME GAP [ $ ]
0.50
INEQUALITY / GINI INDEX
337
TOTAL POPULATION
196
MALE POPULATION
141
FEMALE POPULATION
139.01
MALES / 100 FEMALES
71.94
FEMALES / 100 MALES
55.5
MEDIAN AGE
4.2
AVG FAMILY SIZE
2.7
AVG HOUSEHOLD SIZE
165
LABOR FORCE [ PEOPLE ]
50.8%
PERCENT IN LABOR FORCE
17.0%
UNEMPLOYMENT RATE
East Arcadia Area Codes
Income in East Arcadia
Income Overview in East Arcadia
Per Capita Income in East Arcadia is $26,894, while median incomes of families and households are $49,539 and $31,731 respectively.
| Characteristic | Number | Measure |
| Per Capita Income | 337 | $26,894 |
| Median Family Income | 67 | $49,539 |
| Mean Family Income | 67 | $72,452 |
| Median Household Income | 124 | $31,731 |
| Mean Household Income | 124 | $48,056 |
| Income Deficit | 67 | $0 |
| Wage / Income Gap (%) | 337 | 6.75% |
| Wage / Income Gap ($) | 337 | 93.25¢ per $1 |
| Gini / Inequality Index | 337 | 0.50 |
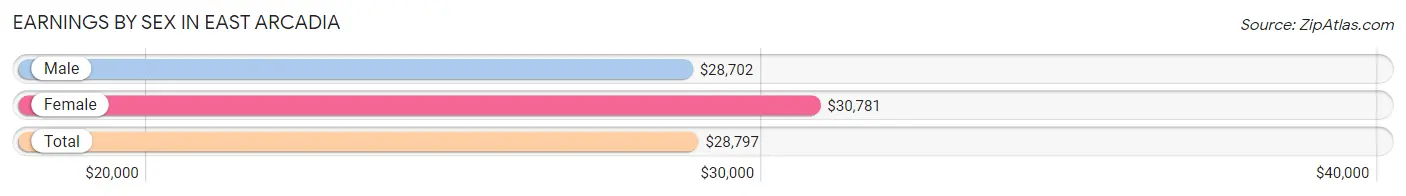
Earnings by Sex in East Arcadia
Average Earnings in East Arcadia are $28,797, $28,702 for men and $30,781 for women, a difference of 6.8%.
| Sex | Number | Average Earnings |
| Male | 95 (67.9%) | $28,702 |
| Female | 45 (32.1%) | $30,781 |
| Total | 140 (100.0%) | $28,797 |
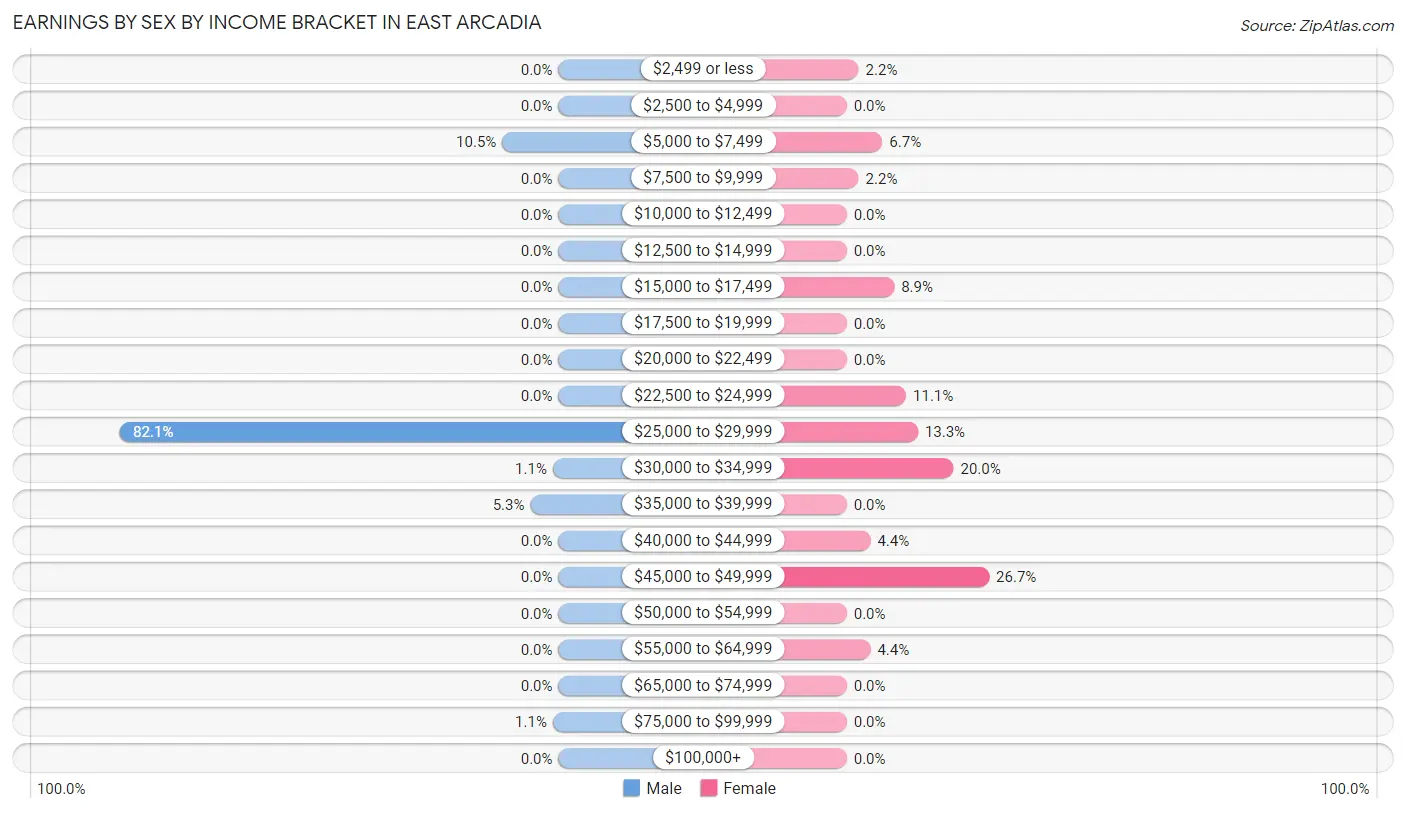
Earnings by Sex by Income Bracket in East Arcadia
The most common earnings brackets in East Arcadia are $25,000 to $29,999 for men (78 | 82.1%) and $45,000 to $49,999 for women (12 | 26.7%).
| Income | Male | Female |
| $2,499 or less | 0 (0.0%) | 1 (2.2%) |
| $2,500 to $4,999 | 0 (0.0%) | 0 (0.0%) |
| $5,000 to $7,499 | 10 (10.5%) | 3 (6.7%) |
| $7,500 to $9,999 | 0 (0.0%) | 1 (2.2%) |
| $10,000 to $12,499 | 0 (0.0%) | 0 (0.0%) |
| $12,500 to $14,999 | 0 (0.0%) | 0 (0.0%) |
| $15,000 to $17,499 | 0 (0.0%) | 4 (8.9%) |
| $17,500 to $19,999 | 0 (0.0%) | 0 (0.0%) |
| $20,000 to $22,499 | 0 (0.0%) | 0 (0.0%) |
| $22,500 to $24,999 | 0 (0.0%) | 5 (11.1%) |
| $25,000 to $29,999 | 78 (82.1%) | 6 (13.3%) |
| $30,000 to $34,999 | 1 (1.1%) | 9 (20.0%) |
| $35,000 to $39,999 | 5 (5.3%) | 0 (0.0%) |
| $40,000 to $44,999 | 0 (0.0%) | 2 (4.4%) |
| $45,000 to $49,999 | 0 (0.0%) | 12 (26.7%) |
| $50,000 to $54,999 | 0 (0.0%) | 0 (0.0%) |
| $55,000 to $64,999 | 0 (0.0%) | 2 (4.4%) |
| $65,000 to $74,999 | 0 (0.0%) | 0 (0.0%) |
| $75,000 to $99,999 | 1 (1.1%) | 0 (0.0%) |
| $100,000+ | 0 (0.0%) | 0 (0.0%) |
| Total | 95 (100.0%) | 45 (100.0%) |
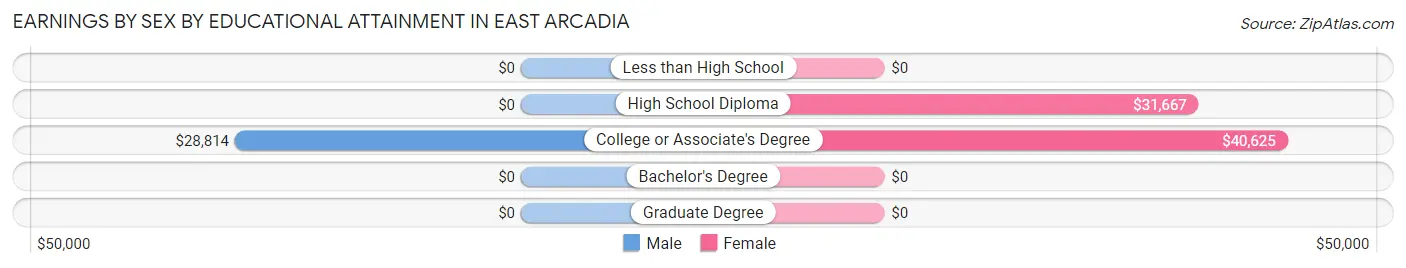
Earnings by Sex by Educational Attainment in East Arcadia
Average earnings in East Arcadia are $28,702 for men and $31,406 for women, a difference of 8.6%. Men with an educational attainment of college or associate's degree enjoy the highest average annual earnings of $28,814, while those with college or associate's degree education earn the least with $28,814. Women with an educational attainment of college or associate's degree earn the most with the average annual earnings of $40,625, while those with high school diploma education have the smallest earnings of $31,667.
| Educational Attainment | Male Income | Female Income |
| Less than High School | - | - |
| High School Diploma | - | - |
| College or Associate's Degree | $28,814 | $40,625 |
| Bachelor's Degree | - | - |
| Graduate Degree | - | - |
| Total | $28,702 | $31,406 |
Family Income in East Arcadia
Family Income Brackets in East Arcadia
According to the East Arcadia family income data, there are 24 families falling into the $35,000 to $49,999 income range, which is the most common income bracket and makes up 35.8% of all families.
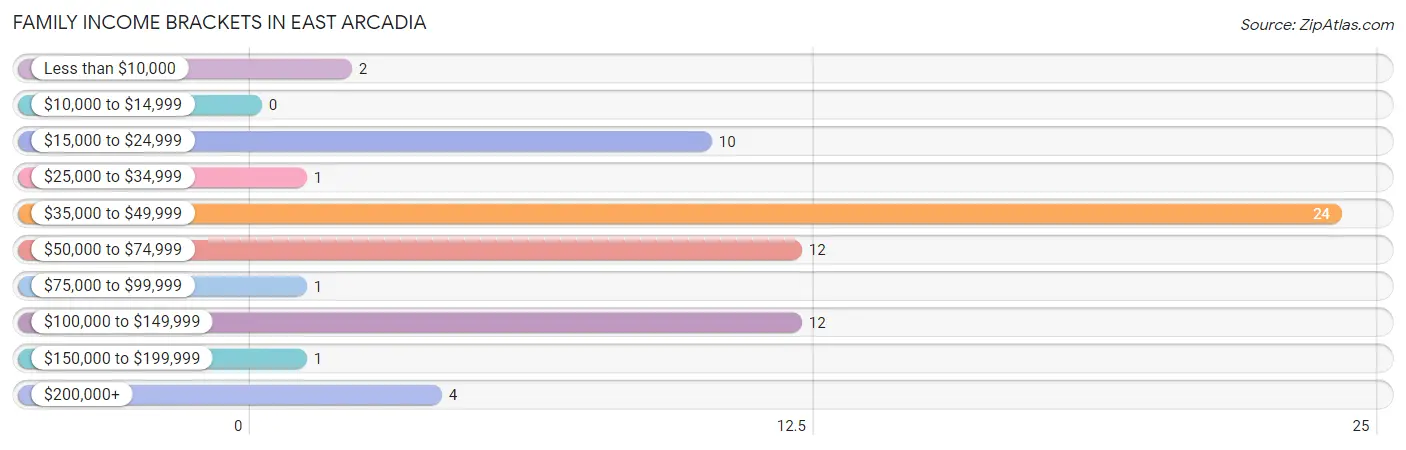
| Income Bracket | # Families | % Families |
| Less than $10,000 | 2 | 3.0% |
| $10,000 to $14,999 | 0 | 0.0% |
| $15,000 to $24,999 | 10 | 14.9% |
| $25,000 to $34,999 | 1 | 1.5% |
| $35,000 to $49,999 | 24 | 35.8% |
| $50,000 to $74,999 | 12 | 17.9% |
| $75,000 to $99,999 | 1 | 1.5% |
| $100,000 to $149,999 | 12 | 17.9% |
| $150,000 to $199,999 | 1 | 1.5% |
| $200,000+ | 4 | 6.0% |
Family Income by Famaliy Size in East Arcadia
3-person families (10 | 14.9%) account for the highest median family income in East Arcadia with $70,500 per family, while 2-person families (54 | 80.6%) have the highest median income of $24,606 per family member.
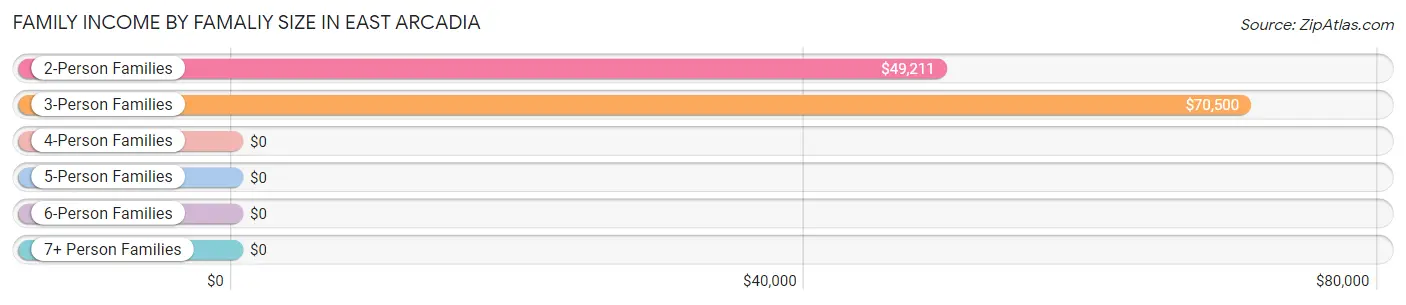
| Income Bracket | # Families | Median Income |
| 2-Person Families | 54 (80.6%) | $49,211 |
| 3-Person Families | 10 (14.9%) | $70,500 |
| 4-Person Families | 3 (4.5%) | $0 |
| 5-Person Families | 0 (0.0%) | $0 |
| 6-Person Families | 0 (0.0%) | $0 |
| 7+ Person Families | 0 (0.0%) | $0 |
| Total | 67 (100.0%) | $49,539 |
Family Income by Number of Earners in East Arcadia
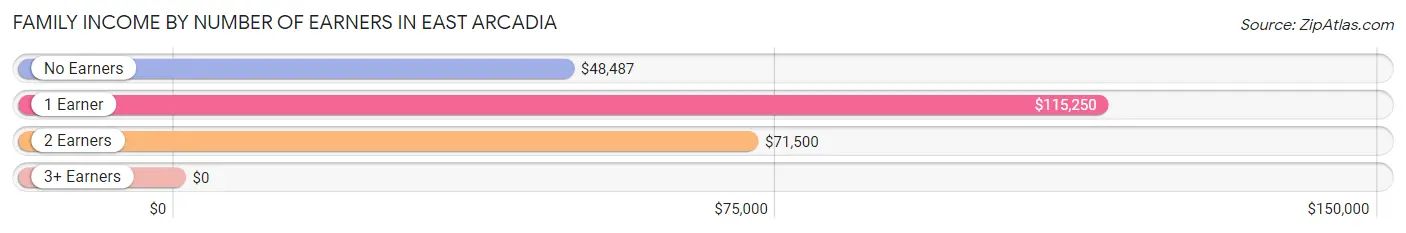
| Number of Earners | # Families | Median Income |
| No Earners | 39 (58.2%) | $48,487 |
| 1 Earner | 18 (26.9%) | $115,250 |
| 2 Earners | 8 (11.9%) | $71,500 |
| 3+ Earners | 2 (3.0%) | $0 |
| Total | 67 (100.0%) | $49,539 |
Household Income in East Arcadia
Household Income Brackets in East Arcadia
With 26 households falling in the category, the $35,000 to $49,999 income range is the most frequent in East Arcadia, accounting for 21.0% of all households. In contrast, only 1 households (0.8%) fall into the $75,000 to $99,999 income bracket, making it the least populous group.
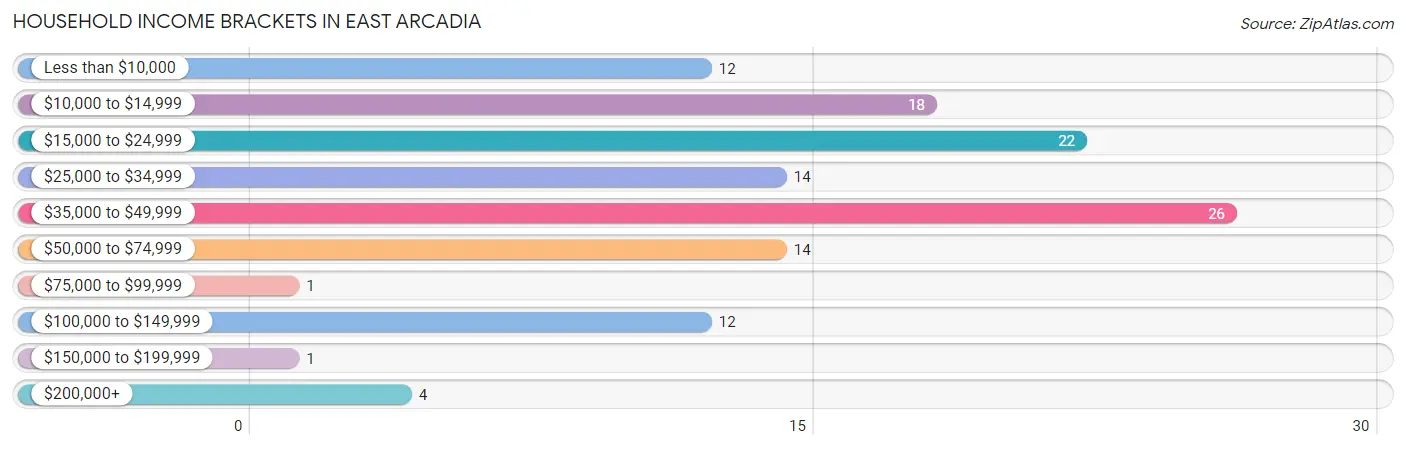
| Income Bracket | # Households | % Households |
| Less than $10,000 | 12 | 9.7% |
| $10,000 to $14,999 | 18 | 14.5% |
| $15,000 to $24,999 | 22 | 17.7% |
| $25,000 to $34,999 | 14 | 11.3% |
| $35,000 to $49,999 | 26 | 21.0% |
| $50,000 to $74,999 | 14 | 11.3% |
| $75,000 to $99,999 | 1 | 0.8% |
| $100,000 to $149,999 | 12 | 9.7% |
| $150,000 to $199,999 | 1 | 0.8% |
| $200,000+ | 4 | 3.2% |
Household Income by Householder Age in East Arcadia
The median household income in East Arcadia is $31,731, with the highest median household income of $48,816 found in the 45 to 64 years age bracket for the primary householder. A total of 58 households (46.8%) fall into this category.
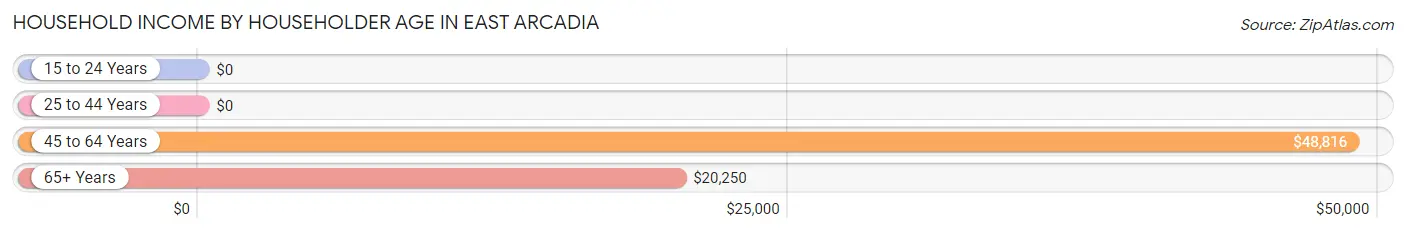
| Income Bracket | # Households | Median Income |
| 15 to 24 Years | 0 (0.0%) | $0 |
| 25 to 44 Years | 14 (11.3%) | $0 |
| 45 to 64 Years | 58 (46.8%) | $48,816 |
| 65+ Years | 52 (41.9%) | $20,250 |
| Total | 124 (100.0%) | $31,731 |
Poverty in East Arcadia
Income Below Poverty by Sex and Age in East Arcadia
With 3.6% poverty level for males and 17.7% for females among the residents of East Arcadia, 55 to 64 year old males and 15 year old females are the most vulnerable to poverty, with 5 males (9.3%) and 3 females (75.0%) in their respective age groups living below the poverty level.
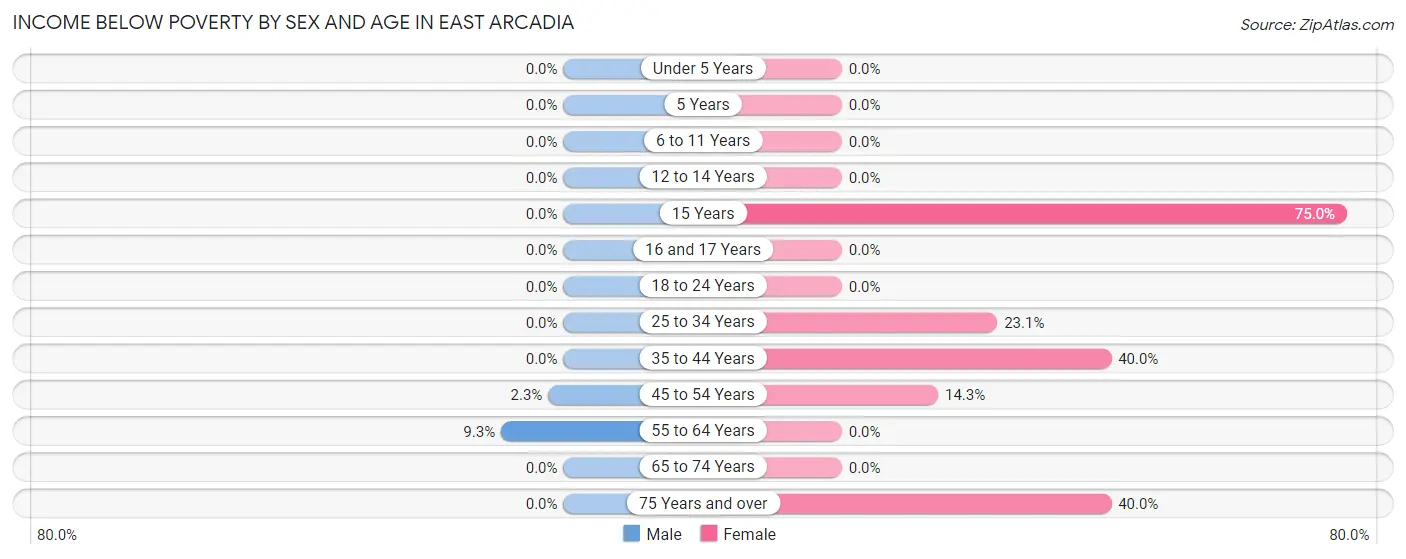
| Age Bracket | Male | Female |
| Under 5 Years | 0 (0.0%) | 0 (0.0%) |
| 5 Years | 0 (0.0%) | 0 (0.0%) |
| 6 to 11 Years | 0 (0.0%) | 0 (0.0%) |
| 12 to 14 Years | 0 (0.0%) | 0 (0.0%) |
| 15 Years | 0 (0.0%) | 3 (75.0%) |
| 16 and 17 Years | 0 (0.0%) | 0 (0.0%) |
| 18 to 24 Years | 0 (0.0%) | 0 (0.0%) |
| 25 to 34 Years | 0 (0.0%) | 3 (23.1%) |
| 35 to 44 Years | 0 (0.0%) | 2 (40.0%) |
| 45 to 54 Years | 2 (2.2%) | 1 (14.3%) |
| 55 to 64 Years | 5 (9.3%) | 0 (0.0%) |
| 65 to 74 Years | 0 (0.0%) | 0 (0.0%) |
| 75 Years and over | 0 (0.0%) | 16 (40.0%) |
| Total | 7 (3.6%) | 25 (17.7%) |
Income Above Poverty by Sex and Age in East Arcadia
According to the poverty statistics in East Arcadia, males aged 6 to 11 years and females aged 6 to 11 years are the age groups that are most secure financially, with 100.0% of males and 100.0% of females in these age groups living above the poverty line.
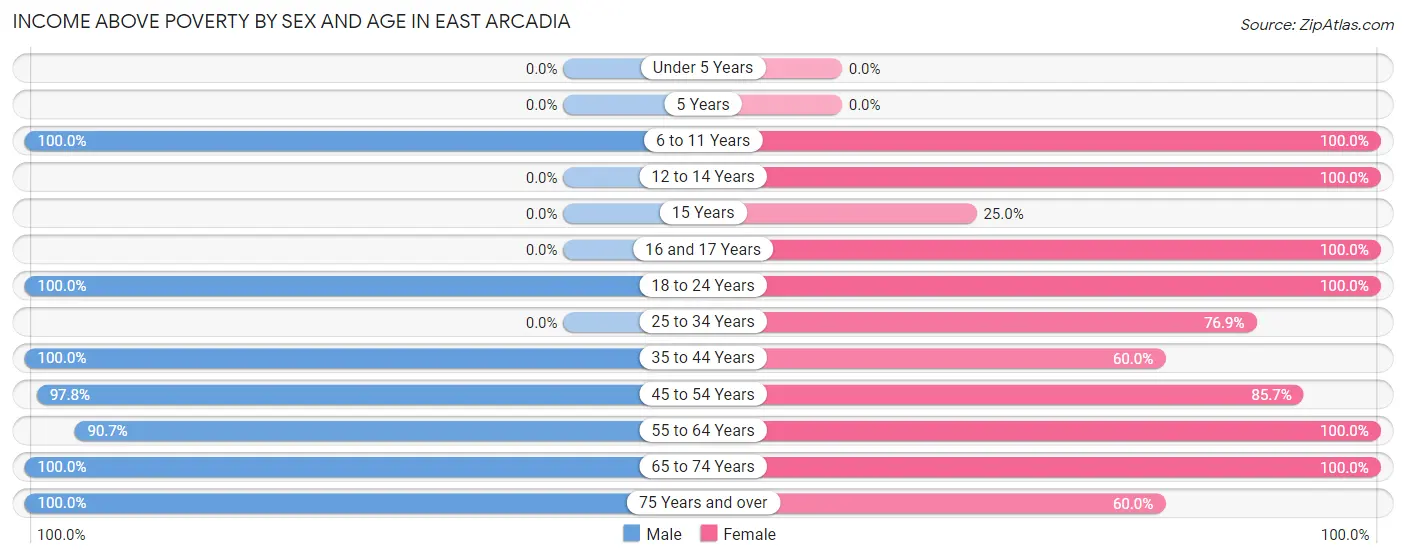
| Age Bracket | Male | Female |
| Under 5 Years | 0 (0.0%) | 0 (0.0%) |
| 5 Years | 0 (0.0%) | 0 (0.0%) |
| 6 to 11 Years | 1 (100.0%) | 2 (100.0%) |
| 12 to 14 Years | 0 (0.0%) | 5 (100.0%) |
| 15 Years | 0 (0.0%) | 1 (25.0%) |
| 16 and 17 Years | 0 (0.0%) | 1 (100.0%) |
| 18 to 24 Years | 25 (100.0%) | 4 (100.0%) |
| 25 to 34 Years | 0 (0.0%) | 10 (76.9%) |
| 35 to 44 Years | 1 (100.0%) | 3 (60.0%) |
| 45 to 54 Years | 87 (97.8%) | 6 (85.7%) |
| 55 to 64 Years | 49 (90.7%) | 40 (100.0%) |
| 65 to 74 Years | 24 (100.0%) | 20 (100.0%) |
| 75 Years and over | 2 (100.0%) | 24 (60.0%) |
| Total | 189 (96.4%) | 116 (82.3%) |
Income Below Poverty Among Married-Couple Families in East Arcadia
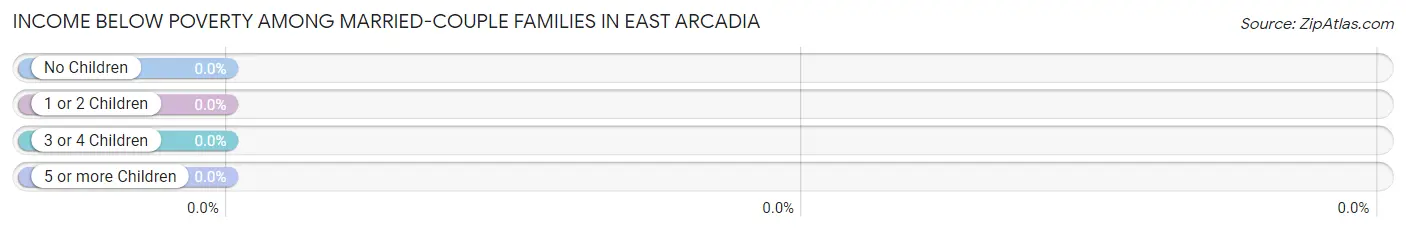
| Children | Above Poverty | Below Poverty |
| No Children | 38 (100.0%) | 0 (0.0%) |
| 1 or 2 Children | 3 (100.0%) | 0 (0.0%) |
| 3 or 4 Children | 0 (0.0%) | 0 (0.0%) |
| 5 or more Children | 0 (0.0%) | 0 (0.0%) |
| Total | 41 (100.0%) | 0 (0.0%) |
Income Below Poverty Among Single-Parent Households in East Arcadia
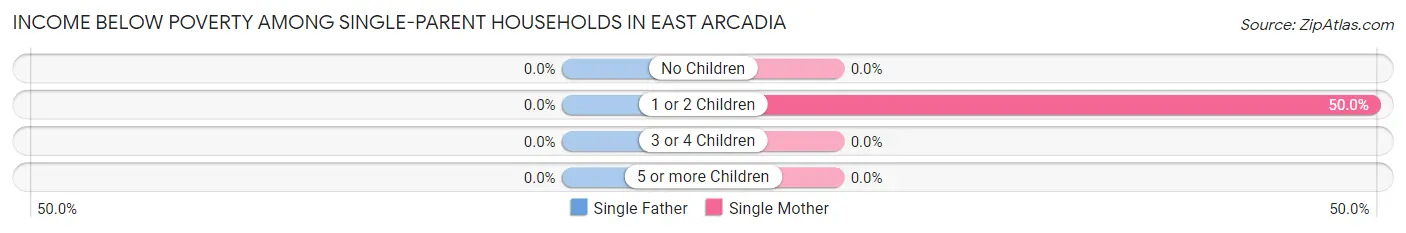
| Children | Single Father | Single Mother |
| No Children | 0 (0.0%) | 0 (0.0%) |
| 1 or 2 Children | 0 (0.0%) | 2 (50.0%) |
| 3 or 4 Children | 0 (0.0%) | 0 (0.0%) |
| 5 or more Children | 0 (0.0%) | 0 (0.0%) |
| Total | 0 (0.0%) | 2 (9.1%) |
Income Below Poverty Among Married-Couple vs Single-Parent Households in East Arcadia
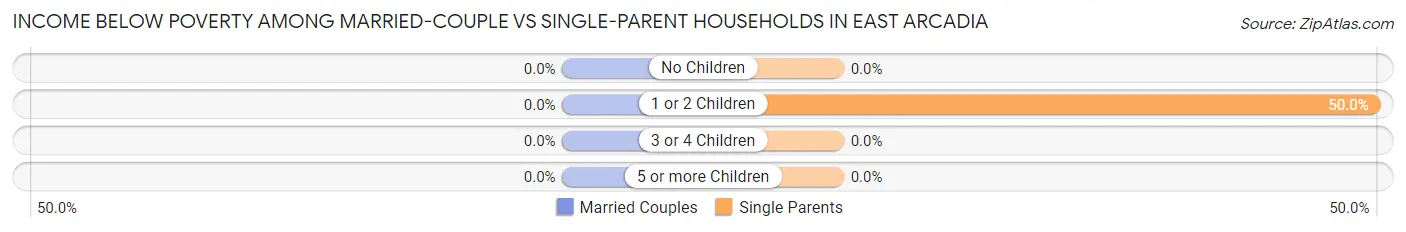
| Children | Married-Couple Families | Single-Parent Households |
| No Children | 0 (0.0%) | 0 (0.0%) |
| 1 or 2 Children | 0 (0.0%) | 2 (50.0%) |
| 3 or 4 Children | 0 (0.0%) | 0 (0.0%) |
| 5 or more Children | 0 (0.0%) | 0 (0.0%) |
| Total | 0 (0.0%) | 2 (7.7%) |
Race in East Arcadia
The most populous races in East Arcadia are , and Black / African American (337 | 100.0%).
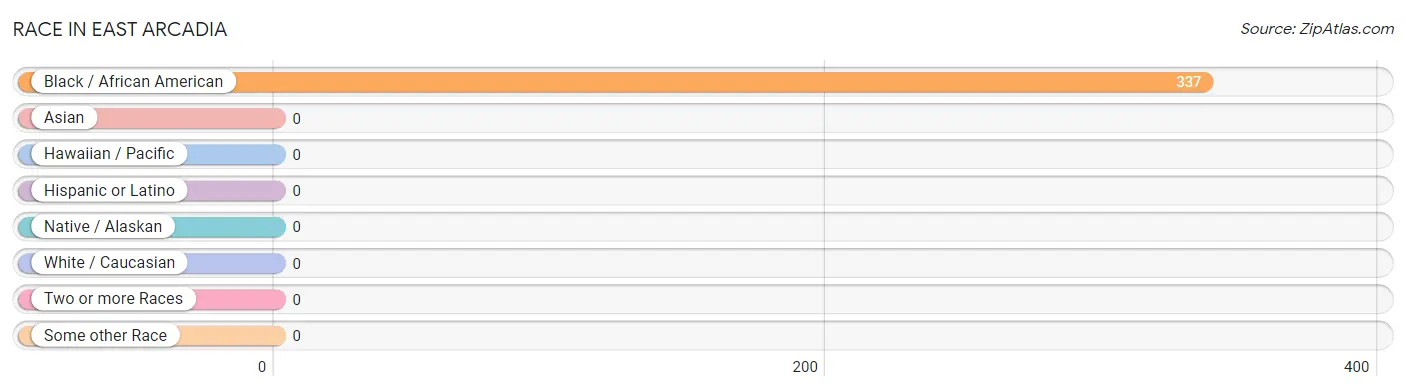
| Race | # Population | % Population |
| Asian | 0 | 0.0% |
| Black / African American | 337 | 100.0% |
| Hawaiian / Pacific | 0 | 0.0% |
| Hispanic or Latino | 0 | 0.0% |
| Native / Alaskan | 0 | 0.0% |
| White / Caucasian | 0 | 0.0% |
| Two or more Races | 0 | 0.0% |
| Some other Race | 0 | 0.0% |
| Total | 337 | 100.0% |
Ancestry in East Arcadia
The most populous ancestries reported in East Arcadia are African (2 | 0.6%), and Subsaharan African (2 | 0.6%), together accounting for 1.2% of all East Arcadia residents.
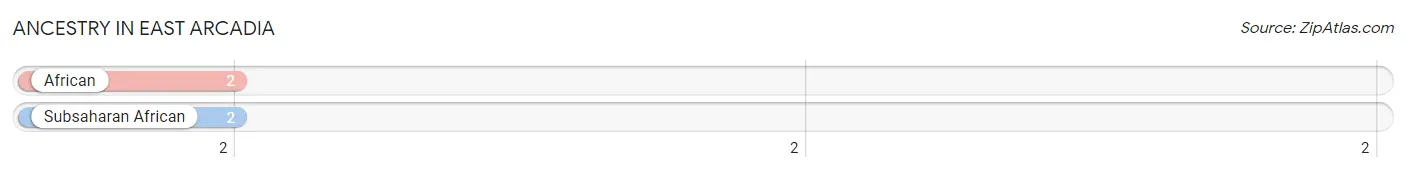
| Ancestry | # Population | % Population |
| African | 2 | 0.6% |
| Subsaharan African | 2 | 0.6% | View All 2 Rows |
Immigrants in East Arcadia
The most numerous immigrant groups reported in East Arcadia came from Caribbean (38 | 11.3%), Latin America (38 | 11.3%), and West Indies (38 | 11.3%), together accounting for 33.8% of all East Arcadia residents.
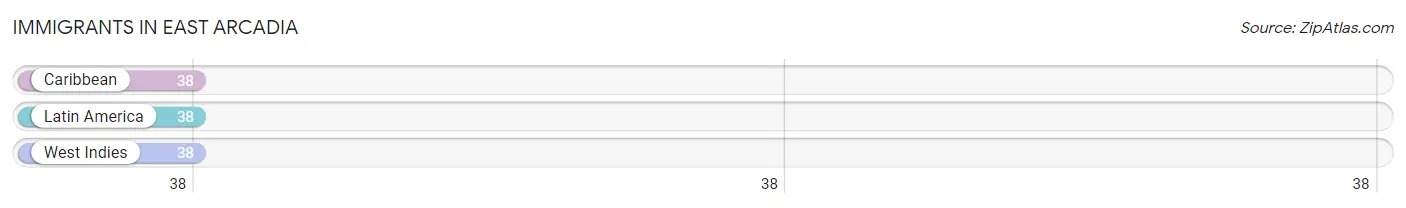
| Immigration Origin | # Population | % Population |
| Caribbean | 38 | 11.3% |
| Latin America | 38 | 11.3% |
| West Indies | 38 | 11.3% | View All 3 Rows |
Sex and Age in East Arcadia
Sex and Age in East Arcadia
The most populous age groups in East Arcadia are 45 to 49 Years (52 | 26.5%) for men and 75 to 79 Years (40 | 28.4%) for women.
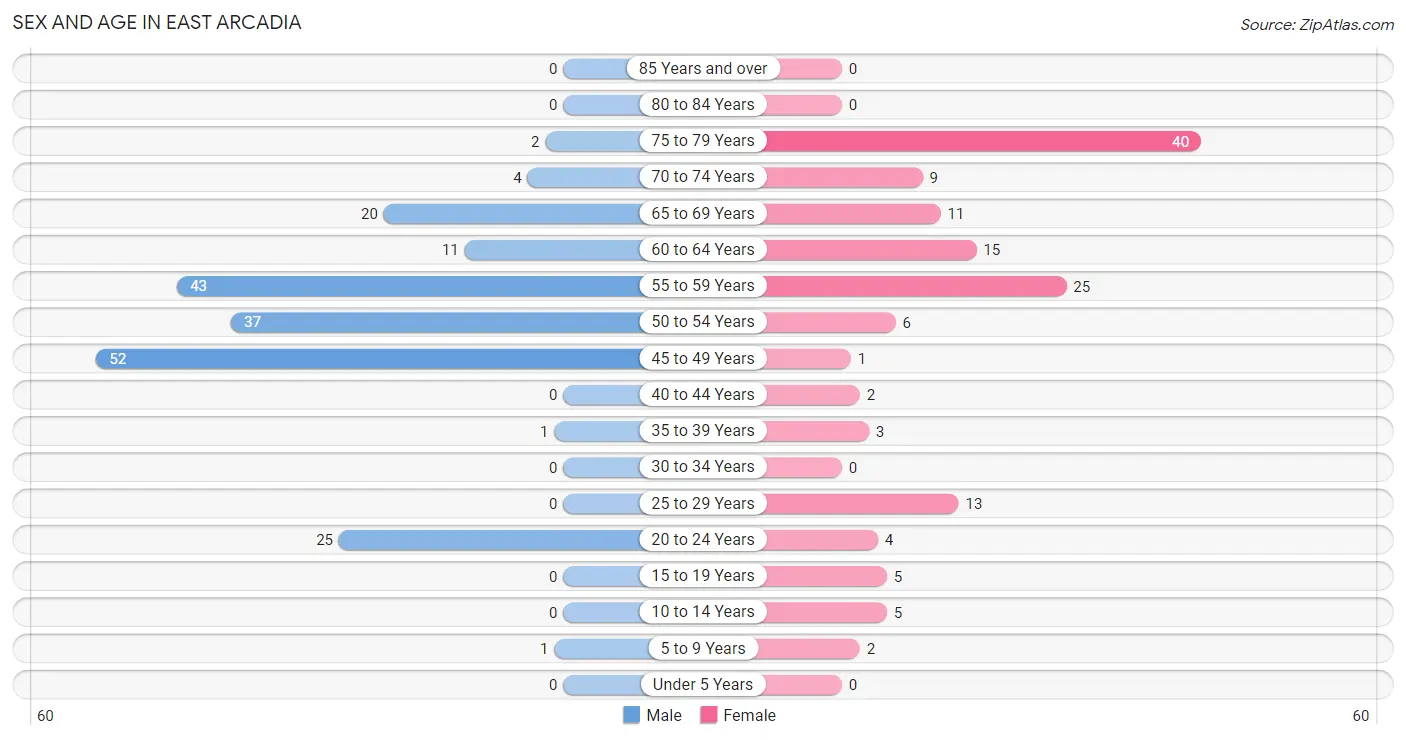
| Age Bracket | Male | Female |
| Under 5 Years | 0 (0.0%) | 0 (0.0%) |
| 5 to 9 Years | 1 (0.5%) | 2 (1.4%) |
| 10 to 14 Years | 0 (0.0%) | 5 (3.5%) |
| 15 to 19 Years | 0 (0.0%) | 5 (3.5%) |
| 20 to 24 Years | 25 (12.8%) | 4 (2.8%) |
| 25 to 29 Years | 0 (0.0%) | 13 (9.2%) |
| 30 to 34 Years | 0 (0.0%) | 0 (0.0%) |
| 35 to 39 Years | 1 (0.5%) | 3 (2.1%) |
| 40 to 44 Years | 0 (0.0%) | 2 (1.4%) |
| 45 to 49 Years | 52 (26.5%) | 1 (0.7%) |
| 50 to 54 Years | 37 (18.9%) | 6 (4.3%) |
| 55 to 59 Years | 43 (21.9%) | 25 (17.7%) |
| 60 to 64 Years | 11 (5.6%) | 15 (10.6%) |
| 65 to 69 Years | 20 (10.2%) | 11 (7.8%) |
| 70 to 74 Years | 4 (2.0%) | 9 (6.4%) |
| 75 to 79 Years | 2 (1.0%) | 40 (28.4%) |
| 80 to 84 Years | 0 (0.0%) | 0 (0.0%) |
| 85 Years and over | 0 (0.0%) | 0 (0.0%) |
| Total | 196 (100.0%) | 141 (100.0%) |
Families and Households in East Arcadia
Median Family Size in East Arcadia
The median family size in East Arcadia is 4.16 persons per family, with single female/mother families (22 | 32.8%) accounting for the largest median family size of 6.41 persons per family. On the other hand, married-couple families (41 | 61.2%) represent the smallest median family size with 2.90 persons per family.
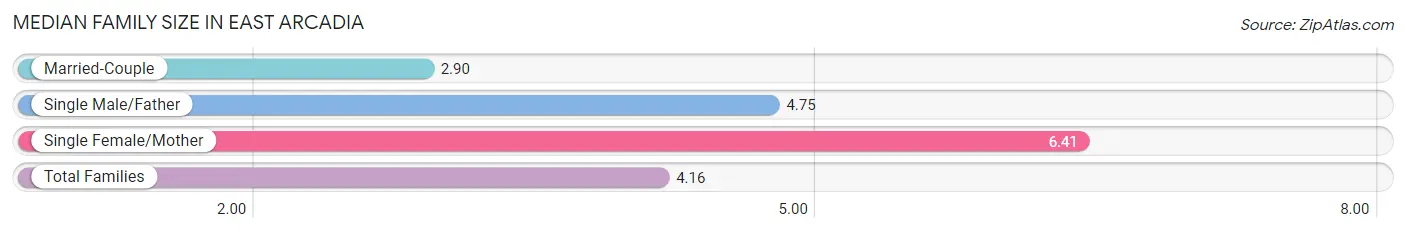
| Family Type | # Families | Family Size |
| Married-Couple | 41 (61.2%) | 2.90 |
| Single Male/Father | 4 (6.0%) | 4.75 |
| Single Female/Mother | 22 (32.8%) | 6.41 |
| Total Families | 67 (100.0%) | 4.16 |
Median Household Size in East Arcadia
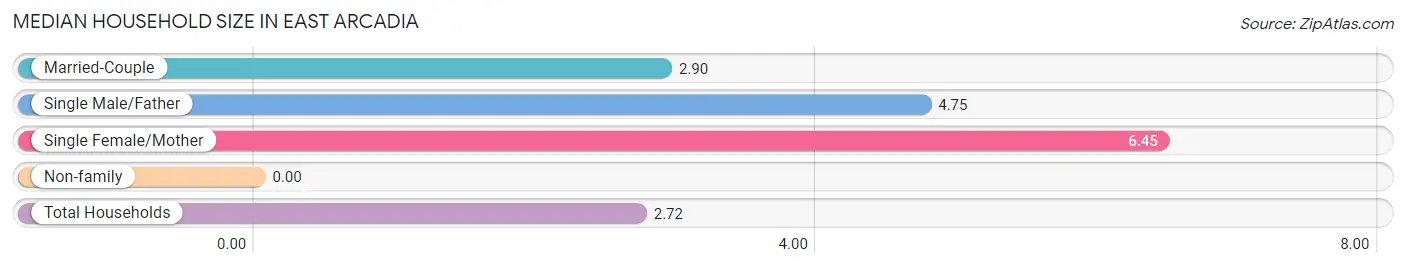
| Household Type | # Households | Household Size |
| Married-Couple | 41 (33.1%) | 2.90 |
| Single Male/Father | 4 (3.2%) | 4.75 |
| Single Female/Mother | 22 (17.7%) | 6.45 |
| Non-family | 57 (46.0%) | - |
| Total Households | 124 (100.0%) | 2.72 |
Household Size by Marriage Status in East Arcadia
Out of a total of 124 households in East Arcadia, 67 (54.0%) are family households, while 57 (46.0%) are nonfamily households. The most numerous type of family households are 2-person households, comprising 53, and the most common type of nonfamily households are 1-person households, comprising 57.
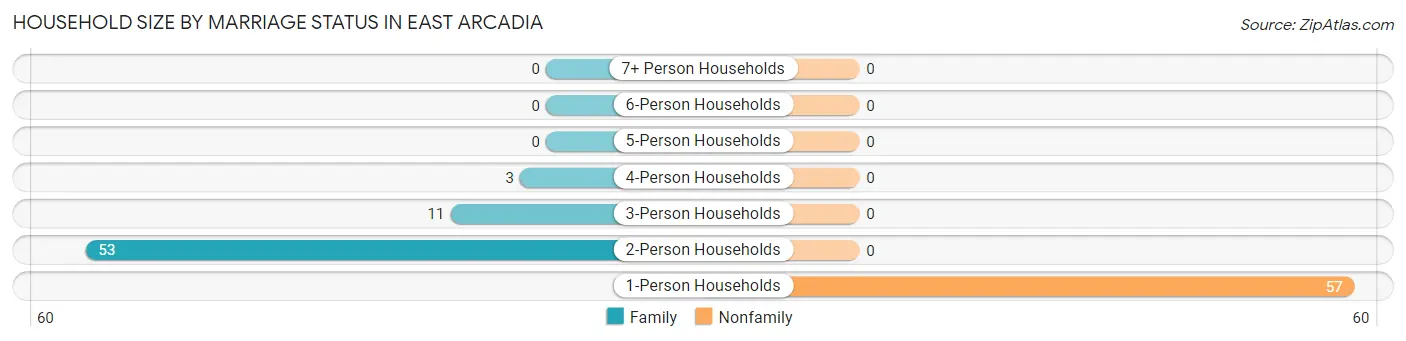
| Household Size | Family Households | Nonfamily Households |
| 1-Person Households | - | 57 (46.0%) |
| 2-Person Households | 53 (42.7%) | 0 (0.0%) |
| 3-Person Households | 11 (8.9%) | 0 (0.0%) |
| 4-Person Households | 3 (2.4%) | 0 (0.0%) |
| 5-Person Households | 0 (0.0%) | 0 (0.0%) |
| 6-Person Households | 0 (0.0%) | 0 (0.0%) |
| 7+ Person Households | 0 (0.0%) | 0 (0.0%) |
| Total | 67 (54.0%) | 57 (46.0%) |
Female Fertility in East Arcadia
Fertility by Age in East Arcadia
Average fertility rate in East Arcadia is 97.0 births per 1,000 women. Women in the age bracket of 20 to 34 years have the highest fertility rate with 176.0 births per 1,000 women. Women in the age bracket of 20 to 34 years acount for 100.0% of all women with births.
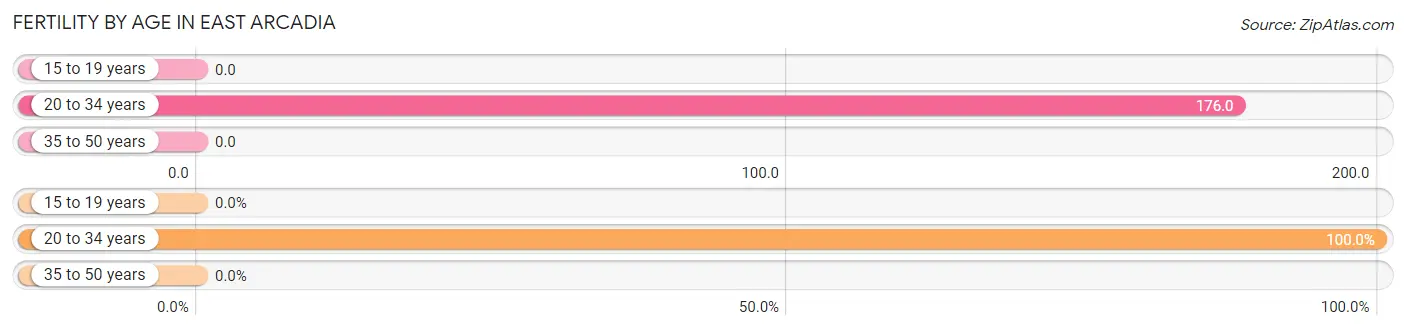
| Age Bracket | Women with Births | Births / 1,000 Women |
| 15 to 19 years | 0 (0.0%) | 0.0 |
| 20 to 34 years | 3 (100.0%) | 176.0 |
| 35 to 50 years | 0 (0.0%) | 0.0 |
| Total | 3 (100.0%) | 97.0 |
Fertility by Age by Marriage Status in East Arcadia
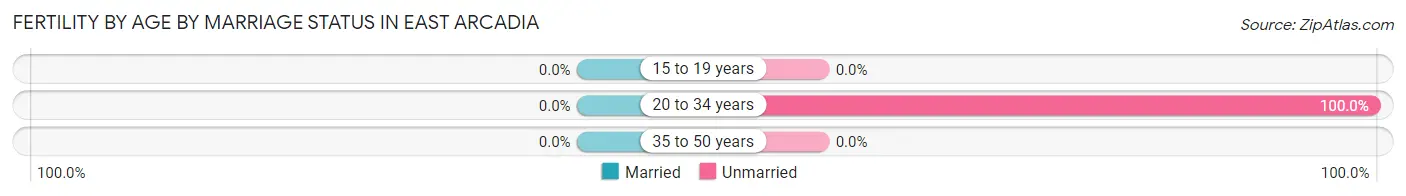
| Age Bracket | Married | Unmarried |
| 15 to 19 years | 0 (0.0%) | 0 (0.0%) |
| 20 to 34 years | 0 (0.0%) | 3 (100.0%) |
| 35 to 50 years | 0 (0.0%) | 0 (0.0%) |
| Total | 0 (0.0%) | 3 (100.0%) |
Fertility by Education in East Arcadia
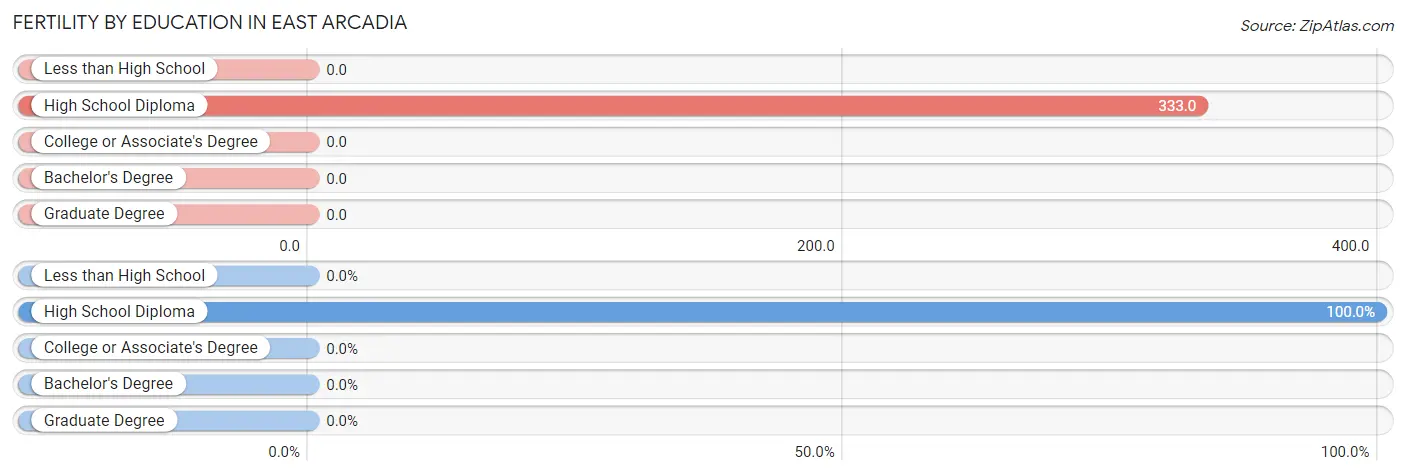
| Educational Attainment | Women with Births | Births / 1,000 Women |
| Less than High School | 0 (0.0%) | 0.0 |
| High School Diploma | 3 (100.0%) | 333.0 |
| College or Associate's Degree | 0 (0.0%) | 0.0 |
| Bachelor's Degree | 0 (0.0%) | 0.0 |
| Graduate Degree | 0 (0.0%) | 0.0 |
| Total | 3 (100.0%) | 97.0 |
Fertility by Education by Marriage Status in East Arcadia
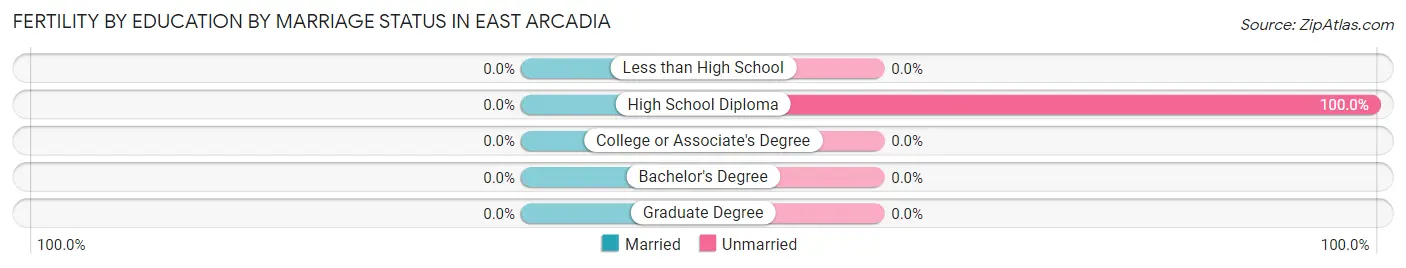
| Educational Attainment | Married | Unmarried |
| Less than High School | 0 (0.0%) | 0 (0.0%) |
| High School Diploma | 0 (0.0%) | 3 (100.0%) |
| College or Associate's Degree | 0 (0.0%) | 0 (0.0%) |
| Bachelor's Degree | 0 (0.0%) | 0 (0.0%) |
| Graduate Degree | 0 (0.0%) | 0 (0.0%) |
| Total | 0 (0.0%) | 3 (100.0%) |
Employment Characteristics in East Arcadia
Employment by Class of Employer in East Arcadia
Among the 135 employed individuals in East Arcadia, private company employees (86 | 63.7%), local government employees (38 | 28.1%), and self-employed (incorporated) (5 | 3.7%) make up the most common classes of employment.
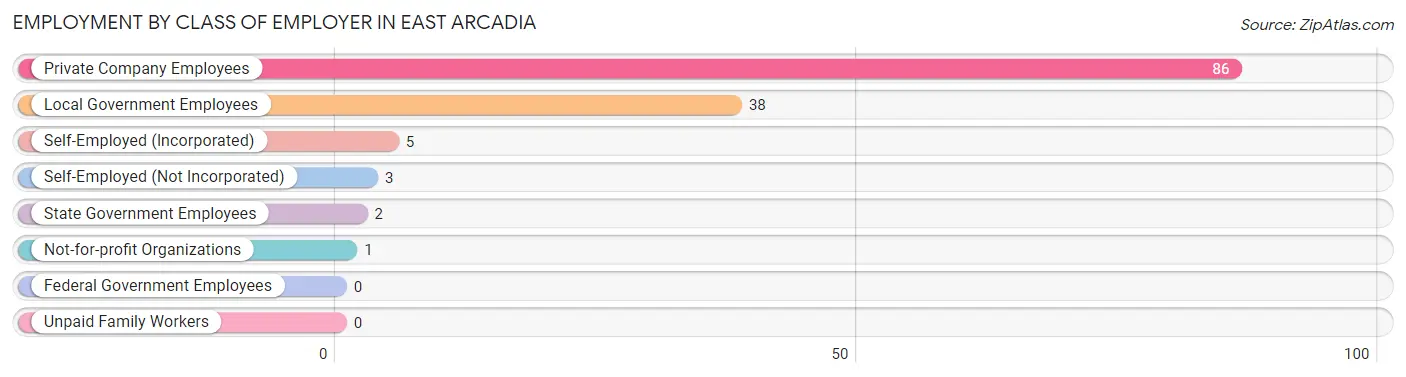
| Employer Class | # Employees | % Employees |
| Private Company Employees | 86 | 63.7% |
| Self-Employed (Incorporated) | 5 | 3.7% |
| Self-Employed (Not Incorporated) | 3 | 2.2% |
| Not-for-profit Organizations | 1 | 0.7% |
| Local Government Employees | 38 | 28.1% |
| State Government Employees | 2 | 1.5% |
| Federal Government Employees | 0 | 0.0% |
| Unpaid Family Workers | 0 | 0.0% |
| Total | 135 | 100.0% |
Employment Status by Age in East Arcadia
According to the labor force statistics for East Arcadia, out of the total population over 16 years of age (325), 50.8% or 165 individuals are in the labor force, with 17.0% or 28 of them unemployed. The age group with the highest labor force participation rate is 20 to 24 years, with 100.0% or 29 individuals in the labor force. Within the labor force, the 20 to 24 years age range has the highest percentage of unemployed individuals, with 86.2% or 25 of them being unemployed.
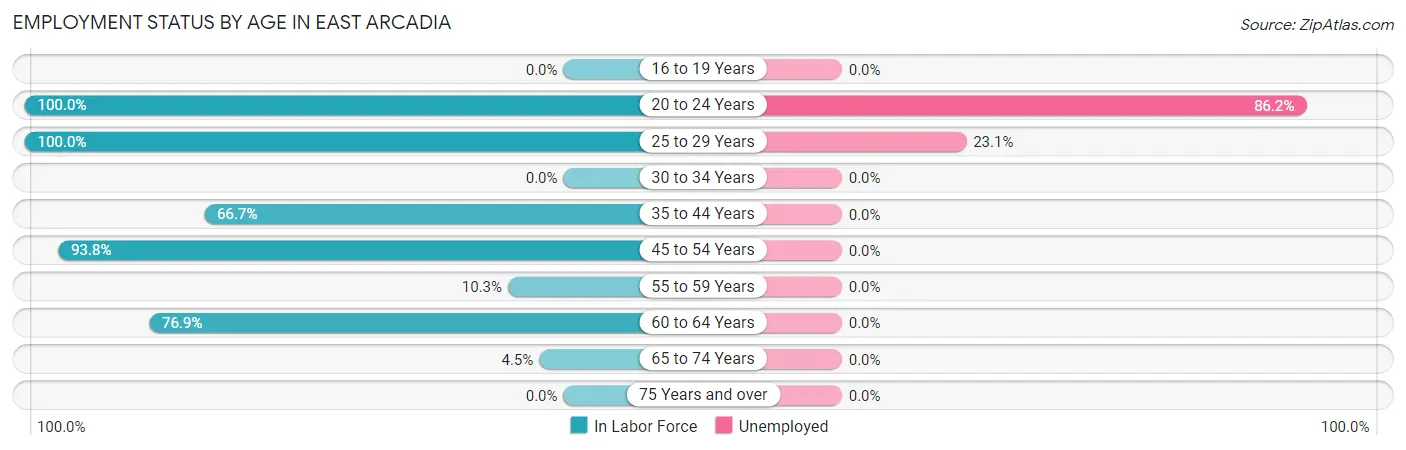
| Age Bracket | In Labor Force | Unemployed |
| 16 to 19 Years | 0 (0.0%) | 0 (0.0%) |
| 20 to 24 Years | 29 (100.0%) | 25 (86.2%) |
| 25 to 29 Years | 13 (100.0%) | 3 (23.1%) |
| 30 to 34 Years | 0 (0.0%) | 0 (0.0%) |
| 35 to 44 Years | 4 (66.7%) | 0 (0.0%) |
| 45 to 54 Years | 90 (93.8%) | 0 (0.0%) |
| 55 to 59 Years | 7 (10.3%) | 0 (0.0%) |
| 60 to 64 Years | 20 (76.9%) | 0 (0.0%) |
| 65 to 74 Years | 2 (4.5%) | 0 (0.0%) |
| 75 Years and over | 0 (0.0%) | 0 (0.0%) |
| Total | 165 (50.8%) | 28 (17.0%) |
Employment Status by Educational Attainment in East Arcadia
According to labor force statistics for East Arcadia, 64.1% of individuals (134) out of the total population between 25 and 64 years of age (209) are in the labor force, with 2.2% or 3 of them being unemployed. The group with the highest labor force participation rate are those with the educational attainment of college / associate degree, with 95.8% or 91 individuals in the labor force. Within the labor force, individuals with high school diploma education have the highest percentage of unemployment, with 11.1% or 3 of them being unemployed.
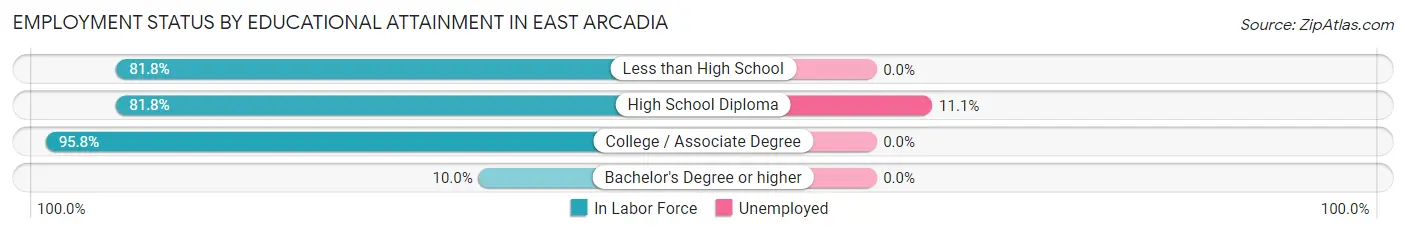
| Educational Attainment | In Labor Force | Unemployed |
| Less than High School | 9 (81.8%) | 0 (0.0%) |
| High School Diploma | 27 (81.8%) | 4 (11.1%) |
| College / Associate Degree | 91 (95.8%) | 0 (0.0%) |
| Bachelor's Degree or higher | 7 (10.0%) | 0 (0.0%) |
| Total | 134 (64.1%) | 5 (2.2%) |
Employment Occupations by Sex in East Arcadia
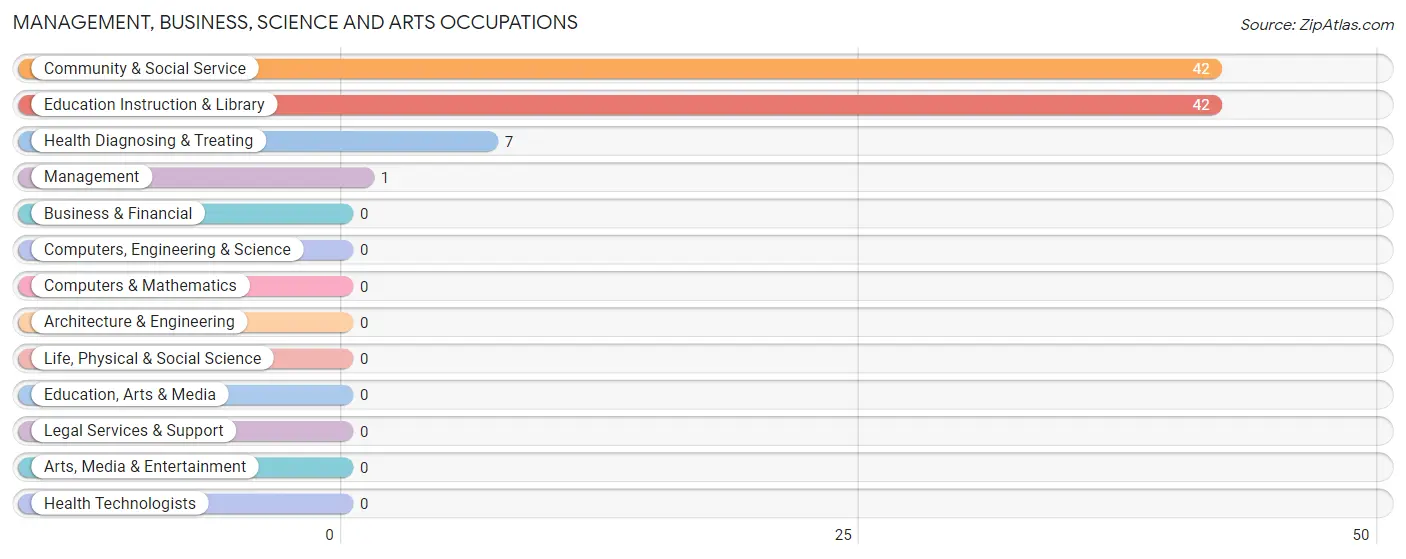
Management, Business, Science and Arts Occupations
The most common Management, Business, Science and Arts occupations in East Arcadia are Community & Social Service (42 | 30.7%), Education Instruction & Library (42 | 30.7%), Health Diagnosing & Treating (7 | 5.1%), and Management (1 | 0.7%).
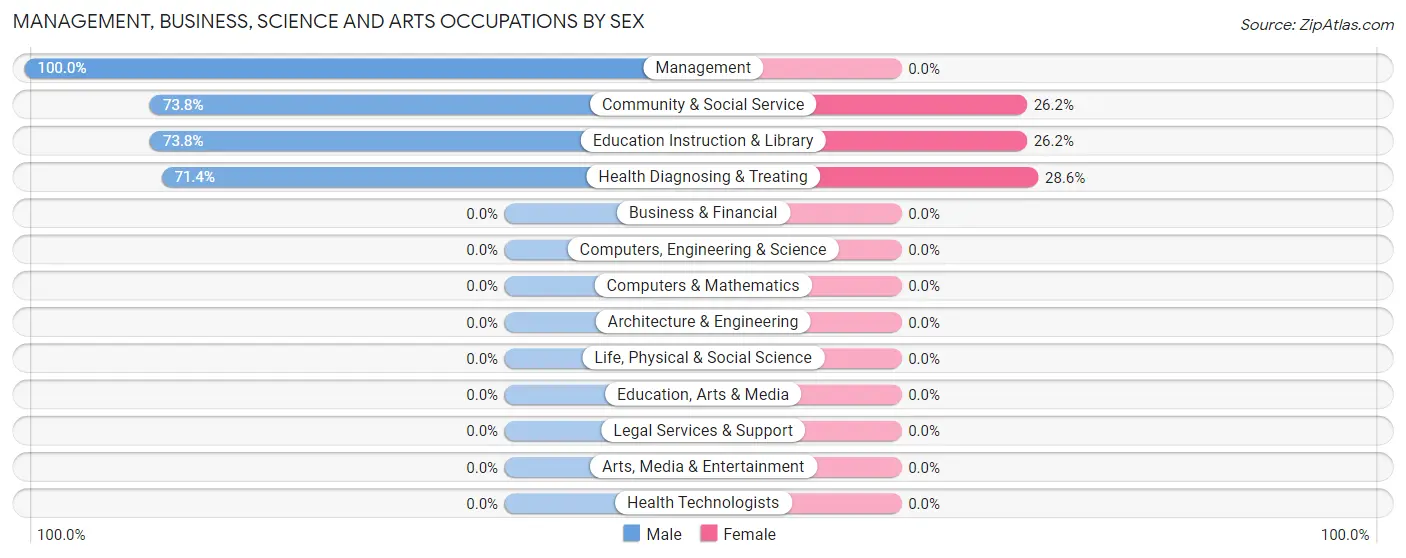
Management, Business, Science and Arts Occupations by Sex
Within the Management, Business, Science and Arts occupations in East Arcadia, the most male-oriented occupations are Management (100.0%), Community & Social Service (73.8%), and Education Instruction & Library (73.8%), while the most female-oriented occupations are Health Diagnosing & Treating (28.6%), Community & Social Service (26.2%), and Education Instruction & Library (26.2%).
| Occupation | Male | Female |
| Management | 1 (100.0%) | 0 (0.0%) |
| Business & Financial | 0 (0.0%) | 0 (0.0%) |
| Computers, Engineering & Science | 0 (0.0%) | 0 (0.0%) |
| Computers & Mathematics | 0 (0.0%) | 0 (0.0%) |
| Architecture & Engineering | 0 (0.0%) | 0 (0.0%) |
| Life, Physical & Social Science | 0 (0.0%) | 0 (0.0%) |
| Community & Social Service | 31 (73.8%) | 11 (26.2%) |
| Education, Arts & Media | 0 (0.0%) | 0 (0.0%) |
| Legal Services & Support | 0 (0.0%) | 0 (0.0%) |
| Education Instruction & Library | 31 (73.8%) | 11 (26.2%) |
| Arts, Media & Entertainment | 0 (0.0%) | 0 (0.0%) |
| Health Diagnosing & Treating | 5 (71.4%) | 2 (28.6%) |
| Health Technologists | 0 (0.0%) | 0 (0.0%) |
| Total (Category) | 37 (74.0%) | 13 (26.0%) |
| Total (Overall) | 95 (69.3%) | 42 (30.7%) |
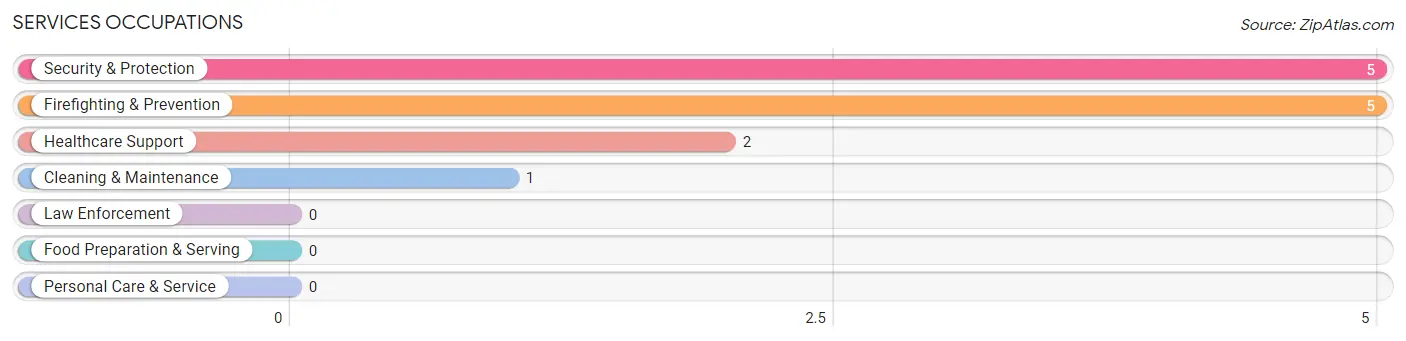
Services Occupations
The most common Services occupations in East Arcadia are Security & Protection (5 | 3.6%), Firefighting & Prevention (5 | 3.6%), Healthcare Support (2 | 1.5%), and Cleaning & Maintenance (1 | 0.7%).
Services Occupations by Sex
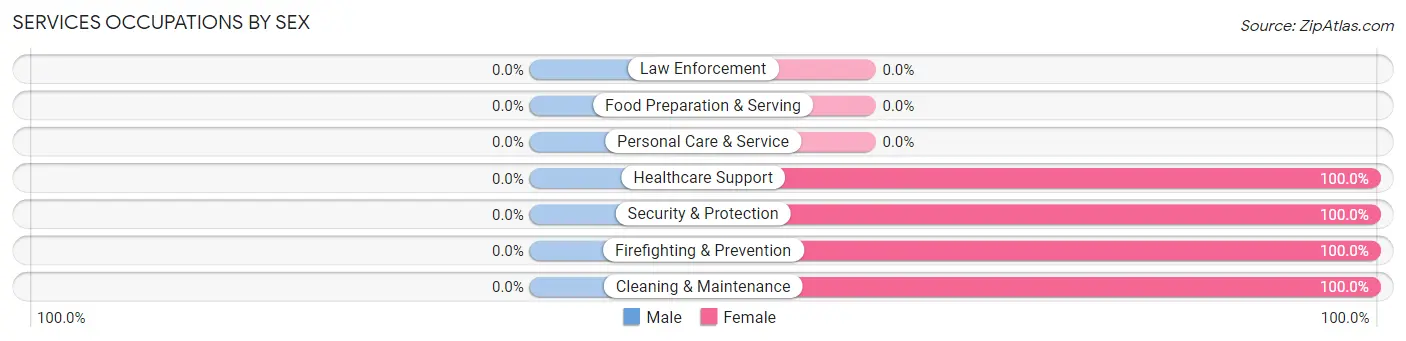
| Occupation | Male | Female |
| Healthcare Support | 0 (0.0%) | 2 (100.0%) |
| Security & Protection | 0 (0.0%) | 5 (100.0%) |
| Firefighting & Prevention | 0 (0.0%) | 5 (100.0%) |
| Law Enforcement | 0 (0.0%) | 0 (0.0%) |
| Food Preparation & Serving | 0 (0.0%) | 0 (0.0%) |
| Cleaning & Maintenance | 0 (0.0%) | 1 (100.0%) |
| Personal Care & Service | 0 (0.0%) | 0 (0.0%) |
| Total (Category) | 0 (0.0%) | 8 (100.0%) |
| Total (Overall) | 95 (69.3%) | 42 (30.7%) |
Sales and Office Occupations
The most common Sales and Office occupations in East Arcadia are , and Office & Administration (7 | 5.1%).

Sales and Office Occupations by Sex

| Occupation | Male | Female |
| Sales & Related | 0 (0.0%) | 0 (0.0%) |
| Office & Administration | 0 (0.0%) | 7 (100.0%) |
| Total (Category) | 0 (0.0%) | 7 (100.0%) |
| Total (Overall) | 95 (69.3%) | 42 (30.7%) |
Natural Resources, Construction and Maintenance Occupations
The most common Natural Resources, Construction and Maintenance occupations in East Arcadia are Installation, Maintenance & Repair (48 | 35.0%), and Construction & Extraction (1 | 0.7%).

Natural Resources, Construction and Maintenance Occupations by Sex

| Occupation | Male | Female |
| Farming, Fishing & Forestry | 0 (0.0%) | 0 (0.0%) |
| Construction & Extraction | 0 (0.0%) | 1 (100.0%) |
| Installation, Maintenance & Repair | 48 (100.0%) | 0 (0.0%) |
| Total (Category) | 48 (98.0%) | 1 (2.0%) |
| Total (Overall) | 95 (69.3%) | 42 (30.7%) |
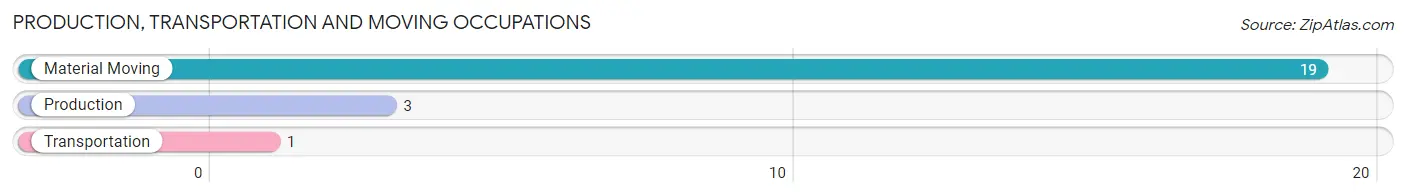
Production, Transportation and Moving Occupations
The most common Production, Transportation and Moving occupations in East Arcadia are Material Moving (19 | 13.9%), Production (3 | 2.2%), and Transportation (1 | 0.7%).
Production, Transportation and Moving Occupations by Sex

| Occupation | Male | Female |
| Production | 1 (33.3%) | 2 (66.7%) |
| Transportation | 0 (0.0%) | 1 (100.0%) |
| Material Moving | 9 (47.4%) | 10 (52.6%) |
| Total (Category) | 10 (43.5%) | 13 (56.5%) |
| Total (Overall) | 95 (69.3%) | 42 (30.7%) |
Employment Industries by Sex in East Arcadia
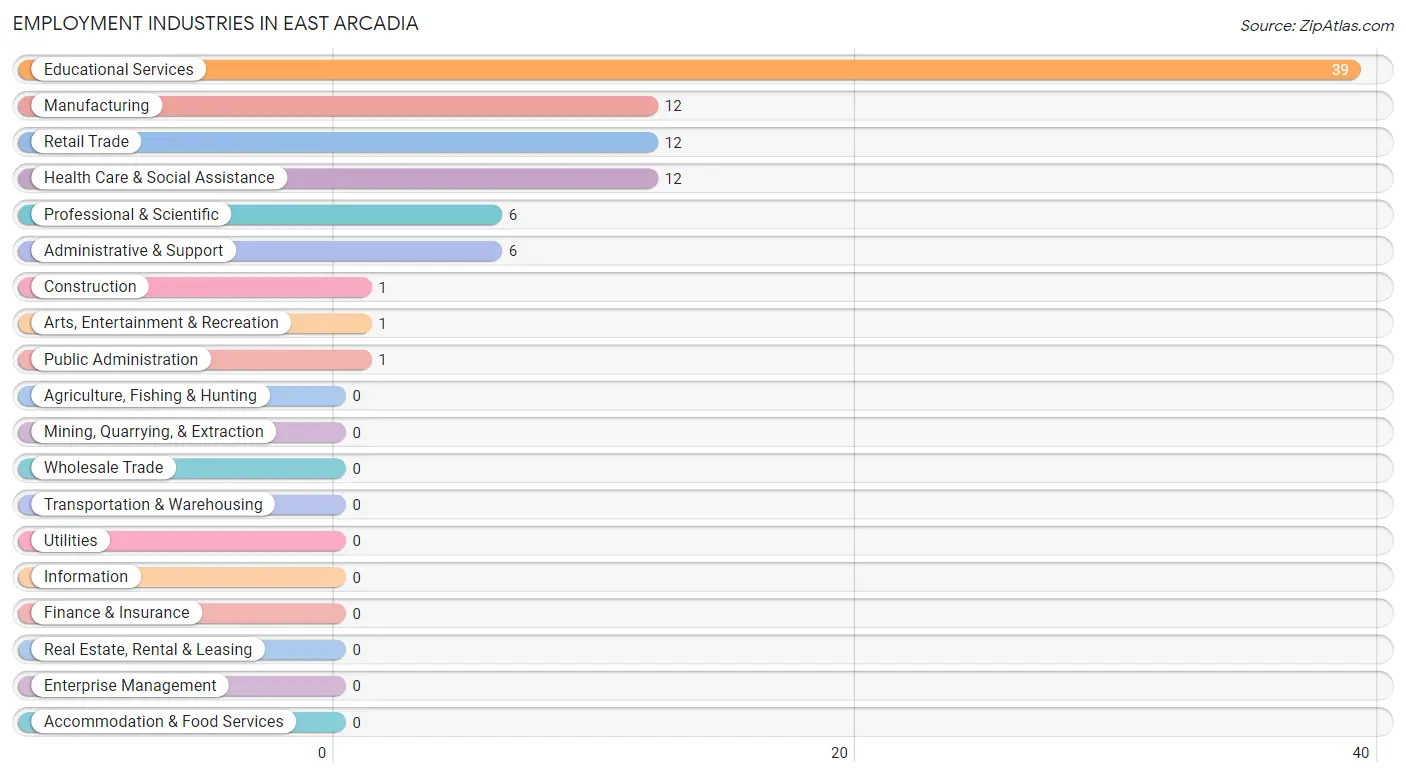
Employment Industries in East Arcadia
The major employment industries in East Arcadia include Educational Services (39 | 28.5%), Manufacturing (12 | 8.8%), Retail Trade (12 | 8.8%), Health Care & Social Assistance (12 | 8.8%), and Professional & Scientific (6 | 4.4%).
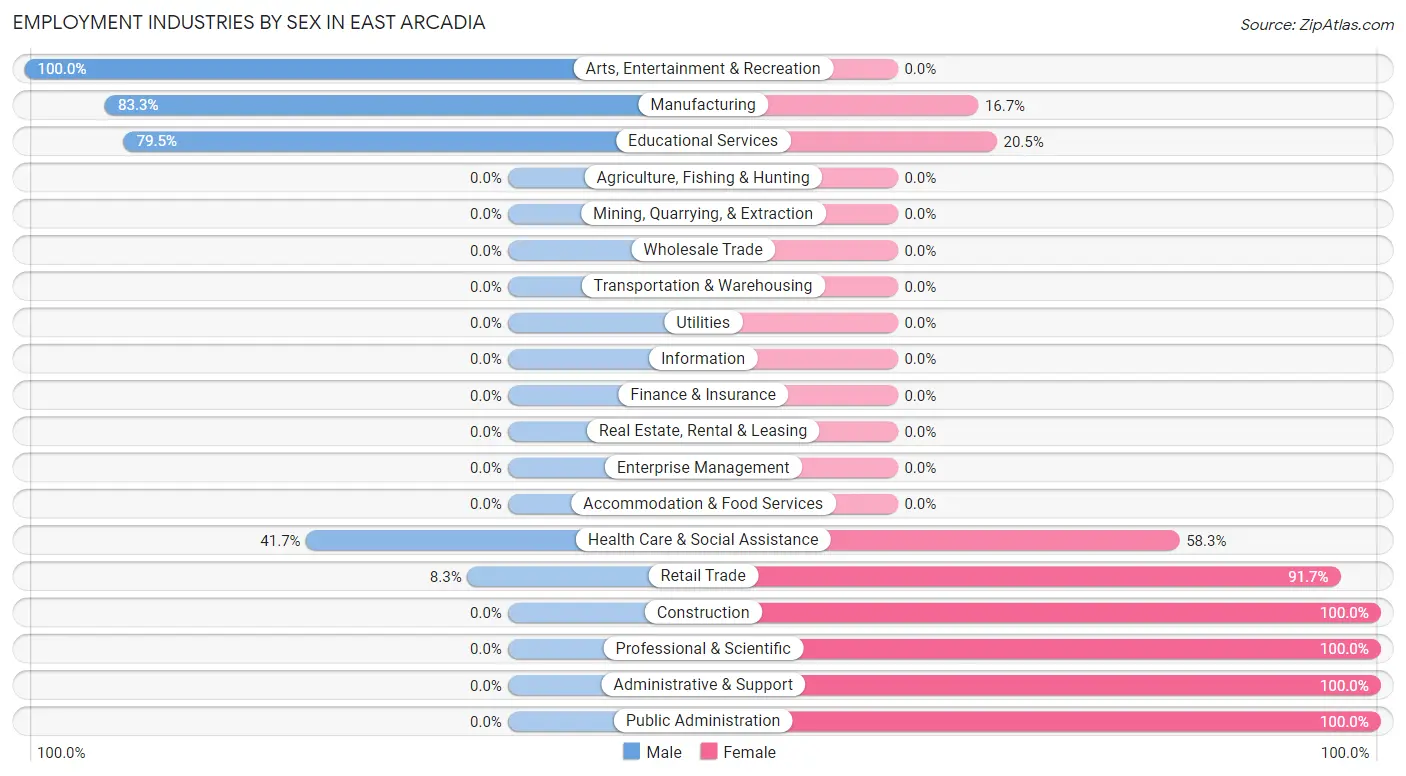
Employment Industries by Sex in East Arcadia
The East Arcadia industries that see more men than women are Arts, Entertainment & Recreation (100.0%), Manufacturing (83.3%), and Educational Services (79.5%), whereas the industries that tend to have a higher number of women are Construction (100.0%), Professional & Scientific (100.0%), and Administrative & Support (100.0%).
| Industry | Male | Female |
| Agriculture, Fishing & Hunting | 0 (0.0%) | 0 (0.0%) |
| Mining, Quarrying, & Extraction | 0 (0.0%) | 0 (0.0%) |
| Construction | 0 (0.0%) | 1 (100.0%) |
| Manufacturing | 10 (83.3%) | 2 (16.7%) |
| Wholesale Trade | 0 (0.0%) | 0 (0.0%) |
| Retail Trade | 1 (8.3%) | 11 (91.7%) |
| Transportation & Warehousing | 0 (0.0%) | 0 (0.0%) |
| Utilities | 0 (0.0%) | 0 (0.0%) |
| Information | 0 (0.0%) | 0 (0.0%) |
| Finance & Insurance | 0 (0.0%) | 0 (0.0%) |
| Real Estate, Rental & Leasing | 0 (0.0%) | 0 (0.0%) |
| Professional & Scientific | 0 (0.0%) | 6 (100.0%) |
| Enterprise Management | 0 (0.0%) | 0 (0.0%) |
| Administrative & Support | 0 (0.0%) | 6 (100.0%) |
| Educational Services | 31 (79.5%) | 8 (20.5%) |
| Health Care & Social Assistance | 5 (41.7%) | 7 (58.3%) |
| Arts, Entertainment & Recreation | 1 (100.0%) | 0 (0.0%) |
| Accommodation & Food Services | 0 (0.0%) | 0 (0.0%) |
| Public Administration | 0 (0.0%) | 1 (100.0%) |
| Total | 95 (69.3%) | 42 (30.7%) |
Education in East Arcadia
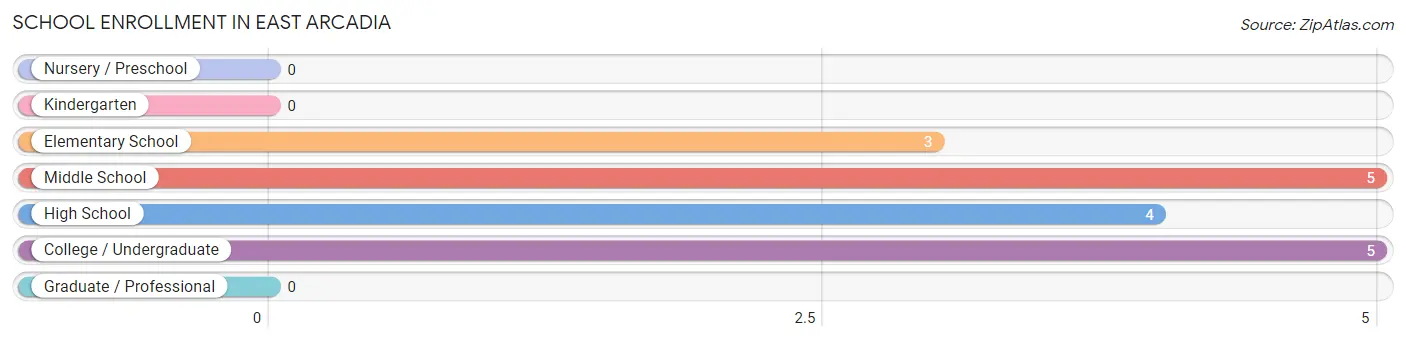
School Enrollment in East Arcadia
The most common levels of schooling among the 17 students in East Arcadia are middle school (5 | 29.4%), college / undergraduate (5 | 29.4%), and high school (4 | 23.5%).
| School Level | # Students | % Students |
| Nursery / Preschool | 0 | 0.0% |
| Kindergarten | 0 | 0.0% |
| Elementary School | 3 | 17.6% |
| Middle School | 5 | 29.4% |
| High School | 4 | 23.5% |
| College / Undergraduate | 5 | 29.4% |
| Graduate / Professional | 0 | 0.0% |
| Total | 17 | 100.0% |
School Enrollment by Age by Funding Source in East Arcadia
Out of a total of 17 students who are enrolled in schools in East Arcadia, 4 (23.5%) attend a private institution, while the remaining 13 (76.5%) are enrolled in public schools. The age group of 20 to 24 year olds has the highest likelihood of being enrolled in private schools, with 3 (75.0% in the age bracket) enrolled. Conversely, the age group of 10 to 14 year olds has the lowest likelihood of being enrolled in a private school, with 5 (100.0% in the age bracket) attending a public institution.
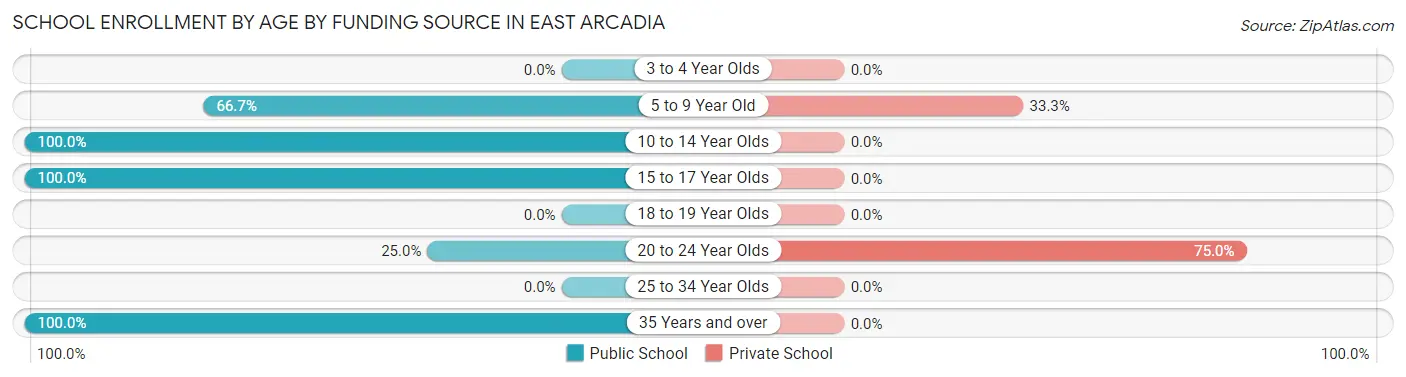
| Age Bracket | Public School | Private School |
| 3 to 4 Year Olds | 0 (0.0%) | 0 (0.0%) |
| 5 to 9 Year Old | 2 (66.7%) | 1 (33.3%) |
| 10 to 14 Year Olds | 5 (100.0%) | 0 (0.0%) |
| 15 to 17 Year Olds | 4 (100.0%) | 0 (0.0%) |
| 18 to 19 Year Olds | 0 (0.0%) | 0 (0.0%) |
| 20 to 24 Year Olds | 1 (25.0%) | 3 (75.0%) |
| 25 to 34 Year Olds | 0 (0.0%) | 0 (0.0%) |
| 35 Years and over | 1 (100.0%) | 0 (0.0%) |
| Total | 13 (76.5%) | 4 (23.5%) |
Educational Attainment by Field of Study in East Arcadia
Arts & humanities (38 | 54.3%), business (21 | 30.0%), education (7 | 10.0%), and science & technology (4 | 5.7%) are the most common fields of study among 70 individuals in East Arcadia who have obtained a bachelor's degree or higher.
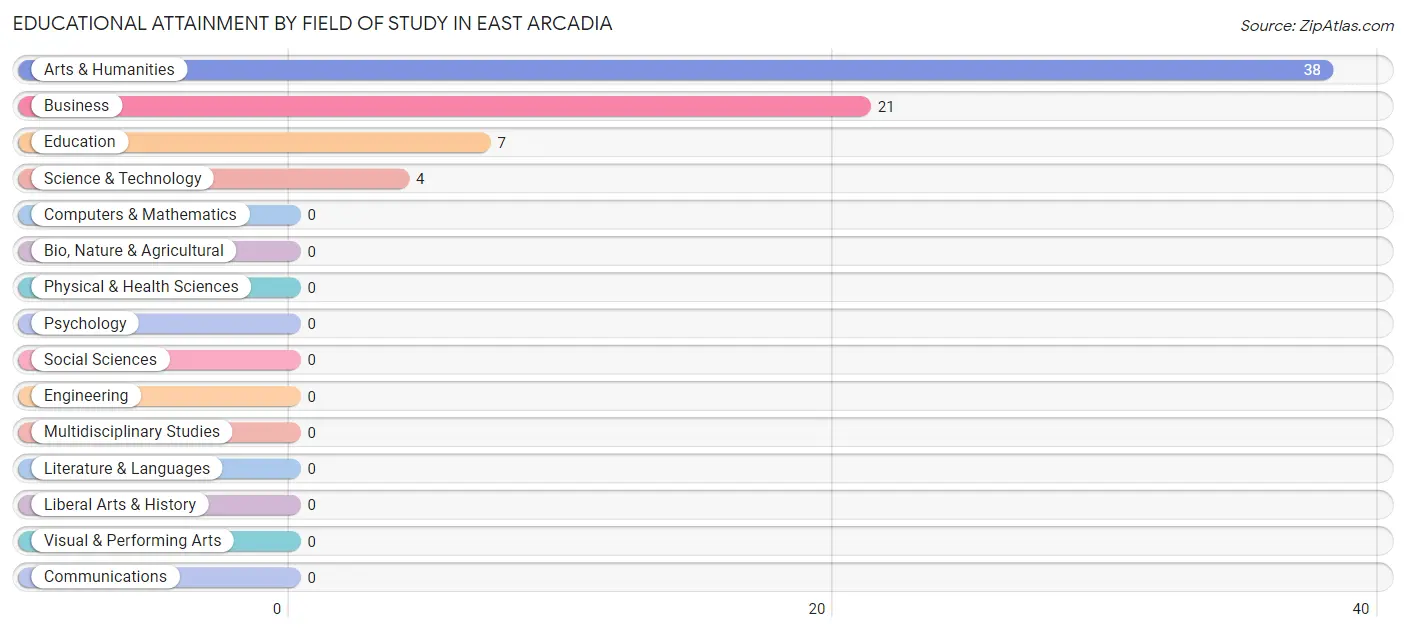
| Field of Study | # Graduates | % Graduates |
| Computers & Mathematics | 0 | 0.0% |
| Bio, Nature & Agricultural | 0 | 0.0% |
| Physical & Health Sciences | 0 | 0.0% |
| Psychology | 0 | 0.0% |
| Social Sciences | 0 | 0.0% |
| Engineering | 0 | 0.0% |
| Multidisciplinary Studies | 0 | 0.0% |
| Science & Technology | 4 | 5.7% |
| Business | 21 | 30.0% |
| Education | 7 | 10.0% |
| Literature & Languages | 0 | 0.0% |
| Liberal Arts & History | 0 | 0.0% |
| Visual & Performing Arts | 0 | 0.0% |
| Communications | 0 | 0.0% |
| Arts & Humanities | 38 | 54.3% |
| Total | 70 | 100.0% |
Transportation & Commute in East Arcadia
Vehicle Availability by Sex in East Arcadia
The most prevalent vehicle ownership categories in East Arcadia are males with 1 vehicle (79, accounting for 84.0%) and females with 1 vehicle (10, making up 192.7%).
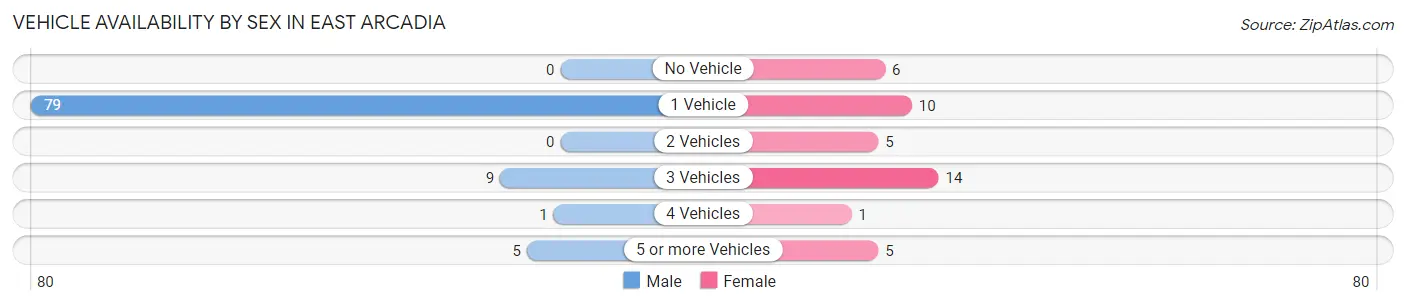
| Vehicles Available | Male | Female |
| No Vehicle | 0 (0.0%) | 6 (14.6%) |
| 1 Vehicle | 79 (84.0%) | 10 (24.4%) |
| 2 Vehicles | 0 (0.0%) | 5 (12.2%) |
| 3 Vehicles | 9 (9.6%) | 14 (34.2%) |
| 4 Vehicles | 1 (1.1%) | 1 (2.4%) |
| 5 or more Vehicles | 5 (5.3%) | 5 (12.2%) |
| Total | 94 (100.0%) | 41 (100.0%) |
Commute Time in East Arcadia
The most frequently occuring commute durations in East Arcadia are 30 to 34 minutes (55 commuters, 44.0%), less than 5 minutes (36 commuters, 28.8%), and 35 to 39 minutes (14 commuters, 11.2%).
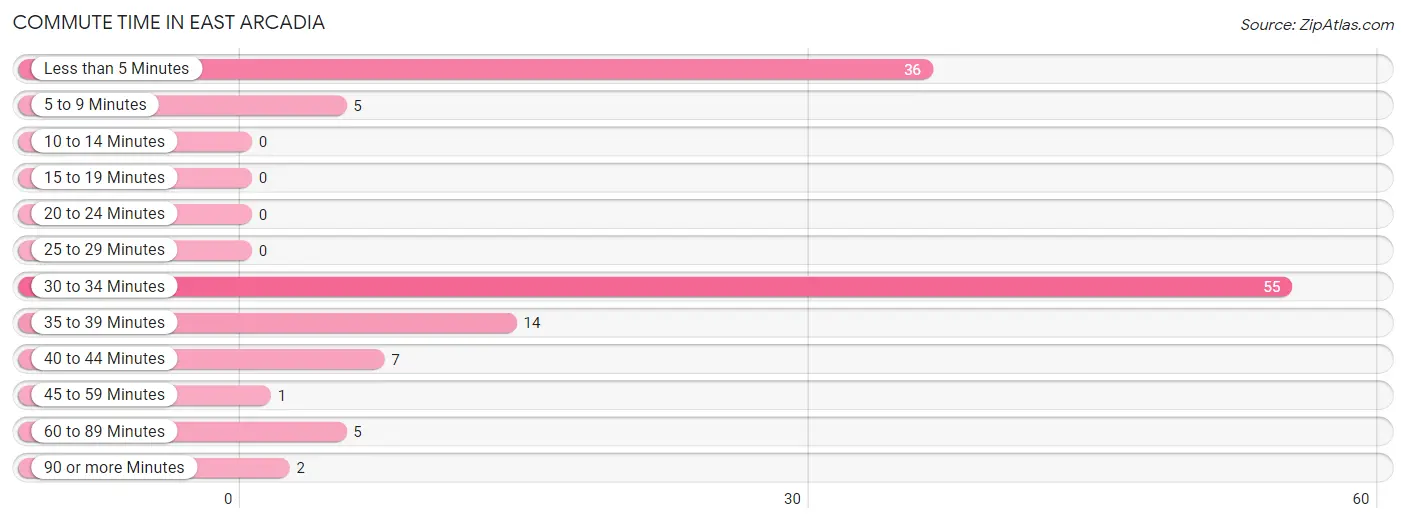
| Commute Time | # Commuters | % Commuters |
| Less than 5 Minutes | 36 | 28.8% |
| 5 to 9 Minutes | 5 | 4.0% |
| 10 to 14 Minutes | 0 | 0.0% |
| 15 to 19 Minutes | 0 | 0.0% |
| 20 to 24 Minutes | 0 | 0.0% |
| 25 to 29 Minutes | 0 | 0.0% |
| 30 to 34 Minutes | 55 | 44.0% |
| 35 to 39 Minutes | 14 | 11.2% |
| 40 to 44 Minutes | 7 | 5.6% |
| 45 to 59 Minutes | 1 | 0.8% |
| 60 to 89 Minutes | 5 | 4.0% |
| 90 or more Minutes | 2 | 1.6% |
Commute Time by Sex in East Arcadia
The most common commute times in East Arcadia are 30 to 34 minutes (49 commuters, 52.1%) for males and 40 to 44 minutes (7 commuters, 22.6%) for females.
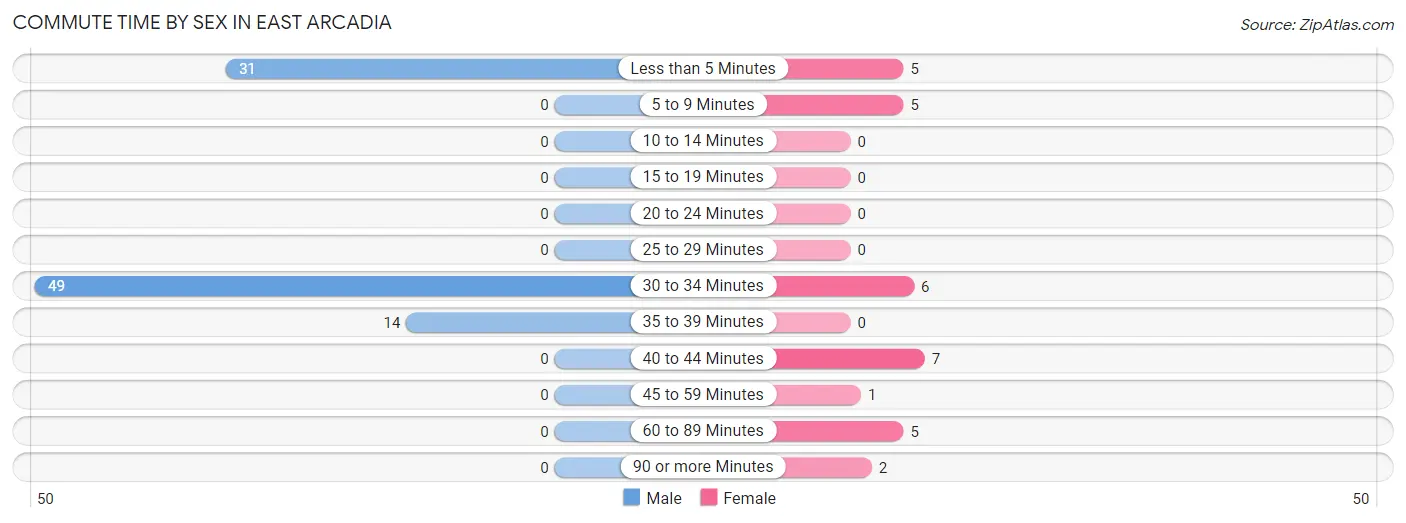
| Commute Time | Male | Female |
| Less than 5 Minutes | 31 (33.0%) | 5 (16.1%) |
| 5 to 9 Minutes | 0 (0.0%) | 5 (16.1%) |
| 10 to 14 Minutes | 0 (0.0%) | 0 (0.0%) |
| 15 to 19 Minutes | 0 (0.0%) | 0 (0.0%) |
| 20 to 24 Minutes | 0 (0.0%) | 0 (0.0%) |
| 25 to 29 Minutes | 0 (0.0%) | 0 (0.0%) |
| 30 to 34 Minutes | 49 (52.1%) | 6 (19.4%) |
| 35 to 39 Minutes | 14 (14.9%) | 0 (0.0%) |
| 40 to 44 Minutes | 0 (0.0%) | 7 (22.6%) |
| 45 to 59 Minutes | 0 (0.0%) | 1 (3.2%) |
| 60 to 89 Minutes | 0 (0.0%) | 5 (16.1%) |
| 90 or more Minutes | 0 (0.0%) | 2 (6.5%) |
Time of Departure to Work by Sex in East Arcadia
The most frequent times of departure to work in East Arcadia are 6:00 AM to 6:29 AM (56, 59.6%) for males and 7:00 AM to 7:29 AM (6, 19.4%) for females.
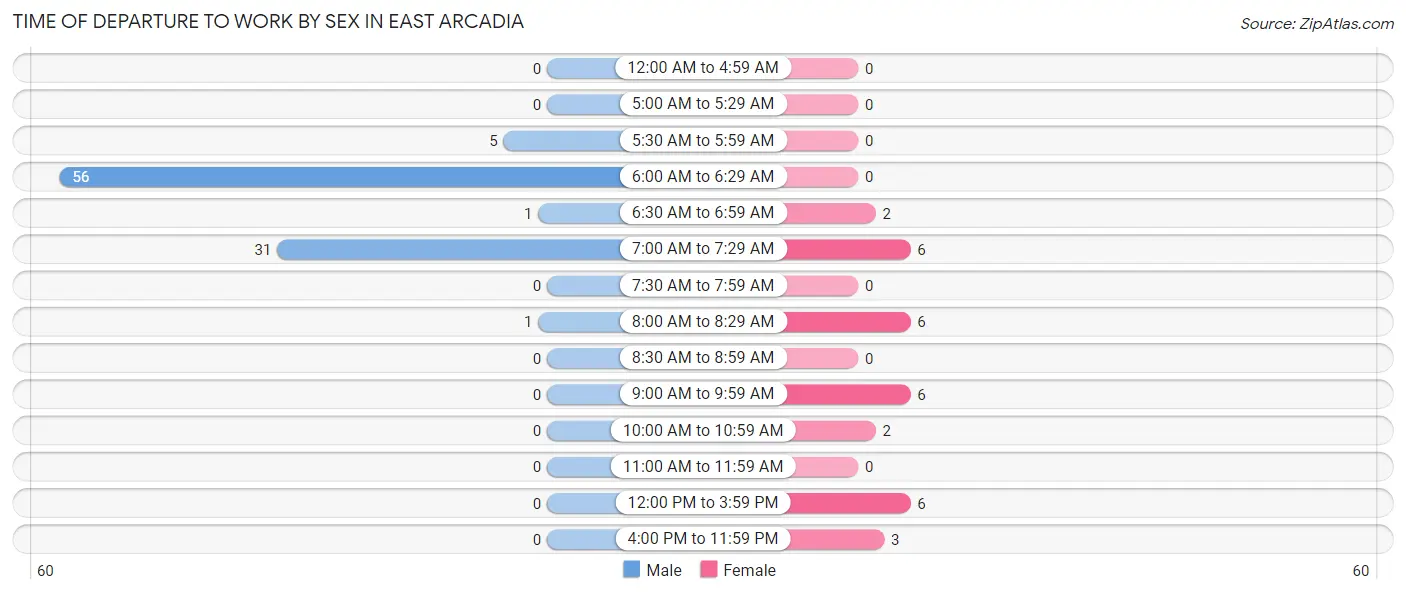
| Time of Departure | Male | Female |
| 12:00 AM to 4:59 AM | 0 (0.0%) | 0 (0.0%) |
| 5:00 AM to 5:29 AM | 0 (0.0%) | 0 (0.0%) |
| 5:30 AM to 5:59 AM | 5 (5.3%) | 0 (0.0%) |
| 6:00 AM to 6:29 AM | 56 (59.6%) | 0 (0.0%) |
| 6:30 AM to 6:59 AM | 1 (1.1%) | 2 (6.5%) |
| 7:00 AM to 7:29 AM | 31 (33.0%) | 6 (19.4%) |
| 7:30 AM to 7:59 AM | 0 (0.0%) | 0 (0.0%) |
| 8:00 AM to 8:29 AM | 1 (1.1%) | 6 (19.4%) |
| 8:30 AM to 8:59 AM | 0 (0.0%) | 0 (0.0%) |
| 9:00 AM to 9:59 AM | 0 (0.0%) | 6 (19.4%) |
| 10:00 AM to 10:59 AM | 0 (0.0%) | 2 (6.5%) |
| 11:00 AM to 11:59 AM | 0 (0.0%) | 0 (0.0%) |
| 12:00 PM to 3:59 PM | 0 (0.0%) | 6 (19.4%) |
| 4:00 PM to 11:59 PM | 0 (0.0%) | 3 (9.7%) |
| Total | 94 (100.0%) | 31 (100.0%) |
Housing Occupancy in East Arcadia
Occupancy by Ownership in East Arcadia
Of the total 124 dwellings in East Arcadia, owner-occupied units account for 98 (79.0%), while renter-occupied units make up 26 (21.0%).
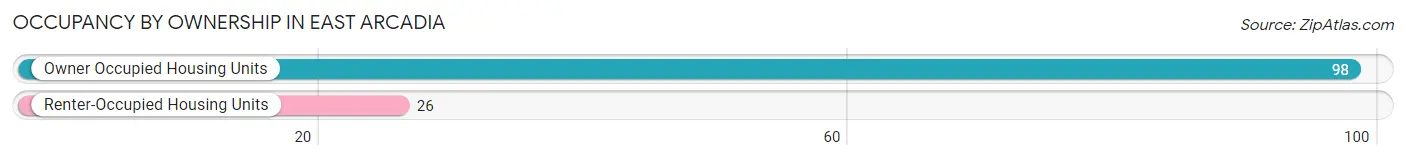
| Occupancy | # Housing Units | % Housing Units |
| Owner Occupied Housing Units | 98 | 79.0% |
| Renter-Occupied Housing Units | 26 | 21.0% |
| Total Occupied Housing Units | 124 | 100.0% |
Occupancy by Household Size in East Arcadia
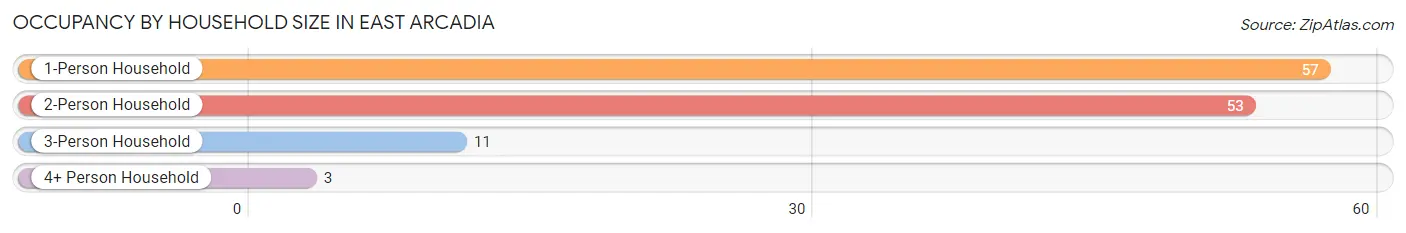
| Household Size | # Housing Units | % Housing Units |
| 1-Person Household | 57 | 46.0% |
| 2-Person Household | 53 | 42.7% |
| 3-Person Household | 11 | 8.9% |
| 4+ Person Household | 3 | 2.4% |
| Total Housing Units | 124 | 100.0% |
Occupancy by Ownership by Household Size in East Arcadia
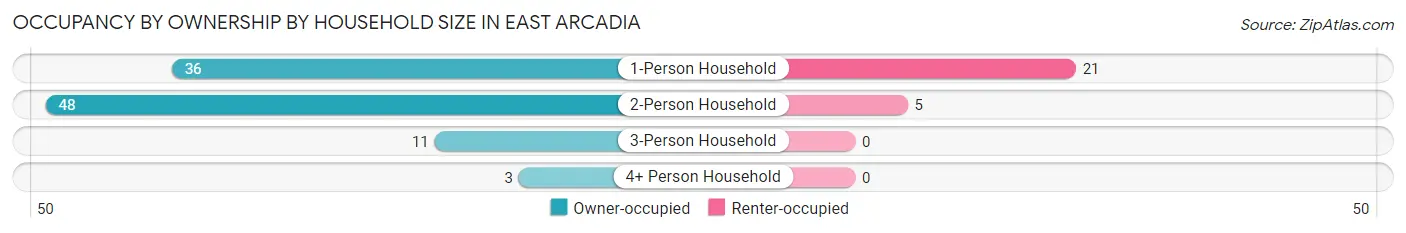
| Household Size | Owner-occupied | Renter-occupied |
| 1-Person Household | 36 (63.2%) | 21 (36.8%) |
| 2-Person Household | 48 (90.6%) | 5 (9.4%) |
| 3-Person Household | 11 (100.0%) | 0 (0.0%) |
| 4+ Person Household | 3 (100.0%) | 0 (0.0%) |
| Total Housing Units | 98 (79.0%) | 26 (21.0%) |
Occupancy by Educational Attainment in East Arcadia
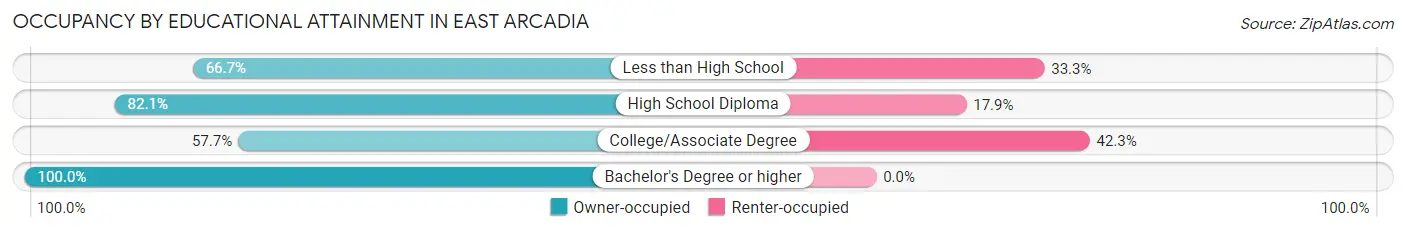
| Household Size | Owner-occupied | Renter-occupied |
| Less than High School | 10 (66.7%) | 5 (33.3%) |
| High School Diploma | 46 (82.1%) | 10 (17.9%) |
| College/Associate Degree | 15 (57.7%) | 11 (42.3%) |
| Bachelor's Degree or higher | 27 (100.0%) | 0 (0.0%) |
Occupancy by Age of Householder in East Arcadia
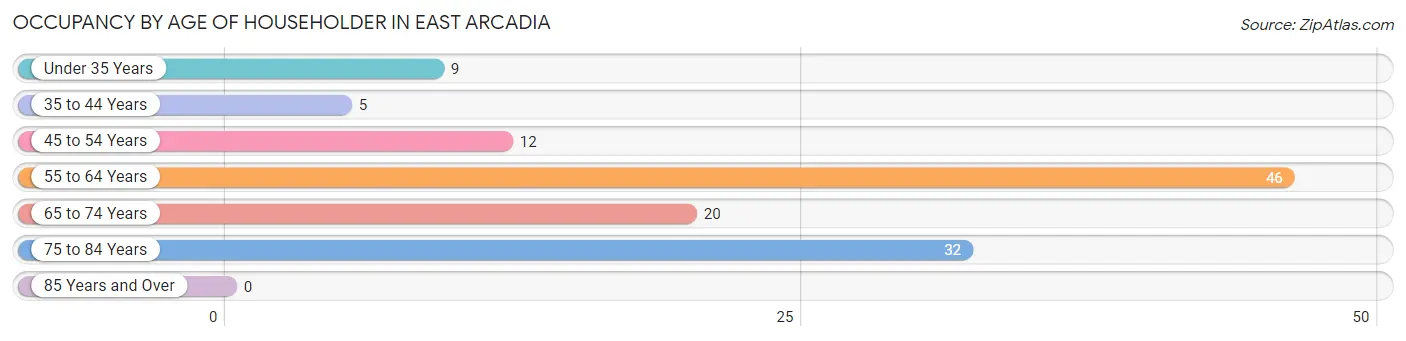
| Age Bracket | # Households | % Households |
| Under 35 Years | 9 | 7.3% |
| 35 to 44 Years | 5 | 4.0% |
| 45 to 54 Years | 12 | 9.7% |
| 55 to 64 Years | 46 | 37.1% |
| 65 to 74 Years | 20 | 16.1% |
| 75 to 84 Years | 32 | 25.8% |
| 85 Years and Over | 0 | 0.0% |
| Total | 124 | 100.0% |
Housing Finances in East Arcadia
Median Income by Occupancy in East Arcadia
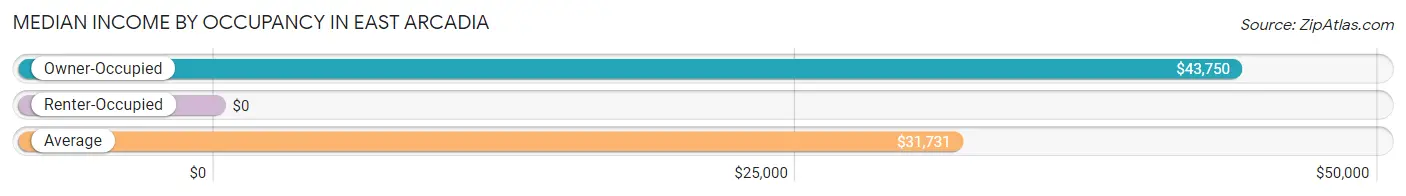
| Occupancy Type | # Households | Median Income |
| Owner-Occupied | 98 (79.0%) | $43,750 |
| Renter-Occupied | 26 (21.0%) | $0 |
| Average | 124 (100.0%) | $31,731 |
Occupancy by Householder Income Bracket in East Arcadia
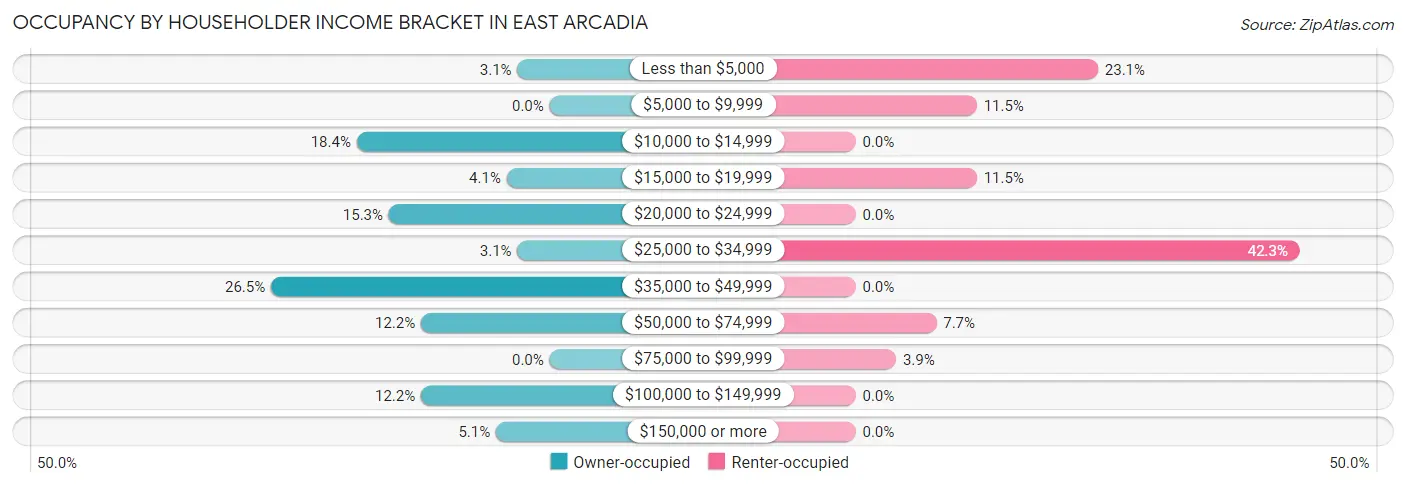
| Income Bracket | Owner-occupied | Renter-occupied |
| Less than $5,000 | 3 (3.1%) | 6 (23.1%) |
| $5,000 to $9,999 | 0 (0.0%) | 3 (11.5%) |
| $10,000 to $14,999 | 18 (18.4%) | 0 (0.0%) |
| $15,000 to $19,999 | 4 (4.1%) | 3 (11.5%) |
| $20,000 to $24,999 | 15 (15.3%) | 0 (0.0%) |
| $25,000 to $34,999 | 3 (3.1%) | 11 (42.3%) |
| $35,000 to $49,999 | 26 (26.5%) | 0 (0.0%) |
| $50,000 to $74,999 | 12 (12.2%) | 2 (7.7%) |
| $75,000 to $99,999 | 0 (0.0%) | 1 (3.8%) |
| $100,000 to $149,999 | 12 (12.2%) | 0 (0.0%) |
| $150,000 or more | 5 (5.1%) | 0 (0.0%) |
| Total | 98 (100.0%) | 26 (100.0%) |
Monthly Housing Cost Tiers in East Arcadia
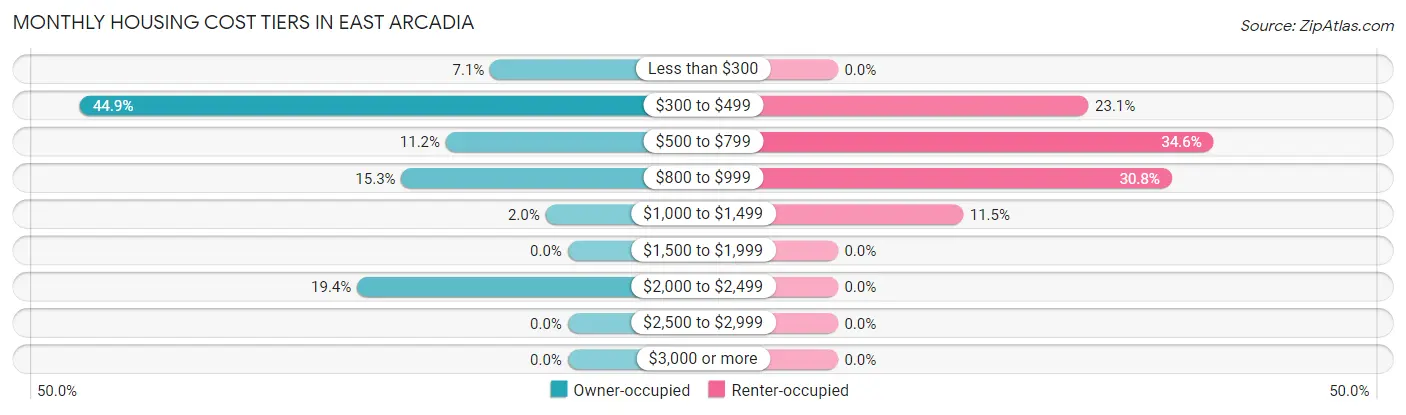
| Monthly Cost | Owner-occupied | Renter-occupied |
| Less than $300 | 7 (7.1%) | 0 (0.0%) |
| $300 to $499 | 44 (44.9%) | 6 (23.1%) |
| $500 to $799 | 11 (11.2%) | 9 (34.6%) |
| $800 to $999 | 15 (15.3%) | 8 (30.8%) |
| $1,000 to $1,499 | 2 (2.0%) | 3 (11.5%) |
| $1,500 to $1,999 | 0 (0.0%) | 0 (0.0%) |
| $2,000 to $2,499 | 19 (19.4%) | 0 (0.0%) |
| $2,500 to $2,999 | 0 (0.0%) | 0 (0.0%) |
| $3,000 or more | 0 (0.0%) | 0 (0.0%) |
| Total | 98 (100.0%) | 26 (100.0%) |
Physical Housing Characteristics in East Arcadia
Housing Structures in East Arcadia
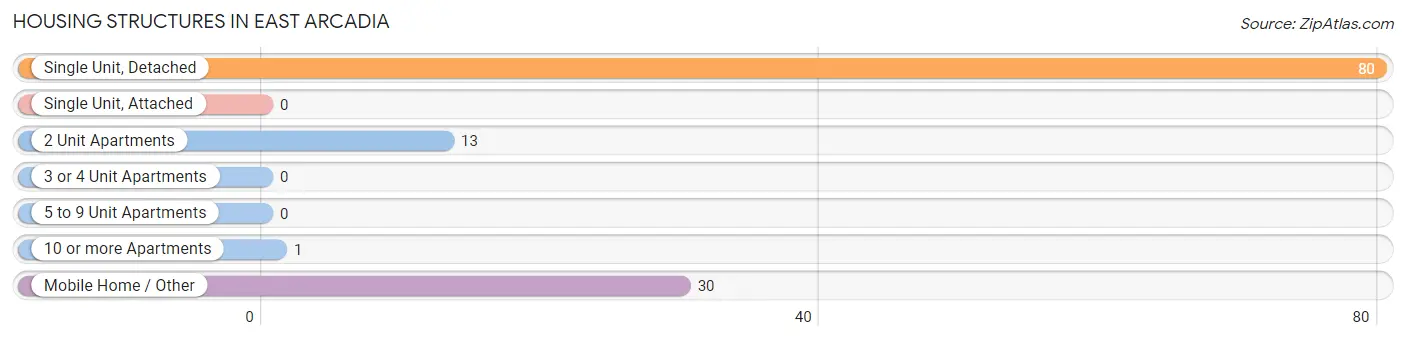
| Structure Type | # Housing Units | % Housing Units |
| Single Unit, Detached | 80 | 64.5% |
| Single Unit, Attached | 0 | 0.0% |
| 2 Unit Apartments | 13 | 10.5% |
| 3 or 4 Unit Apartments | 0 | 0.0% |
| 5 to 9 Unit Apartments | 0 | 0.0% |
| 10 or more Apartments | 1 | 0.8% |
| Mobile Home / Other | 30 | 24.2% |
| Total | 124 | 100.0% |
Housing Structures by Occupancy in East Arcadia
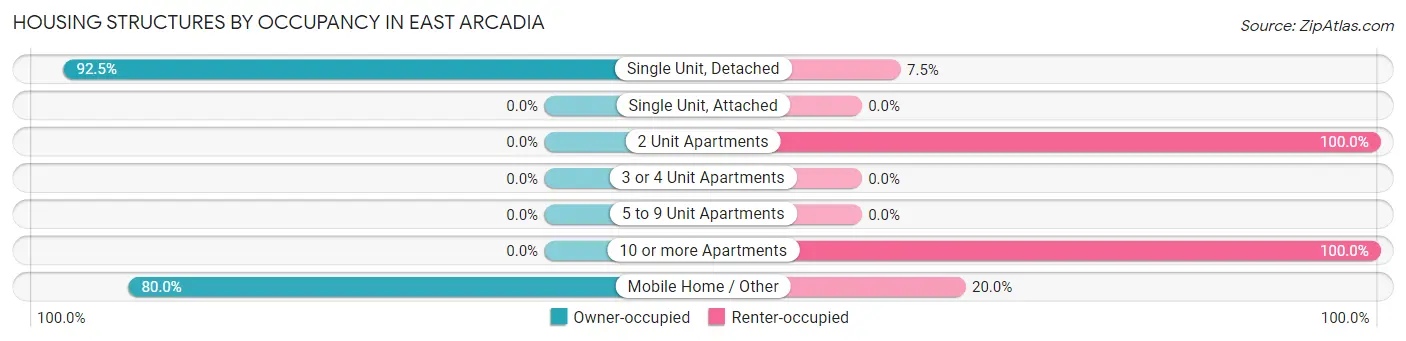
| Structure Type | Owner-occupied | Renter-occupied |
| Single Unit, Detached | 74 (92.5%) | 6 (7.5%) |
| Single Unit, Attached | 0 (0.0%) | 0 (0.0%) |
| 2 Unit Apartments | 0 (0.0%) | 13 (100.0%) |
| 3 or 4 Unit Apartments | 0 (0.0%) | 0 (0.0%) |
| 5 to 9 Unit Apartments | 0 (0.0%) | 0 (0.0%) |
| 10 or more Apartments | 0 (0.0%) | 1 (100.0%) |
| Mobile Home / Other | 24 (80.0%) | 6 (20.0%) |
| Total | 98 (79.0%) | 26 (21.0%) |
Housing Structures by Number of Rooms in East Arcadia
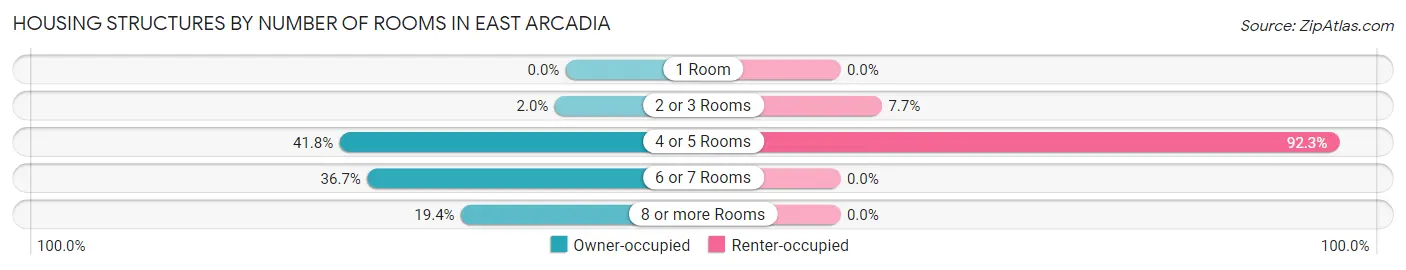
| Number of Rooms | Owner-occupied | Renter-occupied |
| 1 Room | 0 (0.0%) | 0 (0.0%) |
| 2 or 3 Rooms | 2 (2.0%) | 2 (7.7%) |
| 4 or 5 Rooms | 41 (41.8%) | 24 (92.3%) |
| 6 or 7 Rooms | 36 (36.7%) | 0 (0.0%) |
| 8 or more Rooms | 19 (19.4%) | 0 (0.0%) |
| Total | 98 (100.0%) | 26 (100.0%) |
Housing Structure by Heating Type in East Arcadia
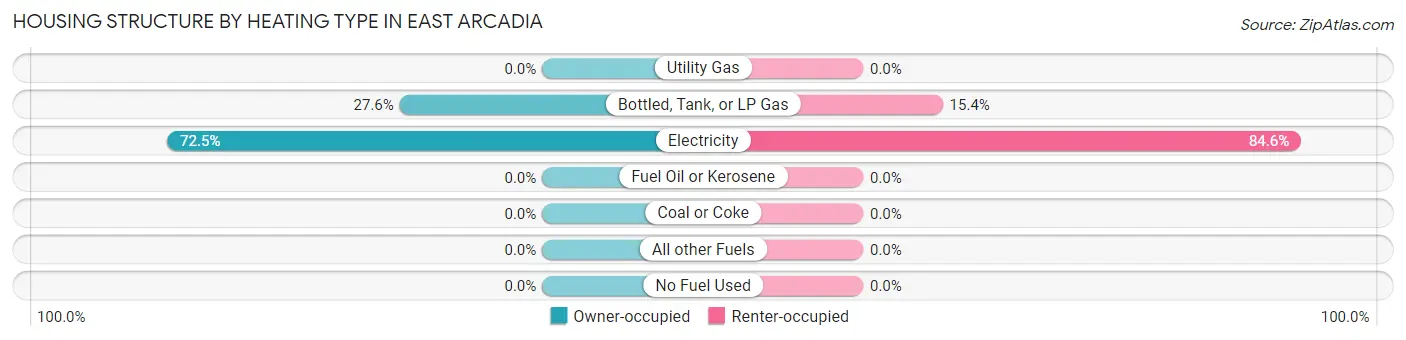
| Heating Type | Owner-occupied | Renter-occupied |
| Utility Gas | 0 (0.0%) | 0 (0.0%) |
| Bottled, Tank, or LP Gas | 27 (27.6%) | 4 (15.4%) |
| Electricity | 71 (72.5%) | 22 (84.6%) |
| Fuel Oil or Kerosene | 0 (0.0%) | 0 (0.0%) |
| Coal or Coke | 0 (0.0%) | 0 (0.0%) |
| All other Fuels | 0 (0.0%) | 0 (0.0%) |
| No Fuel Used | 0 (0.0%) | 0 (0.0%) |
| Total | 98 (100.0%) | 26 (100.0%) |
Household Vehicle Usage in East Arcadia
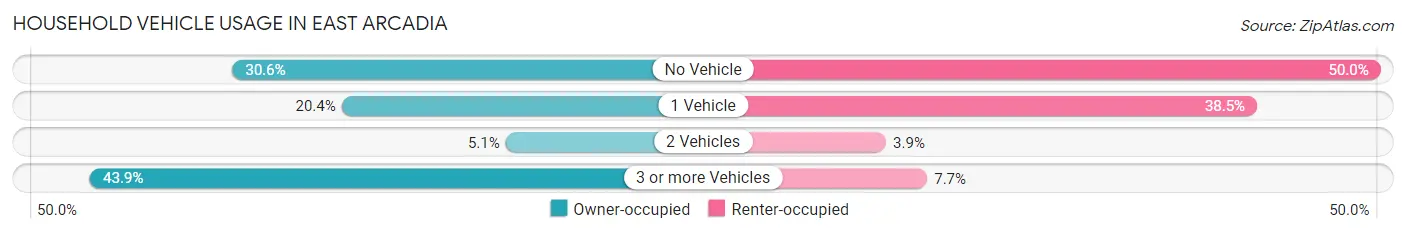
| Vehicles per Household | Owner-occupied | Renter-occupied |
| No Vehicle | 30 (30.6%) | 13 (50.0%) |
| 1 Vehicle | 20 (20.4%) | 10 (38.5%) |
| 2 Vehicles | 5 (5.1%) | 1 (3.8%) |
| 3 or more Vehicles | 43 (43.9%) | 2 (7.7%) |
| Total | 98 (100.0%) | 26 (100.0%) |
Real Estate & Mortgages in East Arcadia
Real Estate and Mortgage Overview in East Arcadia
| Characteristic | Without Mortgage | With Mortgage |
| Housing Units | 73 | 25 |
| Median Property Value | - | - |
| Median Household Income | - | - |
| Monthly Housing Costs | $457 | $0 |
| Real Estate Taxes | $1,238 | $0 |
Property Value by Mortgage Status in East Arcadia
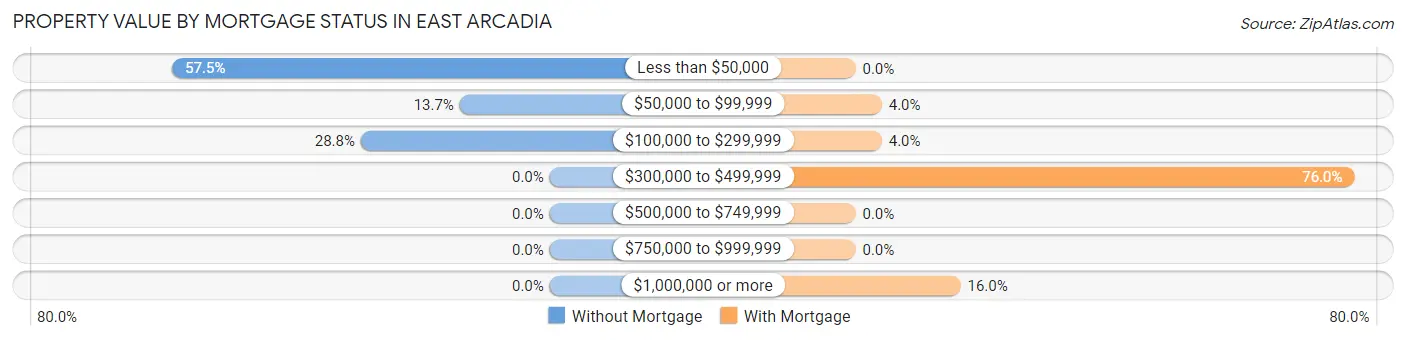
| Property Value | Without Mortgage | With Mortgage |
| Less than $50,000 | 42 (57.5%) | 0 (0.0%) |
| $50,000 to $99,999 | 10 (13.7%) | 1 (4.0%) |
| $100,000 to $299,999 | 21 (28.8%) | 1 (4.0%) |
| $300,000 to $499,999 | 0 (0.0%) | 19 (76.0%) |
| $500,000 to $749,999 | 0 (0.0%) | 0 (0.0%) |
| $750,000 to $999,999 | 0 (0.0%) | 0 (0.0%) |
| $1,000,000 or more | 0 (0.0%) | 4 (16.0%) |
| Total | 73 (100.0%) | 25 (100.0%) |
Household Income by Mortgage Status in East Arcadia
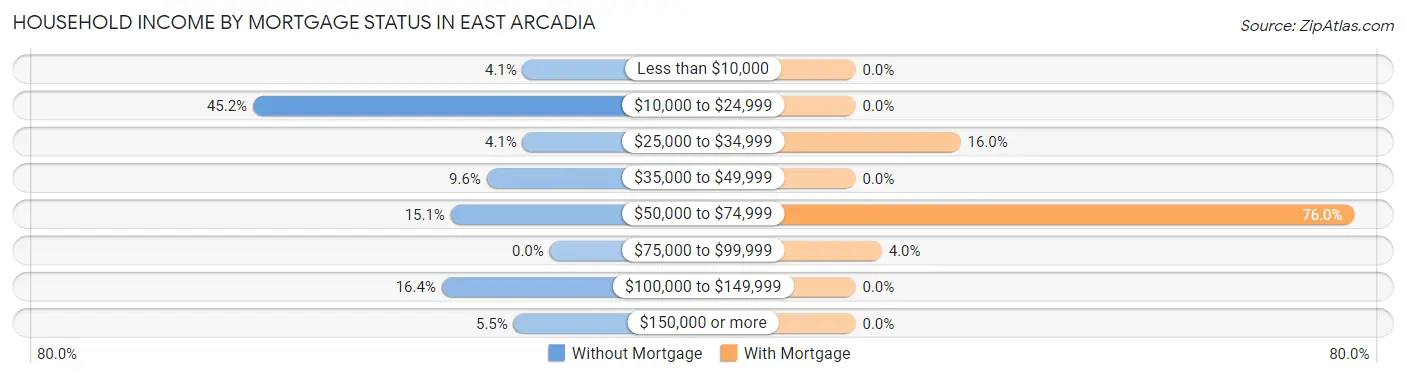
| Household Income | Without Mortgage | With Mortgage |
| Less than $10,000 | 3 (4.1%) | 0 (0.0%) |
| $10,000 to $24,999 | 33 (45.2%) | 0 (0.0%) |
| $25,000 to $34,999 | 3 (4.1%) | 4 (16.0%) |
| $35,000 to $49,999 | 7 (9.6%) | 0 (0.0%) |
| $50,000 to $74,999 | 11 (15.1%) | 19 (76.0%) |
| $75,000 to $99,999 | 0 (0.0%) | 1 (4.0%) |
| $100,000 to $149,999 | 12 (16.4%) | 0 (0.0%) |
| $150,000 or more | 4 (5.5%) | 0 (0.0%) |
| Total | 73 (100.0%) | 25 (100.0%) |
Property Value to Household Income Ratio in East Arcadia
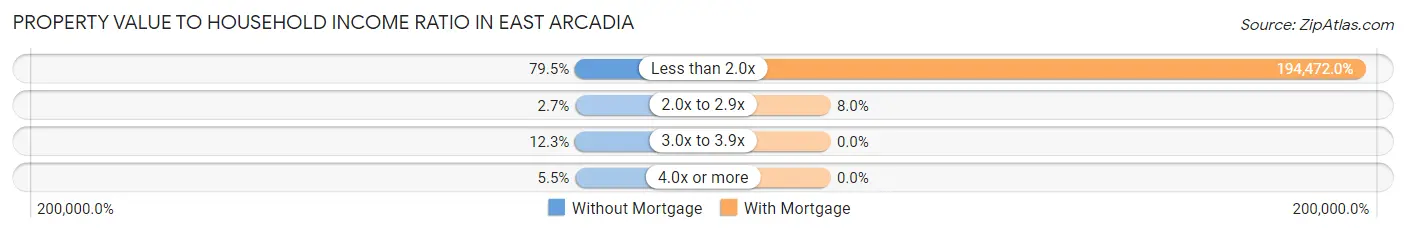
| Value-to-Income Ratio | Without Mortgage | With Mortgage |
| Less than 2.0x | 58 (79.4%) | 48,618 (194,472.0%) |
| 2.0x to 2.9x | 2 (2.7%) | 2 (8.0%) |
| 3.0x to 3.9x | 9 (12.3%) | 0 (0.0%) |
| 4.0x or more | 4 (5.5%) | 0 (0.0%) |
| Total | 73 (100.0%) | 25 (100.0%) |
Real Estate Taxes by Mortgage Status in East Arcadia

| Property Taxes | Without Mortgage | With Mortgage |
| Less than $800 | 9 (12.3%) | 0 (0.0%) |
| $800 to $1,499 | 45 (61.6%) | 5 (20.0%) |
| $800 to $1,499 | 12 (16.4%) | 1 (4.0%) |
| Total | 73 (100.0%) | 25 (100.0%) |
Health & Disability in East Arcadia
Health Insurance Coverage by Age in East Arcadia
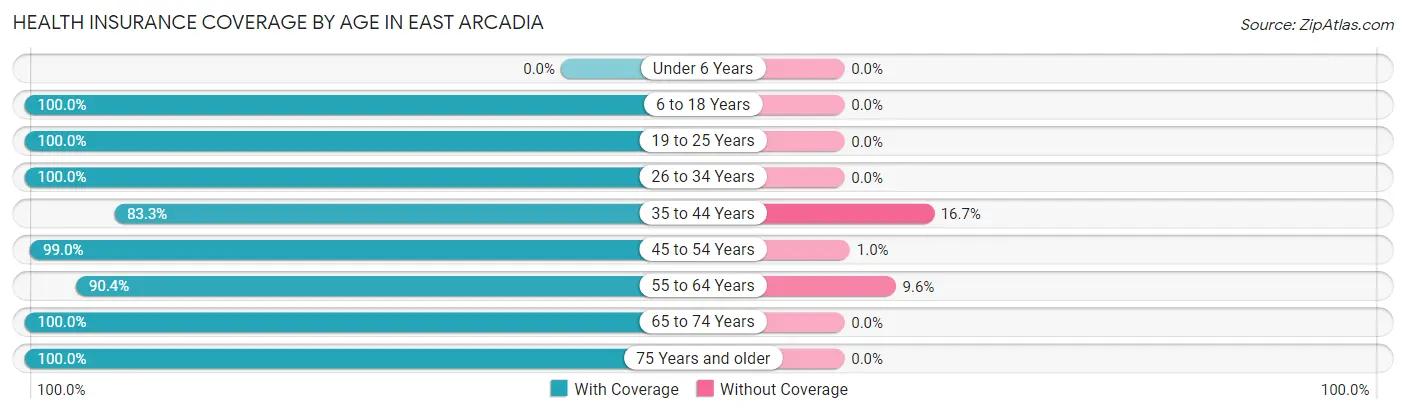
| Age Bracket | With Coverage | Without Coverage |
| Under 6 Years | 0 (0.0%) | 0 (0.0%) |
| 6 to 18 Years | 13 (100.0%) | 0 (0.0%) |
| 19 to 25 Years | 29 (100.0%) | 0 (0.0%) |
| 26 to 34 Years | 13 (100.0%) | 0 (0.0%) |
| 35 to 44 Years | 5 (83.3%) | 1 (16.7%) |
| 45 to 54 Years | 95 (99.0%) | 1 (1.0%) |
| 55 to 64 Years | 85 (90.4%) | 9 (9.6%) |
| 65 to 74 Years | 44 (100.0%) | 0 (0.0%) |
| 75 Years and older | 42 (100.0%) | 0 (0.0%) |
| Total | 326 (96.7%) | 11 (3.3%) |
Health Insurance Coverage by Citizenship Status in East Arcadia

| Citizenship Status | With Coverage | Without Coverage |
| Native Born | 0 (0.0%) | 0 (0.0%) |
| Foreign Born, Citizen | 13 (100.0%) | 0 (0.0%) |
| Foreign Born, not a Citizen | 29 (100.0%) | 0 (0.0%) |
Health Insurance Coverage by Household Income in East Arcadia
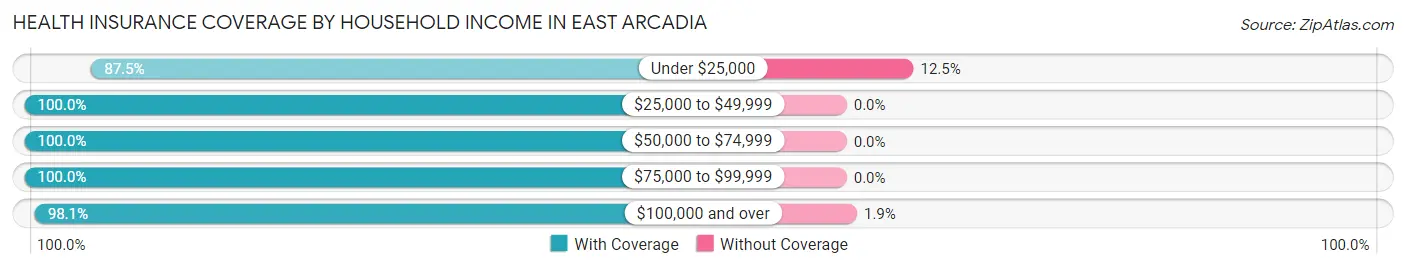
| Household Income | With Coverage | Without Coverage |
| Under $25,000 | 70 (87.5%) | 10 (12.5%) |
| $25,000 to $49,999 | 96 (100.0%) | 0 (0.0%) |
| $50,000 to $74,999 | 107 (100.0%) | 0 (0.0%) |
| $75,000 to $99,999 | 2 (100.0%) | 0 (0.0%) |
| $100,000 and over | 51 (98.1%) | 1 (1.9%) |
Public vs Private Health Insurance Coverage by Age in East Arcadia
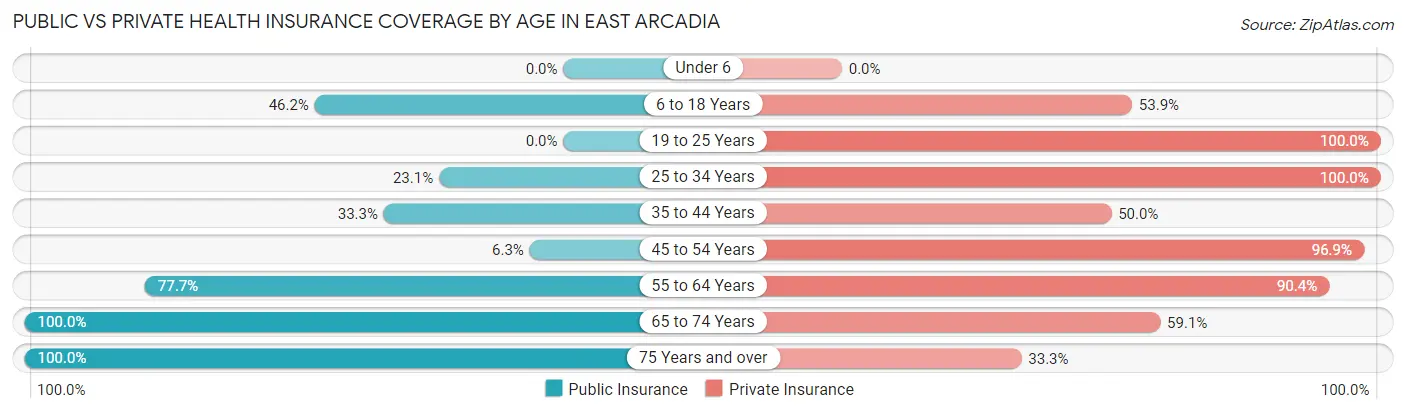
| Age Bracket | Public Insurance | Private Insurance |
| Under 6 | 0 (0.0%) | 0 (0.0%) |
| 6 to 18 Years | 6 (46.2%) | 7 (53.8%) |
| 19 to 25 Years | 0 (0.0%) | 29 (100.0%) |
| 25 to 34 Years | 3 (23.1%) | 13 (100.0%) |
| 35 to 44 Years | 2 (33.3%) | 3 (50.0%) |
| 45 to 54 Years | 6 (6.2%) | 93 (96.9%) |
| 55 to 64 Years | 73 (77.7%) | 85 (90.4%) |
| 65 to 74 Years | 44 (100.0%) | 26 (59.1%) |
| 75 Years and over | 42 (100.0%) | 14 (33.3%) |
| Total | 176 (52.2%) | 270 (80.1%) |
Disability Status by Sex by Age in East Arcadia
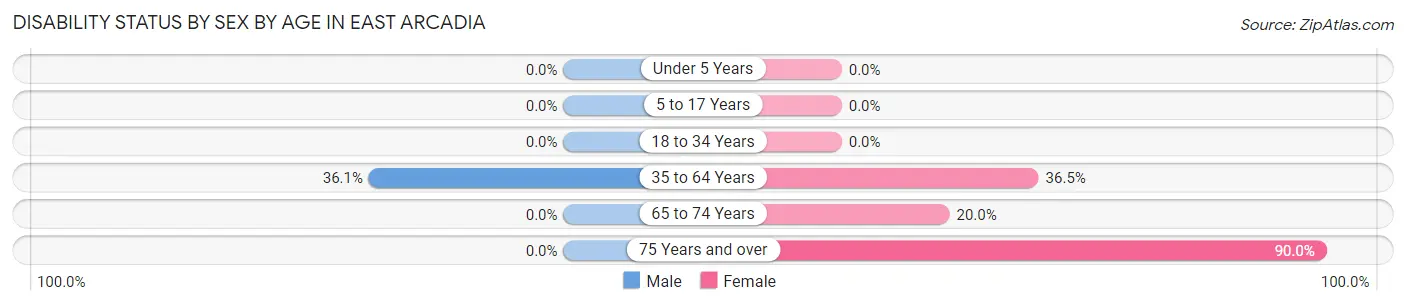
| Age Bracket | Male | Female |
| Under 5 Years | 0 (0.0%) | 0 (0.0%) |
| 5 to 17 Years | 0 (0.0%) | 0 (0.0%) |
| 18 to 34 Years | 0 (0.0%) | 0 (0.0%) |
| 35 to 64 Years | 52 (36.1%) | 19 (36.5%) |
| 65 to 74 Years | 0 (0.0%) | 4 (20.0%) |
| 75 Years and over | 0 (0.0%) | 36 (90.0%) |
Disability Class by Sex by Age in East Arcadia
Disability Class: Hearing Difficulty
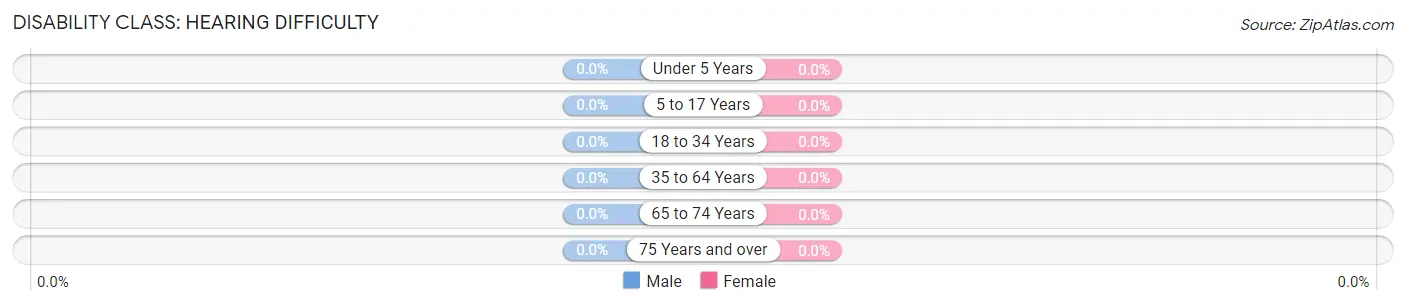
| Age Bracket | Male | Female |
| Under 5 Years | 0 (0.0%) | 0 (0.0%) |
| 5 to 17 Years | 0 (0.0%) | 0 (0.0%) |
| 18 to 34 Years | 0 (0.0%) | 0 (0.0%) |
| 35 to 64 Years | 0 (0.0%) | 0 (0.0%) |
| 65 to 74 Years | 0 (0.0%) | 0 (0.0%) |
| 75 Years and over | 0 (0.0%) | 0 (0.0%) |
Disability Class: Vision Difficulty
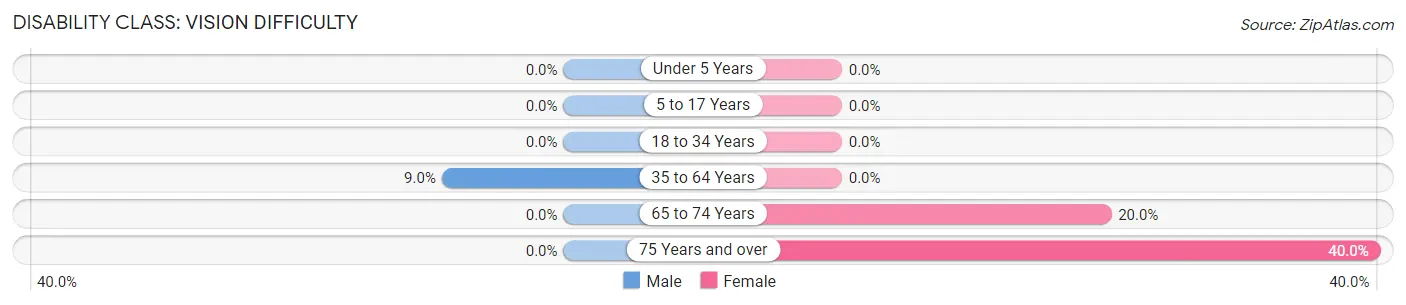
| Age Bracket | Male | Female |
| Under 5 Years | 0 (0.0%) | 0 (0.0%) |
| 5 to 17 Years | 0 (0.0%) | 0 (0.0%) |
| 18 to 34 Years | 0 (0.0%) | 0 (0.0%) |
| 35 to 64 Years | 13 (9.0%) | 0 (0.0%) |
| 65 to 74 Years | 0 (0.0%) | 4 (20.0%) |
| 75 Years and over | 0 (0.0%) | 16 (40.0%) |
Disability Class: Cognitive Difficulty
| Age Bracket | Male | Female |
| 5 to 17 Years | 0 (0.0%) | 0 (0.0%) |
| 18 to 34 Years | 0 (0.0%) | 0 (0.0%) |
| 35 to 64 Years | 0 (0.0%) | 0 (0.0%) |
| 65 to 74 Years | 0 (0.0%) | 0 (0.0%) |
| 75 Years and over | 0 (0.0%) | 0 (0.0%) |
Disability Class: Ambulatory Difficulty
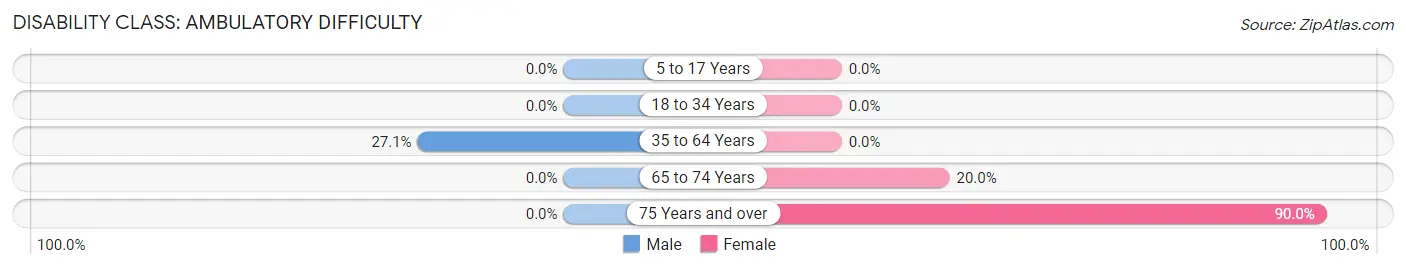
| Age Bracket | Male | Female |
| 5 to 17 Years | 0 (0.0%) | 0 (0.0%) |
| 18 to 34 Years | 0 (0.0%) | 0 (0.0%) |
| 35 to 64 Years | 39 (27.1%) | 0 (0.0%) |
| 65 to 74 Years | 0 (0.0%) | 4 (20.0%) |
| 75 Years and over | 0 (0.0%) | 36 (90.0%) |
Disability Class: Self-Care Difficulty
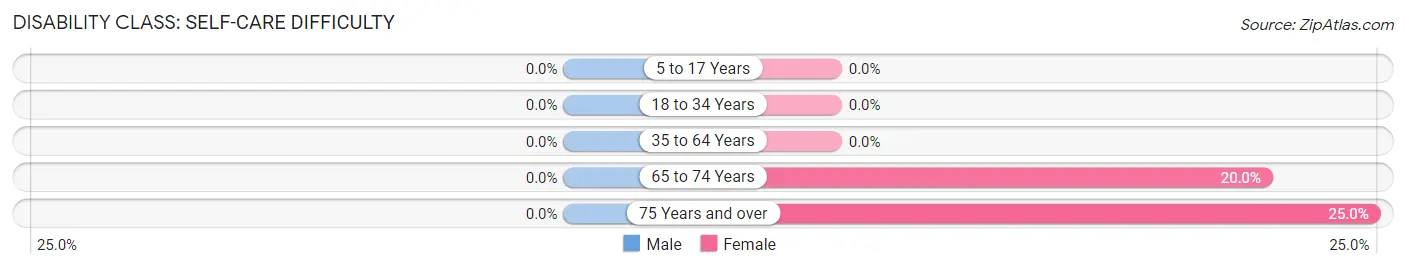
| Age Bracket | Male | Female |
| 5 to 17 Years | 0 (0.0%) | 0 (0.0%) |
| 18 to 34 Years | 0 (0.0%) | 0 (0.0%) |
| 35 to 64 Years | 0 (0.0%) | 0 (0.0%) |
| 65 to 74 Years | 0 (0.0%) | 4 (20.0%) |
| 75 Years and over | 0 (0.0%) | 10 (25.0%) |
Technology Access in East Arcadia
Computing Device Access in East Arcadia
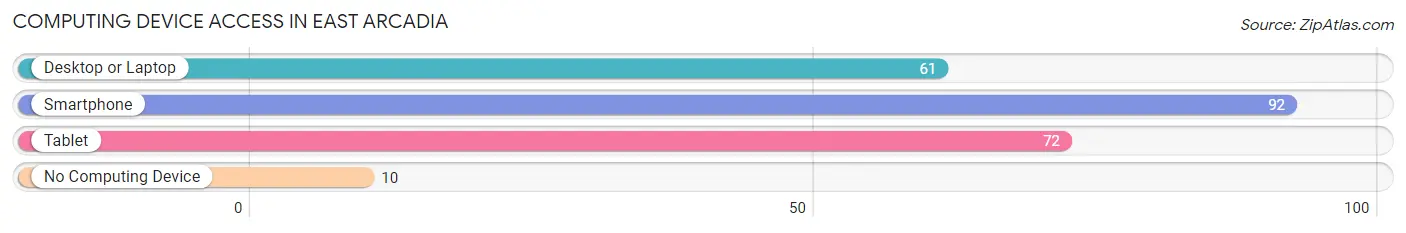
| Device Type | # Households | % Households |
| Desktop or Laptop | 61 | 49.2% |
| Smartphone | 92 | 74.2% |
| Tablet | 72 | 58.1% |
| No Computing Device | 10 | 8.1% |
| Total | 124 | 100.0% |
Internet Access in East Arcadia
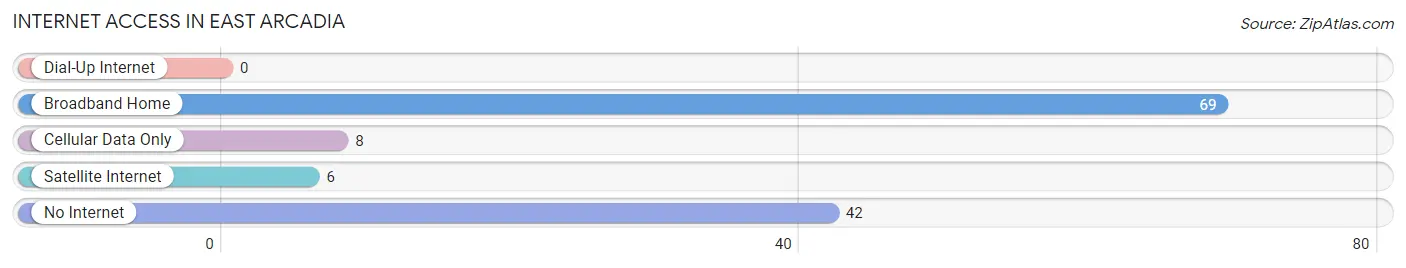
| Internet Type | # Households | % Households |
| Dial-Up Internet | 0 | 0.0% |
| Broadband Home | 69 | 55.6% |
| Cellular Data Only | 8 | 6.5% |
| Satellite Internet | 6 | 4.8% |
| No Internet | 42 | 33.9% |
| Total | 124 | 100.0% |
East Arcadia Summary
Arcadia, North Carolina is a small town located in the eastern part of the state. It is situated in the foothills of the Blue Ridge Mountains and is part of the Piedmont Triad region. The town has a population of approximately 1,500 people and is located in the county of Edgecombe.
History
Arcadia was first settled in the late 1700s by a group of settlers from Scotland. The town was originally known as “Arcadia” due to its location in the foothills of the Blue Ridge Mountains. The town was officially incorporated in 1887 and was named after the Greek region of Arcadia.
The town was a major center for the production of tobacco and cotton during the 19th century. The town was also home to several mills and factories, including a cotton mill, a tobacco factory, and a sawmill.
Geography
Arcadia is located in the eastern part of North Carolina, in the foothills of the Blue Ridge Mountains. The town is situated in the Piedmont Triad region, which is made up of the cities of Greensboro, Winston-Salem, and High Point. The town is located approximately 30 miles east of Raleigh, the state capital.
The town is situated on the banks of the Tar River, which flows through the town and provides a source of recreation for the locals. The town is also located near the Uwharrie National Forest, which is a popular destination for outdoor activities such as camping, hiking, and fishing.
Economy
The economy of Arcadia is largely based on agriculture and manufacturing. The town is home to several farms, which produce a variety of crops such as corn, soybeans, and tobacco. The town is also home to several factories, which produce a variety of products such as furniture, textiles, and paper products.
The town is also home to several small businesses, which provide services such as auto repair, plumbing, and electrical work. The town is also home to several restaurants, which serve a variety of cuisines.
Demographics
As of the 2010 census, the population of Arcadia was 1,500 people. The town is predominantly white, with approximately 85% of the population being white. The town is also home to a small African American population, which makes up approximately 10% of the population. The town is also home to a small Hispanic population, which makes up approximately 5% of the population.
The median household income in Arcadia is approximately $35,000, which is slightly lower than the national average. The town has a poverty rate of approximately 15%, which is slightly higher than the national average. The town also has a high rate of unemployment, with approximately 10% of the population being unemployed.
Common Questions
What is Per Capita Income in East Arcadia?
Per Capita income in East Arcadia is $26,894.
What is the Median Family Income in East Arcadia?
Median Family Income in East Arcadia is $49,539.
What is the Median Household income in East Arcadia?
Median Household Income in East Arcadia is $31,731.
What is Income or Wage Gap in East Arcadia?
Income or Wage Gap in East Arcadia is 6.8%.
Women in East Arcadia earn 93.2 cents for every dollar earned by a man.
What is Inequality or Gini Index in East Arcadia?
Inequality or Gini Index in East Arcadia is 0.50.
What is the Total Population of East Arcadia?
Total Population of East Arcadia is 337.
What is the Total Male Population of East Arcadia?
Total Male Population of East Arcadia is 196.
What is the Total Female Population of East Arcadia?
Total Female Population of East Arcadia is 141.
What is the Ratio of Males per 100 Females in East Arcadia?
There are 139.01 Males per 100 Females in East Arcadia.
What is the Ratio of Females per 100 Males in East Arcadia?
There are 71.94 Females per 100 Males in East Arcadia.
What is the Median Population Age in East Arcadia?
Median Population Age in East Arcadia is 55.5 Years.
What is the Average Family Size in East Arcadia
Average Family Size in East Arcadia is 4.2 People.
What is the Average Household Size in East Arcadia
Average Household Size in East Arcadia is 2.7 People.
How Large is the Labor Force in East Arcadia?
There are 165 People in the Labor Forcein in East Arcadia.
What is the Percentage of People in the Labor Force in East Arcadia?
50.8% of People are in the Labor Force in East Arcadia.
What is the Unemployment Rate in East Arcadia?
Unemployment Rate in East Arcadia is 17.0%.