Barker Ten Mile, NC Map & Demographics
Barker Ten Mile Map
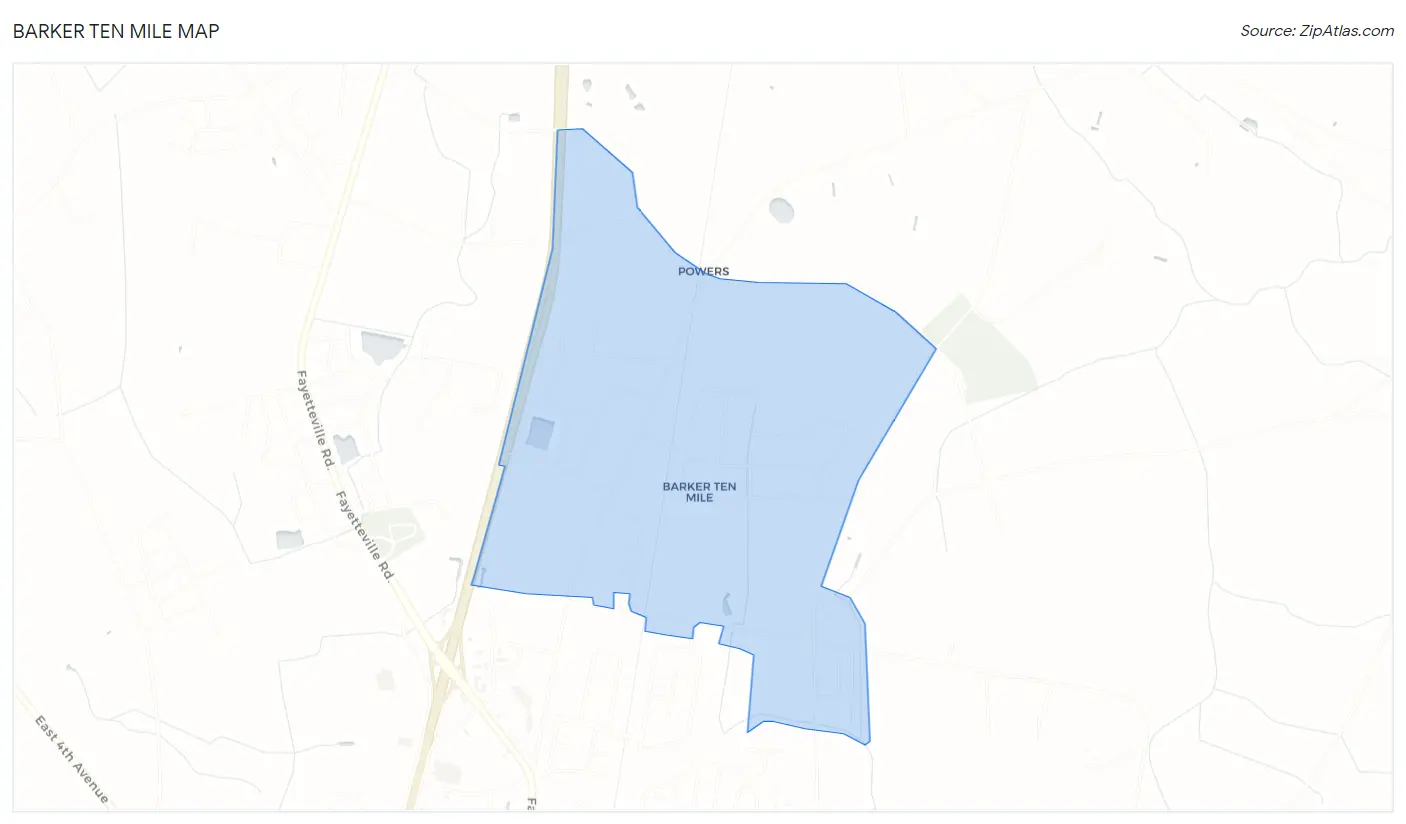
Barker Ten Mile Overview
$47,547
PER CAPITA INCOME
$96,458
AVG FAMILY INCOME
2.2%
WAGE / INCOME GAP [ % ]
97.8¢/ $1
WAGE / INCOME GAP [ $ ]
0.49
INEQUALITY / GINI INDEX
769
TOTAL POPULATION
359
MALE POPULATION
410
FEMALE POPULATION
87.56
MALES / 100 FEMALES
114.21
FEMALES / 100 MALES
49.7
MEDIAN AGE
2.7
AVG FAMILY SIZE
2.4
AVG HOUSEHOLD SIZE
402
LABOR FORCE [ PEOPLE ]
55.0%
PERCENT IN LABOR FORCE
Income in Barker Ten Mile
Income Overview in Barker Ten Mile
| Characteristic | Number | Measure |
| Per Capita Income | 769 | $47,547 |
| Median Family Income | 267 | $96,458 |
| Mean Family Income | 267 | $118,815 |
| Median Household Income | 321 | $0 |
| Mean Household Income | 321 | $106,117 |
| Income Deficit | 267 | $0 |
| Wage / Income Gap (%) | 769 | 2.19% |
| Wage / Income Gap ($) | 769 | 97.81¢ per $1 |
| Gini / Inequality Index | 769 | 0.49 |
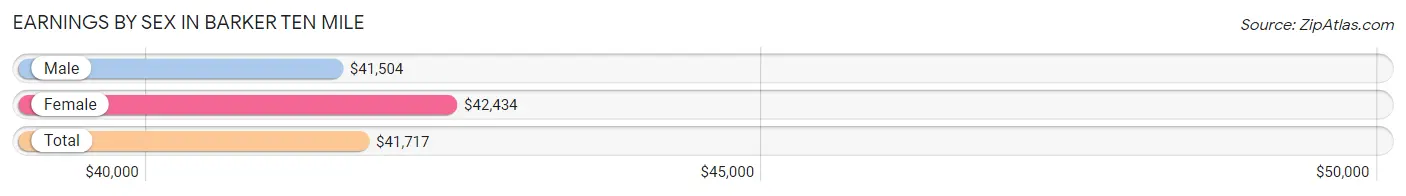
Earnings by Sex in Barker Ten Mile
Average Earnings in Barker Ten Mile are $41,717, $41,504 for men and $42,434 for women, a difference of 2.2%.
| Sex | Number | Average Earnings |
| Male | 205 (44.4%) | $41,504 |
| Female | 257 (55.6%) | $42,434 |
| Total | 462 (100.0%) | $41,717 |
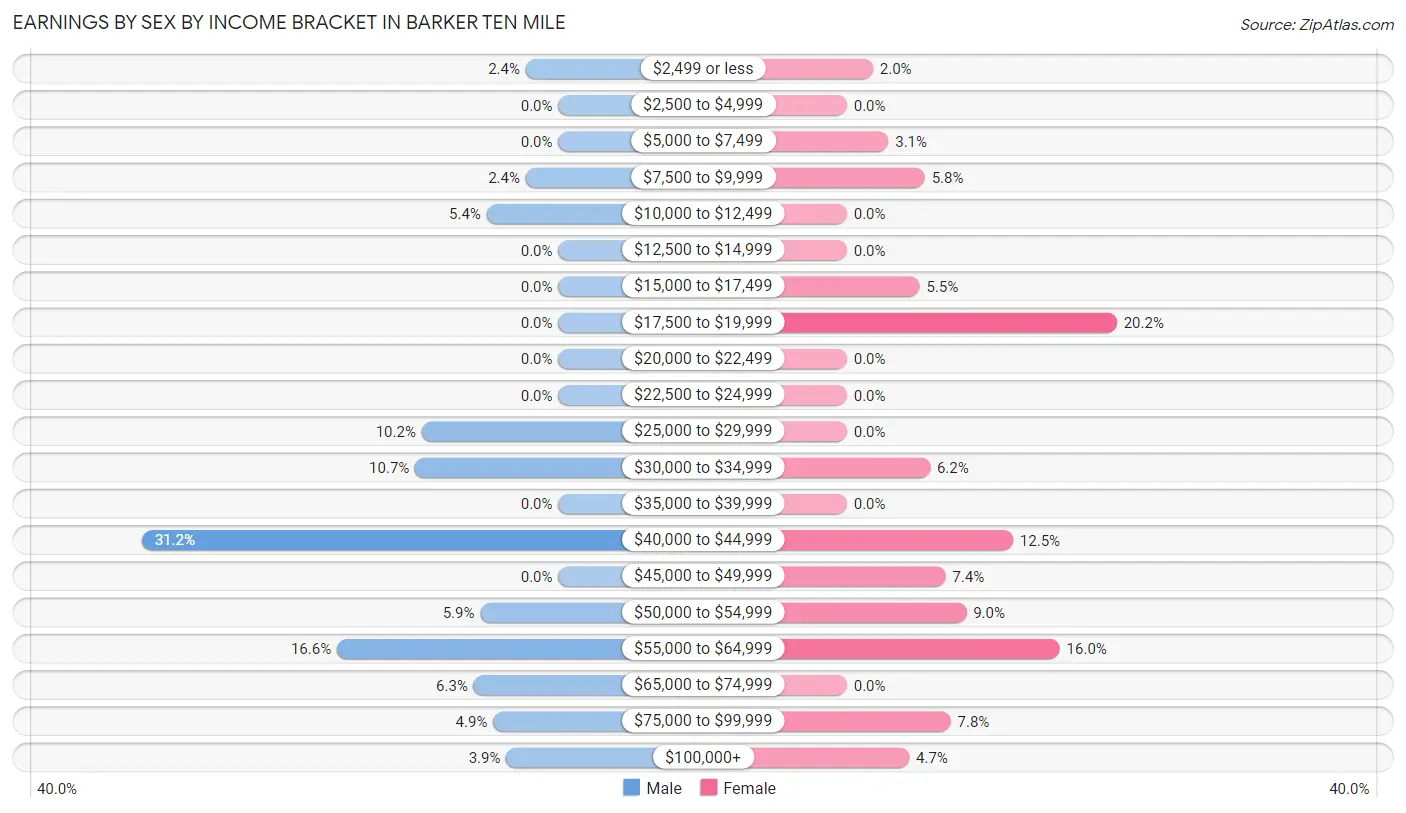
Earnings by Sex by Income Bracket in Barker Ten Mile
The most common earnings brackets in Barker Ten Mile are $40,000 to $44,999 for men (64 | 31.2%) and $17,500 to $19,999 for women (52 | 20.2%).
| Income | Male | Female |
| $2,499 or less | 5 (2.4%) | 5 (1.9%) |
| $2,500 to $4,999 | 0 (0.0%) | 0 (0.0%) |
| $5,000 to $7,499 | 0 (0.0%) | 8 (3.1%) |
| $7,500 to $9,999 | 5 (2.4%) | 15 (5.8%) |
| $10,000 to $12,499 | 11 (5.4%) | 0 (0.0%) |
| $12,500 to $14,999 | 0 (0.0%) | 0 (0.0%) |
| $15,000 to $17,499 | 0 (0.0%) | 14 (5.4%) |
| $17,500 to $19,999 | 0 (0.0%) | 52 (20.2%) |
| $20,000 to $22,499 | 0 (0.0%) | 0 (0.0%) |
| $22,500 to $24,999 | 0 (0.0%) | 0 (0.0%) |
| $25,000 to $29,999 | 21 (10.2%) | 0 (0.0%) |
| $30,000 to $34,999 | 22 (10.7%) | 16 (6.2%) |
| $35,000 to $39,999 | 0 (0.0%) | 0 (0.0%) |
| $40,000 to $44,999 | 64 (31.2%) | 32 (12.4%) |
| $45,000 to $49,999 | 0 (0.0%) | 19 (7.4%) |
| $50,000 to $54,999 | 12 (5.9%) | 23 (8.9%) |
| $55,000 to $64,999 | 34 (16.6%) | 41 (16.0%) |
| $65,000 to $74,999 | 13 (6.3%) | 0 (0.0%) |
| $75,000 to $99,999 | 10 (4.9%) | 20 (7.8%) |
| $100,000+ | 8 (3.9%) | 12 (4.7%) |
| Total | 205 (100.0%) | 257 (100.0%) |
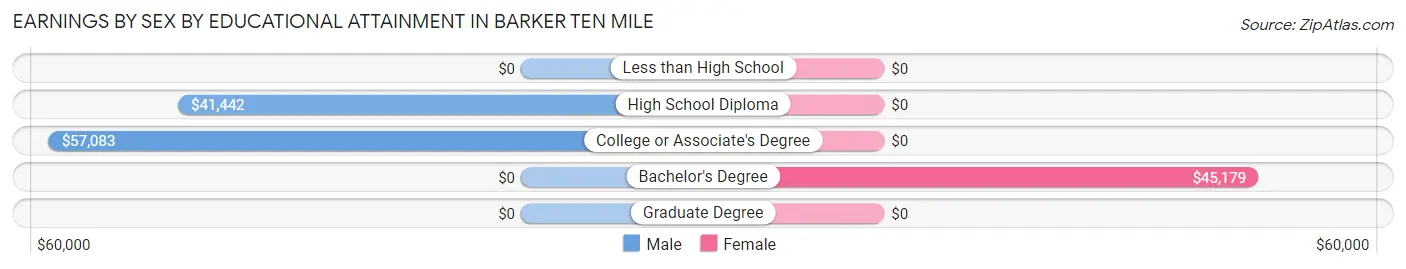
Earnings by Sex by Educational Attainment in Barker Ten Mile
Average earnings in Barker Ten Mile are $41,816 for men and $44,808 for women, a difference of 6.7%. Men with an educational attainment of college or associate's degree enjoy the highest average annual earnings of $57,083, while those with high school diploma education earn the least with $41,442. Women with an educational attainment of bachelor's degree earn the most with the average annual earnings of $45,179, while those with bachelor's degree education have the smallest earnings of $45,179.
| Educational Attainment | Male Income | Female Income |
| Less than High School | - | - |
| High School Diploma | $41,442 | $0 |
| College or Associate's Degree | $57,083 | $0 |
| Bachelor's Degree | - | - |
| Graduate Degree | - | - |
| Total | $41,816 | $44,808 |
Family Income in Barker Ten Mile
Family Income Brackets in Barker Ten Mile
According to the Barker Ten Mile family income data, there are 72 families falling into the $100,000 to $149,999 income range, which is the most common income bracket and makes up 27.0% of all families.
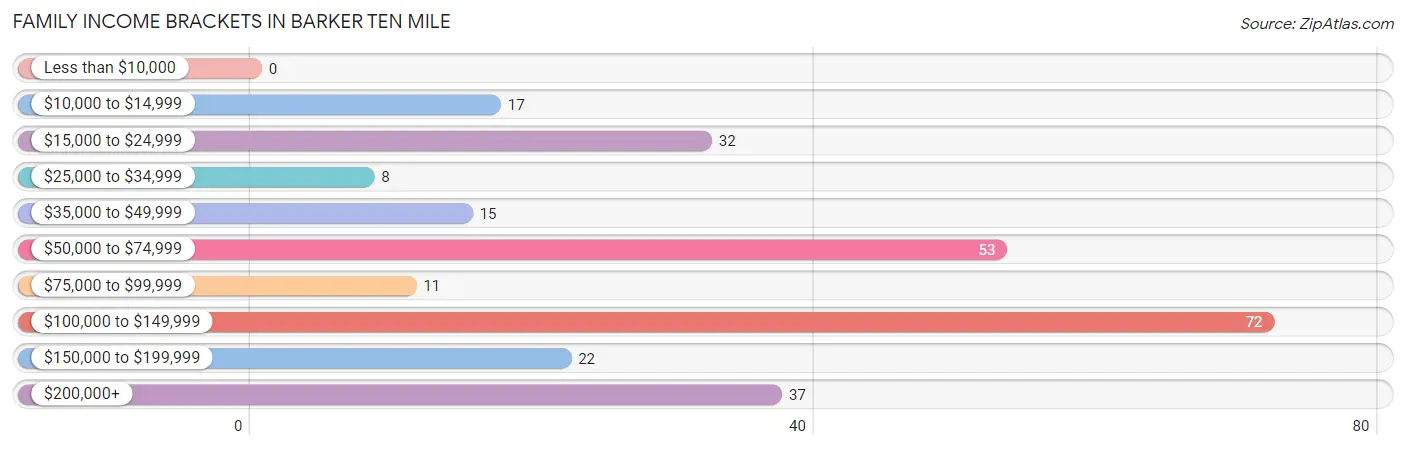
| Income Bracket | # Families | % Families |
| Less than $10,000 | 0 | 0.0% |
| $10,000 to $14,999 | 17 | 6.4% |
| $15,000 to $24,999 | 32 | 12.0% |
| $25,000 to $34,999 | 8 | 3.0% |
| $35,000 to $49,999 | 15 | 5.6% |
| $50,000 to $74,999 | 53 | 19.9% |
| $75,000 to $99,999 | 11 | 4.1% |
| $100,000 to $149,999 | 72 | 27.0% |
| $150,000 to $199,999 | 22 | 8.2% |
| $200,000+ | 37 | 13.9% |
Family Income by Famaliy Size in Barker Ten Mile
2-person families (188 | 70.4%) account for the highest median family income in Barker Ten Mile with $95,417 per family, while 2-person families (188 | 70.4%) have the highest median income of $47,708 per family member.
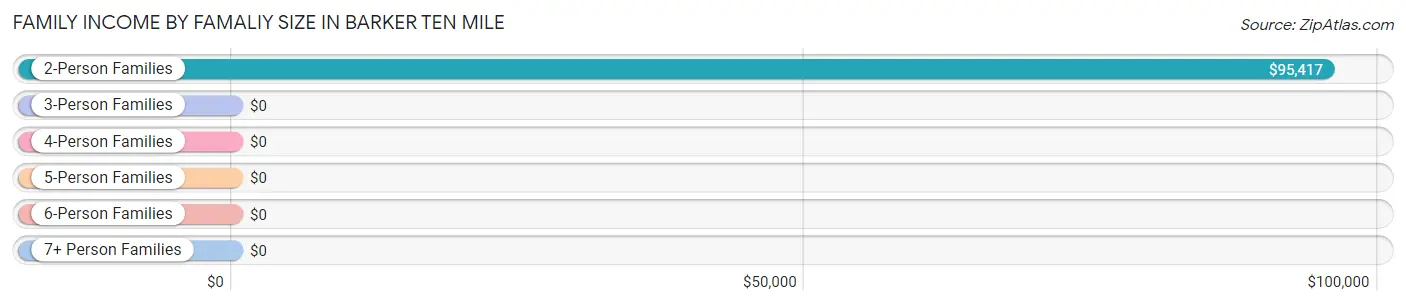
| Income Bracket | # Families | Median Income |
| 2-Person Families | 188 (70.4%) | $95,417 |
| 3-Person Families | 23 (8.6%) | $0 |
| 4-Person Families | 33 (12.4%) | $0 |
| 5-Person Families | 23 (8.6%) | $0 |
| 6-Person Families | 0 (0.0%) | $0 |
| 7+ Person Families | 0 (0.0%) | $0 |
| Total | 267 (100.0%) | $96,458 |
Family Income by Number of Earners in Barker Ten Mile
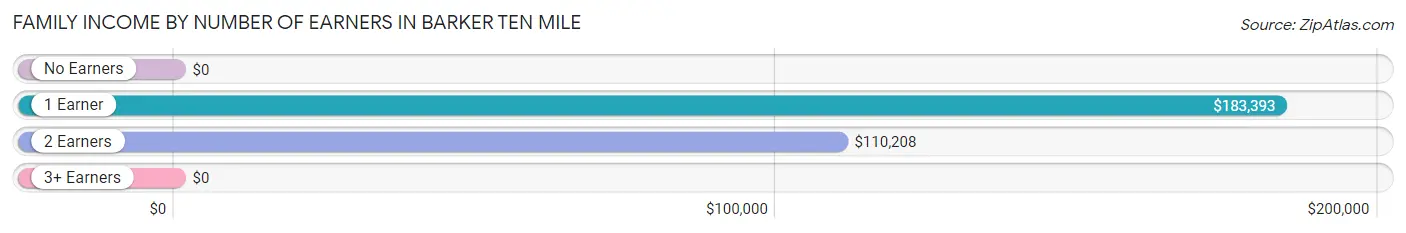
| Number of Earners | # Families | Median Income |
| No Earners | 55 (20.6%) | $0 |
| 1 Earner | 61 (22.9%) | $183,393 |
| 2 Earners | 132 (49.4%) | $110,208 |
| 3+ Earners | 19 (7.1%) | $0 |
| Total | 267 (100.0%) | $96,458 |
Household Income in Barker Ten Mile
Household Income Brackets in Barker Ten Mile
With 80 households falling in the category, the $100,000 to $149,999 income range is the most frequent in Barker Ten Mile, accounting for 24.9% of all households. In contrast, only 9 households (2.8%) fall into the less than $10,000 income bracket, making it the least populous group.
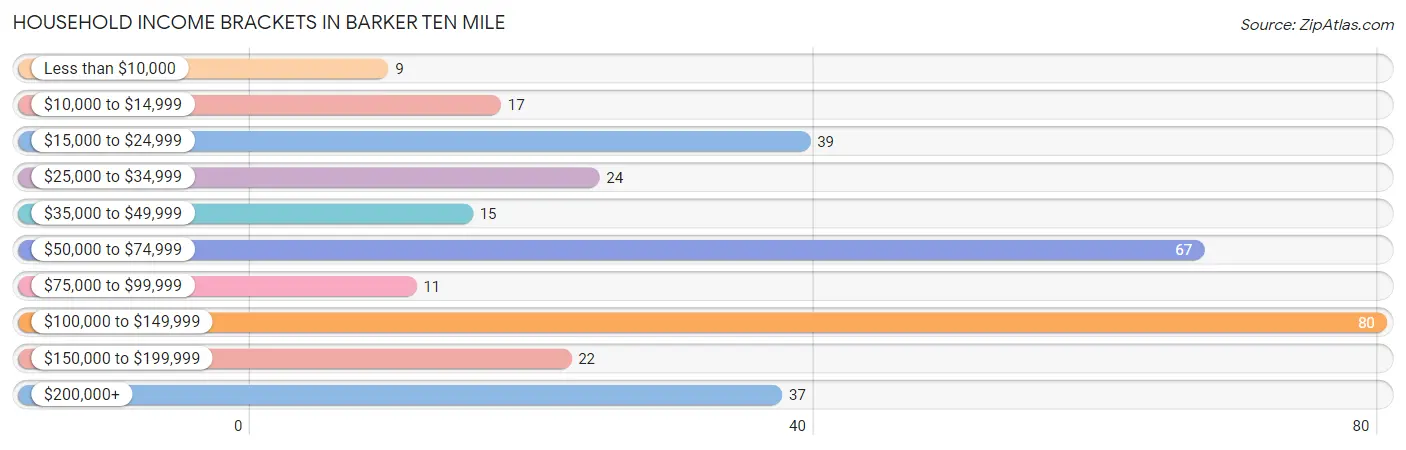
| Income Bracket | # Households | % Households |
| Less than $10,000 | 9 | 2.8% |
| $10,000 to $14,999 | 17 | 5.3% |
| $15,000 to $24,999 | 39 | 12.1% |
| $25,000 to $34,999 | 24 | 7.5% |
| $35,000 to $49,999 | 15 | 4.7% |
| $50,000 to $74,999 | 67 | 20.9% |
| $75,000 to $99,999 | 11 | 3.4% |
| $100,000 to $149,999 | 80 | 24.9% |
| $150,000 to $199,999 | 22 | 6.9% |
| $200,000+ | 37 | 11.5% |
Household Income by Householder Age in Barker Ten Mile
The median household income in Barker Ten Mile is $0, with the highest median household income of $111,146 found in the 45 to 64 years age bracket for the primary householder. A total of 85 households (26.5%) fall into this category. Meanwhile, the 15 to 24 years age bracket for the primary householder has the lowest median household income of $0, with 17 households (5.3%) in this group.
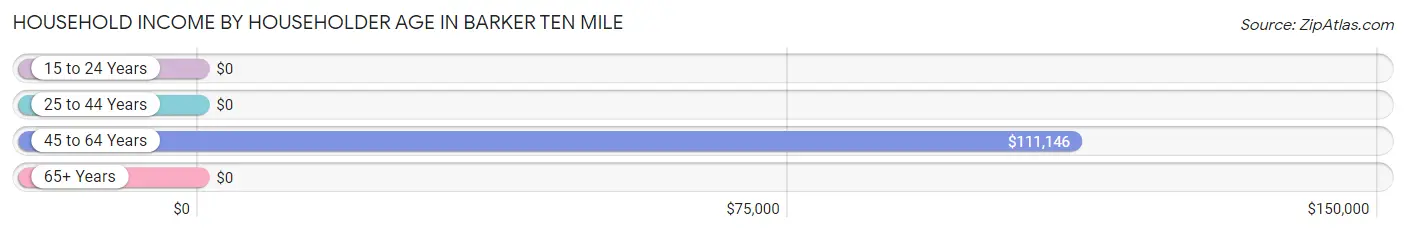
| Income Bracket | # Households | Median Income |
| 15 to 24 Years | 17 (5.3%) | $0 |
| 25 to 44 Years | 85 (26.5%) | $0 |
| 45 to 64 Years | 85 (26.5%) | $111,146 |
| 65+ Years | 134 (41.7%) | $0 |
| Total | 321 (100.0%) | $0 |
Poverty in Barker Ten Mile
Income Below Poverty by Sex and Age in Barker Ten Mile
With 10.3% poverty level for males and 5.6% for females among the residents of Barker Ten Mile, 18 to 24 year old males and 16 and 17 year old females are the most vulnerable to poverty, with 17 males (38.6%) and 13 females (100.0%) in their respective age groups living below the poverty level.
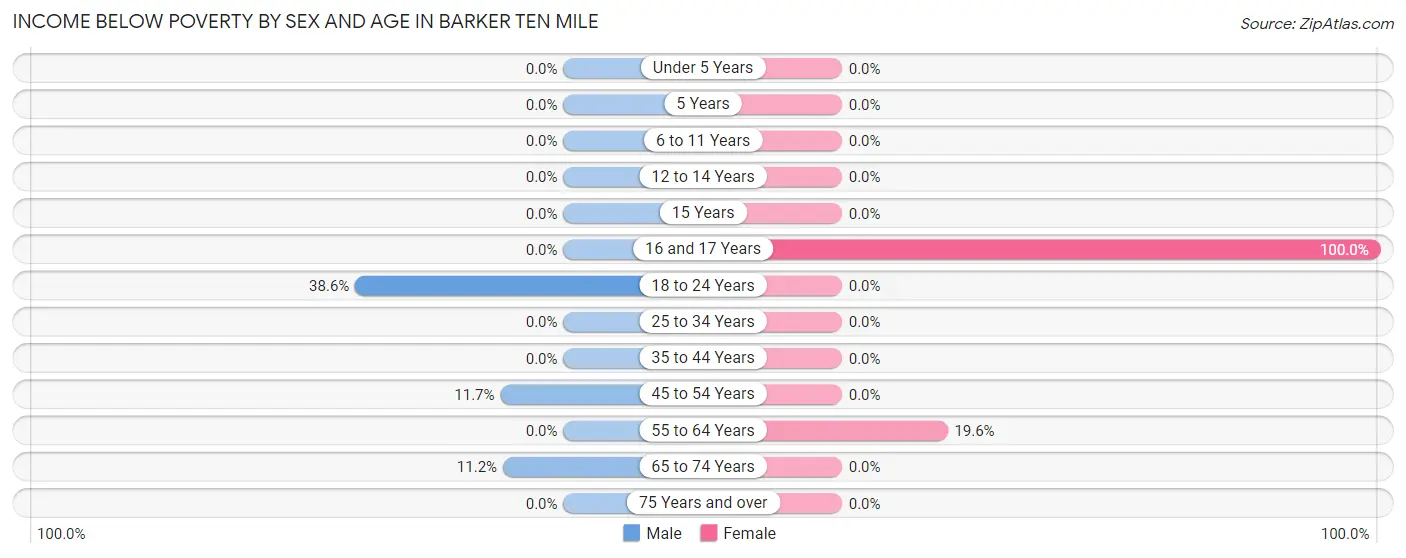
| Age Bracket | Male | Female |
| Under 5 Years | 0 (0.0%) | 0 (0.0%) |
| 5 Years | 0 (0.0%) | 0 (0.0%) |
| 6 to 11 Years | 0 (0.0%) | 0 (0.0%) |
| 12 to 14 Years | 0 (0.0%) | 0 (0.0%) |
| 15 Years | 0 (0.0%) | 0 (0.0%) |
| 16 and 17 Years | 0 (0.0%) | 13 (100.0%) |
| 18 to 24 Years | 17 (38.6%) | 0 (0.0%) |
| 25 to 34 Years | 0 (0.0%) | 0 (0.0%) |
| 35 to 44 Years | 0 (0.0%) | 0 (0.0%) |
| 45 to 54 Years | 9 (11.7%) | 0 (0.0%) |
| 55 to 64 Years | 0 (0.0%) | 10 (19.6%) |
| 65 to 74 Years | 11 (11.2%) | 0 (0.0%) |
| 75 Years and over | 0 (0.0%) | 0 (0.0%) |
| Total | 37 (10.3%) | 23 (5.6%) |
Income Above Poverty by Sex and Age in Barker Ten Mile
According to the poverty statistics in Barker Ten Mile, males aged 15 years and females aged 5 years are the age groups that are most secure financially, with 100.0% of males and 100.0% of females in these age groups living above the poverty line.
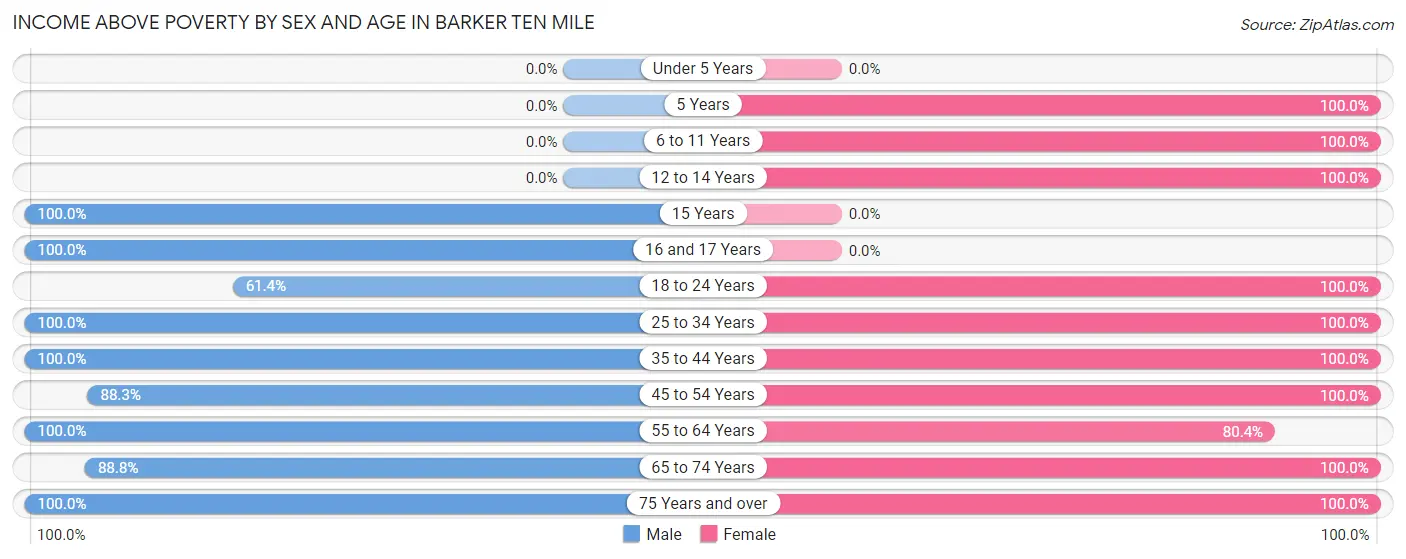
| Age Bracket | Male | Female |
| Under 5 Years | 0 (0.0%) | 0 (0.0%) |
| 5 Years | 0 (0.0%) | 9 (100.0%) |
| 6 to 11 Years | 0 (0.0%) | 12 (100.0%) |
| 12 to 14 Years | 0 (0.0%) | 12 (100.0%) |
| 15 Years | 5 (100.0%) | 0 (0.0%) |
| 16 and 17 Years | 13 (100.0%) | 0 (0.0%) |
| 18 to 24 Years | 27 (61.4%) | 25 (100.0%) |
| 25 to 34 Years | 37 (100.0%) | 26 (100.0%) |
| 35 to 44 Years | 35 (100.0%) | 89 (100.0%) |
| 45 to 54 Years | 68 (88.3%) | 47 (100.0%) |
| 55 to 64 Years | 24 (100.0%) | 41 (80.4%) |
| 65 to 74 Years | 87 (88.8%) | 97 (100.0%) |
| 75 Years and over | 26 (100.0%) | 29 (100.0%) |
| Total | 322 (89.7%) | 387 (94.4%) |
Income Below Poverty Among Married-Couple Families in Barker Ten Mile
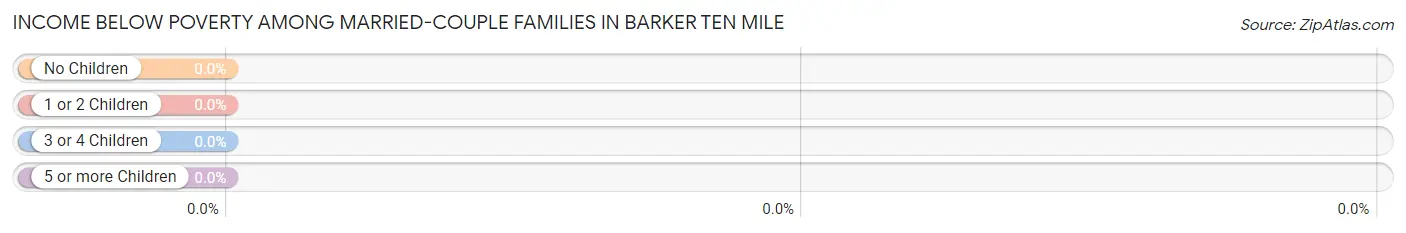
| Children | Above Poverty | Below Poverty |
| No Children | 220 (100.0%) | 0 (0.0%) |
| 1 or 2 Children | 15 (100.0%) | 0 (0.0%) |
| 3 or 4 Children | 15 (100.0%) | 0 (0.0%) |
| 5 or more Children | 0 (0.0%) | 0 (0.0%) |
| Total | 250 (100.0%) | 0 (0.0%) |
Income Below Poverty Among Single-Parent Households in Barker Ten Mile
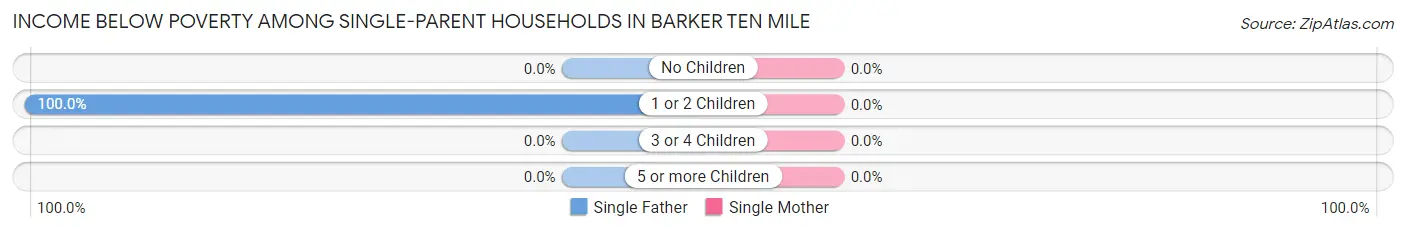
| Children | Single Father | Single Mother |
| No Children | 0 (0.0%) | 0 (0.0%) |
| 1 or 2 Children | 17 (100.0%) | 0 (0.0%) |
| 3 or 4 Children | 0 (0.0%) | 0 (0.0%) |
| 5 or more Children | 0 (0.0%) | 0 (0.0%) |
| Total | 17 (100.0%) | 0 (0.0%) |
Income Below Poverty Among Married-Couple vs Single-Parent Households in Barker Ten Mile
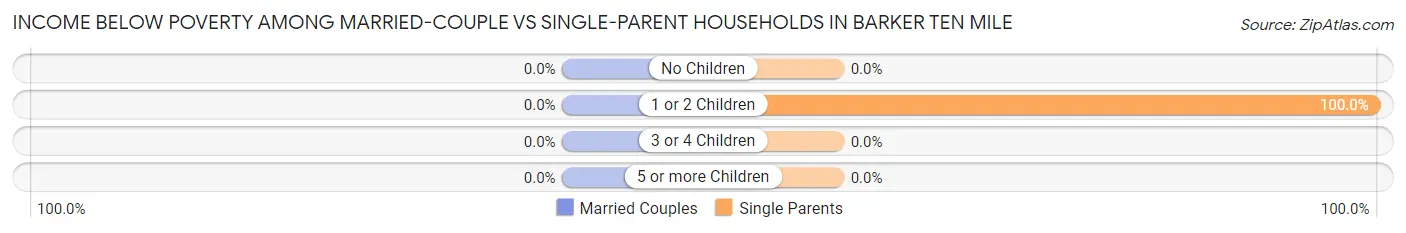
| Children | Married-Couple Families | Single-Parent Households |
| No Children | 0 (0.0%) | 0 (0.0%) |
| 1 or 2 Children | 0 (0.0%) | 17 (100.0%) |
| 3 or 4 Children | 0 (0.0%) | 0 (0.0%) |
| 5 or more Children | 0 (0.0%) | 0 (0.0%) |
| Total | 0 (0.0%) | 17 (100.0%) |
Race in Barker Ten Mile
The most populous races in Barker Ten Mile are White / Caucasian (401 | 52.1%), Native / Alaskan (203 | 26.4%), and Black / African American (165 | 21.5%).
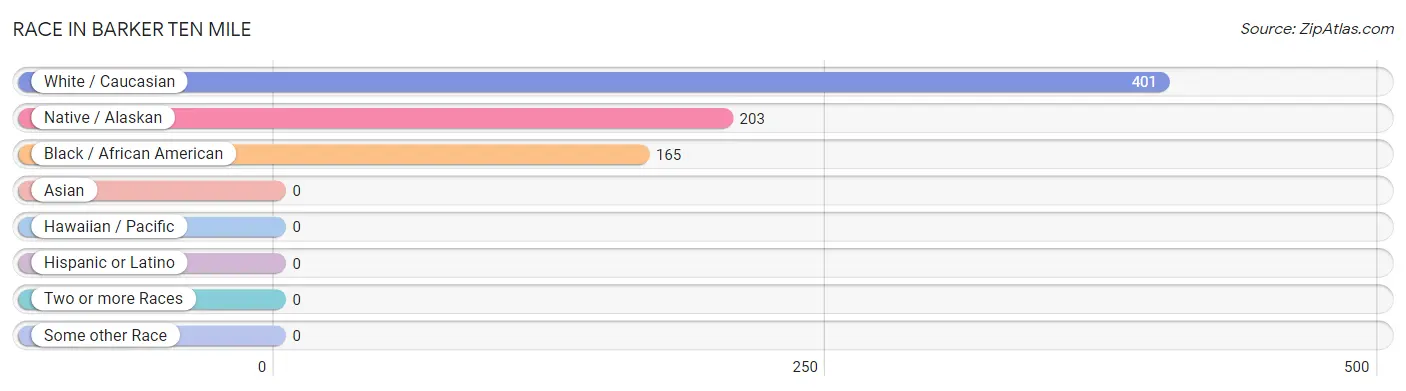
| Race | # Population | % Population |
| Asian | 0 | 0.0% |
| Black / African American | 165 | 21.5% |
| Hawaiian / Pacific | 0 | 0.0% |
| Hispanic or Latino | 0 | 0.0% |
| Native / Alaskan | 203 | 26.4% |
| White / Caucasian | 401 | 52.1% |
| Two or more Races | 0 | 0.0% |
| Some other Race | 0 | 0.0% |
| Total | 769 | 100.0% |
Ancestry in Barker Ten Mile
The most populous ancestries reported in Barker Ten Mile are American (234 | 30.4%), Lumbee (124 | 16.1%), English (68 | 8.8%), Jamaican (51 | 6.6%), and Irish (45 | 5.9%), together accounting for 67.9% of all Barker Ten Mile residents.
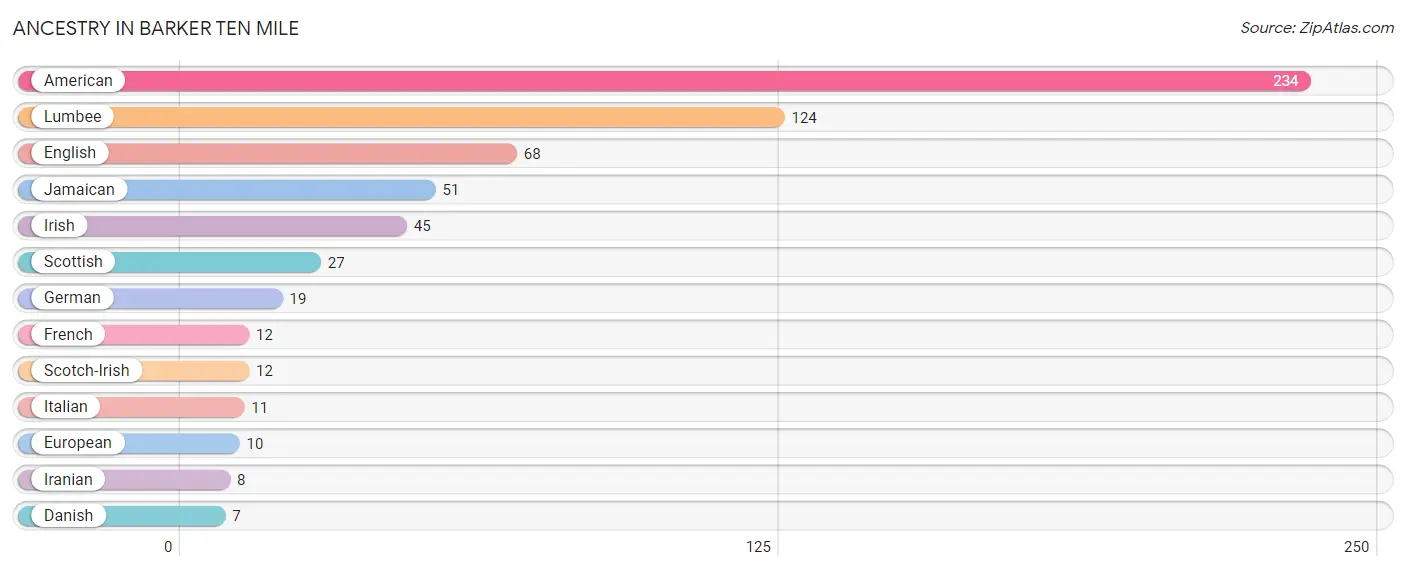
| Ancestry | # Population | % Population |
| American | 234 | 30.4% |
| Danish | 7 | 0.9% |
| English | 68 | 8.8% |
| European | 10 | 1.3% |
| French | 12 | 1.6% |
| German | 19 | 2.5% |
| Iranian | 8 | 1.0% |
| Irish | 45 | 5.9% |
| Italian | 11 | 1.4% |
| Jamaican | 51 | 6.6% |
| Lumbee | 124 | 16.1% |
| Scotch-Irish | 12 | 1.6% |
| Scottish | 27 | 3.5% | View All 13 Rows |
Immigrants in Barker Ten Mile
The most numerous immigrant groups reported in Barker Ten Mile came from Caribbean (21 | 2.7%), Jamaica (21 | 2.7%), Latin America (21 | 2.7%), Asia (8 | 1.0%), and Iran (8 | 1.0%), together accounting for 10.3% of all Barker Ten Mile residents.
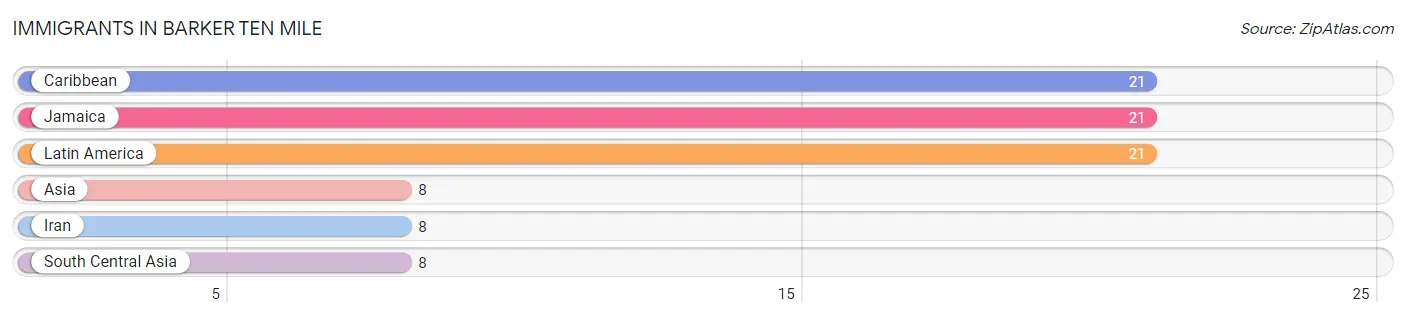
| Immigration Origin | # Population | % Population |
| Asia | 8 | 1.0% |
| Caribbean | 21 | 2.7% |
| Iran | 8 | 1.0% |
| Jamaica | 21 | 2.7% |
| Latin America | 21 | 2.7% |
| South Central Asia | 8 | 1.0% | View All 6 Rows |
Sex and Age in Barker Ten Mile
Sex and Age in Barker Ten Mile
The most populous age groups in Barker Ten Mile are 70 to 74 Years (85 | 23.7%) for men and 65 to 69 Years (76 | 18.5%) for women.
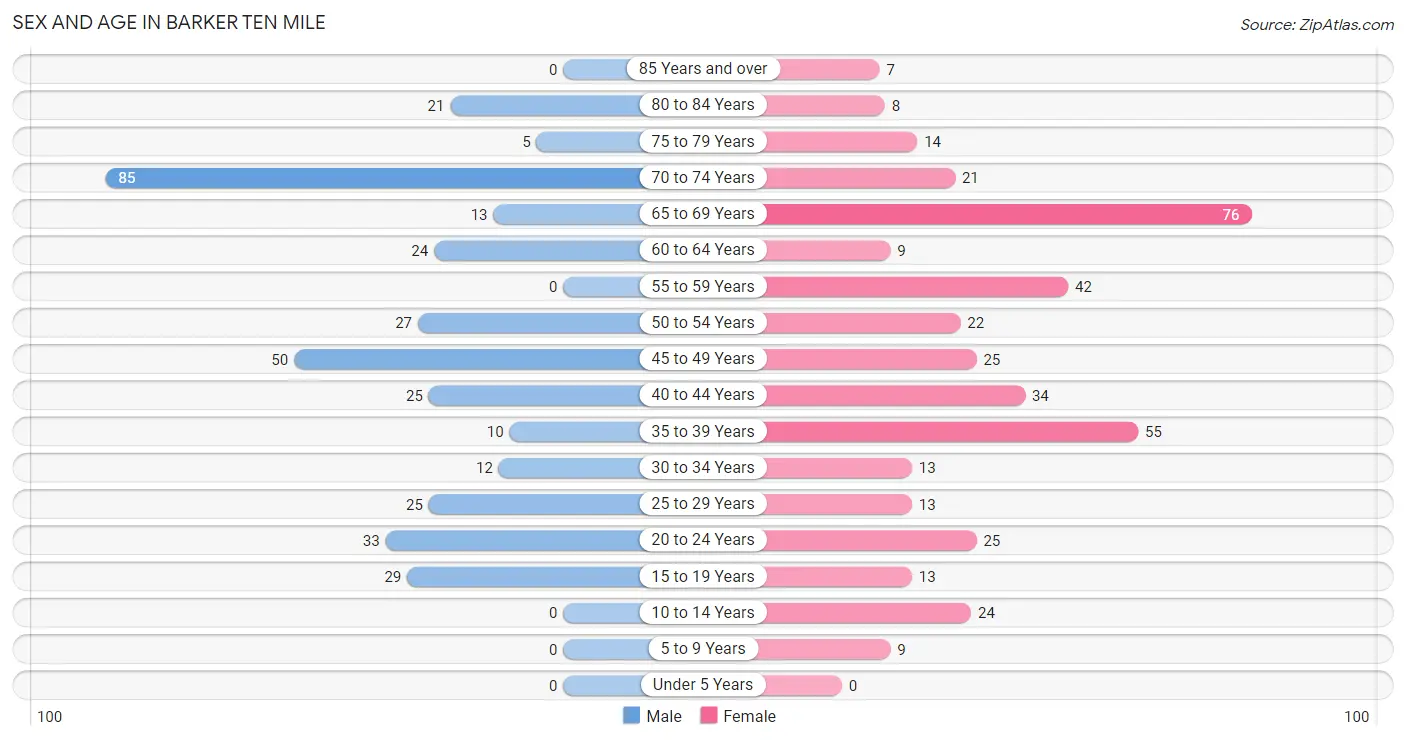
| Age Bracket | Male | Female |
| Under 5 Years | 0 (0.0%) | 0 (0.0%) |
| 5 to 9 Years | 0 (0.0%) | 9 (2.2%) |
| 10 to 14 Years | 0 (0.0%) | 24 (5.9%) |
| 15 to 19 Years | 29 (8.1%) | 13 (3.2%) |
| 20 to 24 Years | 33 (9.2%) | 25 (6.1%) |
| 25 to 29 Years | 25 (7.0%) | 13 (3.2%) |
| 30 to 34 Years | 12 (3.3%) | 13 (3.2%) |
| 35 to 39 Years | 10 (2.8%) | 55 (13.4%) |
| 40 to 44 Years | 25 (7.0%) | 34 (8.3%) |
| 45 to 49 Years | 50 (13.9%) | 25 (6.1%) |
| 50 to 54 Years | 27 (7.5%) | 22 (5.4%) |
| 55 to 59 Years | 0 (0.0%) | 42 (10.2%) |
| 60 to 64 Years | 24 (6.7%) | 9 (2.2%) |
| 65 to 69 Years | 13 (3.6%) | 76 (18.5%) |
| 70 to 74 Years | 85 (23.7%) | 21 (5.1%) |
| 75 to 79 Years | 5 (1.4%) | 14 (3.4%) |
| 80 to 84 Years | 21 (5.9%) | 8 (1.9%) |
| 85 Years and over | 0 (0.0%) | 7 (1.7%) |
| Total | 359 (100.0%) | 410 (100.0%) |
Families and Households in Barker Ten Mile
Median Family Size in Barker Ten Mile
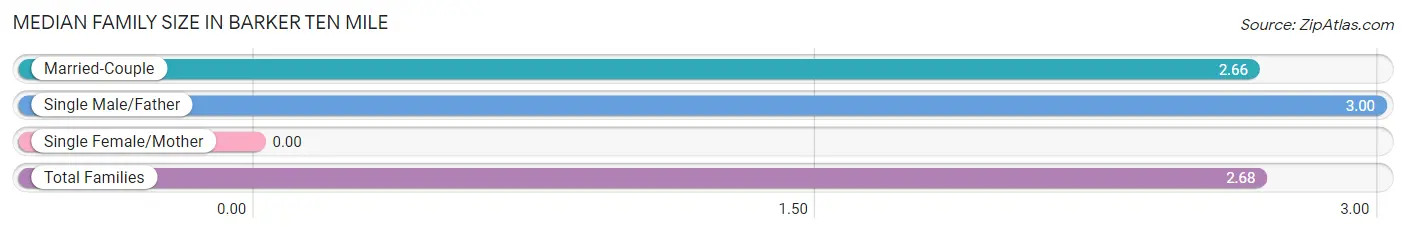
| Family Type | # Families | Family Size |
| Married-Couple | 250 (93.6%) | 2.66 |
| Single Male/Father | 17 (6.4%) | 3.00 |
| Single Female/Mother | 0 (0.0%) | - |
| Total Families | 267 (100.0%) | 2.68 |
Median Household Size in Barker Ten Mile
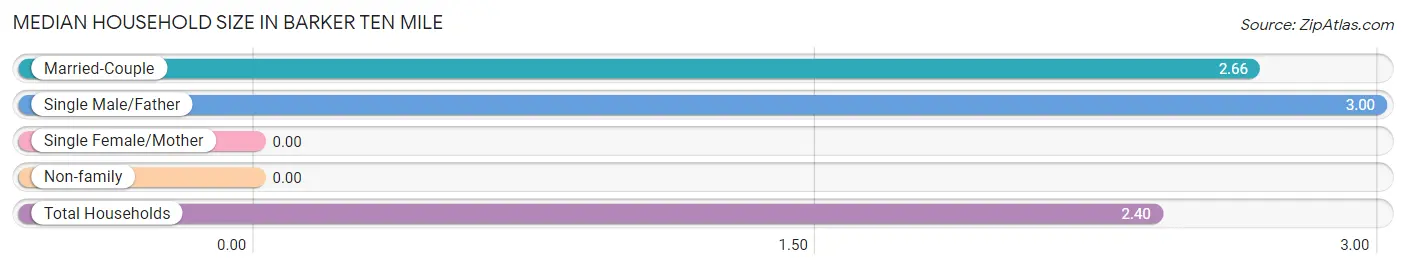
| Household Type | # Households | Household Size |
| Married-Couple | 250 (77.9%) | 2.66 |
| Single Male/Father | 17 (5.3%) | 3.00 |
| Single Female/Mother | 0 (0.0%) | - |
| Non-family | 54 (16.8%) | - |
| Total Households | 321 (100.0%) | 2.40 |
Household Size by Marriage Status in Barker Ten Mile
Out of a total of 321 households in Barker Ten Mile, 267 (83.2%) are family households, while 54 (16.8%) are nonfamily households. The most numerous type of family households are 2-person households, comprising 188, and the most common type of nonfamily households are 1-person households, comprising 54.
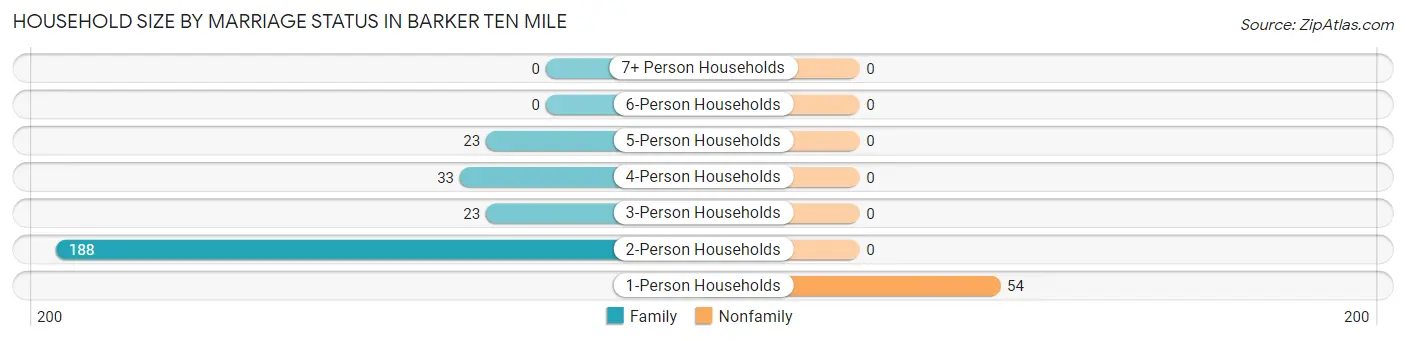
| Household Size | Family Households | Nonfamily Households |
| 1-Person Households | - | 54 (16.8%) |
| 2-Person Households | 188 (58.6%) | 0 (0.0%) |
| 3-Person Households | 23 (7.2%) | 0 (0.0%) |
| 4-Person Households | 33 (10.3%) | 0 (0.0%) |
| 5-Person Households | 23 (7.2%) | 0 (0.0%) |
| 6-Person Households | 0 (0.0%) | 0 (0.0%) |
| 7+ Person Households | 0 (0.0%) | 0 (0.0%) |
| Total | 267 (83.2%) | 54 (16.8%) |
Female Fertility in Barker Ten Mile
Fertility by Age in Barker Ten Mile
| Age Bracket | Women with Births | Births / 1,000 Women |
| 15 to 19 years | 0 (0.0%) | 0.0 |
| 20 to 34 years | 0 (0.0%) | 0.0 |
| 35 to 50 years | 0 (0.0%) | 0.0 |
| Total | 0 (0.0%) | 0.0 |
Fertility by Age by Marriage Status in Barker Ten Mile
| Age Bracket | Married | Unmarried |
| 15 to 19 years | 0 (0.0%) | 0 (0.0%) |
| 20 to 34 years | 0 (0.0%) | 0 (0.0%) |
| 35 to 50 years | 0 (0.0%) | 0 (0.0%) |
| Total | 0 (0.0%) | 0 (0.0%) |
Fertility by Education in Barker Ten Mile
| Educational Attainment | Women with Births | Births / 1,000 Women |
| Less than High School | 0 (0.0%) | 0.0 |
| High School Diploma | 0 (0.0%) | 0.0 |
| College or Associate's Degree | 0 (0.0%) | 0.0 |
| Bachelor's Degree | 0 (0.0%) | 0.0 |
| Graduate Degree | 0 (0.0%) | 0.0 |
| Total | 0 (0.0%) | 0.0 |
Fertility by Education by Marriage Status in Barker Ten Mile
| Educational Attainment | Married | Unmarried |
| Less than High School | 0 (0.0%) | 0 (0.0%) |
| High School Diploma | 0 (0.0%) | 0 (0.0%) |
| College or Associate's Degree | 0 (0.0%) | 0 (0.0%) |
| Bachelor's Degree | 0 (0.0%) | 0 (0.0%) |
| Graduate Degree | 0 (0.0%) | 0 (0.0%) |
| Total | 0 (0.0%) | 0 (0.0%) |
Employment Characteristics in Barker Ten Mile
Employment by Class of Employer in Barker Ten Mile
Among the 402 employed individuals in Barker Ten Mile, private company employees (224 | 55.7%), not-for-profit organizations (76 | 18.9%), and local government employees (64 | 15.9%) make up the most common classes of employment.
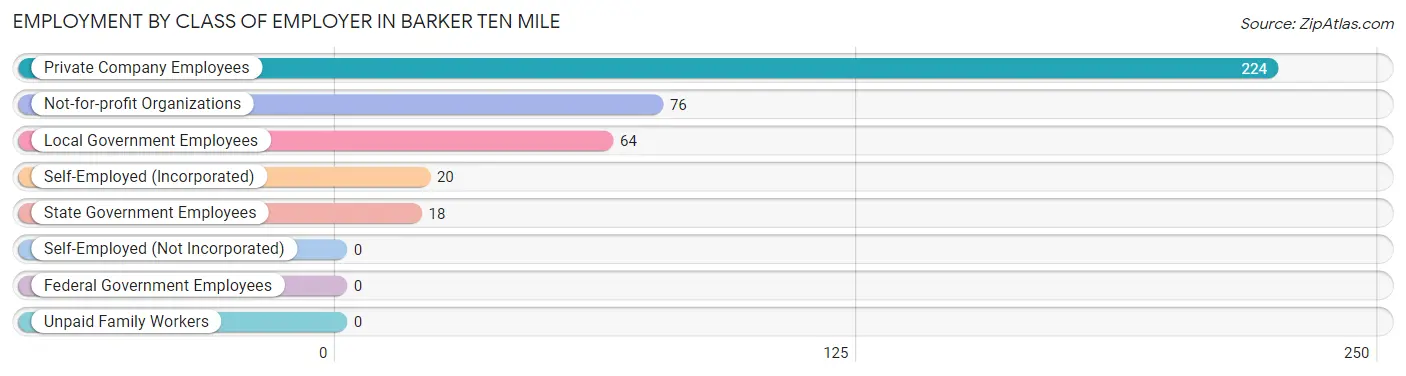
| Employer Class | # Employees | % Employees |
| Private Company Employees | 224 | 55.7% |
| Self-Employed (Incorporated) | 20 | 5.0% |
| Self-Employed (Not Incorporated) | 0 | 0.0% |
| Not-for-profit Organizations | 76 | 18.9% |
| Local Government Employees | 64 | 15.9% |
| State Government Employees | 18 | 4.5% |
| Federal Government Employees | 0 | 0.0% |
| Unpaid Family Workers | 0 | 0.0% |
| Total | 402 | 100.0% |
Employment Status by Age in Barker Ten Mile
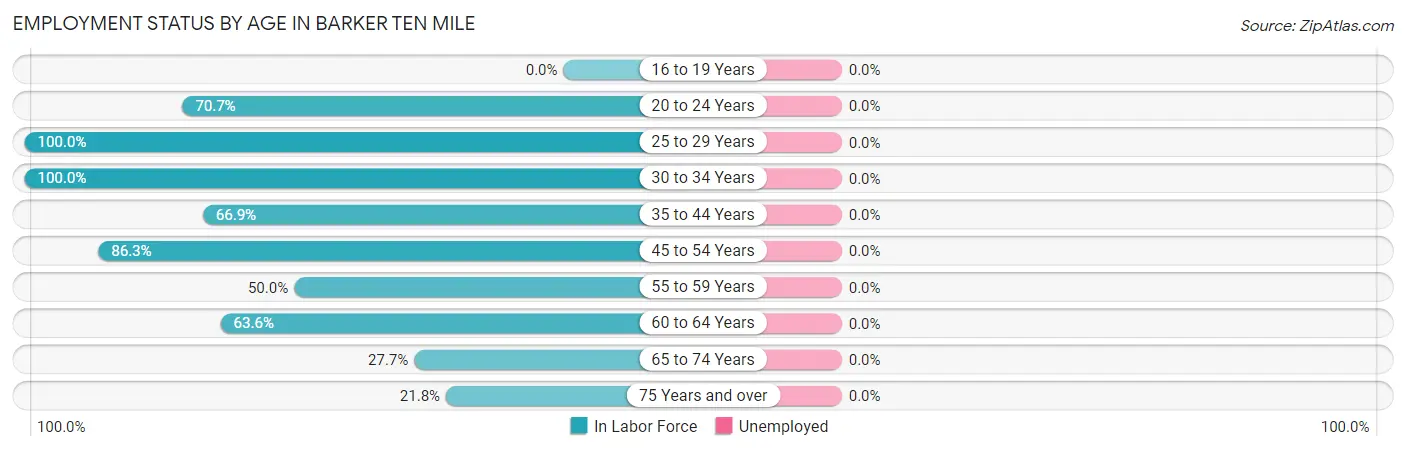
| Age Bracket | In Labor Force | Unemployed |
| 16 to 19 Years | 0 (0.0%) | 0 (0.0%) |
| 20 to 24 Years | 41 (70.7%) | 0 (0.0%) |
| 25 to 29 Years | 38 (100.0%) | 0 (0.0%) |
| 30 to 34 Years | 25 (100.0%) | 0 (0.0%) |
| 35 to 44 Years | 83 (66.9%) | 0 (0.0%) |
| 45 to 54 Years | 107 (86.3%) | 0 (0.0%) |
| 55 to 59 Years | 21 (50.0%) | 0 (0.0%) |
| 60 to 64 Years | 21 (63.6%) | 0 (0.0%) |
| 65 to 74 Years | 54 (27.7%) | 0 (0.0%) |
| 75 Years and over | 12 (21.8%) | 0 (0.0%) |
| Total | 402 (55.0%) | 0 (0.0%) |
Employment Status by Educational Attainment in Barker Ten Mile
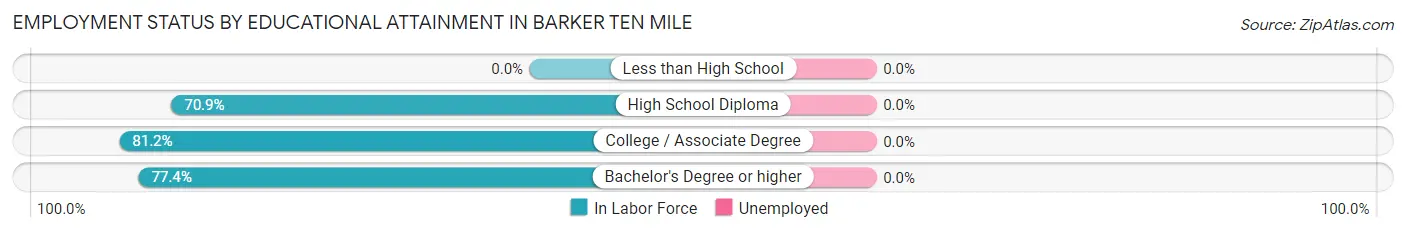
| Educational Attainment | In Labor Force | Unemployed |
| Less than High School | 0 (0.0%) | 0 (0.0%) |
| High School Diploma | 83 (70.9%) | 0 (0.0%) |
| College / Associate Degree | 82 (81.2%) | 0 (0.0%) |
| Bachelor's Degree or higher | 130 (77.4%) | 0 (0.0%) |
| Total | 295 (76.4%) | 0 (0.0%) |
Employment Occupations by Sex in Barker Ten Mile
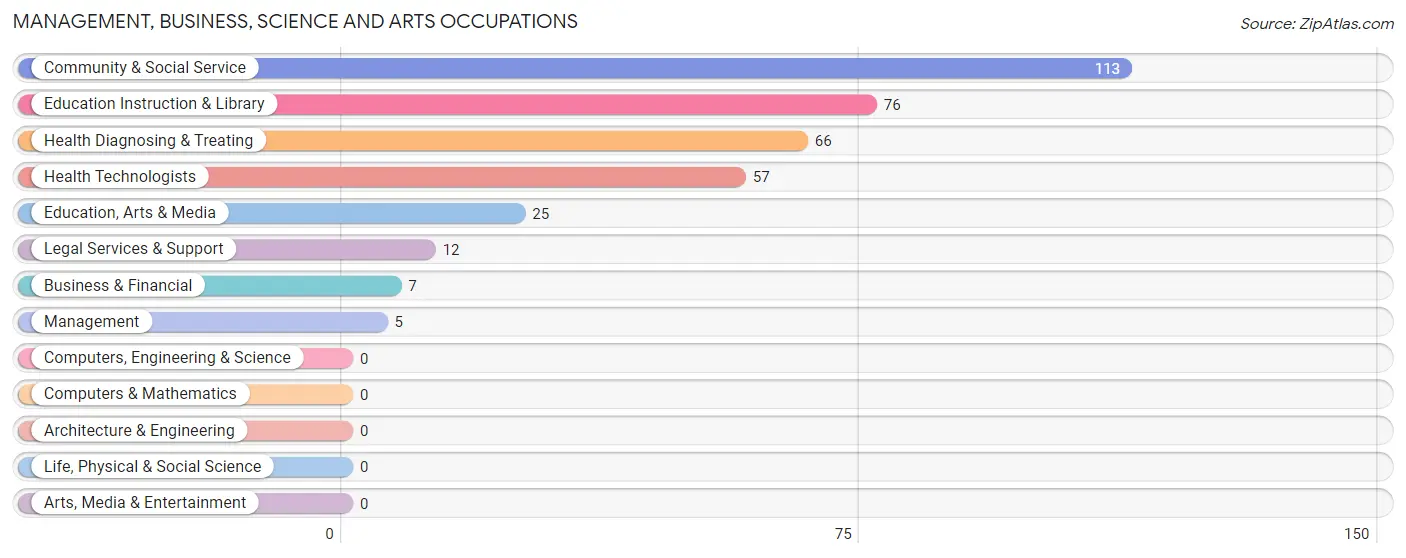
Management, Business, Science and Arts Occupations
The most common Management, Business, Science and Arts occupations in Barker Ten Mile are Community & Social Service (113 | 28.1%), Education Instruction & Library (76 | 18.9%), Health Diagnosing & Treating (66 | 16.4%), Health Technologists (57 | 14.2%), and Education, Arts & Media (25 | 6.2%).
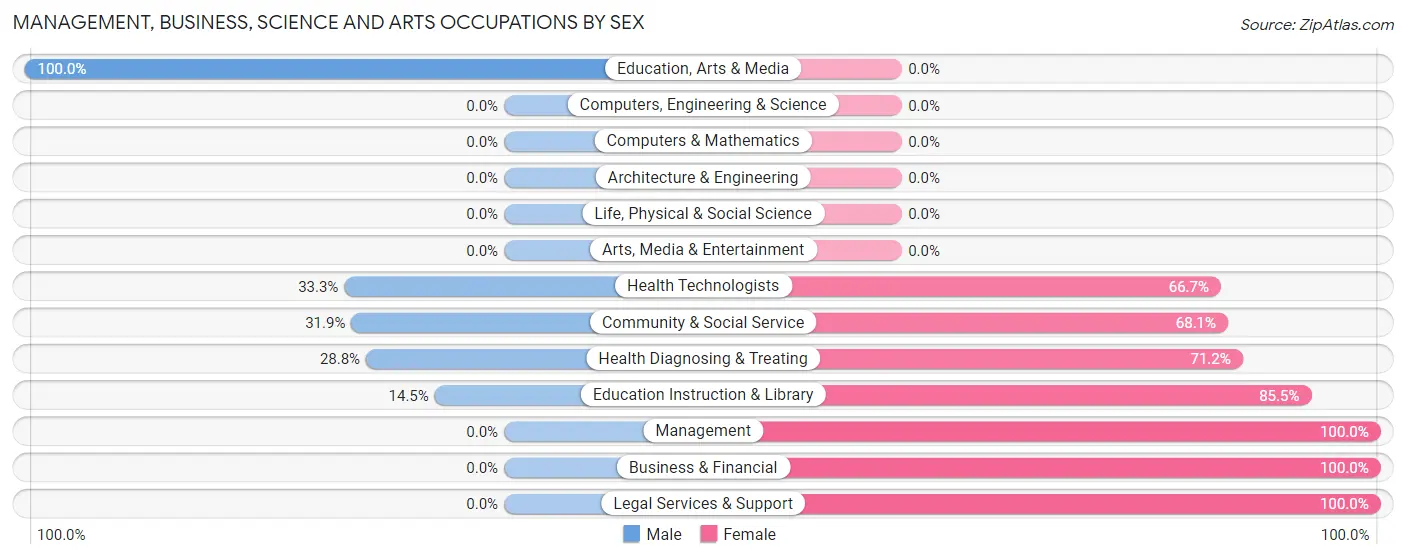
Management, Business, Science and Arts Occupations by Sex
Within the Management, Business, Science and Arts occupations in Barker Ten Mile, the most male-oriented occupations are Education, Arts & Media (100.0%), Health Technologists (33.3%), and Community & Social Service (31.9%), while the most female-oriented occupations are Management (100.0%), Business & Financial (100.0%), and Legal Services & Support (100.0%).
| Occupation | Male | Female |
| Management | 0 (0.0%) | 5 (100.0%) |
| Business & Financial | 0 (0.0%) | 7 (100.0%) |
| Computers, Engineering & Science | 0 (0.0%) | 0 (0.0%) |
| Computers & Mathematics | 0 (0.0%) | 0 (0.0%) |
| Architecture & Engineering | 0 (0.0%) | 0 (0.0%) |
| Life, Physical & Social Science | 0 (0.0%) | 0 (0.0%) |
| Community & Social Service | 36 (31.9%) | 77 (68.1%) |
| Education, Arts & Media | 25 (100.0%) | 0 (0.0%) |
| Legal Services & Support | 0 (0.0%) | 12 (100.0%) |
| Education Instruction & Library | 11 (14.5%) | 65 (85.5%) |
| Arts, Media & Entertainment | 0 (0.0%) | 0 (0.0%) |
| Health Diagnosing & Treating | 19 (28.8%) | 47 (71.2%) |
| Health Technologists | 19 (33.3%) | 38 (66.7%) |
| Total (Category) | 55 (28.8%) | 136 (71.2%) |
| Total (Overall) | 205 (51.0%) | 197 (49.0%) |
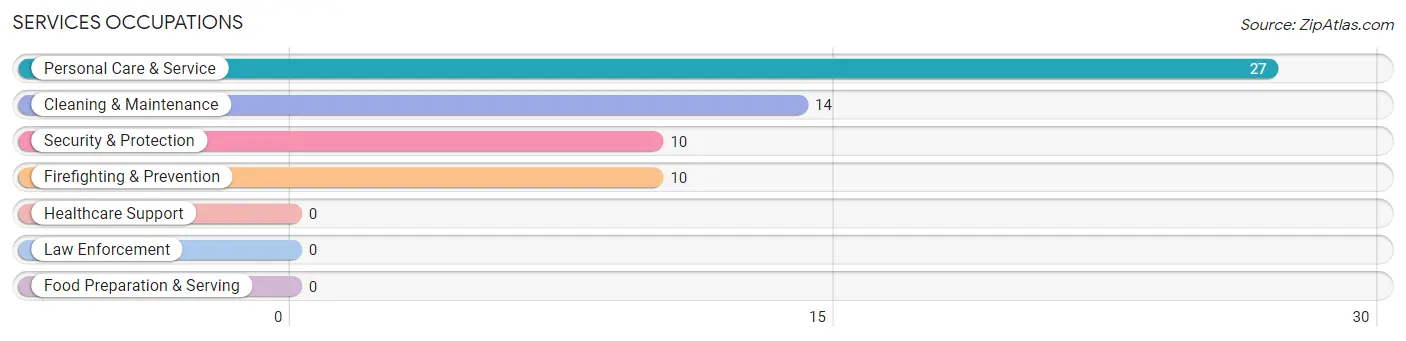
Services Occupations
The most common Services occupations in Barker Ten Mile are Personal Care & Service (27 | 6.7%), Cleaning & Maintenance (14 | 3.5%), Security & Protection (10 | 2.5%), and Firefighting & Prevention (10 | 2.5%).
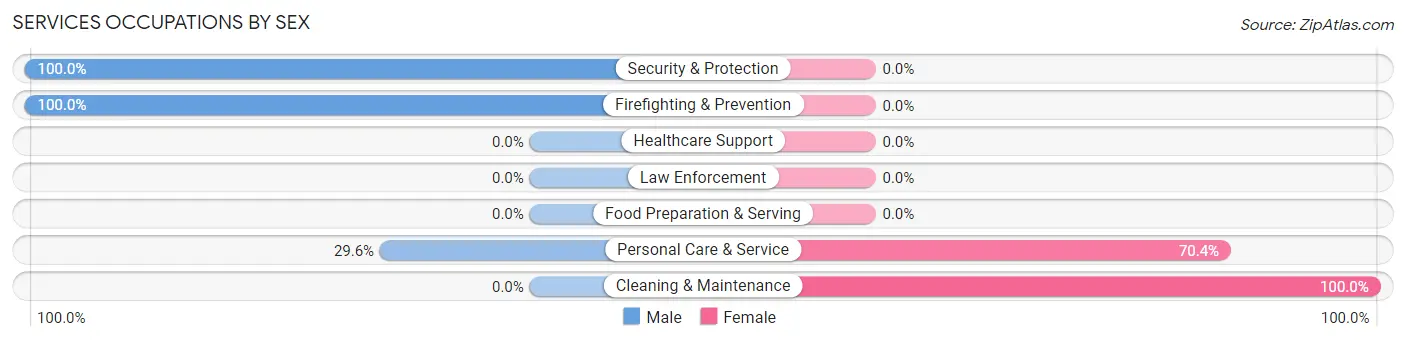
Services Occupations by Sex
Within the Services occupations in Barker Ten Mile, the most male-oriented occupations are Security & Protection (100.0%), Firefighting & Prevention (100.0%), and Personal Care & Service (29.6%), while the most female-oriented occupations are Cleaning & Maintenance (100.0%), and Personal Care & Service (70.4%).
| Occupation | Male | Female |
| Healthcare Support | 0 (0.0%) | 0 (0.0%) |
| Security & Protection | 10 (100.0%) | 0 (0.0%) |
| Firefighting & Prevention | 10 (100.0%) | 0 (0.0%) |
| Law Enforcement | 0 (0.0%) | 0 (0.0%) |
| Food Preparation & Serving | 0 (0.0%) | 0 (0.0%) |
| Cleaning & Maintenance | 0 (0.0%) | 14 (100.0%) |
| Personal Care & Service | 8 (29.6%) | 19 (70.4%) |
| Total (Category) | 18 (35.3%) | 33 (64.7%) |
| Total (Overall) | 205 (51.0%) | 197 (49.0%) |
Sales and Office Occupations
The most common Sales and Office occupations in Barker Ten Mile are Office & Administration (28 | 7.0%), and Sales & Related (17 | 4.2%).
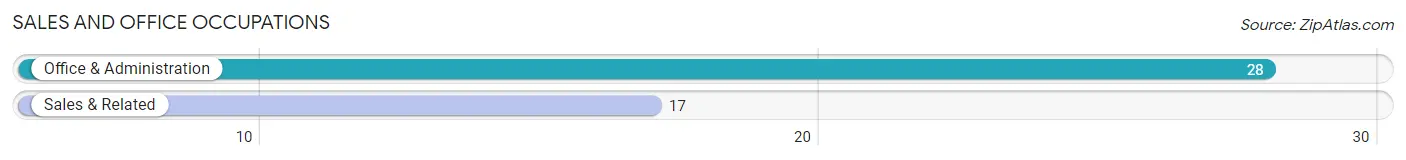
Sales and Office Occupations by Sex

| Occupation | Male | Female |
| Sales & Related | 17 (100.0%) | 0 (0.0%) |
| Office & Administration | 0 (0.0%) | 28 (100.0%) |
| Total (Category) | 17 (37.8%) | 28 (62.2%) |
| Total (Overall) | 205 (51.0%) | 197 (49.0%) |
Natural Resources, Construction and Maintenance Occupations
The most common Natural Resources, Construction and Maintenance occupations in Barker Ten Mile are , and Installation, Maintenance & Repair (13 | 3.2%).
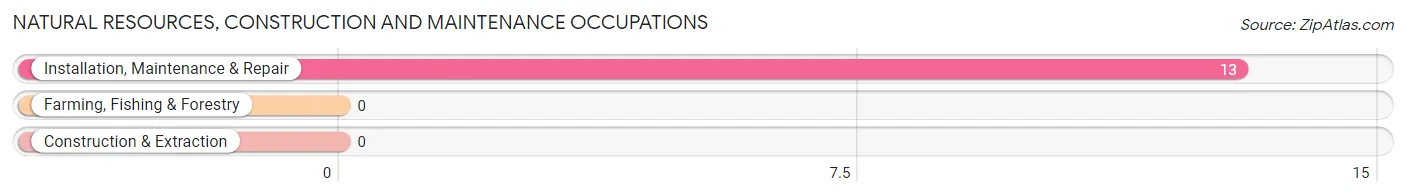
Natural Resources, Construction and Maintenance Occupations by Sex

| Occupation | Male | Female |
| Farming, Fishing & Forestry | 0 (0.0%) | 0 (0.0%) |
| Construction & Extraction | 0 (0.0%) | 0 (0.0%) |
| Installation, Maintenance & Repair | 13 (100.0%) | 0 (0.0%) |
| Total (Category) | 13 (100.0%) | 0 (0.0%) |
| Total (Overall) | 205 (51.0%) | 197 (49.0%) |
Production, Transportation and Moving Occupations
The most common Production, Transportation and Moving occupations in Barker Ten Mile are Material Moving (44 | 11.0%), Transportation (32 | 8.0%), and Production (26 | 6.5%).
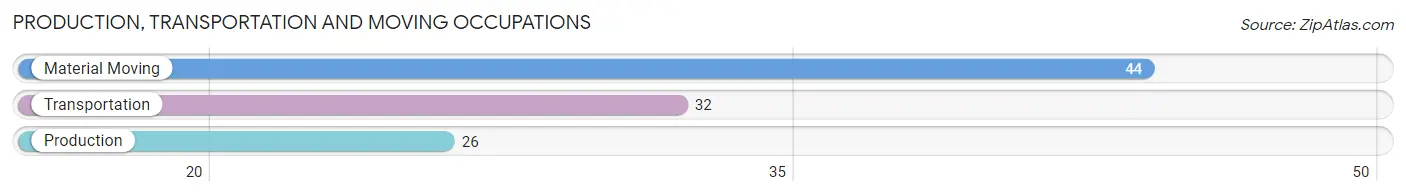
Production, Transportation and Moving Occupations by Sex
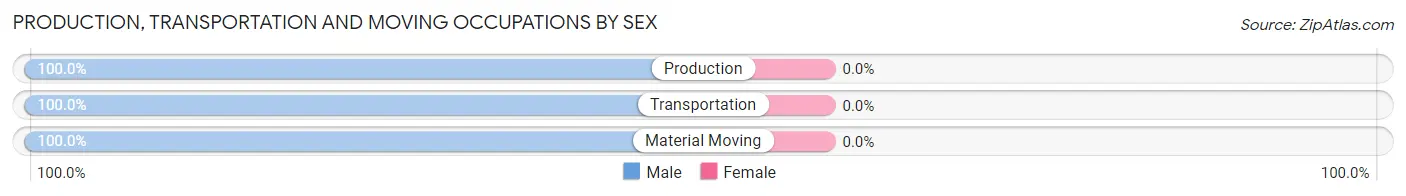
| Occupation | Male | Female |
| Production | 26 (100.0%) | 0 (0.0%) |
| Transportation | 32 (100.0%) | 0 (0.0%) |
| Material Moving | 44 (100.0%) | 0 (0.0%) |
| Total (Category) | 102 (100.0%) | 0 (0.0%) |
| Total (Overall) | 205 (51.0%) | 197 (49.0%) |
Employment Industries by Sex in Barker Ten Mile
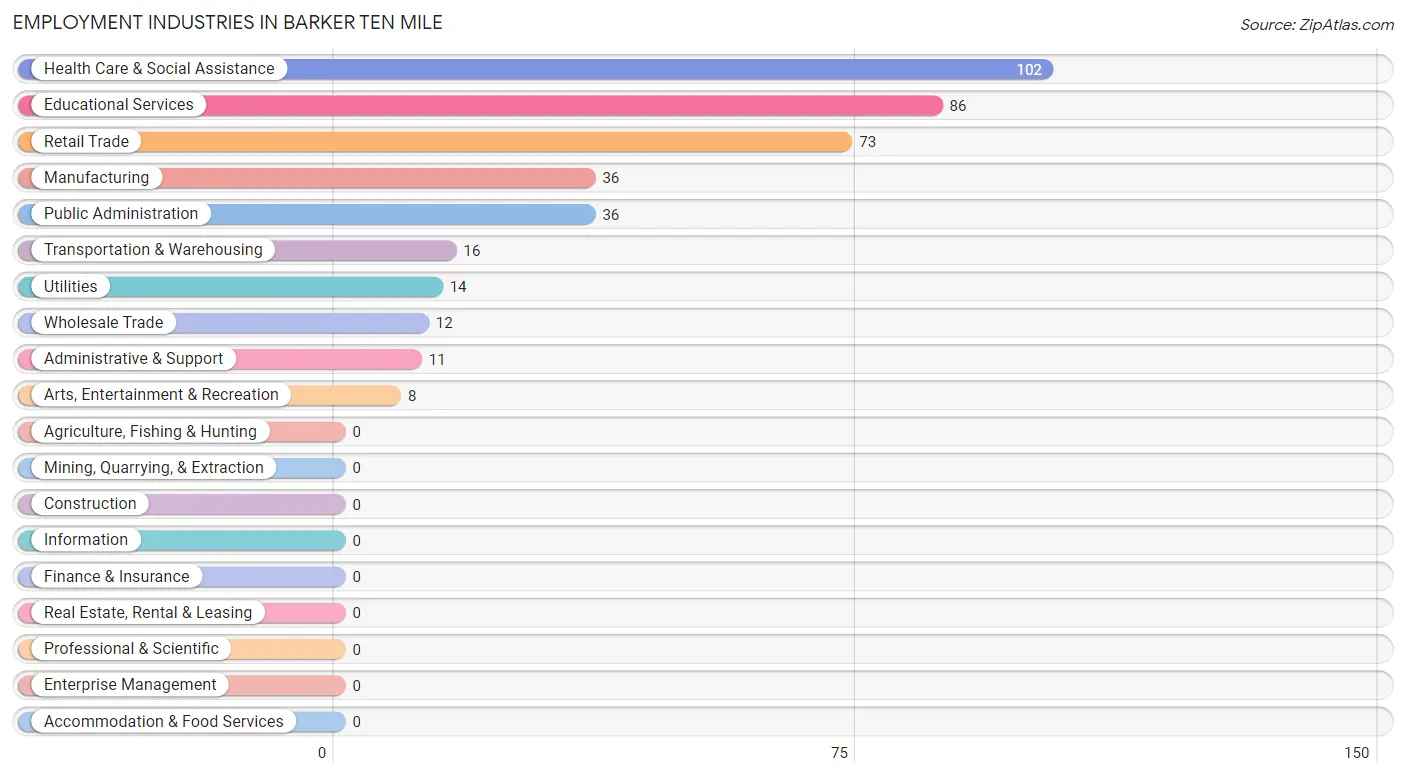
Employment Industries in Barker Ten Mile
The major employment industries in Barker Ten Mile include Health Care & Social Assistance (102 | 25.4%), Educational Services (86 | 21.4%), Retail Trade (73 | 18.2%), Manufacturing (36 | 9.0%), and Public Administration (36 | 9.0%).
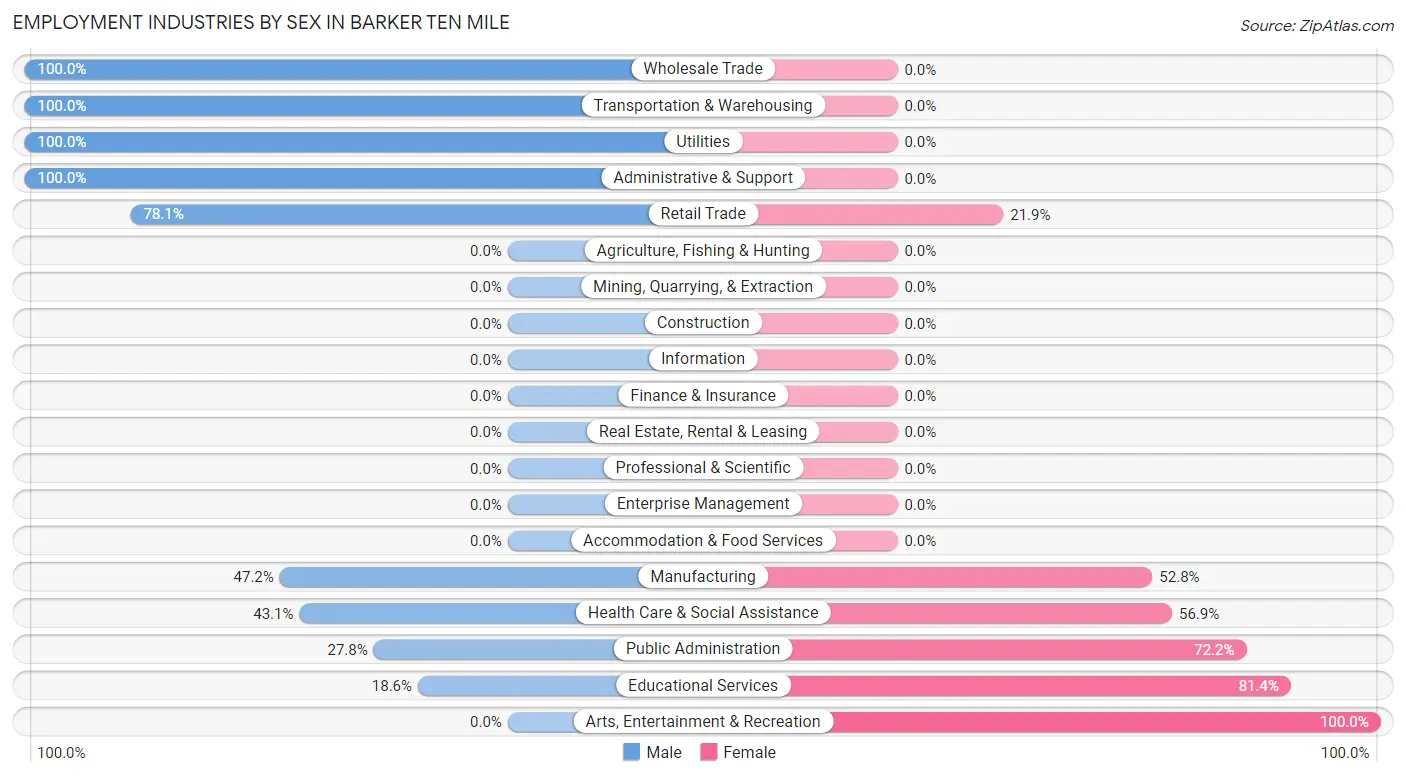
Employment Industries by Sex in Barker Ten Mile
The Barker Ten Mile industries that see more men than women are Wholesale Trade (100.0%), Transportation & Warehousing (100.0%), and Utilities (100.0%), whereas the industries that tend to have a higher number of women are Arts, Entertainment & Recreation (100.0%), Educational Services (81.4%), and Public Administration (72.2%).
| Industry | Male | Female |
| Agriculture, Fishing & Hunting | 0 (0.0%) | 0 (0.0%) |
| Mining, Quarrying, & Extraction | 0 (0.0%) | 0 (0.0%) |
| Construction | 0 (0.0%) | 0 (0.0%) |
| Manufacturing | 17 (47.2%) | 19 (52.8%) |
| Wholesale Trade | 12 (100.0%) | 0 (0.0%) |
| Retail Trade | 57 (78.1%) | 16 (21.9%) |
| Transportation & Warehousing | 16 (100.0%) | 0 (0.0%) |
| Utilities | 14 (100.0%) | 0 (0.0%) |
| Information | 0 (0.0%) | 0 (0.0%) |
| Finance & Insurance | 0 (0.0%) | 0 (0.0%) |
| Real Estate, Rental & Leasing | 0 (0.0%) | 0 (0.0%) |
| Professional & Scientific | 0 (0.0%) | 0 (0.0%) |
| Enterprise Management | 0 (0.0%) | 0 (0.0%) |
| Administrative & Support | 11 (100.0%) | 0 (0.0%) |
| Educational Services | 16 (18.6%) | 70 (81.4%) |
| Health Care & Social Assistance | 44 (43.1%) | 58 (56.9%) |
| Arts, Entertainment & Recreation | 0 (0.0%) | 8 (100.0%) |
| Accommodation & Food Services | 0 (0.0%) | 0 (0.0%) |
| Public Administration | 10 (27.8%) | 26 (72.2%) |
| Total | 205 (51.0%) | 197 (49.0%) |
Education in Barker Ten Mile
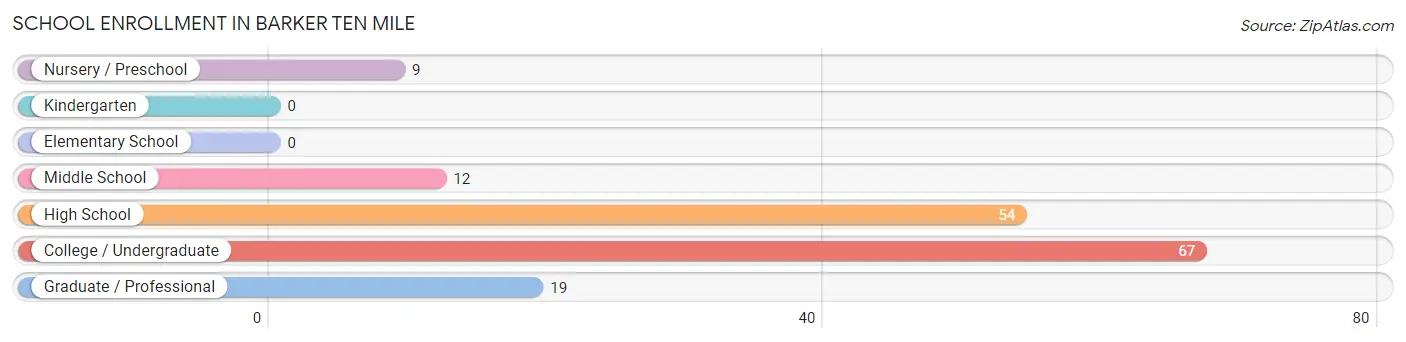
School Enrollment in Barker Ten Mile
The most common levels of schooling among the 161 students in Barker Ten Mile are college / undergraduate (67 | 41.6%), high school (54 | 33.5%), and graduate / professional (19 | 11.8%).
| School Level | # Students | % Students |
| Nursery / Preschool | 9 | 5.6% |
| Kindergarten | 0 | 0.0% |
| Elementary School | 0 | 0.0% |
| Middle School | 12 | 7.4% |
| High School | 54 | 33.5% |
| College / Undergraduate | 67 | 41.6% |
| Graduate / Professional | 19 | 11.8% |
| Total | 161 | 100.0% |
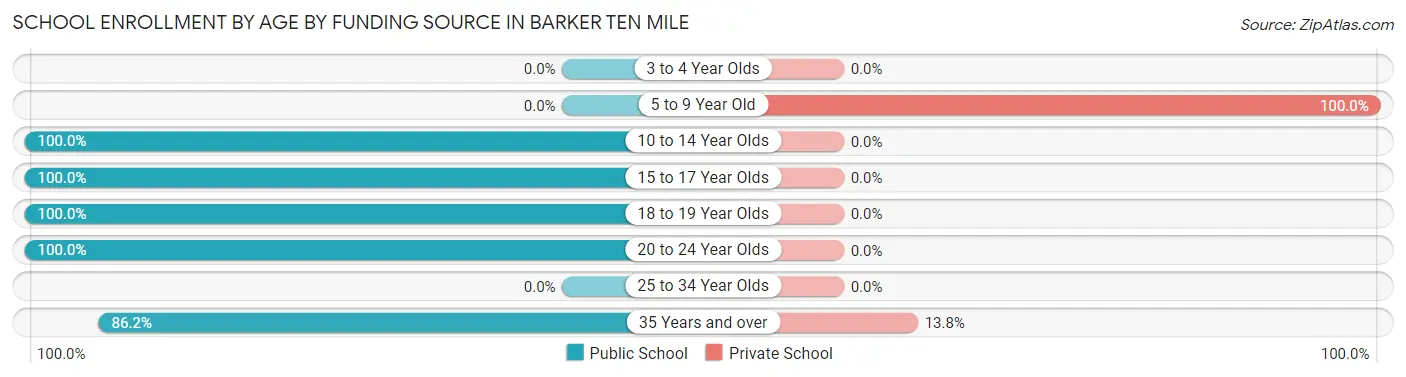
School Enrollment by Age by Funding Source in Barker Ten Mile
Out of a total of 161 students who are enrolled in schools in Barker Ten Mile, 17 (10.6%) attend a private institution, while the remaining 144 (89.4%) are enrolled in public schools. The age group of 5 to 9 year old has the highest likelihood of being enrolled in private schools, with 9 (100.0% in the age bracket) enrolled. Conversely, the age group of 10 to 14 year olds has the lowest likelihood of being enrolled in a private school, with 24 (100.0% in the age bracket) attending a public institution.
| Age Bracket | Public School | Private School |
| 3 to 4 Year Olds | 0 (0.0%) | 0 (0.0%) |
| 5 to 9 Year Old | 0 (0.0%) | 9 (100.0%) |
| 10 to 14 Year Olds | 24 (100.0%) | 0 (0.0%) |
| 15 to 17 Year Olds | 31 (100.0%) | 0 (0.0%) |
| 18 to 19 Year Olds | 11 (100.0%) | 0 (0.0%) |
| 20 to 24 Year Olds | 28 (100.0%) | 0 (0.0%) |
| 25 to 34 Year Olds | 0 (0.0%) | 0 (0.0%) |
| 35 Years and over | 50 (86.2%) | 8 (13.8%) |
| Total | 144 (89.4%) | 17 (10.6%) |
Educational Attainment by Field of Study in Barker Ten Mile
Education (62 | 20.3%), social sciences (48 | 15.7%), business (37 | 12.1%), science & technology (35 | 11.4%), and arts & humanities (31 | 10.1%) are the most common fields of study among 306 individuals in Barker Ten Mile who have obtained a bachelor's degree or higher.
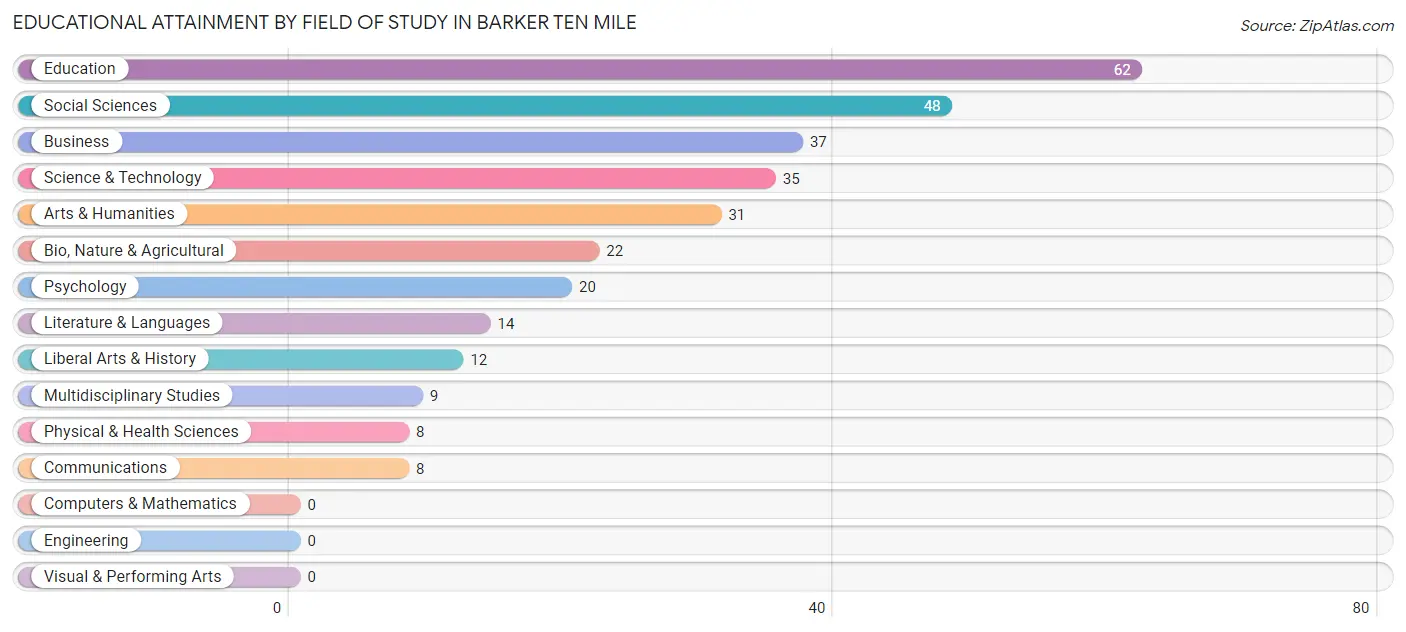
| Field of Study | # Graduates | % Graduates |
| Computers & Mathematics | 0 | 0.0% |
| Bio, Nature & Agricultural | 22 | 7.2% |
| Physical & Health Sciences | 8 | 2.6% |
| Psychology | 20 | 6.5% |
| Social Sciences | 48 | 15.7% |
| Engineering | 0 | 0.0% |
| Multidisciplinary Studies | 9 | 2.9% |
| Science & Technology | 35 | 11.4% |
| Business | 37 | 12.1% |
| Education | 62 | 20.3% |
| Literature & Languages | 14 | 4.6% |
| Liberal Arts & History | 12 | 3.9% |
| Visual & Performing Arts | 0 | 0.0% |
| Communications | 8 | 2.6% |
| Arts & Humanities | 31 | 10.1% |
| Total | 306 | 100.0% |
Transportation & Commute in Barker Ten Mile
Vehicle Availability by Sex in Barker Ten Mile
The most prevalent vehicle ownership categories in Barker Ten Mile are males with 3 vehicles (67, accounting for 32.7%) and females with 3 vehicles (71, making up 34.0%).
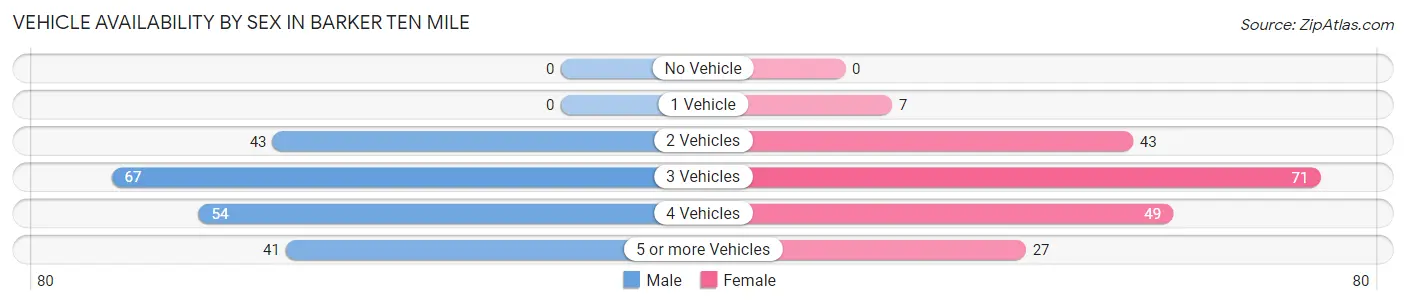
| Vehicles Available | Male | Female |
| No Vehicle | 0 (0.0%) | 0 (0.0%) |
| 1 Vehicle | 0 (0.0%) | 7 (3.5%) |
| 2 Vehicles | 43 (21.0%) | 43 (21.8%) |
| 3 Vehicles | 67 (32.7%) | 71 (36.0%) |
| 4 Vehicles | 54 (26.3%) | 49 (24.9%) |
| 5 or more Vehicles | 41 (20.0%) | 27 (13.7%) |
| Total | 205 (100.0%) | 197 (100.0%) |
Commute Time in Barker Ten Mile
The most frequently occuring commute durations in Barker Ten Mile are 20 to 24 minutes (80 commuters, 19.9%), 10 to 14 minutes (58 commuters, 14.4%), and 30 to 34 minutes (51 commuters, 12.7%).
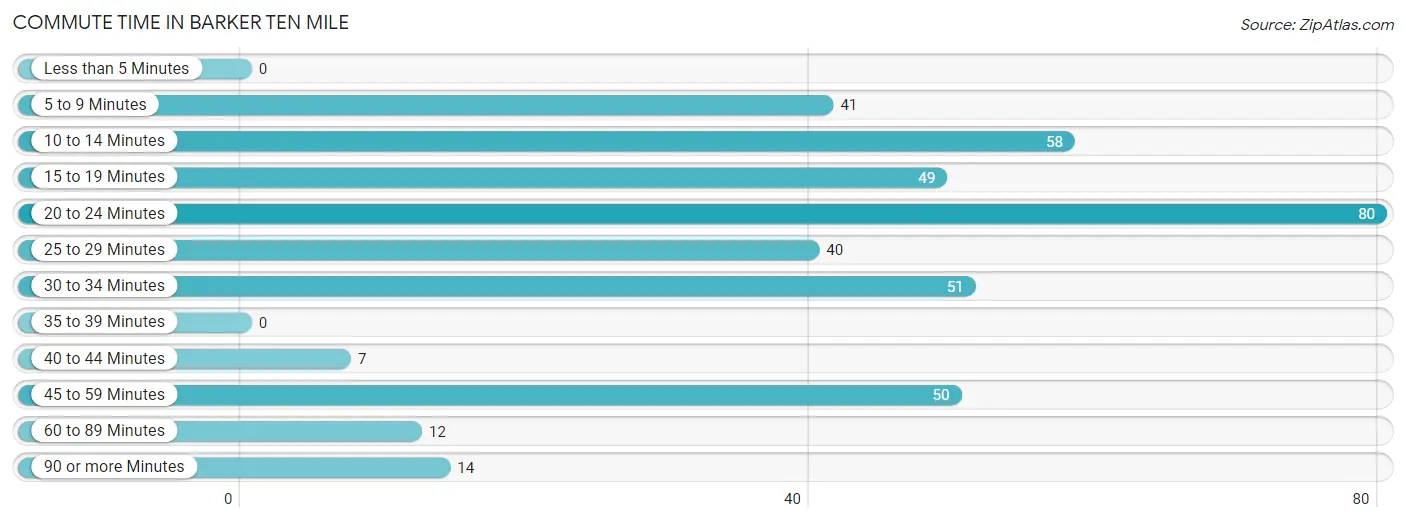
| Commute Time | # Commuters | % Commuters |
| Less than 5 Minutes | 0 | 0.0% |
| 5 to 9 Minutes | 41 | 10.2% |
| 10 to 14 Minutes | 58 | 14.4% |
| 15 to 19 Minutes | 49 | 12.2% |
| 20 to 24 Minutes | 80 | 19.9% |
| 25 to 29 Minutes | 40 | 10.0% |
| 30 to 34 Minutes | 51 | 12.7% |
| 35 to 39 Minutes | 0 | 0.0% |
| 40 to 44 Minutes | 7 | 1.7% |
| 45 to 59 Minutes | 50 | 12.4% |
| 60 to 89 Minutes | 12 | 3.0% |
| 90 or more Minutes | 14 | 3.5% |
Commute Time by Sex in Barker Ten Mile
The most common commute times in Barker Ten Mile are 20 to 24 minutes (75 commuters, 36.6%) for males and 25 to 29 minutes (40 commuters, 20.3%) for females.
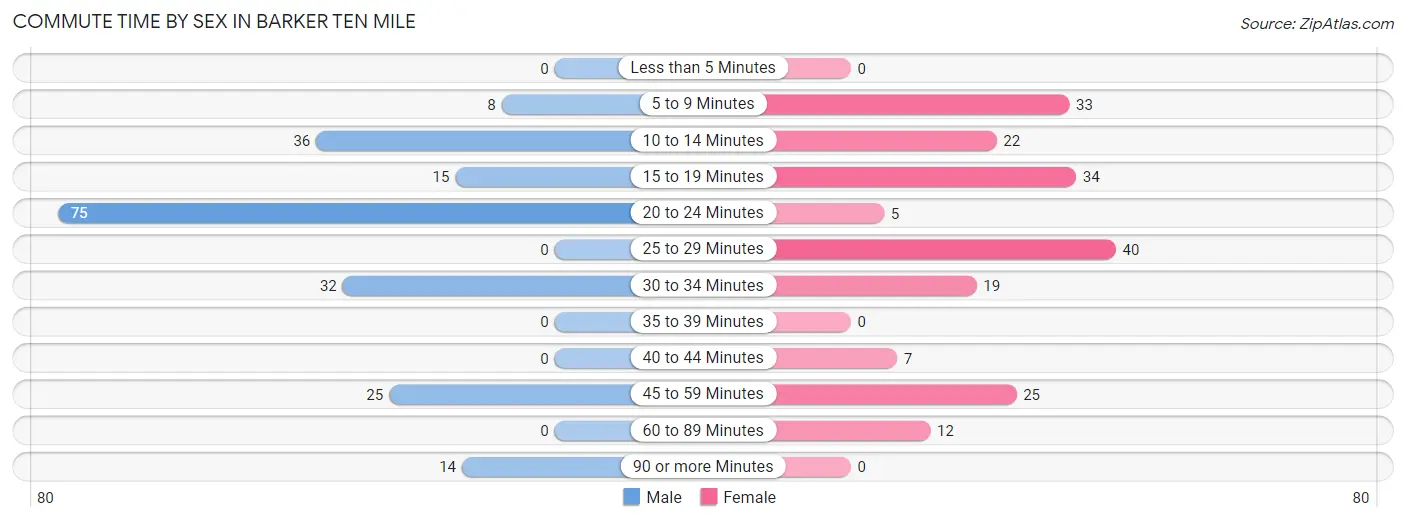
| Commute Time | Male | Female |
| Less than 5 Minutes | 0 (0.0%) | 0 (0.0%) |
| 5 to 9 Minutes | 8 (3.9%) | 33 (16.8%) |
| 10 to 14 Minutes | 36 (17.6%) | 22 (11.2%) |
| 15 to 19 Minutes | 15 (7.3%) | 34 (17.3%) |
| 20 to 24 Minutes | 75 (36.6%) | 5 (2.5%) |
| 25 to 29 Minutes | 0 (0.0%) | 40 (20.3%) |
| 30 to 34 Minutes | 32 (15.6%) | 19 (9.6%) |
| 35 to 39 Minutes | 0 (0.0%) | 0 (0.0%) |
| 40 to 44 Minutes | 0 (0.0%) | 7 (3.5%) |
| 45 to 59 Minutes | 25 (12.2%) | 25 (12.7%) |
| 60 to 89 Minutes | 0 (0.0%) | 12 (6.1%) |
| 90 or more Minutes | 14 (6.8%) | 0 (0.0%) |
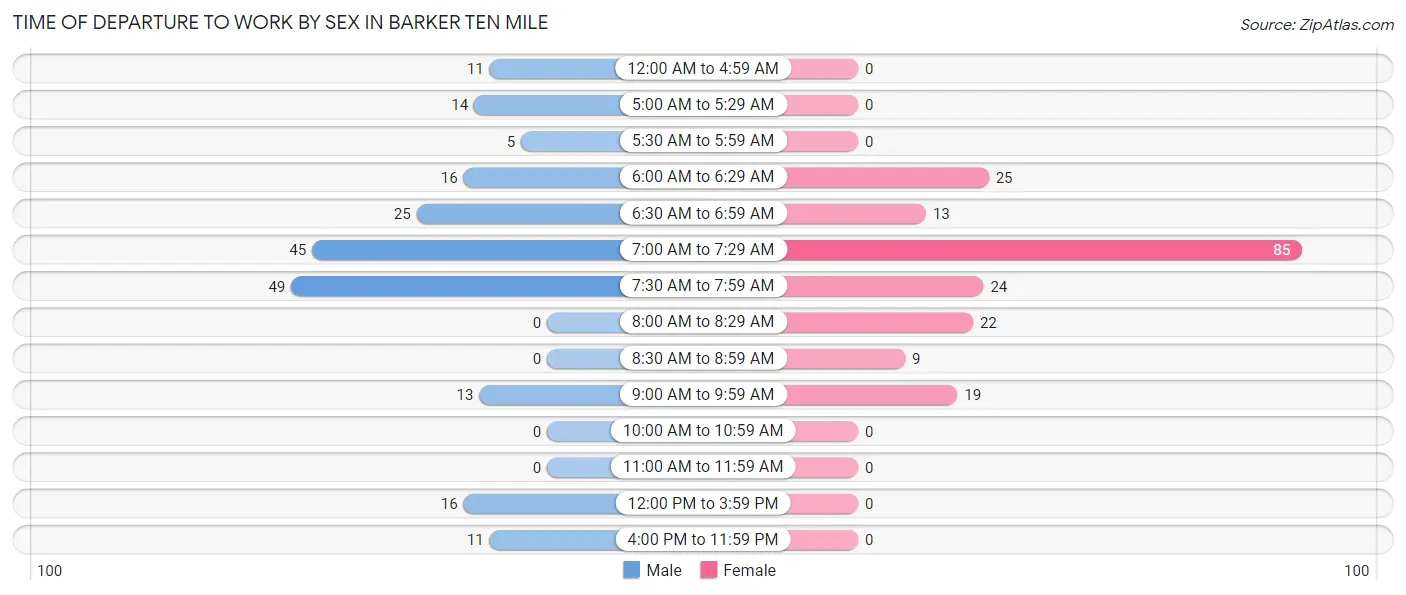
Time of Departure to Work by Sex in Barker Ten Mile
The most frequent times of departure to work in Barker Ten Mile are 7:30 AM to 7:59 AM (49, 23.9%) for males and 7:00 AM to 7:29 AM (85, 43.1%) for females.
| Time of Departure | Male | Female |
| 12:00 AM to 4:59 AM | 11 (5.4%) | 0 (0.0%) |
| 5:00 AM to 5:29 AM | 14 (6.8%) | 0 (0.0%) |
| 5:30 AM to 5:59 AM | 5 (2.4%) | 0 (0.0%) |
| 6:00 AM to 6:29 AM | 16 (7.8%) | 25 (12.7%) |
| 6:30 AM to 6:59 AM | 25 (12.2%) | 13 (6.6%) |
| 7:00 AM to 7:29 AM | 45 (22.0%) | 85 (43.1%) |
| 7:30 AM to 7:59 AM | 49 (23.9%) | 24 (12.2%) |
| 8:00 AM to 8:29 AM | 0 (0.0%) | 22 (11.2%) |
| 8:30 AM to 8:59 AM | 0 (0.0%) | 9 (4.6%) |
| 9:00 AM to 9:59 AM | 13 (6.3%) | 19 (9.6%) |
| 10:00 AM to 10:59 AM | 0 (0.0%) | 0 (0.0%) |
| 11:00 AM to 11:59 AM | 0 (0.0%) | 0 (0.0%) |
| 12:00 PM to 3:59 PM | 16 (7.8%) | 0 (0.0%) |
| 4:00 PM to 11:59 PM | 11 (5.4%) | 0 (0.0%) |
| Total | 205 (100.0%) | 197 (100.0%) |
Housing Occupancy in Barker Ten Mile
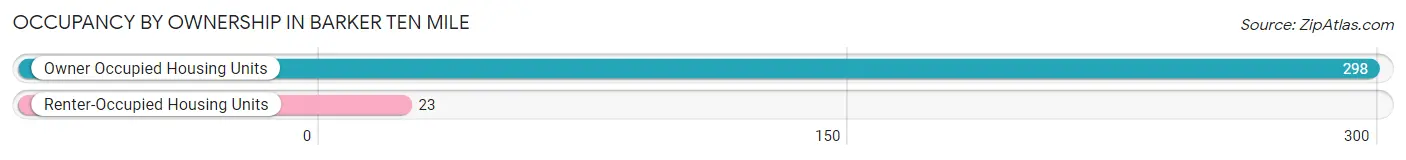
Occupancy by Ownership in Barker Ten Mile
Of the total 321 dwellings in Barker Ten Mile, owner-occupied units account for 298 (92.8%), while renter-occupied units make up 23 (7.2%).
| Occupancy | # Housing Units | % Housing Units |
| Owner Occupied Housing Units | 298 | 92.8% |
| Renter-Occupied Housing Units | 23 | 7.2% |
| Total Occupied Housing Units | 321 | 100.0% |
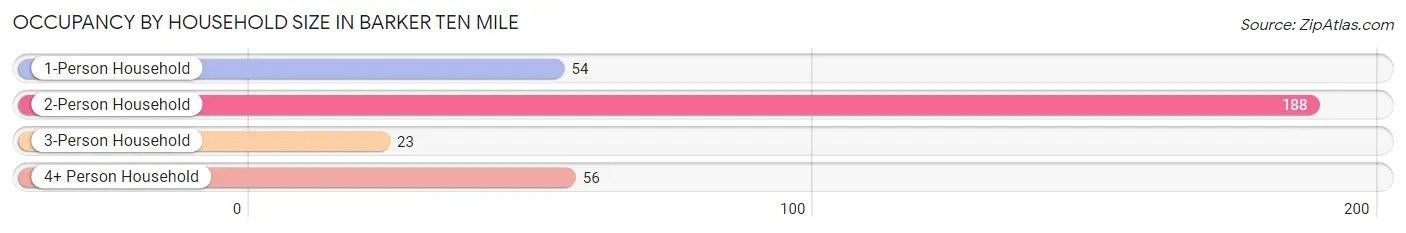
Occupancy by Household Size in Barker Ten Mile
| Household Size | # Housing Units | % Housing Units |
| 1-Person Household | 54 | 16.8% |
| 2-Person Household | 188 | 58.6% |
| 3-Person Household | 23 | 7.2% |
| 4+ Person Household | 56 | 17.4% |
| Total Housing Units | 321 | 100.0% |
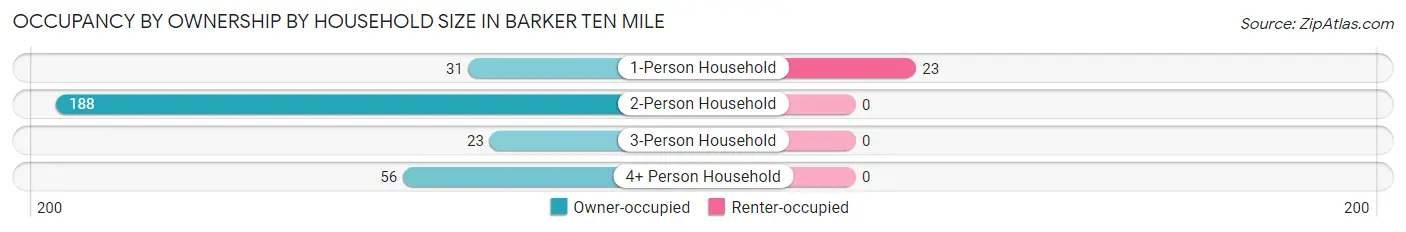
Occupancy by Ownership by Household Size in Barker Ten Mile
| Household Size | Owner-occupied | Renter-occupied |
| 1-Person Household | 31 (57.4%) | 23 (42.6%) |
| 2-Person Household | 188 (100.0%) | 0 (0.0%) |
| 3-Person Household | 23 (100.0%) | 0 (0.0%) |
| 4+ Person Household | 56 (100.0%) | 0 (0.0%) |
| Total Housing Units | 298 (92.8%) | 23 (7.2%) |
Occupancy by Educational Attainment in Barker Ten Mile
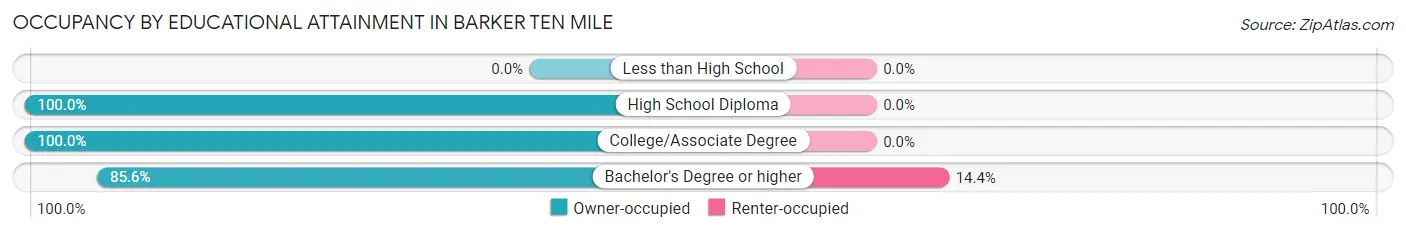
| Household Size | Owner-occupied | Renter-occupied |
| Less than High School | 0 (0.0%) | 0 (0.0%) |
| High School Diploma | 43 (100.0%) | 0 (0.0%) |
| College/Associate Degree | 118 (100.0%) | 0 (0.0%) |
| Bachelor's Degree or higher | 137 (85.6%) | 23 (14.4%) |
Occupancy by Age of Householder in Barker Ten Mile
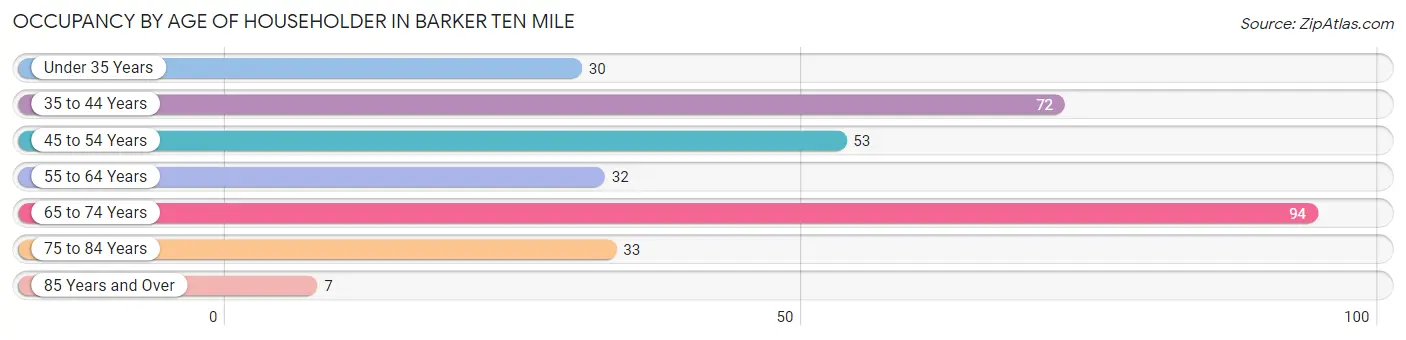
| Age Bracket | # Households | % Households |
| Under 35 Years | 30 | 9.3% |
| 35 to 44 Years | 72 | 22.4% |
| 45 to 54 Years | 53 | 16.5% |
| 55 to 64 Years | 32 | 10.0% |
| 65 to 74 Years | 94 | 29.3% |
| 75 to 84 Years | 33 | 10.3% |
| 85 Years and Over | 7 | 2.2% |
| Total | 321 | 100.0% |
Housing Finances in Barker Ten Mile
Median Income by Occupancy in Barker Ten Mile
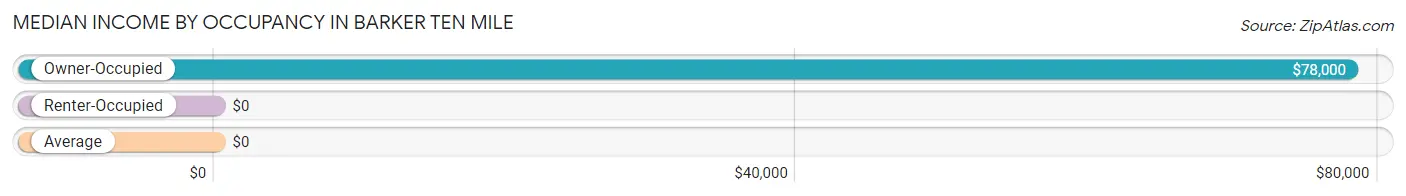
| Occupancy Type | # Households | Median Income |
| Owner-Occupied | 298 (92.8%) | $78,000 |
| Renter-Occupied | 23 (7.2%) | $0 |
| Average | 321 (100.0%) | $0 |
Occupancy by Householder Income Bracket in Barker Ten Mile
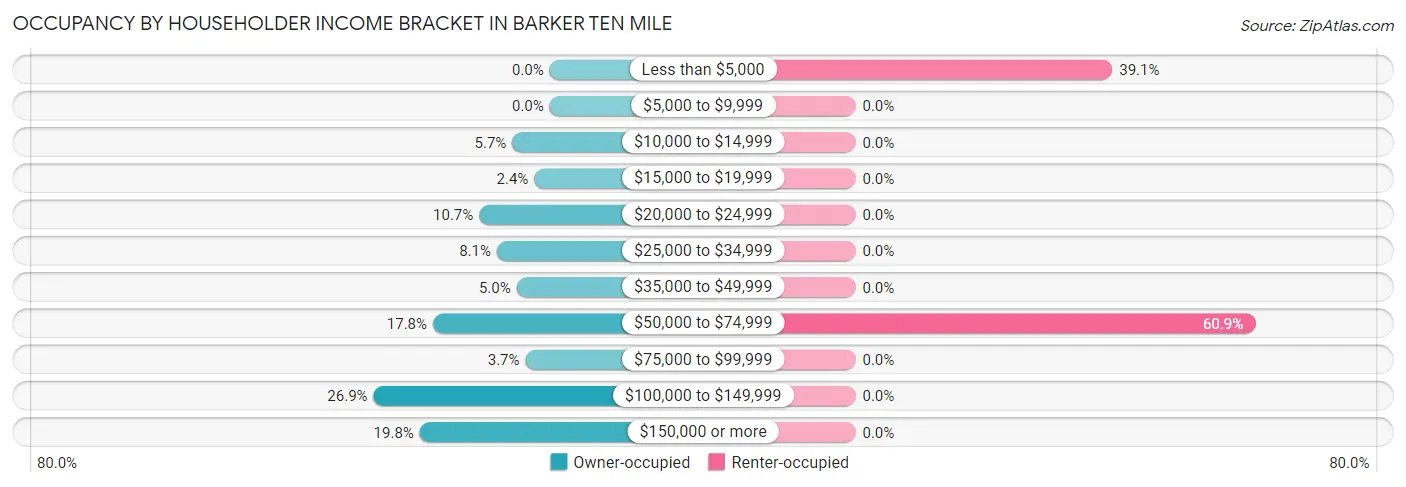
| Income Bracket | Owner-occupied | Renter-occupied |
| Less than $5,000 | 0 (0.0%) | 9 (39.1%) |
| $5,000 to $9,999 | 0 (0.0%) | 0 (0.0%) |
| $10,000 to $14,999 | 17 (5.7%) | 0 (0.0%) |
| $15,000 to $19,999 | 7 (2.4%) | 0 (0.0%) |
| $20,000 to $24,999 | 32 (10.7%) | 0 (0.0%) |
| $25,000 to $34,999 | 24 (8.1%) | 0 (0.0%) |
| $35,000 to $49,999 | 15 (5.0%) | 0 (0.0%) |
| $50,000 to $74,999 | 53 (17.8%) | 14 (60.9%) |
| $75,000 to $99,999 | 11 (3.7%) | 0 (0.0%) |
| $100,000 to $149,999 | 80 (26.9%) | 0 (0.0%) |
| $150,000 or more | 59 (19.8%) | 0 (0.0%) |
| Total | 298 (100.0%) | 23 (100.0%) |
Monthly Housing Cost Tiers in Barker Ten Mile
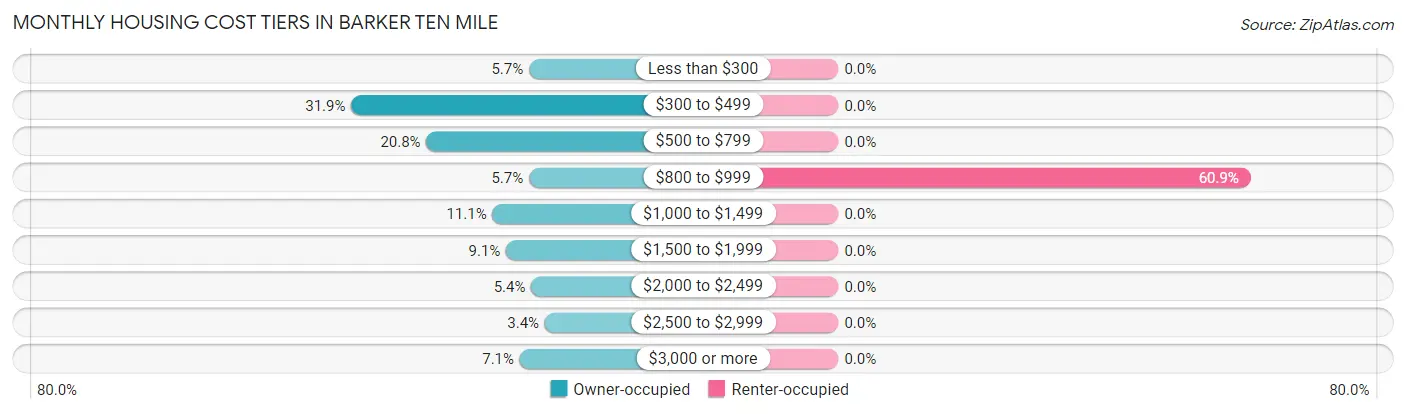
| Monthly Cost | Owner-occupied | Renter-occupied |
| Less than $300 | 17 (5.7%) | 0 (0.0%) |
| $300 to $499 | 95 (31.9%) | 0 (0.0%) |
| $500 to $799 | 62 (20.8%) | 0 (0.0%) |
| $800 to $999 | 17 (5.7%) | 14 (60.9%) |
| $1,000 to $1,499 | 33 (11.1%) | 0 (0.0%) |
| $1,500 to $1,999 | 27 (9.1%) | 0 (0.0%) |
| $2,000 to $2,499 | 16 (5.4%) | 0 (0.0%) |
| $2,500 to $2,999 | 10 (3.4%) | 0 (0.0%) |
| $3,000 or more | 21 (7.0%) | 0 (0.0%) |
| Total | 298 (100.0%) | 23 (100.0%) |
Physical Housing Characteristics in Barker Ten Mile
Housing Structures in Barker Ten Mile
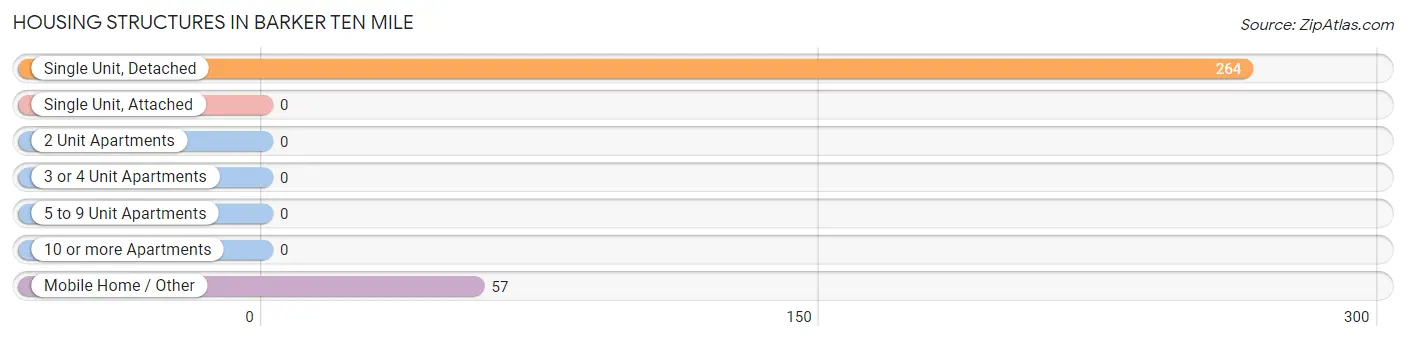
| Structure Type | # Housing Units | % Housing Units |
| Single Unit, Detached | 264 | 82.2% |
| Single Unit, Attached | 0 | 0.0% |
| 2 Unit Apartments | 0 | 0.0% |
| 3 or 4 Unit Apartments | 0 | 0.0% |
| 5 to 9 Unit Apartments | 0 | 0.0% |
| 10 or more Apartments | 0 | 0.0% |
| Mobile Home / Other | 57 | 17.8% |
| Total | 321 | 100.0% |
Housing Structures by Occupancy in Barker Ten Mile
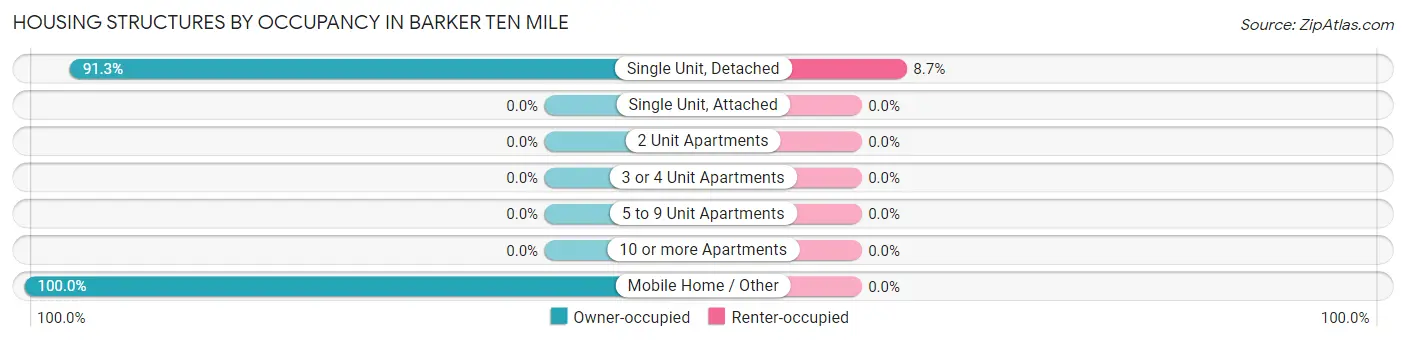
| Structure Type | Owner-occupied | Renter-occupied |
| Single Unit, Detached | 241 (91.3%) | 23 (8.7%) |
| Single Unit, Attached | 0 (0.0%) | 0 (0.0%) |
| 2 Unit Apartments | 0 (0.0%) | 0 (0.0%) |
| 3 or 4 Unit Apartments | 0 (0.0%) | 0 (0.0%) |
| 5 to 9 Unit Apartments | 0 (0.0%) | 0 (0.0%) |
| 10 or more Apartments | 0 (0.0%) | 0 (0.0%) |
| Mobile Home / Other | 57 (100.0%) | 0 (0.0%) |
| Total | 298 (92.8%) | 23 (7.2%) |
Housing Structures by Number of Rooms in Barker Ten Mile
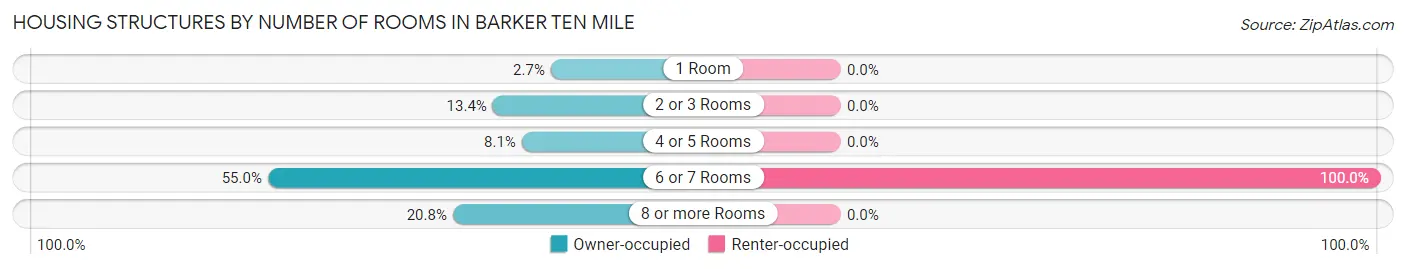
| Number of Rooms | Owner-occupied | Renter-occupied |
| 1 Room | 8 (2.7%) | 0 (0.0%) |
| 2 or 3 Rooms | 40 (13.4%) | 0 (0.0%) |
| 4 or 5 Rooms | 24 (8.1%) | 0 (0.0%) |
| 6 or 7 Rooms | 164 (55.0%) | 23 (100.0%) |
| 8 or more Rooms | 62 (20.8%) | 0 (0.0%) |
| Total | 298 (100.0%) | 23 (100.0%) |
Housing Structure by Heating Type in Barker Ten Mile
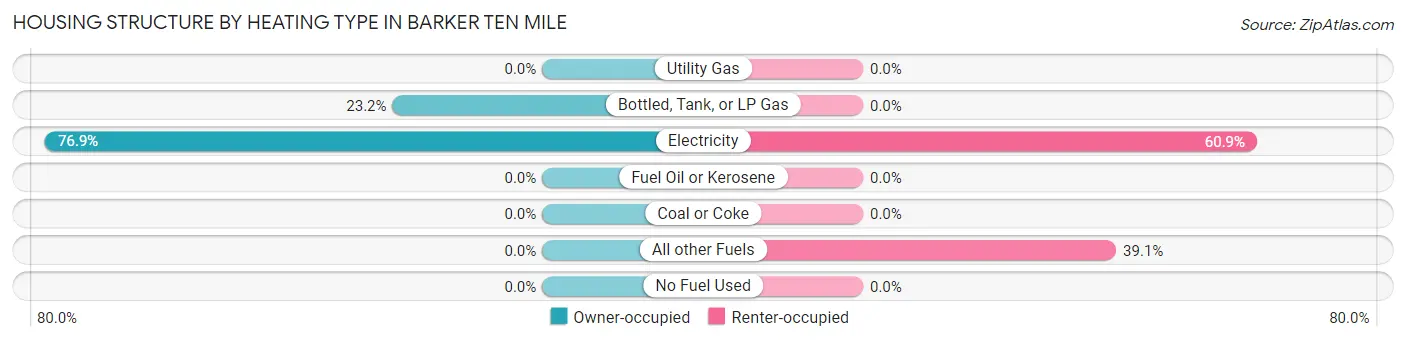
| Heating Type | Owner-occupied | Renter-occupied |
| Utility Gas | 0 (0.0%) | 0 (0.0%) |
| Bottled, Tank, or LP Gas | 69 (23.2%) | 0 (0.0%) |
| Electricity | 229 (76.8%) | 14 (60.9%) |
| Fuel Oil or Kerosene | 0 (0.0%) | 0 (0.0%) |
| Coal or Coke | 0 (0.0%) | 0 (0.0%) |
| All other Fuels | 0 (0.0%) | 9 (39.1%) |
| No Fuel Used | 0 (0.0%) | 0 (0.0%) |
| Total | 298 (100.0%) | 23 (100.0%) |
Household Vehicle Usage in Barker Ten Mile
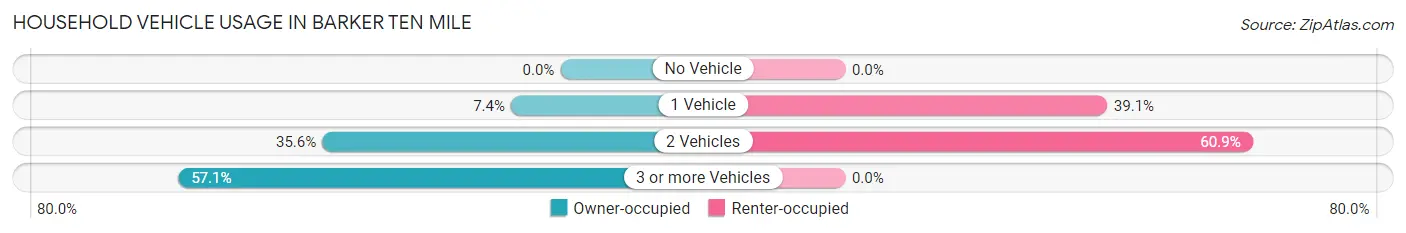
| Vehicles per Household | Owner-occupied | Renter-occupied |
| No Vehicle | 0 (0.0%) | 0 (0.0%) |
| 1 Vehicle | 22 (7.4%) | 9 (39.1%) |
| 2 Vehicles | 106 (35.6%) | 14 (60.9%) |
| 3 or more Vehicles | 170 (57.1%) | 0 (0.0%) |
| Total | 298 (100.0%) | 23 (100.0%) |
Real Estate & Mortgages in Barker Ten Mile
Real Estate and Mortgage Overview in Barker Ten Mile
| Characteristic | Without Mortgage | With Mortgage |
| Housing Units | 167 | 131 |
| Median Property Value | - | - |
| Median Household Income | $60,156 | $34 |
| Monthly Housing Costs | $470 | $21 |
| Real Estate Taxes | $1,131 | $0 |
Property Value by Mortgage Status in Barker Ten Mile
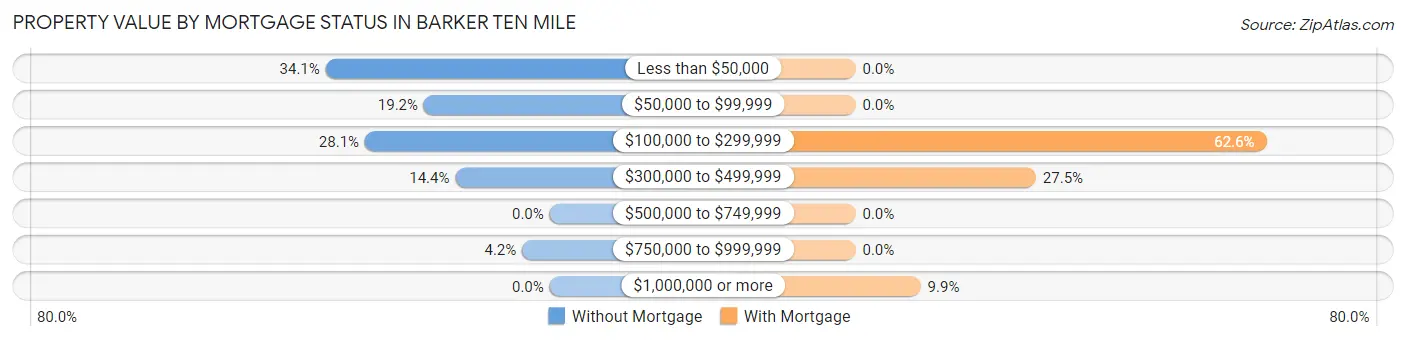
| Property Value | Without Mortgage | With Mortgage |
| Less than $50,000 | 57 (34.1%) | 0 (0.0%) |
| $50,000 to $99,999 | 32 (19.2%) | 0 (0.0%) |
| $100,000 to $299,999 | 47 (28.1%) | 82 (62.6%) |
| $300,000 to $499,999 | 24 (14.4%) | 36 (27.5%) |
| $500,000 to $749,999 | 0 (0.0%) | 0 (0.0%) |
| $750,000 to $999,999 | 7 (4.2%) | 0 (0.0%) |
| $1,000,000 or more | 0 (0.0%) | 13 (9.9%) |
| Total | 167 (100.0%) | 131 (100.0%) |
Household Income by Mortgage Status in Barker Ten Mile
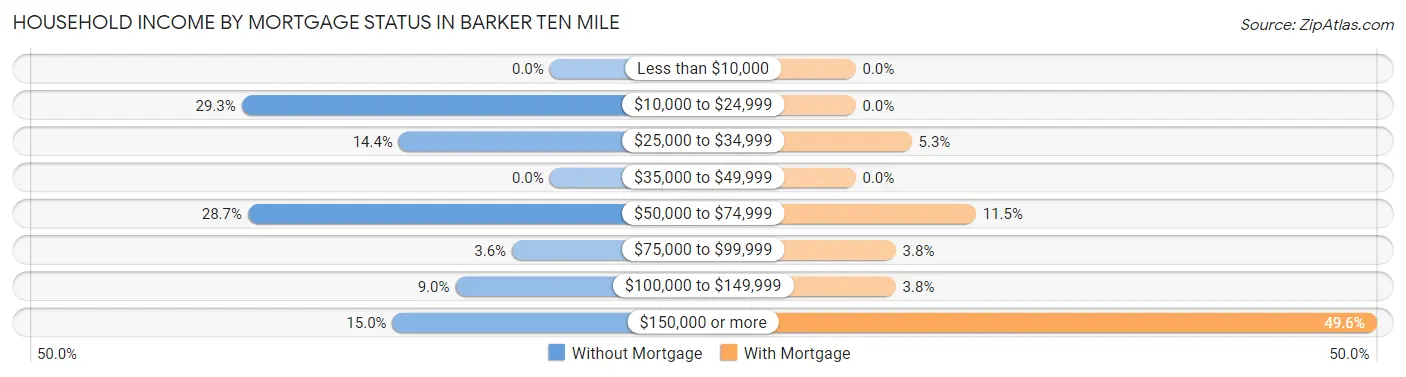
| Household Income | Without Mortgage | With Mortgage |
| Less than $10,000 | 0 (0.0%) | 0 (0.0%) |
| $10,000 to $24,999 | 49 (29.3%) | 0 (0.0%) |
| $25,000 to $34,999 | 24 (14.4%) | 7 (5.3%) |
| $35,000 to $49,999 | 0 (0.0%) | 0 (0.0%) |
| $50,000 to $74,999 | 48 (28.7%) | 15 (11.5%) |
| $75,000 to $99,999 | 6 (3.6%) | 5 (3.8%) |
| $100,000 to $149,999 | 15 (9.0%) | 5 (3.8%) |
| $150,000 or more | 25 (15.0%) | 65 (49.6%) |
| Total | 167 (100.0%) | 131 (100.0%) |
Property Value to Household Income Ratio in Barker Ten Mile
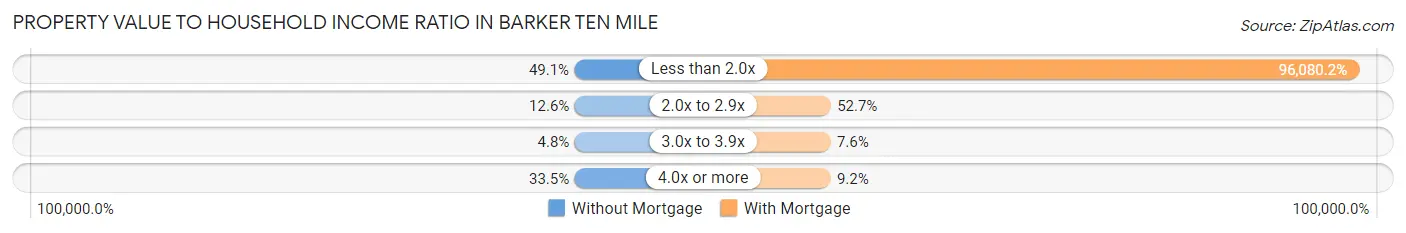
| Value-to-Income Ratio | Without Mortgage | With Mortgage |
| Less than 2.0x | 82 (49.1%) | 125,865 (96,080.2%) |
| 2.0x to 2.9x | 21 (12.6%) | 69 (52.7%) |
| 3.0x to 3.9x | 8 (4.8%) | 10 (7.6%) |
| 4.0x or more | 56 (33.5%) | 12 (9.2%) |
| Total | 167 (100.0%) | 131 (100.0%) |
Real Estate Taxes by Mortgage Status in Barker Ten Mile
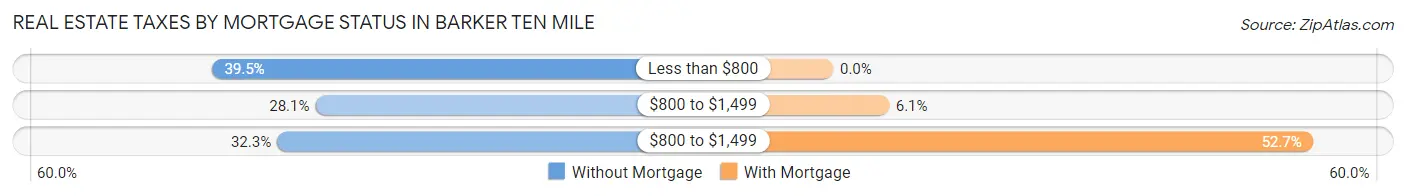
| Property Taxes | Without Mortgage | With Mortgage |
| Less than $800 | 66 (39.5%) | 0 (0.0%) |
| $800 to $1,499 | 47 (28.1%) | 8 (6.1%) |
| $800 to $1,499 | 54 (32.3%) | 69 (52.7%) |
| Total | 167 (100.0%) | 131 (100.0%) |
Health & Disability in Barker Ten Mile
Health Insurance Coverage by Age in Barker Ten Mile
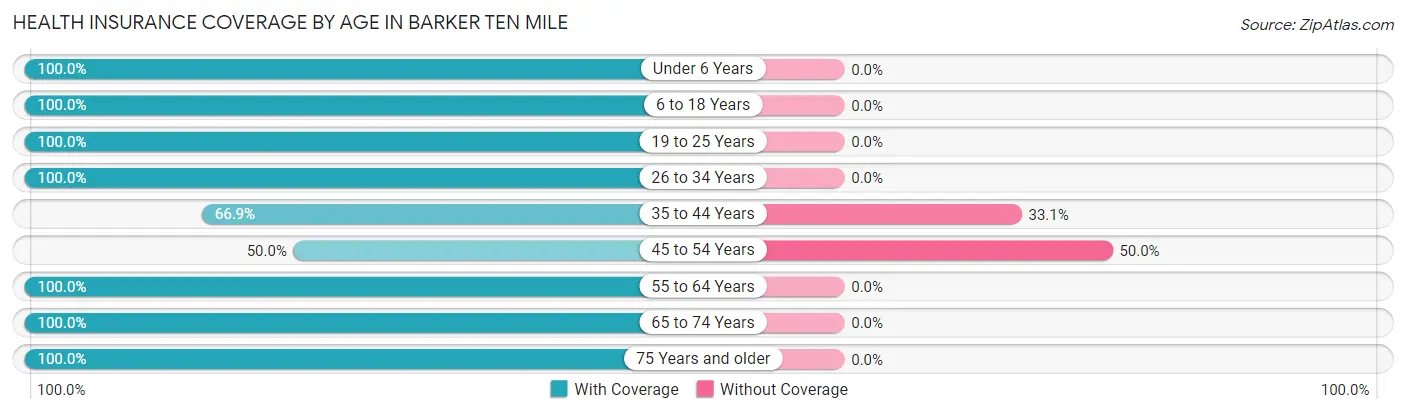
| Age Bracket | With Coverage | Without Coverage |
| Under 6 Years | 9 (100.0%) | 0 (0.0%) |
| 6 to 18 Years | 66 (100.0%) | 0 (0.0%) |
| 19 to 25 Years | 58 (100.0%) | 0 (0.0%) |
| 26 to 34 Years | 63 (100.0%) | 0 (0.0%) |
| 35 to 44 Years | 83 (66.9%) | 41 (33.1%) |
| 45 to 54 Years | 62 (50.0%) | 62 (50.0%) |
| 55 to 64 Years | 75 (100.0%) | 0 (0.0%) |
| 65 to 74 Years | 195 (100.0%) | 0 (0.0%) |
| 75 Years and older | 55 (100.0%) | 0 (0.0%) |
| Total | 666 (86.6%) | 103 (13.4%) |
Health Insurance Coverage by Citizenship Status in Barker Ten Mile
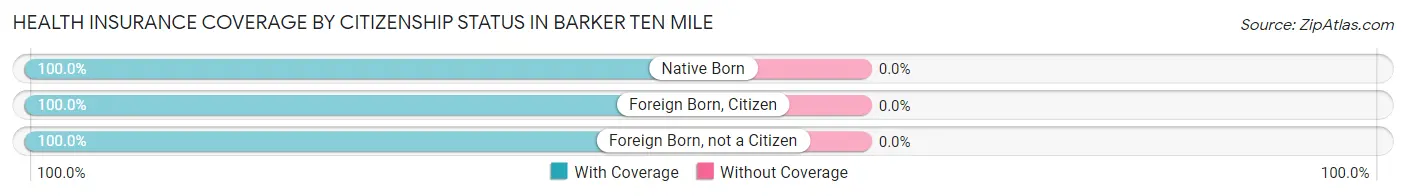
| Citizenship Status | With Coverage | Without Coverage |
| Native Born | 9 (100.0%) | 0 (0.0%) |
| Foreign Born, Citizen | 66 (100.0%) | 0 (0.0%) |
| Foreign Born, not a Citizen | 58 (100.0%) | 0 (0.0%) |
Health Insurance Coverage by Household Income in Barker Ten Mile
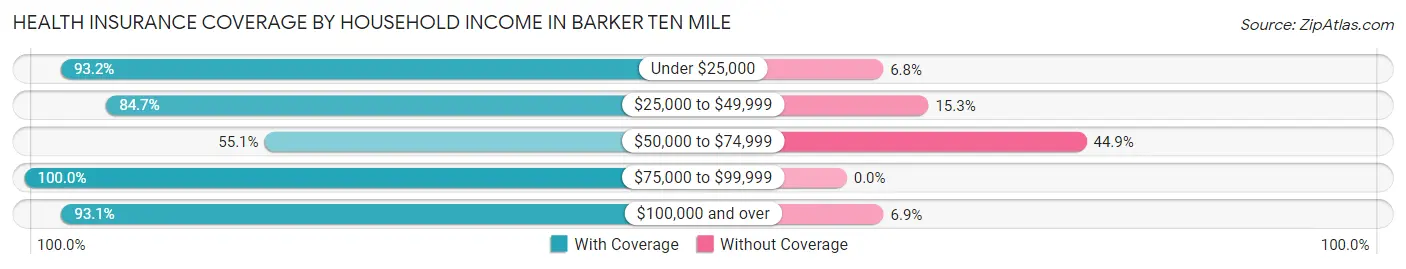
| Household Income | With Coverage | Without Coverage |
| Under $25,000 | 123 (93.2%) | 9 (6.8%) |
| $25,000 to $49,999 | 83 (84.7%) | 15 (15.3%) |
| $50,000 to $74,999 | 65 (55.1%) | 53 (44.9%) |
| $75,000 to $99,999 | 44 (100.0%) | 0 (0.0%) |
| $100,000 and over | 351 (93.1%) | 26 (6.9%) |
Public vs Private Health Insurance Coverage by Age in Barker Ten Mile
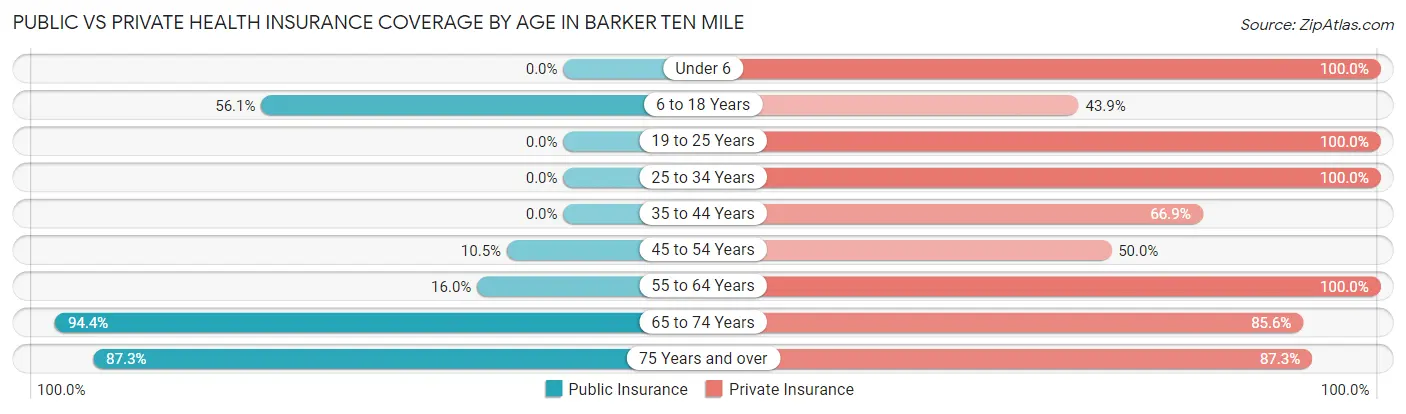
| Age Bracket | Public Insurance | Private Insurance |
| Under 6 | 0 (0.0%) | 9 (100.0%) |
| 6 to 18 Years | 37 (56.1%) | 29 (43.9%) |
| 19 to 25 Years | 0 (0.0%) | 58 (100.0%) |
| 25 to 34 Years | 0 (0.0%) | 63 (100.0%) |
| 35 to 44 Years | 0 (0.0%) | 83 (66.9%) |
| 45 to 54 Years | 13 (10.5%) | 62 (50.0%) |
| 55 to 64 Years | 12 (16.0%) | 75 (100.0%) |
| 65 to 74 Years | 184 (94.4%) | 167 (85.6%) |
| 75 Years and over | 48 (87.3%) | 48 (87.3%) |
| Total | 294 (38.2%) | 594 (77.2%) |
Disability Status by Sex by Age in Barker Ten Mile
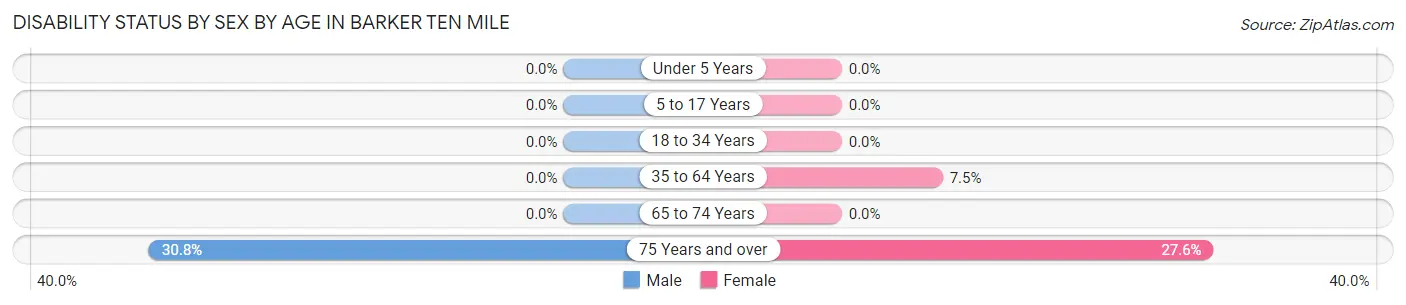
| Age Bracket | Male | Female |
| Under 5 Years | 0 (0.0%) | 0 (0.0%) |
| 5 to 17 Years | 0 (0.0%) | 0 (0.0%) |
| 18 to 34 Years | 0 (0.0%) | 0 (0.0%) |
| 35 to 64 Years | 0 (0.0%) | 14 (7.5%) |
| 65 to 74 Years | 0 (0.0%) | 0 (0.0%) |
| 75 Years and over | 8 (30.8%) | 8 (27.6%) |
Disability Class by Sex by Age in Barker Ten Mile
Disability Class: Hearing Difficulty
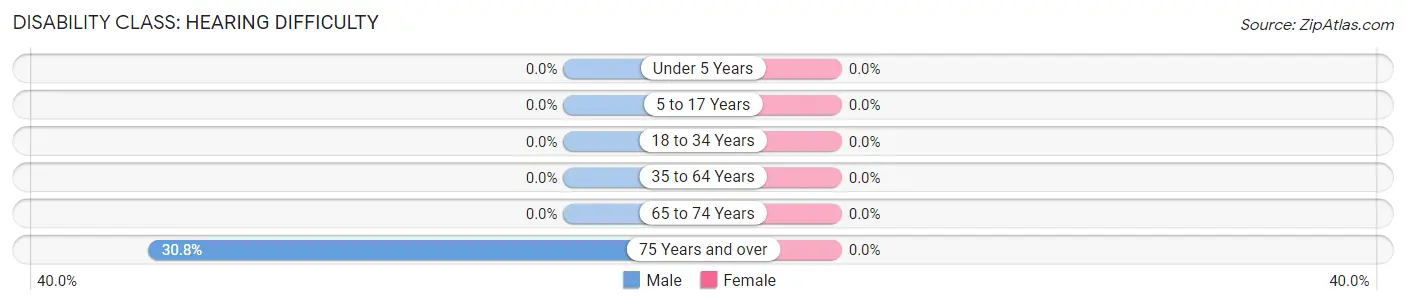
| Age Bracket | Male | Female |
| Under 5 Years | 0 (0.0%) | 0 (0.0%) |
| 5 to 17 Years | 0 (0.0%) | 0 (0.0%) |
| 18 to 34 Years | 0 (0.0%) | 0 (0.0%) |
| 35 to 64 Years | 0 (0.0%) | 0 (0.0%) |
| 65 to 74 Years | 0 (0.0%) | 0 (0.0%) |
| 75 Years and over | 8 (30.8%) | 0 (0.0%) |
Disability Class: Vision Difficulty
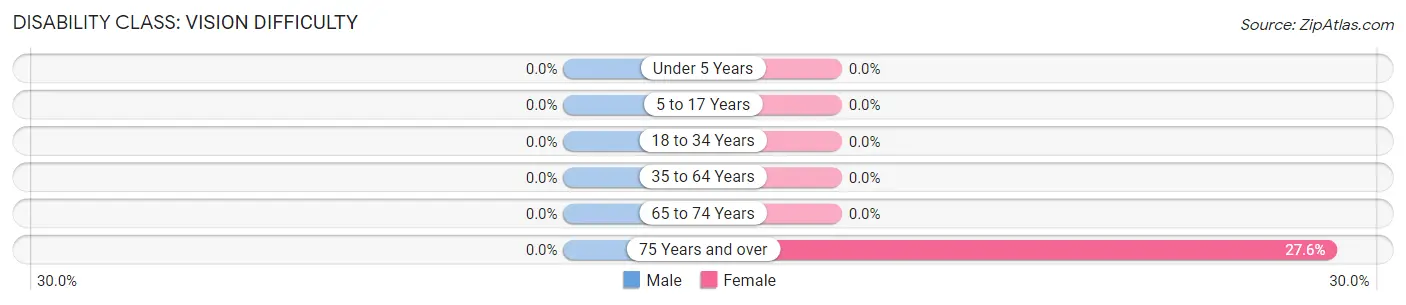
| Age Bracket | Male | Female |
| Under 5 Years | 0 (0.0%) | 0 (0.0%) |
| 5 to 17 Years | 0 (0.0%) | 0 (0.0%) |
| 18 to 34 Years | 0 (0.0%) | 0 (0.0%) |
| 35 to 64 Years | 0 (0.0%) | 0 (0.0%) |
| 65 to 74 Years | 0 (0.0%) | 0 (0.0%) |
| 75 Years and over | 0 (0.0%) | 8 (27.6%) |
Disability Class: Cognitive Difficulty
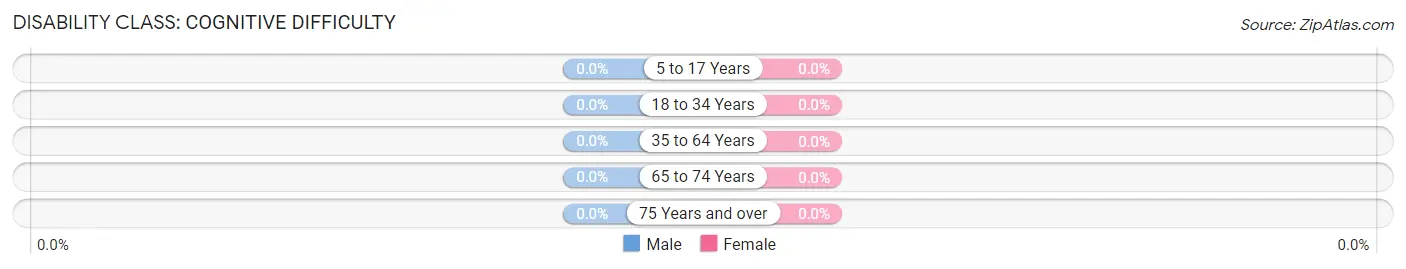
| Age Bracket | Male | Female |
| 5 to 17 Years | 0 (0.0%) | 0 (0.0%) |
| 18 to 34 Years | 0 (0.0%) | 0 (0.0%) |
| 35 to 64 Years | 0 (0.0%) | 0 (0.0%) |
| 65 to 74 Years | 0 (0.0%) | 0 (0.0%) |
| 75 Years and over | 0 (0.0%) | 0 (0.0%) |
Disability Class: Ambulatory Difficulty
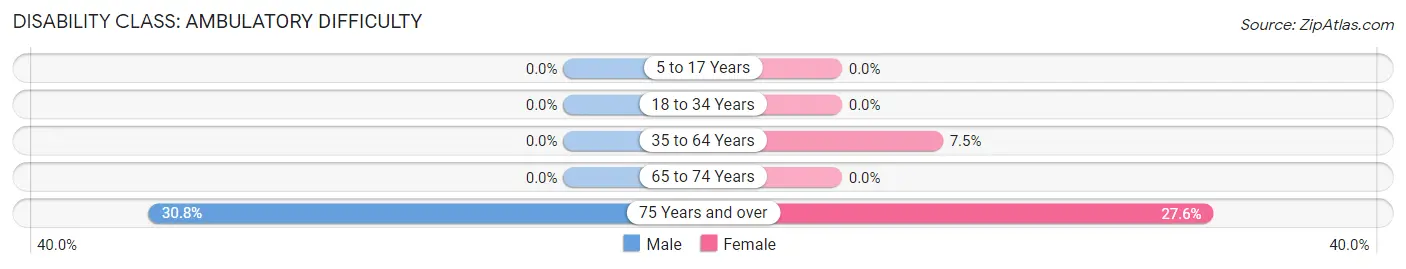
| Age Bracket | Male | Female |
| 5 to 17 Years | 0 (0.0%) | 0 (0.0%) |
| 18 to 34 Years | 0 (0.0%) | 0 (0.0%) |
| 35 to 64 Years | 0 (0.0%) | 14 (7.5%) |
| 65 to 74 Years | 0 (0.0%) | 0 (0.0%) |
| 75 Years and over | 8 (30.8%) | 8 (27.6%) |
Disability Class: Self-Care Difficulty
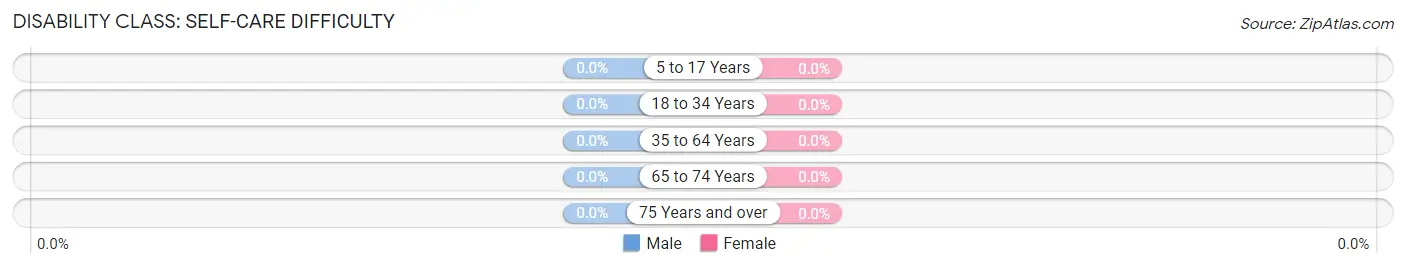
| Age Bracket | Male | Female |
| 5 to 17 Years | 0 (0.0%) | 0 (0.0%) |
| 18 to 34 Years | 0 (0.0%) | 0 (0.0%) |
| 35 to 64 Years | 0 (0.0%) | 0 (0.0%) |
| 65 to 74 Years | 0 (0.0%) | 0 (0.0%) |
| 75 Years and over | 0 (0.0%) | 0 (0.0%) |
Technology Access in Barker Ten Mile
Computing Device Access in Barker Ten Mile
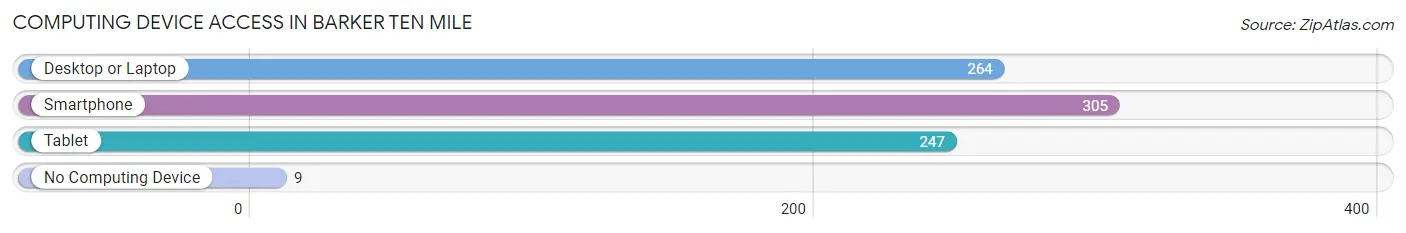
| Device Type | # Households | % Households |
| Desktop or Laptop | 264 | 82.2% |
| Smartphone | 305 | 95.0% |
| Tablet | 247 | 76.9% |
| No Computing Device | 9 | 2.8% |
| Total | 321 | 100.0% |
Internet Access in Barker Ten Mile
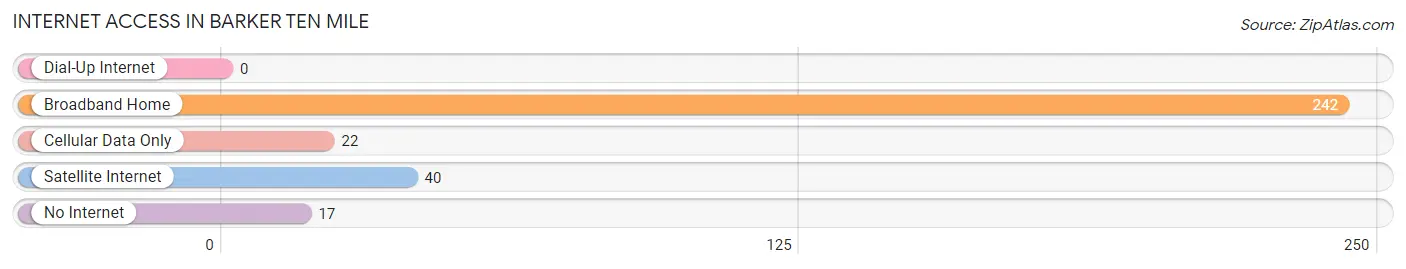
| Internet Type | # Households | % Households |
| Dial-Up Internet | 0 | 0.0% |
| Broadband Home | 242 | 75.4% |
| Cellular Data Only | 22 | 6.9% |
| Satellite Internet | 40 | 12.5% |
| No Internet | 17 | 5.3% |
| Total | 321 | 100.0% |
Barker Ten Mile Summary
Barker Ten Mile is an unincorporated community located in the western part of Haywood County, North Carolina. It is situated in the Appalachian Mountains, approximately 10 miles from the county seat of Waynesville. The community is named after the Barker family, who settled in the area in the late 1700s.
History
The Barker family first settled in the area in the late 1700s. The family was originally from England and had migrated to the United States in search of a better life. The family settled in the area and began farming the land. The community was originally known as Barker’s Crossroads, as it was located at the intersection of two roads.
In the early 1900s, the community began to grow and develop. A post office was established in the area in 1910, and the community was officially named Barker Ten Mile. The name was derived from the fact that the community was located approximately 10 miles from the county seat of Waynesville.
In the mid-1900s, the community began to decline as many of the residents moved away in search of better economic opportunities. The post office closed in the late 1960s, and the community has remained relatively small and isolated since then.
Geography
Barker Ten Mile is located in the western part of Haywood County, North Carolina. It is situated in the Appalachian Mountains, approximately 10 miles from the county seat of Waynesville. The community is located at an elevation of 2,400 feet above sea level.
The area is characterized by rolling hills and valleys, with the highest point in the area being the summit of Mount Sterling, which is located approximately 5 miles from the community. The area is also home to several creeks and streams, including the Pigeon River, which flows through the community.
Economy
The economy of Barker Ten Mile is largely based on agriculture. The area is home to several small farms, which produce a variety of crops, including corn, soybeans, and hay. The area is also home to several small businesses, including a general store, a gas station, and a restaurant.
Demographics
As of the 2010 census, the population of Barker Ten Mile was 545. The racial makeup of the community was 97.3% White, 0.7% African American, 0.2% Native American, 0.2% Asian, and 1.6% from other races. The median household income was $30,000, and the median age was 44.
Conclusion
Barker Ten Mile is an unincorporated community located in the western part of Haywood County, North Carolina. It is situated in the Appalachian Mountains, approximately 10 miles from the county seat of Waynesville. The community was originally settled by the Barker family in the late 1700s, and the economy is largely based on agriculture. As of the 2010 census, the population of Barker Ten Mile was 545.
Common Questions
What is Per Capita Income in Barker Ten Mile?
Per Capita income in Barker Ten Mile is $47,547.
What is the Median Family Income in Barker Ten Mile?
Median Family Income in Barker Ten Mile is $96,458.
What is Income or Wage Gap in Barker Ten Mile?
Income or Wage Gap in Barker Ten Mile is 2.2%.
Women in Barker Ten Mile earn 97.8 cents for every dollar earned by a man.
What is Inequality or Gini Index in Barker Ten Mile?
Inequality or Gini Index in Barker Ten Mile is 0.49.
What is the Total Population of Barker Ten Mile?
Total Population of Barker Ten Mile is 769.
What is the Total Male Population of Barker Ten Mile?
Total Male Population of Barker Ten Mile is 359.
What is the Total Female Population of Barker Ten Mile?
Total Female Population of Barker Ten Mile is 410.
What is the Ratio of Males per 100 Females in Barker Ten Mile?
There are 87.56 Males per 100 Females in Barker Ten Mile.
What is the Ratio of Females per 100 Males in Barker Ten Mile?
There are 114.21 Females per 100 Males in Barker Ten Mile.
What is the Median Population Age in Barker Ten Mile?
Median Population Age in Barker Ten Mile is 49.7 Years.
What is the Average Family Size in Barker Ten Mile
Average Family Size in Barker Ten Mile is 2.7 People.
What is the Average Household Size in Barker Ten Mile
Average Household Size in Barker Ten Mile is 2.4 People.
How Large is the Labor Force in Barker Ten Mile?
There are 402 People in the Labor Forcein in Barker Ten Mile.
What is the Percentage of People in the Labor Force in Barker Ten Mile?
55.0% of People are in the Labor Force in Barker Ten Mile.