Beaufort, NC Map & Demographics
Beaufort Map
Beaufort Overview
$32,059
PER CAPITA INCOME
$60,987
AVG FAMILY INCOME
$41,890
AVG HOUSEHOLD INCOME
13.6%
WAGE / INCOME GAP [ % ]
86.4¢/ $1
WAGE / INCOME GAP [ $ ]
0.51
INEQUALITY / GINI INDEX
4,534
TOTAL POPULATION
2,040
MALE POPULATION
2,494
FEMALE POPULATION
81.80
MALES / 100 FEMALES
122.25
FEMALES / 100 MALES
50.9
MEDIAN AGE
2.6
AVG FAMILY SIZE
1.9
AVG HOUSEHOLD SIZE
1,979
LABOR FORCE [ PEOPLE ]
50.7%
PERCENT IN LABOR FORCE
6.4%
UNEMPLOYMENT RATE
Beaufort Zip Codes
Beaufort Area Codes
Income in Beaufort
Income Overview in Beaufort
Per Capita Income in Beaufort is $32,059, while median incomes of families and households are $60,987 and $41,890 respectively.
| Characteristic | Number | Measure |
| Per Capita Income | 4,534 | $32,059 |
| Median Family Income | 1,097 | $60,987 |
| Mean Family Income | 1,097 | $88,530 |
| Median Household Income | 2,321 | $41,890 |
| Mean Household Income | 2,321 | $61,394 |
| Income Deficit | 1,097 | $0 |
| Wage / Income Gap (%) | 4,534 | 13.62% |
| Wage / Income Gap ($) | 4,534 | 86.38¢ per $1 |
| Gini / Inequality Index | 4,534 | 0.51 |
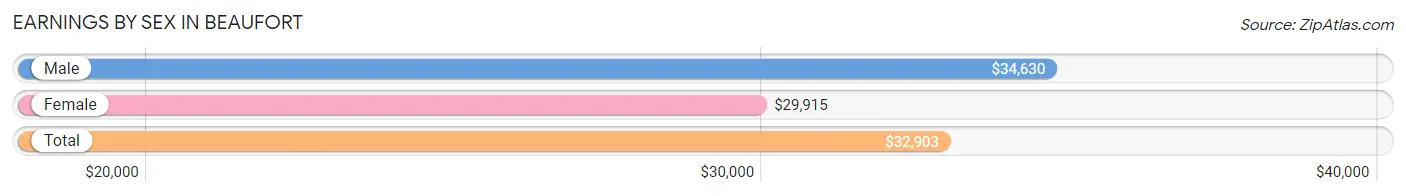
Earnings by Sex in Beaufort
Average Earnings in Beaufort are $32,903, $34,630 for men and $29,915 for women, a difference of 13.6%.
| Sex | Number | Average Earnings |
| Male | 870 (42.1%) | $34,630 |
| Female | 1,197 (57.9%) | $29,915 |
| Total | 2,067 (100.0%) | $32,903 |
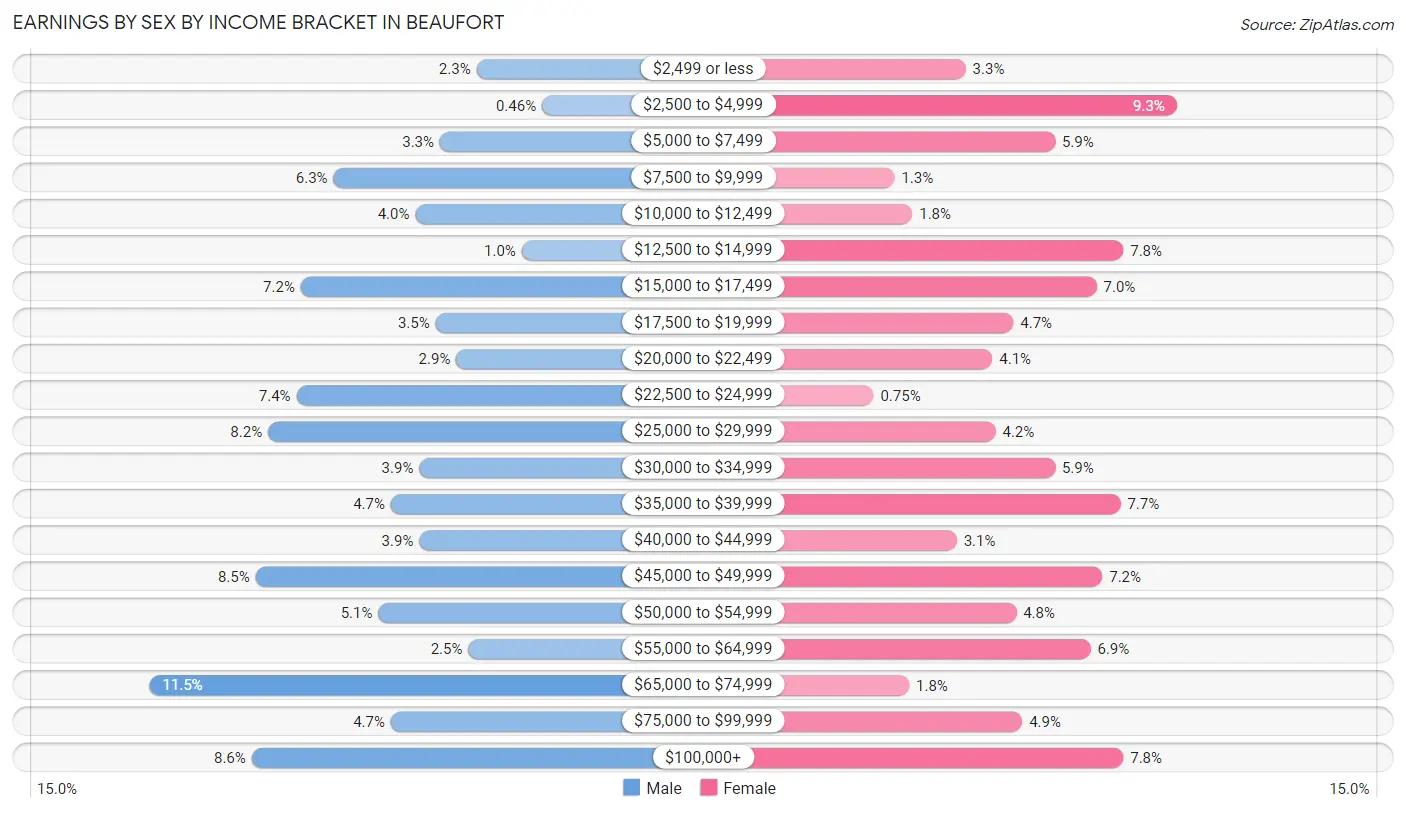
Earnings by Sex by Income Bracket in Beaufort
The most common earnings brackets in Beaufort are $65,000 to $74,999 for men (100 | 11.5%) and $2,500 to $4,999 for women (111 | 9.3%).
| Income | Male | Female |
| $2,499 or less | 20 (2.3%) | 40 (3.3%) |
| $2,500 to $4,999 | 4 (0.5%) | 111 (9.3%) |
| $5,000 to $7,499 | 29 (3.3%) | 70 (5.9%) |
| $7,500 to $9,999 | 55 (6.3%) | 16 (1.3%) |
| $10,000 to $12,499 | 35 (4.0%) | 22 (1.8%) |
| $12,500 to $14,999 | 9 (1.0%) | 93 (7.8%) |
| $15,000 to $17,499 | 63 (7.2%) | 84 (7.0%) |
| $17,500 to $19,999 | 30 (3.5%) | 56 (4.7%) |
| $20,000 to $22,499 | 25 (2.9%) | 49 (4.1%) |
| $22,500 to $24,999 | 64 (7.4%) | 9 (0.7%) |
| $25,000 to $29,999 | 71 (8.2%) | 50 (4.2%) |
| $30,000 to $34,999 | 34 (3.9%) | 70 (5.9%) |
| $35,000 to $39,999 | 41 (4.7%) | 92 (7.7%) |
| $40,000 to $44,999 | 34 (3.9%) | 37 (3.1%) |
| $45,000 to $49,999 | 74 (8.5%) | 86 (7.2%) |
| $50,000 to $54,999 | 44 (5.1%) | 57 (4.8%) |
| $55,000 to $64,999 | 22 (2.5%) | 82 (6.9%) |
| $65,000 to $74,999 | 100 (11.5%) | 21 (1.8%) |
| $75,000 to $99,999 | 41 (4.7%) | 59 (4.9%) |
| $100,000+ | 75 (8.6%) | 93 (7.8%) |
| Total | 870 (100.0%) | 1,197 (100.0%) |
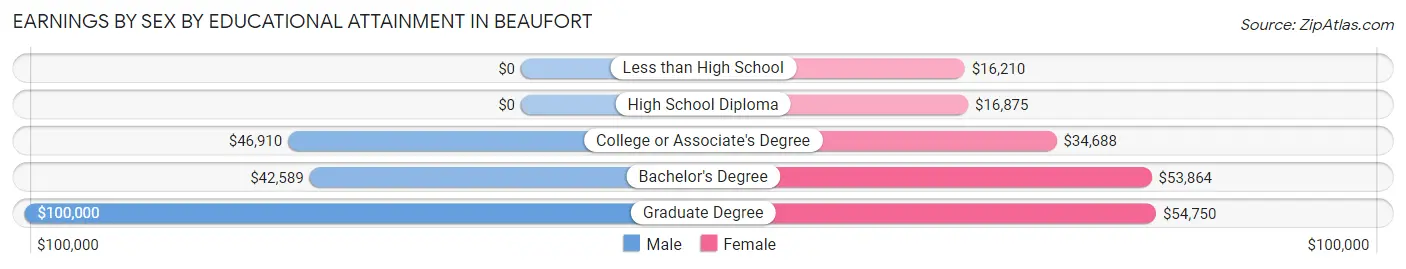
Earnings by Sex by Educational Attainment in Beaufort
Average earnings in Beaufort are $45,694 for men and $33,194 for women, a difference of 27.4%. Men with an educational attainment of graduate degree enjoy the highest average annual earnings of $100,000, while those with bachelor's degree education earn the least with $42,589. Women with an educational attainment of graduate degree earn the most with the average annual earnings of $54,750, while those with less than high school education have the smallest earnings of $16,210.
| Educational Attainment | Male Income | Female Income |
| Less than High School | - | - |
| High School Diploma | - | - |
| College or Associate's Degree | $46,910 | $34,688 |
| Bachelor's Degree | $42,589 | $53,864 |
| Graduate Degree | $100,000 | $54,750 |
| Total | $45,694 | $33,194 |
Family Income in Beaufort
Family Income Brackets in Beaufort
According to the Beaufort family income data, there are 284 families falling into the $50,000 to $74,999 income range, which is the most common income bracket and makes up 25.9% of all families.
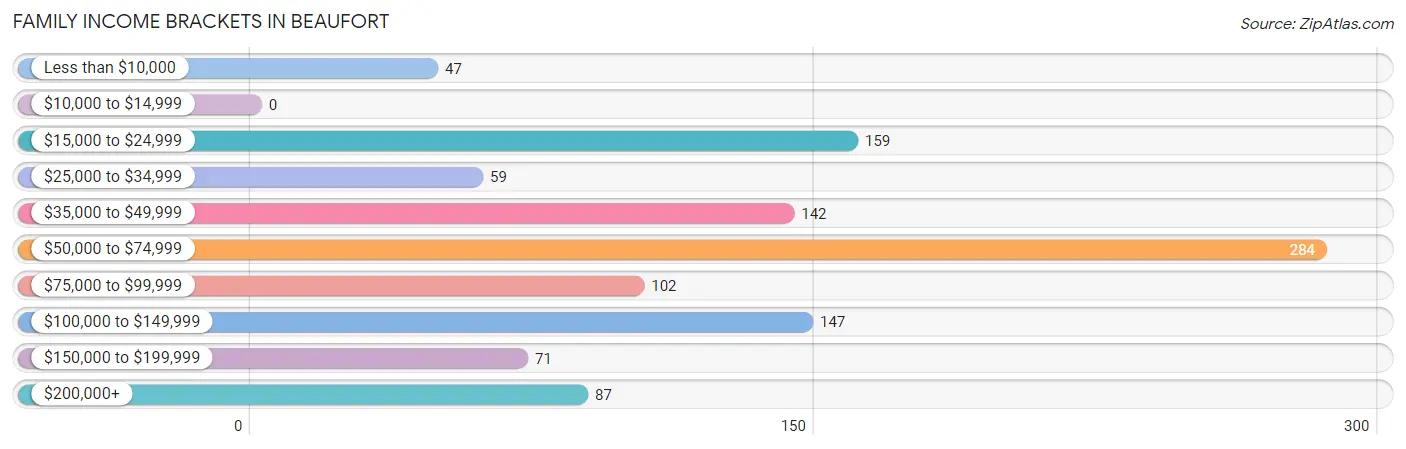
| Income Bracket | # Families | % Families |
| Less than $10,000 | 47 | 4.3% |
| $10,000 to $14,999 | 0 | 0.0% |
| $15,000 to $24,999 | 159 | 14.5% |
| $25,000 to $34,999 | 59 | 5.4% |
| $35,000 to $49,999 | 142 | 12.9% |
| $50,000 to $74,999 | 284 | 25.9% |
| $75,000 to $99,999 | 102 | 9.3% |
| $100,000 to $149,999 | 147 | 13.4% |
| $150,000 to $199,999 | 71 | 6.5% |
| $200,000+ | 87 | 7.9% |
Family Income by Famaliy Size in Beaufort
5-person families (44 | 4.0%) account for the highest median family income in Beaufort with $77,708 per family, while 2-person families (760 | 69.3%) have the highest median income of $29,509 per family member.
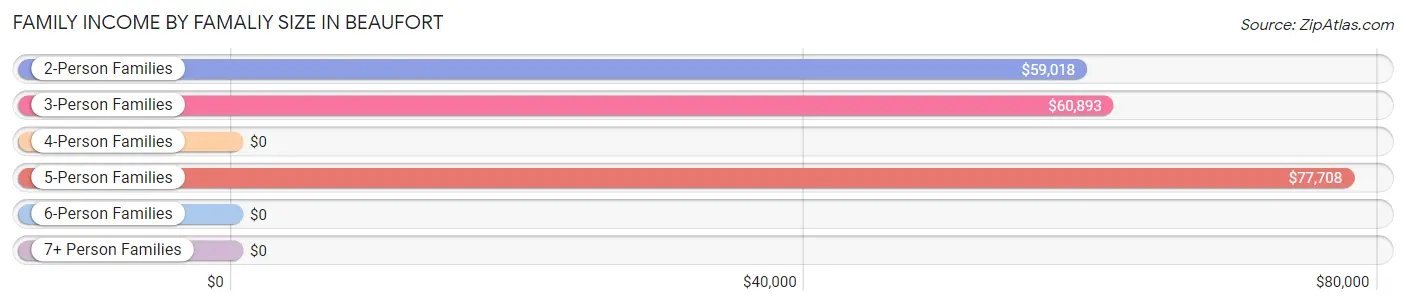
| Income Bracket | # Families | Median Income |
| 2-Person Families | 760 (69.3%) | $59,018 |
| 3-Person Families | 214 (19.5%) | $60,893 |
| 4-Person Families | 66 (6.0%) | $0 |
| 5-Person Families | 44 (4.0%) | $77,708 |
| 6-Person Families | 13 (1.2%) | $0 |
| 7+ Person Families | 0 (0.0%) | $0 |
| Total | 1,097 (100.0%) | $60,987 |
Family Income by Number of Earners in Beaufort
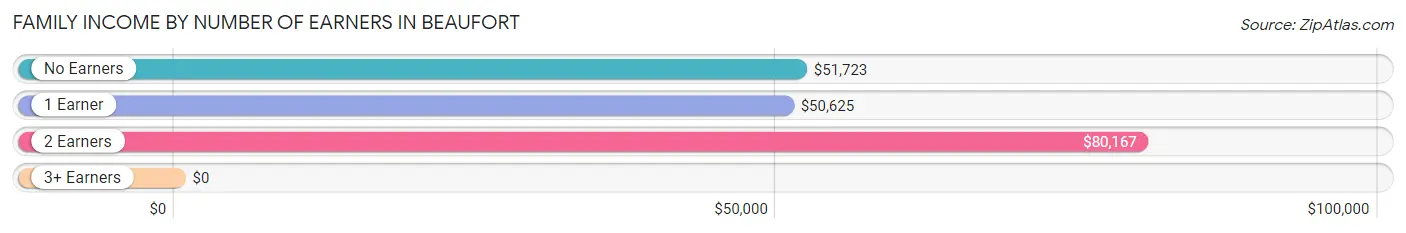
| Number of Earners | # Families | Median Income |
| No Earners | 289 (26.3%) | $51,723 |
| 1 Earner | 452 (41.2%) | $50,625 |
| 2 Earners | 324 (29.5%) | $80,167 |
| 3+ Earners | 32 (2.9%) | $0 |
| Total | 1,097 (100.0%) | $60,987 |
Household Income in Beaufort
Household Income Brackets in Beaufort
With 499 households falling in the category, the $15,000 to $24,999 income range is the most frequent in Beaufort, accounting for 21.5% of all households. In contrast, only 79 households (3.4%) fall into the $150,000 to $199,999 income bracket, making it the least populous group.
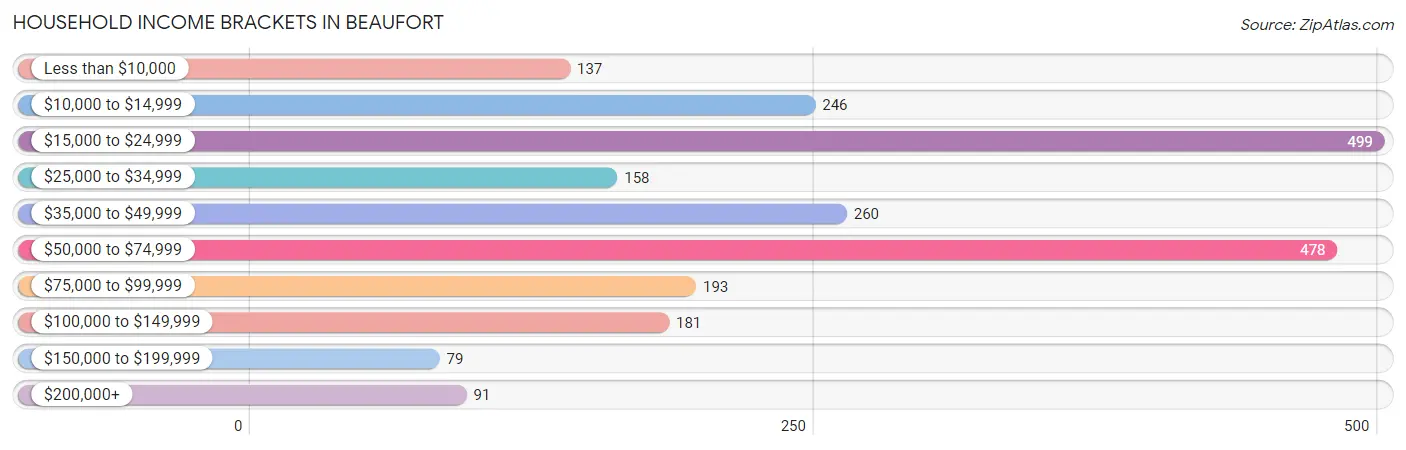
| Income Bracket | # Households | % Households |
| Less than $10,000 | 137 | 5.9% |
| $10,000 to $14,999 | 246 | 10.6% |
| $15,000 to $24,999 | 499 | 21.5% |
| $25,000 to $34,999 | 158 | 6.8% |
| $35,000 to $49,999 | 260 | 11.2% |
| $50,000 to $74,999 | 478 | 20.6% |
| $75,000 to $99,999 | 193 | 8.3% |
| $100,000 to $149,999 | 181 | 7.8% |
| $150,000 to $199,999 | 79 | 3.4% |
| $200,000+ | 91 | 3.9% |
Household Income by Householder Age in Beaufort
The median household income in Beaufort is $41,890, with the highest median household income of $57,880 found in the 25 to 44 years age bracket for the primary householder. A total of 479 households (20.6%) fall into this category. Meanwhile, the 15 to 24 years age bracket for the primary householder has the lowest median household income of $0, with 107 households (4.6%) in this group.
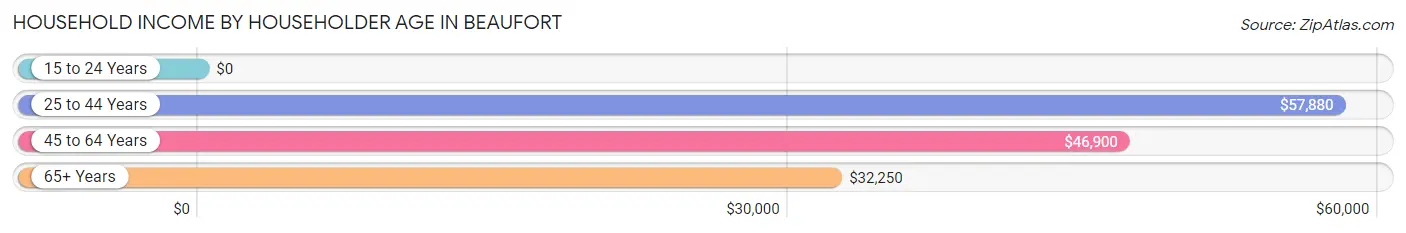
| Income Bracket | # Households | Median Income |
| 15 to 24 Years | 107 (4.6%) | $0 |
| 25 to 44 Years | 479 (20.6%) | $57,880 |
| 45 to 64 Years | 670 (28.9%) | $46,900 |
| 65+ Years | 1,065 (45.9%) | $32,250 |
| Total | 2,321 (100.0%) | $41,890 |
Poverty in Beaufort
Income Below Poverty by Sex and Age in Beaufort
With 15.4% poverty level for males and 13.9% for females among the residents of Beaufort, 5 year old males and 12 to 14 year old females are the most vulnerable to poverty, with 16 males (100.0%) and 45 females (34.6%) in their respective age groups living below the poverty level.
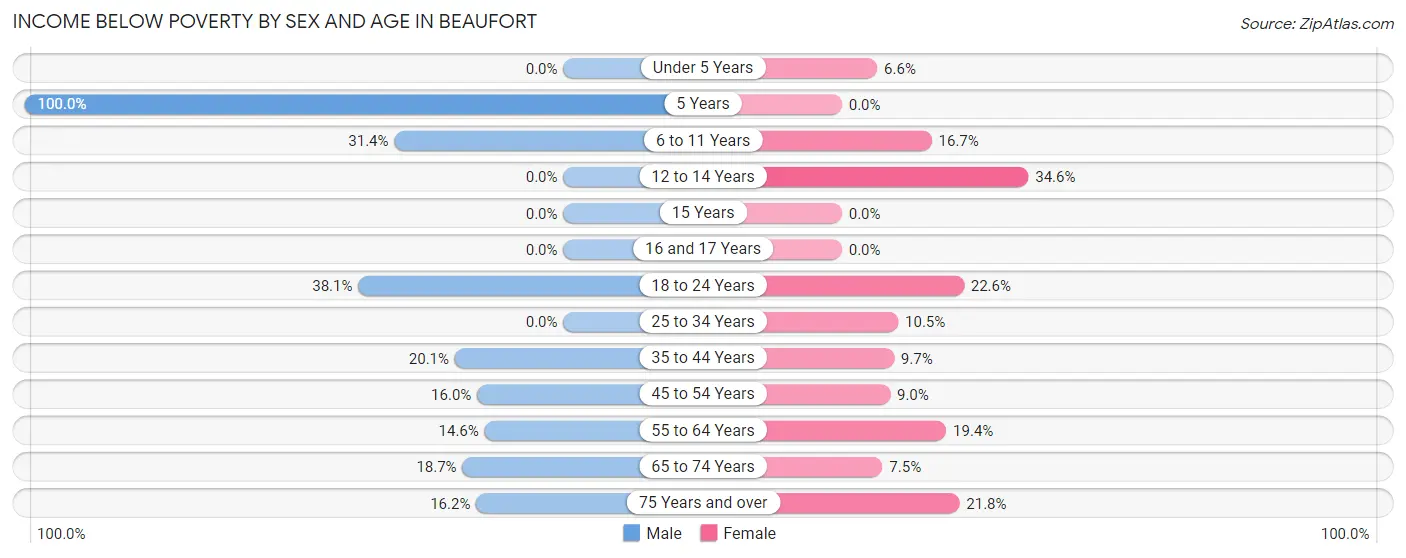
| Age Bracket | Male | Female |
| Under 5 Years | 0 (0.0%) | 4 (6.6%) |
| 5 Years | 16 (100.0%) | 0 (0.0%) |
| 6 to 11 Years | 16 (31.4%) | 11 (16.7%) |
| 12 to 14 Years | 0 (0.0%) | 45 (34.6%) |
| 15 Years | 0 (0.0%) | 0 (0.0%) |
| 16 and 17 Years | 0 (0.0%) | 0 (0.0%) |
| 18 to 24 Years | 59 (38.1%) | 24 (22.6%) |
| 25 to 34 Years | 0 (0.0%) | 23 (10.4%) |
| 35 to 44 Years | 28 (20.1%) | 29 (9.7%) |
| 45 to 54 Years | 28 (16.0%) | 17 (8.9%) |
| 55 to 64 Years | 31 (14.6%) | 80 (19.4%) |
| 65 to 74 Years | 68 (18.7%) | 43 (7.5%) |
| 75 Years and over | 43 (16.2%) | 60 (21.8%) |
| Total | 289 (15.4%) | 336 (13.9%) |
Income Above Poverty by Sex and Age in Beaufort
According to the poverty statistics in Beaufort, males aged under 5 years and females aged 5 years are the age groups that are most secure financially, with 100.0% of males and 100.0% of females in these age groups living above the poverty line.
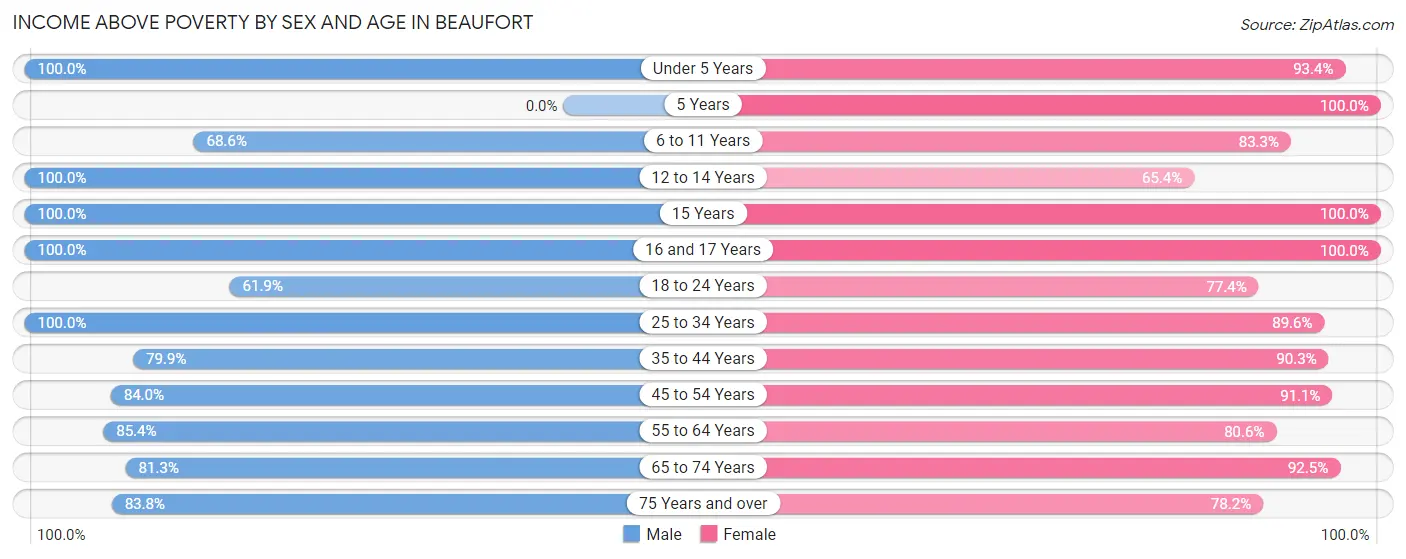
| Age Bracket | Male | Female |
| Under 5 Years | 59 (100.0%) | 57 (93.4%) |
| 5 Years | 0 (0.0%) | 7 (100.0%) |
| 6 to 11 Years | 35 (68.6%) | 55 (83.3%) |
| 12 to 14 Years | 202 (100.0%) | 85 (65.4%) |
| 15 Years | 23 (100.0%) | 16 (100.0%) |
| 16 and 17 Years | 33 (100.0%) | 68 (100.0%) |
| 18 to 24 Years | 96 (61.9%) | 82 (77.4%) |
| 25 to 34 Years | 178 (100.0%) | 197 (89.5%) |
| 35 to 44 Years | 111 (79.9%) | 271 (90.3%) |
| 45 to 54 Years | 147 (84.0%) | 173 (91.0%) |
| 55 to 64 Years | 181 (85.4%) | 333 (80.6%) |
| 65 to 74 Years | 295 (81.3%) | 527 (92.5%) |
| 75 Years and over | 223 (83.8%) | 215 (78.2%) |
| Total | 1,583 (84.6%) | 2,086 (86.1%) |
Income Below Poverty Among Married-Couple Families in Beaufort
The poverty statistics for married-couple families in Beaufort show that 12.9% or 100 of the total 773 families live below the poverty line. Families with 3 or 4 children have the highest poverty rate of 100.0%, comprising of 13 families. On the other hand, families with 1 or 2 children have the lowest poverty rate of 0.0%, which includes 0 families.
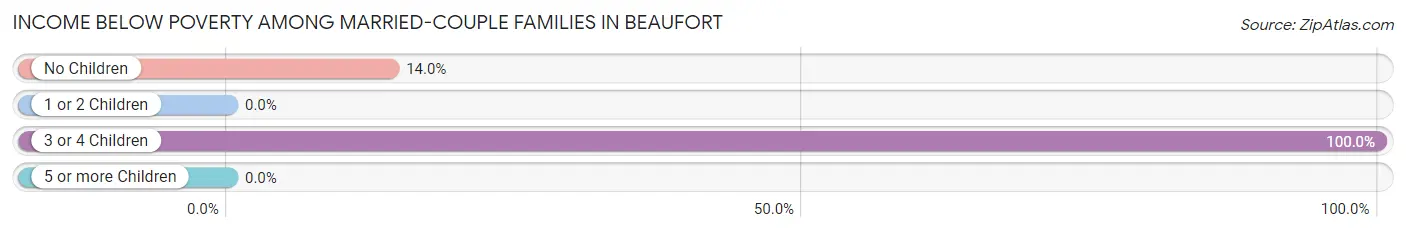
| Children | Above Poverty | Below Poverty |
| No Children | 533 (86.0%) | 87 (14.0%) |
| 1 or 2 Children | 140 (100.0%) | 0 (0.0%) |
| 3 or 4 Children | 0 (0.0%) | 13 (100.0%) |
| 5 or more Children | 0 (0.0%) | 0 (0.0%) |
| Total | 673 (87.1%) | 100 (12.9%) |
Income Below Poverty Among Single-Parent Households in Beaufort
According to the poverty data in Beaufort, 40.6% or 28 single-father households and 10.6% or 27 single-mother households are living below the poverty line. Among single-father households, those with 1 or 2 children have the highest poverty rate, with 28 households (65.1%) experiencing poverty. Likewise, among single-mother households, those with no children have the highest poverty rate, with 12 households (29.3%) falling below the poverty line.
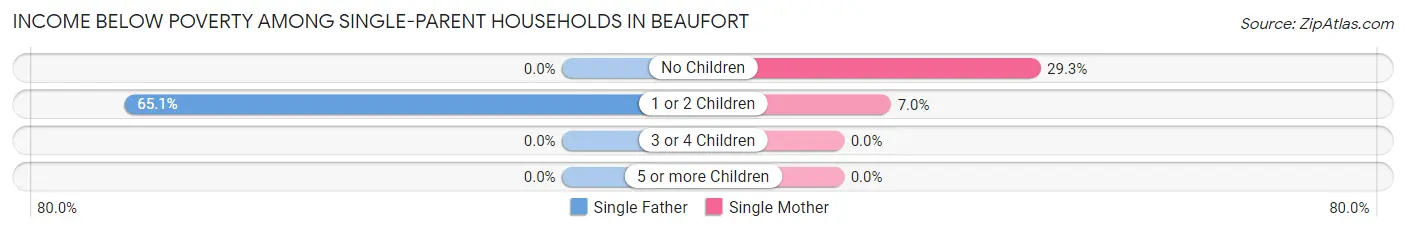
| Children | Single Father | Single Mother |
| No Children | 0 (0.0%) | 12 (29.3%) |
| 1 or 2 Children | 28 (65.1%) | 15 (7.0%) |
| 3 or 4 Children | 0 (0.0%) | 0 (0.0%) |
| 5 or more Children | 0 (0.0%) | 0 (0.0%) |
| Total | 28 (40.6%) | 27 (10.6%) |
Income Below Poverty Among Married-Couple vs Single-Parent Households in Beaufort
The poverty data for Beaufort shows that 100 of the married-couple family households (12.9%) and 55 of the single-parent households (17.0%) are living below the poverty level. Within the married-couple family households, those with 3 or 4 children have the highest poverty rate, with 13 households (100.0%) falling below the poverty line. Among the single-parent households, those with no children have the highest poverty rate, with 12 household (17.9%) living below poverty.
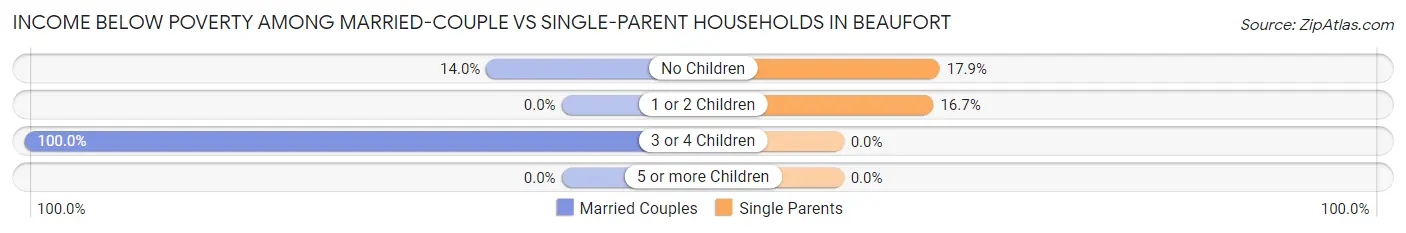
| Children | Married-Couple Families | Single-Parent Households |
| No Children | 87 (14.0%) | 12 (17.9%) |
| 1 or 2 Children | 0 (0.0%) | 43 (16.7%) |
| 3 or 4 Children | 13 (100.0%) | 0 (0.0%) |
| 5 or more Children | 0 (0.0%) | 0 (0.0%) |
| Total | 100 (12.9%) | 55 (17.0%) |
Race in Beaufort
The most populous races in Beaufort are White / Caucasian (3,578 | 78.9%), Black / African American (578 | 12.8%), and Two or more Races (290 | 6.4%).
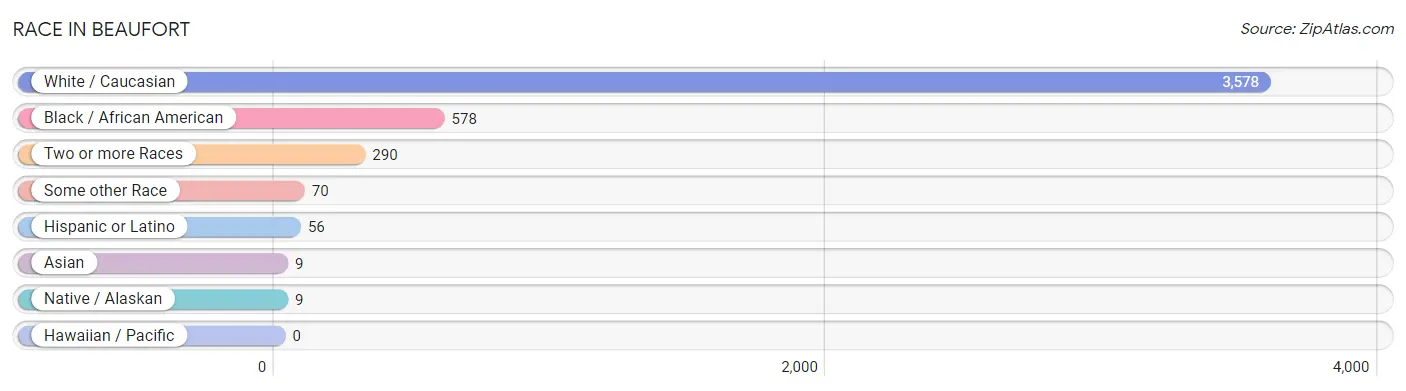
| Race | # Population | % Population |
| Asian | 9 | 0.2% |
| Black / African American | 578 | 12.8% |
| Hawaiian / Pacific | 0 | 0.0% |
| Hispanic or Latino | 56 | 1.2% |
| Native / Alaskan | 9 | 0.2% |
| White / Caucasian | 3,578 | 78.9% |
| Two or more Races | 290 | 6.4% |
| Some other Race | 70 | 1.5% |
| Total | 4,534 | 100.0% |
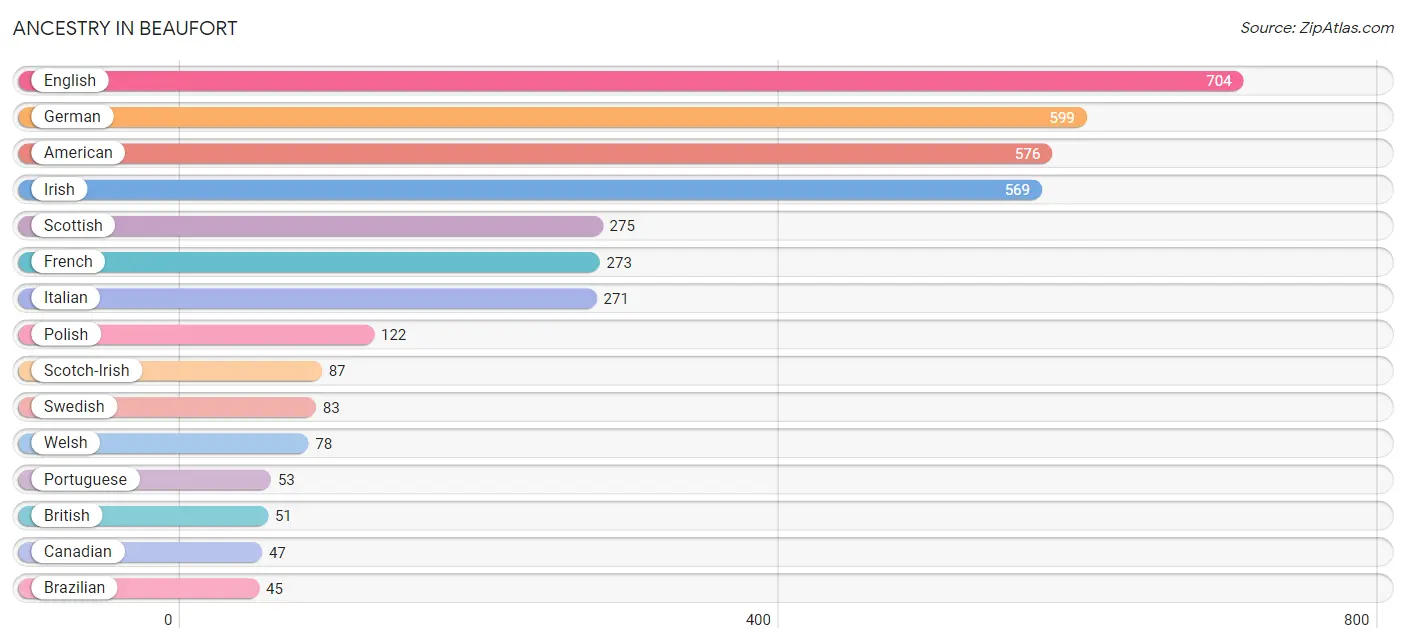
Ancestry in Beaufort
The most populous ancestries reported in Beaufort are English (704 | 15.5%), German (599 | 13.2%), American (576 | 12.7%), Irish (569 | 12.6%), and Scottish (275 | 6.1%), together accounting for 60.1% of all Beaufort residents.
| Ancestry | # Population | % Population |
| American | 576 | 12.7% |
| Brazilian | 45 | 1.0% |
| British | 51 | 1.1% |
| Canadian | 47 | 1.0% |
| Celtic | 5 | 0.1% |
| Central American | 11 | 0.2% |
| Cherokee | 17 | 0.4% |
| Cuban | 20 | 0.4% |
| Czech | 11 | 0.2% |
| Danish | 8 | 0.2% |
| Dutch | 34 | 0.7% |
| English | 704 | 15.5% |
| European | 43 | 0.9% |
| Finnish | 30 | 0.7% |
| French | 273 | 6.0% |
| German | 599 | 13.2% |
| Greek | 15 | 0.3% |
| Guatemalan | 11 | 0.2% |
| Hungarian | 32 | 0.7% |
| Irish | 569 | 12.6% |
| Italian | 271 | 6.0% |
| Korean | 1 | 0.0% |
| Lumbee | 9 | 0.2% |
| Mexican | 18 | 0.4% |
| Norwegian | 39 | 0.9% |
| Polish | 122 | 2.7% |
| Portuguese | 53 | 1.2% |
| Puerto Rican | 7 | 0.2% |
| Russian | 11 | 0.2% |
| Scandinavian | 18 | 0.4% |
| Scotch-Irish | 87 | 1.9% |
| Scottish | 275 | 6.1% |
| Swedish | 83 | 1.8% |
| Swiss | 5 | 0.1% |
| Thai | 8 | 0.2% |
| Welsh | 78 | 1.7% | View All 36 Rows |
Immigrants in Beaufort
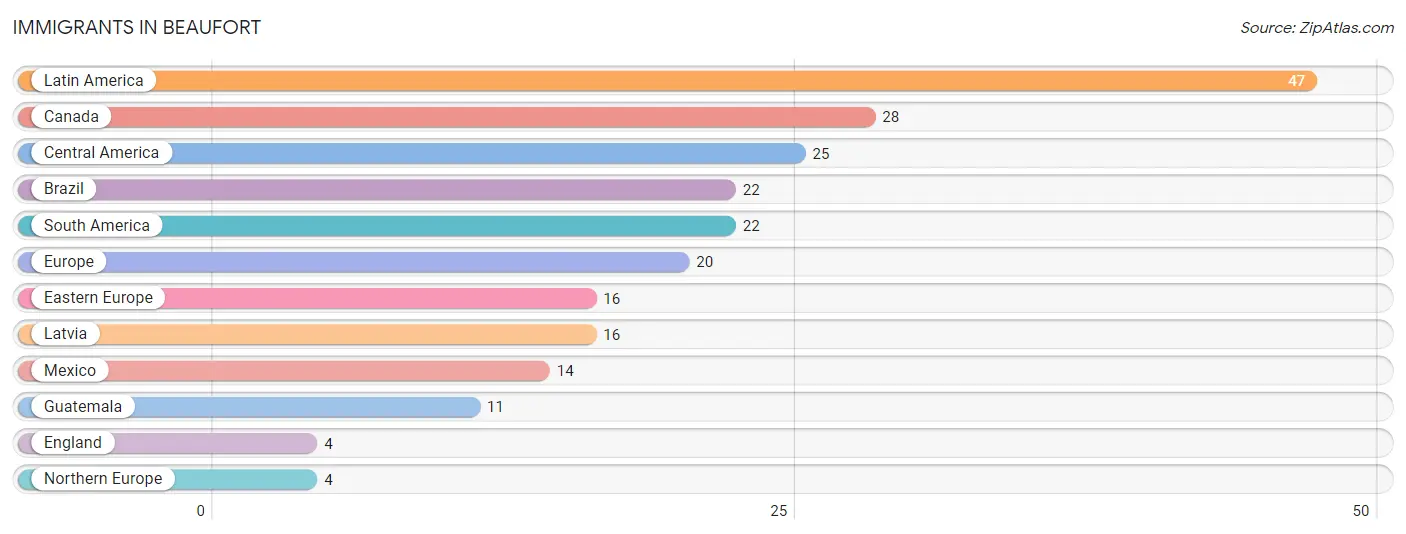
The most numerous immigrant groups reported in Beaufort came from Latin America (47 | 1.0%), Canada (28 | 0.6%), Central America (25 | 0.5%), Brazil (22 | 0.5%), and South America (22 | 0.5%), together accounting for 3.2% of all Beaufort residents.
| Immigration Origin | # Population | % Population |
| Brazil | 22 | 0.5% |
| Canada | 28 | 0.6% |
| Central America | 25 | 0.5% |
| Eastern Europe | 16 | 0.4% |
| England | 4 | 0.1% |
| Europe | 20 | 0.4% |
| Guatemala | 11 | 0.2% |
| Latin America | 47 | 1.0% |
| Latvia | 16 | 0.4% |
| Mexico | 14 | 0.3% |
| Northern Europe | 4 | 0.1% |
| South America | 22 | 0.5% | View All 12 Rows |
Sex and Age in Beaufort
Sex and Age in Beaufort
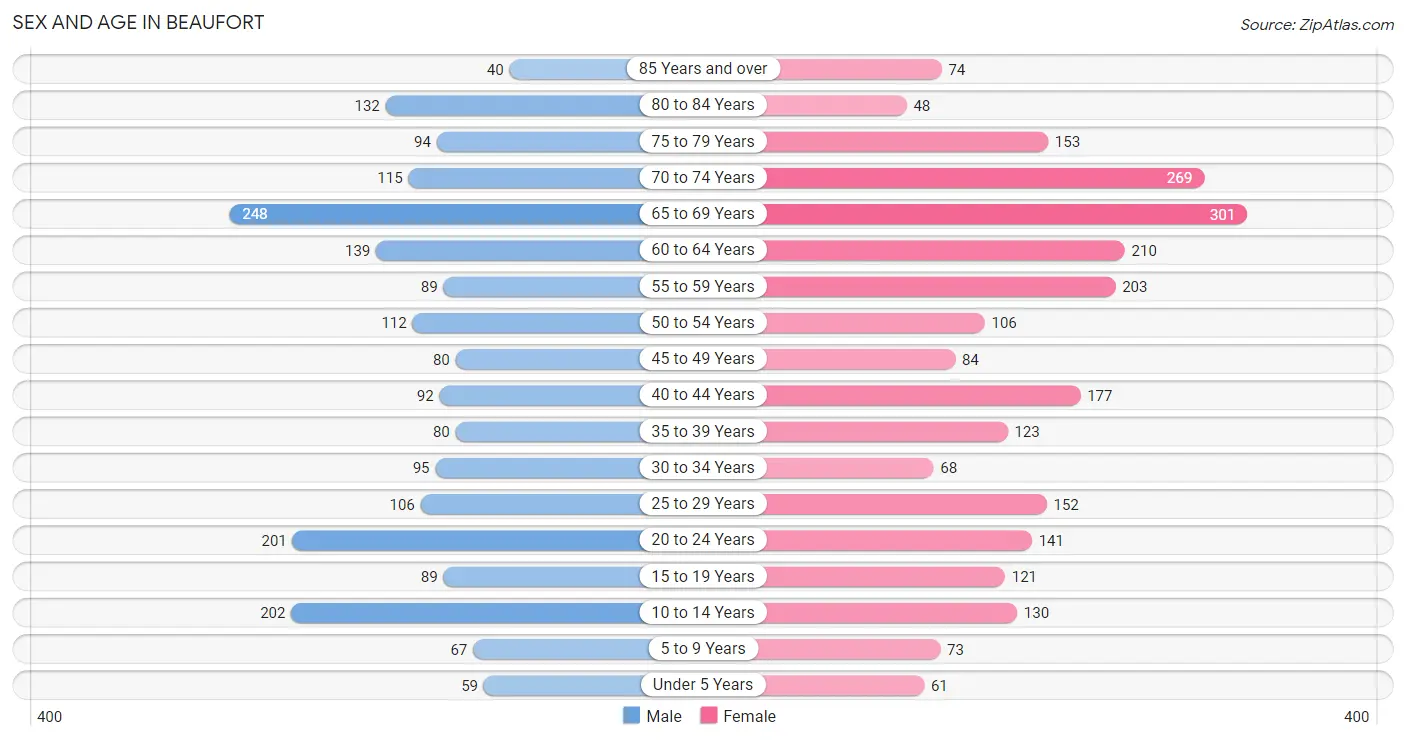
The most populous age groups in Beaufort are 65 to 69 Years (248 | 12.2%) for men and 65 to 69 Years (301 | 12.1%) for women.
| Age Bracket | Male | Female |
| Under 5 Years | 59 (2.9%) | 61 (2.5%) |
| 5 to 9 Years | 67 (3.3%) | 73 (2.9%) |
| 10 to 14 Years | 202 (9.9%) | 130 (5.2%) |
| 15 to 19 Years | 89 (4.4%) | 121 (4.9%) |
| 20 to 24 Years | 201 (9.9%) | 141 (5.7%) |
| 25 to 29 Years | 106 (5.2%) | 152 (6.1%) |
| 30 to 34 Years | 95 (4.7%) | 68 (2.7%) |
| 35 to 39 Years | 80 (3.9%) | 123 (4.9%) |
| 40 to 44 Years | 92 (4.5%) | 177 (7.1%) |
| 45 to 49 Years | 80 (3.9%) | 84 (3.4%) |
| 50 to 54 Years | 112 (5.5%) | 106 (4.3%) |
| 55 to 59 Years | 89 (4.4%) | 203 (8.1%) |
| 60 to 64 Years | 139 (6.8%) | 210 (8.4%) |
| 65 to 69 Years | 248 (12.2%) | 301 (12.1%) |
| 70 to 74 Years | 115 (5.6%) | 269 (10.8%) |
| 75 to 79 Years | 94 (4.6%) | 153 (6.1%) |
| 80 to 84 Years | 132 (6.5%) | 48 (1.9%) |
| 85 Years and over | 40 (2.0%) | 74 (3.0%) |
| Total | 2,040 (100.0%) | 2,494 (100.0%) |
Families and Households in Beaufort
Median Family Size in Beaufort
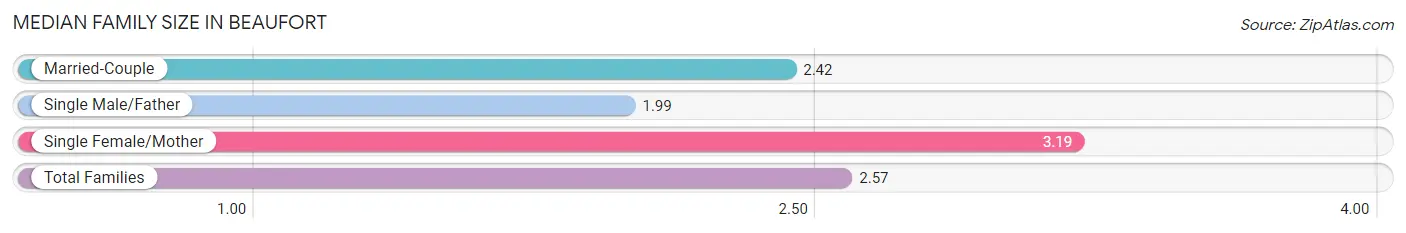
The median family size in Beaufort is 2.57 persons per family, with single female/mother families (255 | 23.3%) accounting for the largest median family size of 3.19 persons per family. On the other hand, single male/father families (69 | 6.3%) represent the smallest median family size with 1.99 persons per family.
| Family Type | # Families | Family Size |
| Married-Couple | 773 (70.5%) | 2.42 |
| Single Male/Father | 69 (6.3%) | 1.99 |
| Single Female/Mother | 255 (23.3%) | 3.19 |
| Total Families | 1,097 (100.0%) | 2.57 |
Median Household Size in Beaufort
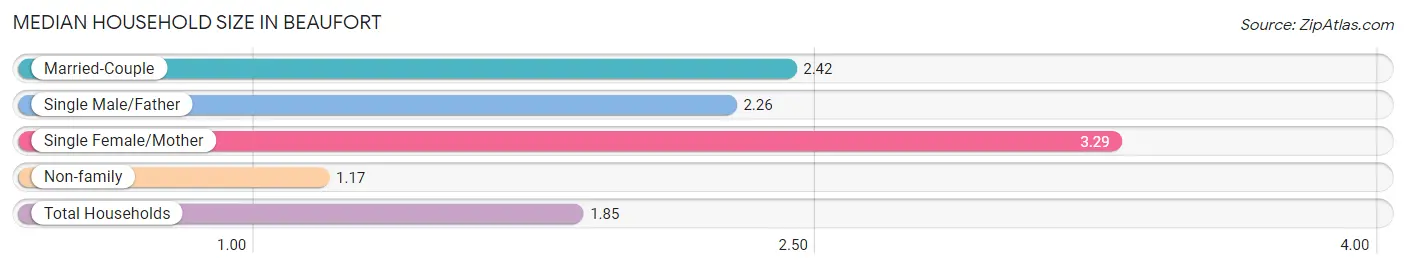
The median household size in Beaufort is 1.85 persons per household, with single female/mother households (255 | 11.0%) accounting for the largest median household size of 3.29 persons per household. non-family households (1,224 | 52.7%) represent the smallest median household size with 1.17 persons per household.
| Household Type | # Households | Household Size |
| Married-Couple | 773 (33.3%) | 2.42 |
| Single Male/Father | 69 (3.0%) | 2.26 |
| Single Female/Mother | 255 (11.0%) | 3.29 |
| Non-family | 1,224 (52.7%) | 1.17 |
| Total Households | 2,321 (100.0%) | 1.85 |
Household Size by Marriage Status in Beaufort
Out of a total of 2,321 households in Beaufort, 1,097 (47.3%) are family households, while 1,224 (52.7%) are nonfamily households. The most numerous type of family households are 2-person households, comprising 740, and the most common type of nonfamily households are 1-person households, comprising 1,080.
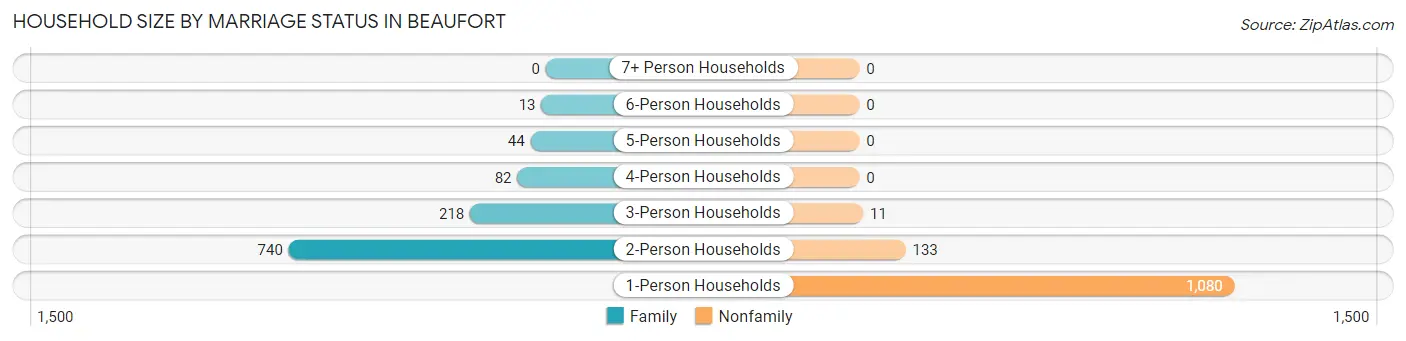
| Household Size | Family Households | Nonfamily Households |
| 1-Person Households | - | 1,080 (46.5%) |
| 2-Person Households | 740 (31.9%) | 133 (5.7%) |
| 3-Person Households | 218 (9.4%) | 11 (0.5%) |
| 4-Person Households | 82 (3.5%) | 0 (0.0%) |
| 5-Person Households | 44 (1.9%) | 0 (0.0%) |
| 6-Person Households | 13 (0.6%) | 0 (0.0%) |
| 7+ Person Households | 0 (0.0%) | 0 (0.0%) |
| Total | 1,097 (47.3%) | 1,224 (52.7%) |
Female Fertility in Beaufort
Fertility by Age in Beaufort
Average fertility rate in Beaufort is 24.0 births per 1,000 women. Women in the age bracket of 20 to 34 years have the highest fertility rate with 33.0 births per 1,000 women. Women in the age bracket of 20 to 34 years acount for 57.1% of all women with births.
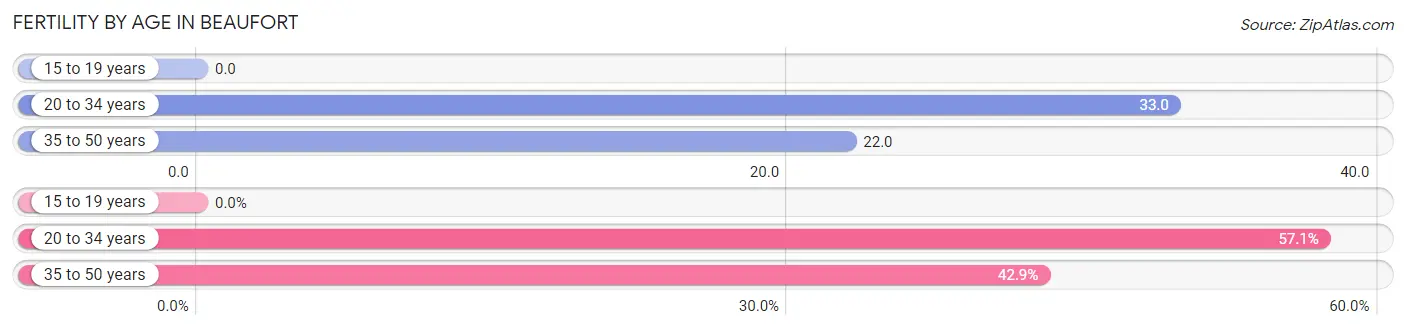
| Age Bracket | Women with Births | Births / 1,000 Women |
| 15 to 19 years | 0 (0.0%) | 0.0 |
| 20 to 34 years | 12 (57.1%) | 33.0 |
| 35 to 50 years | 9 (42.9%) | 22.0 |
| Total | 21 (100.0%) | 24.0 |
Fertility by Age by Marriage Status in Beaufort
42.9% of women with births (21) in Beaufort are married. The highest percentage of unmarried women with births falls into 20 to 34 years age bracket with 100.0% of them unmarried at the time of birth, while the lowest percentage of unmarried women with births belong to 35 to 50 years age bracket with 0.0% of them unmarried.
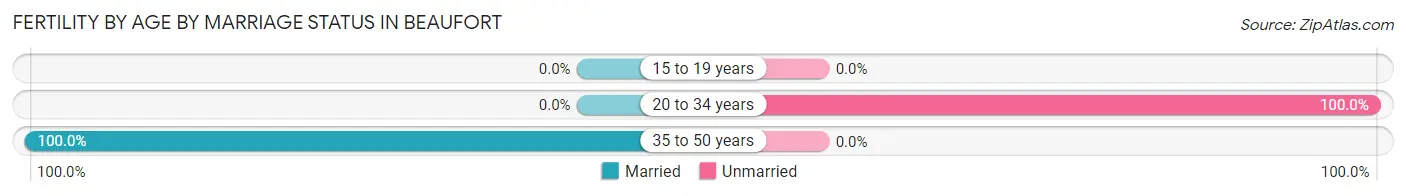
| Age Bracket | Married | Unmarried |
| 15 to 19 years | 0 (0.0%) | 0 (0.0%) |
| 20 to 34 years | 0 (0.0%) | 12 (100.0%) |
| 35 to 50 years | 9 (100.0%) | 0 (0.0%) |
| Total | 9 (42.9%) | 12 (57.1%) |
Fertility by Education in Beaufort
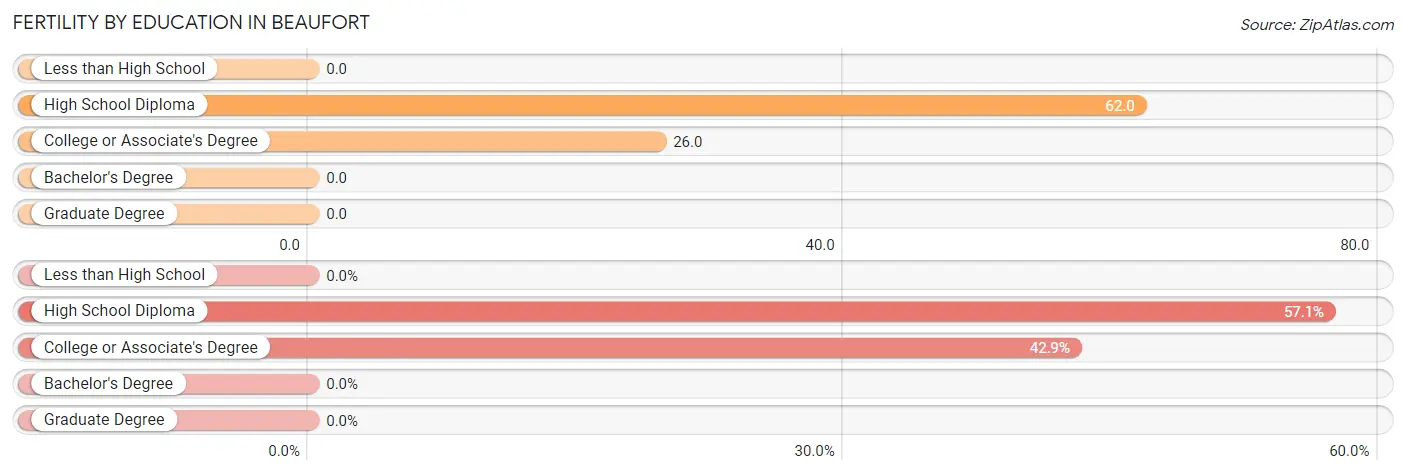
| Educational Attainment | Women with Births | Births / 1,000 Women |
| Less than High School | 0 (0.0%) | 0.0 |
| High School Diploma | 12 (57.1%) | 62.0 |
| College or Associate's Degree | 9 (42.9%) | 26.0 |
| Bachelor's Degree | 0 (0.0%) | 0.0 |
| Graduate Degree | 0 (0.0%) | 0.0 |
| Total | 21 (100.0%) | 24.0 |
Fertility by Education by Marriage Status in Beaufort
57.1% of women with births in Beaufort are unmarried. Women with the educational attainment of college or associate's degree are most likely to be married with 100.0% of them married at childbirth, while women with the educational attainment of high school diploma are least likely to be married with 100.0% of them unmarried at childbirth.
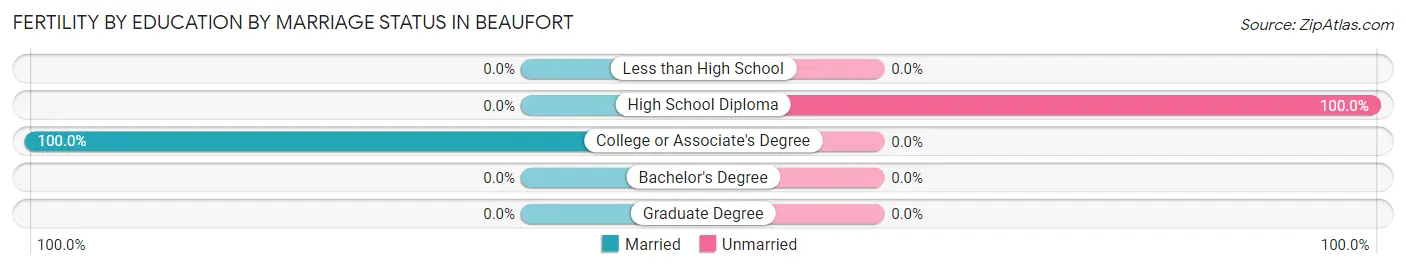
| Educational Attainment | Married | Unmarried |
| Less than High School | 0 (0.0%) | 0 (0.0%) |
| High School Diploma | 0 (0.0%) | 12 (100.0%) |
| College or Associate's Degree | 9 (100.0%) | 0 (0.0%) |
| Bachelor's Degree | 0 (0.0%) | 0 (0.0%) |
| Graduate Degree | 0 (0.0%) | 0 (0.0%) |
| Total | 9 (42.9%) | 12 (57.1%) |
Employment Characteristics in Beaufort
Employment by Class of Employer in Beaufort
Among the 1,783 employed individuals in Beaufort, private company employees (1,120 | 62.8%), self-employed (not incorporated) (153 | 8.6%), and not-for-profit organizations (144 | 8.1%) make up the most common classes of employment.
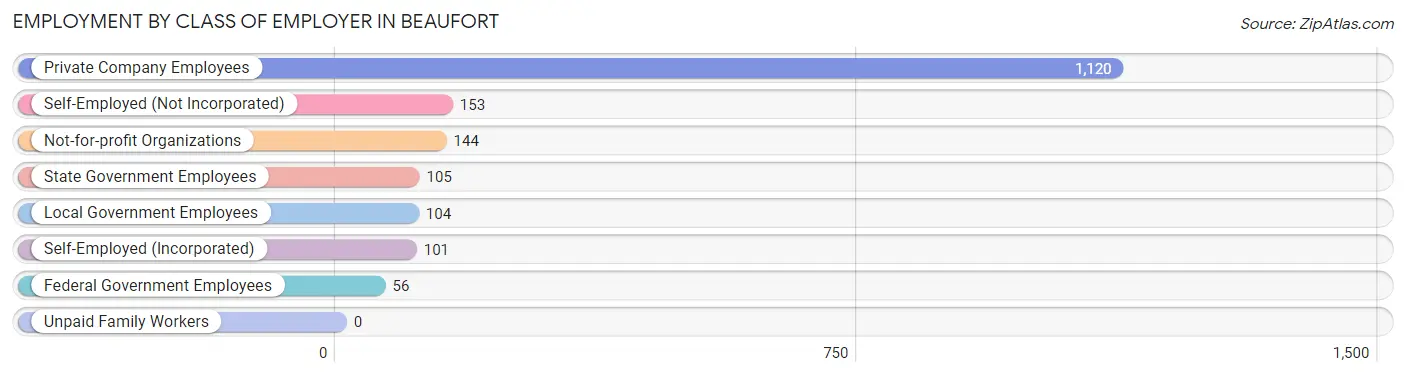
| Employer Class | # Employees | % Employees |
| Private Company Employees | 1,120 | 62.8% |
| Self-Employed (Incorporated) | 101 | 5.7% |
| Self-Employed (Not Incorporated) | 153 | 8.6% |
| Not-for-profit Organizations | 144 | 8.1% |
| Local Government Employees | 104 | 5.8% |
| State Government Employees | 105 | 5.9% |
| Federal Government Employees | 56 | 3.1% |
| Unpaid Family Workers | 0 | 0.0% |
| Total | 1,783 | 100.0% |
Employment Status by Age in Beaufort
According to the labor force statistics for Beaufort, out of the total population over 16 years of age (3,903), 50.7% or 1,979 individuals are in the labor force, with 6.4% or 127 of them unemployed. The age group with the highest labor force participation rate is 35 to 44 years, with 84.1% or 397 individuals in the labor force. Within the labor force, the 16 to 19 years age range has the highest percentage of unemployed individuals, with 48.4% or 15 of them being unemployed.
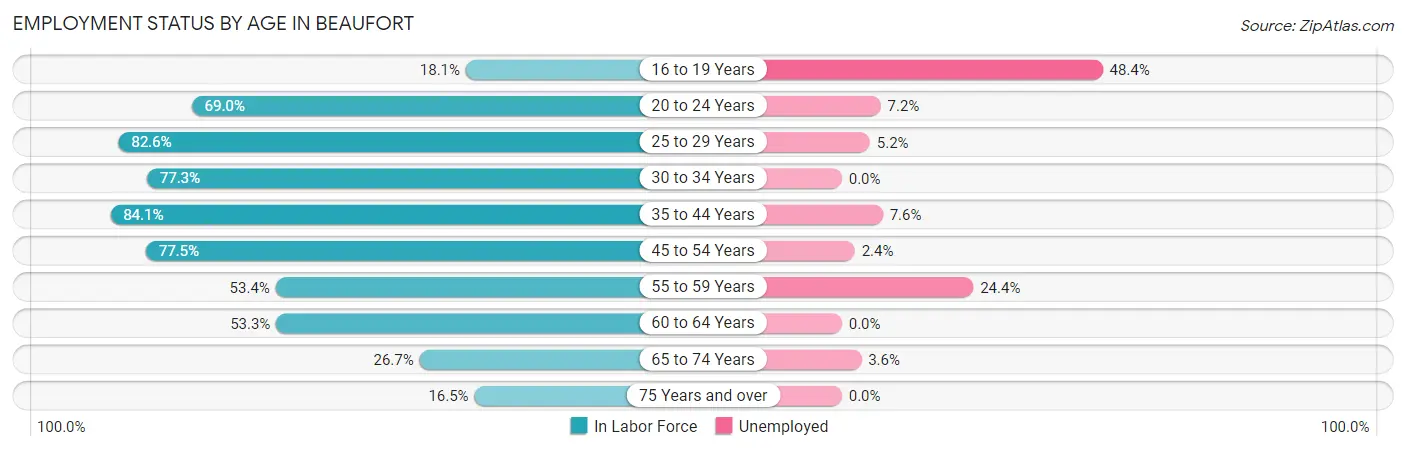
| Age Bracket | In Labor Force | Unemployed |
| 16 to 19 Years | 31 (18.1%) | 15 (48.4%) |
| 20 to 24 Years | 236 (69.0%) | 17 (7.2%) |
| 25 to 29 Years | 213 (82.6%) | 11 (5.2%) |
| 30 to 34 Years | 126 (77.3%) | 0 (0.0%) |
| 35 to 44 Years | 397 (84.1%) | 30 (7.6%) |
| 45 to 54 Years | 296 (77.5%) | 7 (2.4%) |
| 55 to 59 Years | 156 (53.4%) | 38 (24.4%) |
| 60 to 64 Years | 186 (53.3%) | 0 (0.0%) |
| 65 to 74 Years | 249 (26.7%) | 9 (3.6%) |
| 75 Years and over | 89 (16.5%) | 0 (0.0%) |
| Total | 1,979 (50.7%) | 127 (6.4%) |
Employment Status by Educational Attainment in Beaufort
According to labor force statistics for Beaufort, 71.7% of individuals (1,374) out of the total population between 25 and 64 years of age (1,916) are in the labor force, with 6.3% or 87 of them being unemployed. The group with the highest labor force participation rate are those with the educational attainment of bachelor's degree or higher, with 86.6% or 503 individuals in the labor force. Within the labor force, individuals with high school diploma education have the highest percentage of unemployment, with 15.9% or 41 of them being unemployed.
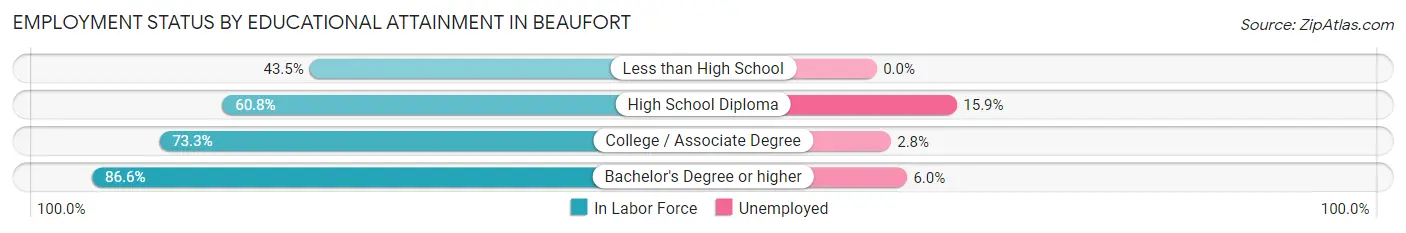
| Educational Attainment | In Labor Force | Unemployed |
| Less than High School | 80 (43.5%) | 0 (0.0%) |
| High School Diploma | 258 (60.8%) | 67 (15.9%) |
| College / Associate Degree | 533 (73.3%) | 20 (2.8%) |
| Bachelor's Degree or higher | 503 (86.6%) | 35 (6.0%) |
| Total | 1,374 (71.7%) | 121 (6.3%) |
Employment Occupations by Sex in Beaufort
Management, Business, Science and Arts Occupations
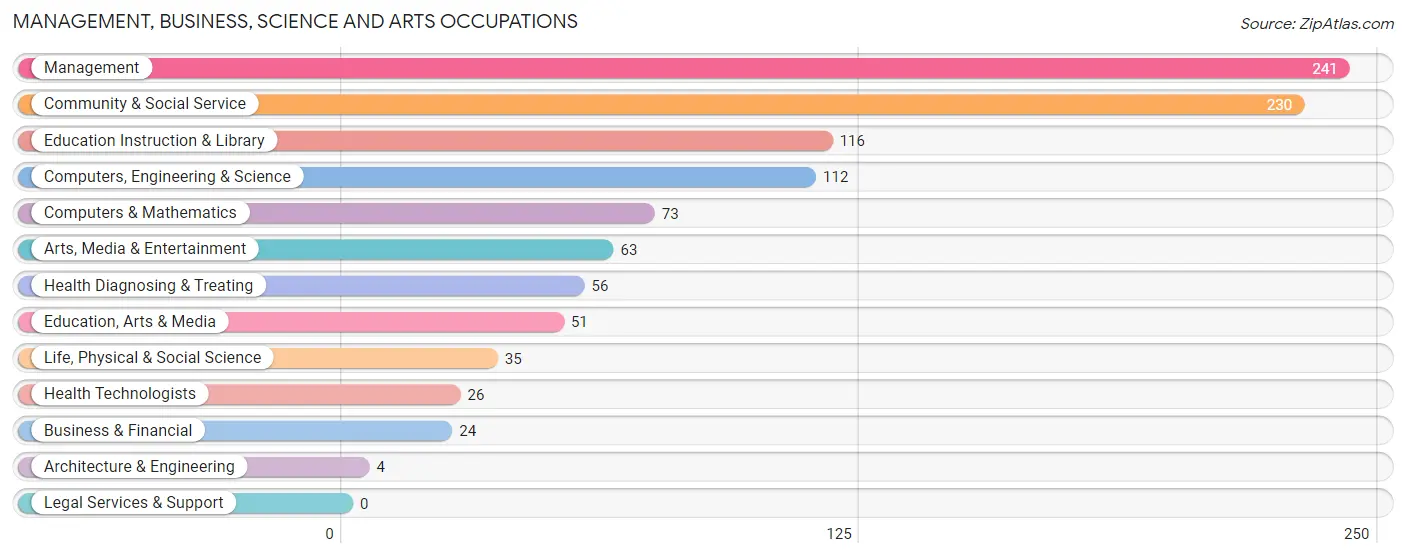
The most common Management, Business, Science and Arts occupations in Beaufort are Management (241 | 13.0%), Community & Social Service (230 | 12.4%), Education Instruction & Library (116 | 6.3%), Computers, Engineering & Science (112 | 6.0%), and Computers & Mathematics (73 | 3.9%).
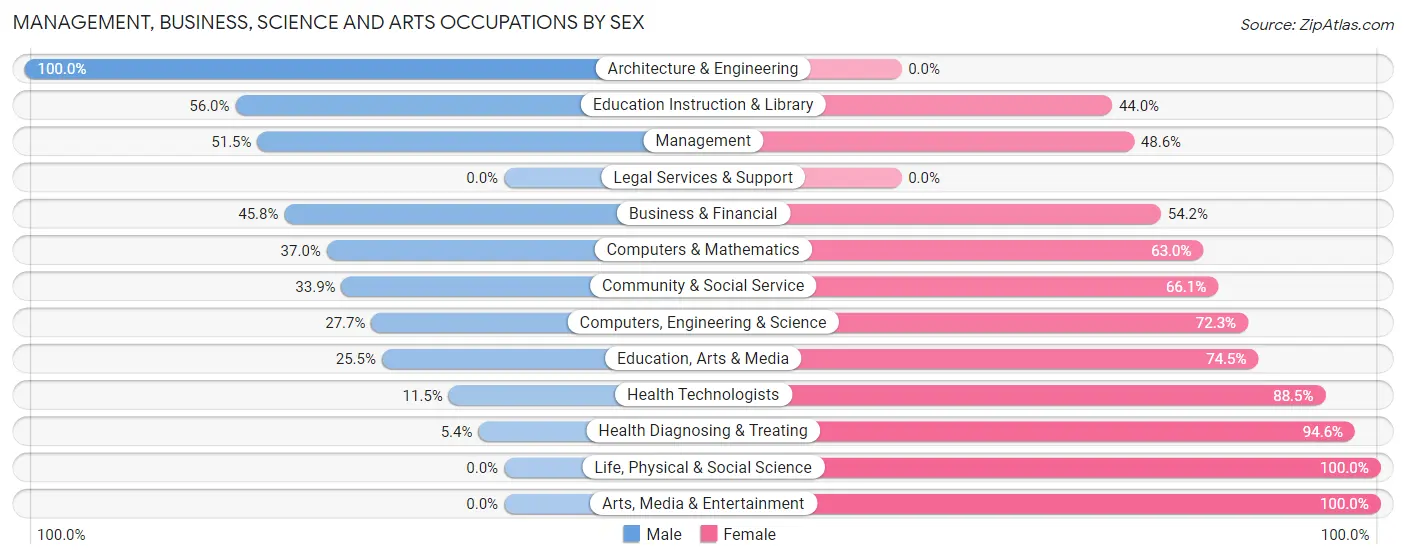
Management, Business, Science and Arts Occupations by Sex
Within the Management, Business, Science and Arts occupations in Beaufort, the most male-oriented occupations are Architecture & Engineering (100.0%), Education Instruction & Library (56.0%), and Management (51.4%), while the most female-oriented occupations are Life, Physical & Social Science (100.0%), Arts, Media & Entertainment (100.0%), and Health Diagnosing & Treating (94.6%).
| Occupation | Male | Female |
| Management | 124 (51.4%) | 117 (48.5%) |
| Business & Financial | 11 (45.8%) | 13 (54.2%) |
| Computers, Engineering & Science | 31 (27.7%) | 81 (72.3%) |
| Computers & Mathematics | 27 (37.0%) | 46 (63.0%) |
| Architecture & Engineering | 4 (100.0%) | 0 (0.0%) |
| Life, Physical & Social Science | 0 (0.0%) | 35 (100.0%) |
| Community & Social Service | 78 (33.9%) | 152 (66.1%) |
| Education, Arts & Media | 13 (25.5%) | 38 (74.5%) |
| Legal Services & Support | 0 (0.0%) | 0 (0.0%) |
| Education Instruction & Library | 65 (56.0%) | 51 (44.0%) |
| Arts, Media & Entertainment | 0 (0.0%) | 63 (100.0%) |
| Health Diagnosing & Treating | 3 (5.4%) | 53 (94.6%) |
| Health Technologists | 3 (11.5%) | 23 (88.5%) |
| Total (Category) | 247 (37.2%) | 416 (62.7%) |
| Total (Overall) | 796 (43.0%) | 1,056 (57.0%) |
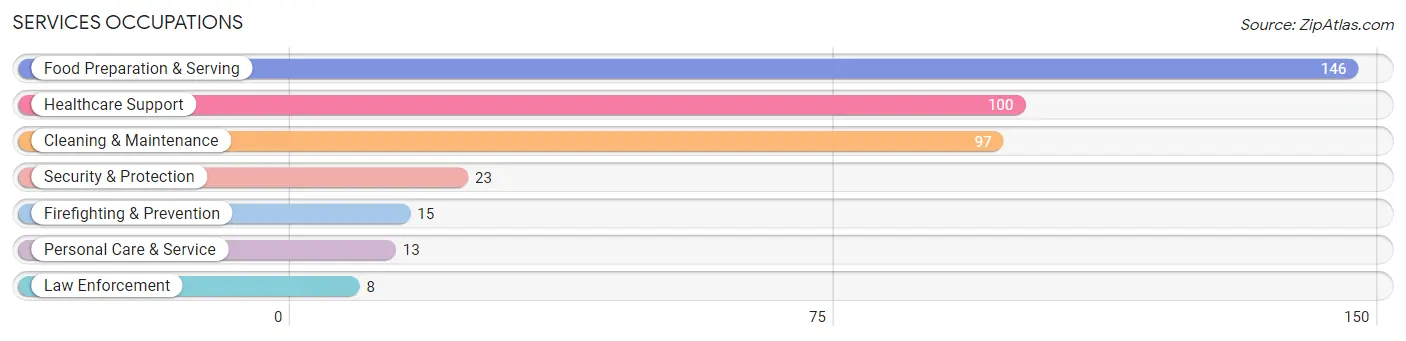
Services Occupations
The most common Services occupations in Beaufort are Food Preparation & Serving (146 | 7.9%), Healthcare Support (100 | 5.4%), Cleaning & Maintenance (97 | 5.2%), Security & Protection (23 | 1.2%), and Firefighting & Prevention (15 | 0.8%).
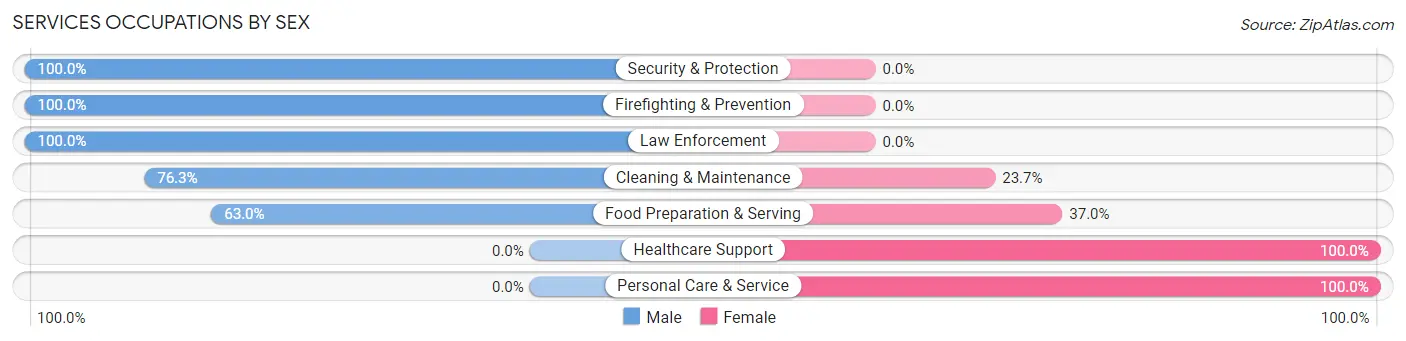
Services Occupations by Sex
Within the Services occupations in Beaufort, the most male-oriented occupations are Security & Protection (100.0%), Firefighting & Prevention (100.0%), and Law Enforcement (100.0%), while the most female-oriented occupations are Healthcare Support (100.0%), Personal Care & Service (100.0%), and Food Preparation & Serving (37.0%).
| Occupation | Male | Female |
| Healthcare Support | 0 (0.0%) | 100 (100.0%) |
| Security & Protection | 23 (100.0%) | 0 (0.0%) |
| Firefighting & Prevention | 15 (100.0%) | 0 (0.0%) |
| Law Enforcement | 8 (100.0%) | 0 (0.0%) |
| Food Preparation & Serving | 92 (63.0%) | 54 (37.0%) |
| Cleaning & Maintenance | 74 (76.3%) | 23 (23.7%) |
| Personal Care & Service | 0 (0.0%) | 13 (100.0%) |
| Total (Category) | 189 (49.9%) | 190 (50.1%) |
| Total (Overall) | 796 (43.0%) | 1,056 (57.0%) |
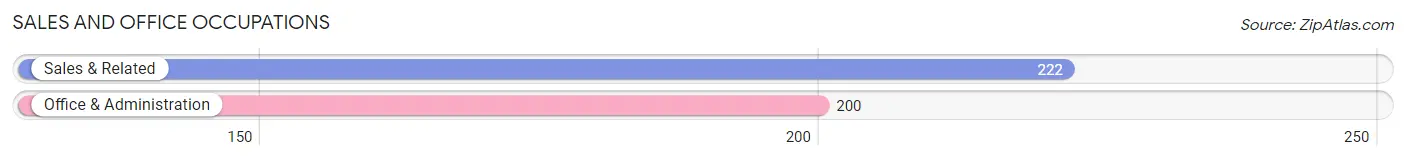
Sales and Office Occupations
The most common Sales and Office occupations in Beaufort are Sales & Related (222 | 12.0%), and Office & Administration (200 | 10.8%).
Sales and Office Occupations by Sex
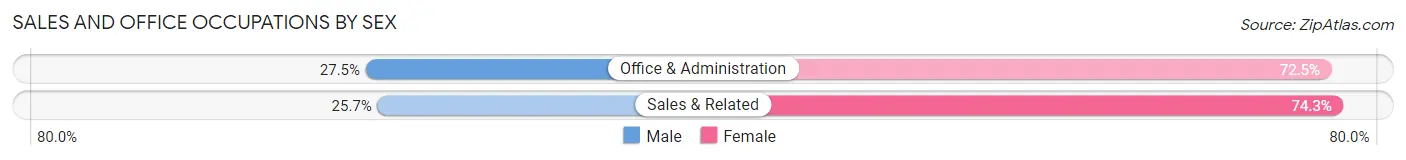
| Occupation | Male | Female |
| Sales & Related | 57 (25.7%) | 165 (74.3%) |
| Office & Administration | 55 (27.5%) | 145 (72.5%) |
| Total (Category) | 112 (26.5%) | 310 (73.5%) |
| Total (Overall) | 796 (43.0%) | 1,056 (57.0%) |
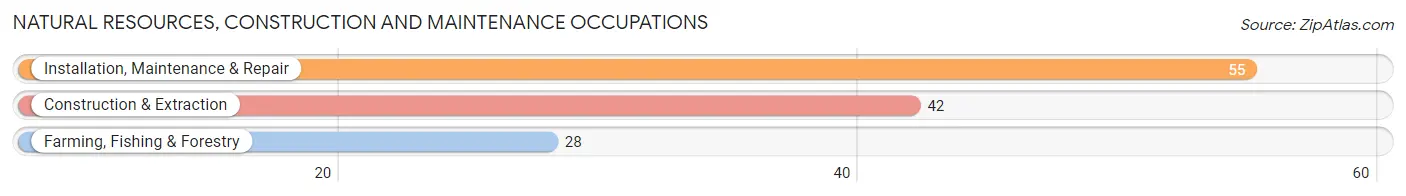
Natural Resources, Construction and Maintenance Occupations
The most common Natural Resources, Construction and Maintenance occupations in Beaufort are Installation, Maintenance & Repair (55 | 3.0%), Construction & Extraction (42 | 2.3%), and Farming, Fishing & Forestry (28 | 1.5%).
Natural Resources, Construction and Maintenance Occupations by Sex
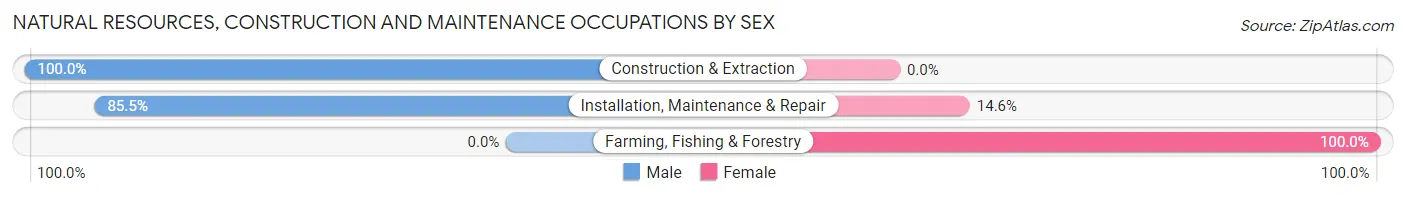
| Occupation | Male | Female |
| Farming, Fishing & Forestry | 0 (0.0%) | 28 (100.0%) |
| Construction & Extraction | 42 (100.0%) | 0 (0.0%) |
| Installation, Maintenance & Repair | 47 (85.5%) | 8 (14.5%) |
| Total (Category) | 89 (71.2%) | 36 (28.8%) |
| Total (Overall) | 796 (43.0%) | 1,056 (57.0%) |
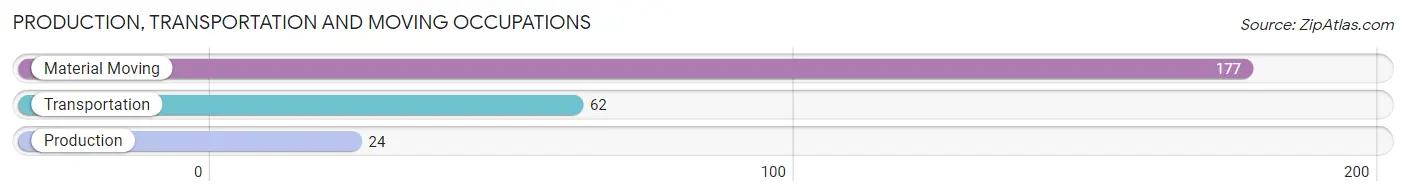
Production, Transportation and Moving Occupations
The most common Production, Transportation and Moving occupations in Beaufort are Material Moving (177 | 9.6%), Transportation (62 | 3.4%), and Production (24 | 1.3%).
Production, Transportation and Moving Occupations by Sex
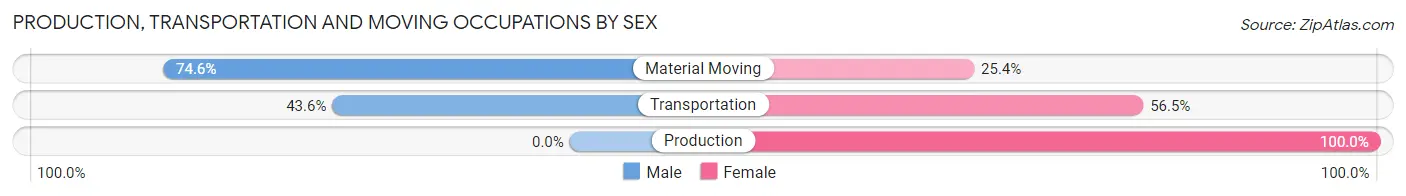
| Occupation | Male | Female |
| Production | 0 (0.0%) | 24 (100.0%) |
| Transportation | 27 (43.5%) | 35 (56.5%) |
| Material Moving | 132 (74.6%) | 45 (25.4%) |
| Total (Category) | 159 (60.5%) | 104 (39.5%) |
| Total (Overall) | 796 (43.0%) | 1,056 (57.0%) |
Employment Industries by Sex in Beaufort
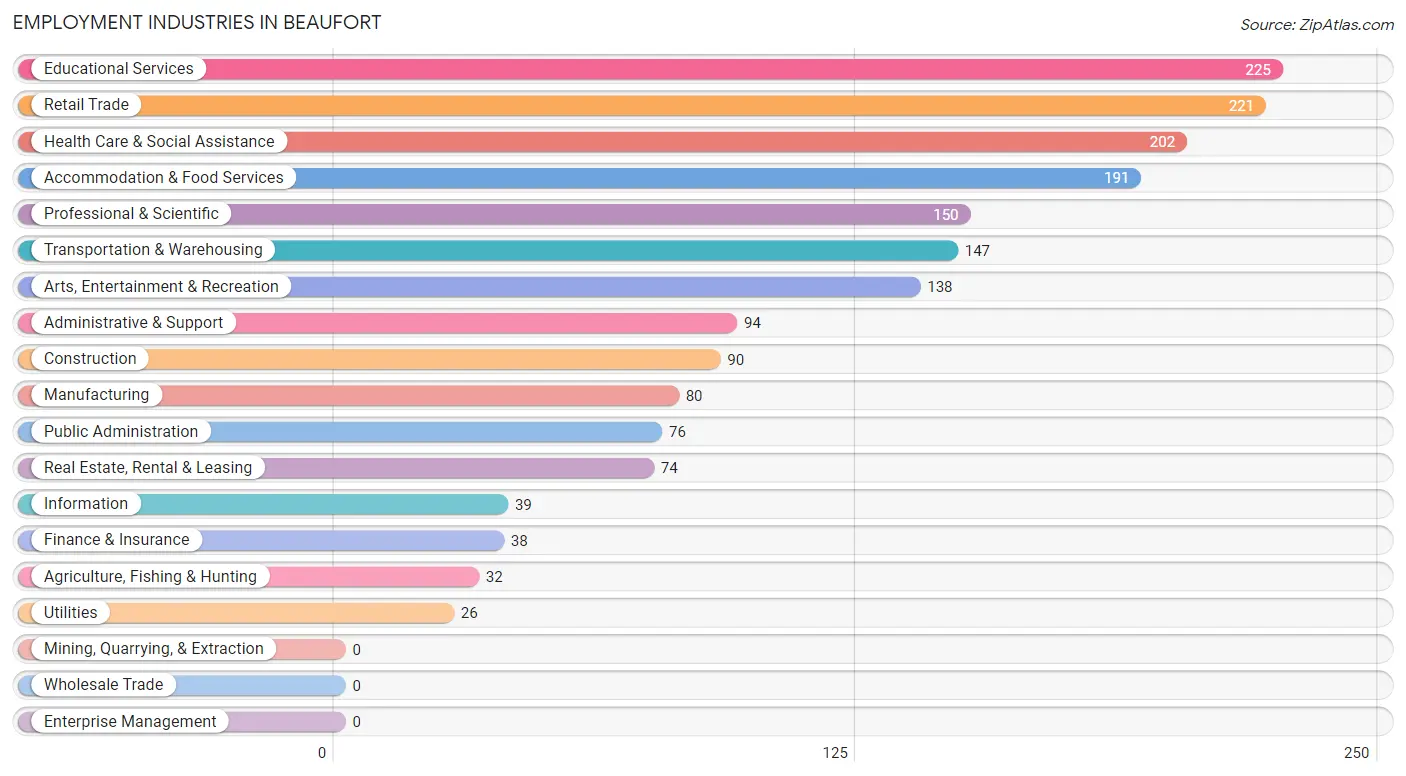
Employment Industries in Beaufort
The major employment industries in Beaufort include Educational Services (225 | 12.1%), Retail Trade (221 | 11.9%), Health Care & Social Assistance (202 | 10.9%), Accommodation & Food Services (191 | 10.3%), and Professional & Scientific (150 | 8.1%).
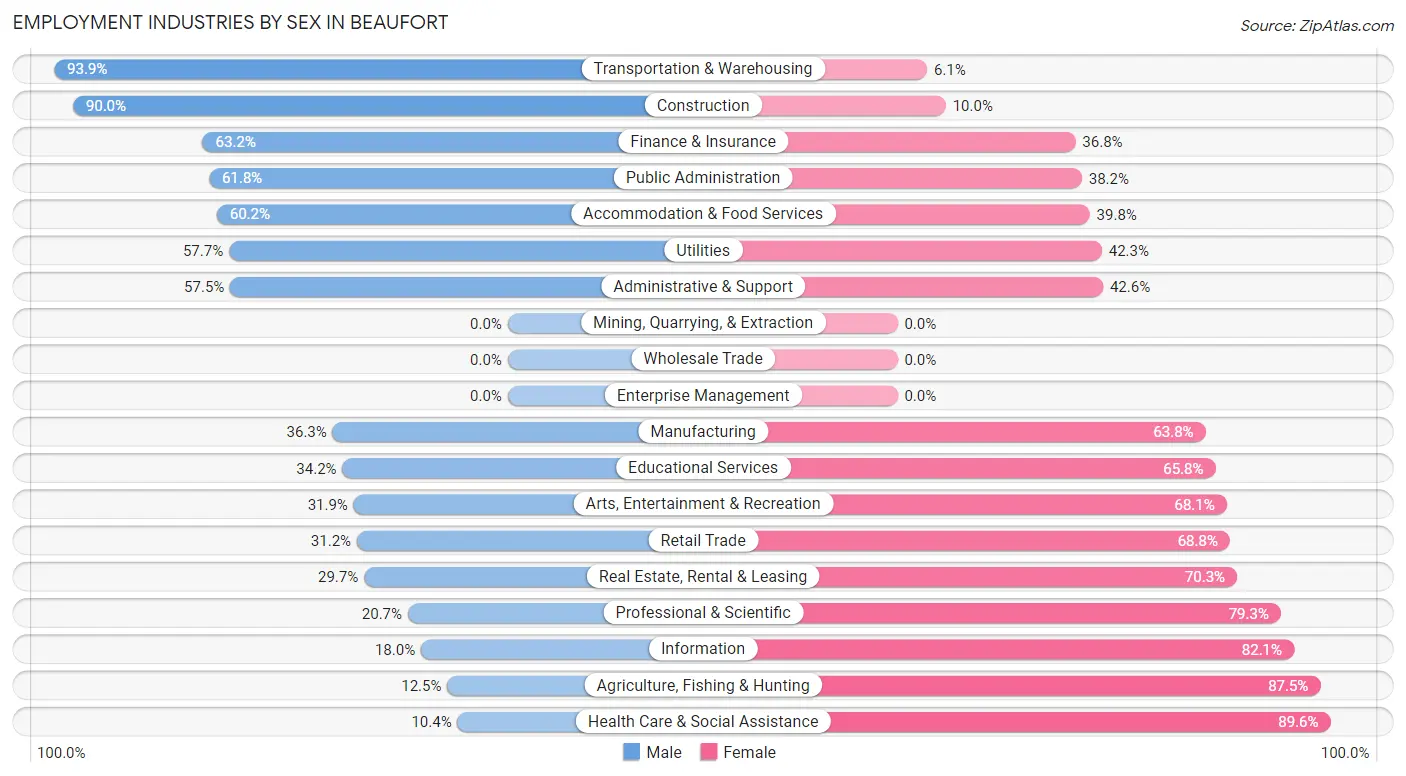
Employment Industries by Sex in Beaufort
The Beaufort industries that see more men than women are Transportation & Warehousing (93.9%), Construction (90.0%), and Finance & Insurance (63.2%), whereas the industries that tend to have a higher number of women are Health Care & Social Assistance (89.6%), Agriculture, Fishing & Hunting (87.5%), and Information (82.1%).
| Industry | Male | Female |
| Agriculture, Fishing & Hunting | 4 (12.5%) | 28 (87.5%) |
| Mining, Quarrying, & Extraction | 0 (0.0%) | 0 (0.0%) |
| Construction | 81 (90.0%) | 9 (10.0%) |
| Manufacturing | 29 (36.2%) | 51 (63.7%) |
| Wholesale Trade | 0 (0.0%) | 0 (0.0%) |
| Retail Trade | 69 (31.2%) | 152 (68.8%) |
| Transportation & Warehousing | 138 (93.9%) | 9 (6.1%) |
| Utilities | 15 (57.7%) | 11 (42.3%) |
| Information | 7 (17.9%) | 32 (82.1%) |
| Finance & Insurance | 24 (63.2%) | 14 (36.8%) |
| Real Estate, Rental & Leasing | 22 (29.7%) | 52 (70.3%) |
| Professional & Scientific | 31 (20.7%) | 119 (79.3%) |
| Enterprise Management | 0 (0.0%) | 0 (0.0%) |
| Administrative & Support | 54 (57.5%) | 40 (42.5%) |
| Educational Services | 77 (34.2%) | 148 (65.8%) |
| Health Care & Social Assistance | 21 (10.4%) | 181 (89.6%) |
| Arts, Entertainment & Recreation | 44 (31.9%) | 94 (68.1%) |
| Accommodation & Food Services | 115 (60.2%) | 76 (39.8%) |
| Public Administration | 47 (61.8%) | 29 (38.2%) |
| Total | 796 (43.0%) | 1,056 (57.0%) |
Education in Beaufort
School Enrollment in Beaufort
The most common levels of schooling among the 1,037 students in Beaufort are middle school (310 | 29.9%), college / undergraduate (273 | 26.3%), and high school (162 | 15.6%).
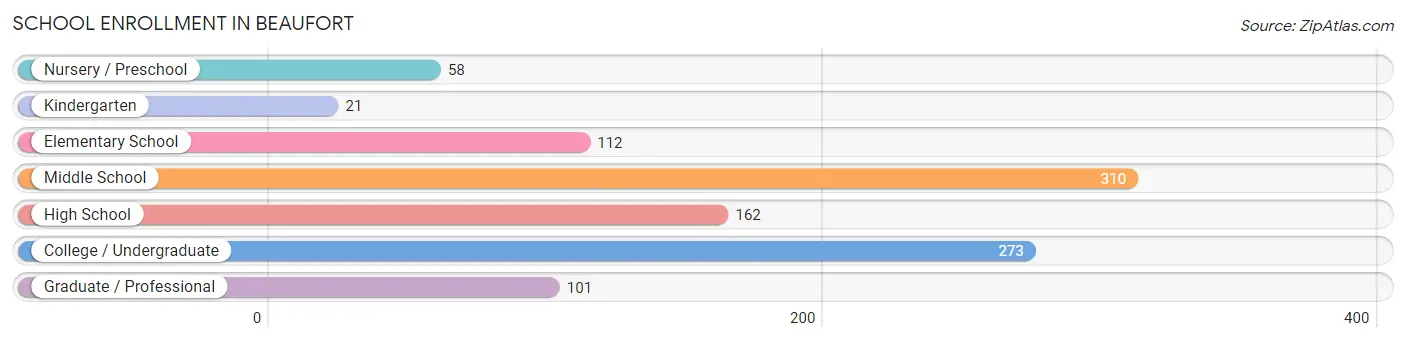
| School Level | # Students | % Students |
| Nursery / Preschool | 58 | 5.6% |
| Kindergarten | 21 | 2.0% |
| Elementary School | 112 | 10.8% |
| Middle School | 310 | 29.9% |
| High School | 162 | 15.6% |
| College / Undergraduate | 273 | 26.3% |
| Graduate / Professional | 101 | 9.7% |
| Total | 1,037 | 100.0% |
School Enrollment by Age by Funding Source in Beaufort
Out of a total of 1,037 students who are enrolled in schools in Beaufort, 211 (20.3%) attend a private institution, while the remaining 826 (79.7%) are enrolled in public schools. The age group of 3 to 4 year olds has the highest likelihood of being enrolled in private schools, with 38 (65.5% in the age bracket) enrolled. Conversely, the age group of 10 to 14 year olds has the lowest likelihood of being enrolled in a private school, with 332 (100.0% in the age bracket) attending a public institution.
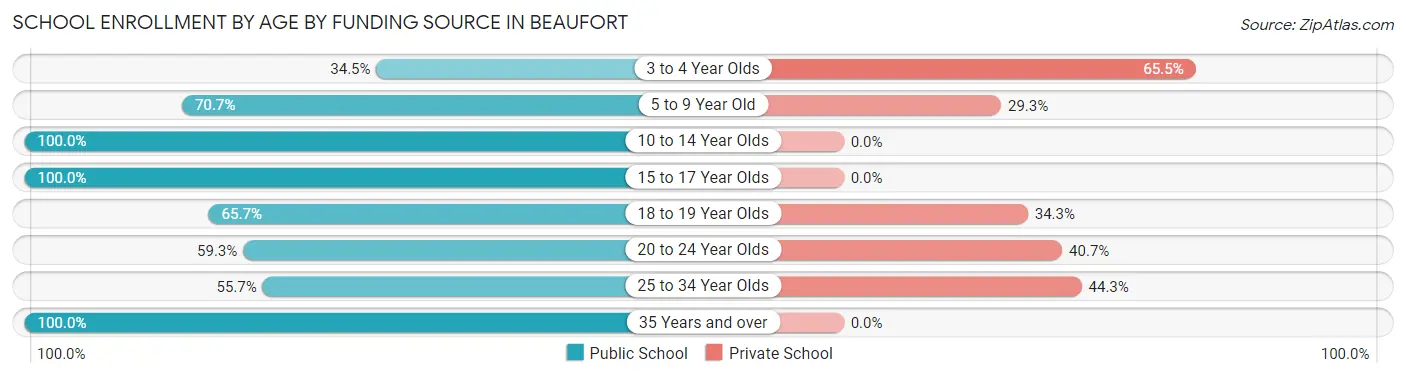
| Age Bracket | Public School | Private School |
| 3 to 4 Year Olds | 20 (34.5%) | 38 (65.5%) |
| 5 to 9 Year Old | 94 (70.7%) | 39 (29.3%) |
| 10 to 14 Year Olds | 332 (100.0%) | 0 (0.0%) |
| 15 to 17 Year Olds | 140 (100.0%) | 0 (0.0%) |
| 18 to 19 Year Olds | 46 (65.7%) | 24 (34.3%) |
| 20 to 24 Year Olds | 102 (59.3%) | 70 (40.7%) |
| 25 to 34 Year Olds | 49 (55.7%) | 39 (44.3%) |
| 35 Years and over | 44 (100.0%) | 0 (0.0%) |
| Total | 826 (79.7%) | 211 (20.3%) |
Educational Attainment by Field of Study in Beaufort
Education (179 | 15.7%), business (169 | 14.8%), bio, nature & agricultural (104 | 9.1%), social sciences (104 | 9.1%), and science & technology (82 | 7.2%) are the most common fields of study among 1,140 individuals in Beaufort who have obtained a bachelor's degree or higher.
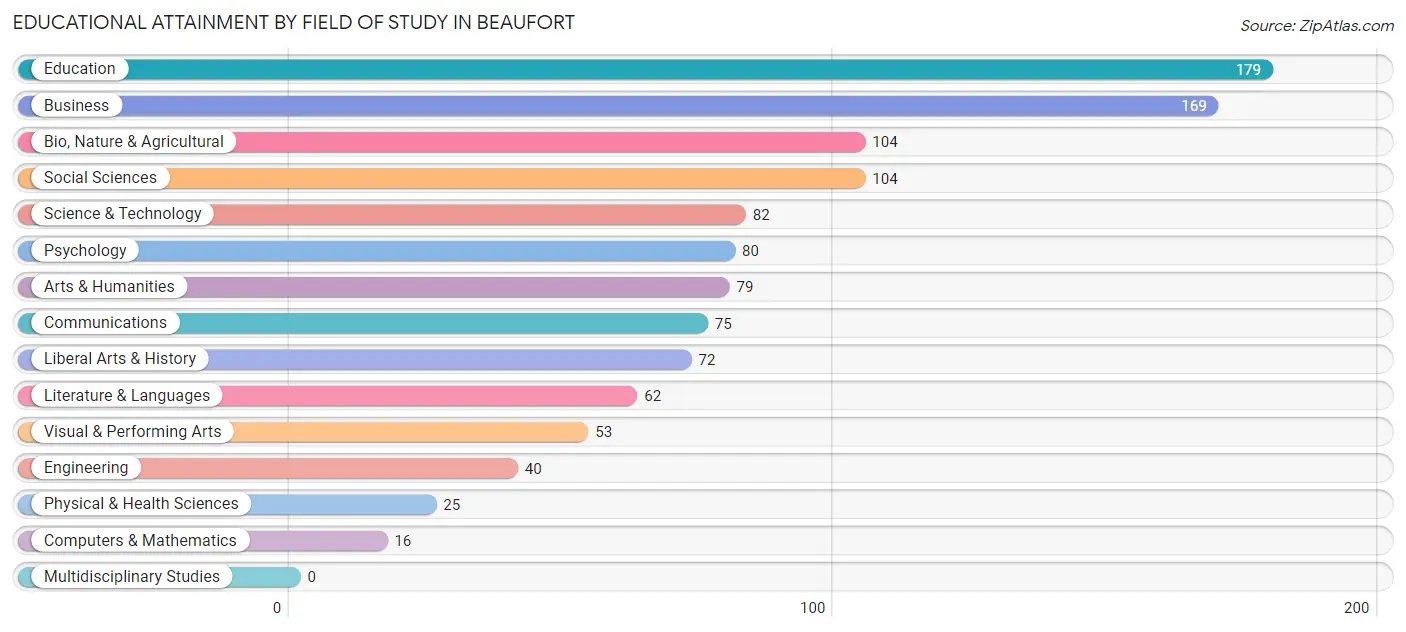
| Field of Study | # Graduates | % Graduates |
| Computers & Mathematics | 16 | 1.4% |
| Bio, Nature & Agricultural | 104 | 9.1% |
| Physical & Health Sciences | 25 | 2.2% |
| Psychology | 80 | 7.0% |
| Social Sciences | 104 | 9.1% |
| Engineering | 40 | 3.5% |
| Multidisciplinary Studies | 0 | 0.0% |
| Science & Technology | 82 | 7.2% |
| Business | 169 | 14.8% |
| Education | 179 | 15.7% |
| Literature & Languages | 62 | 5.4% |
| Liberal Arts & History | 72 | 6.3% |
| Visual & Performing Arts | 53 | 4.6% |
| Communications | 75 | 6.6% |
| Arts & Humanities | 79 | 6.9% |
| Total | 1,140 | 100.0% |
Transportation & Commute in Beaufort
Vehicle Availability by Sex in Beaufort
The most prevalent vehicle ownership categories in Beaufort are males with 2 vehicles (452, accounting for 59.2%) and females with 2 vehicles (414, making up 45.0%).
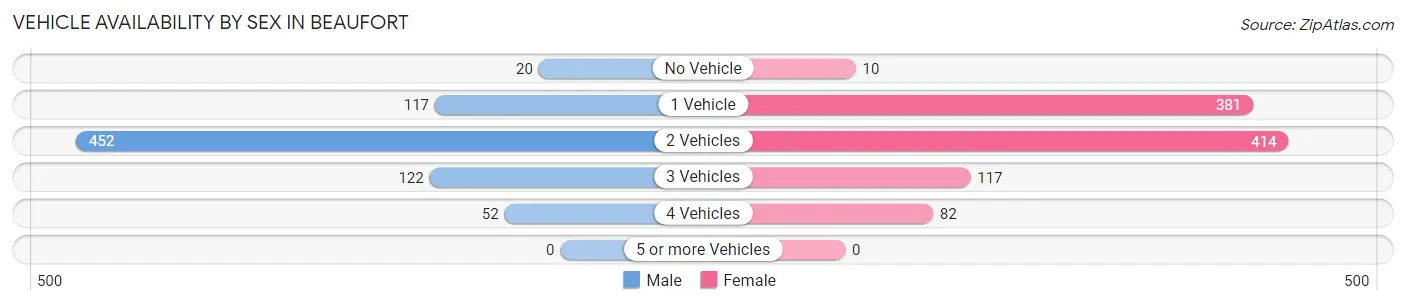
| Vehicles Available | Male | Female |
| No Vehicle | 20 (2.6%) | 10 (1.0%) |
| 1 Vehicle | 117 (15.3%) | 381 (38.0%) |
| 2 Vehicles | 452 (59.2%) | 414 (41.2%) |
| 3 Vehicles | 122 (16.0%) | 117 (11.7%) |
| 4 Vehicles | 52 (6.8%) | 82 (8.2%) |
| 5 or more Vehicles | 0 (0.0%) | 0 (0.0%) |
| Total | 763 (100.0%) | 1,004 (100.0%) |
Commute Time in Beaufort
The most frequently occuring commute durations in Beaufort are 5 to 9 minutes (396 commuters, 24.8%), 20 to 24 minutes (293 commuters, 18.3%), and 15 to 19 minutes (282 commuters, 17.7%).
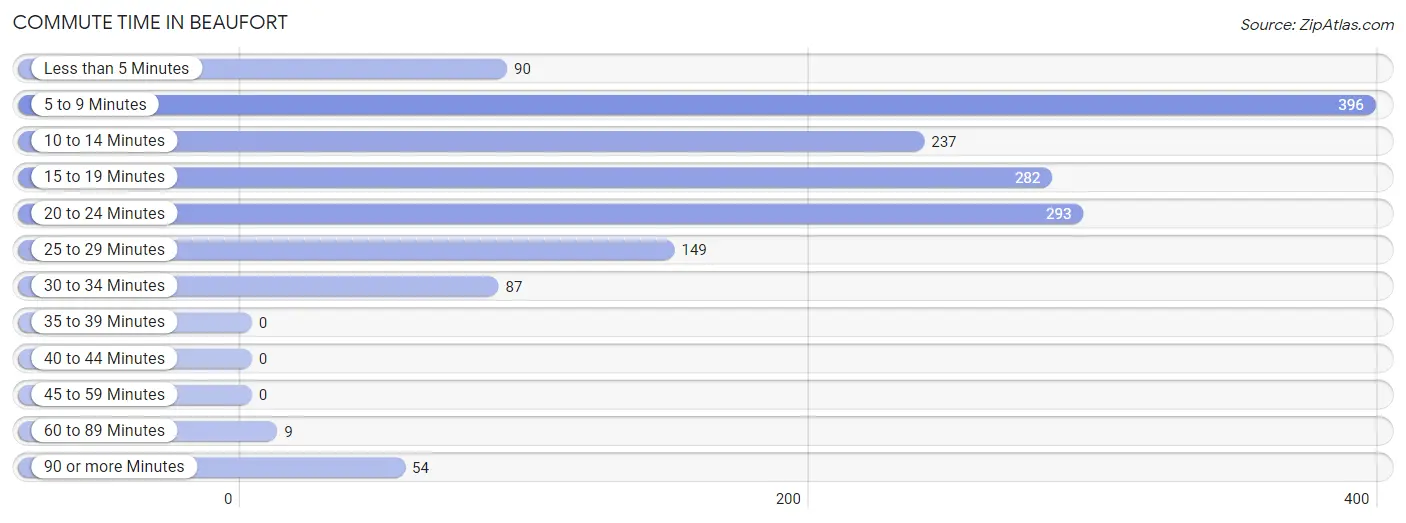
| Commute Time | # Commuters | % Commuters |
| Less than 5 Minutes | 90 | 5.6% |
| 5 to 9 Minutes | 396 | 24.8% |
| 10 to 14 Minutes | 237 | 14.8% |
| 15 to 19 Minutes | 282 | 17.7% |
| 20 to 24 Minutes | 293 | 18.3% |
| 25 to 29 Minutes | 149 | 9.3% |
| 30 to 34 Minutes | 87 | 5.4% |
| 35 to 39 Minutes | 0 | 0.0% |
| 40 to 44 Minutes | 0 | 0.0% |
| 45 to 59 Minutes | 0 | 0.0% |
| 60 to 89 Minutes | 9 | 0.6% |
| 90 or more Minutes | 54 | 3.4% |
Commute Time by Sex in Beaufort
The most common commute times in Beaufort are 5 to 9 minutes (206 commuters, 29.6%) for males and 15 to 19 minutes (219 commuters, 24.3%) for females.
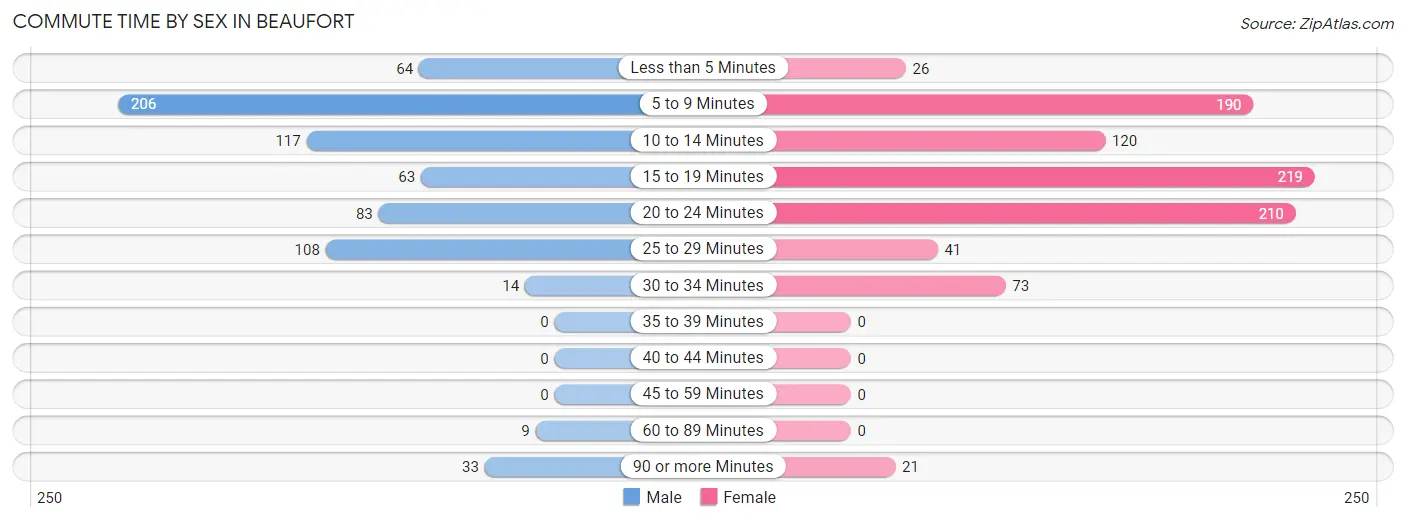
| Commute Time | Male | Female |
| Less than 5 Minutes | 64 (9.2%) | 26 (2.9%) |
| 5 to 9 Minutes | 206 (29.6%) | 190 (21.1%) |
| 10 to 14 Minutes | 117 (16.8%) | 120 (13.3%) |
| 15 to 19 Minutes | 63 (9.0%) | 219 (24.3%) |
| 20 to 24 Minutes | 83 (11.9%) | 210 (23.3%) |
| 25 to 29 Minutes | 108 (15.5%) | 41 (4.6%) |
| 30 to 34 Minutes | 14 (2.0%) | 73 (8.1%) |
| 35 to 39 Minutes | 0 (0.0%) | 0 (0.0%) |
| 40 to 44 Minutes | 0 (0.0%) | 0 (0.0%) |
| 45 to 59 Minutes | 0 (0.0%) | 0 (0.0%) |
| 60 to 89 Minutes | 9 (1.3%) | 0 (0.0%) |
| 90 or more Minutes | 33 (4.7%) | 21 (2.3%) |
Time of Departure to Work by Sex in Beaufort
The most frequent times of departure to work in Beaufort are 8:00 AM to 8:29 AM (111, 15.9%) for males and 9:00 AM to 9:59 AM (198, 22.0%) for females.
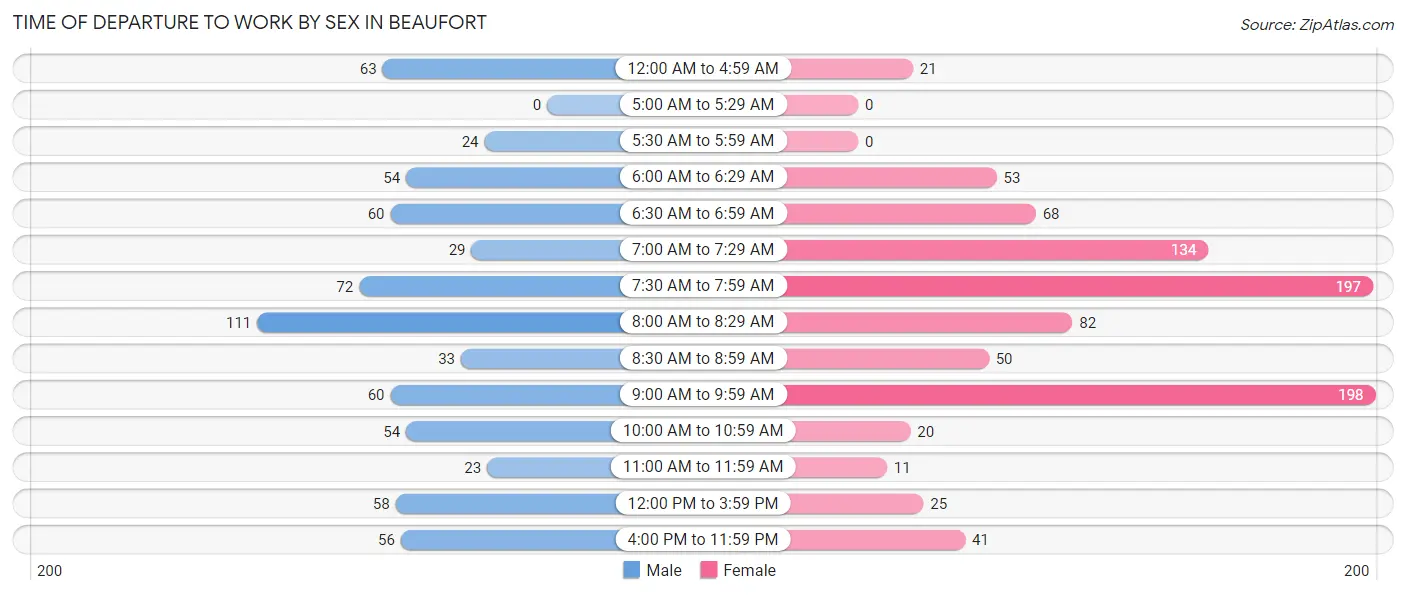
| Time of Departure | Male | Female |
| 12:00 AM to 4:59 AM | 63 (9.0%) | 21 (2.3%) |
| 5:00 AM to 5:29 AM | 0 (0.0%) | 0 (0.0%) |
| 5:30 AM to 5:59 AM | 24 (3.4%) | 0 (0.0%) |
| 6:00 AM to 6:29 AM | 54 (7.7%) | 53 (5.9%) |
| 6:30 AM to 6:59 AM | 60 (8.6%) | 68 (7.6%) |
| 7:00 AM to 7:29 AM | 29 (4.2%) | 134 (14.9%) |
| 7:30 AM to 7:59 AM | 72 (10.3%) | 197 (21.9%) |
| 8:00 AM to 8:29 AM | 111 (15.9%) | 82 (9.1%) |
| 8:30 AM to 8:59 AM | 33 (4.7%) | 50 (5.6%) |
| 9:00 AM to 9:59 AM | 60 (8.6%) | 198 (22.0%) |
| 10:00 AM to 10:59 AM | 54 (7.7%) | 20 (2.2%) |
| 11:00 AM to 11:59 AM | 23 (3.3%) | 11 (1.2%) |
| 12:00 PM to 3:59 PM | 58 (8.3%) | 25 (2.8%) |
| 4:00 PM to 11:59 PM | 56 (8.0%) | 41 (4.6%) |
| Total | 697 (100.0%) | 900 (100.0%) |
Housing Occupancy in Beaufort
Occupancy by Ownership in Beaufort
Of the total 2,321 dwellings in Beaufort, owner-occupied units account for 1,093 (47.1%), while renter-occupied units make up 1,228 (52.9%).
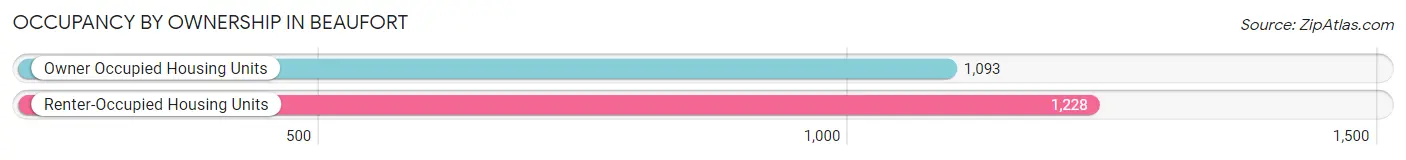
| Occupancy | # Housing Units | % Housing Units |
| Owner Occupied Housing Units | 1,093 | 47.1% |
| Renter-Occupied Housing Units | 1,228 | 52.9% |
| Total Occupied Housing Units | 2,321 | 100.0% |
Occupancy by Household Size in Beaufort
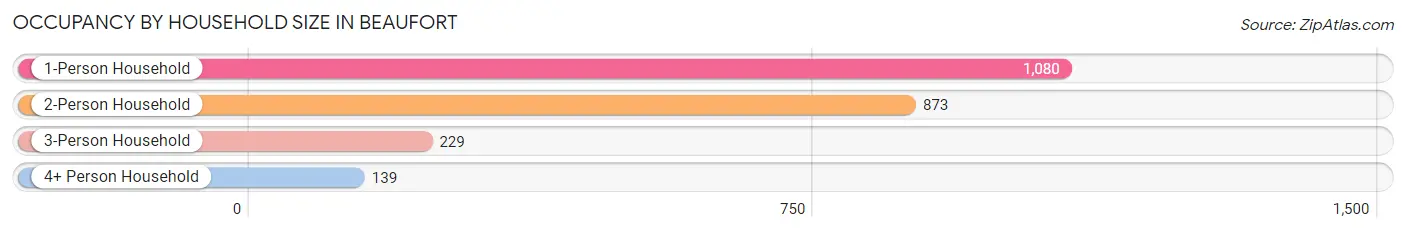
| Household Size | # Housing Units | % Housing Units |
| 1-Person Household | 1,080 | 46.5% |
| 2-Person Household | 873 | 37.6% |
| 3-Person Household | 229 | 9.9% |
| 4+ Person Household | 139 | 6.0% |
| Total Housing Units | 2,321 | 100.0% |
Occupancy by Ownership by Household Size in Beaufort
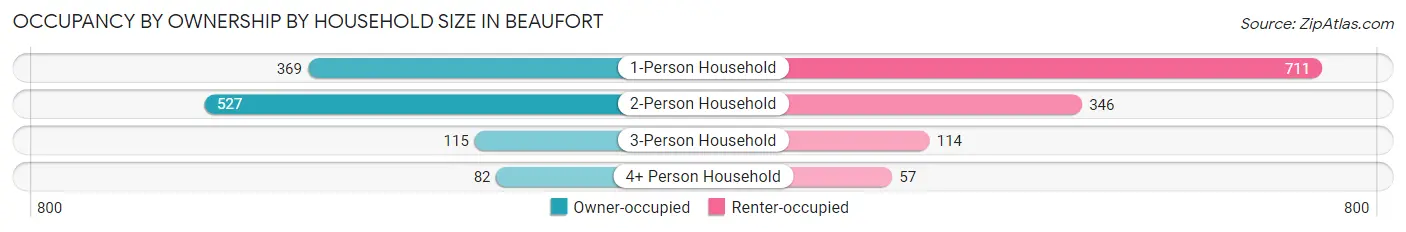
| Household Size | Owner-occupied | Renter-occupied |
| 1-Person Household | 369 (34.2%) | 711 (65.8%) |
| 2-Person Household | 527 (60.4%) | 346 (39.6%) |
| 3-Person Household | 115 (50.2%) | 114 (49.8%) |
| 4+ Person Household | 82 (59.0%) | 57 (41.0%) |
| Total Housing Units | 1,093 (47.1%) | 1,228 (52.9%) |
Occupancy by Educational Attainment in Beaufort
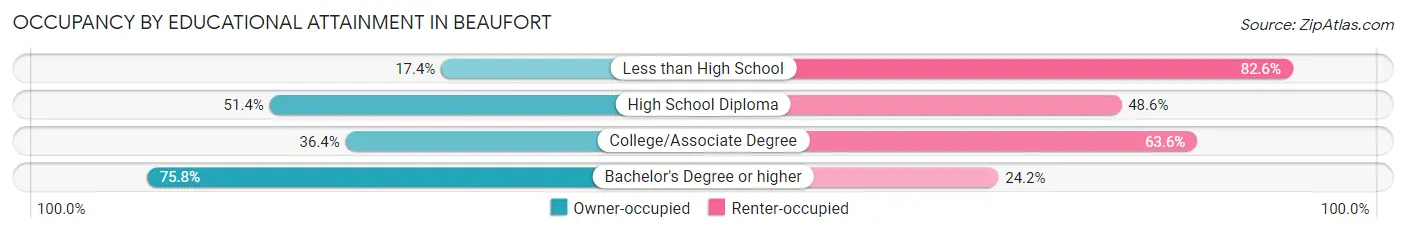
| Household Size | Owner-occupied | Renter-occupied |
| Less than High School | 59 (17.4%) | 280 (82.6%) |
| High School Diploma | 164 (51.4%) | 155 (48.6%) |
| College/Associate Degree | 360 (36.4%) | 630 (63.6%) |
| Bachelor's Degree or higher | 510 (75.8%) | 163 (24.2%) |
Occupancy by Age of Householder in Beaufort
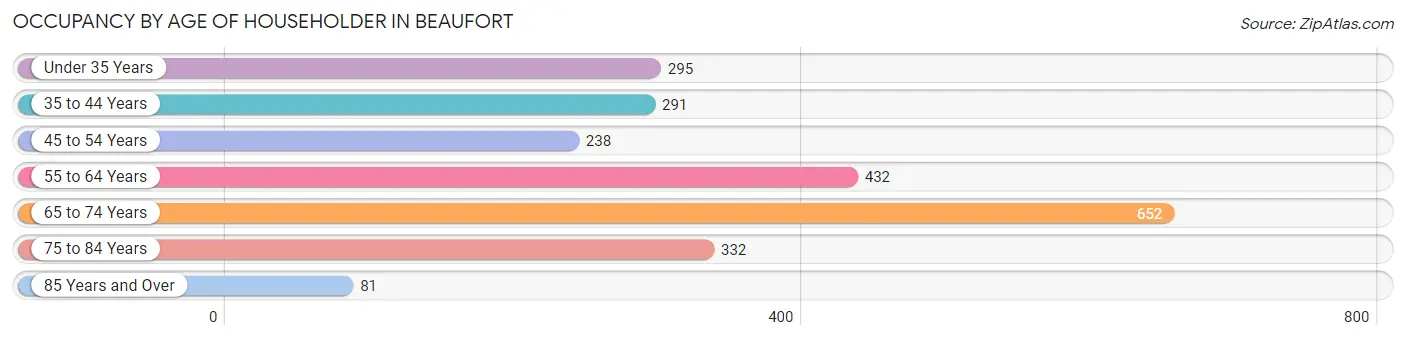
| Age Bracket | # Households | % Households |
| Under 35 Years | 295 | 12.7% |
| 35 to 44 Years | 291 | 12.5% |
| 45 to 54 Years | 238 | 10.2% |
| 55 to 64 Years | 432 | 18.6% |
| 65 to 74 Years | 652 | 28.1% |
| 75 to 84 Years | 332 | 14.3% |
| 85 Years and Over | 81 | 3.5% |
| Total | 2,321 | 100.0% |
Housing Finances in Beaufort
Median Income by Occupancy in Beaufort
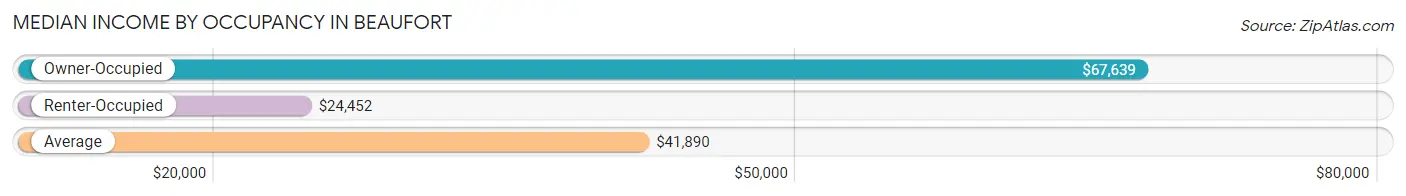
| Occupancy Type | # Households | Median Income |
| Owner-Occupied | 1,093 (47.1%) | $67,639 |
| Renter-Occupied | 1,228 (52.9%) | $24,452 |
| Average | 2,321 (100.0%) | $41,890 |
Occupancy by Householder Income Bracket in Beaufort
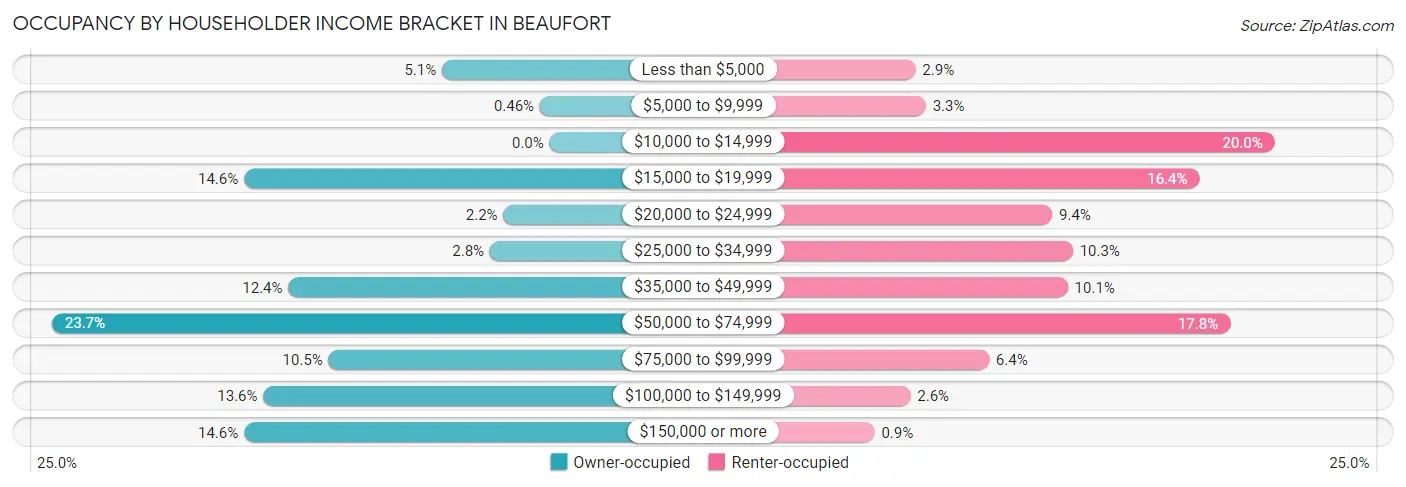
| Income Bracket | Owner-occupied | Renter-occupied |
| Less than $5,000 | 56 (5.1%) | 35 (2.9%) |
| $5,000 to $9,999 | 5 (0.5%) | 41 (3.3%) |
| $10,000 to $14,999 | 0 (0.0%) | 245 (20.0%) |
| $15,000 to $19,999 | 159 (14.5%) | 201 (16.4%) |
| $20,000 to $24,999 | 24 (2.2%) | 115 (9.4%) |
| $25,000 to $34,999 | 31 (2.8%) | 127 (10.3%) |
| $35,000 to $49,999 | 136 (12.4%) | 124 (10.1%) |
| $50,000 to $74,999 | 259 (23.7%) | 219 (17.8%) |
| $75,000 to $99,999 | 115 (10.5%) | 78 (6.4%) |
| $100,000 to $149,999 | 149 (13.6%) | 32 (2.6%) |
| $150,000 or more | 159 (14.5%) | 11 (0.9%) |
| Total | 1,093 (100.0%) | 1,228 (100.0%) |
Monthly Housing Cost Tiers in Beaufort
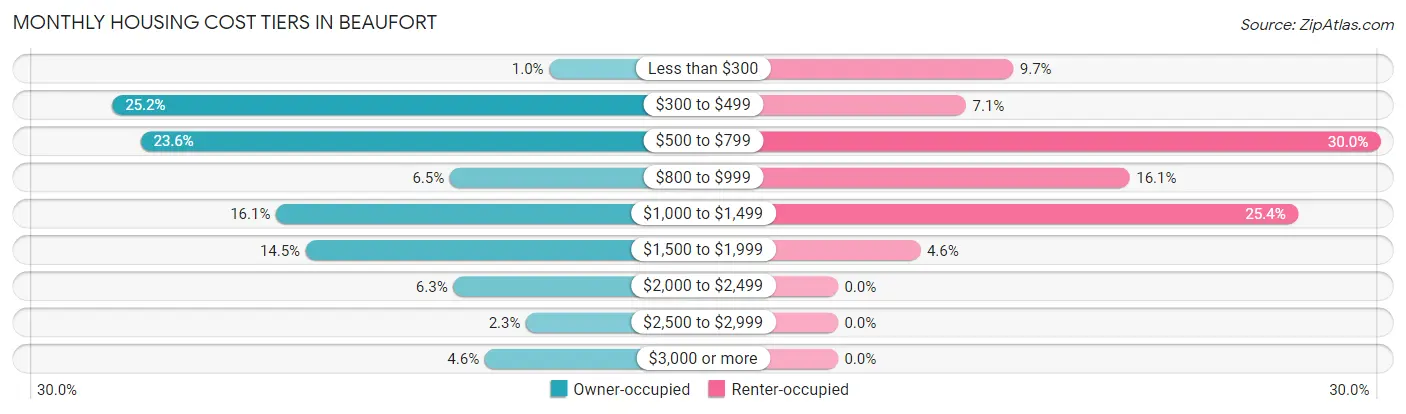
| Monthly Cost | Owner-occupied | Renter-occupied |
| Less than $300 | 11 (1.0%) | 119 (9.7%) |
| $300 to $499 | 275 (25.2%) | 87 (7.1%) |
| $500 to $799 | 258 (23.6%) | 368 (30.0%) |
| $800 to $999 | 71 (6.5%) | 198 (16.1%) |
| $1,000 to $1,499 | 176 (16.1%) | 312 (25.4%) |
| $1,500 to $1,999 | 158 (14.5%) | 56 (4.6%) |
| $2,000 to $2,499 | 69 (6.3%) | 0 (0.0%) |
| $2,500 to $2,999 | 25 (2.3%) | 0 (0.0%) |
| $3,000 or more | 50 (4.6%) | 0 (0.0%) |
| Total | 1,093 (100.0%) | 1,228 (100.0%) |
Physical Housing Characteristics in Beaufort
Housing Structures in Beaufort
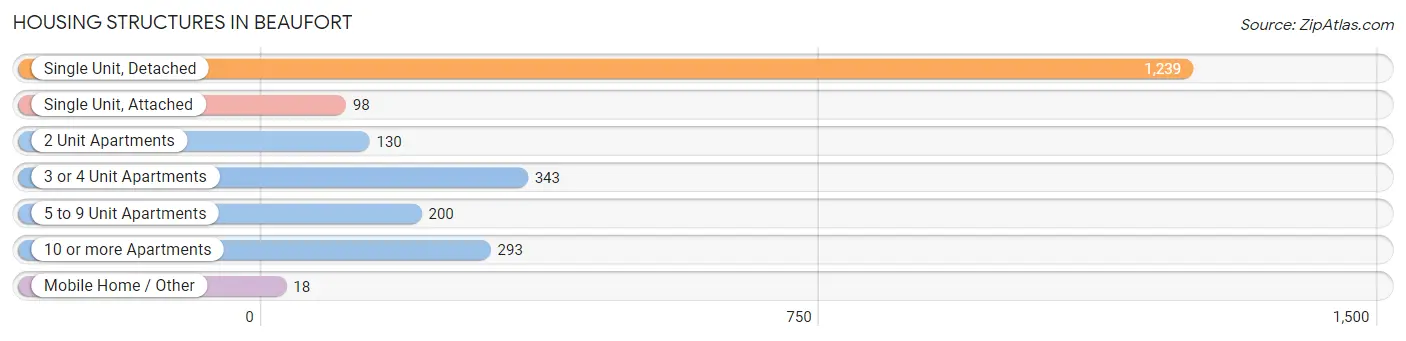
| Structure Type | # Housing Units | % Housing Units |
| Single Unit, Detached | 1,239 | 53.4% |
| Single Unit, Attached | 98 | 4.2% |
| 2 Unit Apartments | 130 | 5.6% |
| 3 or 4 Unit Apartments | 343 | 14.8% |
| 5 to 9 Unit Apartments | 200 | 8.6% |
| 10 or more Apartments | 293 | 12.6% |
| Mobile Home / Other | 18 | 0.8% |
| Total | 2,321 | 100.0% |
Housing Structures by Occupancy in Beaufort
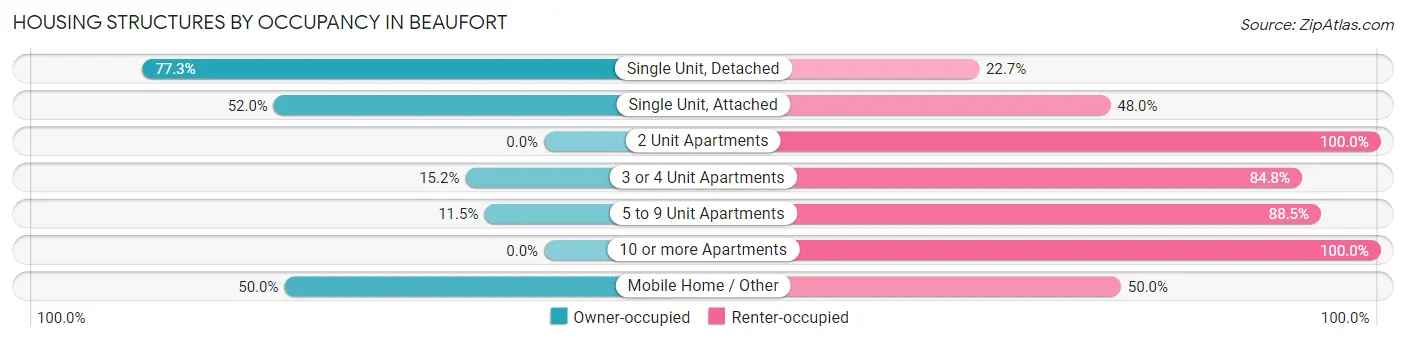
| Structure Type | Owner-occupied | Renter-occupied |
| Single Unit, Detached | 958 (77.3%) | 281 (22.7%) |
| Single Unit, Attached | 51 (52.0%) | 47 (48.0%) |
| 2 Unit Apartments | 0 (0.0%) | 130 (100.0%) |
| 3 or 4 Unit Apartments | 52 (15.2%) | 291 (84.8%) |
| 5 to 9 Unit Apartments | 23 (11.5%) | 177 (88.5%) |
| 10 or more Apartments | 0 (0.0%) | 293 (100.0%) |
| Mobile Home / Other | 9 (50.0%) | 9 (50.0%) |
| Total | 1,093 (47.1%) | 1,228 (52.9%) |
Housing Structures by Number of Rooms in Beaufort
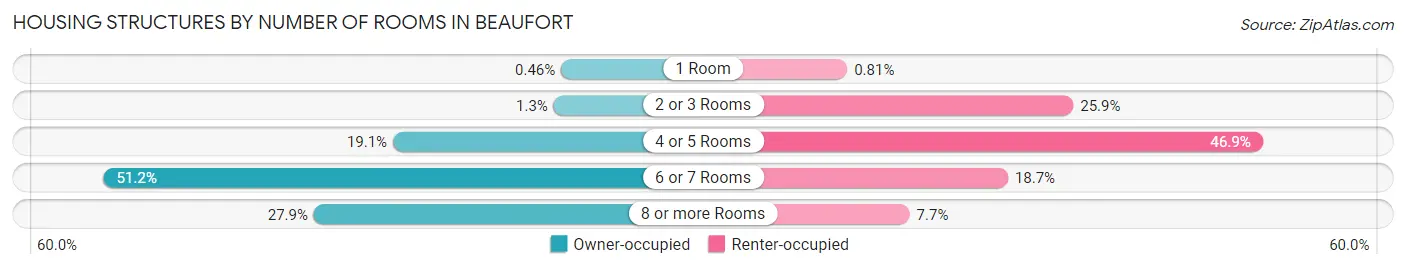
| Number of Rooms | Owner-occupied | Renter-occupied |
| 1 Room | 5 (0.5%) | 10 (0.8%) |
| 2 or 3 Rooms | 14 (1.3%) | 318 (25.9%) |
| 4 or 5 Rooms | 209 (19.1%) | 576 (46.9%) |
| 6 or 7 Rooms | 560 (51.2%) | 229 (18.6%) |
| 8 or more Rooms | 305 (27.9%) | 95 (7.7%) |
| Total | 1,093 (100.0%) | 1,228 (100.0%) |
Housing Structure by Heating Type in Beaufort
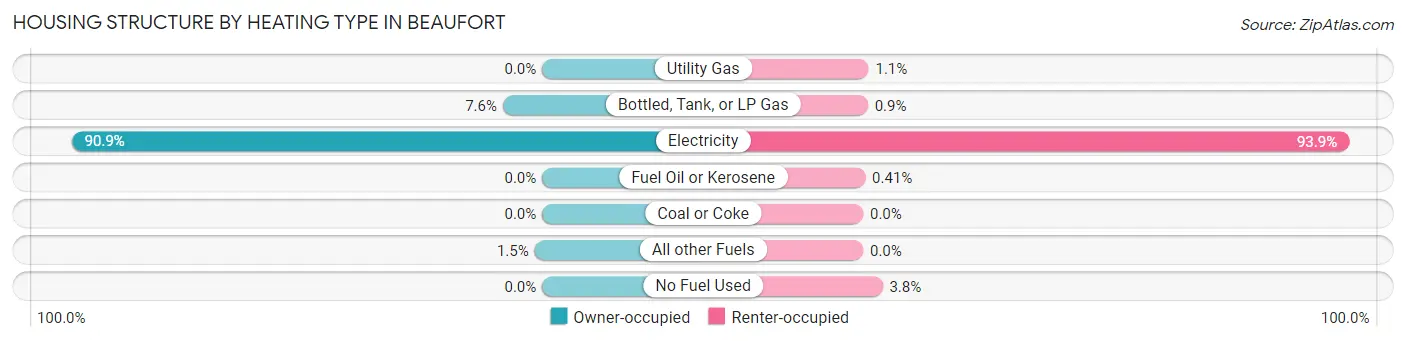
| Heating Type | Owner-occupied | Renter-occupied |
| Utility Gas | 0 (0.0%) | 13 (1.1%) |
| Bottled, Tank, or LP Gas | 83 (7.6%) | 11 (0.9%) |
| Electricity | 994 (90.9%) | 1,153 (93.9%) |
| Fuel Oil or Kerosene | 0 (0.0%) | 5 (0.4%) |
| Coal or Coke | 0 (0.0%) | 0 (0.0%) |
| All other Fuels | 16 (1.5%) | 0 (0.0%) |
| No Fuel Used | 0 (0.0%) | 46 (3.7%) |
| Total | 1,093 (100.0%) | 1,228 (100.0%) |
Household Vehicle Usage in Beaufort
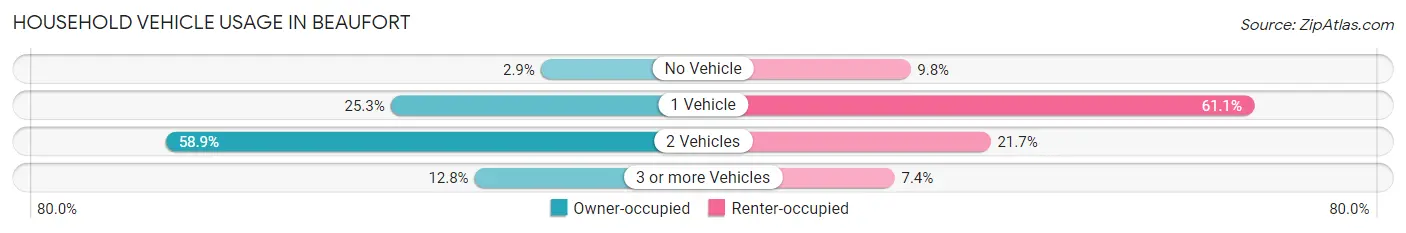
| Vehicles per Household | Owner-occupied | Renter-occupied |
| No Vehicle | 32 (2.9%) | 120 (9.8%) |
| 1 Vehicle | 277 (25.3%) | 750 (61.1%) |
| 2 Vehicles | 644 (58.9%) | 267 (21.7%) |
| 3 or more Vehicles | 140 (12.8%) | 91 (7.4%) |
| Total | 1,093 (100.0%) | 1,228 (100.0%) |
Real Estate & Mortgages in Beaufort
Real Estate and Mortgage Overview in Beaufort
| Characteristic | Without Mortgage | With Mortgage |
| Housing Units | 620 | 473 |
| Median Property Value | $280,900 | $274,400 |
| Median Household Income | $48,684 | $116 |
| Monthly Housing Costs | $529 | $50 |
| Real Estate Taxes | $1,698 | $0 |
Property Value by Mortgage Status in Beaufort
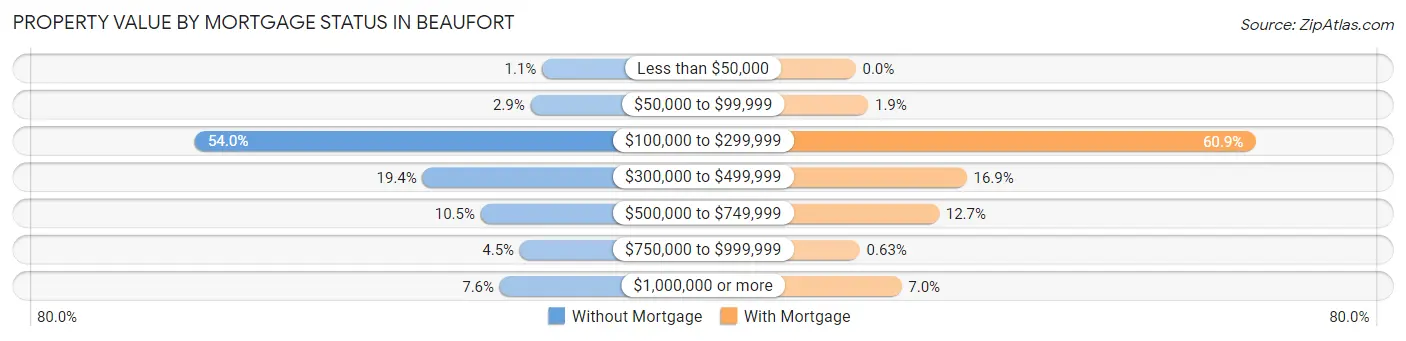
| Property Value | Without Mortgage | With Mortgage |
| Less than $50,000 | 7 (1.1%) | 0 (0.0%) |
| $50,000 to $99,999 | 18 (2.9%) | 9 (1.9%) |
| $100,000 to $299,999 | 335 (54.0%) | 288 (60.9%) |
| $300,000 to $499,999 | 120 (19.4%) | 80 (16.9%) |
| $500,000 to $749,999 | 65 (10.5%) | 60 (12.7%) |
| $750,000 to $999,999 | 28 (4.5%) | 3 (0.6%) |
| $1,000,000 or more | 47 (7.6%) | 33 (7.0%) |
| Total | 620 (100.0%) | 473 (100.0%) |
Household Income by Mortgage Status in Beaufort
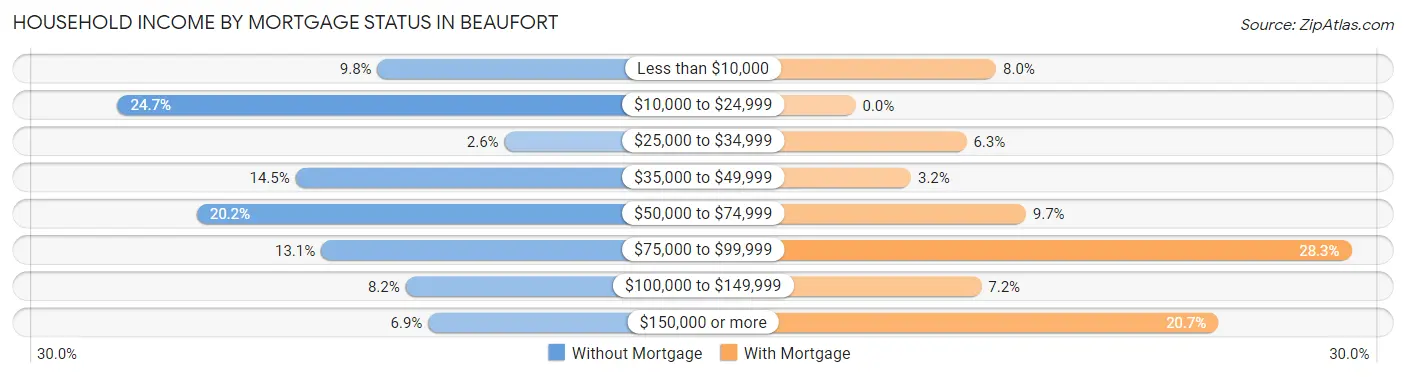
| Household Income | Without Mortgage | With Mortgage |
| Less than $10,000 | 61 (9.8%) | 38 (8.0%) |
| $10,000 to $24,999 | 153 (24.7%) | 0 (0.0%) |
| $25,000 to $34,999 | 16 (2.6%) | 30 (6.3%) |
| $35,000 to $49,999 | 90 (14.5%) | 15 (3.2%) |
| $50,000 to $74,999 | 125 (20.2%) | 46 (9.7%) |
| $75,000 to $99,999 | 81 (13.1%) | 134 (28.3%) |
| $100,000 to $149,999 | 51 (8.2%) | 34 (7.2%) |
| $150,000 or more | 43 (6.9%) | 98 (20.7%) |
| Total | 620 (100.0%) | 473 (100.0%) |
Property Value to Household Income Ratio in Beaufort
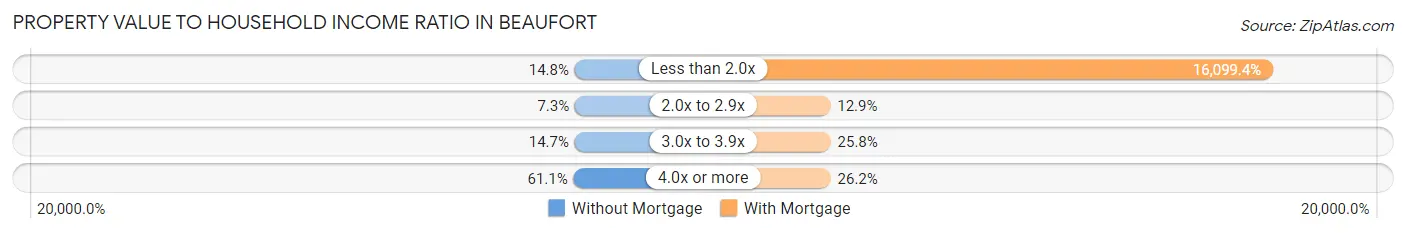
| Value-to-Income Ratio | Without Mortgage | With Mortgage |
| Less than 2.0x | 92 (14.8%) | 76,150 (16,099.4%) |
| 2.0x to 2.9x | 45 (7.3%) | 61 (12.9%) |
| 3.0x to 3.9x | 91 (14.7%) | 122 (25.8%) |
| 4.0x or more | 379 (61.1%) | 124 (26.2%) |
| Total | 620 (100.0%) | 473 (100.0%) |
Real Estate Taxes by Mortgage Status in Beaufort
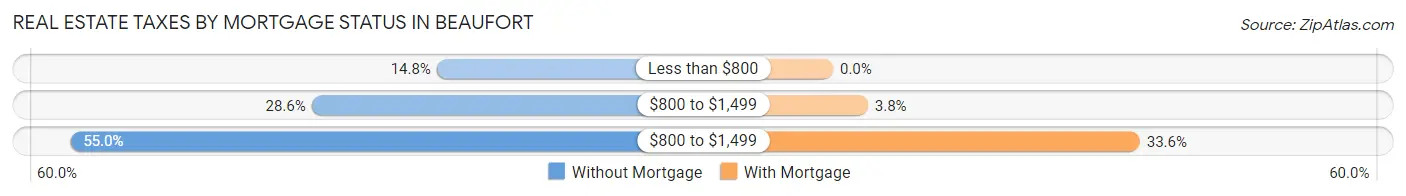
| Property Taxes | Without Mortgage | With Mortgage |
| Less than $800 | 92 (14.8%) | 0 (0.0%) |
| $800 to $1,499 | 177 (28.5%) | 18 (3.8%) |
| $800 to $1,499 | 341 (55.0%) | 159 (33.6%) |
| Total | 620 (100.0%) | 473 (100.0%) |
Health & Disability in Beaufort
Health Insurance Coverage by Age in Beaufort
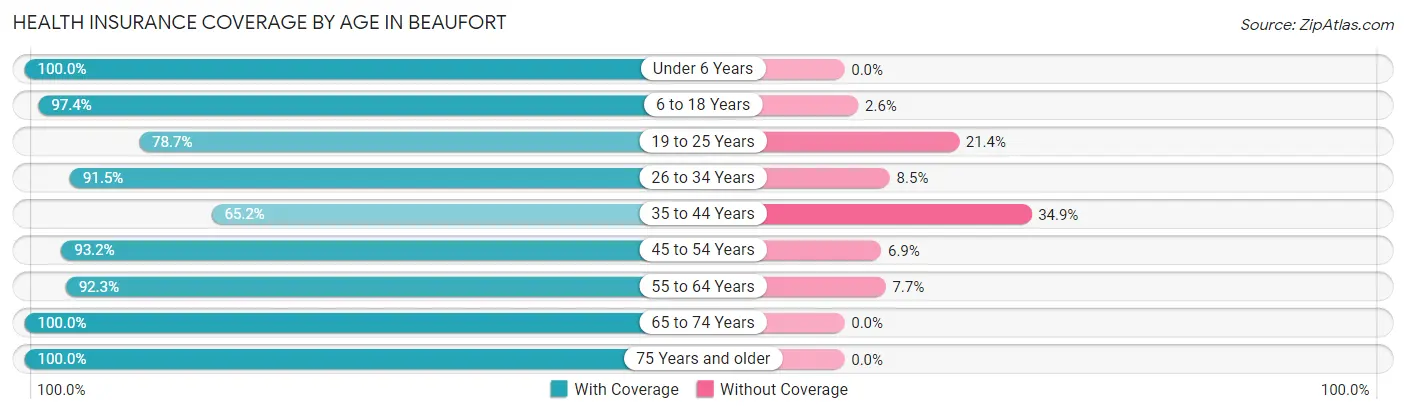
| Age Bracket | With Coverage | Without Coverage |
| Under 6 Years | 143 (100.0%) | 0 (0.0%) |
| 6 to 18 Years | 604 (97.4%) | 16 (2.6%) |
| 19 to 25 Years | 350 (78.6%) | 95 (21.3%) |
| 26 to 34 Years | 292 (91.5%) | 27 (8.5%) |
| 35 to 44 Years | 286 (65.1%) | 153 (34.8%) |
| 45 to 54 Years | 340 (93.1%) | 25 (6.9%) |
| 55 to 64 Years | 577 (92.3%) | 48 (7.7%) |
| 65 to 74 Years | 933 (100.0%) | 0 (0.0%) |
| 75 Years and older | 541 (100.0%) | 0 (0.0%) |
| Total | 4,066 (91.8%) | 364 (8.2%) |
Health Insurance Coverage by Citizenship Status in Beaufort
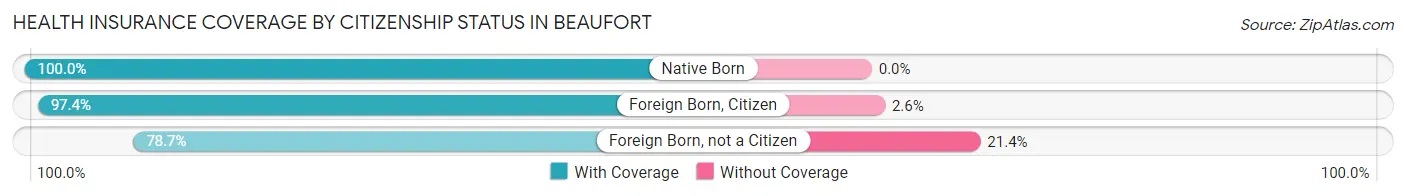
| Citizenship Status | With Coverage | Without Coverage |
| Native Born | 143 (100.0%) | 0 (0.0%) |
| Foreign Born, Citizen | 604 (97.4%) | 16 (2.6%) |
| Foreign Born, not a Citizen | 350 (78.6%) | 95 (21.3%) |
Health Insurance Coverage by Household Income in Beaufort
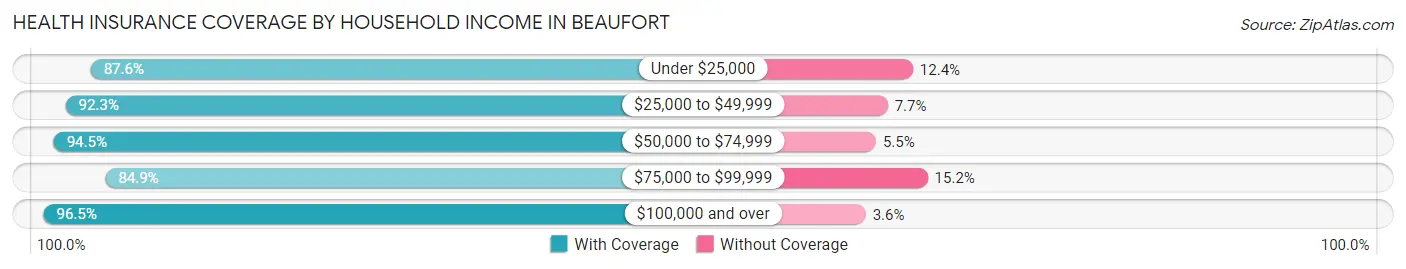
| Household Income | With Coverage | Without Coverage |
| Under $25,000 | 962 (87.6%) | 136 (12.4%) |
| $25,000 to $49,999 | 819 (92.3%) | 68 (7.7%) |
| $50,000 to $74,999 | 898 (94.5%) | 52 (5.5%) |
| $75,000 to $99,999 | 437 (84.9%) | 78 (15.1%) |
| $100,000 and over | 814 (96.5%) | 30 (3.5%) |
Public vs Private Health Insurance Coverage by Age in Beaufort
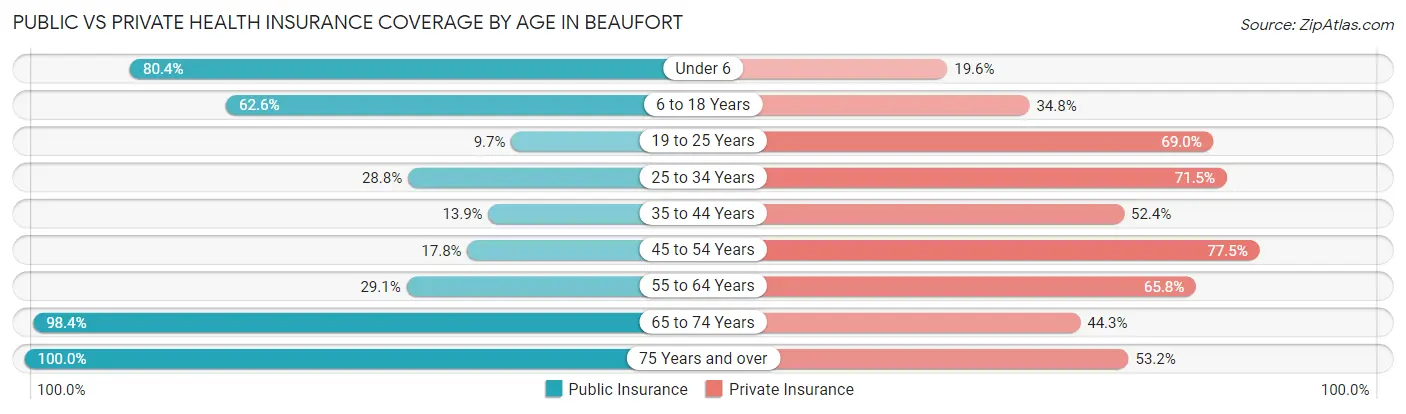
| Age Bracket | Public Insurance | Private Insurance |
| Under 6 | 115 (80.4%) | 28 (19.6%) |
| 6 to 18 Years | 388 (62.6%) | 216 (34.8%) |
| 19 to 25 Years | 43 (9.7%) | 307 (69.0%) |
| 25 to 34 Years | 92 (28.8%) | 228 (71.5%) |
| 35 to 44 Years | 61 (13.9%) | 230 (52.4%) |
| 45 to 54 Years | 65 (17.8%) | 283 (77.5%) |
| 55 to 64 Years | 182 (29.1%) | 411 (65.8%) |
| 65 to 74 Years | 918 (98.4%) | 413 (44.3%) |
| 75 Years and over | 541 (100.0%) | 288 (53.2%) |
| Total | 2,405 (54.3%) | 2,404 (54.3%) |
Disability Status by Sex by Age in Beaufort
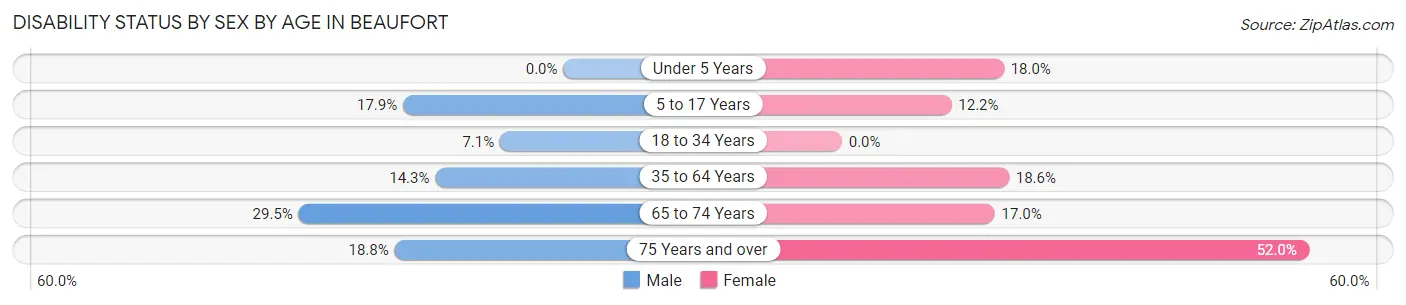
| Age Bracket | Male | Female |
| Under 5 Years | 0 (0.0%) | 11 (18.0%) |
| 5 to 17 Years | 58 (17.8%) | 35 (12.2%) |
| 18 to 34 Years | 28 (7.0%) | 0 (0.0%) |
| 35 to 64 Years | 75 (14.3%) | 168 (18.6%) |
| 65 to 74 Years | 107 (29.5%) | 97 (17.0%) |
| 75 Years and over | 50 (18.8%) | 143 (52.0%) |
Disability Class by Sex by Age in Beaufort
Disability Class: Hearing Difficulty
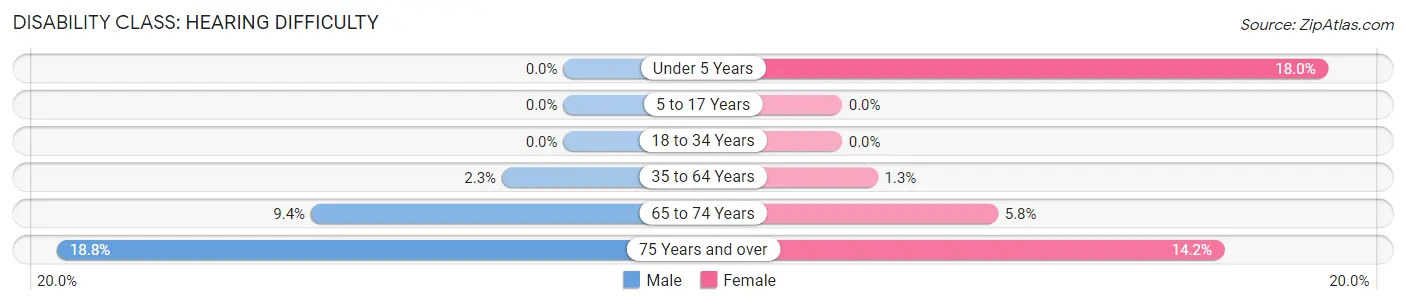
| Age Bracket | Male | Female |
| Under 5 Years | 0 (0.0%) | 11 (18.0%) |
| 5 to 17 Years | 0 (0.0%) | 0 (0.0%) |
| 18 to 34 Years | 0 (0.0%) | 0 (0.0%) |
| 35 to 64 Years | 12 (2.3%) | 12 (1.3%) |
| 65 to 74 Years | 34 (9.4%) | 33 (5.8%) |
| 75 Years and over | 50 (18.8%) | 39 (14.2%) |
Disability Class: Vision Difficulty
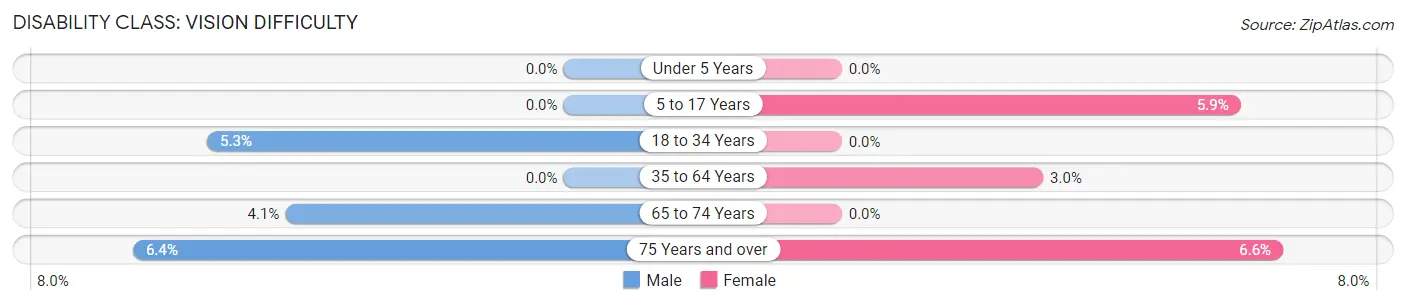
| Age Bracket | Male | Female |
| Under 5 Years | 0 (0.0%) | 0 (0.0%) |
| 5 to 17 Years | 0 (0.0%) | 17 (5.9%) |
| 18 to 34 Years | 21 (5.3%) | 0 (0.0%) |
| 35 to 64 Years | 0 (0.0%) | 27 (3.0%) |
| 65 to 74 Years | 15 (4.1%) | 0 (0.0%) |
| 75 Years and over | 17 (6.4%) | 18 (6.6%) |
Disability Class: Cognitive Difficulty
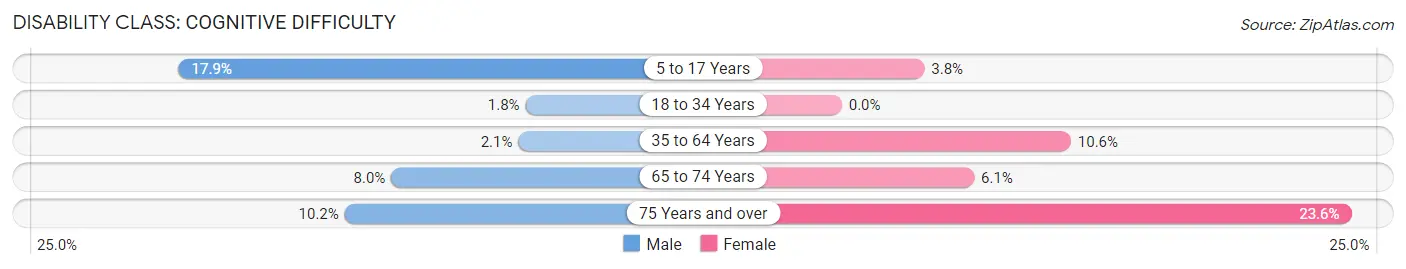
| Age Bracket | Male | Female |
| 5 to 17 Years | 58 (17.8%) | 11 (3.8%) |
| 18 to 34 Years | 7 (1.8%) | 0 (0.0%) |
| 35 to 64 Years | 11 (2.1%) | 96 (10.6%) |
| 65 to 74 Years | 29 (8.0%) | 35 (6.1%) |
| 75 Years and over | 27 (10.2%) | 65 (23.6%) |
Disability Class: Ambulatory Difficulty
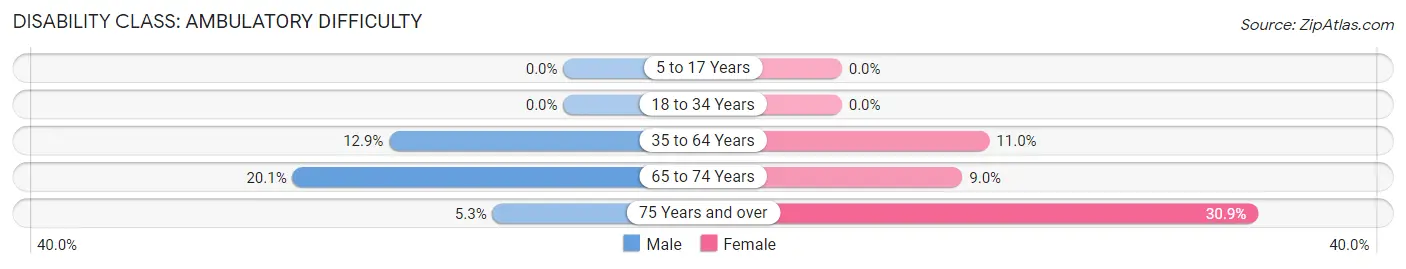
| Age Bracket | Male | Female |
| 5 to 17 Years | 0 (0.0%) | 0 (0.0%) |
| 18 to 34 Years | 0 (0.0%) | 0 (0.0%) |
| 35 to 64 Years | 68 (12.9%) | 99 (11.0%) |
| 65 to 74 Years | 73 (20.1%) | 51 (8.9%) |
| 75 Years and over | 14 (5.3%) | 85 (30.9%) |
Disability Class: Self-Care Difficulty
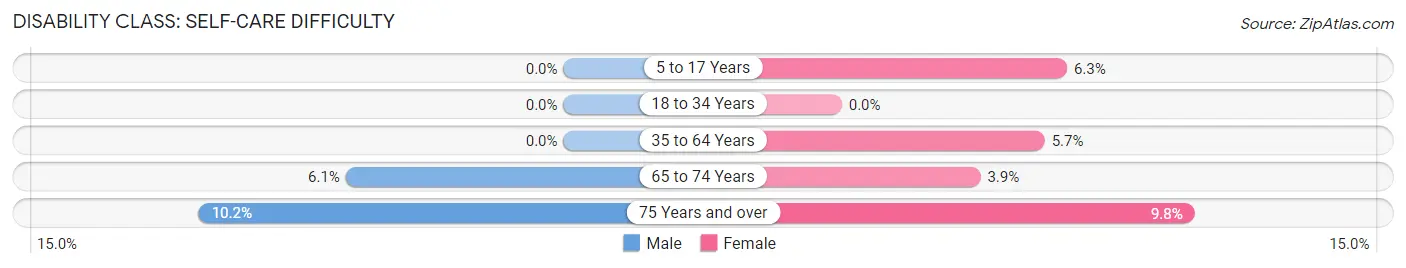
| Age Bracket | Male | Female |
| 5 to 17 Years | 0 (0.0%) | 18 (6.3%) |
| 18 to 34 Years | 0 (0.0%) | 0 (0.0%) |
| 35 to 64 Years | 0 (0.0%) | 51 (5.7%) |
| 65 to 74 Years | 22 (6.1%) | 22 (3.9%) |
| 75 Years and over | 27 (10.2%) | 27 (9.8%) |
Technology Access in Beaufort
Computing Device Access in Beaufort
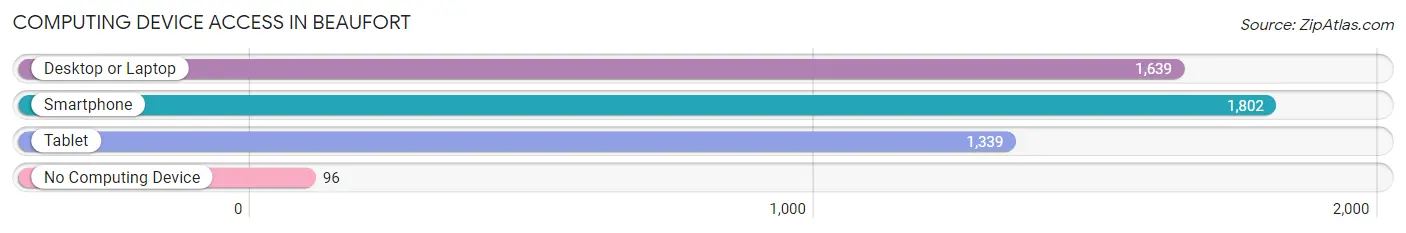
| Device Type | # Households | % Households |
| Desktop or Laptop | 1,639 | 70.6% |
| Smartphone | 1,802 | 77.6% |
| Tablet | 1,339 | 57.7% |
| No Computing Device | 96 | 4.1% |
| Total | 2,321 | 100.0% |
Internet Access in Beaufort
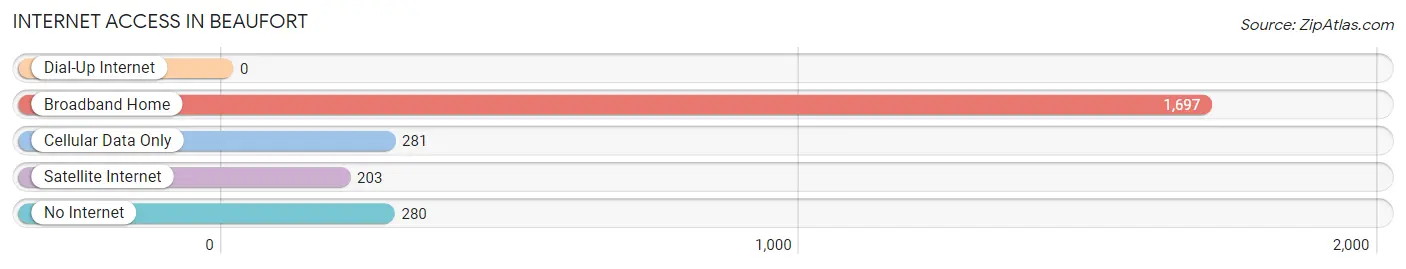
| Internet Type | # Households | % Households |
| Dial-Up Internet | 0 | 0.0% |
| Broadband Home | 1,697 | 73.1% |
| Cellular Data Only | 281 | 12.1% |
| Satellite Internet | 203 | 8.7% |
| No Internet | 280 | 12.1% |
| Total | 2,321 | 100.0% |
Beaufort Summary
Beaufort, North Carolina is a small town located in Carteret County on the coast of North Carolina. It is situated on the banks of the Newport River and is part of the Crystal Coast region. The town has a population of 4,039 as of the 2010 census and is the county seat of Carteret County.
History
Beaufort was founded in 1709 by settlers from the British Isles. The town was named after Henry Somerset, the Duke of Beaufort, who was a major supporter of the settlement. The town was originally a trading post and was the first permanent settlement in the area. In 1722, the town was incorporated and became the county seat of Carteret County.
In the late 18th century, Beaufort was a major port of entry for immigrants from Europe. The town was also a major center for the slave trade. During the American Revolution, Beaufort was occupied by British forces and was the site of several battles. After the war, the town was rebuilt and continued to grow.
In the 19th century, Beaufort was a major center for the fishing industry. The town was also a major port for the export of naval stores, such as tar, pitch, and turpentine. In the early 20th century, the town was a major center for the lumber industry.
Geography
Beaufort is located in the southeastern corner of North Carolina, on the banks of the Newport River. The town is situated on the Crystal Coast, which is a stretch of coastline that extends from Cape Lookout to Cape Fear. The town is surrounded by the Croatan National Forest and is close to the Cape Lookout National Seashore.
The town has a humid subtropical climate, with hot, humid summers and mild winters. The average annual temperature is around 70 degrees Fahrenheit. The town receives an average of 48 inches of rain per year.
Economy
Beaufort’s economy is largely based on tourism and fishing. The town is a popular destination for fishing, boating, and other outdoor activities. The town is also home to several marinas, which provide services for recreational boaters.
The town is also home to several seafood processing plants, which process and package seafood for export. The town is also home to several boat builders, which build and repair boats for commercial and recreational use.
Demographics
As of the 2010 census, the population of Beaufort was 4,039. The racial makeup of the town was 79.3% White, 15.2% African American, 0.7% Native American, 0.7% Asian, 0.1% Pacific Islander, and 3.9% from other races. The median household income was $37,941. The per capita income was $20,945.
Beaufort is home to several churches, including the First Baptist Church, the First Presbyterian Church, and the St. Paul’s Episcopal Church. The town is also home to several schools, including the Beaufort Elementary School, the Beaufort Middle School, and the East Carteret High School.
Common Questions
What is Per Capita Income in Beaufort?
Per Capita income in Beaufort is $32,059.
What is the Median Family Income in Beaufort?
Median Family Income in Beaufort is $60,987.
What is the Median Household income in Beaufort?
Median Household Income in Beaufort is $41,890.
What is Income or Wage Gap in Beaufort?
Income or Wage Gap in Beaufort is 13.6%.
Women in Beaufort earn 86.4 cents for every dollar earned by a man.
What is Inequality or Gini Index in Beaufort?
Inequality or Gini Index in Beaufort is 0.51.
What is the Total Population of Beaufort?
Total Population of Beaufort is 4,534.
What is the Total Male Population of Beaufort?
Total Male Population of Beaufort is 2,040.
What is the Total Female Population of Beaufort?
Total Female Population of Beaufort is 2,494.
What is the Ratio of Males per 100 Females in Beaufort?
There are 81.80 Males per 100 Females in Beaufort.
What is the Ratio of Females per 100 Males in Beaufort?
There are 122.25 Females per 100 Males in Beaufort.
What is the Median Population Age in Beaufort?
Median Population Age in Beaufort is 50.9 Years.
What is the Average Family Size in Beaufort
Average Family Size in Beaufort is 2.6 People.
What is the Average Household Size in Beaufort
Average Household Size in Beaufort is 1.9 People.
How Large is the Labor Force in Beaufort?
There are 1,979 People in the Labor Forcein in Beaufort.
What is the Percentage of People in the Labor Force in Beaufort?
50.7% of People are in the Labor Force in Beaufort.
What is the Unemployment Rate in Beaufort?
Unemployment Rate in Beaufort is 6.4%.