Prospect, NC Map & Demographics
Prospect Map
Prospect Overview
$34,176
PER CAPITA INCOME
$114,792
AVG FAMILY INCOME
29.6%
WAGE / INCOME GAP [ % ]
70.4¢/ $1
WAGE / INCOME GAP [ $ ]
0.46
INEQUALITY / GINI INDEX
650
TOTAL POPULATION
380
MALE POPULATION
270
FEMALE POPULATION
140.74
MALES / 100 FEMALES
71.05
FEMALES / 100 MALES
43.4
MEDIAN AGE
4.0
AVG FAMILY SIZE
2.8
AVG HOUSEHOLD SIZE
309
LABOR FORCE [ PEOPLE ]
53.7%
PERCENT IN LABOR FORCE
Income in Prospect
Income Overview in Prospect
| Characteristic | Number | Measure |
| Per Capita Income | 650 | $34,176 |
| Median Family Income | 138 | $114,792 |
| Mean Family Income | 138 | $106,236 |
| Median Household Income | 230 | $0 |
| Mean Household Income | 230 | $74,796 |
| Income Deficit | 138 | $0 |
| Wage / Income Gap (%) | 650 | 29.65% |
| Wage / Income Gap ($) | 650 | 70.35¢ per $1 |
| Gini / Inequality Index | 650 | 0.46 |
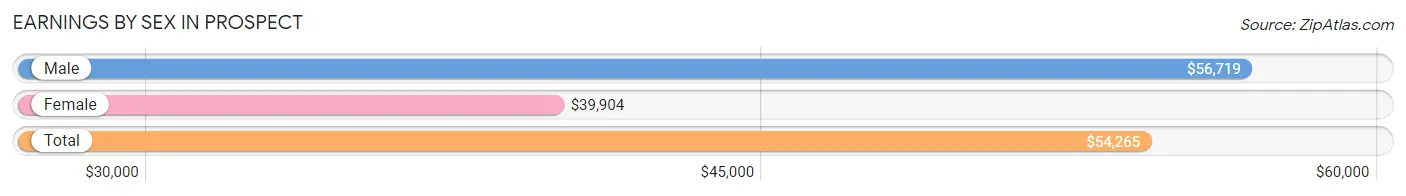
Earnings by Sex in Prospect
Average Earnings in Prospect are $54,265, $56,719 for men and $39,904 for women, a difference of 29.6%.
| Sex | Number | Average Earnings |
| Male | 197 (62.0%) | $56,719 |
| Female | 121 (38.1%) | $39,904 |
| Total | 318 (100.0%) | $54,265 |
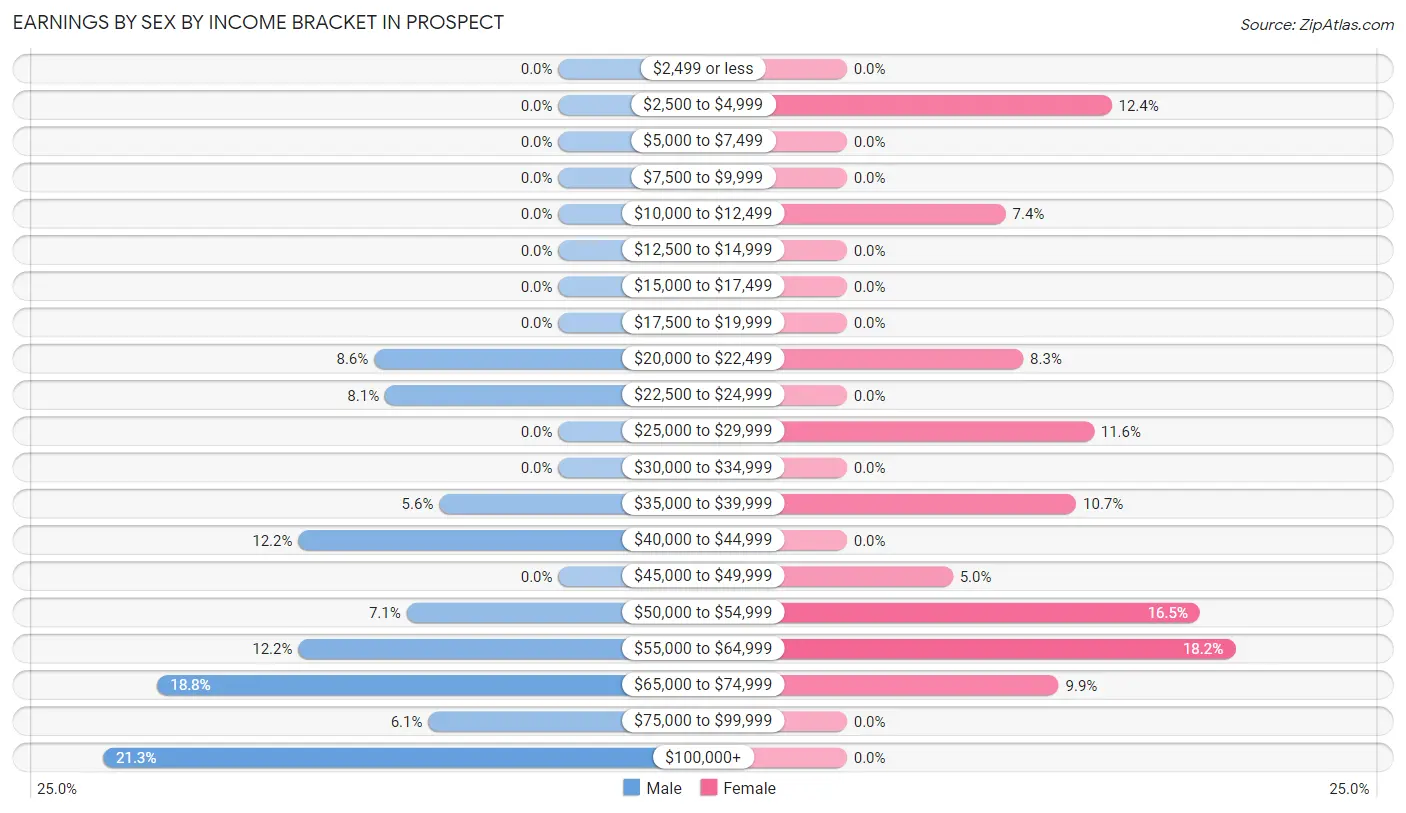
Earnings by Sex by Income Bracket in Prospect
The most common earnings brackets in Prospect are $100,000+ for men (42 | 21.3%) and $55,000 to $64,999 for women (22 | 18.2%).
| Income | Male | Female |
| $2,499 or less | 0 (0.0%) | 0 (0.0%) |
| $2,500 to $4,999 | 0 (0.0%) | 15 (12.4%) |
| $5,000 to $7,499 | 0 (0.0%) | 0 (0.0%) |
| $7,500 to $9,999 | 0 (0.0%) | 0 (0.0%) |
| $10,000 to $12,499 | 0 (0.0%) | 9 (7.4%) |
| $12,500 to $14,999 | 0 (0.0%) | 0 (0.0%) |
| $15,000 to $17,499 | 0 (0.0%) | 0 (0.0%) |
| $17,500 to $19,999 | 0 (0.0%) | 0 (0.0%) |
| $20,000 to $22,499 | 17 (8.6%) | 10 (8.3%) |
| $22,500 to $24,999 | 16 (8.1%) | 0 (0.0%) |
| $25,000 to $29,999 | 0 (0.0%) | 14 (11.6%) |
| $30,000 to $34,999 | 0 (0.0%) | 0 (0.0%) |
| $35,000 to $39,999 | 11 (5.6%) | 13 (10.7%) |
| $40,000 to $44,999 | 24 (12.2%) | 0 (0.0%) |
| $45,000 to $49,999 | 0 (0.0%) | 6 (5.0%) |
| $50,000 to $54,999 | 14 (7.1%) | 20 (16.5%) |
| $55,000 to $64,999 | 24 (12.2%) | 22 (18.2%) |
| $65,000 to $74,999 | 37 (18.8%) | 12 (9.9%) |
| $75,000 to $99,999 | 12 (6.1%) | 0 (0.0%) |
| $100,000+ | 42 (21.3%) | 0 (0.0%) |
| Total | 197 (100.0%) | 121 (100.0%) |
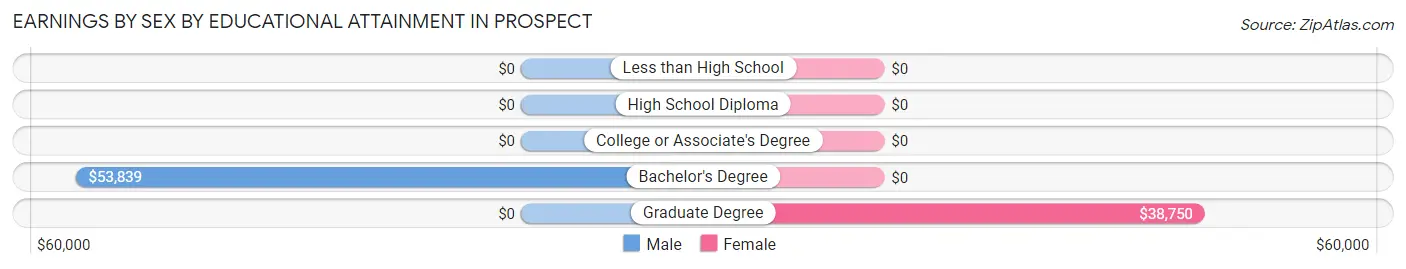
Earnings by Sex by Educational Attainment in Prospect
Average earnings in Prospect are $67,534 for men and $49,375 for women, a difference of 26.9%. Men with an educational attainment of bachelor's degree enjoy the highest average annual earnings of $53,839, while those with bachelor's degree education earn the least with $53,839. Women with an educational attainment of graduate degree earn the most with the average annual earnings of $38,750, while those with graduate degree education have the smallest earnings of $38,750.
| Educational Attainment | Male Income | Female Income |
| Less than High School | - | - |
| High School Diploma | - | - |
| College or Associate's Degree | - | - |
| Bachelor's Degree | $53,839 | $0 |
| Graduate Degree | - | - |
| Total | $67,534 | $49,375 |
Family Income in Prospect
Family Income Brackets in Prospect
According to the Prospect family income data, there are 57 families falling into the $100,000 to $149,999 income range, which is the most common income bracket and makes up 41.3% of all families.
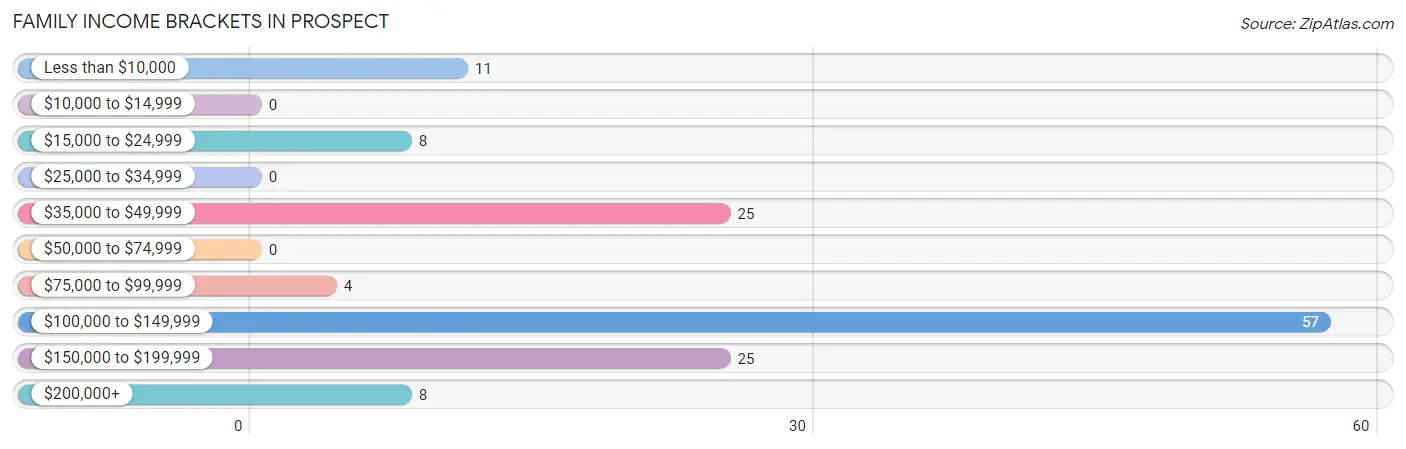
| Income Bracket | # Families | % Families |
| Less than $10,000 | 11 | 8.0% |
| $10,000 to $14,999 | 0 | 0.0% |
| $15,000 to $24,999 | 8 | 5.8% |
| $25,000 to $34,999 | 0 | 0.0% |
| $35,000 to $49,999 | 25 | 18.1% |
| $50,000 to $74,999 | 0 | 0.0% |
| $75,000 to $99,999 | 4 | 2.9% |
| $100,000 to $149,999 | 57 | 41.3% |
| $150,000 to $199,999 | 25 | 18.1% |
| $200,000+ | 8 | 5.8% |
Family Income by Famaliy Size in Prospect
3-person families (43 | 31.2%) account for the highest median family income in Prospect with $125,917 per family, while 3-person families (43 | 31.2%) have the highest median income of $41,972 per family member.
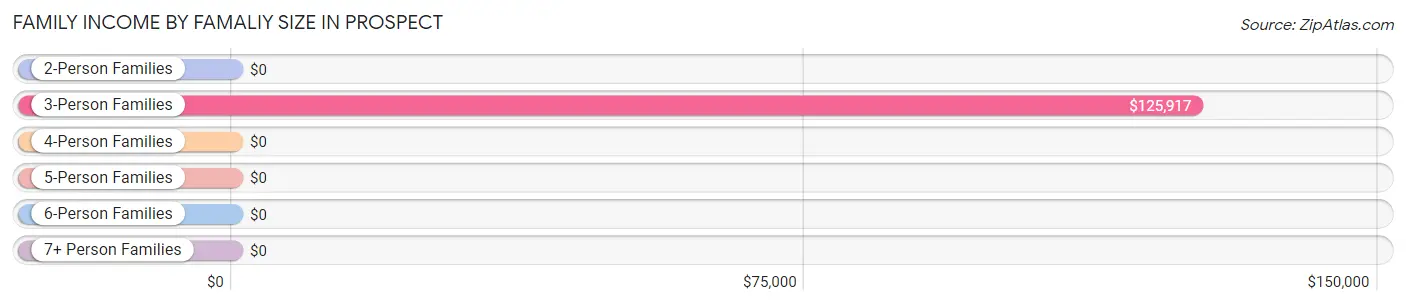
| Income Bracket | # Families | Median Income |
| 2-Person Families | 55 (39.9%) | $0 |
| 3-Person Families | 43 (31.2%) | $125,917 |
| 4-Person Families | 0 (0.0%) | $0 |
| 5-Person Families | 32 (23.2%) | $0 |
| 6-Person Families | 8 (5.8%) | $0 |
| 7+ Person Families | 0 (0.0%) | $0 |
| Total | 138 (100.0%) | $114,792 |
Family Income by Number of Earners in Prospect
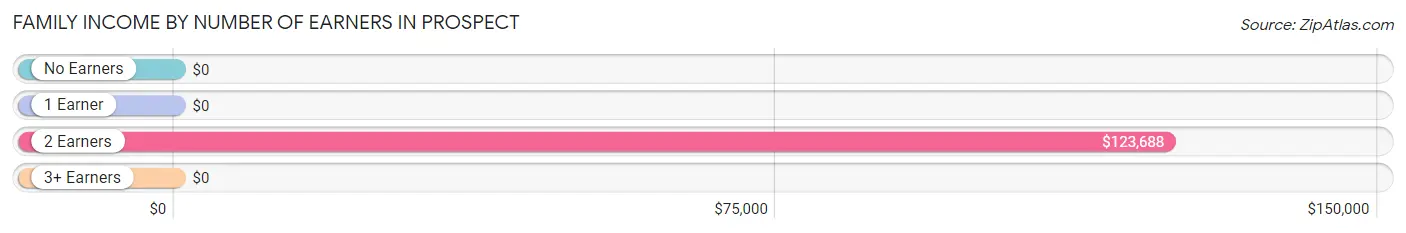
| Number of Earners | # Families | Median Income |
| No Earners | 19 (13.8%) | $0 |
| 1 Earner | 40 (29.0%) | $0 |
| 2 Earners | 71 (51.4%) | $123,688 |
| 3+ Earners | 8 (5.8%) | $0 |
| Total | 138 (100.0%) | $114,792 |
Household Income in Prospect
Household Income Brackets in Prospect
With 57 households falling in the category, the $100,000 to $149,999 income range is the most frequent in Prospect, accounting for 24.8% of all households. In contrast, only 4 households (1.7%) fall into the $75,000 to $99,999 income bracket, making it the least populous group.
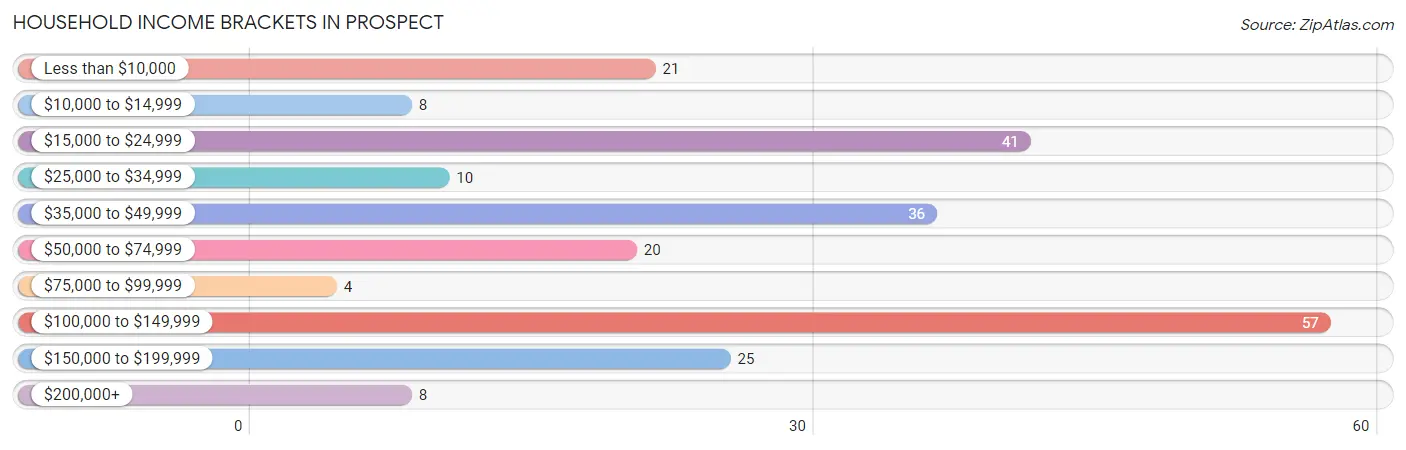
| Income Bracket | # Households | % Households |
| Less than $10,000 | 21 | 9.1% |
| $10,000 to $14,999 | 8 | 3.5% |
| $15,000 to $24,999 | 41 | 17.8% |
| $25,000 to $34,999 | 10 | 4.3% |
| $35,000 to $49,999 | 36 | 15.7% |
| $50,000 to $74,999 | 20 | 8.7% |
| $75,000 to $99,999 | 4 | 1.7% |
| $100,000 to $149,999 | 57 | 24.8% |
| $150,000 to $199,999 | 25 | 10.9% |
| $200,000+ | 8 | 3.5% |
Household Income by Householder Age in Prospect
The median household income in Prospect is $0, with the highest median household income of $125,917 found in the 65+ years age bracket for the primary householder. A total of 43 households (18.7%) fall into this category.
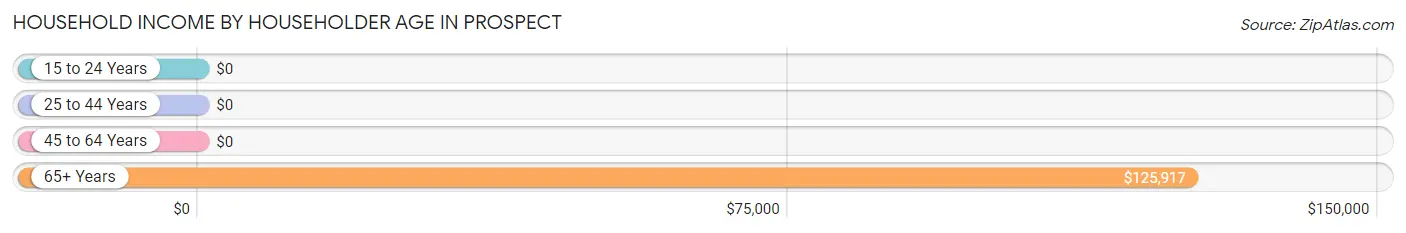
| Income Bracket | # Households | Median Income |
| 15 to 24 Years | 0 (0.0%) | $0 |
| 25 to 44 Years | 44 (19.1%) | $0 |
| 45 to 64 Years | 143 (62.2%) | $0 |
| 65+ Years | 43 (18.7%) | $125,917 |
| Total | 230 (100.0%) | $0 |
Poverty in Prospect
Income Below Poverty by Sex and Age in Prospect
With 13.7% poverty level for males and 7.0% for females among the residents of Prospect, 55 to 64 year old males and 55 to 64 year old females are the most vulnerable to poverty, with 24 males (49.0%) and 19 females (30.2%) in their respective age groups living below the poverty level.
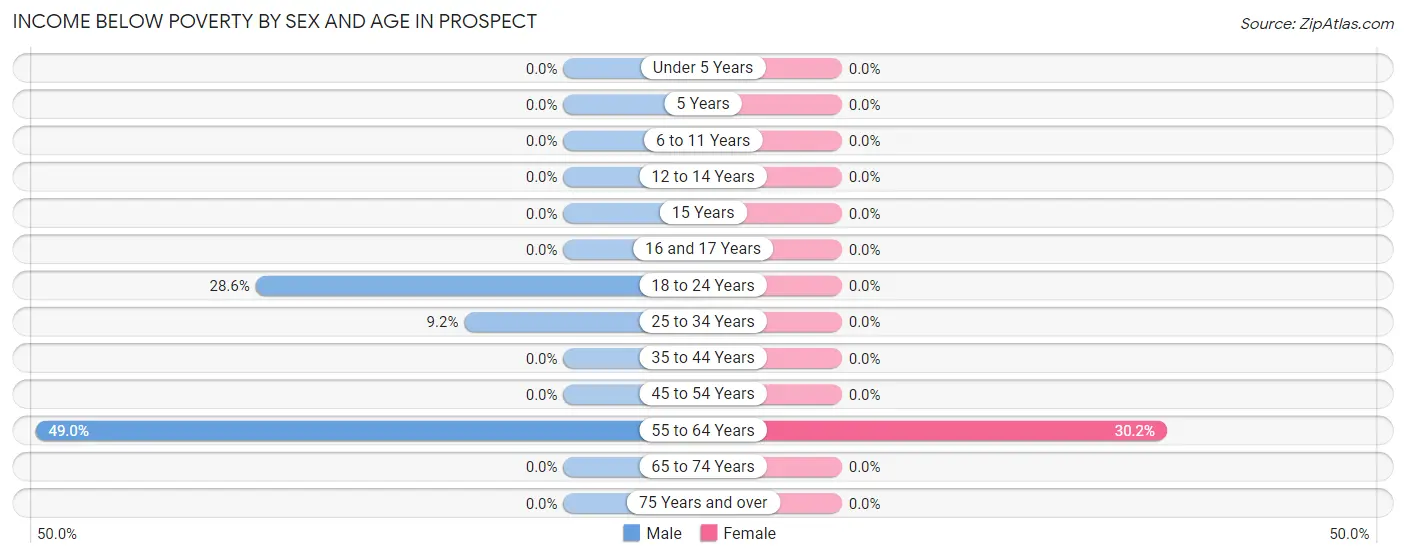
| Age Bracket | Male | Female |
| Under 5 Years | 0 (0.0%) | 0 (0.0%) |
| 5 Years | 0 (0.0%) | 0 (0.0%) |
| 6 to 11 Years | 0 (0.0%) | 0 (0.0%) |
| 12 to 14 Years | 0 (0.0%) | 0 (0.0%) |
| 15 Years | 0 (0.0%) | 0 (0.0%) |
| 16 and 17 Years | 0 (0.0%) | 0 (0.0%) |
| 18 to 24 Years | 20 (28.6%) | 0 (0.0%) |
| 25 to 34 Years | 8 (9.2%) | 0 (0.0%) |
| 35 to 44 Years | 0 (0.0%) | 0 (0.0%) |
| 45 to 54 Years | 0 (0.0%) | 0 (0.0%) |
| 55 to 64 Years | 24 (49.0%) | 19 (30.2%) |
| 65 to 74 Years | 0 (0.0%) | 0 (0.0%) |
| 75 Years and over | 0 (0.0%) | 0 (0.0%) |
| Total | 52 (13.7%) | 19 (7.0%) |
Income Above Poverty by Sex and Age in Prospect
According to the poverty statistics in Prospect, males aged 6 to 11 years and females aged under 5 years are the age groups that are most secure financially, with 100.0% of males and 100.0% of females in these age groups living above the poverty line.
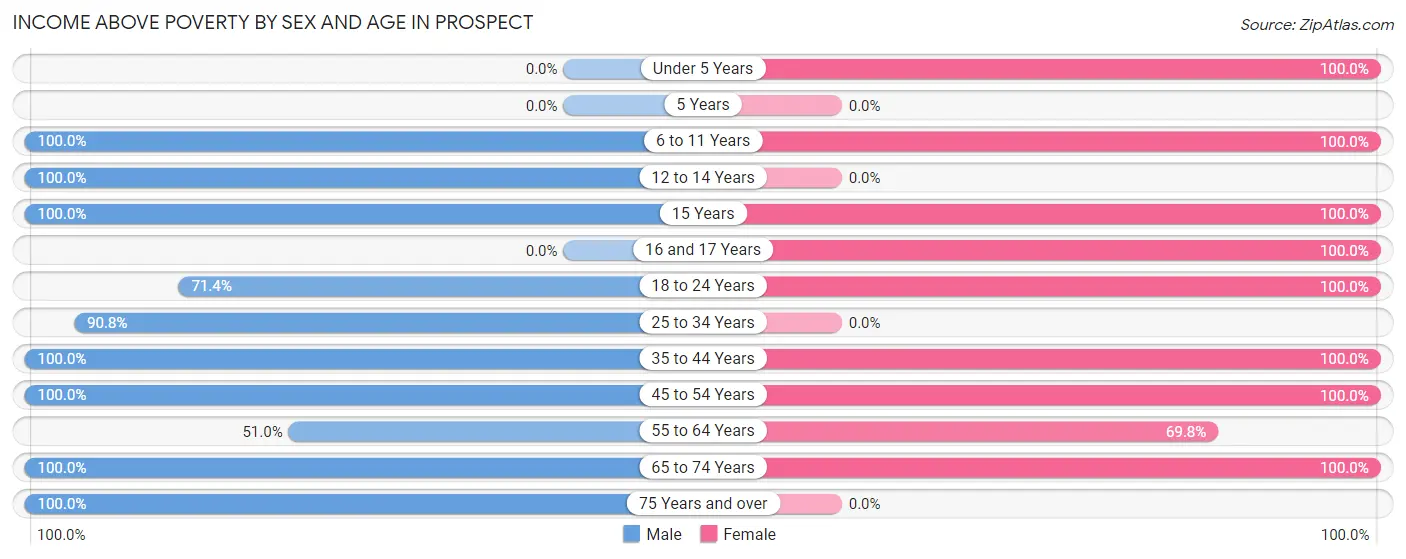
| Age Bracket | Male | Female |
| Under 5 Years | 0 (0.0%) | 4 (100.0%) |
| 5 Years | 0 (0.0%) | 0 (0.0%) |
| 6 to 11 Years | 17 (100.0%) | 15 (100.0%) |
| 12 to 14 Years | 13 (100.0%) | 0 (0.0%) |
| 15 Years | 13 (100.0%) | 13 (100.0%) |
| 16 and 17 Years | 0 (0.0%) | 29 (100.0%) |
| 18 to 24 Years | 50 (71.4%) | 35 (100.0%) |
| 25 to 34 Years | 79 (90.8%) | 0 (0.0%) |
| 35 to 44 Years | 40 (100.0%) | 26 (100.0%) |
| 45 to 54 Years | 63 (100.0%) | 43 (100.0%) |
| 55 to 64 Years | 25 (51.0%) | 44 (69.8%) |
| 65 to 74 Years | 12 (100.0%) | 42 (100.0%) |
| 75 Years and over | 16 (100.0%) | 0 (0.0%) |
| Total | 328 (86.3%) | 251 (93.0%) |
Income Below Poverty Among Married-Couple Families in Prospect
The poverty statistics for married-couple families in Prospect show that 12.0% or 11 of the total 92 families live below the poverty line. Families with no children have the highest poverty rate of 21.1%, comprising of 11 families. On the other hand, families with 1 or 2 children have the lowest poverty rate of 0.0%, which includes 0 families.
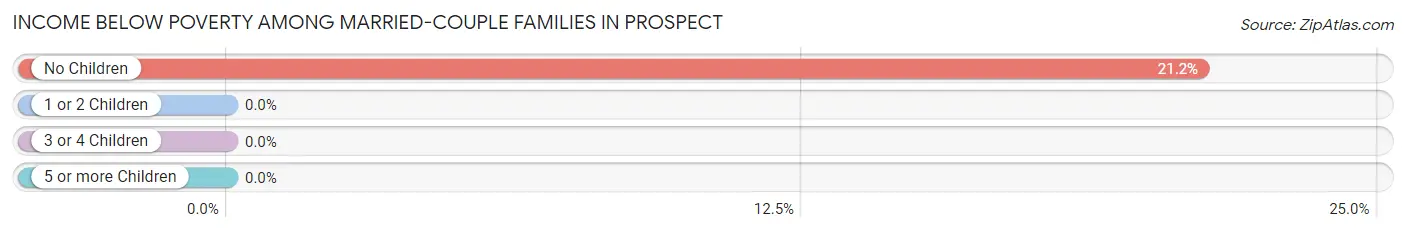
| Children | Above Poverty | Below Poverty |
| No Children | 41 (78.8%) | 11 (21.1%) |
| 1 or 2 Children | 28 (100.0%) | 0 (0.0%) |
| 3 or 4 Children | 12 (100.0%) | 0 (0.0%) |
| 5 or more Children | 0 (0.0%) | 0 (0.0%) |
| Total | 81 (88.0%) | 11 (12.0%) |
Income Below Poverty Among Single-Parent Households in Prospect
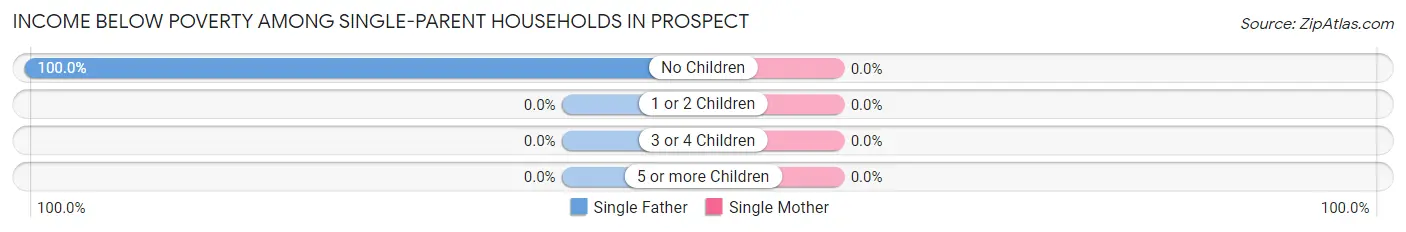
| Children | Single Father | Single Mother |
| No Children | 8 (100.0%) | 0 (0.0%) |
| 1 or 2 Children | 0 (0.0%) | 0 (0.0%) |
| 3 or 4 Children | 0 (0.0%) | 0 (0.0%) |
| 5 or more Children | 0 (0.0%) | 0 (0.0%) |
| Total | 8 (100.0%) | 0 (0.0%) |
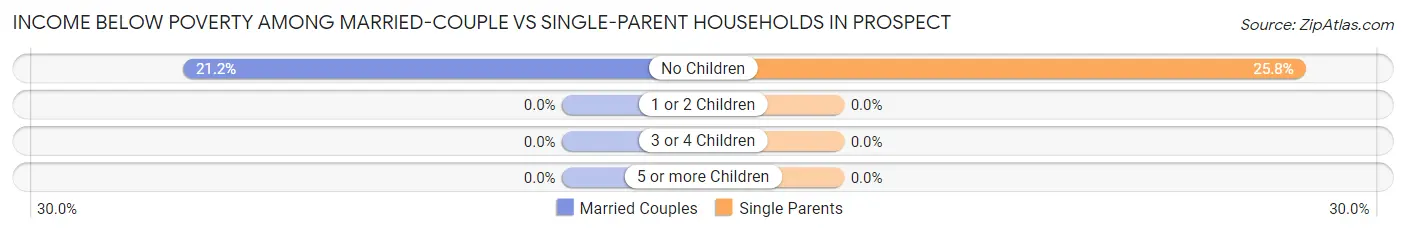
Income Below Poverty Among Married-Couple vs Single-Parent Households in Prospect
The poverty data for Prospect shows that 11 of the married-couple family households (12.0%) and 8 of the single-parent households (17.4%) are living below the poverty level. Within the married-couple family households, those with no children have the highest poverty rate, with 11 households (21.1%) falling below the poverty line. Among the single-parent households, those with no children have the highest poverty rate, with 8 household (25.8%) living below poverty.
| Children | Married-Couple Families | Single-Parent Households |
| No Children | 11 (21.1%) | 8 (25.8%) |
| 1 or 2 Children | 0 (0.0%) | 0 (0.0%) |
| 3 or 4 Children | 0 (0.0%) | 0 (0.0%) |
| 5 or more Children | 0 (0.0%) | 0 (0.0%) |
| Total | 11 (12.0%) | 8 (17.4%) |
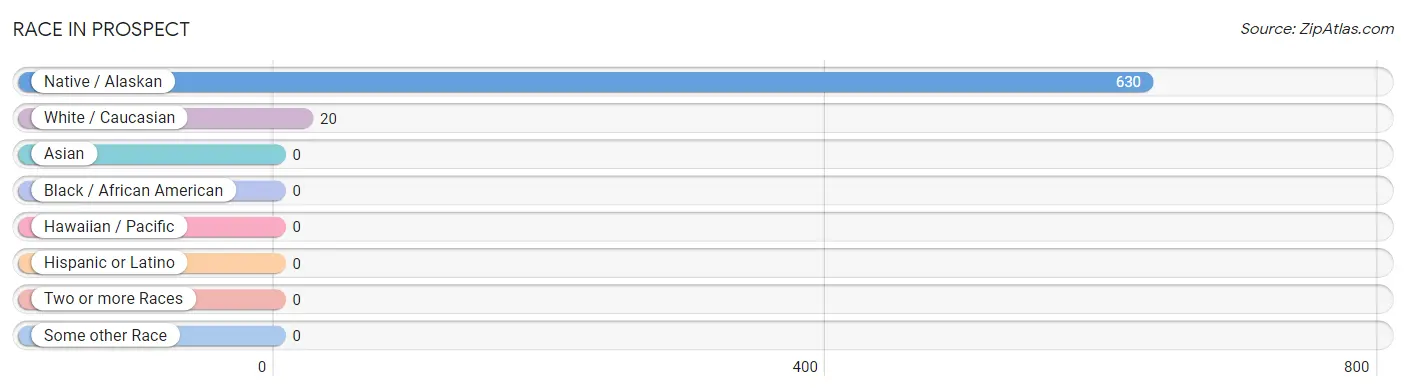
Race in Prospect
The most populous races in Prospect are Native / Alaskan (630 | 96.9%), and White / Caucasian (20 | 3.1%).
| Race | # Population | % Population |
| Asian | 0 | 0.0% |
| Black / African American | 0 | 0.0% |
| Hawaiian / Pacific | 0 | 0.0% |
| Hispanic or Latino | 0 | 0.0% |
| Native / Alaskan | 630 | 96.9% |
| White / Caucasian | 20 | 3.1% |
| Two or more Races | 0 | 0.0% |
| Some other Race | 0 | 0.0% |
| Total | 650 | 100.0% |
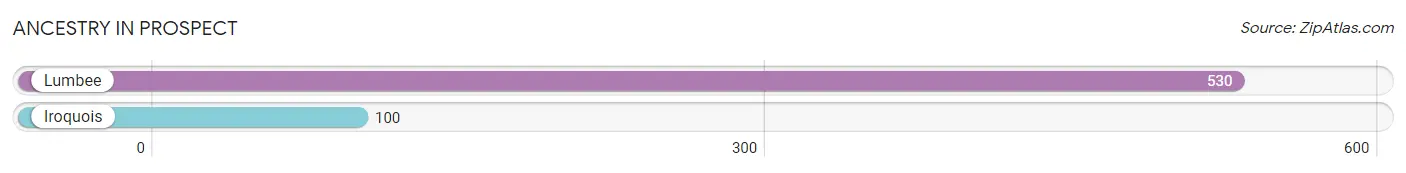
Ancestry in Prospect
The most populous ancestries reported in Prospect are Lumbee (530 | 81.5%), and Iroquois (100 | 15.4%), together accounting for 96.9% of all Prospect residents.
| Ancestry | # Population | % Population |
| Iroquois | 100 | 15.4% |
| Lumbee | 530 | 81.5% | View All 2 Rows |
Immigrants in Prospect

| Immigration Origin | # Population | % Population | View All 0 Rows |
Sex and Age in Prospect
Sex and Age in Prospect
The most populous age groups in Prospect are 20 to 24 Years (70 | 18.4%) for men and 15 to 19 Years (67 | 24.8%) for women.
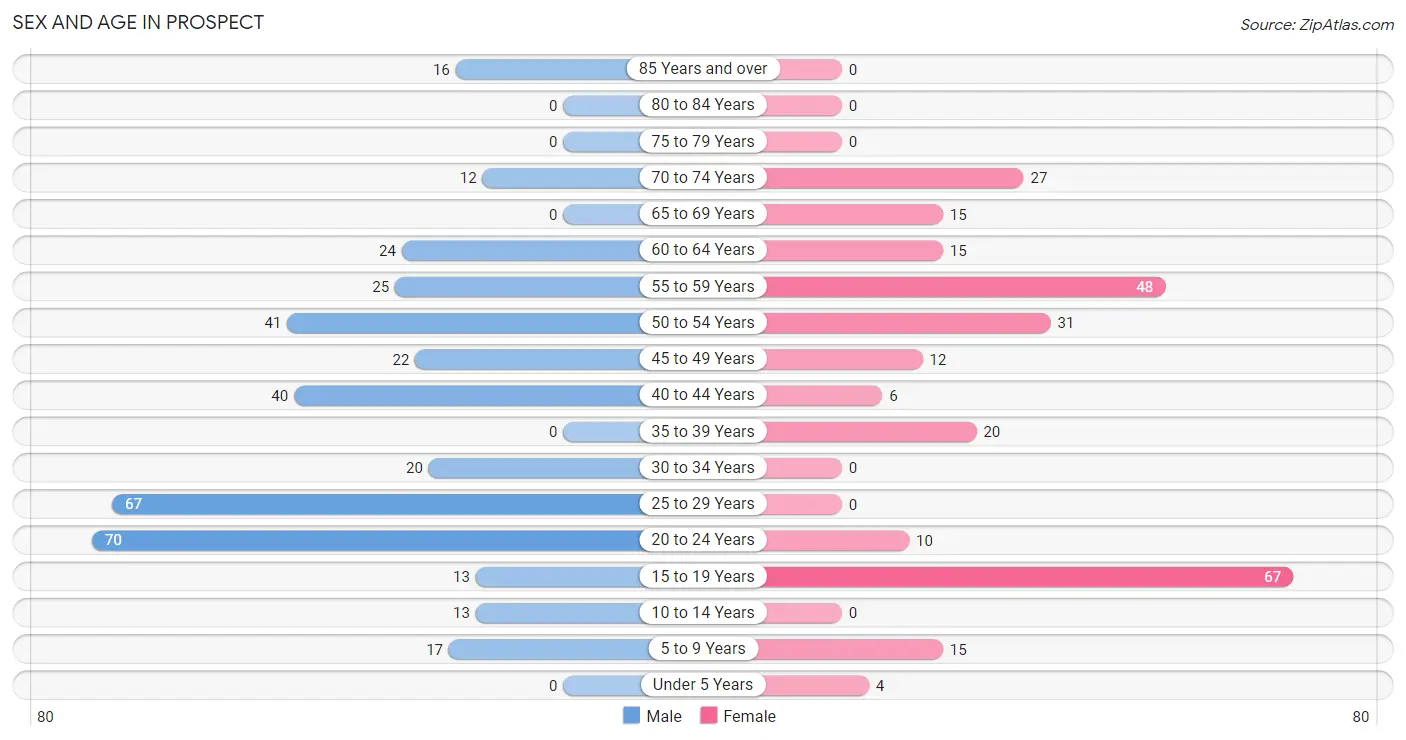
| Age Bracket | Male | Female |
| Under 5 Years | 0 (0.0%) | 4 (1.5%) |
| 5 to 9 Years | 17 (4.5%) | 15 (5.6%) |
| 10 to 14 Years | 13 (3.4%) | 0 (0.0%) |
| 15 to 19 Years | 13 (3.4%) | 67 (24.8%) |
| 20 to 24 Years | 70 (18.4%) | 10 (3.7%) |
| 25 to 29 Years | 67 (17.6%) | 0 (0.0%) |
| 30 to 34 Years | 20 (5.3%) | 0 (0.0%) |
| 35 to 39 Years | 0 (0.0%) | 20 (7.4%) |
| 40 to 44 Years | 40 (10.5%) | 6 (2.2%) |
| 45 to 49 Years | 22 (5.8%) | 12 (4.4%) |
| 50 to 54 Years | 41 (10.8%) | 31 (11.5%) |
| 55 to 59 Years | 25 (6.6%) | 48 (17.8%) |
| 60 to 64 Years | 24 (6.3%) | 15 (5.6%) |
| 65 to 69 Years | 0 (0.0%) | 15 (5.6%) |
| 70 to 74 Years | 12 (3.2%) | 27 (10.0%) |
| 75 to 79 Years | 0 (0.0%) | 0 (0.0%) |
| 80 to 84 Years | 0 (0.0%) | 0 (0.0%) |
| 85 Years and over | 16 (4.2%) | 0 (0.0%) |
| Total | 380 (100.0%) | 270 (100.0%) |
Families and Households in Prospect
Median Family Size in Prospect
The median family size in Prospect is 4.04 persons per family, with married-couple families (92 | 66.7%) accounting for the largest median family size of 4.53 persons per family. On the other hand, single female/mother families (38 | 27.5%) represent the smallest median family size with 2.97 persons per family.
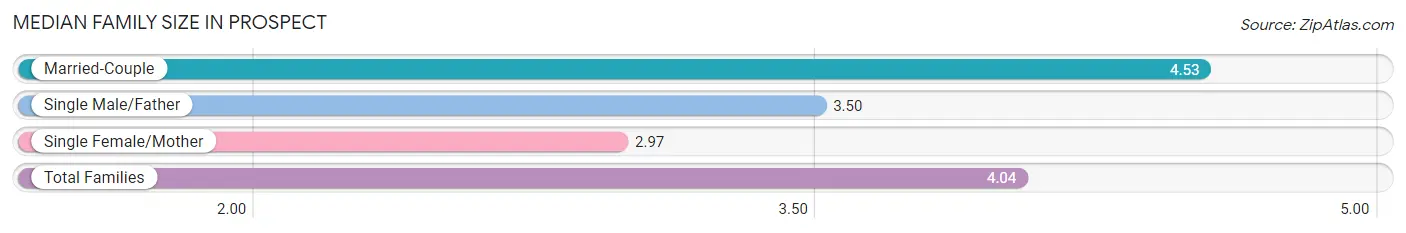
| Family Type | # Families | Family Size |
| Married-Couple | 92 (66.7%) | 4.53 |
| Single Male/Father | 8 (5.8%) | 3.50 |
| Single Female/Mother | 38 (27.5%) | 2.97 |
| Total Families | 138 (100.0%) | 4.04 |
Median Household Size in Prospect
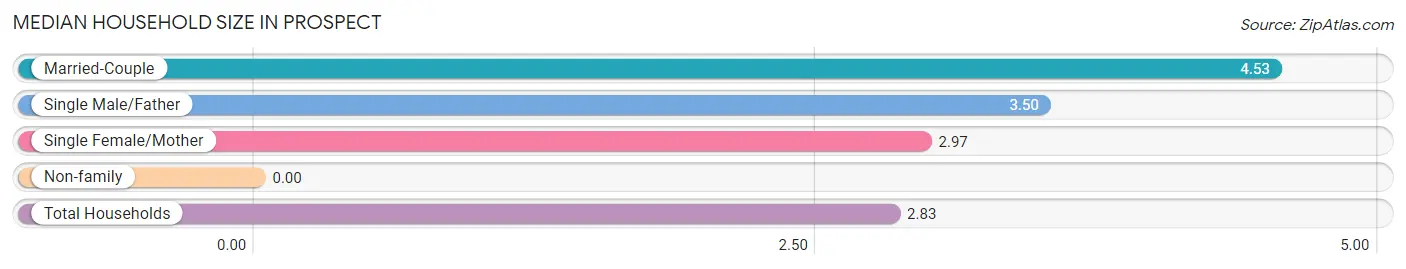
| Household Type | # Households | Household Size |
| Married-Couple | 92 (40.0%) | 4.53 |
| Single Male/Father | 8 (3.5%) | 3.50 |
| Single Female/Mother | 38 (16.5%) | 2.97 |
| Non-family | 92 (40.0%) | - |
| Total Households | 230 (100.0%) | 2.83 |
Household Size by Marriage Status in Prospect
Out of a total of 230 households in Prospect, 138 (60.0%) are family households, while 92 (40.0%) are nonfamily households. The most numerous type of family households are 2-person households, comprising 55, and the most common type of nonfamily households are 1-person households, comprising 92.
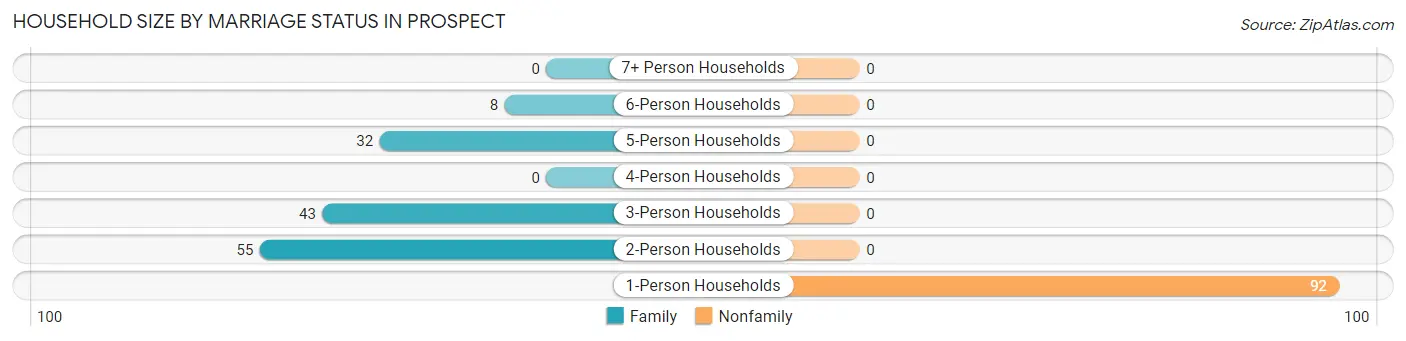
| Household Size | Family Households | Nonfamily Households |
| 1-Person Households | - | 92 (40.0%) |
| 2-Person Households | 55 (23.9%) | 0 (0.0%) |
| 3-Person Households | 43 (18.7%) | 0 (0.0%) |
| 4-Person Households | 0 (0.0%) | 0 (0.0%) |
| 5-Person Households | 32 (13.9%) | 0 (0.0%) |
| 6-Person Households | 8 (3.5%) | 0 (0.0%) |
| 7+ Person Households | 0 (0.0%) | 0 (0.0%) |
| Total | 138 (60.0%) | 92 (40.0%) |
Female Fertility in Prospect
Fertility by Age in Prospect
Average fertility rate in Prospect is 47.0 births per 1,000 women. Women in the age bracket of 35 to 50 years have the highest fertility rate with 120.0 births per 1,000 women. Women in the age bracket of 35 to 50 years acount for 100.0% of all women with births.
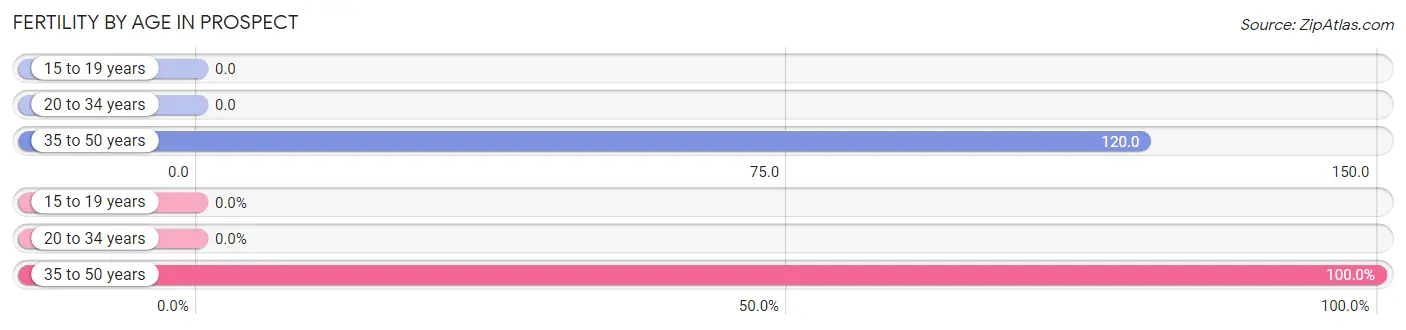
| Age Bracket | Women with Births | Births / 1,000 Women |
| 15 to 19 years | 0 (0.0%) | 0.0 |
| 20 to 34 years | 0 (0.0%) | 0.0 |
| 35 to 50 years | 6 (100.0%) | 120.0 |
| Total | 6 (100.0%) | 47.0 |
Fertility by Age by Marriage Status in Prospect
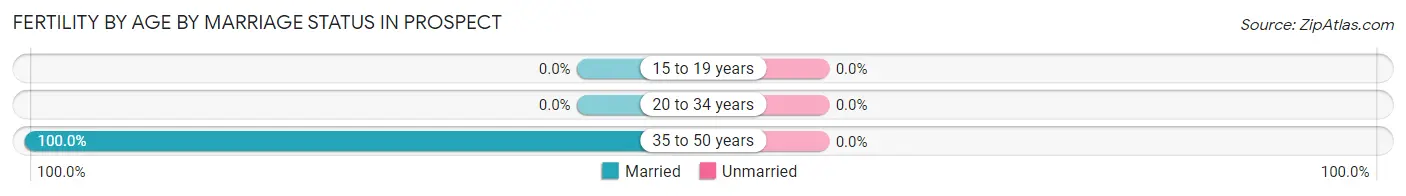
| Age Bracket | Married | Unmarried |
| 15 to 19 years | 0 (0.0%) | 0 (0.0%) |
| 20 to 34 years | 0 (0.0%) | 0 (0.0%) |
| 35 to 50 years | 6 (100.0%) | 0 (0.0%) |
| Total | 6 (100.0%) | 0 (0.0%) |
Fertility by Education in Prospect
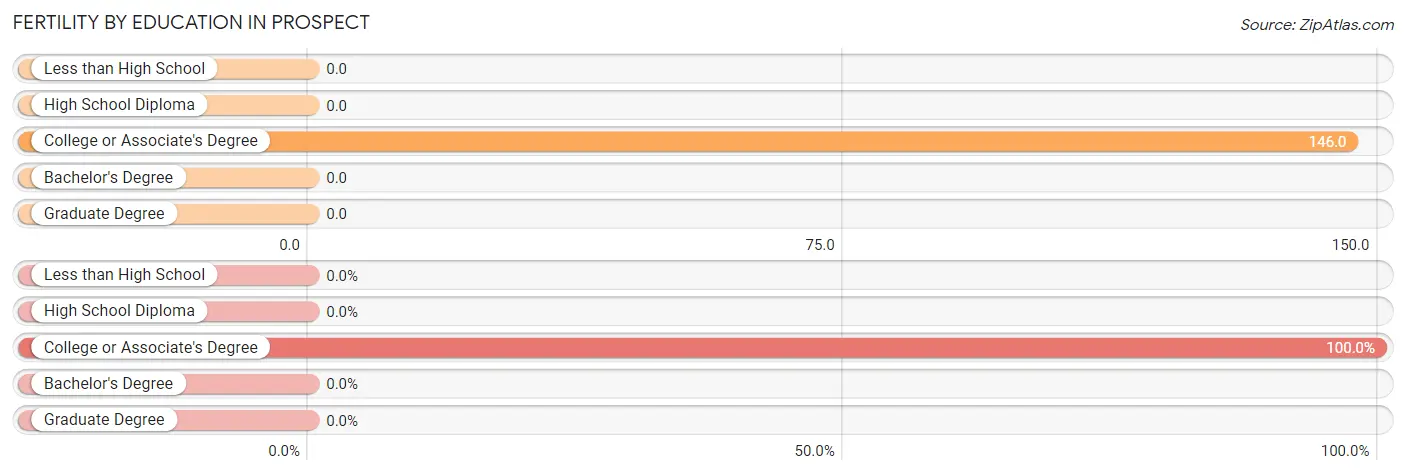
| Educational Attainment | Women with Births | Births / 1,000 Women |
| Less than High School | 0 (0.0%) | 0.0 |
| High School Diploma | 0 (0.0%) | 0.0 |
| College or Associate's Degree | 6 (100.0%) | 146.0 |
| Bachelor's Degree | 0 (0.0%) | 0.0 |
| Graduate Degree | 0 (0.0%) | 0.0 |
| Total | 6 (100.0%) | 47.0 |
Fertility by Education by Marriage Status in Prospect
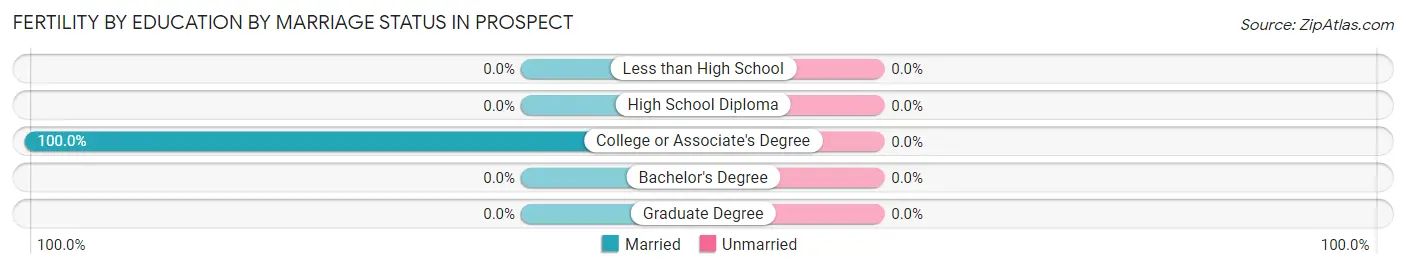
| Educational Attainment | Married | Unmarried |
| Less than High School | 0 (0.0%) | 0 (0.0%) |
| High School Diploma | 0 (0.0%) | 0 (0.0%) |
| College or Associate's Degree | 6 (100.0%) | 0 (0.0%) |
| Bachelor's Degree | 0 (0.0%) | 0 (0.0%) |
| Graduate Degree | 0 (0.0%) | 0 (0.0%) |
| Total | 6 (100.0%) | 0 (0.0%) |
Employment Characteristics in Prospect
Employment by Class of Employer in Prospect
Among the 299 employed individuals in Prospect, private company employees (179 | 59.9%), local government employees (57 | 19.1%), and state government employees (49 | 16.4%) make up the most common classes of employment.
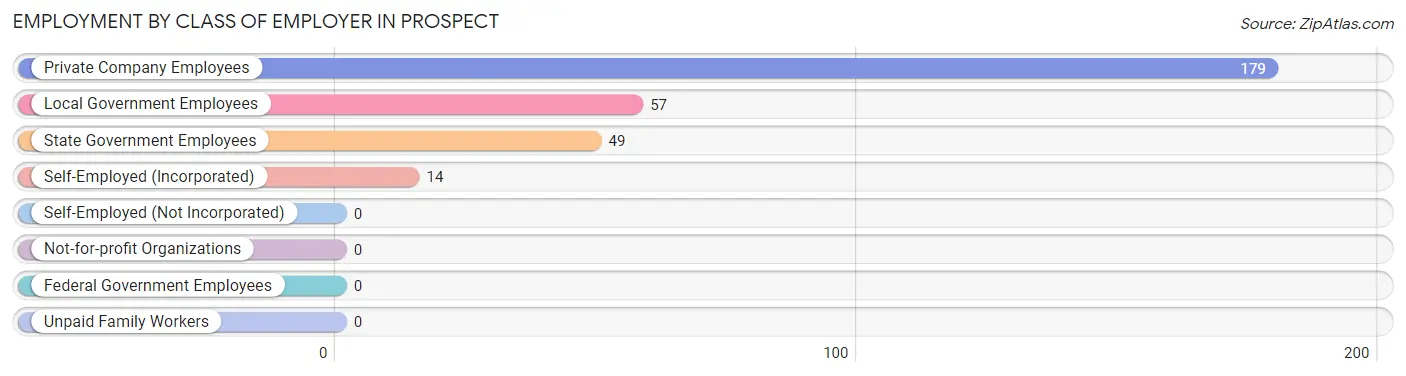
| Employer Class | # Employees | % Employees |
| Private Company Employees | 179 | 59.9% |
| Self-Employed (Incorporated) | 14 | 4.7% |
| Self-Employed (Not Incorporated) | 0 | 0.0% |
| Not-for-profit Organizations | 0 | 0.0% |
| Local Government Employees | 57 | 19.1% |
| State Government Employees | 49 | 16.4% |
| Federal Government Employees | 0 | 0.0% |
| Unpaid Family Workers | 0 | 0.0% |
| Total | 299 | 100.0% |
Employment Status by Age in Prospect
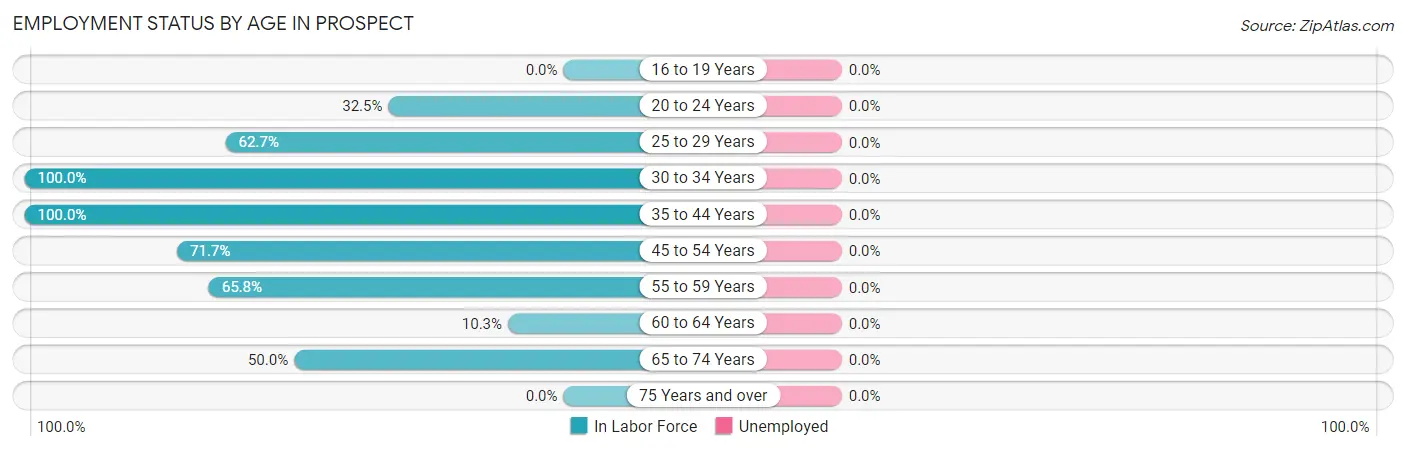
| Age Bracket | In Labor Force | Unemployed |
| 16 to 19 Years | 0 (0.0%) | 0 (0.0%) |
| 20 to 24 Years | 26 (32.5%) | 0 (0.0%) |
| 25 to 29 Years | 42 (62.7%) | 0 (0.0%) |
| 30 to 34 Years | 20 (100.0%) | 0 (0.0%) |
| 35 to 44 Years | 66 (100.0%) | 0 (0.0%) |
| 45 to 54 Years | 76 (71.7%) | 0 (0.0%) |
| 55 to 59 Years | 48 (65.8%) | 0 (0.0%) |
| 60 to 64 Years | 4 (10.3%) | 0 (0.0%) |
| 65 to 74 Years | 27 (50.0%) | 0 (0.0%) |
| 75 Years and over | 0 (0.0%) | 0 (0.0%) |
| Total | 309 (53.7%) | 0 (0.0%) |
Employment Status by Educational Attainment in Prospect
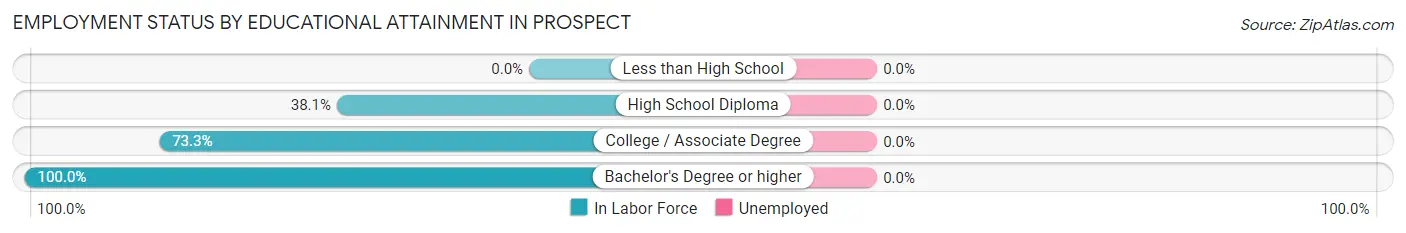
| Educational Attainment | In Labor Force | Unemployed |
| Less than High School | 0 (0.0%) | 0 (0.0%) |
| High School Diploma | 40 (38.1%) | 0 (0.0%) |
| College / Associate Degree | 110 (73.3%) | 0 (0.0%) |
| Bachelor's Degree or higher | 106 (100.0%) | 0 (0.0%) |
| Total | 256 (69.0%) | 0 (0.0%) |
Employment Occupations by Sex in Prospect
Management, Business, Science and Arts Occupations
The most common Management, Business, Science and Arts occupations in Prospect are Community & Social Service (47 | 15.2%), Education Instruction & Library (47 | 15.2%), Management (28 | 9.1%), and Health Diagnosing & Treating (6 | 1.9%).
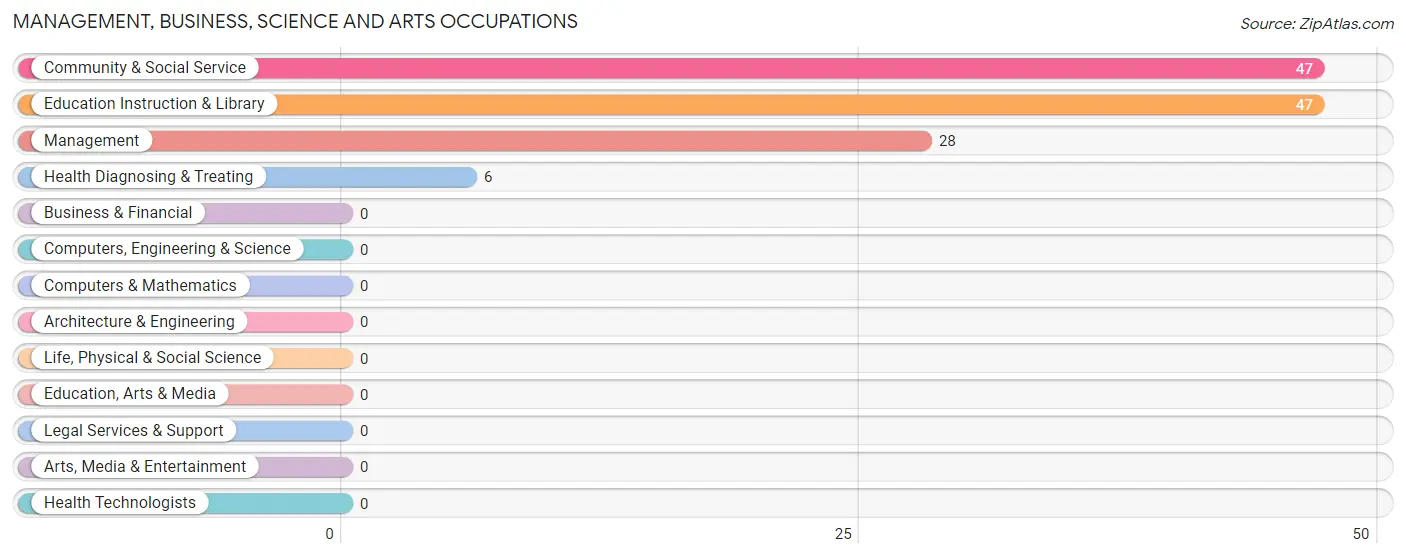
Management, Business, Science and Arts Occupations by Sex
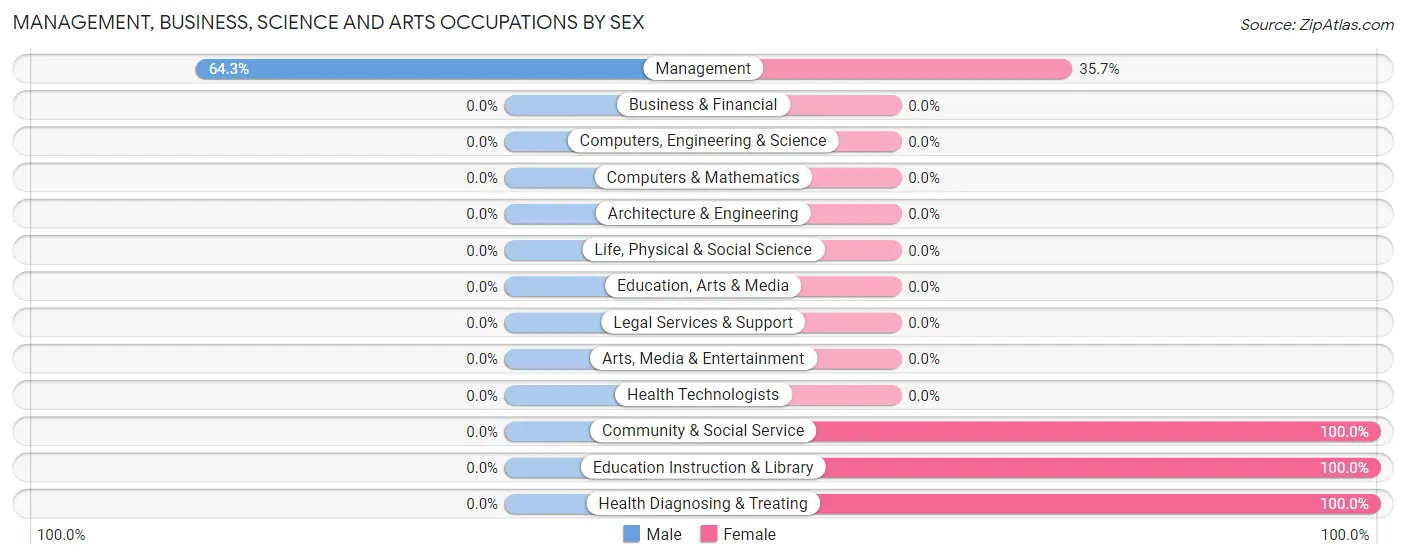
| Occupation | Male | Female |
| Management | 18 (64.3%) | 10 (35.7%) |
| Business & Financial | 0 (0.0%) | 0 (0.0%) |
| Computers, Engineering & Science | 0 (0.0%) | 0 (0.0%) |
| Computers & Mathematics | 0 (0.0%) | 0 (0.0%) |
| Architecture & Engineering | 0 (0.0%) | 0 (0.0%) |
| Life, Physical & Social Science | 0 (0.0%) | 0 (0.0%) |
| Community & Social Service | 0 (0.0%) | 47 (100.0%) |
| Education, Arts & Media | 0 (0.0%) | 0 (0.0%) |
| Legal Services & Support | 0 (0.0%) | 0 (0.0%) |
| Education Instruction & Library | 0 (0.0%) | 47 (100.0%) |
| Arts, Media & Entertainment | 0 (0.0%) | 0 (0.0%) |
| Health Diagnosing & Treating | 0 (0.0%) | 6 (100.0%) |
| Health Technologists | 0 (0.0%) | 0 (0.0%) |
| Total (Category) | 18 (22.2%) | 63 (77.8%) |
| Total (Overall) | 197 (63.7%) | 112 (36.2%) |
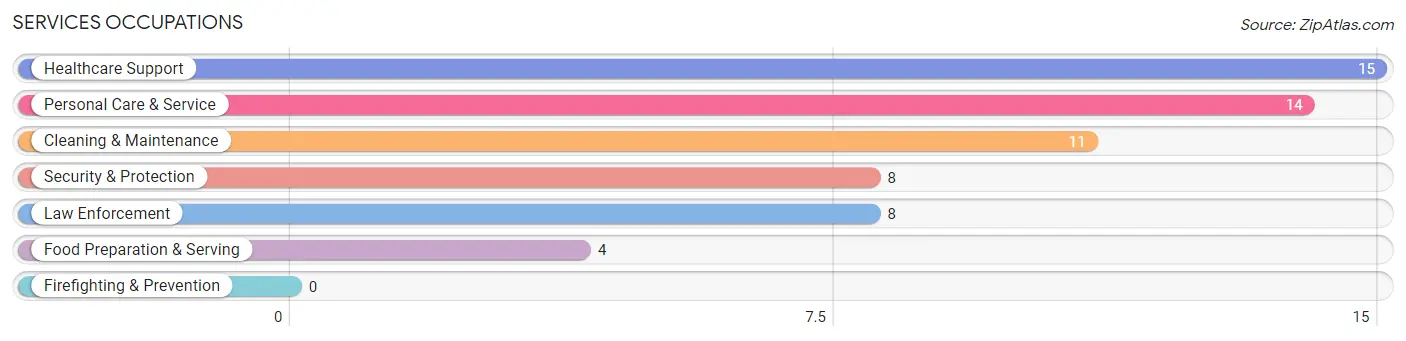
Services Occupations
The most common Services occupations in Prospect are Healthcare Support (15 | 4.9%), Personal Care & Service (14 | 4.5%), Cleaning & Maintenance (11 | 3.6%), Security & Protection (8 | 2.6%), and Law Enforcement (8 | 2.6%).
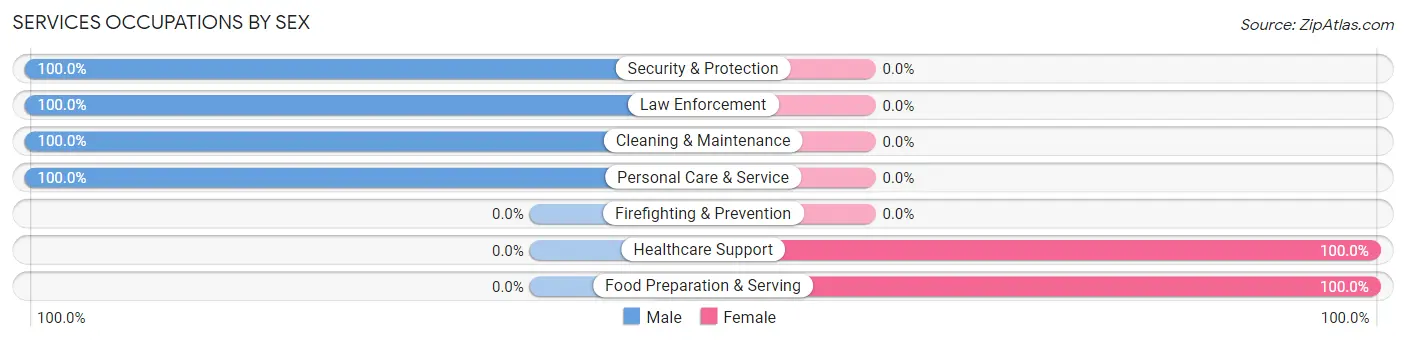
Services Occupations by Sex
Within the Services occupations in Prospect, the most male-oriented occupations are Security & Protection (100.0%), Law Enforcement (100.0%), and Cleaning & Maintenance (100.0%), while the most female-oriented occupations are Healthcare Support (100.0%), and Food Preparation & Serving (100.0%).
| Occupation | Male | Female |
| Healthcare Support | 0 (0.0%) | 15 (100.0%) |
| Security & Protection | 8 (100.0%) | 0 (0.0%) |
| Firefighting & Prevention | 0 (0.0%) | 0 (0.0%) |
| Law Enforcement | 8 (100.0%) | 0 (0.0%) |
| Food Preparation & Serving | 0 (0.0%) | 4 (100.0%) |
| Cleaning & Maintenance | 11 (100.0%) | 0 (0.0%) |
| Personal Care & Service | 14 (100.0%) | 0 (0.0%) |
| Total (Category) | 33 (63.5%) | 19 (36.5%) |
| Total (Overall) | 197 (63.7%) | 112 (36.2%) |
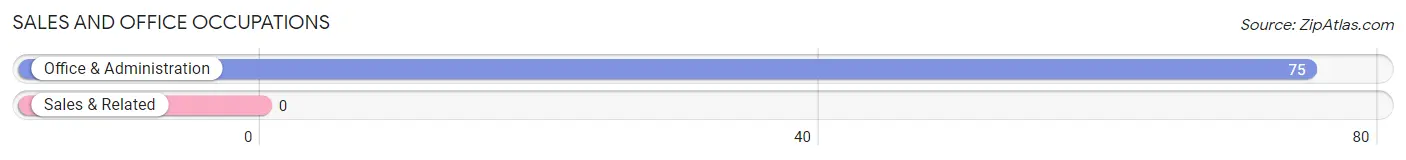
Sales and Office Occupations
The most common Sales and Office occupations in Prospect are , and Office & Administration (75 | 24.3%).
Sales and Office Occupations by Sex
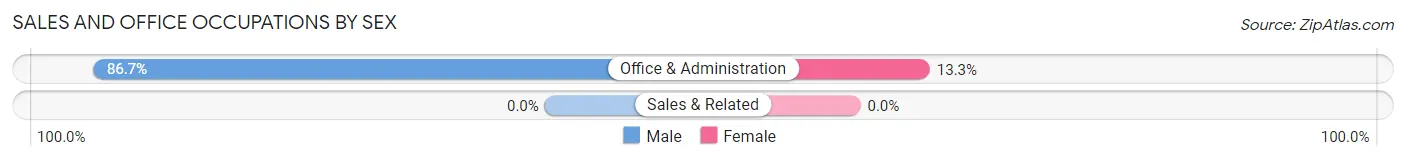
| Occupation | Male | Female |
| Sales & Related | 0 (0.0%) | 0 (0.0%) |
| Office & Administration | 65 (86.7%) | 10 (13.3%) |
| Total (Category) | 65 (86.7%) | 10 (13.3%) |
| Total (Overall) | 197 (63.7%) | 112 (36.2%) |
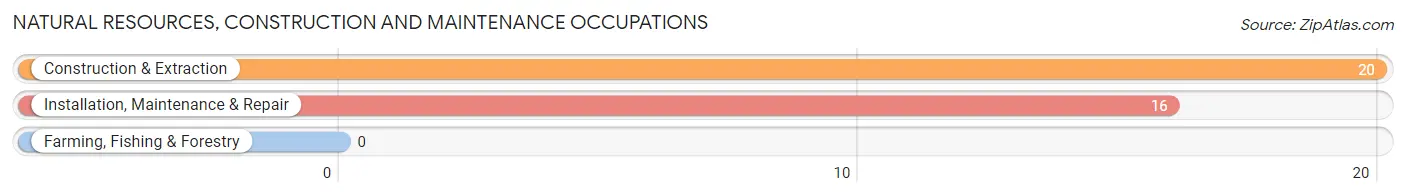
Natural Resources, Construction and Maintenance Occupations
The most common Natural Resources, Construction and Maintenance occupations in Prospect are Construction & Extraction (20 | 6.5%), and Installation, Maintenance & Repair (16 | 5.2%).
Natural Resources, Construction and Maintenance Occupations by Sex
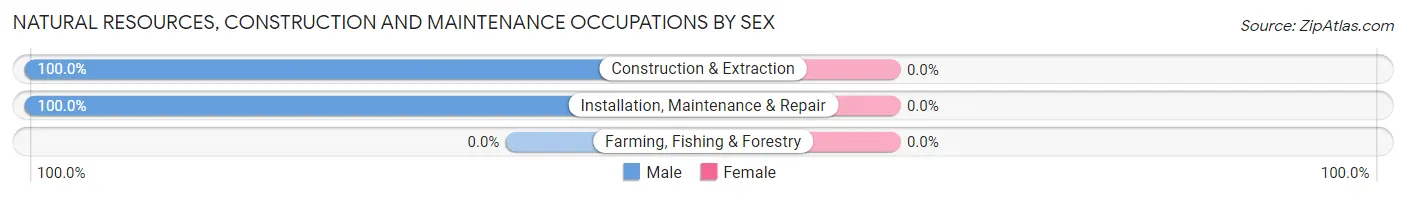
| Occupation | Male | Female |
| Farming, Fishing & Forestry | 0 (0.0%) | 0 (0.0%) |
| Construction & Extraction | 20 (100.0%) | 0 (0.0%) |
| Installation, Maintenance & Repair | 16 (100.0%) | 0 (0.0%) |
| Total (Category) | 36 (100.0%) | 0 (0.0%) |
| Total (Overall) | 197 (63.7%) | 112 (36.2%) |
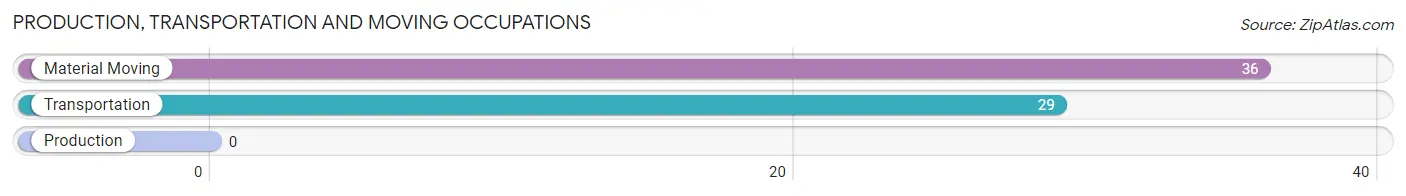
Production, Transportation and Moving Occupations
The most common Production, Transportation and Moving occupations in Prospect are Material Moving (36 | 11.7%), and Transportation (29 | 9.4%).
Production, Transportation and Moving Occupations by Sex
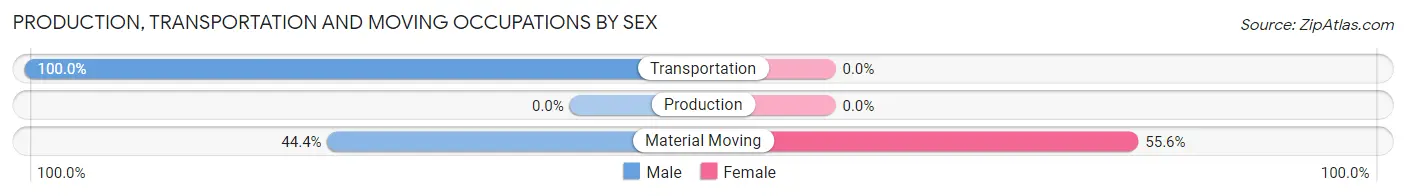
| Occupation | Male | Female |
| Production | 0 (0.0%) | 0 (0.0%) |
| Transportation | 29 (100.0%) | 0 (0.0%) |
| Material Moving | 16 (44.4%) | 20 (55.6%) |
| Total (Category) | 45 (69.2%) | 20 (30.8%) |
| Total (Overall) | 197 (63.7%) | 112 (36.2%) |
Employment Industries by Sex in Prospect
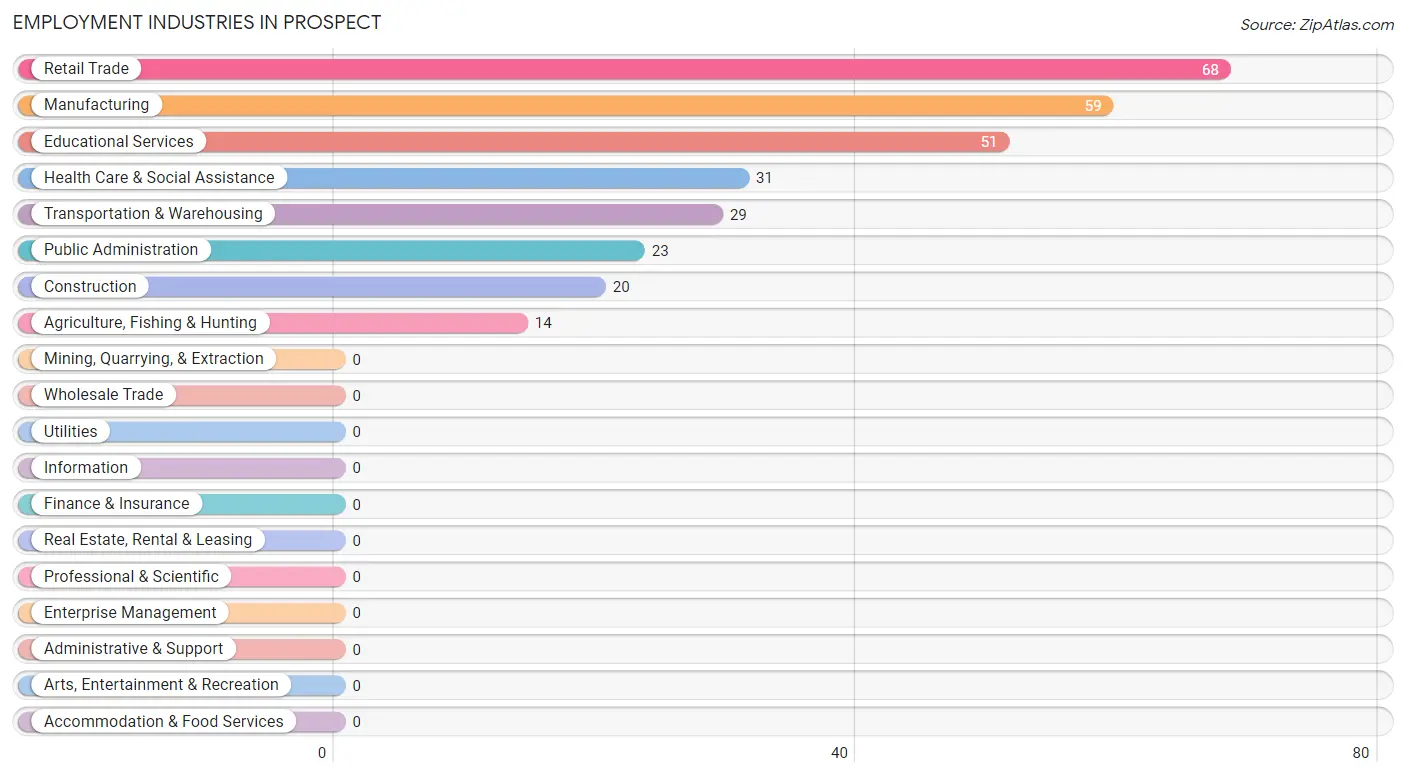
Employment Industries in Prospect
The major employment industries in Prospect include Retail Trade (68 | 22.0%), Manufacturing (59 | 19.1%), Educational Services (51 | 16.5%), Health Care & Social Assistance (31 | 10.0%), and Transportation & Warehousing (29 | 9.4%).
Employment Industries by Sex in Prospect
The Prospect industries that see more men than women are Agriculture, Fishing & Hunting (100.0%), Construction (100.0%), and Transportation & Warehousing (100.0%), whereas the industries that tend to have a higher number of women are Educational Services (100.0%), Health Care & Social Assistance (100.0%), and Manufacturing (33.9%).
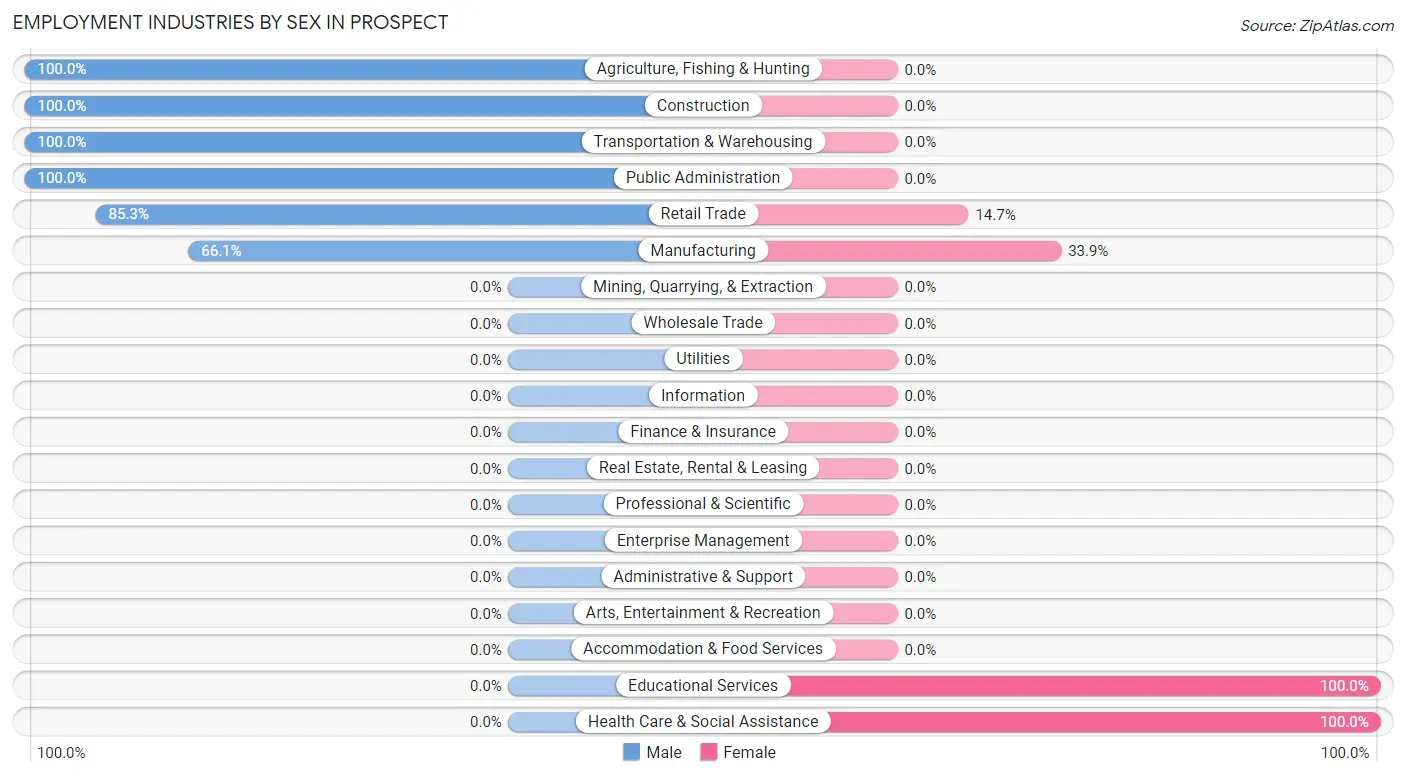
| Industry | Male | Female |
| Agriculture, Fishing & Hunting | 14 (100.0%) | 0 (0.0%) |
| Mining, Quarrying, & Extraction | 0 (0.0%) | 0 (0.0%) |
| Construction | 20 (100.0%) | 0 (0.0%) |
| Manufacturing | 39 (66.1%) | 20 (33.9%) |
| Wholesale Trade | 0 (0.0%) | 0 (0.0%) |
| Retail Trade | 58 (85.3%) | 10 (14.7%) |
| Transportation & Warehousing | 29 (100.0%) | 0 (0.0%) |
| Utilities | 0 (0.0%) | 0 (0.0%) |
| Information | 0 (0.0%) | 0 (0.0%) |
| Finance & Insurance | 0 (0.0%) | 0 (0.0%) |
| Real Estate, Rental & Leasing | 0 (0.0%) | 0 (0.0%) |
| Professional & Scientific | 0 (0.0%) | 0 (0.0%) |
| Enterprise Management | 0 (0.0%) | 0 (0.0%) |
| Administrative & Support | 0 (0.0%) | 0 (0.0%) |
| Educational Services | 0 (0.0%) | 51 (100.0%) |
| Health Care & Social Assistance | 0 (0.0%) | 31 (100.0%) |
| Arts, Entertainment & Recreation | 0 (0.0%) | 0 (0.0%) |
| Accommodation & Food Services | 0 (0.0%) | 0 (0.0%) |
| Public Administration | 23 (100.0%) | 0 (0.0%) |
| Total | 197 (63.7%) | 112 (36.2%) |
Education in Prospect
School Enrollment in Prospect
The most common levels of schooling among the 177 students in Prospect are college / undergraduate (77 | 43.5%), high school (55 | 31.1%), and elementary school (32 | 18.1%).
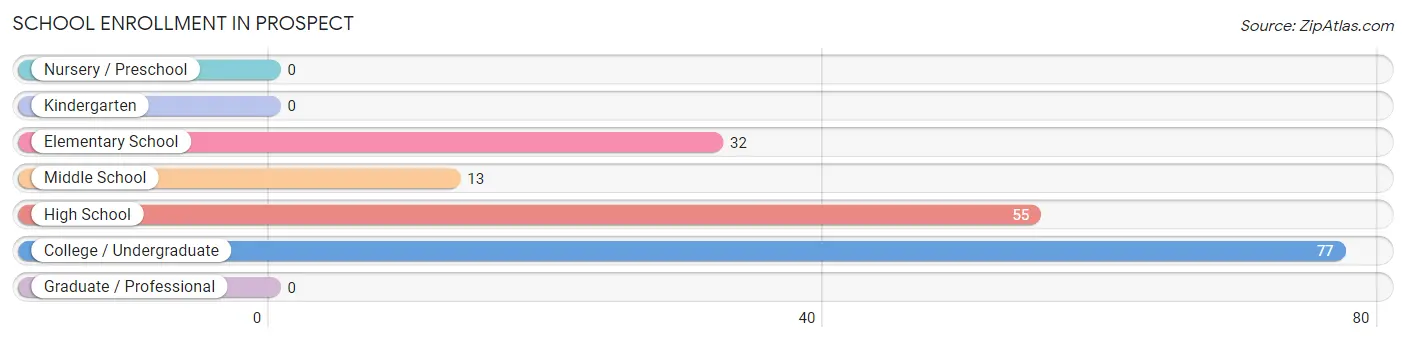
| School Level | # Students | % Students |
| Nursery / Preschool | 0 | 0.0% |
| Kindergarten | 0 | 0.0% |
| Elementary School | 32 | 18.1% |
| Middle School | 13 | 7.3% |
| High School | 55 | 31.1% |
| College / Undergraduate | 77 | 43.5% |
| Graduate / Professional | 0 | 0.0% |
| Total | 177 | 100.0% |
School Enrollment by Age by Funding Source in Prospect
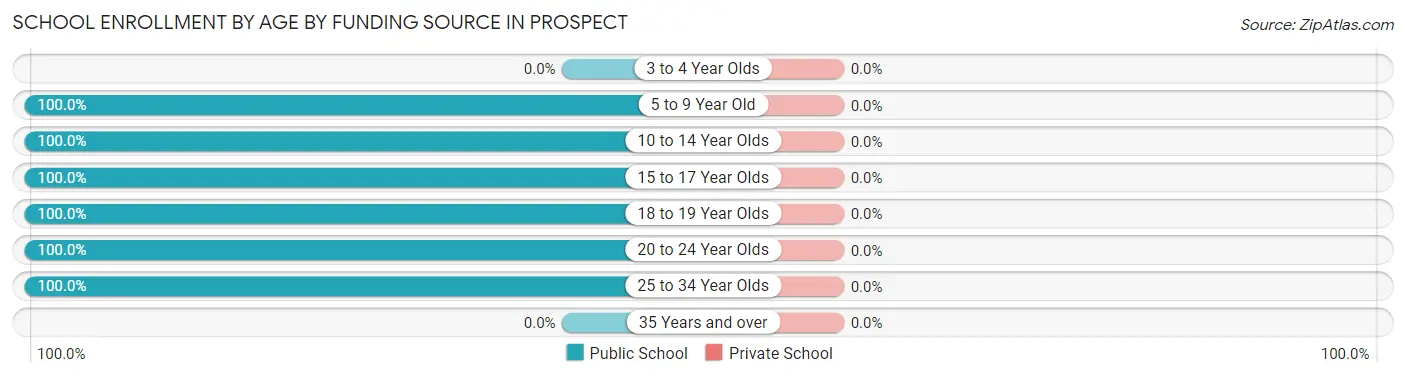
| Age Bracket | Public School | Private School |
| 3 to 4 Year Olds | 0 (0.0%) | 0 (0.0%) |
| 5 to 9 Year Old | 32 (100.0%) | 0 (0.0%) |
| 10 to 14 Year Olds | 13 (100.0%) | 0 (0.0%) |
| 15 to 17 Year Olds | 55 (100.0%) | 0 (0.0%) |
| 18 to 19 Year Olds | 25 (100.0%) | 0 (0.0%) |
| 20 to 24 Year Olds | 10 (100.0%) | 0 (0.0%) |
| 25 to 34 Year Olds | 42 (100.0%) | 0 (0.0%) |
| 35 Years and over | 0 (0.0%) | 0 (0.0%) |
| Total | 177 (100.0%) | 0 (0.0%) |
Educational Attainment by Field of Study in Prospect
Education (61 | 41.8%), arts & humanities (24 | 16.4%), engineering (17 | 11.6%), bio, nature & agricultural (14 | 9.6%), and computers & mathematics (13 | 8.9%) are the most common fields of study among 146 individuals in Prospect who have obtained a bachelor's degree or higher.
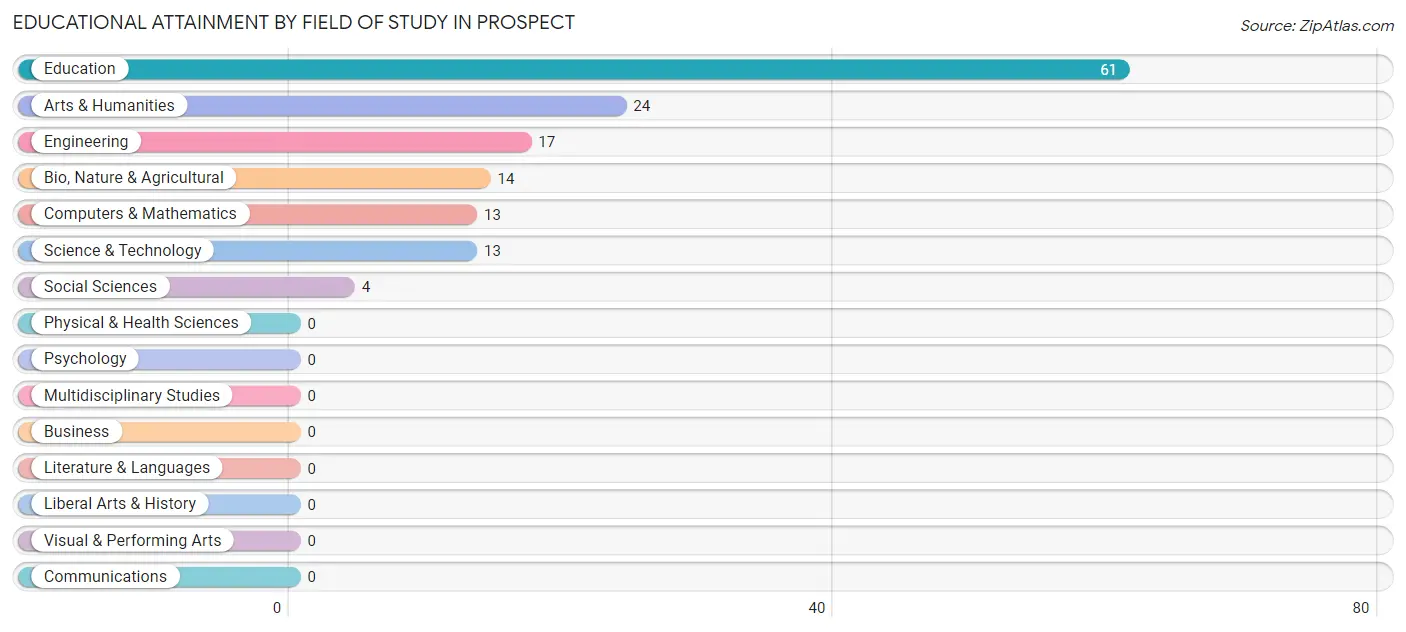
| Field of Study | # Graduates | % Graduates |
| Computers & Mathematics | 13 | 8.9% |
| Bio, Nature & Agricultural | 14 | 9.6% |
| Physical & Health Sciences | 0 | 0.0% |
| Psychology | 0 | 0.0% |
| Social Sciences | 4 | 2.7% |
| Engineering | 17 | 11.6% |
| Multidisciplinary Studies | 0 | 0.0% |
| Science & Technology | 13 | 8.9% |
| Business | 0 | 0.0% |
| Education | 61 | 41.8% |
| Literature & Languages | 0 | 0.0% |
| Liberal Arts & History | 0 | 0.0% |
| Visual & Performing Arts | 0 | 0.0% |
| Communications | 0 | 0.0% |
| Arts & Humanities | 24 | 16.4% |
| Total | 146 | 100.0% |
Transportation & Commute in Prospect
Vehicle Availability by Sex in Prospect
The most prevalent vehicle ownership categories in Prospect are males with 5 or more vehicles (84, accounting for 42.6%) and females with 5 or more vehicles (41, making up 82.4%).
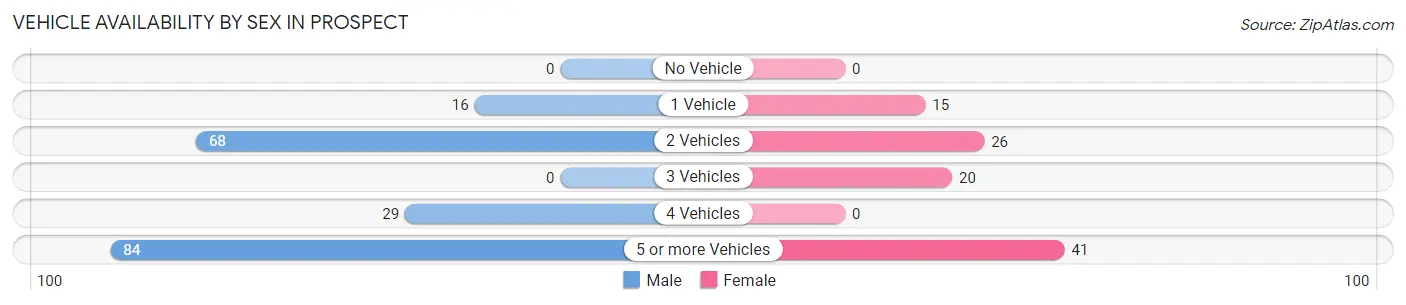
| Vehicles Available | Male | Female |
| No Vehicle | 0 (0.0%) | 0 (0.0%) |
| 1 Vehicle | 16 (8.1%) | 15 (14.7%) |
| 2 Vehicles | 68 (34.5%) | 26 (25.5%) |
| 3 Vehicles | 0 (0.0%) | 20 (19.6%) |
| 4 Vehicles | 29 (14.7%) | 0 (0.0%) |
| 5 or more Vehicles | 84 (42.6%) | 41 (40.2%) |
| Total | 197 (100.0%) | 102 (100.0%) |
Commute Time in Prospect
The most frequently occuring commute durations in Prospect are 10 to 14 minutes (86 commuters, 29.8%), 15 to 19 minutes (48 commuters, 16.6%), and 45 to 59 minutes (34 commuters, 11.8%).
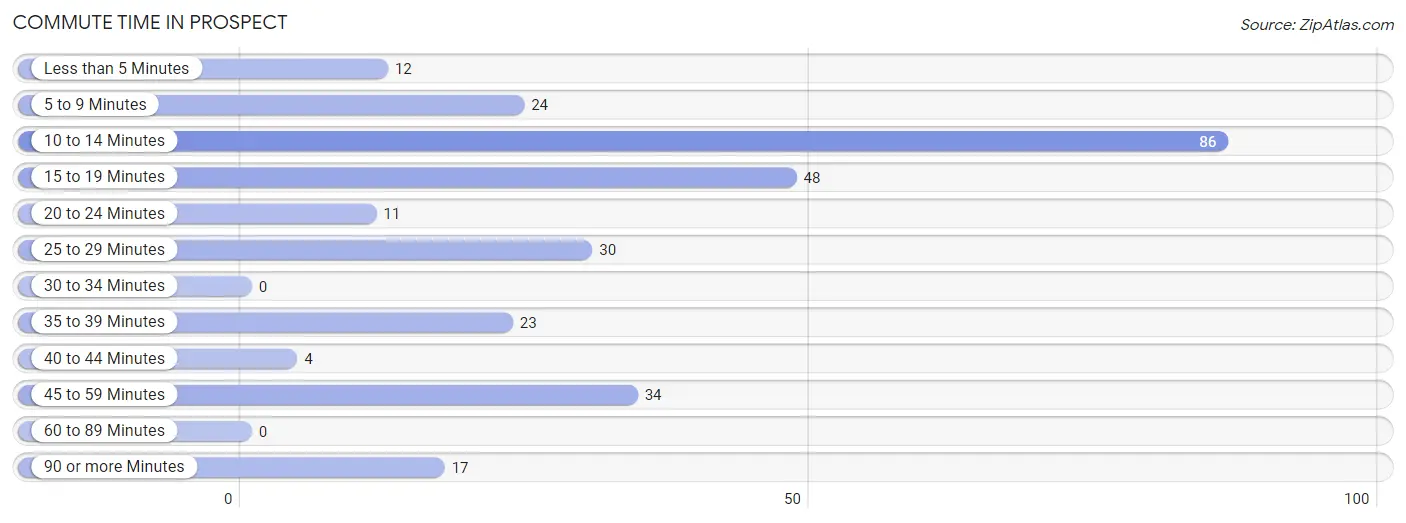
| Commute Time | # Commuters | % Commuters |
| Less than 5 Minutes | 12 | 4.2% |
| 5 to 9 Minutes | 24 | 8.3% |
| 10 to 14 Minutes | 86 | 29.8% |
| 15 to 19 Minutes | 48 | 16.6% |
| 20 to 24 Minutes | 11 | 3.8% |
| 25 to 29 Minutes | 30 | 10.4% |
| 30 to 34 Minutes | 0 | 0.0% |
| 35 to 39 Minutes | 23 | 8.0% |
| 40 to 44 Minutes | 4 | 1.4% |
| 45 to 59 Minutes | 34 | 11.8% |
| 60 to 89 Minutes | 0 | 0.0% |
| 90 or more Minutes | 17 | 5.9% |
Commute Time by Sex in Prospect
The most common commute times in Prospect are 10 to 14 minutes (56 commuters, 28.4%) for males and 15 to 19 minutes (32 commuters, 34.8%) for females.
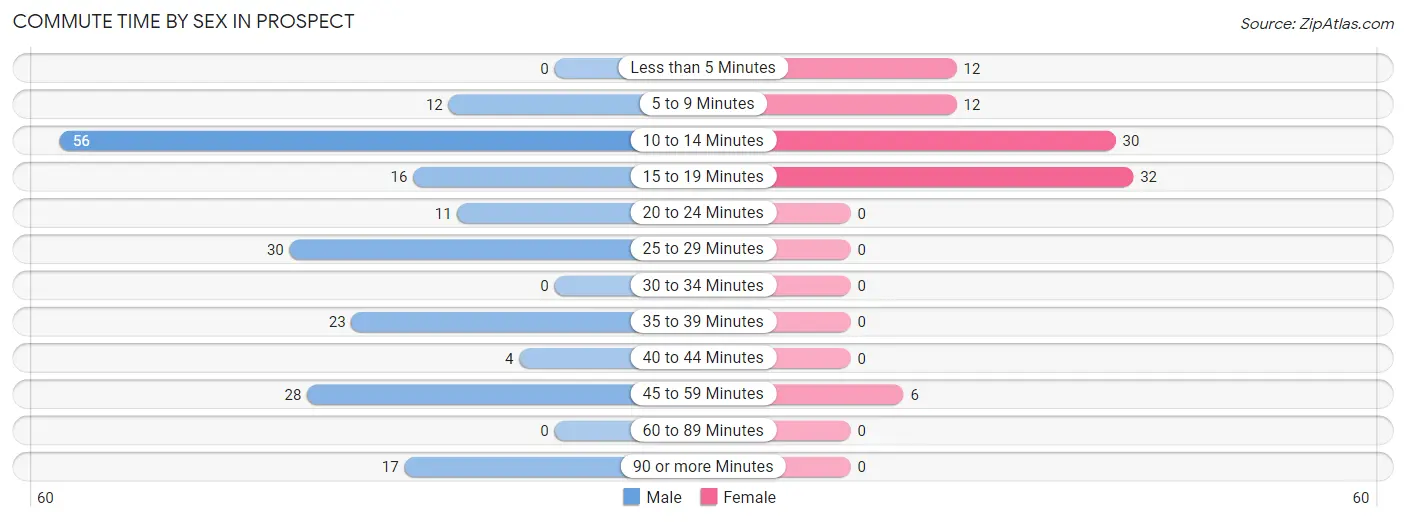
| Commute Time | Male | Female |
| Less than 5 Minutes | 0 (0.0%) | 12 (13.0%) |
| 5 to 9 Minutes | 12 (6.1%) | 12 (13.0%) |
| 10 to 14 Minutes | 56 (28.4%) | 30 (32.6%) |
| 15 to 19 Minutes | 16 (8.1%) | 32 (34.8%) |
| 20 to 24 Minutes | 11 (5.6%) | 0 (0.0%) |
| 25 to 29 Minutes | 30 (15.2%) | 0 (0.0%) |
| 30 to 34 Minutes | 0 (0.0%) | 0 (0.0%) |
| 35 to 39 Minutes | 23 (11.7%) | 0 (0.0%) |
| 40 to 44 Minutes | 4 (2.0%) | 0 (0.0%) |
| 45 to 59 Minutes | 28 (14.2%) | 6 (6.5%) |
| 60 to 89 Minutes | 0 (0.0%) | 0 (0.0%) |
| 90 or more Minutes | 17 (8.6%) | 0 (0.0%) |
Time of Departure to Work by Sex in Prospect
The most frequent times of departure to work in Prospect are 12:00 AM to 4:59 AM (77, 39.1%) for males and 7:00 AM to 7:29 AM (35, 38.0%) for females.
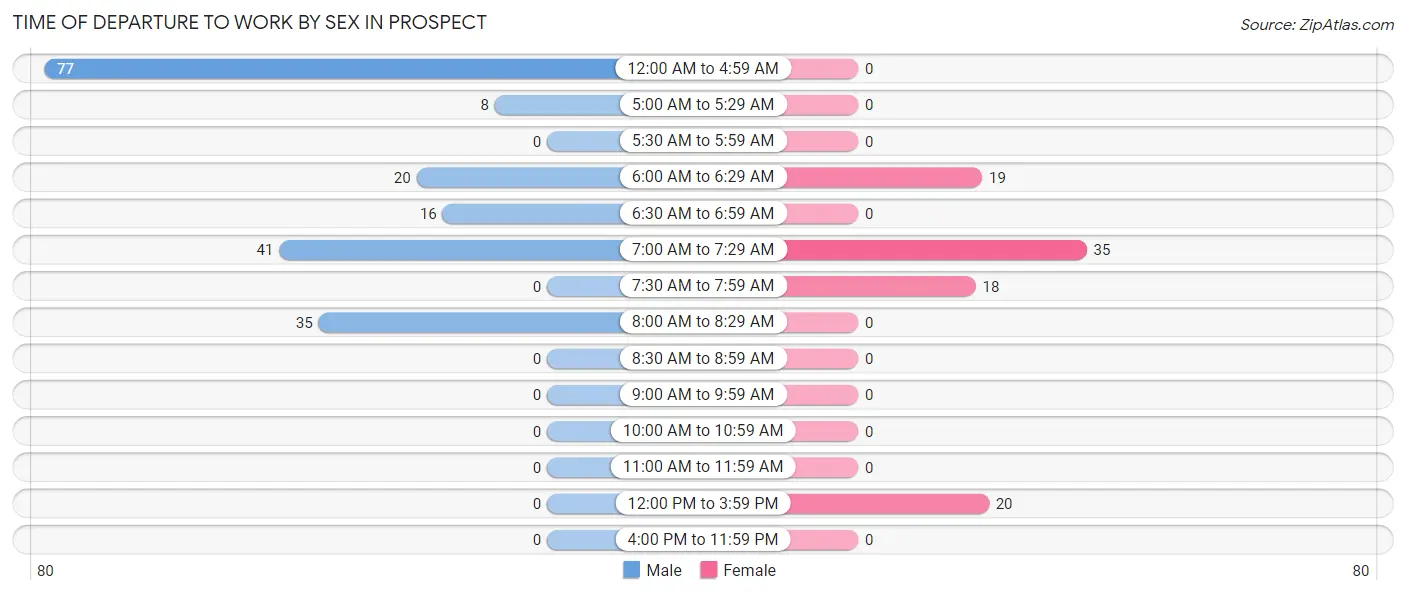
| Time of Departure | Male | Female |
| 12:00 AM to 4:59 AM | 77 (39.1%) | 0 (0.0%) |
| 5:00 AM to 5:29 AM | 8 (4.1%) | 0 (0.0%) |
| 5:30 AM to 5:59 AM | 0 (0.0%) | 0 (0.0%) |
| 6:00 AM to 6:29 AM | 20 (10.2%) | 19 (20.6%) |
| 6:30 AM to 6:59 AM | 16 (8.1%) | 0 (0.0%) |
| 7:00 AM to 7:29 AM | 41 (20.8%) | 35 (38.0%) |
| 7:30 AM to 7:59 AM | 0 (0.0%) | 18 (19.6%) |
| 8:00 AM to 8:29 AM | 35 (17.8%) | 0 (0.0%) |
| 8:30 AM to 8:59 AM | 0 (0.0%) | 0 (0.0%) |
| 9:00 AM to 9:59 AM | 0 (0.0%) | 0 (0.0%) |
| 10:00 AM to 10:59 AM | 0 (0.0%) | 0 (0.0%) |
| 11:00 AM to 11:59 AM | 0 (0.0%) | 0 (0.0%) |
| 12:00 PM to 3:59 PM | 0 (0.0%) | 20 (21.7%) |
| 4:00 PM to 11:59 PM | 0 (0.0%) | 0 (0.0%) |
| Total | 197 (100.0%) | 92 (100.0%) |
Housing Occupancy in Prospect
Occupancy by Ownership in Prospect
Of the total 230 dwellings in Prospect, owner-occupied units account for 194 (84.4%), while renter-occupied units make up 36 (15.7%).
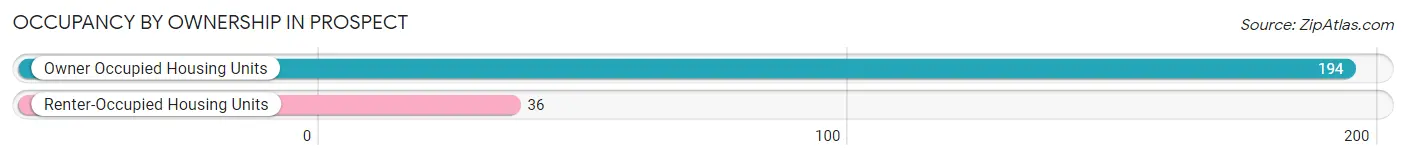
| Occupancy | # Housing Units | % Housing Units |
| Owner Occupied Housing Units | 194 | 84.4% |
| Renter-Occupied Housing Units | 36 | 15.7% |
| Total Occupied Housing Units | 230 | 100.0% |
Occupancy by Household Size in Prospect
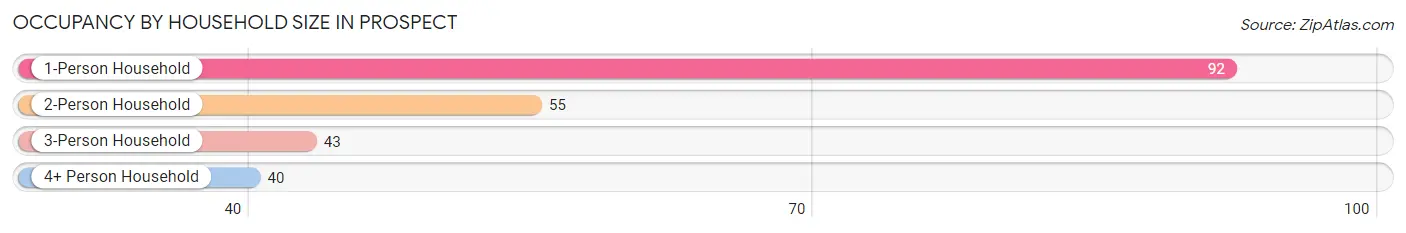
| Household Size | # Housing Units | % Housing Units |
| 1-Person Household | 92 | 40.0% |
| 2-Person Household | 55 | 23.9% |
| 3-Person Household | 43 | 18.7% |
| 4+ Person Household | 40 | 17.4% |
| Total Housing Units | 230 | 100.0% |
Occupancy by Ownership by Household Size in Prospect
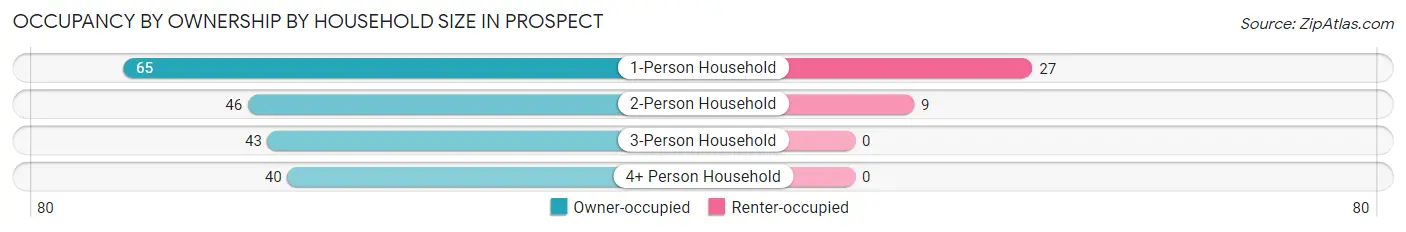
| Household Size | Owner-occupied | Renter-occupied |
| 1-Person Household | 65 (70.7%) | 27 (29.3%) |
| 2-Person Household | 46 (83.6%) | 9 (16.4%) |
| 3-Person Household | 43 (100.0%) | 0 (0.0%) |
| 4+ Person Household | 40 (100.0%) | 0 (0.0%) |
| Total Housing Units | 194 (84.4%) | 36 (15.7%) |
Occupancy by Educational Attainment in Prospect
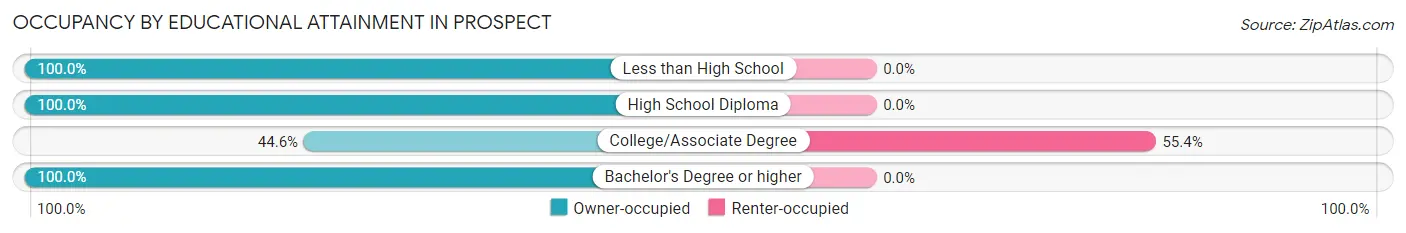
| Household Size | Owner-occupied | Renter-occupied |
| Less than High School | 10 (100.0%) | 0 (0.0%) |
| High School Diploma | 83 (100.0%) | 0 (0.0%) |
| College/Associate Degree | 29 (44.6%) | 36 (55.4%) |
| Bachelor's Degree or higher | 72 (100.0%) | 0 (0.0%) |
Occupancy by Age of Householder in Prospect
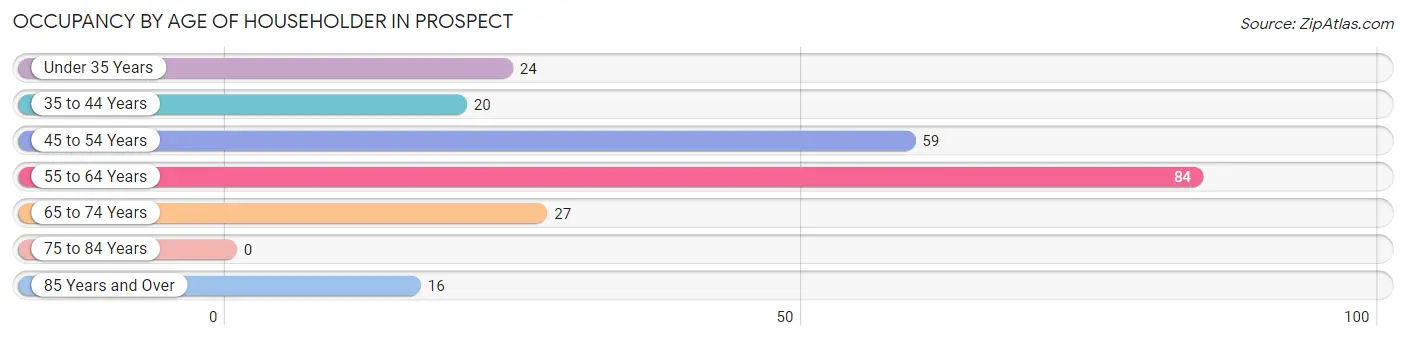
| Age Bracket | # Households | % Households |
| Under 35 Years | 24 | 10.4% |
| 35 to 44 Years | 20 | 8.7% |
| 45 to 54 Years | 59 | 25.7% |
| 55 to 64 Years | 84 | 36.5% |
| 65 to 74 Years | 27 | 11.7% |
| 75 to 84 Years | 0 | 0.0% |
| 85 Years and Over | 16 | 7.0% |
| Total | 230 | 100.0% |
Housing Finances in Prospect
Median Income by Occupancy in Prospect
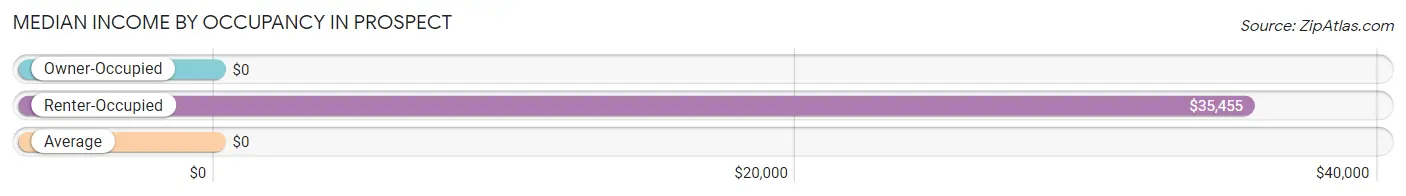
| Occupancy Type | # Households | Median Income |
| Owner-Occupied | 194 (84.4%) | $0 |
| Renter-Occupied | 36 (15.7%) | $35,455 |
| Average | 230 (100.0%) | $0 |
Occupancy by Householder Income Bracket in Prospect
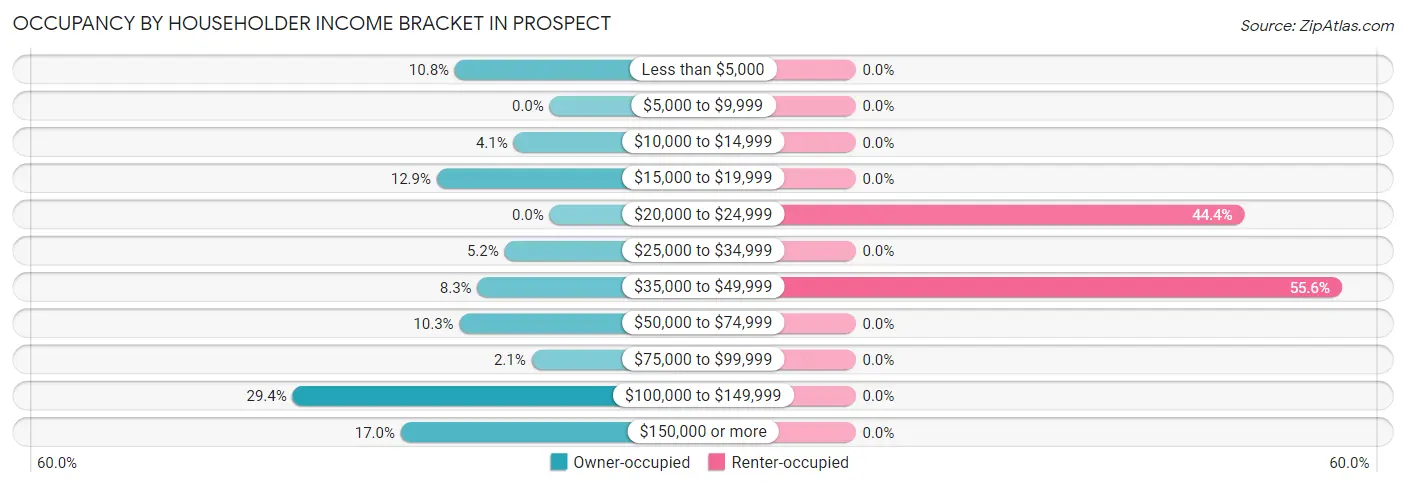
| Income Bracket | Owner-occupied | Renter-occupied |
| Less than $5,000 | 21 (10.8%) | 0 (0.0%) |
| $5,000 to $9,999 | 0 (0.0%) | 0 (0.0%) |
| $10,000 to $14,999 | 8 (4.1%) | 0 (0.0%) |
| $15,000 to $19,999 | 25 (12.9%) | 0 (0.0%) |
| $20,000 to $24,999 | 0 (0.0%) | 16 (44.4%) |
| $25,000 to $34,999 | 10 (5.1%) | 0 (0.0%) |
| $35,000 to $49,999 | 16 (8.3%) | 20 (55.6%) |
| $50,000 to $74,999 | 20 (10.3%) | 0 (0.0%) |
| $75,000 to $99,999 | 4 (2.1%) | 0 (0.0%) |
| $100,000 to $149,999 | 57 (29.4%) | 0 (0.0%) |
| $150,000 or more | 33 (17.0%) | 0 (0.0%) |
| Total | 194 (100.0%) | 36 (100.0%) |
Monthly Housing Cost Tiers in Prospect
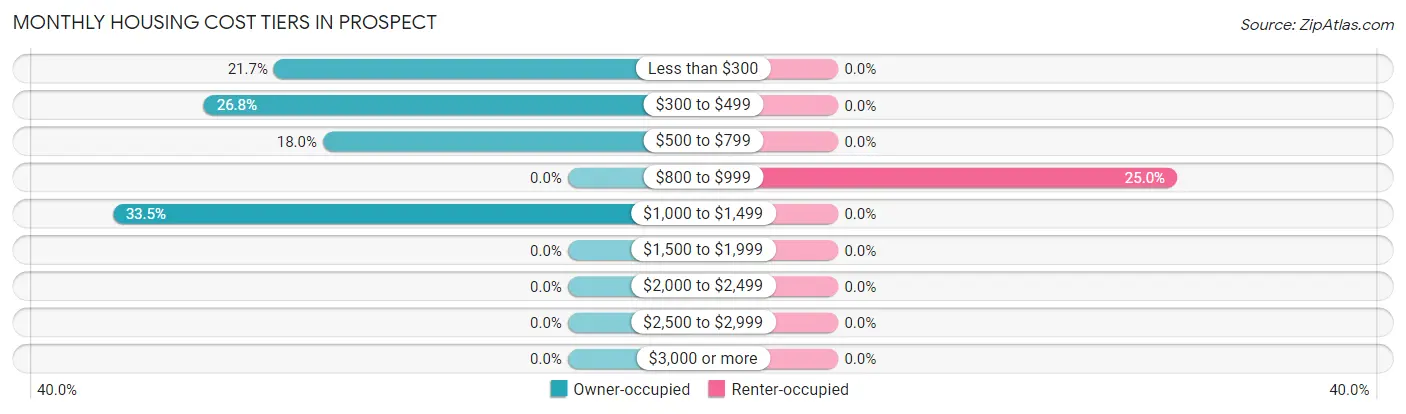
| Monthly Cost | Owner-occupied | Renter-occupied |
| Less than $300 | 42 (21.6%) | 0 (0.0%) |
| $300 to $499 | 52 (26.8%) | 0 (0.0%) |
| $500 to $799 | 35 (18.0%) | 0 (0.0%) |
| $800 to $999 | 0 (0.0%) | 9 (25.0%) |
| $1,000 to $1,499 | 65 (33.5%) | 0 (0.0%) |
| $1,500 to $1,999 | 0 (0.0%) | 0 (0.0%) |
| $2,000 to $2,499 | 0 (0.0%) | 0 (0.0%) |
| $2,500 to $2,999 | 0 (0.0%) | 0 (0.0%) |
| $3,000 or more | 0 (0.0%) | 0 (0.0%) |
| Total | 194 (100.0%) | 36 (100.0%) |
Physical Housing Characteristics in Prospect
Housing Structures in Prospect
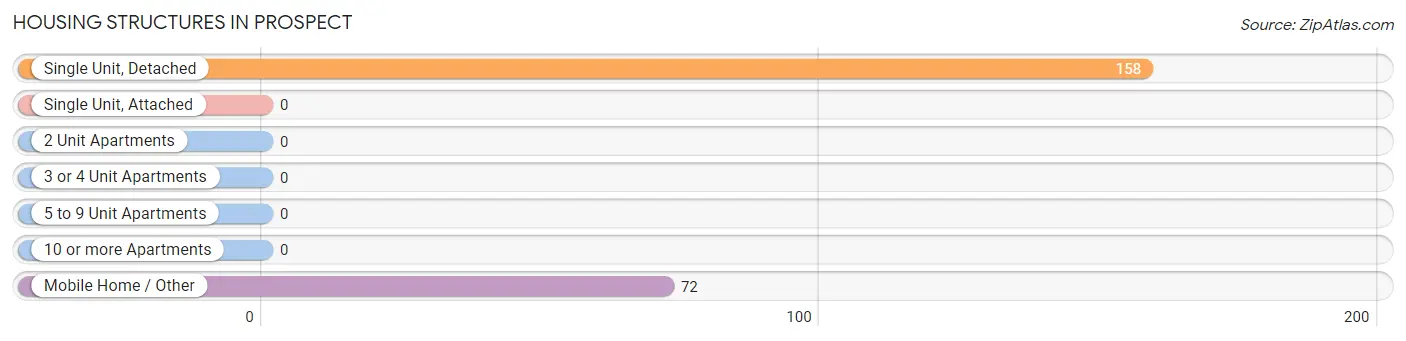
| Structure Type | # Housing Units | % Housing Units |
| Single Unit, Detached | 158 | 68.7% |
| Single Unit, Attached | 0 | 0.0% |
| 2 Unit Apartments | 0 | 0.0% |
| 3 or 4 Unit Apartments | 0 | 0.0% |
| 5 to 9 Unit Apartments | 0 | 0.0% |
| 10 or more Apartments | 0 | 0.0% |
| Mobile Home / Other | 72 | 31.3% |
| Total | 230 | 100.0% |
Housing Structures by Occupancy in Prospect
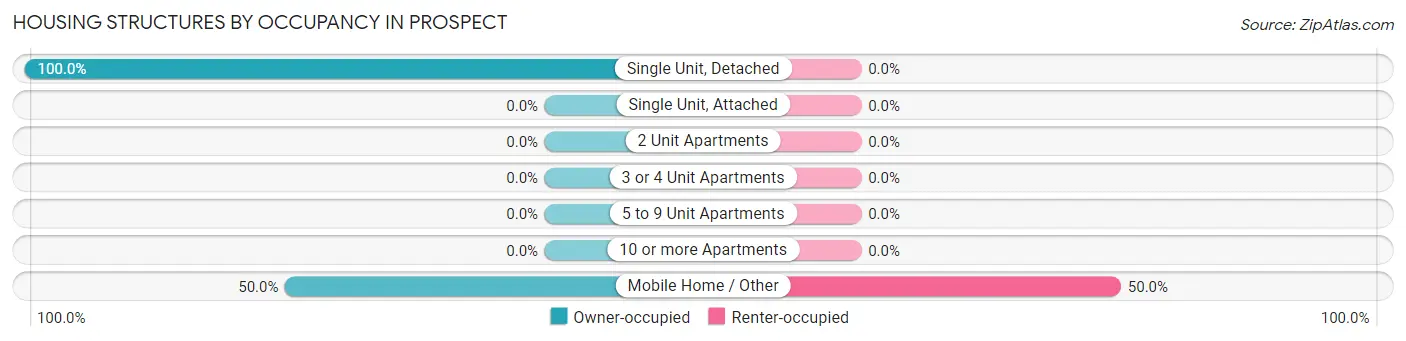
| Structure Type | Owner-occupied | Renter-occupied |
| Single Unit, Detached | 158 (100.0%) | 0 (0.0%) |
| Single Unit, Attached | 0 (0.0%) | 0 (0.0%) |
| 2 Unit Apartments | 0 (0.0%) | 0 (0.0%) |
| 3 or 4 Unit Apartments | 0 (0.0%) | 0 (0.0%) |
| 5 to 9 Unit Apartments | 0 (0.0%) | 0 (0.0%) |
| 10 or more Apartments | 0 (0.0%) | 0 (0.0%) |
| Mobile Home / Other | 36 (50.0%) | 36 (50.0%) |
| Total | 194 (84.4%) | 36 (15.7%) |
Housing Structures by Number of Rooms in Prospect
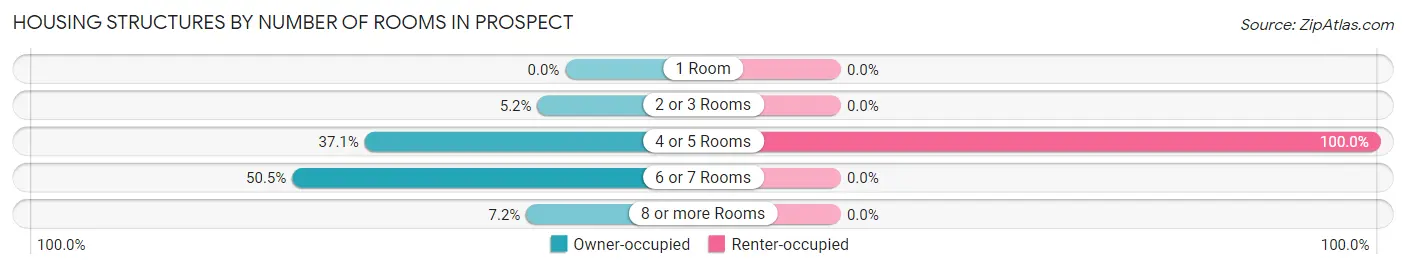
| Number of Rooms | Owner-occupied | Renter-occupied |
| 1 Room | 0 (0.0%) | 0 (0.0%) |
| 2 or 3 Rooms | 10 (5.1%) | 0 (0.0%) |
| 4 or 5 Rooms | 72 (37.1%) | 36 (100.0%) |
| 6 or 7 Rooms | 98 (50.5%) | 0 (0.0%) |
| 8 or more Rooms | 14 (7.2%) | 0 (0.0%) |
| Total | 194 (100.0%) | 36 (100.0%) |
Housing Structure by Heating Type in Prospect
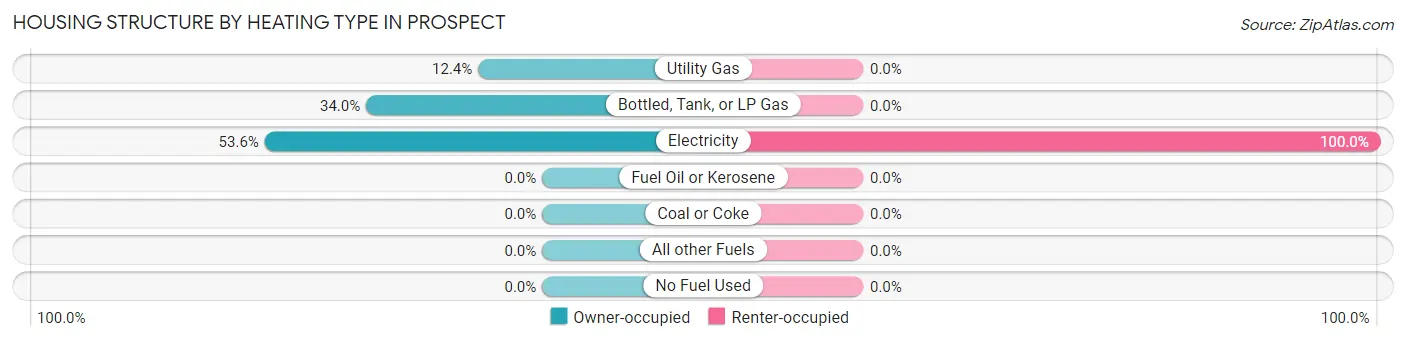
| Heating Type | Owner-occupied | Renter-occupied |
| Utility Gas | 24 (12.4%) | 0 (0.0%) |
| Bottled, Tank, or LP Gas | 66 (34.0%) | 0 (0.0%) |
| Electricity | 104 (53.6%) | 36 (100.0%) |
| Fuel Oil or Kerosene | 0 (0.0%) | 0 (0.0%) |
| Coal or Coke | 0 (0.0%) | 0 (0.0%) |
| All other Fuels | 0 (0.0%) | 0 (0.0%) |
| No Fuel Used | 0 (0.0%) | 0 (0.0%) |
| Total | 194 (100.0%) | 36 (100.0%) |
Household Vehicle Usage in Prospect
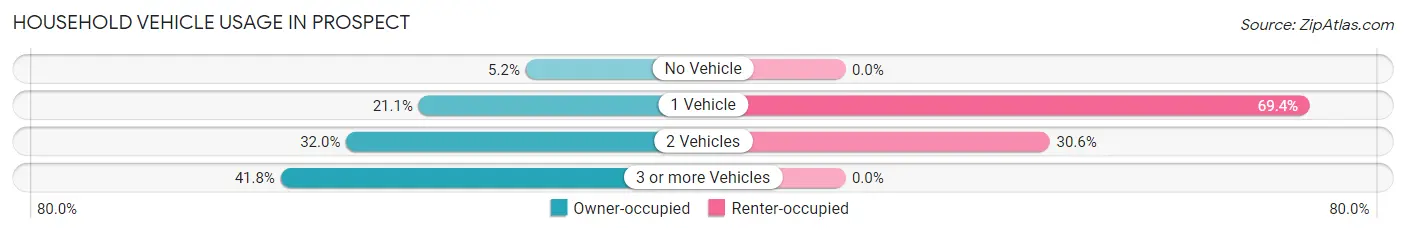
| Vehicles per Household | Owner-occupied | Renter-occupied |
| No Vehicle | 10 (5.1%) | 0 (0.0%) |
| 1 Vehicle | 41 (21.1%) | 25 (69.4%) |
| 2 Vehicles | 62 (32.0%) | 11 (30.6%) |
| 3 or more Vehicles | 81 (41.7%) | 0 (0.0%) |
| Total | 194 (100.0%) | 36 (100.0%) |
Real Estate & Mortgages in Prospect
Real Estate and Mortgage Overview in Prospect
| Characteristic | Without Mortgage | With Mortgage |
| Housing Units | 112 | 82 |
| Median Property Value | $51,900 | $160,700 |
| Median Household Income | - | - |
| Monthly Housing Costs | $368 | $0 |
| Real Estate Taxes | $533 | $25 |
Property Value by Mortgage Status in Prospect
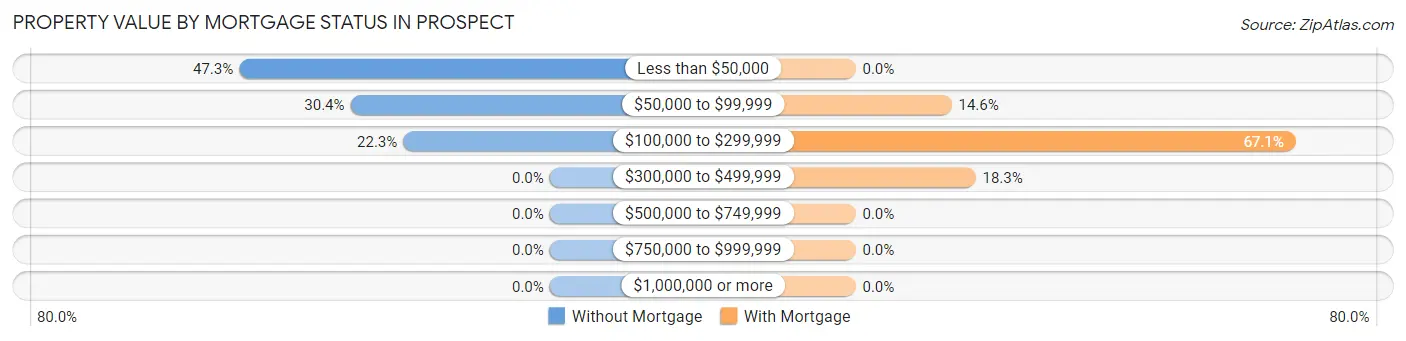
| Property Value | Without Mortgage | With Mortgage |
| Less than $50,000 | 53 (47.3%) | 0 (0.0%) |
| $50,000 to $99,999 | 34 (30.4%) | 12 (14.6%) |
| $100,000 to $299,999 | 25 (22.3%) | 55 (67.1%) |
| $300,000 to $499,999 | 0 (0.0%) | 15 (18.3%) |
| $500,000 to $749,999 | 0 (0.0%) | 0 (0.0%) |
| $750,000 to $999,999 | 0 (0.0%) | 0 (0.0%) |
| $1,000,000 or more | 0 (0.0%) | 0 (0.0%) |
| Total | 112 (100.0%) | 82 (100.0%) |
Household Income by Mortgage Status in Prospect
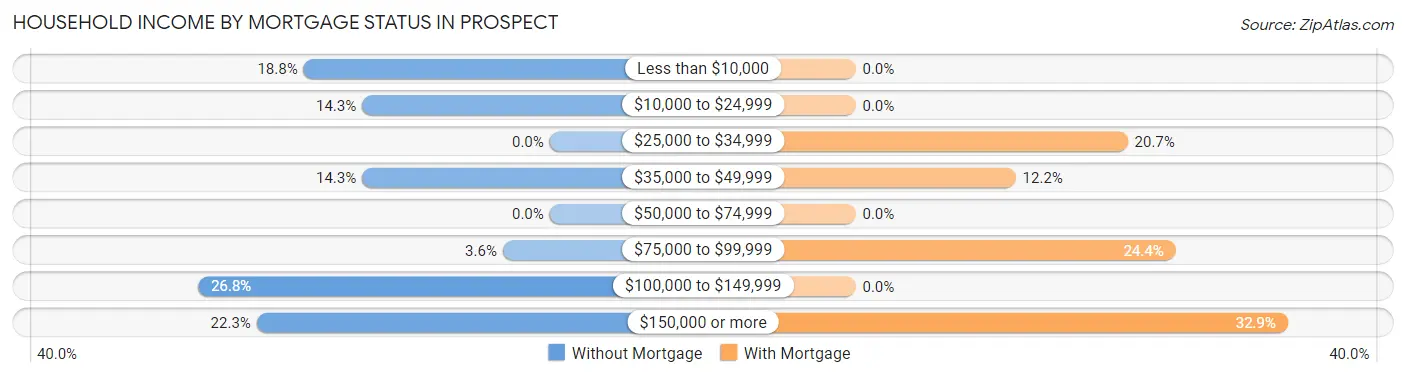
| Household Income | Without Mortgage | With Mortgage |
| Less than $10,000 | 21 (18.8%) | 0 (0.0%) |
| $10,000 to $24,999 | 16 (14.3%) | 0 (0.0%) |
| $25,000 to $34,999 | 0 (0.0%) | 17 (20.7%) |
| $35,000 to $49,999 | 16 (14.3%) | 10 (12.2%) |
| $50,000 to $74,999 | 0 (0.0%) | 0 (0.0%) |
| $75,000 to $99,999 | 4 (3.6%) | 20 (24.4%) |
| $100,000 to $149,999 | 30 (26.8%) | 0 (0.0%) |
| $150,000 or more | 25 (22.3%) | 27 (32.9%) |
| Total | 112 (100.0%) | 82 (100.0%) |
Property Value to Household Income Ratio in Prospect
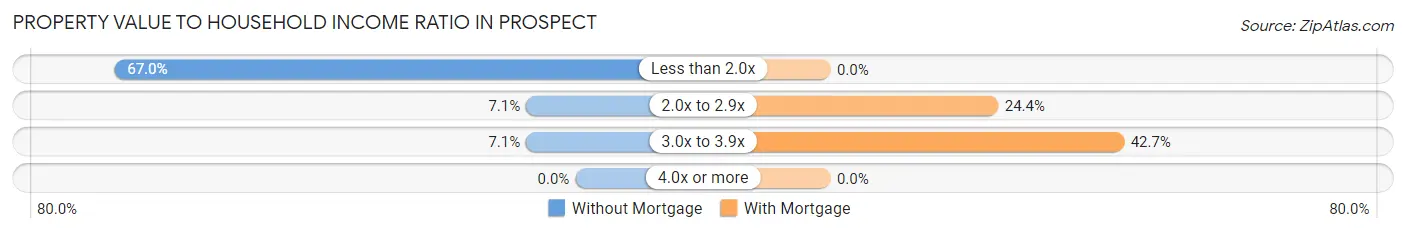
| Value-to-Income Ratio | Without Mortgage | With Mortgage |
| Less than 2.0x | 75 (67.0%) | 0 (0.0%) |
| 2.0x to 2.9x | 8 (7.1%) | 20 (24.4%) |
| 3.0x to 3.9x | 8 (7.1%) | 35 (42.7%) |
| 4.0x or more | 0 (0.0%) | 0 (0.0%) |
| Total | 112 (100.0%) | 82 (100.0%) |
Real Estate Taxes by Mortgage Status in Prospect
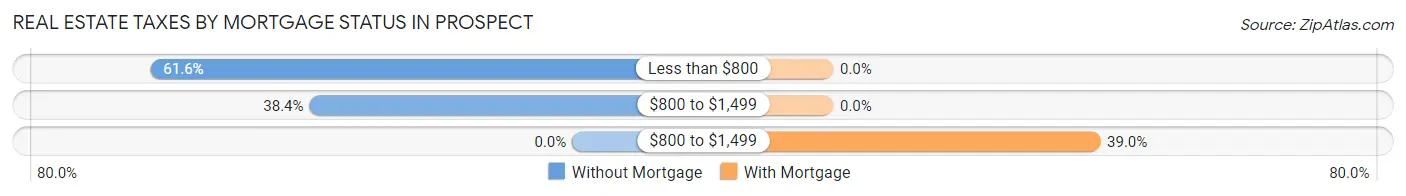
| Property Taxes | Without Mortgage | With Mortgage |
| Less than $800 | 69 (61.6%) | 0 (0.0%) |
| $800 to $1,499 | 43 (38.4%) | 0 (0.0%) |
| $800 to $1,499 | 0 (0.0%) | 32 (39.0%) |
| Total | 112 (100.0%) | 82 (100.0%) |
Health & Disability in Prospect
Health Insurance Coverage by Age in Prospect
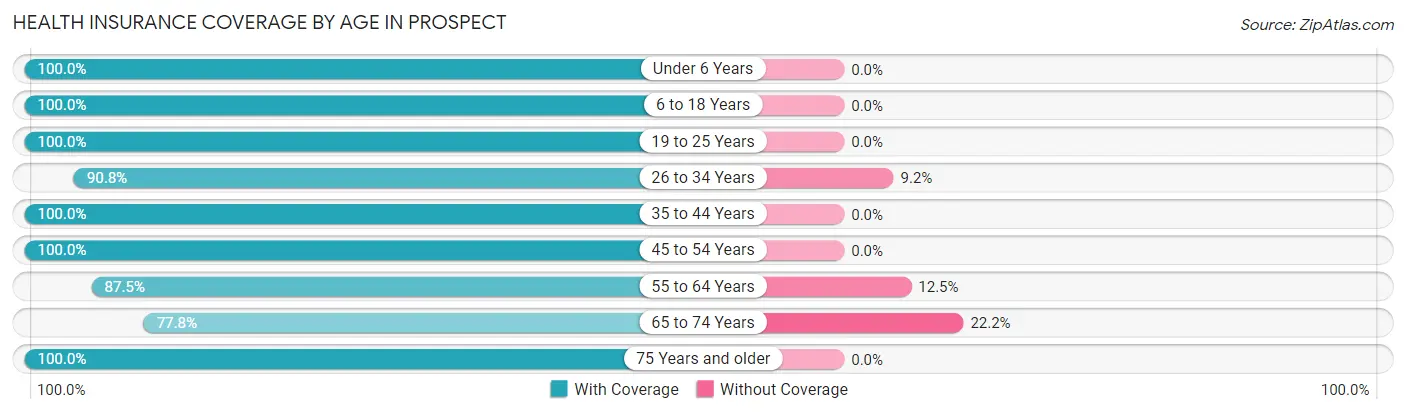
| Age Bracket | With Coverage | Without Coverage |
| Under 6 Years | 4 (100.0%) | 0 (0.0%) |
| 6 to 18 Years | 100 (100.0%) | 0 (0.0%) |
| 19 to 25 Years | 105 (100.0%) | 0 (0.0%) |
| 26 to 34 Years | 79 (90.8%) | 8 (9.2%) |
| 35 to 44 Years | 66 (100.0%) | 0 (0.0%) |
| 45 to 54 Years | 106 (100.0%) | 0 (0.0%) |
| 55 to 64 Years | 98 (87.5%) | 14 (12.5%) |
| 65 to 74 Years | 42 (77.8%) | 12 (22.2%) |
| 75 Years and older | 16 (100.0%) | 0 (0.0%) |
| Total | 616 (94.8%) | 34 (5.2%) |
Health Insurance Coverage by Citizenship Status in Prospect
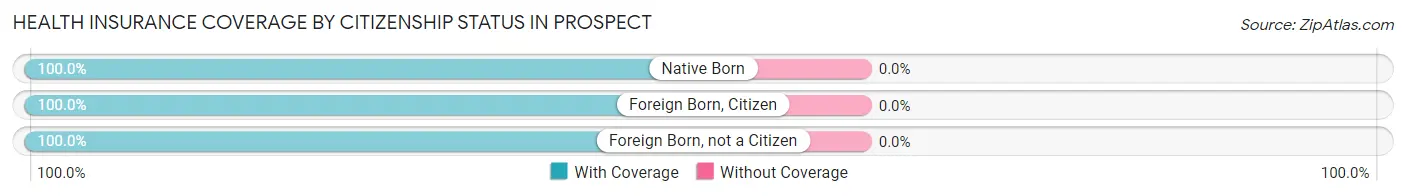
| Citizenship Status | With Coverage | Without Coverage |
| Native Born | 4 (100.0%) | 0 (0.0%) |
| Foreign Born, Citizen | 100 (100.0%) | 0 (0.0%) |
| Foreign Born, not a Citizen | 105 (100.0%) | 0 (0.0%) |
Health Insurance Coverage by Household Income in Prospect
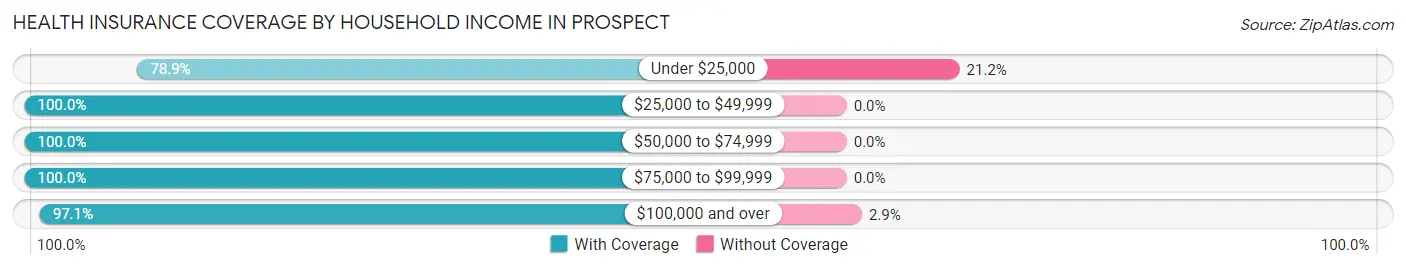
| Household Income | With Coverage | Without Coverage |
| Under $25,000 | 82 (78.8%) | 22 (21.1%) |
| $25,000 to $49,999 | 99 (100.0%) | 0 (0.0%) |
| $50,000 to $74,999 | 20 (100.0%) | 0 (0.0%) |
| $75,000 to $99,999 | 8 (100.0%) | 0 (0.0%) |
| $100,000 and over | 407 (97.1%) | 12 (2.9%) |
Public vs Private Health Insurance Coverage by Age in Prospect
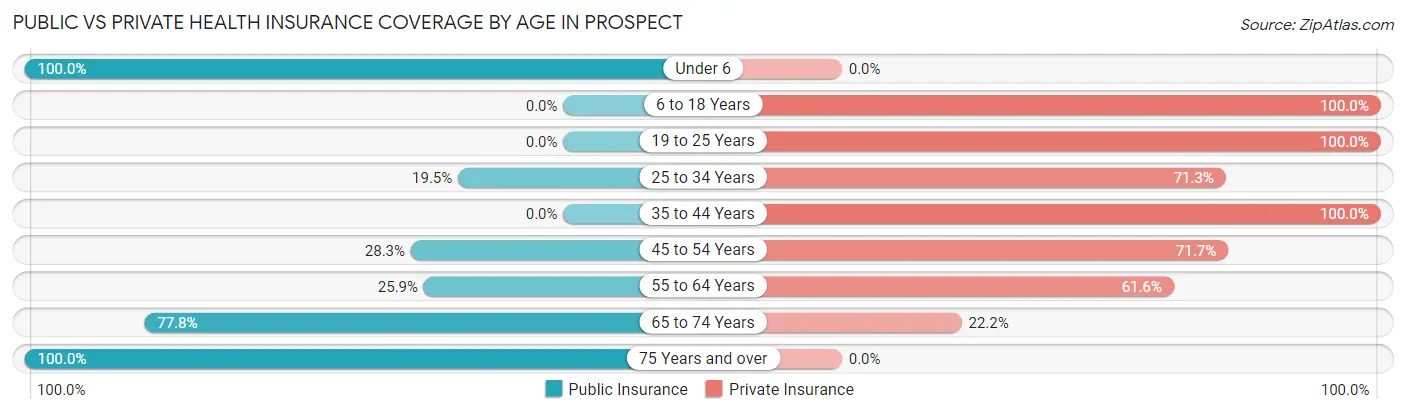
| Age Bracket | Public Insurance | Private Insurance |
| Under 6 | 4 (100.0%) | 0 (0.0%) |
| 6 to 18 Years | 0 (0.0%) | 100 (100.0%) |
| 19 to 25 Years | 0 (0.0%) | 105 (100.0%) |
| 25 to 34 Years | 17 (19.5%) | 62 (71.3%) |
| 35 to 44 Years | 0 (0.0%) | 66 (100.0%) |
| 45 to 54 Years | 30 (28.3%) | 76 (71.7%) |
| 55 to 64 Years | 29 (25.9%) | 69 (61.6%) |
| 65 to 74 Years | 42 (77.8%) | 12 (22.2%) |
| 75 Years and over | 16 (100.0%) | 0 (0.0%) |
| Total | 138 (21.2%) | 490 (75.4%) |
Disability Status by Sex by Age in Prospect
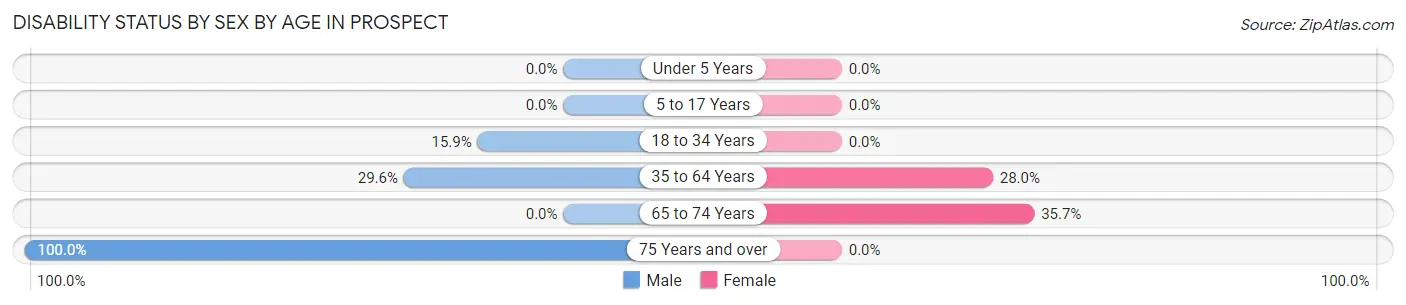
| Age Bracket | Male | Female |
| Under 5 Years | 0 (0.0%) | 0 (0.0%) |
| 5 to 17 Years | 0 (0.0%) | 0 (0.0%) |
| 18 to 34 Years | 25 (15.9%) | 0 (0.0%) |
| 35 to 64 Years | 45 (29.6%) | 37 (28.0%) |
| 65 to 74 Years | 0 (0.0%) | 15 (35.7%) |
| 75 Years and over | 16 (100.0%) | 0 (0.0%) |
Disability Class by Sex by Age in Prospect
Disability Class: Hearing Difficulty
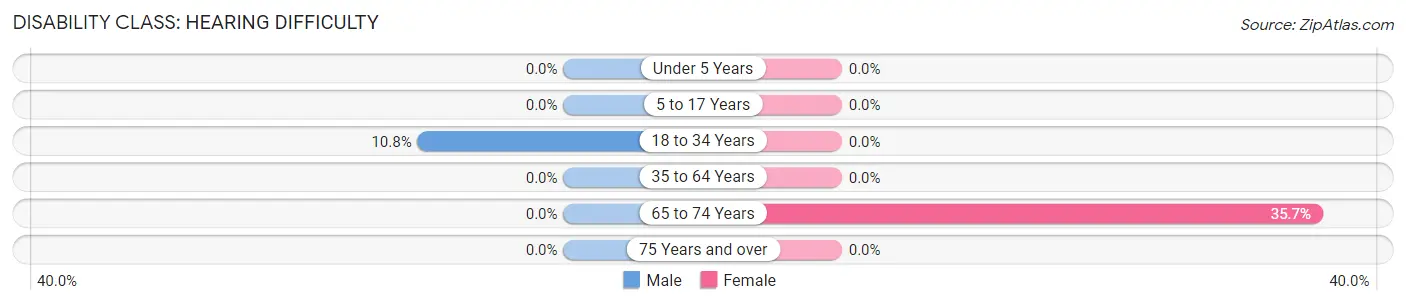
| Age Bracket | Male | Female |
| Under 5 Years | 0 (0.0%) | 0 (0.0%) |
| 5 to 17 Years | 0 (0.0%) | 0 (0.0%) |
| 18 to 34 Years | 17 (10.8%) | 0 (0.0%) |
| 35 to 64 Years | 0 (0.0%) | 0 (0.0%) |
| 65 to 74 Years | 0 (0.0%) | 15 (35.7%) |
| 75 Years and over | 0 (0.0%) | 0 (0.0%) |
Disability Class: Vision Difficulty
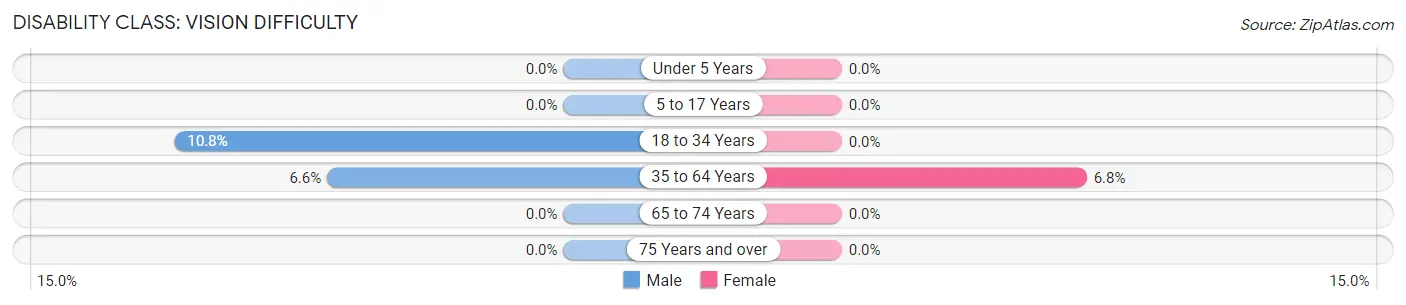
| Age Bracket | Male | Female |
| Under 5 Years | 0 (0.0%) | 0 (0.0%) |
| 5 to 17 Years | 0 (0.0%) | 0 (0.0%) |
| 18 to 34 Years | 17 (10.8%) | 0 (0.0%) |
| 35 to 64 Years | 10 (6.6%) | 9 (6.8%) |
| 65 to 74 Years | 0 (0.0%) | 0 (0.0%) |
| 75 Years and over | 0 (0.0%) | 0 (0.0%) |
Disability Class: Cognitive Difficulty
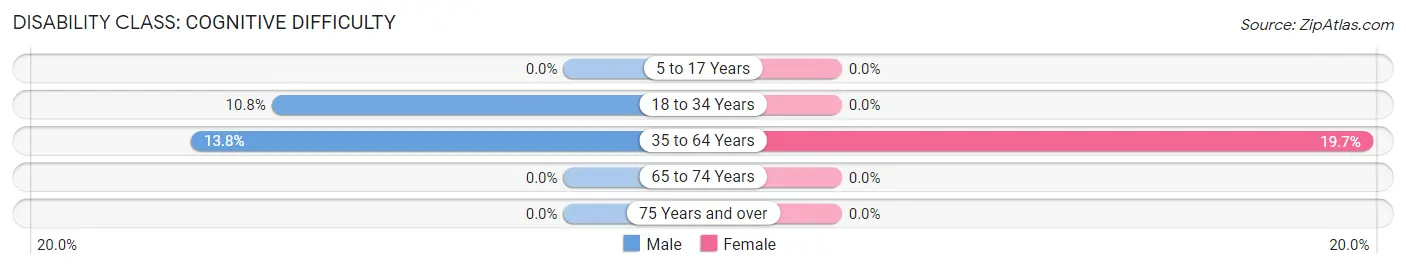
| Age Bracket | Male | Female |
| 5 to 17 Years | 0 (0.0%) | 0 (0.0%) |
| 18 to 34 Years | 17 (10.8%) | 0 (0.0%) |
| 35 to 64 Years | 21 (13.8%) | 26 (19.7%) |
| 65 to 74 Years | 0 (0.0%) | 0 (0.0%) |
| 75 Years and over | 0 (0.0%) | 0 (0.0%) |
Disability Class: Ambulatory Difficulty
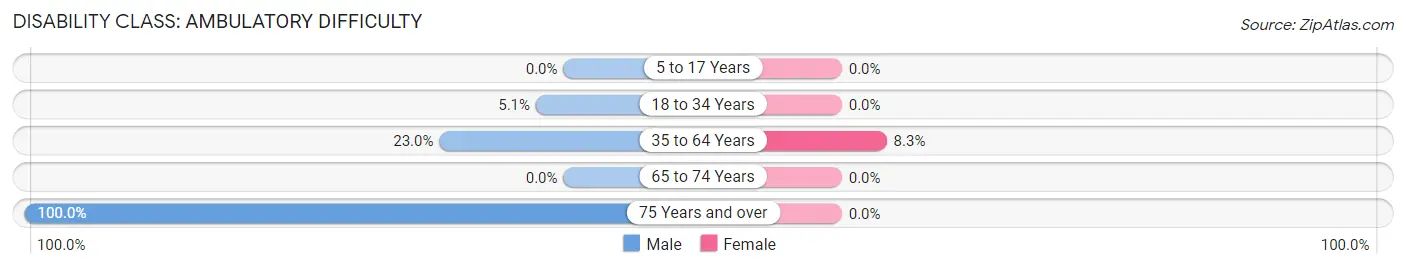
| Age Bracket | Male | Female |
| 5 to 17 Years | 0 (0.0%) | 0 (0.0%) |
| 18 to 34 Years | 8 (5.1%) | 0 (0.0%) |
| 35 to 64 Years | 35 (23.0%) | 11 (8.3%) |
| 65 to 74 Years | 0 (0.0%) | 0 (0.0%) |
| 75 Years and over | 16 (100.0%) | 0 (0.0%) |
Disability Class: Self-Care Difficulty
| Age Bracket | Male | Female |
| 5 to 17 Years | 0 (0.0%) | 0 (0.0%) |
| 18 to 34 Years | 0 (0.0%) | 0 (0.0%) |
| 35 to 64 Years | 0 (0.0%) | 0 (0.0%) |
| 65 to 74 Years | 0 (0.0%) | 0 (0.0%) |
| 75 Years and over | 0 (0.0%) | 0 (0.0%) |
Technology Access in Prospect
Computing Device Access in Prospect
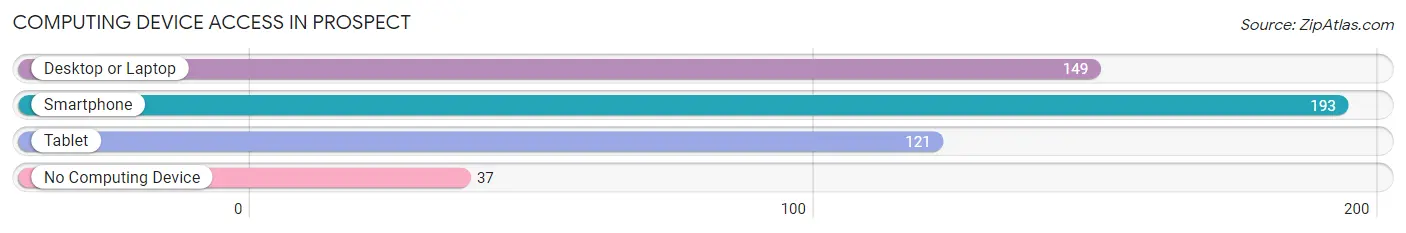
| Device Type | # Households | % Households |
| Desktop or Laptop | 149 | 64.8% |
| Smartphone | 193 | 83.9% |
| Tablet | 121 | 52.6% |
| No Computing Device | 37 | 16.1% |
| Total | 230 | 100.0% |
Internet Access in Prospect
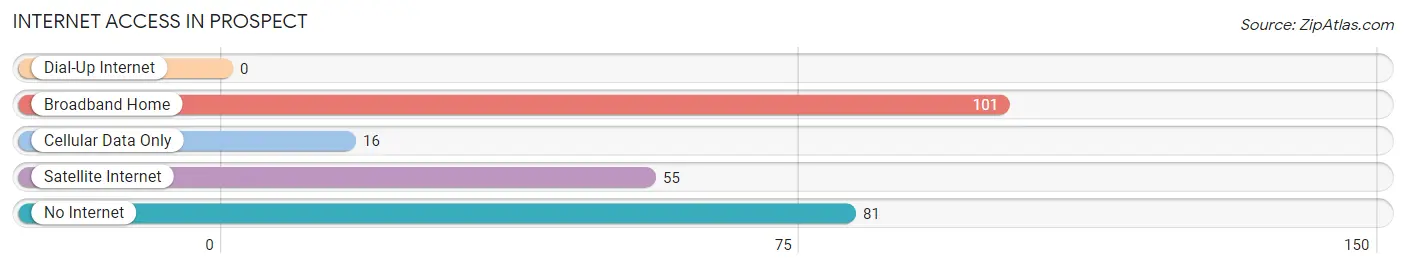
| Internet Type | # Households | % Households |
| Dial-Up Internet | 0 | 0.0% |
| Broadband Home | 101 | 43.9% |
| Cellular Data Only | 16 | 7.0% |
| Satellite Internet | 55 | 23.9% |
| No Internet | 81 | 35.2% |
| Total | 230 | 100.0% |
Prospect Summary
Prospect, North Carolina is a small town located in the northeastern part of the state, in the county of Vance. It is situated on the banks of the Tar River, and is part of the larger metropolitan area of Henderson. The town has a population of just over 1,000 people, and is known for its rural charm and small-town atmosphere.
History
The area that is now Prospect was first settled in the late 1700s by a group of settlers from Virginia. The town was originally known as “Prospect Hill”, and was named after the nearby hill that overlooked the Tar River. The town was officially incorporated in 1887, and was named after the nearby Prospect Hill.
Geography
Prospect is located in the northeastern part of North Carolina, in the county of Vance. It is situated on the banks of the Tar River, and is part of the larger metropolitan area of Henderson. The town has a total area of 1.2 square miles, all of which is land. The terrain is mostly flat, with some rolling hills in the area.
Economy
The economy of Prospect is largely based on agriculture and manufacturing. The town is home to several small businesses, including a few restaurants, a grocery store, and a few other retail stores. The town also has a few small industrial plants, which provide employment for many of the town’s residents.
Demographics
As of the 2010 census, the population of Prospect was 1,072. The racial makeup of the town was 79.2% White, 17.2% African American, 0.3% Native American, 0.3% Asian, 0.1% Pacific Islander, and 2.9% from two or more races. The median household income was $30,938, and the median family income was $37,813.
Conclusion
Prospect, North Carolina is a small town located in the northeastern part of the state, in the county of Vance. It is situated on the banks of the Tar River, and is part of the larger metropolitan area of Henderson. The town has a population of just over 1,000 people, and is known for its rural charm and small-town atmosphere. The economy of Prospect is largely based on agriculture and manufacturing, and the town is home to several small businesses. The racial makeup of the town is mostly White, with a small percentage of African Americans, Native Americans, Asians, and Pacific Islanders. The median household income is $30,938, and the median family income is $37,813.
Common Questions
What is Per Capita Income in Prospect?
Per Capita income in Prospect is $34,176.
What is the Median Family Income in Prospect?
Median Family Income in Prospect is $114,792.
What is Income or Wage Gap in Prospect?
Income or Wage Gap in Prospect is 29.6%.
Women in Prospect earn 70.4 cents for every dollar earned by a man.
What is Inequality or Gini Index in Prospect?
Inequality or Gini Index in Prospect is 0.46.
What is the Total Population of Prospect?
Total Population of Prospect is 650.
What is the Total Male Population of Prospect?
Total Male Population of Prospect is 380.
What is the Total Female Population of Prospect?
Total Female Population of Prospect is 270.
What is the Ratio of Males per 100 Females in Prospect?
There are 140.74 Males per 100 Females in Prospect.
What is the Ratio of Females per 100 Males in Prospect?
There are 71.05 Females per 100 Males in Prospect.
What is the Median Population Age in Prospect?
Median Population Age in Prospect is 43.4 Years.
What is the Average Family Size in Prospect
Average Family Size in Prospect is 4.0 People.
What is the Average Household Size in Prospect
Average Household Size in Prospect is 2.8 People.
How Large is the Labor Force in Prospect?
There are 309 People in the Labor Forcein in Prospect.
What is the Percentage of People in the Labor Force in Prospect?
53.7% of People are in the Labor Force in Prospect.