Spencer, NC Map & Demographics
Spencer Map
Spencer Overview
$29,376
PER CAPITA INCOME
$68,620
AVG FAMILY INCOME
$61,079
AVG HOUSEHOLD INCOME
34.5%
WAGE / INCOME GAP [ % ]
65.5¢/ $1
WAGE / INCOME GAP [ $ ]
0.42
INEQUALITY / GINI INDEX
3,296
TOTAL POPULATION
1,738
MALE POPULATION
1,558
FEMALE POPULATION
111.55
MALES / 100 FEMALES
89.64
FEMALES / 100 MALES
42.9
MEDIAN AGE
3.0
AVG FAMILY SIZE
2.6
AVG HOUSEHOLD SIZE
1,675
LABOR FORCE [ PEOPLE ]
59.9%
PERCENT IN LABOR FORCE
9.0%
UNEMPLOYMENT RATE
Spencer Zip Codes
Spencer Area Codes
Income in Spencer
Income Overview in Spencer
Per Capita Income in Spencer is $29,376, while median incomes of families and households are $68,620 and $61,079 respectively.
| Characteristic | Number | Measure |
| Per Capita Income | 3,296 | $29,376 |
| Median Family Income | 887 | $68,620 |
| Mean Family Income | 887 | $84,266 |
| Median Household Income | 1,265 | $61,079 |
| Mean Household Income | 1,265 | $72,635 |
| Income Deficit | 887 | $0 |
| Wage / Income Gap (%) | 3,296 | 34.54% |
| Wage / Income Gap ($) | 3,296 | 65.46¢ per $1 |
| Gini / Inequality Index | 3,296 | 0.42 |
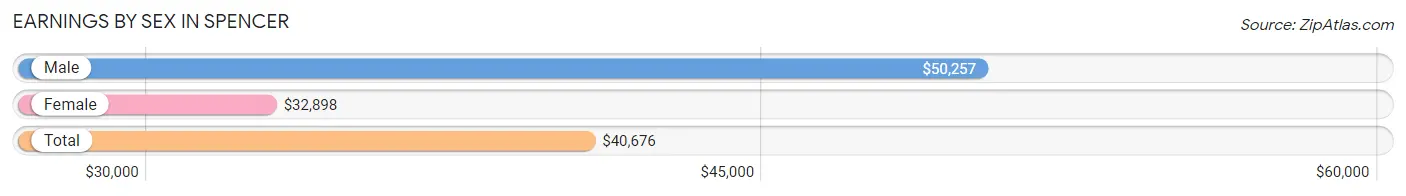
Earnings by Sex in Spencer
Average Earnings in Spencer are $40,676, $50,257 for men and $32,898 for women, a difference of 34.5%.
| Sex | Number | Average Earnings |
| Male | 1,039 (59.1%) | $50,257 |
| Female | 718 (40.9%) | $32,898 |
| Total | 1,757 (100.0%) | $40,676 |
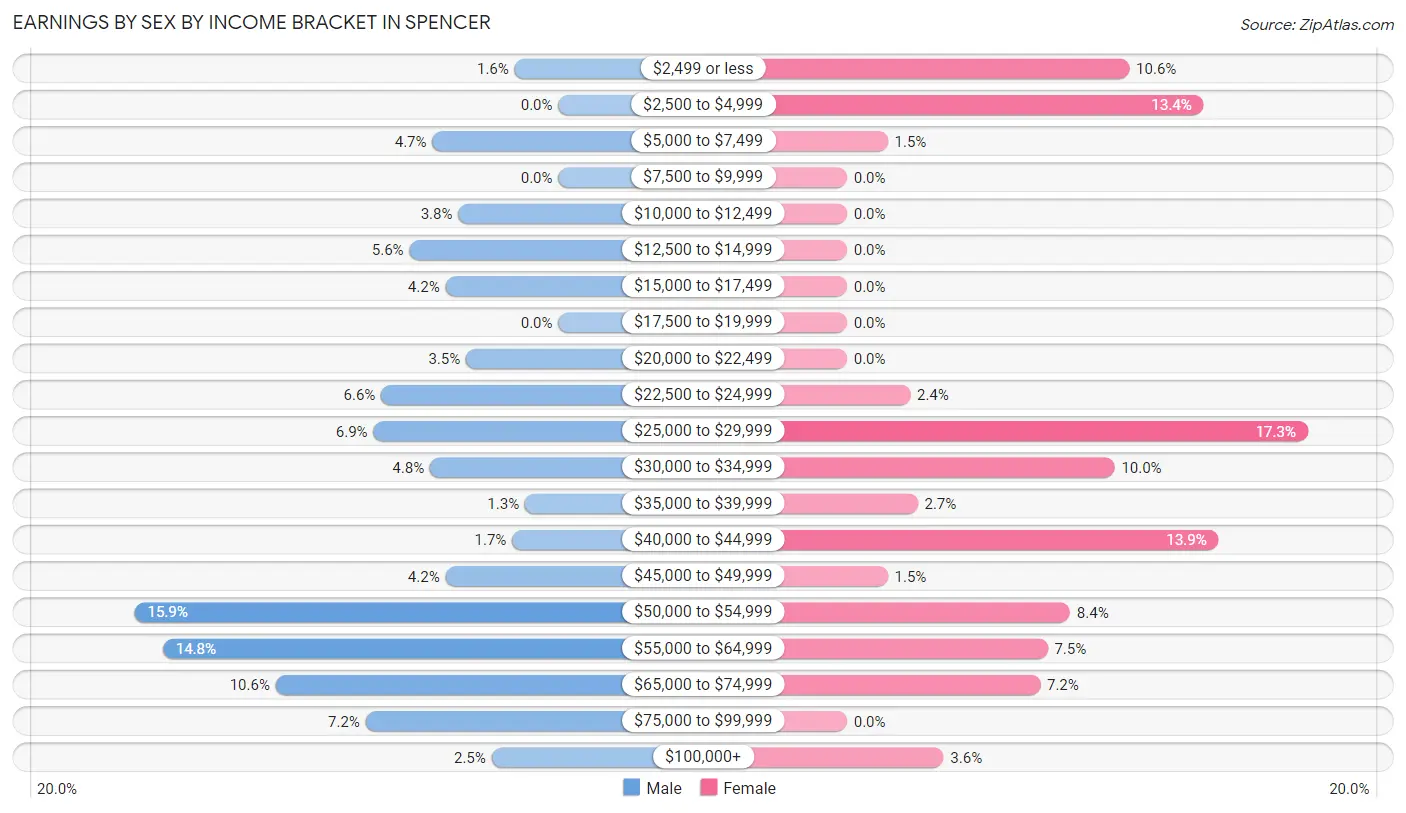
Earnings by Sex by Income Bracket in Spencer
The most common earnings brackets in Spencer are $50,000 to $54,999 for men (165 | 15.9%) and $25,000 to $29,999 for women (124 | 17.3%).
| Income | Male | Female |
| $2,499 or less | 17 (1.6%) | 76 (10.6%) |
| $2,500 to $4,999 | 0 (0.0%) | 96 (13.4%) |
| $5,000 to $7,499 | 49 (4.7%) | 11 (1.5%) |
| $7,500 to $9,999 | 0 (0.0%) | 0 (0.0%) |
| $10,000 to $12,499 | 39 (3.7%) | 0 (0.0%) |
| $12,500 to $14,999 | 58 (5.6%) | 0 (0.0%) |
| $15,000 to $17,499 | 44 (4.2%) | 0 (0.0%) |
| $17,500 to $19,999 | 0 (0.0%) | 0 (0.0%) |
| $20,000 to $22,499 | 36 (3.5%) | 0 (0.0%) |
| $22,500 to $24,999 | 69 (6.6%) | 17 (2.4%) |
| $25,000 to $29,999 | 72 (6.9%) | 124 (17.3%) |
| $30,000 to $34,999 | 50 (4.8%) | 72 (10.0%) |
| $35,000 to $39,999 | 13 (1.3%) | 19 (2.6%) |
| $40,000 to $44,999 | 18 (1.7%) | 100 (13.9%) |
| $45,000 to $49,999 | 44 (4.2%) | 11 (1.5%) |
| $50,000 to $54,999 | 165 (15.9%) | 60 (8.4%) |
| $55,000 to $64,999 | 154 (14.8%) | 54 (7.5%) |
| $65,000 to $74,999 | 110 (10.6%) | 52 (7.2%) |
| $75,000 to $99,999 | 75 (7.2%) | 0 (0.0%) |
| $100,000+ | 26 (2.5%) | 26 (3.6%) |
| Total | 1,039 (100.0%) | 718 (100.0%) |
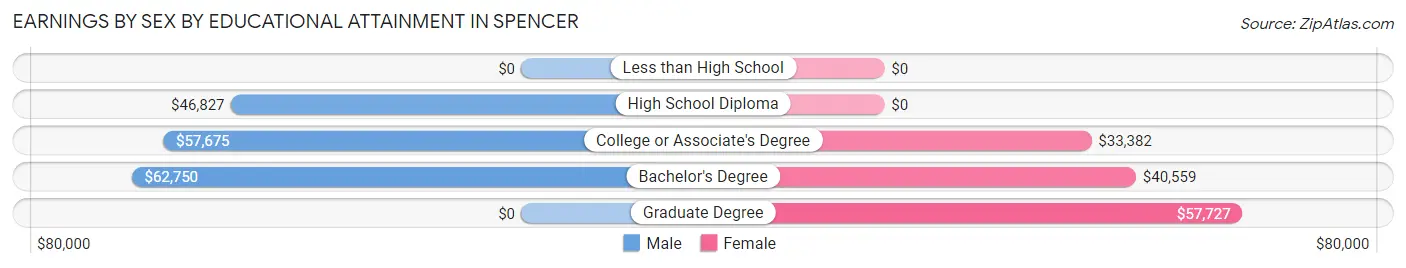
Earnings by Sex by Educational Attainment in Spencer
Average earnings in Spencer are $51,422 for men and $34,091 for women, a difference of 33.7%. Men with an educational attainment of bachelor's degree enjoy the highest average annual earnings of $62,750, while those with high school diploma education earn the least with $46,827. Women with an educational attainment of graduate degree earn the most with the average annual earnings of $57,727, while those with college or associate's degree education have the smallest earnings of $33,382.
| Educational Attainment | Male Income | Female Income |
| Less than High School | - | - |
| High School Diploma | $46,827 | $0 |
| College or Associate's Degree | $57,675 | $33,382 |
| Bachelor's Degree | $62,750 | $40,559 |
| Graduate Degree | - | - |
| Total | $51,422 | $34,091 |
Family Income in Spencer
Family Income Brackets in Spencer
According to the Spencer family income data, there are 288 families falling into the $50,000 to $74,999 income range, which is the most common income bracket and makes up 32.5% of all families. Conversely, the $200,000+ income bracket is the least frequent group with only 18 families (2.0%) belonging to this category.
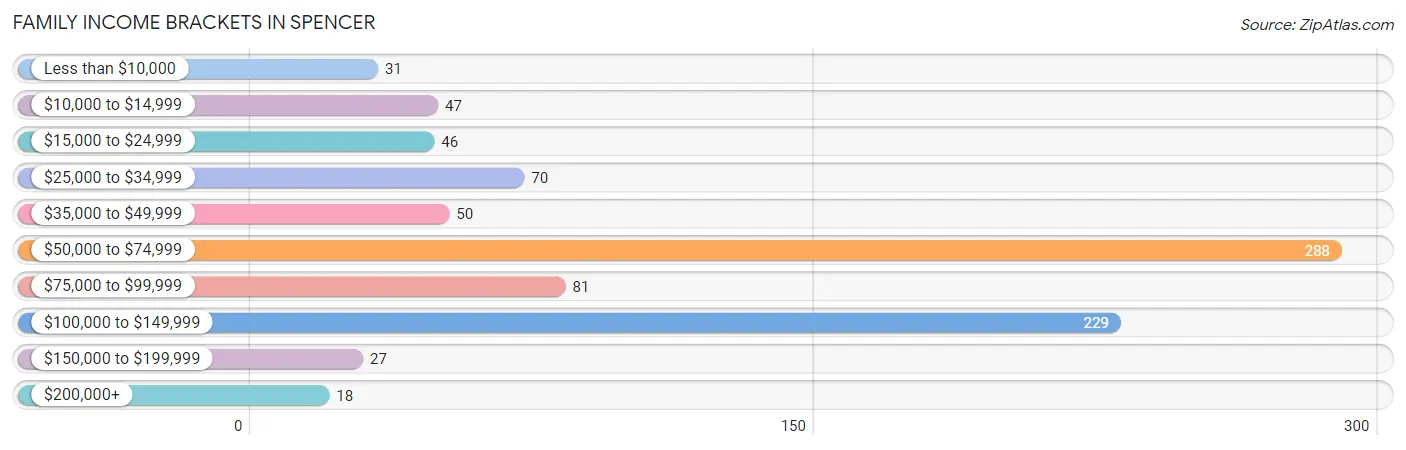
| Income Bracket | # Families | % Families |
| Less than $10,000 | 31 | 3.5% |
| $10,000 to $14,999 | 47 | 5.3% |
| $15,000 to $24,999 | 46 | 5.2% |
| $25,000 to $34,999 | 70 | 7.9% |
| $35,000 to $49,999 | 50 | 5.6% |
| $50,000 to $74,999 | 288 | 32.5% |
| $75,000 to $99,999 | 81 | 9.1% |
| $100,000 to $149,999 | 229 | 25.8% |
| $150,000 to $199,999 | 27 | 3.0% |
| $200,000+ | 18 | 2.0% |
Family Income by Famaliy Size in Spencer
4-person families (52 | 5.9%) account for the highest median family income in Spencer with $143,088 per family, while 4-person families (52 | 5.9%) have the highest median income of $35,772 per family member.
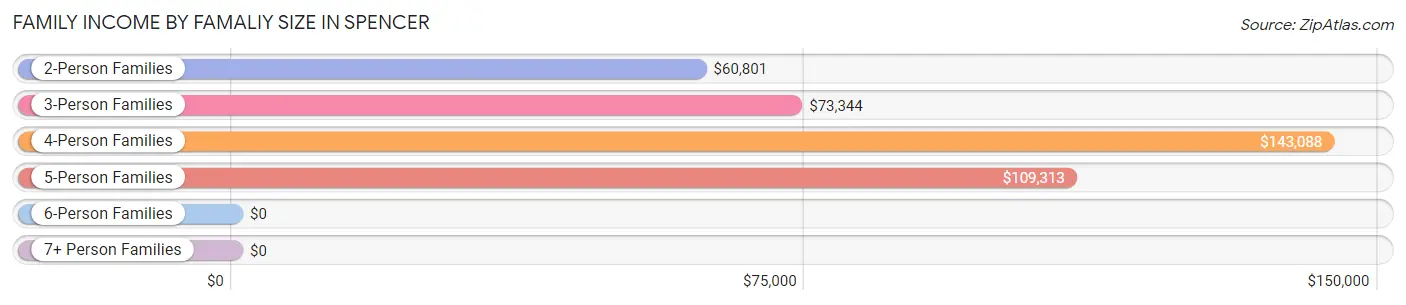
| Income Bracket | # Families | Median Income |
| 2-Person Families | 464 (52.3%) | $60,801 |
| 3-Person Families | 233 (26.3%) | $73,344 |
| 4-Person Families | 52 (5.9%) | $143,088 |
| 5-Person Families | 107 (12.1%) | $109,313 |
| 6-Person Families | 13 (1.5%) | $0 |
| 7+ Person Families | 18 (2.0%) | $0 |
| Total | 887 (100.0%) | $68,620 |
Family Income by Number of Earners in Spencer
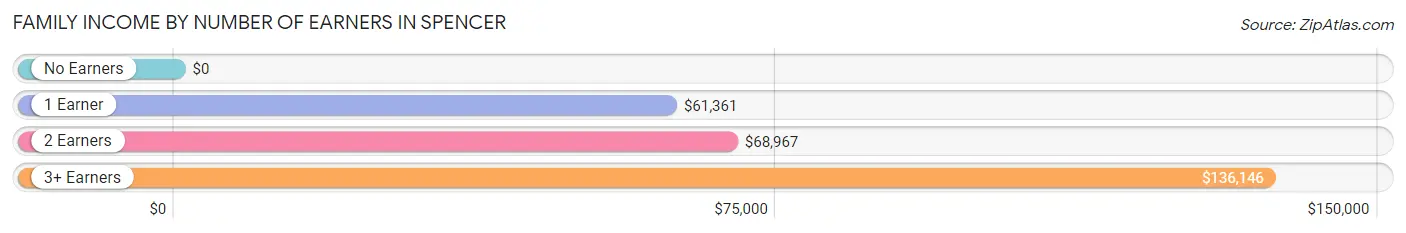
| Number of Earners | # Families | Median Income |
| No Earners | 169 (19.1%) | $0 |
| 1 Earner | 316 (35.6%) | $61,361 |
| 2 Earners | 259 (29.2%) | $68,967 |
| 3+ Earners | 143 (16.1%) | $136,146 |
| Total | 887 (100.0%) | $68,620 |
Household Income in Spencer
Household Income Brackets in Spencer
With 367 households falling in the category, the $50,000 to $74,999 income range is the most frequent in Spencer, accounting for 29.0% of all households. In contrast, only 18 households (1.4%) fall into the $200,000+ income bracket, making it the least populous group.
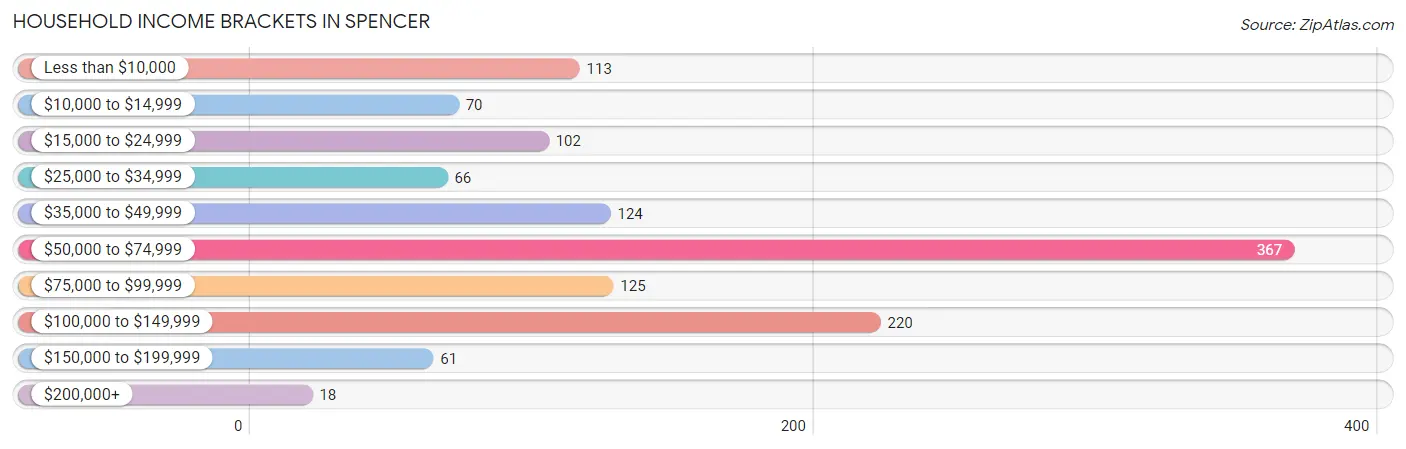
| Income Bracket | # Households | % Households |
| Less than $10,000 | 113 | 8.9% |
| $10,000 to $14,999 | 70 | 5.5% |
| $15,000 to $24,999 | 102 | 8.1% |
| $25,000 to $34,999 | 66 | 5.2% |
| $35,000 to $49,999 | 124 | 9.8% |
| $50,000 to $74,999 | 367 | 29.0% |
| $75,000 to $99,999 | 125 | 9.9% |
| $100,000 to $149,999 | 220 | 17.4% |
| $150,000 to $199,999 | 61 | 4.8% |
| $200,000+ | 18 | 1.4% |
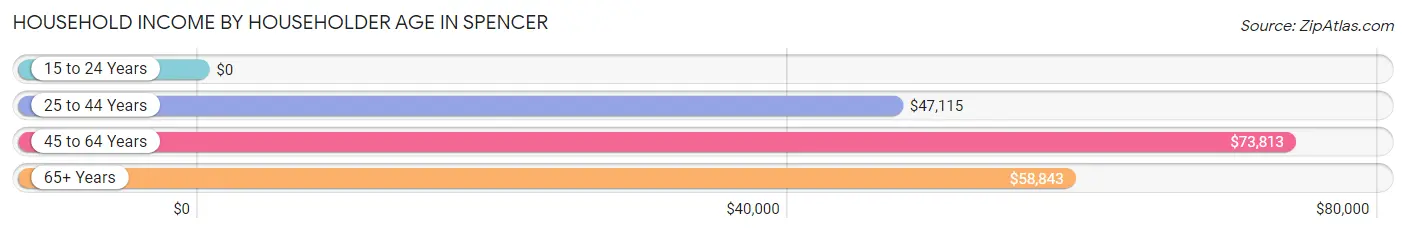
Household Income by Householder Age in Spencer
The median household income in Spencer is $61,079, with the highest median household income of $73,813 found in the 45 to 64 years age bracket for the primary householder. A total of 516 households (40.8%) fall into this category.
| Income Bracket | # Households | Median Income |
| 15 to 24 Years | 0 (0.0%) | $0 |
| 25 to 44 Years | 422 (33.4%) | $47,115 |
| 45 to 64 Years | 516 (40.8%) | $73,813 |
| 65+ Years | 327 (25.9%) | $58,843 |
| Total | 1,265 (100.0%) | $61,079 |
Poverty in Spencer
Income Below Poverty by Sex and Age in Spencer
With 13.6% poverty level for males and 21.2% for females among the residents of Spencer, 18 to 24 year old males and 25 to 34 year old females are the most vulnerable to poverty, with 70 males (45.5%) and 116 females (55.5%) in their respective age groups living below the poverty level.
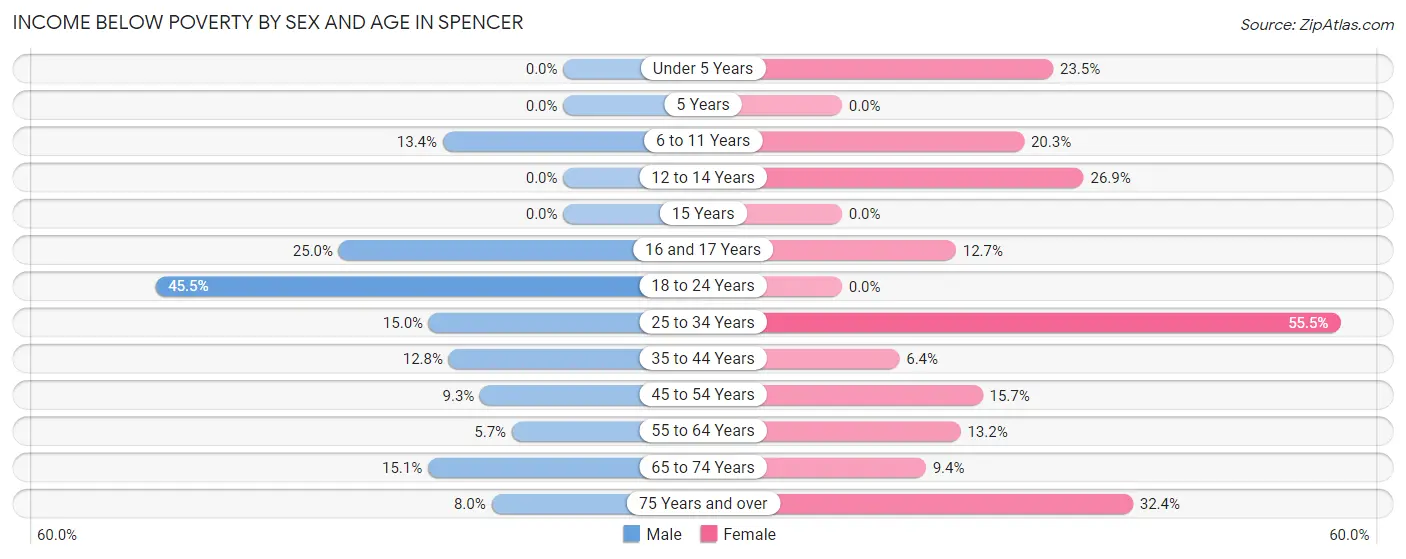
| Age Bracket | Male | Female |
| Under 5 Years | 0 (0.0%) | 20 (23.5%) |
| 5 Years | 0 (0.0%) | 0 (0.0%) |
| 6 to 11 Years | 20 (13.4%) | 14 (20.3%) |
| 12 to 14 Years | 0 (0.0%) | 14 (26.9%) |
| 15 Years | 0 (0.0%) | 0 (0.0%) |
| 16 and 17 Years | 11 (25.0%) | 8 (12.7%) |
| 18 to 24 Years | 70 (45.5%) | 0 (0.0%) |
| 25 to 34 Years | 47 (15.0%) | 116 (55.5%) |
| 35 to 44 Years | 25 (12.8%) | 11 (6.4%) |
| 45 to 54 Years | 30 (9.3%) | 47 (15.7%) |
| 55 to 64 Years | 13 (5.7%) | 23 (13.2%) |
| 65 to 74 Years | 11 (15.1%) | 20 (9.3%) |
| 75 Years and over | 8 (8.0%) | 47 (32.4%) |
| Total | 235 (13.6%) | 320 (21.2%) |
Income Above Poverty by Sex and Age in Spencer
According to the poverty statistics in Spencer, males aged under 5 years and females aged 18 to 24 years are the age groups that are most secure financially, with 100.0% of males and 100.0% of females in these age groups living above the poverty line.
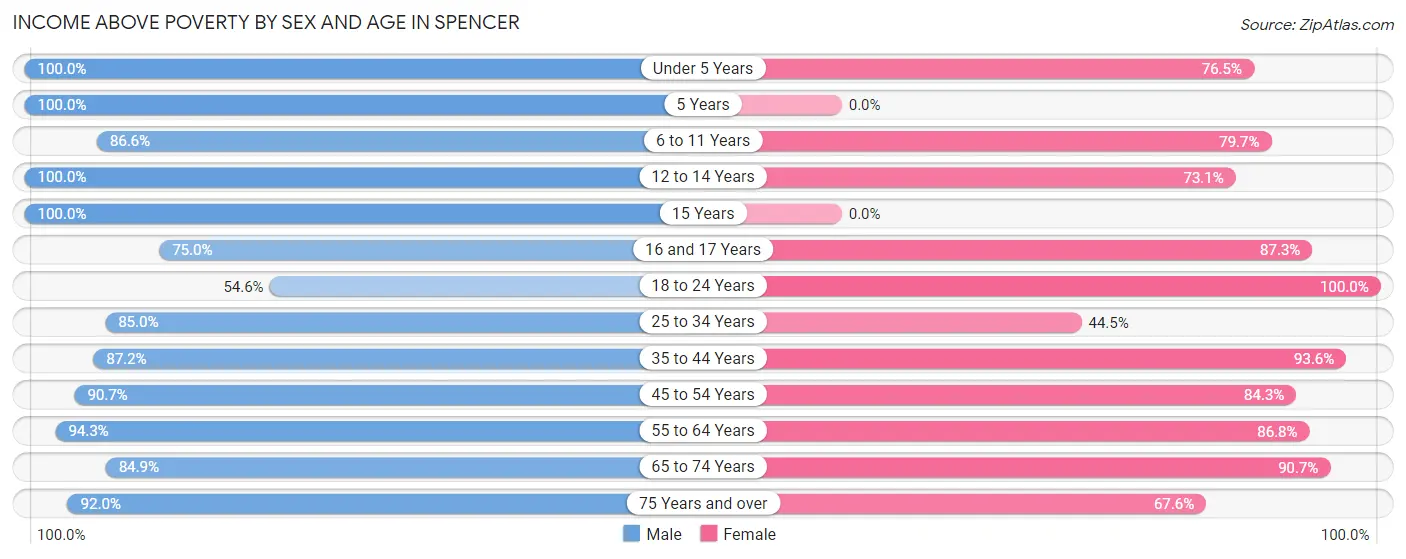
| Age Bracket | Male | Female |
| Under 5 Years | 25 (100.0%) | 65 (76.5%) |
| 5 Years | 21 (100.0%) | 0 (0.0%) |
| 6 to 11 Years | 129 (86.6%) | 55 (79.7%) |
| 12 to 14 Years | 90 (100.0%) | 38 (73.1%) |
| 15 Years | 9 (100.0%) | 0 (0.0%) |
| 16 and 17 Years | 33 (75.0%) | 55 (87.3%) |
| 18 to 24 Years | 84 (54.5%) | 27 (100.0%) |
| 25 to 34 Years | 267 (85.0%) | 93 (44.5%) |
| 35 to 44 Years | 171 (87.2%) | 161 (93.6%) |
| 45 to 54 Years | 294 (90.7%) | 253 (84.3%) |
| 55 to 64 Years | 214 (94.3%) | 151 (86.8%) |
| 65 to 74 Years | 62 (84.9%) | 194 (90.6%) |
| 75 Years and over | 92 (92.0%) | 98 (67.6%) |
| Total | 1,491 (86.4%) | 1,190 (78.8%) |
Income Below Poverty Among Married-Couple Families in Spencer
The poverty statistics for married-couple families in Spencer show that 2.1% or 11 of the total 517 families live below the poverty line. Families with no children have the highest poverty rate of 3.3%, comprising of 11 families. On the other hand, families with 1 or 2 children have the lowest poverty rate of 0.0%, which includes 0 families.
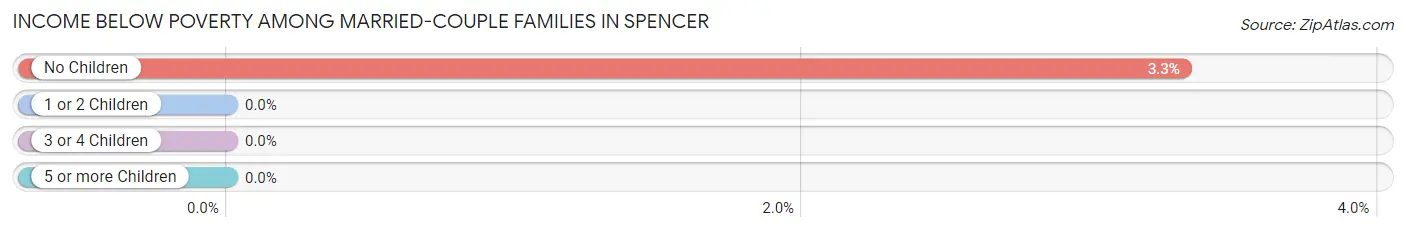
| Children | Above Poverty | Below Poverty |
| No Children | 320 (96.7%) | 11 (3.3%) |
| 1 or 2 Children | 116 (100.0%) | 0 (0.0%) |
| 3 or 4 Children | 52 (100.0%) | 0 (0.0%) |
| 5 or more Children | 18 (100.0%) | 0 (0.0%) |
| Total | 506 (97.9%) | 11 (2.1%) |
Income Below Poverty Among Single-Parent Households in Spencer
According to the poverty data in Spencer, 15.7% or 31 single-father households and 48.0% or 83 single-mother households are living below the poverty line. Among single-father households, those with 1 or 2 children have the highest poverty rate, with 31 households (70.5%) experiencing poverty. Likewise, among single-mother households, those with no children have the highest poverty rate, with 61 households (64.9%) falling below the poverty line.
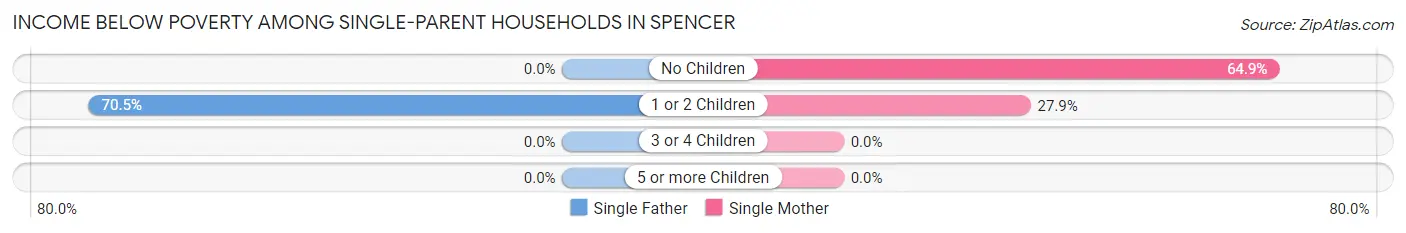
| Children | Single Father | Single Mother |
| No Children | 0 (0.0%) | 61 (64.9%) |
| 1 or 2 Children | 31 (70.5%) | 22 (27.9%) |
| 3 or 4 Children | 0 (0.0%) | 0 (0.0%) |
| 5 or more Children | 0 (0.0%) | 0 (0.0%) |
| Total | 31 (15.7%) | 83 (48.0%) |
Income Below Poverty Among Married-Couple vs Single-Parent Households in Spencer
The poverty data for Spencer shows that 11 of the married-couple family households (2.1%) and 114 of the single-parent households (30.8%) are living below the poverty level. Within the married-couple family households, those with no children have the highest poverty rate, with 11 households (3.3%) falling below the poverty line. Among the single-parent households, those with 1 or 2 children have the highest poverty rate, with 53 household (43.1%) living below poverty.
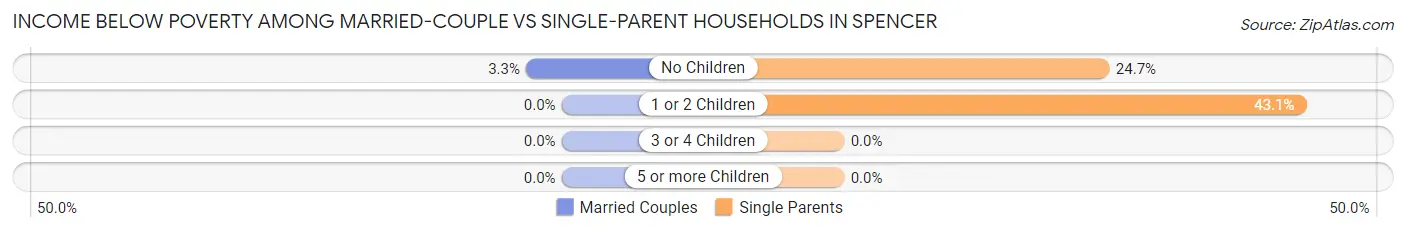
| Children | Married-Couple Families | Single-Parent Households |
| No Children | 11 (3.3%) | 61 (24.7%) |
| 1 or 2 Children | 0 (0.0%) | 53 (43.1%) |
| 3 or 4 Children | 0 (0.0%) | 0 (0.0%) |
| 5 or more Children | 0 (0.0%) | 0 (0.0%) |
| Total | 11 (2.1%) | 114 (30.8%) |
Race in Spencer
The most populous races in Spencer are White / Caucasian (1,778 | 53.9%), Black / African American (1,386 | 42.0%), and Hispanic or Latino (105 | 3.2%).
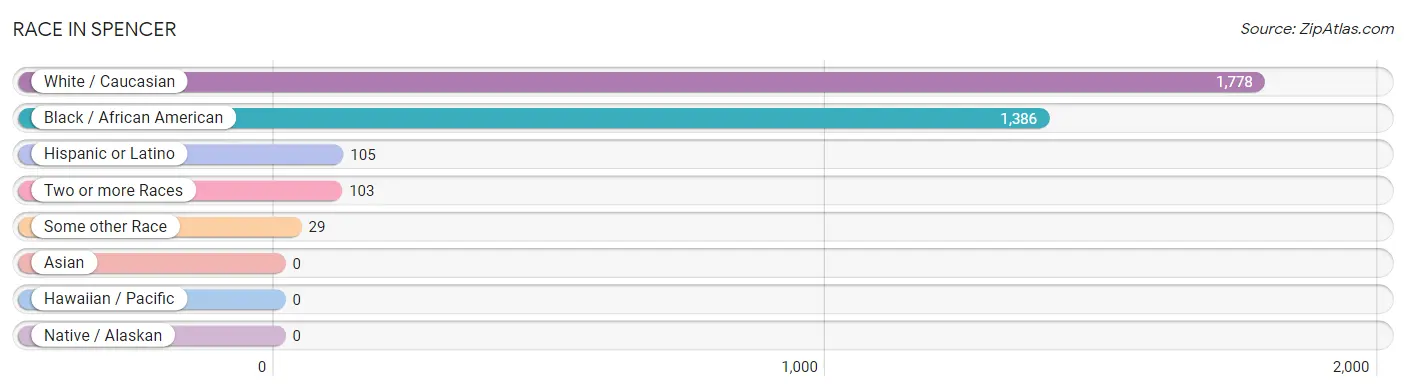
| Race | # Population | % Population |
| Asian | 0 | 0.0% |
| Black / African American | 1,386 | 42.0% |
| Hawaiian / Pacific | 0 | 0.0% |
| Hispanic or Latino | 105 | 3.2% |
| Native / Alaskan | 0 | 0.0% |
| White / Caucasian | 1,778 | 53.9% |
| Two or more Races | 103 | 3.1% |
| Some other Race | 29 | 0.9% |
| Total | 3,296 | 100.0% |
Ancestry in Spencer
The most populous ancestries reported in Spencer are American (466 | 14.1%), English (274 | 8.3%), Scotch-Irish (257 | 7.8%), German (210 | 6.4%), and Mexican (90 | 2.7%), together accounting for 39.3% of all Spencer residents.
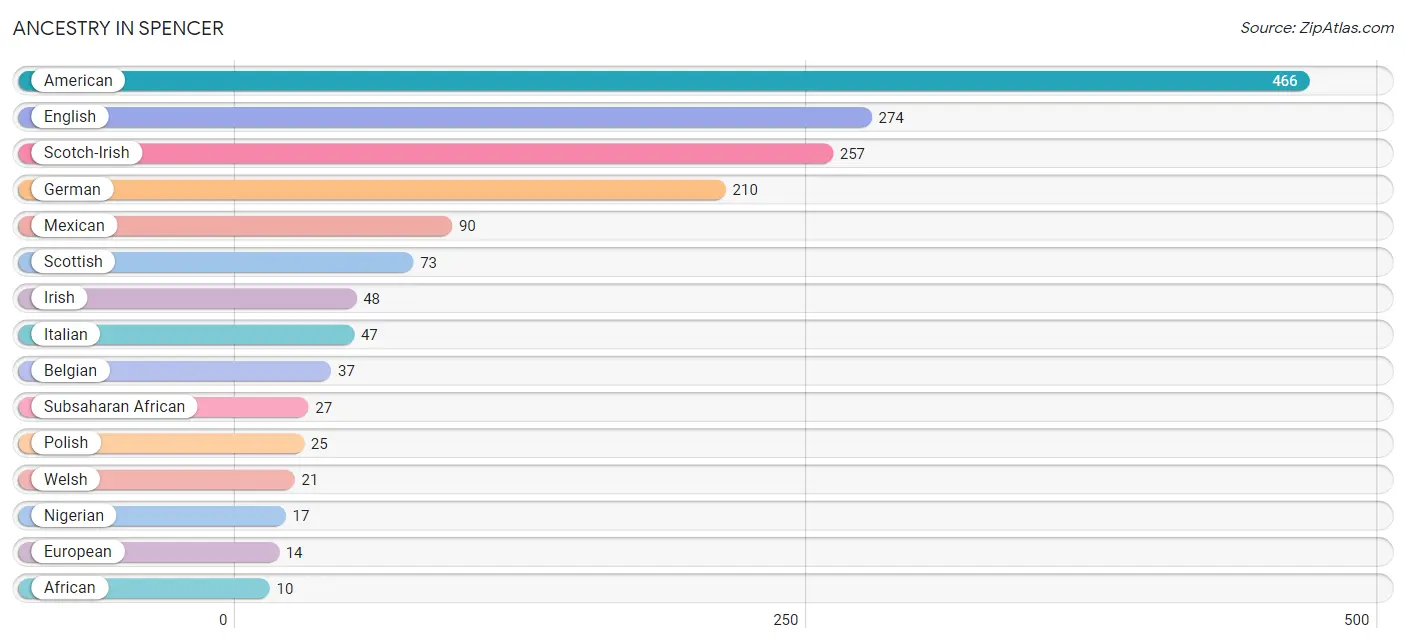
| Ancestry | # Population | % Population |
| African | 10 | 0.3% |
| Aleut | 5 | 0.2% |
| American | 466 | 14.1% |
| Belgian | 37 | 1.1% |
| British | 9 | 0.3% |
| Dutch | 9 | 0.3% |
| English | 274 | 8.3% |
| European | 14 | 0.4% |
| French | 10 | 0.3% |
| German | 210 | 6.4% |
| Irish | 48 | 1.5% |
| Italian | 47 | 1.4% |
| Mexican | 90 | 2.7% |
| Nigerian | 17 | 0.5% |
| Polish | 25 | 0.8% |
| Scandinavian | 10 | 0.3% |
| Scotch-Irish | 257 | 7.8% |
| Scottish | 73 | 2.2% |
| Subsaharan African | 27 | 0.8% |
| Welsh | 21 | 0.6% | View All 20 Rows |
Immigrants in Spencer
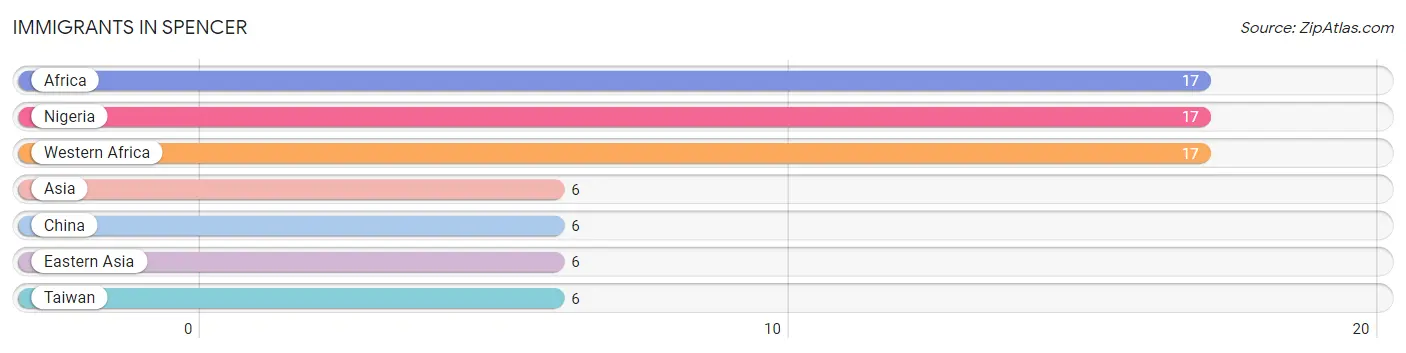
The most numerous immigrant groups reported in Spencer came from Africa (17 | 0.5%), Nigeria (17 | 0.5%), Western Africa (17 | 0.5%), Asia (6 | 0.2%), and China (6 | 0.2%), together accounting for 1.9% of all Spencer residents.
| Immigration Origin | # Population | % Population |
| Africa | 17 | 0.5% |
| Asia | 6 | 0.2% |
| China | 6 | 0.2% |
| Eastern Asia | 6 | 0.2% |
| Nigeria | 17 | 0.5% |
| Taiwan | 6 | 0.2% |
| Western Africa | 17 | 0.5% | View All 7 Rows |
Sex and Age in Spencer
Sex and Age in Spencer
The most populous age groups in Spencer are 25 to 29 Years (213 | 12.3%) for men and 45 to 49 Years (164 | 10.5%) for women.
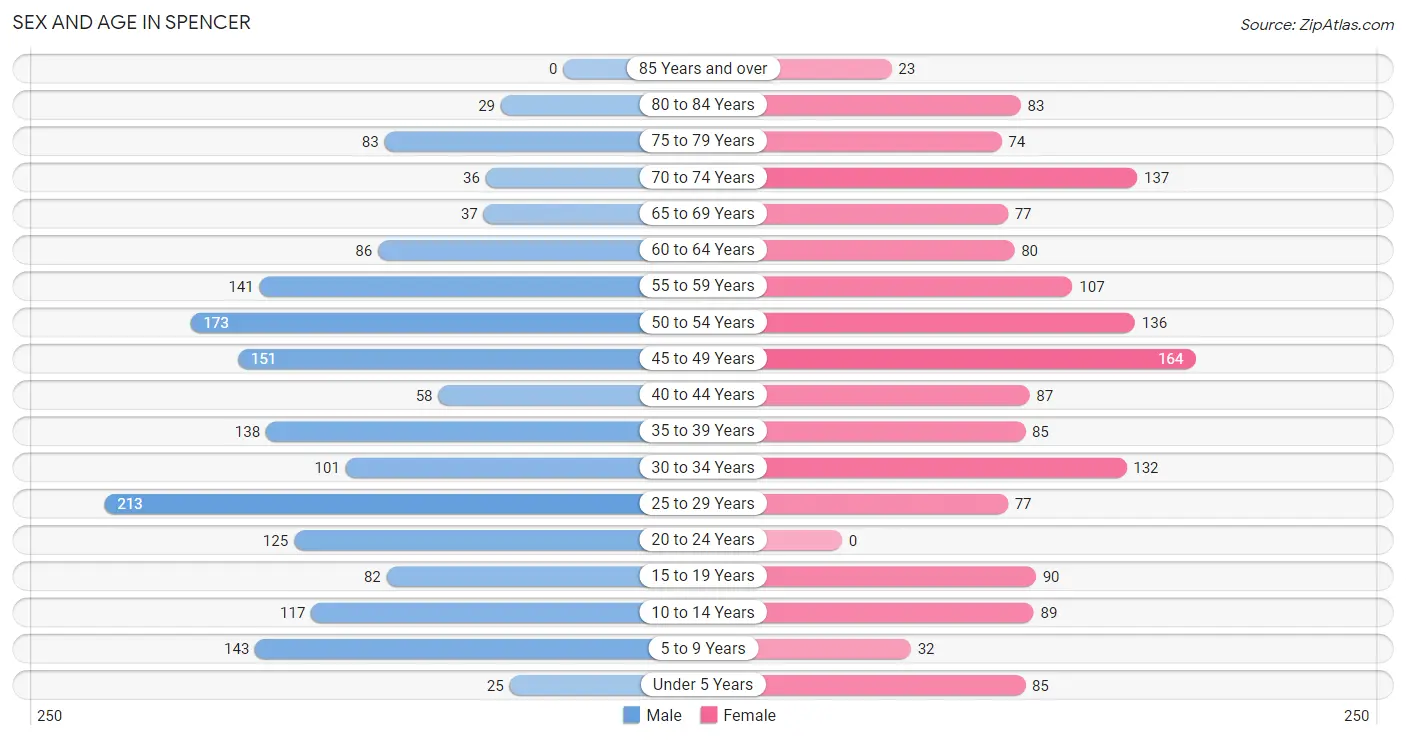
| Age Bracket | Male | Female |
| Under 5 Years | 25 (1.4%) | 85 (5.5%) |
| 5 to 9 Years | 143 (8.2%) | 32 (2.1%) |
| 10 to 14 Years | 117 (6.7%) | 89 (5.7%) |
| 15 to 19 Years | 82 (4.7%) | 90 (5.8%) |
| 20 to 24 Years | 125 (7.2%) | 0 (0.0%) |
| 25 to 29 Years | 213 (12.3%) | 77 (4.9%) |
| 30 to 34 Years | 101 (5.8%) | 132 (8.5%) |
| 35 to 39 Years | 138 (7.9%) | 85 (5.5%) |
| 40 to 44 Years | 58 (3.3%) | 87 (5.6%) |
| 45 to 49 Years | 151 (8.7%) | 164 (10.5%) |
| 50 to 54 Years | 173 (10.0%) | 136 (8.7%) |
| 55 to 59 Years | 141 (8.1%) | 107 (6.9%) |
| 60 to 64 Years | 86 (5.0%) | 80 (5.1%) |
| 65 to 69 Years | 37 (2.1%) | 77 (4.9%) |
| 70 to 74 Years | 36 (2.1%) | 137 (8.8%) |
| 75 to 79 Years | 83 (4.8%) | 74 (4.8%) |
| 80 to 84 Years | 29 (1.7%) | 83 (5.3%) |
| 85 Years and over | 0 (0.0%) | 23 (1.5%) |
| Total | 1,738 (100.0%) | 1,558 (100.0%) |
Families and Households in Spencer
Median Family Size in Spencer
The median family size in Spencer is 3.01 persons per family, with married-couple families (517 | 58.3%) accounting for the largest median family size of 3.48 persons per family. On the other hand, single male/father families (197 | 22.2%) represent the smallest median family size with 2.24 persons per family.
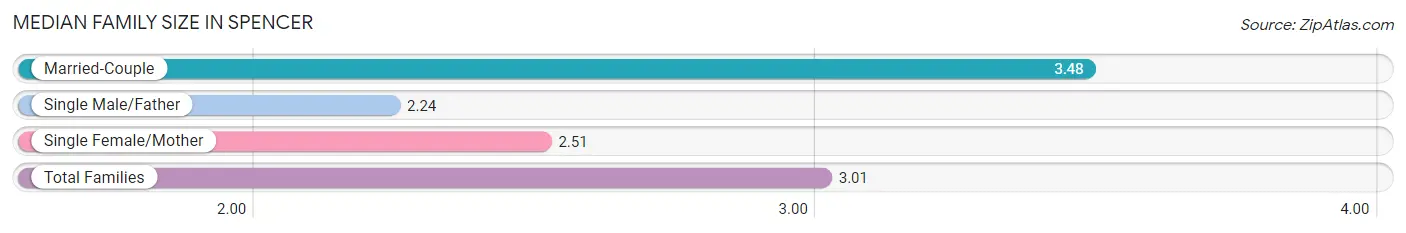
| Family Type | # Families | Family Size |
| Married-Couple | 517 (58.3%) | 3.48 |
| Single Male/Father | 197 (22.2%) | 2.24 |
| Single Female/Mother | 173 (19.5%) | 2.51 |
| Total Families | 887 (100.0%) | 3.01 |
Median Household Size in Spencer
The median household size in Spencer is 2.56 persons per household, with married-couple households (517 | 40.9%) accounting for the largest median household size of 3.55 persons per household. non-family households (378 | 29.9%) represent the smallest median household size with 1.16 persons per household.
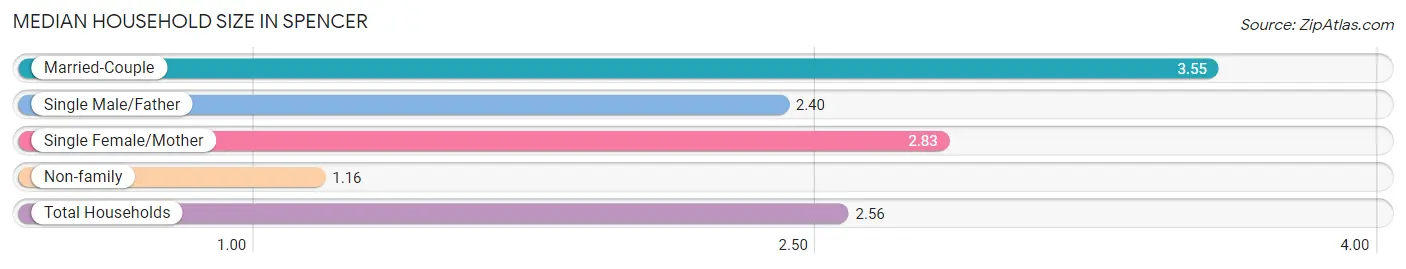
| Household Type | # Households | Household Size |
| Married-Couple | 517 (40.9%) | 3.55 |
| Single Male/Father | 197 (15.6%) | 2.40 |
| Single Female/Mother | 173 (13.7%) | 2.83 |
| Non-family | 378 (29.9%) | 1.16 |
| Total Households | 1,265 (100.0%) | 2.56 |
Household Size by Marriage Status in Spencer
Out of a total of 1,265 households in Spencer, 887 (70.1%) are family households, while 378 (29.9%) are nonfamily households. The most numerous type of family households are 2-person households, comprising 445, and the most common type of nonfamily households are 1-person households, comprising 315.
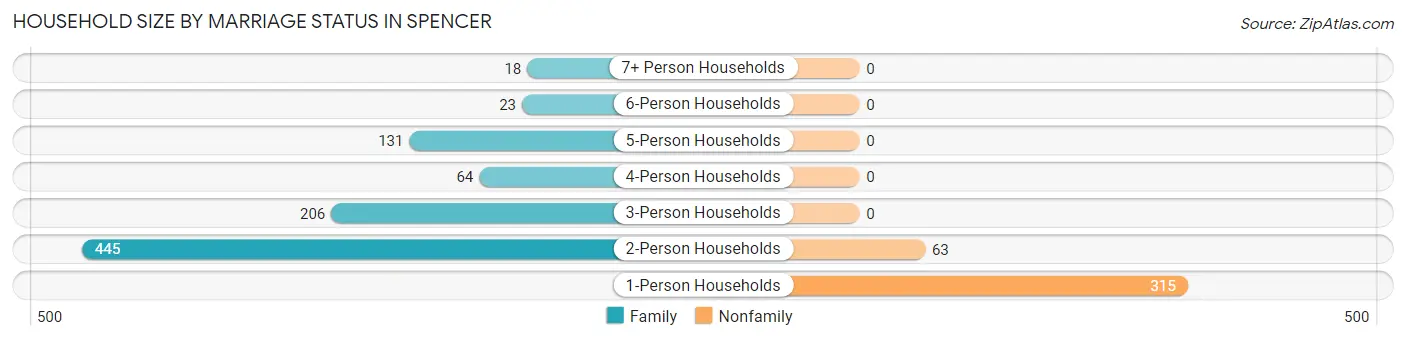
| Household Size | Family Households | Nonfamily Households |
| 1-Person Households | - | 315 (24.9%) |
| 2-Person Households | 445 (35.2%) | 63 (5.0%) |
| 3-Person Households | 206 (16.3%) | 0 (0.0%) |
| 4-Person Households | 64 (5.1%) | 0 (0.0%) |
| 5-Person Households | 131 (10.4%) | 0 (0.0%) |
| 6-Person Households | 23 (1.8%) | 0 (0.0%) |
| 7+ Person Households | 18 (1.4%) | 0 (0.0%) |
| Total | 887 (70.1%) | 378 (29.9%) |
Female Fertility in Spencer
Fertility by Age in Spencer
Average fertility rate in Spencer is 26.0 births per 1,000 women. Women in the age bracket of 20 to 34 years have the highest fertility rate with 81.0 births per 1,000 women. Women in the age bracket of 20 to 34 years acount for 100.0% of all women with births.
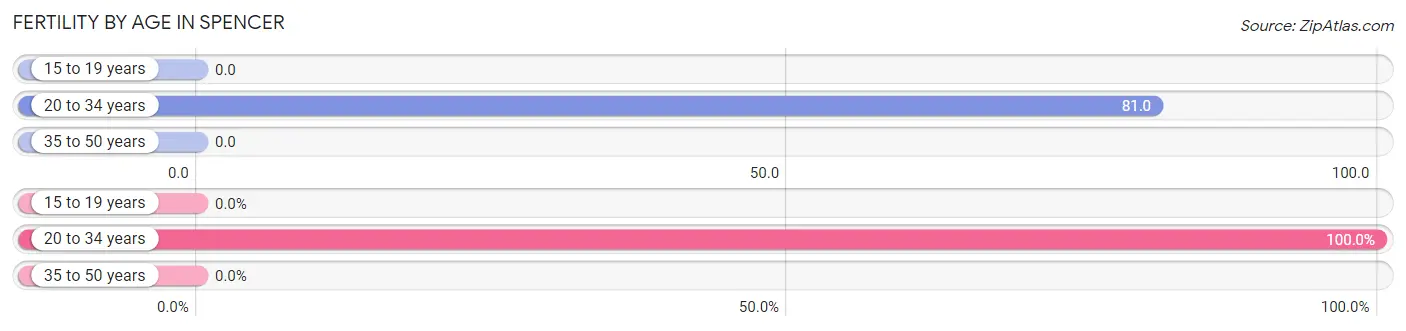
| Age Bracket | Women with Births | Births / 1,000 Women |
| 15 to 19 years | 0 (0.0%) | 0.0 |
| 20 to 34 years | 17 (100.0%) | 81.0 |
| 35 to 50 years | 0 (0.0%) | 0.0 |
| Total | 17 (100.0%) | 26.0 |
Fertility by Age by Marriage Status in Spencer
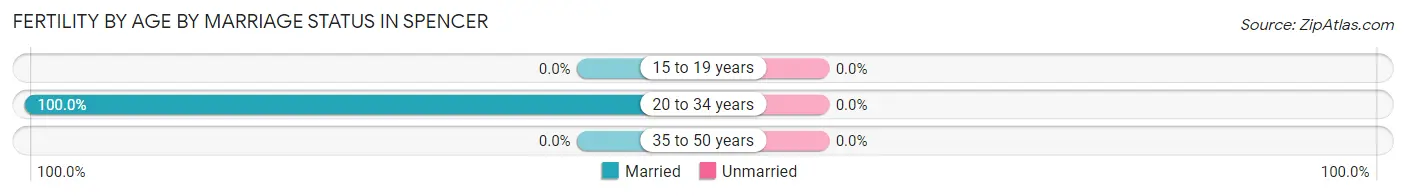
| Age Bracket | Married | Unmarried |
| 15 to 19 years | 0 (0.0%) | 0 (0.0%) |
| 20 to 34 years | 17 (100.0%) | 0 (0.0%) |
| 35 to 50 years | 0 (0.0%) | 0 (0.0%) |
| Total | 17 (100.0%) | 0 (0.0%) |
Fertility by Education in Spencer
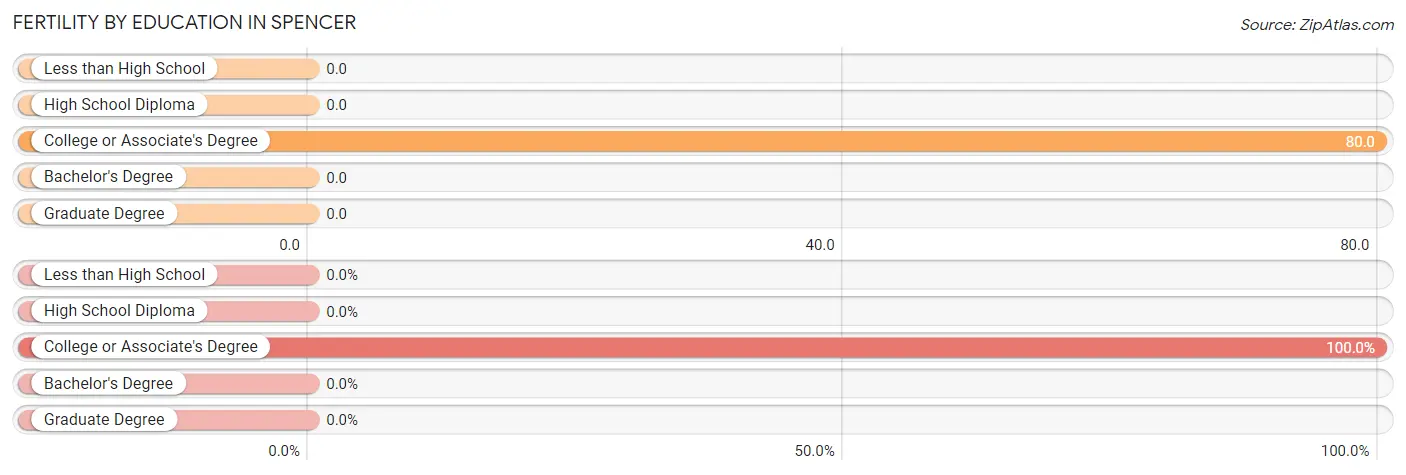
| Educational Attainment | Women with Births | Births / 1,000 Women |
| Less than High School | 0 (0.0%) | 0.0 |
| High School Diploma | 0 (0.0%) | 0.0 |
| College or Associate's Degree | 17 (100.0%) | 80.0 |
| Bachelor's Degree | 0 (0.0%) | 0.0 |
| Graduate Degree | 0 (0.0%) | 0.0 |
| Total | 17 (100.0%) | 26.0 |
Fertility by Education by Marriage Status in Spencer
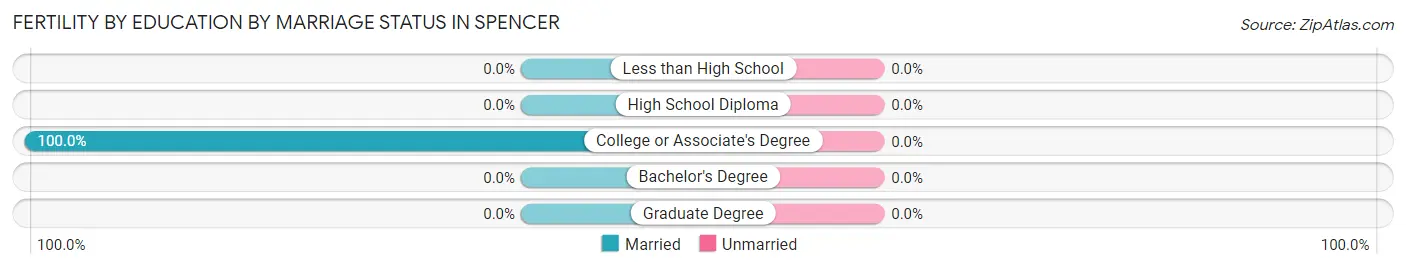
| Educational Attainment | Married | Unmarried |
| Less than High School | 0 (0.0%) | 0 (0.0%) |
| High School Diploma | 0 (0.0%) | 0 (0.0%) |
| College or Associate's Degree | 17 (100.0%) | 0 (0.0%) |
| Bachelor's Degree | 0 (0.0%) | 0 (0.0%) |
| Graduate Degree | 0 (0.0%) | 0 (0.0%) |
| Total | 17 (100.0%) | 0 (0.0%) |
Employment Characteristics in Spencer
Employment by Class of Employer in Spencer
Among the 1,466 employed individuals in Spencer, private company employees (1,064 | 72.6%), not-for-profit organizations (80 | 5.5%), and local government employees (68 | 4.6%) make up the most common classes of employment.
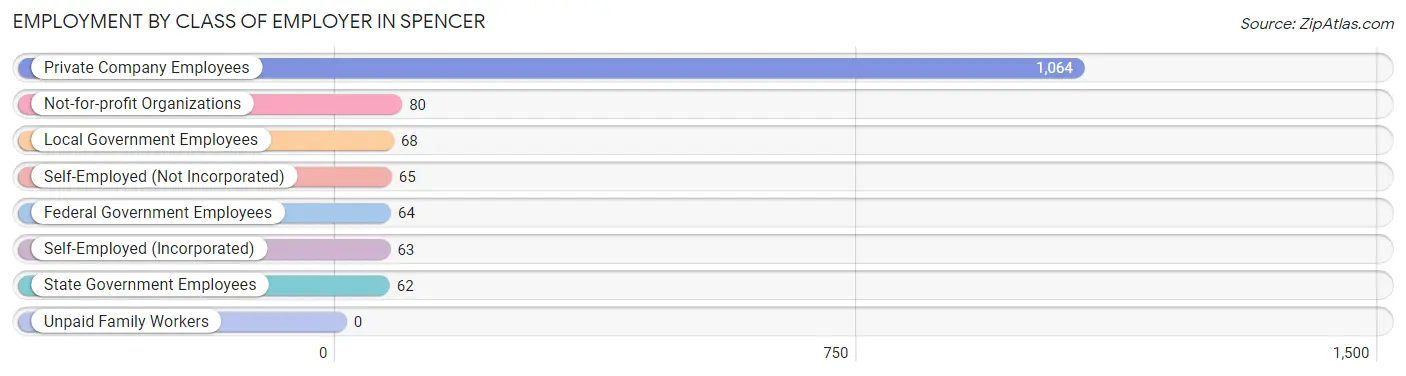
| Employer Class | # Employees | % Employees |
| Private Company Employees | 1,064 | 72.6% |
| Self-Employed (Incorporated) | 63 | 4.3% |
| Self-Employed (Not Incorporated) | 65 | 4.4% |
| Not-for-profit Organizations | 80 | 5.5% |
| Local Government Employees | 68 | 4.6% |
| State Government Employees | 62 | 4.2% |
| Federal Government Employees | 64 | 4.4% |
| Unpaid Family Workers | 0 | 0.0% |
| Total | 1,466 | 100.0% |
Employment Status by Age in Spencer
According to the labor force statistics for Spencer, out of the total population over 16 years of age (2,796), 59.9% or 1,675 individuals are in the labor force, with 9.0% or 151 of them unemployed. The age group with the highest labor force participation rate is 30 to 34 years, with 95.7% or 223 individuals in the labor force. Within the labor force, the 30 to 34 years age range has the highest percentage of unemployed individuals, with 43.9% or 98 of them being unemployed.
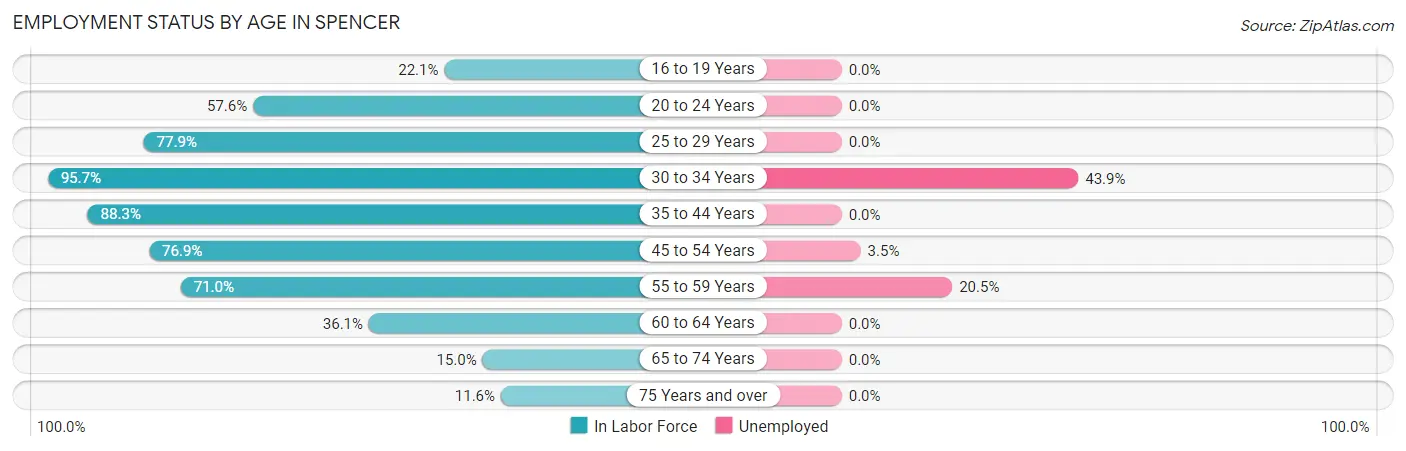
| Age Bracket | In Labor Force | Unemployed |
| 16 to 19 Years | 36 (22.1%) | 0 (0.0%) |
| 20 to 24 Years | 72 (57.6%) | 0 (0.0%) |
| 25 to 29 Years | 226 (77.9%) | 0 (0.0%) |
| 30 to 34 Years | 223 (95.7%) | 98 (43.9%) |
| 35 to 44 Years | 325 (88.3%) | 0 (0.0%) |
| 45 to 54 Years | 480 (76.9%) | 17 (3.5%) |
| 55 to 59 Years | 176 (71.0%) | 36 (20.5%) |
| 60 to 64 Years | 60 (36.1%) | 0 (0.0%) |
| 65 to 74 Years | 43 (15.0%) | 0 (0.0%) |
| 75 Years and over | 34 (11.6%) | 0 (0.0%) |
| Total | 1,675 (59.9%) | 151 (9.0%) |
Employment Status by Educational Attainment in Spencer
According to labor force statistics for Spencer, 77.2% of individuals (1,489) out of the total population between 25 and 64 years of age (1,929) are in the labor force, with 10.1% or 150 of them being unemployed. The group with the highest labor force participation rate are those with the educational attainment of bachelor's degree or higher, with 89.7% or 399 individuals in the labor force. Within the labor force, individuals with less than high school education have the highest percentage of unemployment, with 67.9% or 112 of them being unemployed.
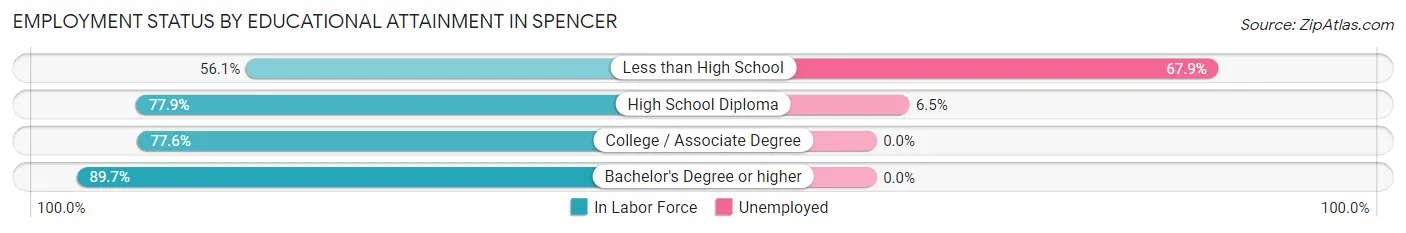
| Educational Attainment | In Labor Force | Unemployed |
| Less than High School | 165 (56.1%) | 200 (67.9%) |
| High School Diploma | 596 (77.9%) | 50 (6.5%) |
| College / Associate Degree | 330 (77.6%) | 0 (0.0%) |
| Bachelor's Degree or higher | 399 (89.7%) | 0 (0.0%) |
| Total | 1,489 (77.2%) | 195 (10.1%) |
Employment Occupations by Sex in Spencer
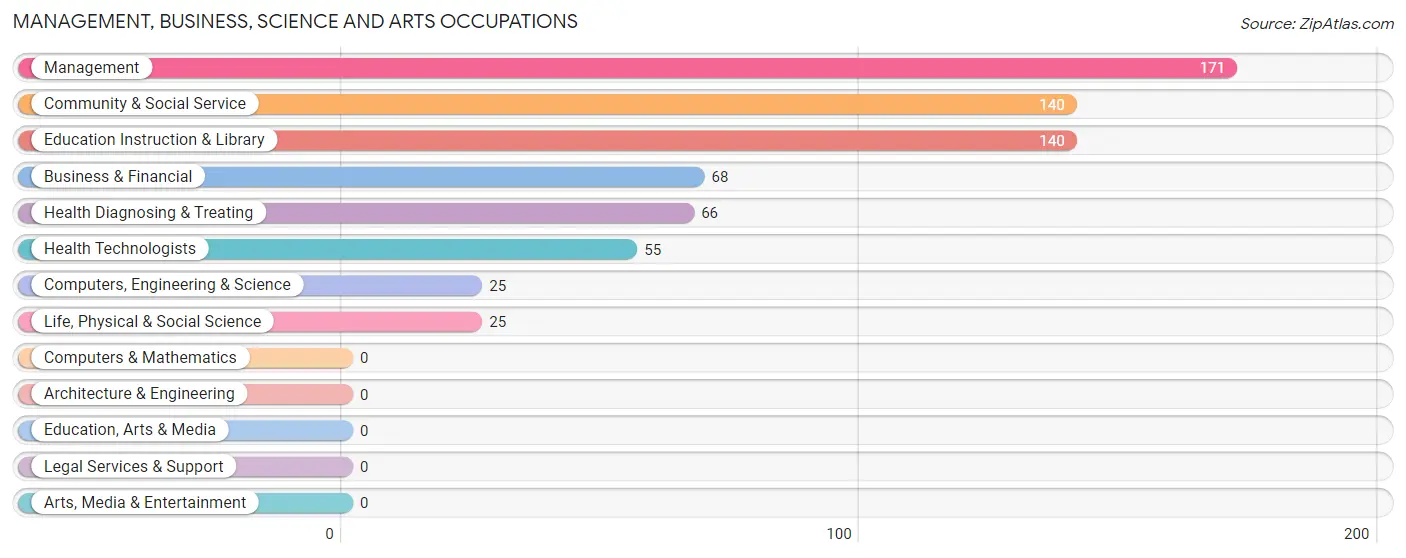
Management, Business, Science and Arts Occupations
The most common Management, Business, Science and Arts occupations in Spencer are Management (171 | 11.2%), Community & Social Service (140 | 9.2%), Education Instruction & Library (140 | 9.2%), Business & Financial (68 | 4.5%), and Health Diagnosing & Treating (66 | 4.3%).
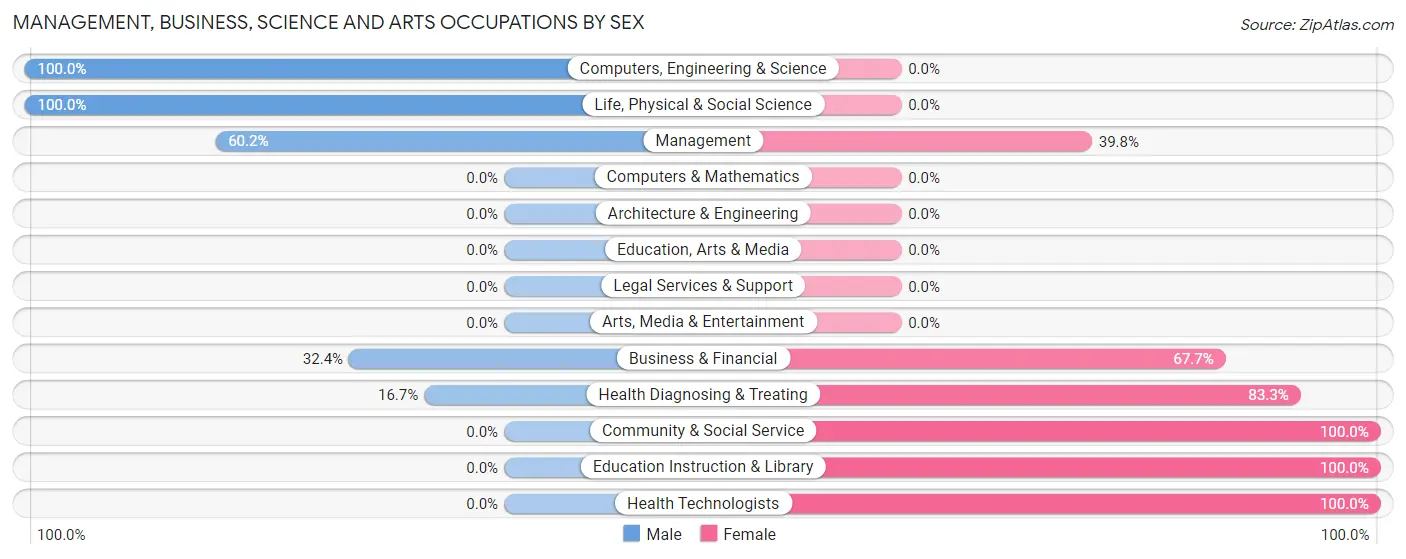
Management, Business, Science and Arts Occupations by Sex
Within the Management, Business, Science and Arts occupations in Spencer, the most male-oriented occupations are Computers, Engineering & Science (100.0%), Life, Physical & Social Science (100.0%), and Management (60.2%), while the most female-oriented occupations are Community & Social Service (100.0%), Education Instruction & Library (100.0%), and Health Technologists (100.0%).
| Occupation | Male | Female |
| Management | 103 (60.2%) | 68 (39.8%) |
| Business & Financial | 22 (32.4%) | 46 (67.6%) |
| Computers, Engineering & Science | 25 (100.0%) | 0 (0.0%) |
| Computers & Mathematics | 0 (0.0%) | 0 (0.0%) |
| Architecture & Engineering | 0 (0.0%) | 0 (0.0%) |
| Life, Physical & Social Science | 25 (100.0%) | 0 (0.0%) |
| Community & Social Service | 0 (0.0%) | 140 (100.0%) |
| Education, Arts & Media | 0 (0.0%) | 0 (0.0%) |
| Legal Services & Support | 0 (0.0%) | 0 (0.0%) |
| Education Instruction & Library | 0 (0.0%) | 140 (100.0%) |
| Arts, Media & Entertainment | 0 (0.0%) | 0 (0.0%) |
| Health Diagnosing & Treating | 11 (16.7%) | 55 (83.3%) |
| Health Technologists | 0 (0.0%) | 55 (100.0%) |
| Total (Category) | 161 (34.3%) | 309 (65.7%) |
| Total (Overall) | 964 (63.2%) | 560 (36.7%) |
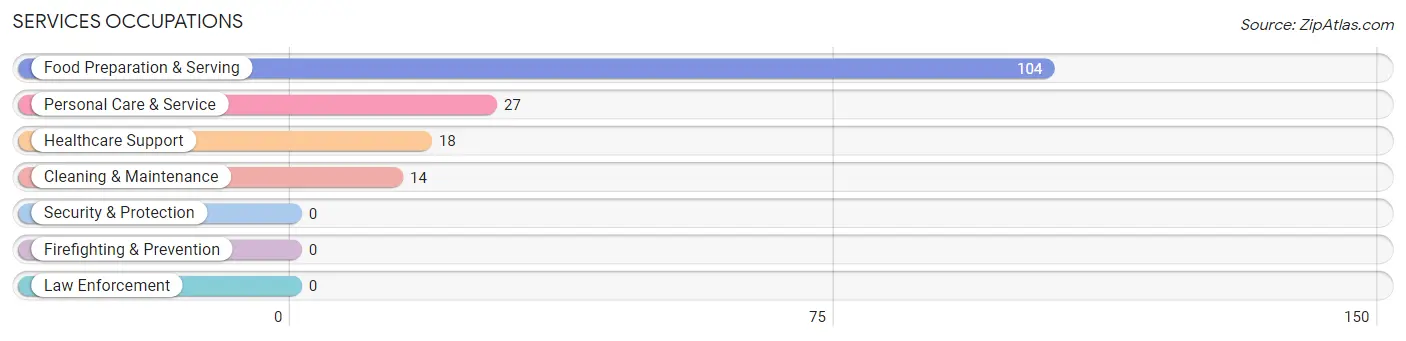
Services Occupations
The most common Services occupations in Spencer are Food Preparation & Serving (104 | 6.8%), Personal Care & Service (27 | 1.8%), Healthcare Support (18 | 1.2%), and Cleaning & Maintenance (14 | 0.9%).
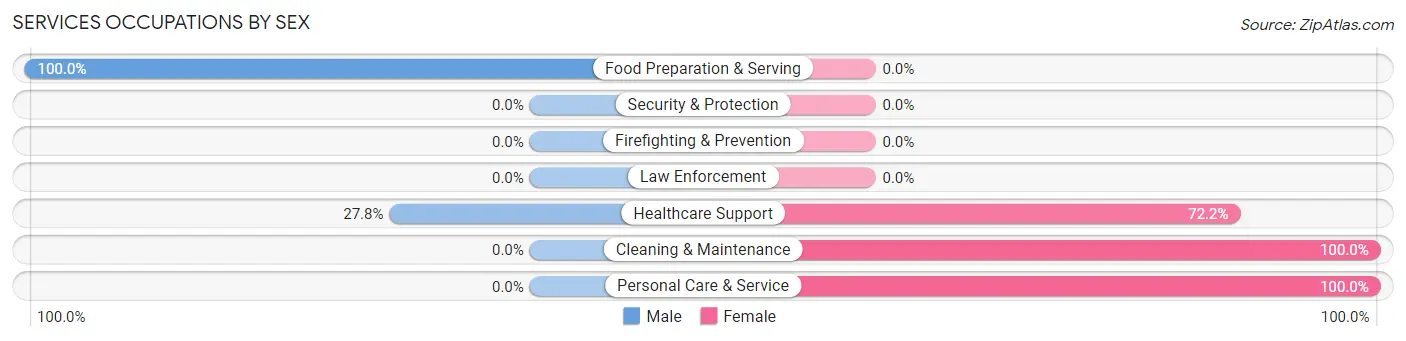
Services Occupations by Sex
Within the Services occupations in Spencer, the most male-oriented occupations are Food Preparation & Serving (100.0%), and Healthcare Support (27.8%), while the most female-oriented occupations are Cleaning & Maintenance (100.0%), Personal Care & Service (100.0%), and Healthcare Support (72.2%).
| Occupation | Male | Female |
| Healthcare Support | 5 (27.8%) | 13 (72.2%) |
| Security & Protection | 0 (0.0%) | 0 (0.0%) |
| Firefighting & Prevention | 0 (0.0%) | 0 (0.0%) |
| Law Enforcement | 0 (0.0%) | 0 (0.0%) |
| Food Preparation & Serving | 104 (100.0%) | 0 (0.0%) |
| Cleaning & Maintenance | 0 (0.0%) | 14 (100.0%) |
| Personal Care & Service | 0 (0.0%) | 27 (100.0%) |
| Total (Category) | 109 (66.9%) | 54 (33.1%) |
| Total (Overall) | 964 (63.2%) | 560 (36.7%) |
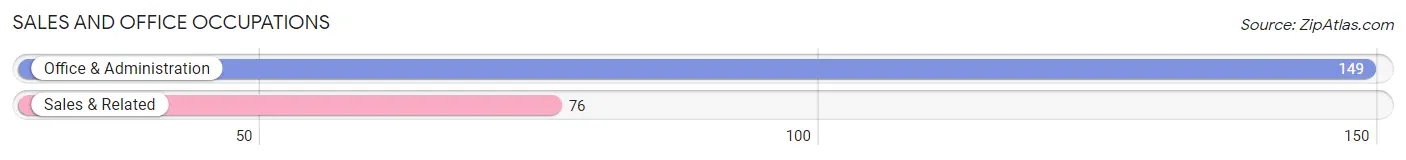
Sales and Office Occupations
The most common Sales and Office occupations in Spencer are Office & Administration (149 | 9.8%), and Sales & Related (76 | 5.0%).
Sales and Office Occupations by Sex
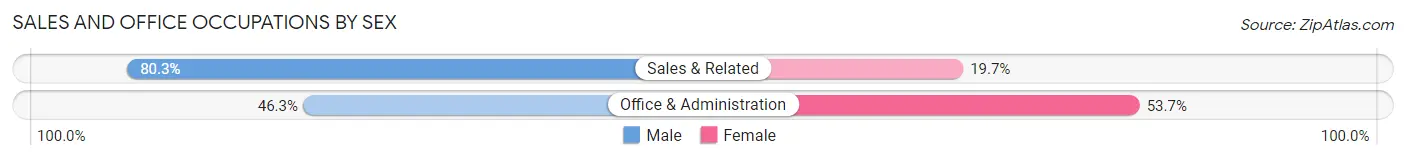
| Occupation | Male | Female |
| Sales & Related | 61 (80.3%) | 15 (19.7%) |
| Office & Administration | 69 (46.3%) | 80 (53.7%) |
| Total (Category) | 130 (57.8%) | 95 (42.2%) |
| Total (Overall) | 964 (63.2%) | 560 (36.7%) |
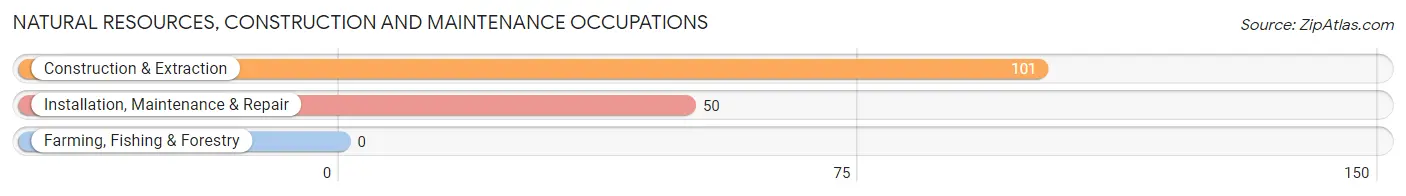
Natural Resources, Construction and Maintenance Occupations
The most common Natural Resources, Construction and Maintenance occupations in Spencer are Construction & Extraction (101 | 6.6%), and Installation, Maintenance & Repair (50 | 3.3%).
Natural Resources, Construction and Maintenance Occupations by Sex
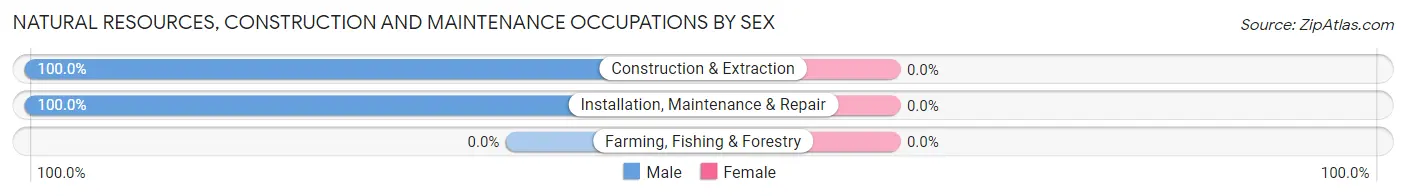
| Occupation | Male | Female |
| Farming, Fishing & Forestry | 0 (0.0%) | 0 (0.0%) |
| Construction & Extraction | 101 (100.0%) | 0 (0.0%) |
| Installation, Maintenance & Repair | 50 (100.0%) | 0 (0.0%) |
| Total (Category) | 151 (100.0%) | 0 (0.0%) |
| Total (Overall) | 964 (63.2%) | 560 (36.7%) |
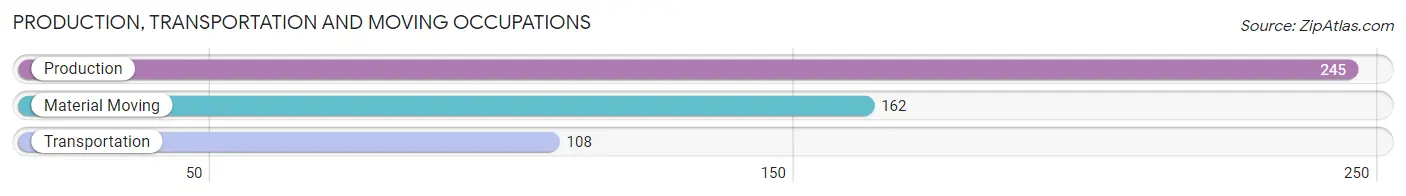
Production, Transportation and Moving Occupations
The most common Production, Transportation and Moving occupations in Spencer are Production (245 | 16.1%), Material Moving (162 | 10.6%), and Transportation (108 | 7.1%).
Production, Transportation and Moving Occupations by Sex
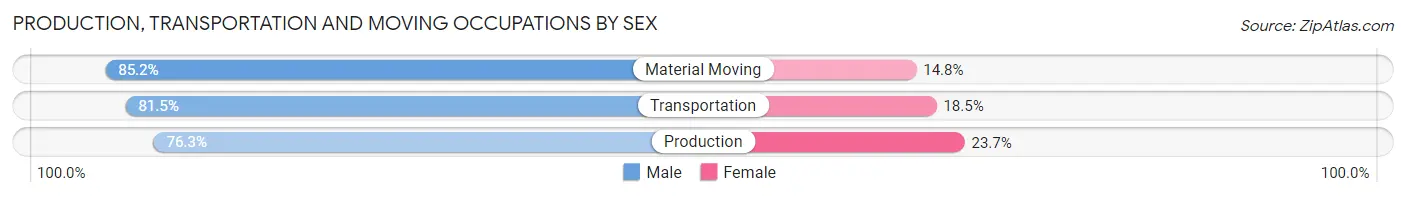
| Occupation | Male | Female |
| Production | 187 (76.3%) | 58 (23.7%) |
| Transportation | 88 (81.5%) | 20 (18.5%) |
| Material Moving | 138 (85.2%) | 24 (14.8%) |
| Total (Category) | 413 (80.2%) | 102 (19.8%) |
| Total (Overall) | 964 (63.2%) | 560 (36.7%) |
Employment Industries by Sex in Spencer
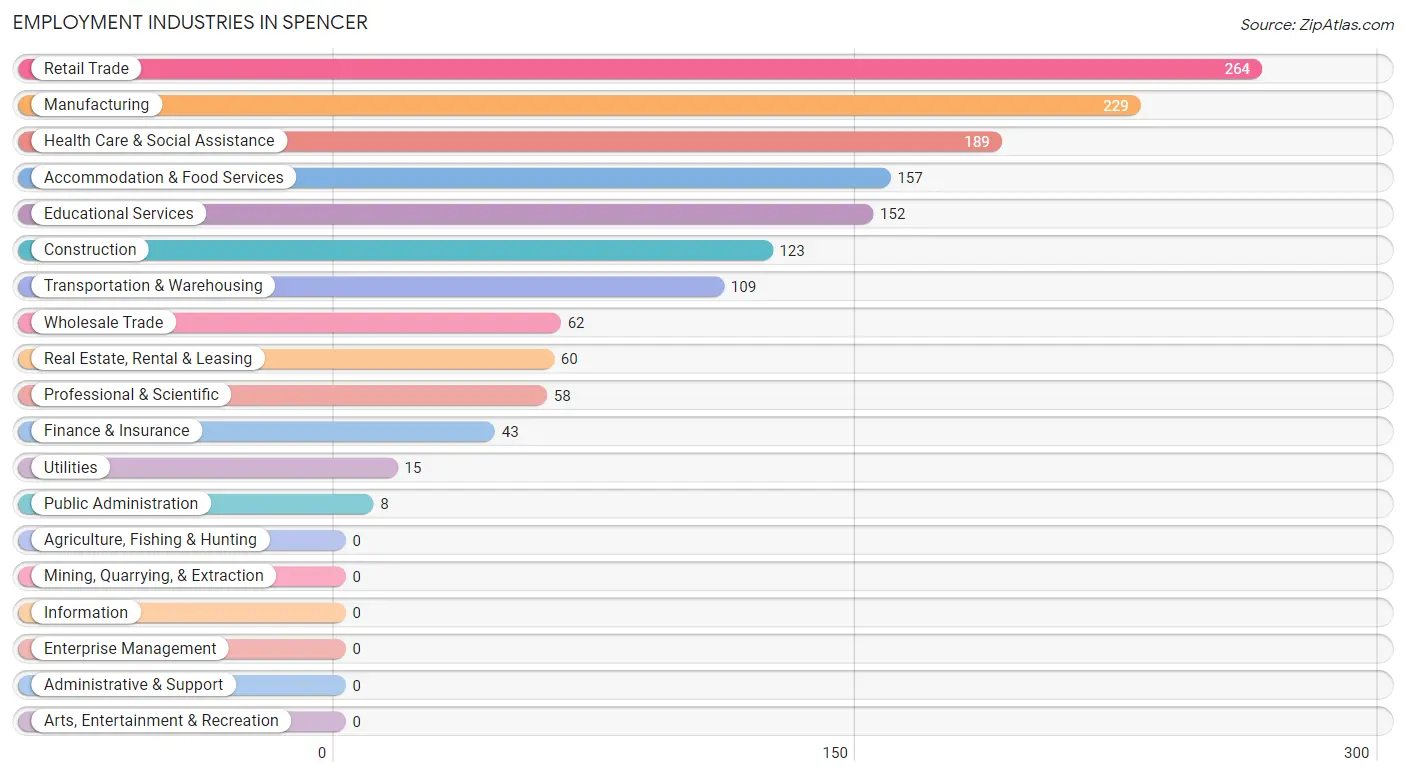
Employment Industries in Spencer
The major employment industries in Spencer include Retail Trade (264 | 17.3%), Manufacturing (229 | 15.0%), Health Care & Social Assistance (189 | 12.4%), Accommodation & Food Services (157 | 10.3%), and Educational Services (152 | 10.0%).
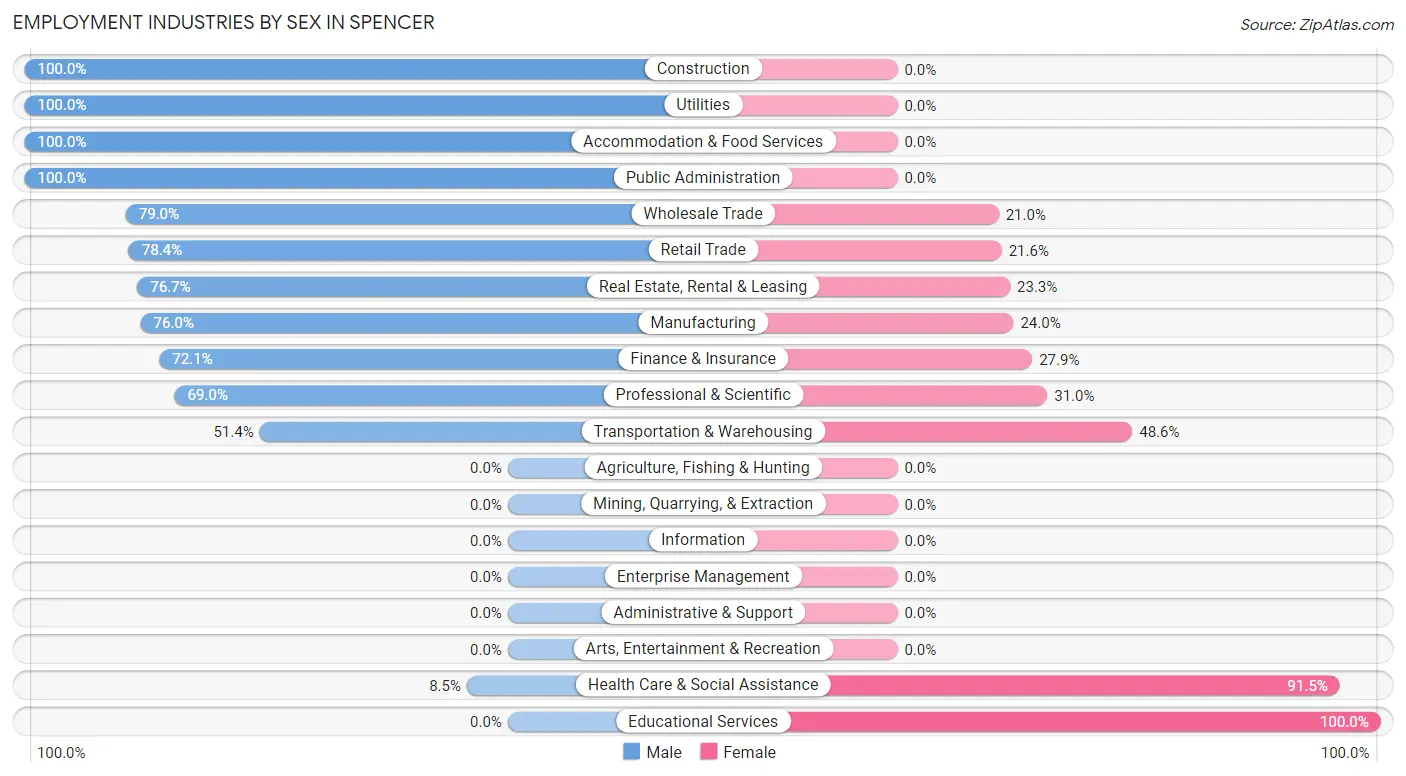
Employment Industries by Sex in Spencer
The Spencer industries that see more men than women are Construction (100.0%), Utilities (100.0%), and Accommodation & Food Services (100.0%), whereas the industries that tend to have a higher number of women are Educational Services (100.0%), Health Care & Social Assistance (91.5%), and Transportation & Warehousing (48.6%).
| Industry | Male | Female |
| Agriculture, Fishing & Hunting | 0 (0.0%) | 0 (0.0%) |
| Mining, Quarrying, & Extraction | 0 (0.0%) | 0 (0.0%) |
| Construction | 123 (100.0%) | 0 (0.0%) |
| Manufacturing | 174 (76.0%) | 55 (24.0%) |
| Wholesale Trade | 49 (79.0%) | 13 (21.0%) |
| Retail Trade | 207 (78.4%) | 57 (21.6%) |
| Transportation & Warehousing | 56 (51.4%) | 53 (48.6%) |
| Utilities | 15 (100.0%) | 0 (0.0%) |
| Information | 0 (0.0%) | 0 (0.0%) |
| Finance & Insurance | 31 (72.1%) | 12 (27.9%) |
| Real Estate, Rental & Leasing | 46 (76.7%) | 14 (23.3%) |
| Professional & Scientific | 40 (69.0%) | 18 (31.0%) |
| Enterprise Management | 0 (0.0%) | 0 (0.0%) |
| Administrative & Support | 0 (0.0%) | 0 (0.0%) |
| Educational Services | 0 (0.0%) | 152 (100.0%) |
| Health Care & Social Assistance | 16 (8.5%) | 173 (91.5%) |
| Arts, Entertainment & Recreation | 0 (0.0%) | 0 (0.0%) |
| Accommodation & Food Services | 157 (100.0%) | 0 (0.0%) |
| Public Administration | 8 (100.0%) | 0 (0.0%) |
| Total | 964 (63.2%) | 560 (36.7%) |
Education in Spencer
School Enrollment in Spencer
The most common levels of schooling among the 747 students in Spencer are middle school (196 | 26.2%), college / undergraduate (187 | 25.0%), and high school (162 | 21.7%).
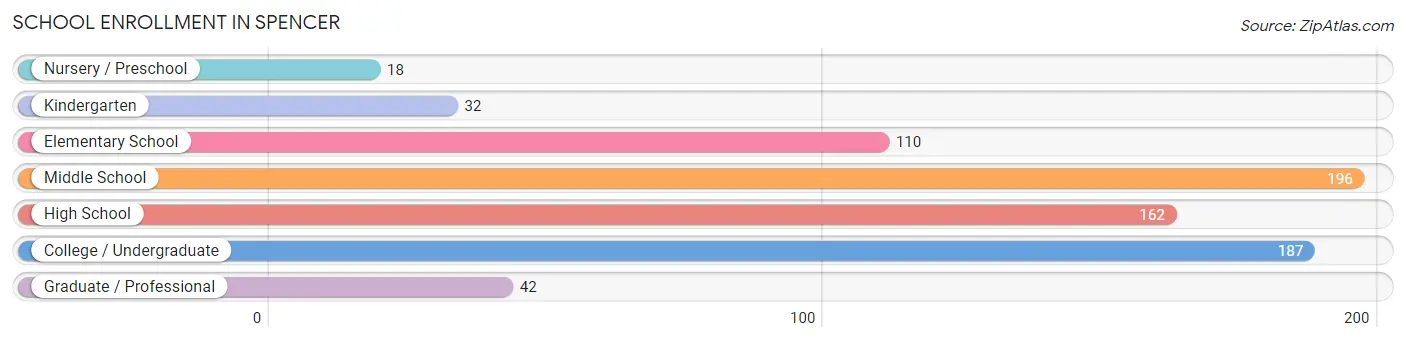
| School Level | # Students | % Students |
| Nursery / Preschool | 18 | 2.4% |
| Kindergarten | 32 | 4.3% |
| Elementary School | 110 | 14.7% |
| Middle School | 196 | 26.2% |
| High School | 162 | 21.7% |
| College / Undergraduate | 187 | 25.0% |
| Graduate / Professional | 42 | 5.6% |
| Total | 747 | 100.0% |
School Enrollment by Age by Funding Source in Spencer
Out of a total of 747 students who are enrolled in schools in Spencer, 210 (28.1%) attend a private institution, while the remaining 537 (71.9%) are enrolled in public schools. The age group of 20 to 24 year olds has the highest likelihood of being enrolled in private schools, with 36 (80.0% in the age bracket) enrolled. Conversely, the age group of 3 to 4 year olds has the lowest likelihood of being enrolled in a private school, with 18 (100.0% in the age bracket) attending a public institution.
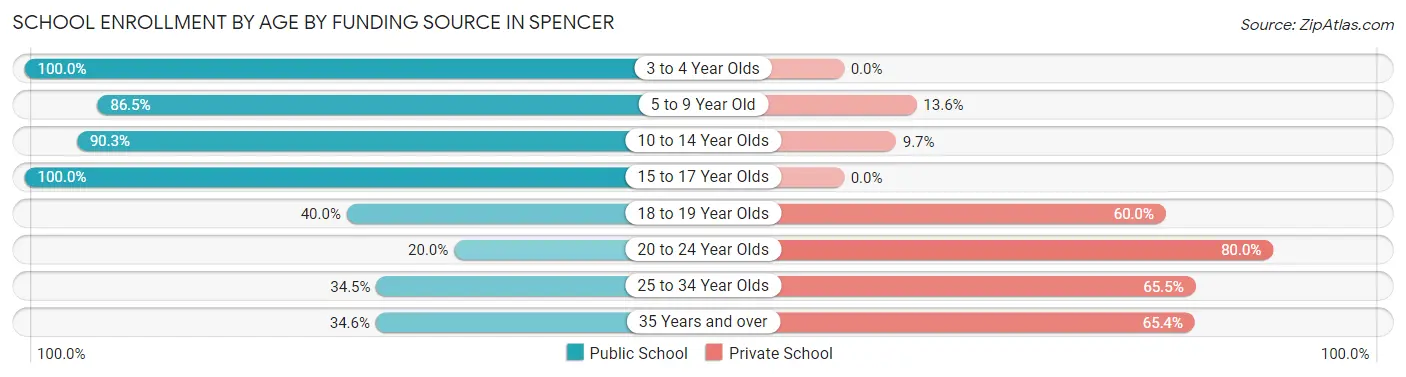
| Age Bracket | Public School | Private School |
| 3 to 4 Year Olds | 18 (100.0%) | 0 (0.0%) |
| 5 to 9 Year Old | 134 (86.5%) | 21 (13.6%) |
| 10 to 14 Year Olds | 186 (90.3%) | 20 (9.7%) |
| 15 to 17 Year Olds | 116 (100.0%) | 0 (0.0%) |
| 18 to 19 Year Olds | 18 (40.0%) | 27 (60.0%) |
| 20 to 24 Year Olds | 9 (20.0%) | 36 (80.0%) |
| 25 to 34 Year Olds | 10 (34.5%) | 19 (65.5%) |
| 35 Years and over | 46 (34.6%) | 87 (65.4%) |
| Total | 537 (71.9%) | 210 (28.1%) |
Educational Attainment by Field of Study in Spencer
Business (215 | 44.5%), education (91 | 18.8%), psychology (56 | 11.6%), engineering (43 | 8.9%), and science & technology (26 | 5.4%) are the most common fields of study among 483 individuals in Spencer who have obtained a bachelor's degree or higher.
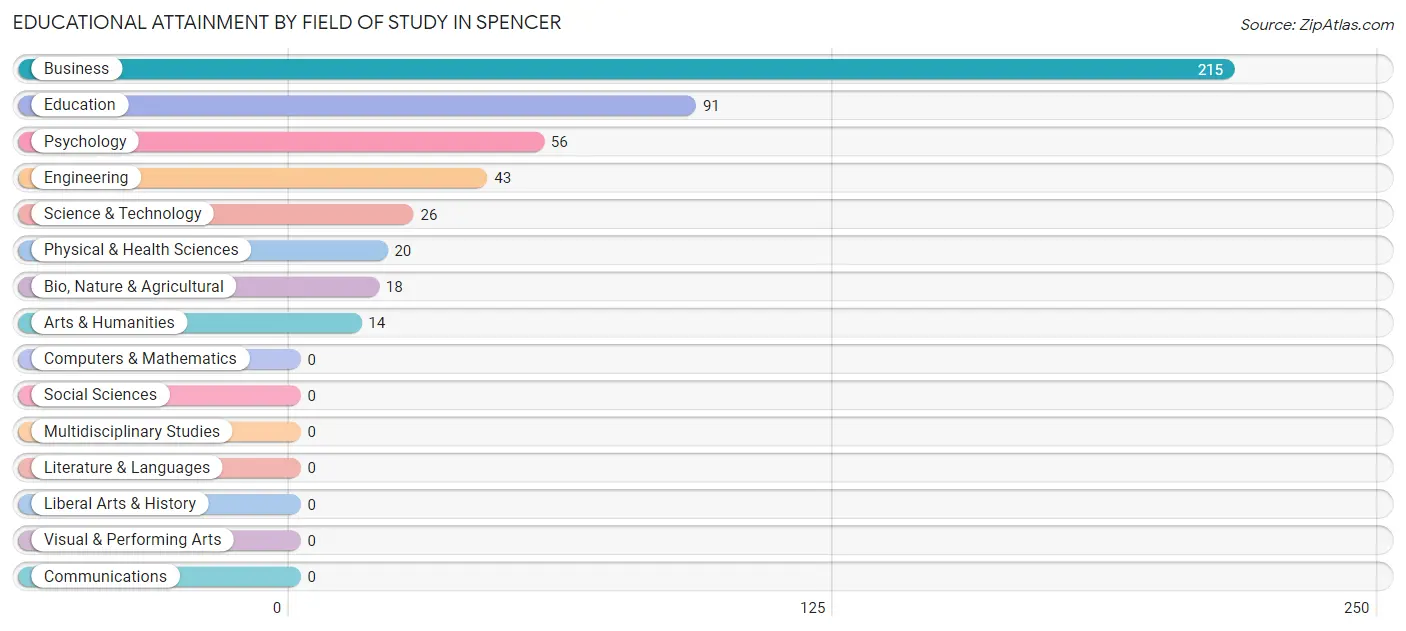
| Field of Study | # Graduates | % Graduates |
| Computers & Mathematics | 0 | 0.0% |
| Bio, Nature & Agricultural | 18 | 3.7% |
| Physical & Health Sciences | 20 | 4.1% |
| Psychology | 56 | 11.6% |
| Social Sciences | 0 | 0.0% |
| Engineering | 43 | 8.9% |
| Multidisciplinary Studies | 0 | 0.0% |
| Science & Technology | 26 | 5.4% |
| Business | 215 | 44.5% |
| Education | 91 | 18.8% |
| Literature & Languages | 0 | 0.0% |
| Liberal Arts & History | 0 | 0.0% |
| Visual & Performing Arts | 0 | 0.0% |
| Communications | 0 | 0.0% |
| Arts & Humanities | 14 | 2.9% |
| Total | 483 | 100.0% |
Transportation & Commute in Spencer
Vehicle Availability by Sex in Spencer
The most prevalent vehicle ownership categories in Spencer are males with 2 vehicles (423, accounting for 44.3%) and females with 2 vehicles (213, making up 82.6%).
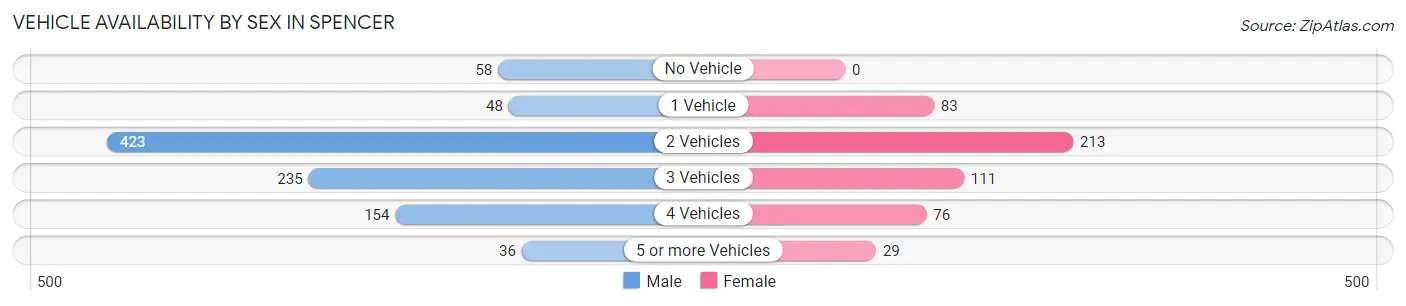
| Vehicles Available | Male | Female |
| No Vehicle | 58 (6.1%) | 0 (0.0%) |
| 1 Vehicle | 48 (5.0%) | 83 (16.2%) |
| 2 Vehicles | 423 (44.3%) | 213 (41.6%) |
| 3 Vehicles | 235 (24.6%) | 111 (21.7%) |
| 4 Vehicles | 154 (16.1%) | 76 (14.8%) |
| 5 or more Vehicles | 36 (3.8%) | 29 (5.7%) |
| Total | 954 (100.0%) | 512 (100.0%) |
Commute Time in Spencer
The most frequently occuring commute durations in Spencer are 15 to 19 minutes (331 commuters, 27.1%), 45 to 59 minutes (215 commuters, 17.6%), and 10 to 14 minutes (177 commuters, 14.5%).
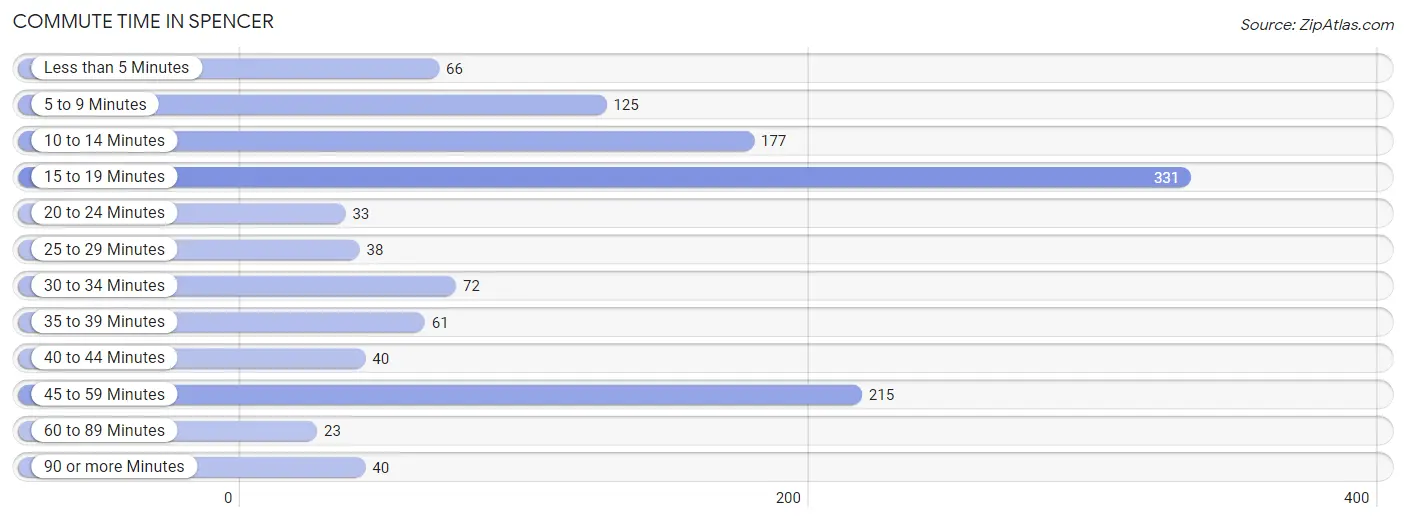
| Commute Time | # Commuters | % Commuters |
| Less than 5 Minutes | 66 | 5.4% |
| 5 to 9 Minutes | 125 | 10.2% |
| 10 to 14 Minutes | 177 | 14.5% |
| 15 to 19 Minutes | 331 | 27.1% |
| 20 to 24 Minutes | 33 | 2.7% |
| 25 to 29 Minutes | 38 | 3.1% |
| 30 to 34 Minutes | 72 | 5.9% |
| 35 to 39 Minutes | 61 | 5.0% |
| 40 to 44 Minutes | 40 | 3.3% |
| 45 to 59 Minutes | 215 | 17.6% |
| 60 to 89 Minutes | 23 | 1.9% |
| 90 or more Minutes | 40 | 3.3% |
Commute Time by Sex in Spencer
The most common commute times in Spencer are 15 to 19 minutes (255 commuters, 30.1%) for males and 5 to 9 minutes (83 commuters, 22.2%) for females.
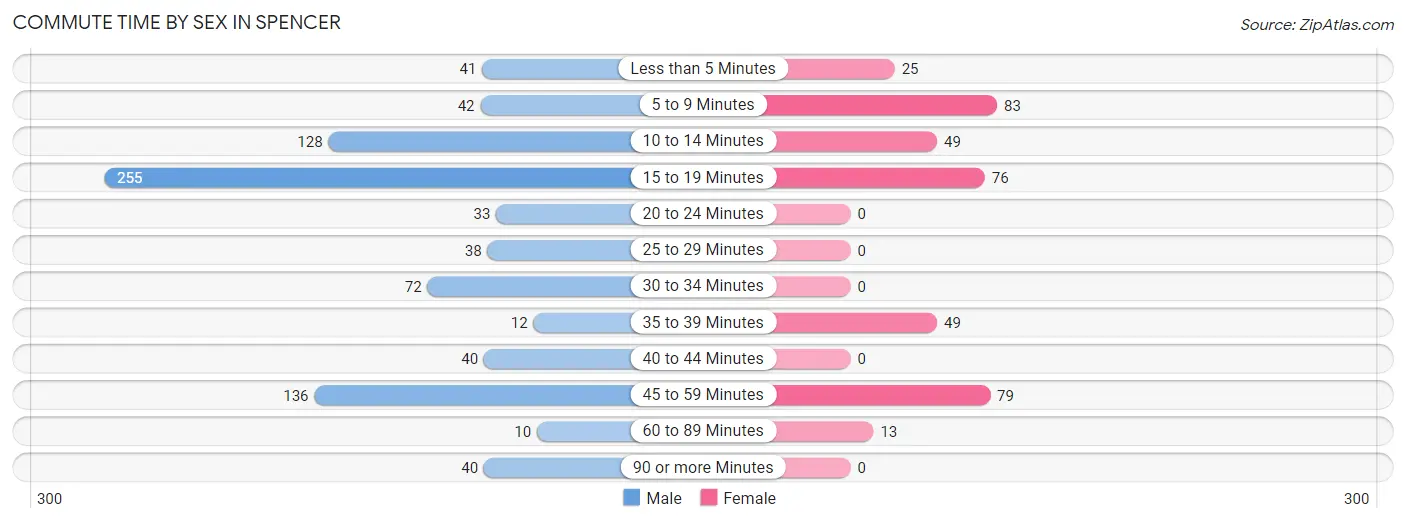
| Commute Time | Male | Female |
| Less than 5 Minutes | 41 (4.8%) | 25 (6.7%) |
| 5 to 9 Minutes | 42 (5.0%) | 83 (22.2%) |
| 10 to 14 Minutes | 128 (15.1%) | 49 (13.1%) |
| 15 to 19 Minutes | 255 (30.1%) | 76 (20.3%) |
| 20 to 24 Minutes | 33 (3.9%) | 0 (0.0%) |
| 25 to 29 Minutes | 38 (4.5%) | 0 (0.0%) |
| 30 to 34 Minutes | 72 (8.5%) | 0 (0.0%) |
| 35 to 39 Minutes | 12 (1.4%) | 49 (13.1%) |
| 40 to 44 Minutes | 40 (4.7%) | 0 (0.0%) |
| 45 to 59 Minutes | 136 (16.1%) | 79 (21.1%) |
| 60 to 89 Minutes | 10 (1.2%) | 13 (3.5%) |
| 90 or more Minutes | 40 (4.7%) | 0 (0.0%) |
Time of Departure to Work by Sex in Spencer
The most frequent times of departure to work in Spencer are 12:00 AM to 4:59 AM (177, 20.9%) for males and 7:00 AM to 7:29 AM (80, 21.4%) for females.
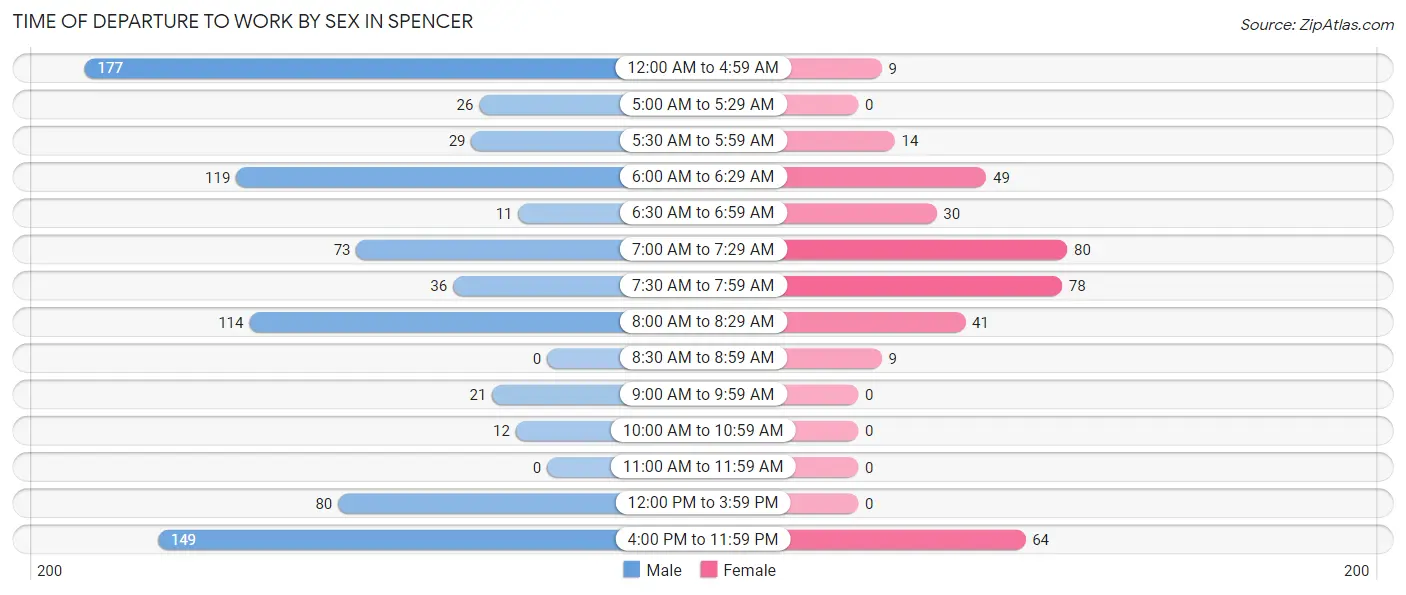
| Time of Departure | Male | Female |
| 12:00 AM to 4:59 AM | 177 (20.9%) | 9 (2.4%) |
| 5:00 AM to 5:29 AM | 26 (3.1%) | 0 (0.0%) |
| 5:30 AM to 5:59 AM | 29 (3.4%) | 14 (3.7%) |
| 6:00 AM to 6:29 AM | 119 (14.1%) | 49 (13.1%) |
| 6:30 AM to 6:59 AM | 11 (1.3%) | 30 (8.0%) |
| 7:00 AM to 7:29 AM | 73 (8.6%) | 80 (21.4%) |
| 7:30 AM to 7:59 AM | 36 (4.3%) | 78 (20.9%) |
| 8:00 AM to 8:29 AM | 114 (13.5%) | 41 (11.0%) |
| 8:30 AM to 8:59 AM | 0 (0.0%) | 9 (2.4%) |
| 9:00 AM to 9:59 AM | 21 (2.5%) | 0 (0.0%) |
| 10:00 AM to 10:59 AM | 12 (1.4%) | 0 (0.0%) |
| 11:00 AM to 11:59 AM | 0 (0.0%) | 0 (0.0%) |
| 12:00 PM to 3:59 PM | 80 (9.5%) | 0 (0.0%) |
| 4:00 PM to 11:59 PM | 149 (17.6%) | 64 (17.1%) |
| Total | 847 (100.0%) | 374 (100.0%) |
Housing Occupancy in Spencer
Occupancy by Ownership in Spencer
Of the total 1,265 dwellings in Spencer, owner-occupied units account for 775 (61.3%), while renter-occupied units make up 490 (38.7%).
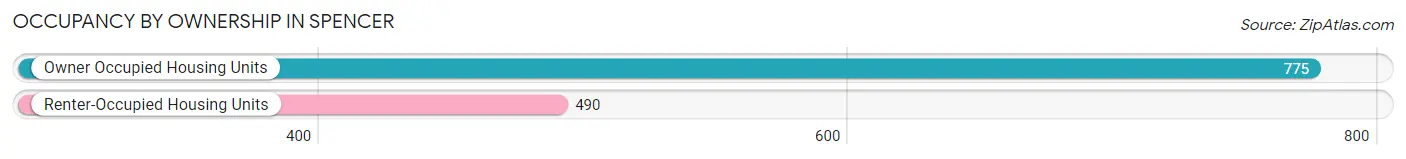
| Occupancy | # Housing Units | % Housing Units |
| Owner Occupied Housing Units | 775 | 61.3% |
| Renter-Occupied Housing Units | 490 | 38.7% |
| Total Occupied Housing Units | 1,265 | 100.0% |
Occupancy by Household Size in Spencer
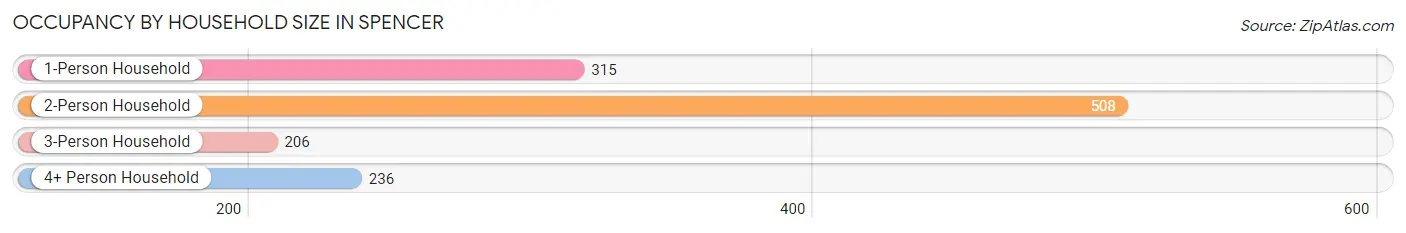
| Household Size | # Housing Units | % Housing Units |
| 1-Person Household | 315 | 24.9% |
| 2-Person Household | 508 | 40.2% |
| 3-Person Household | 206 | 16.3% |
| 4+ Person Household | 236 | 18.7% |
| Total Housing Units | 1,265 | 100.0% |
Occupancy by Ownership by Household Size in Spencer
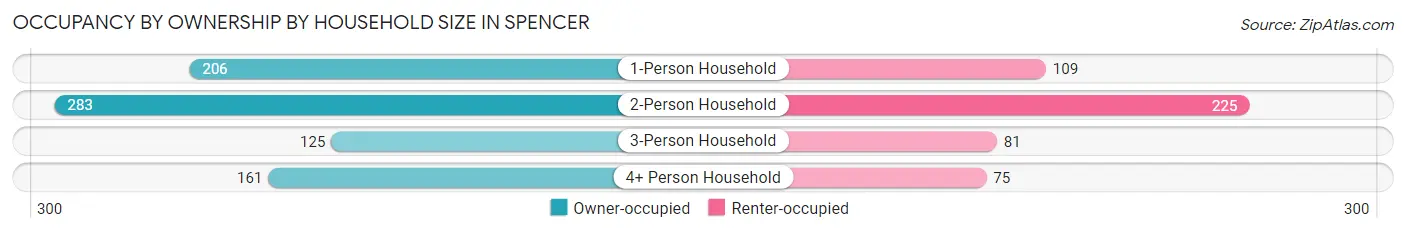
| Household Size | Owner-occupied | Renter-occupied |
| 1-Person Household | 206 (65.4%) | 109 (34.6%) |
| 2-Person Household | 283 (55.7%) | 225 (44.3%) |
| 3-Person Household | 125 (60.7%) | 81 (39.3%) |
| 4+ Person Household | 161 (68.2%) | 75 (31.8%) |
| Total Housing Units | 775 (61.3%) | 490 (38.7%) |
Occupancy by Educational Attainment in Spencer
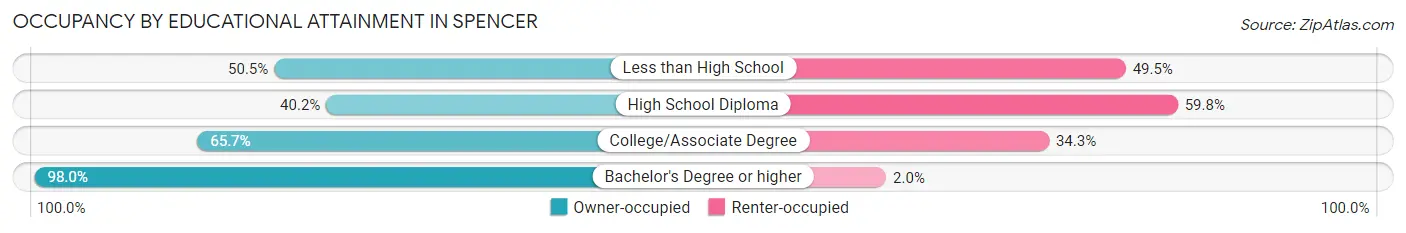
| Household Size | Owner-occupied | Renter-occupied |
| Less than High School | 142 (50.5%) | 139 (49.5%) |
| High School Diploma | 150 (40.2%) | 223 (59.8%) |
| College/Associate Degree | 236 (65.7%) | 123 (34.3%) |
| Bachelor's Degree or higher | 247 (98.0%) | 5 (2.0%) |
Occupancy by Age of Householder in Spencer
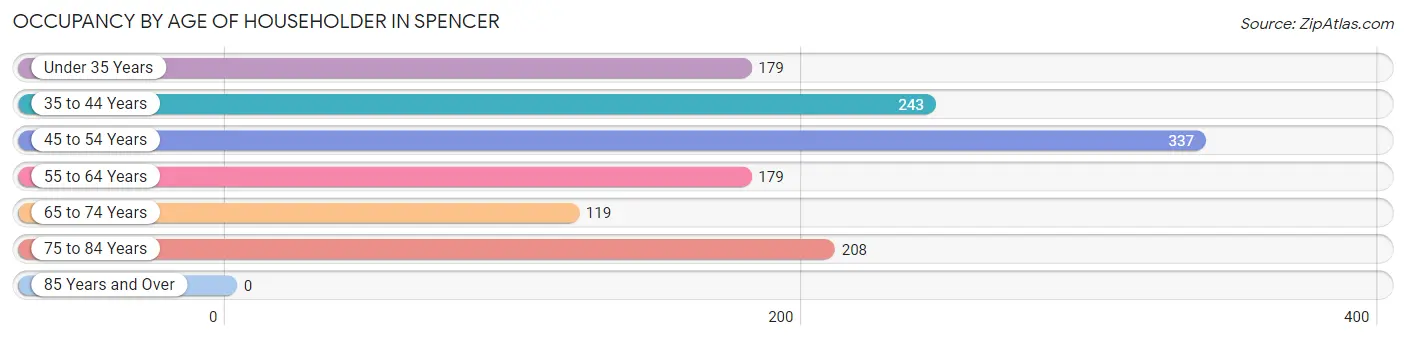
| Age Bracket | # Households | % Households |
| Under 35 Years | 179 | 14.1% |
| 35 to 44 Years | 243 | 19.2% |
| 45 to 54 Years | 337 | 26.6% |
| 55 to 64 Years | 179 | 14.1% |
| 65 to 74 Years | 119 | 9.4% |
| 75 to 84 Years | 208 | 16.4% |
| 85 Years and Over | 0 | 0.0% |
| Total | 1,265 | 100.0% |
Housing Finances in Spencer
Median Income by Occupancy in Spencer

| Occupancy Type | # Households | Median Income |
| Owner-Occupied | 775 (61.3%) | $74,344 |
| Renter-Occupied | 490 (38.7%) | $38,462 |
| Average | 1,265 (100.0%) | $61,079 |
Occupancy by Householder Income Bracket in Spencer
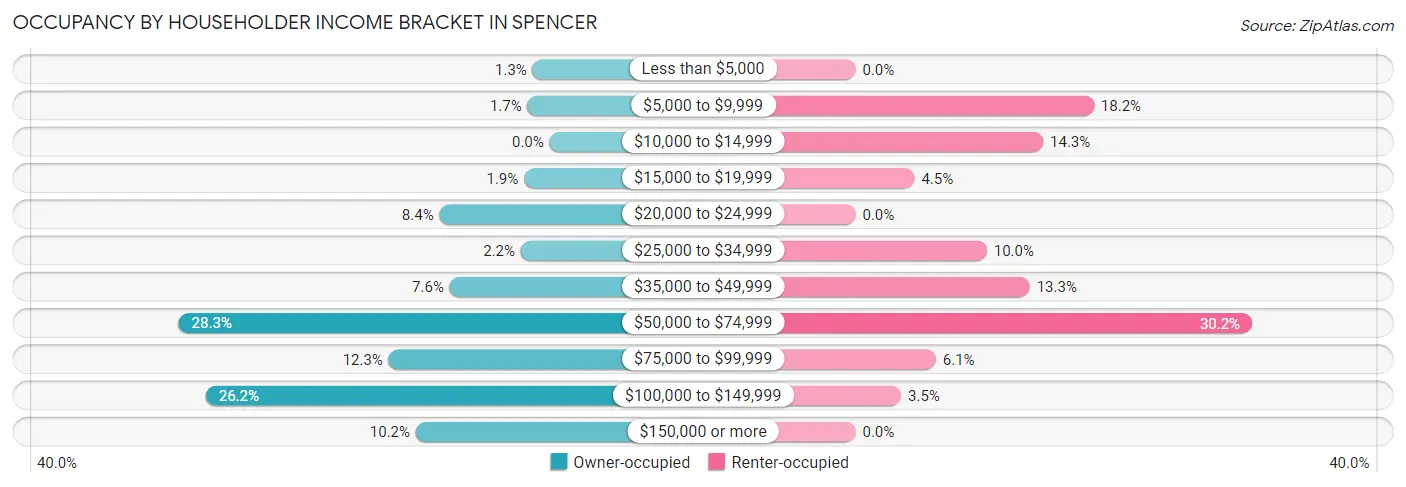
| Income Bracket | Owner-occupied | Renter-occupied |
| Less than $5,000 | 10 (1.3%) | 0 (0.0%) |
| $5,000 to $9,999 | 13 (1.7%) | 89 (18.2%) |
| $10,000 to $14,999 | 0 (0.0%) | 70 (14.3%) |
| $15,000 to $19,999 | 15 (1.9%) | 22 (4.5%) |
| $20,000 to $24,999 | 65 (8.4%) | 0 (0.0%) |
| $25,000 to $34,999 | 17 (2.2%) | 49 (10.0%) |
| $35,000 to $49,999 | 59 (7.6%) | 65 (13.3%) |
| $50,000 to $74,999 | 219 (28.3%) | 148 (30.2%) |
| $75,000 to $99,999 | 95 (12.3%) | 30 (6.1%) |
| $100,000 to $149,999 | 203 (26.2%) | 17 (3.5%) |
| $150,000 or more | 79 (10.2%) | 0 (0.0%) |
| Total | 775 (100.0%) | 490 (100.0%) |
Monthly Housing Cost Tiers in Spencer
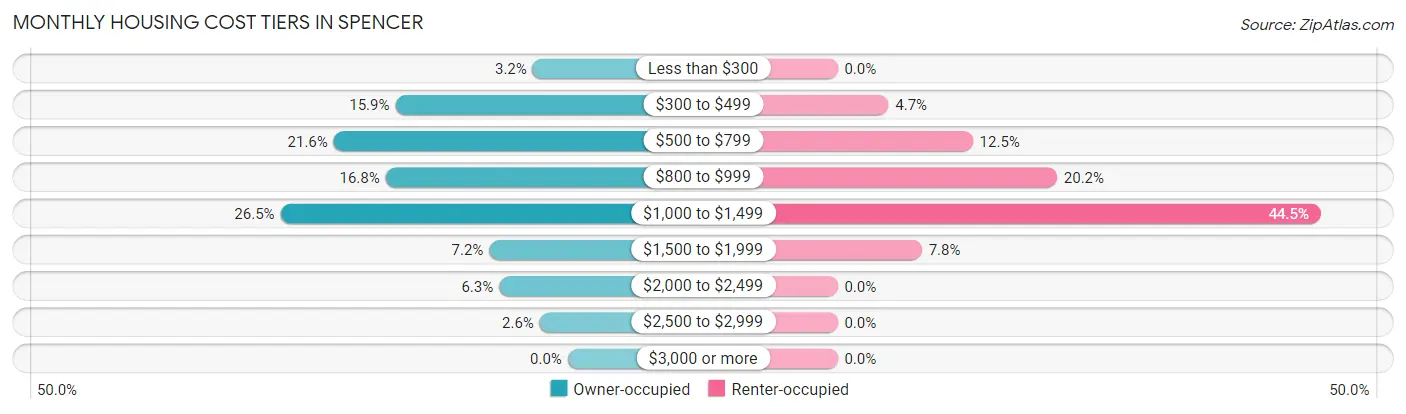
| Monthly Cost | Owner-occupied | Renter-occupied |
| Less than $300 | 25 (3.2%) | 0 (0.0%) |
| $300 to $499 | 123 (15.9%) | 23 (4.7%) |
| $500 to $799 | 167 (21.5%) | 61 (12.4%) |
| $800 to $999 | 130 (16.8%) | 99 (20.2%) |
| $1,000 to $1,499 | 205 (26.5%) | 218 (44.5%) |
| $1,500 to $1,999 | 56 (7.2%) | 38 (7.8%) |
| $2,000 to $2,499 | 49 (6.3%) | 0 (0.0%) |
| $2,500 to $2,999 | 20 (2.6%) | 0 (0.0%) |
| $3,000 or more | 0 (0.0%) | 0 (0.0%) |
| Total | 775 (100.0%) | 490 (100.0%) |
Physical Housing Characteristics in Spencer
Housing Structures in Spencer
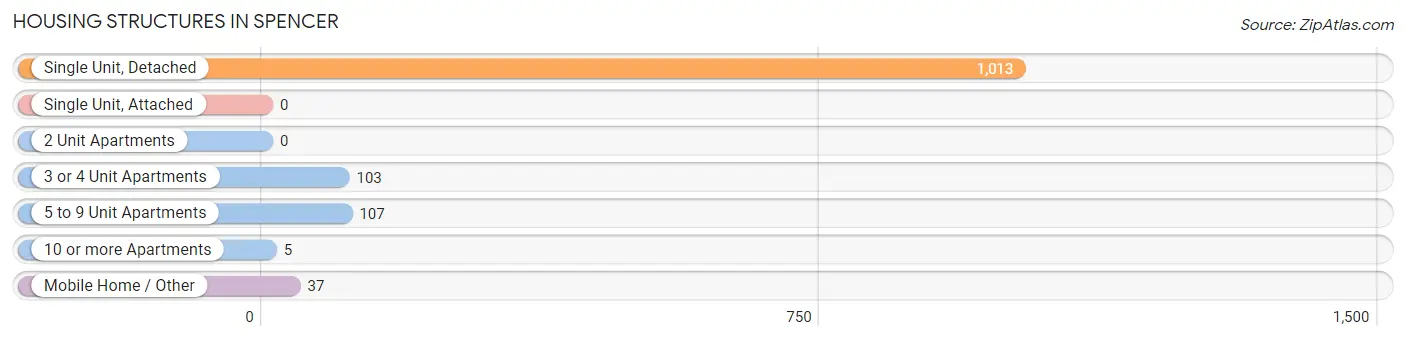
| Structure Type | # Housing Units | % Housing Units |
| Single Unit, Detached | 1,013 | 80.1% |
| Single Unit, Attached | 0 | 0.0% |
| 2 Unit Apartments | 0 | 0.0% |
| 3 or 4 Unit Apartments | 103 | 8.1% |
| 5 to 9 Unit Apartments | 107 | 8.5% |
| 10 or more Apartments | 5 | 0.4% |
| Mobile Home / Other | 37 | 2.9% |
| Total | 1,265 | 100.0% |
Housing Structures by Occupancy in Spencer
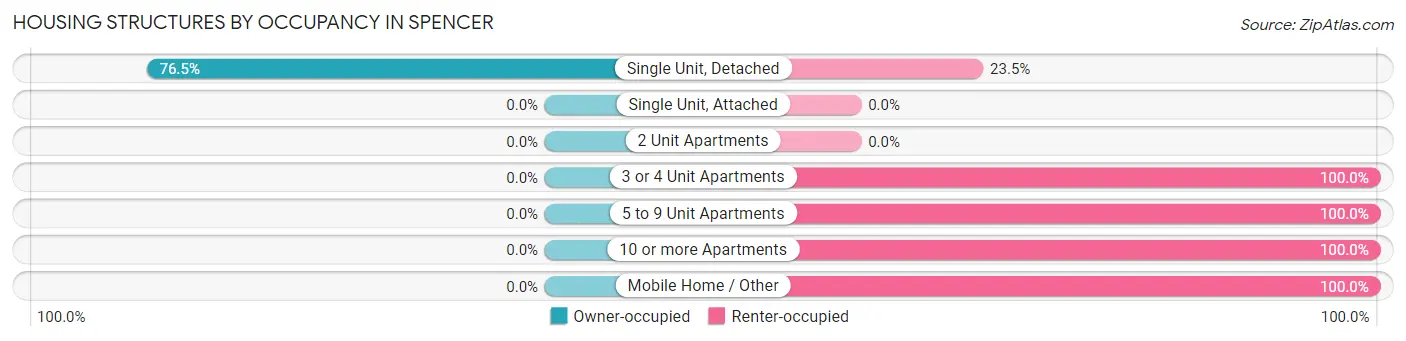
| Structure Type | Owner-occupied | Renter-occupied |
| Single Unit, Detached | 775 (76.5%) | 238 (23.5%) |
| Single Unit, Attached | 0 (0.0%) | 0 (0.0%) |
| 2 Unit Apartments | 0 (0.0%) | 0 (0.0%) |
| 3 or 4 Unit Apartments | 0 (0.0%) | 103 (100.0%) |
| 5 to 9 Unit Apartments | 0 (0.0%) | 107 (100.0%) |
| 10 or more Apartments | 0 (0.0%) | 5 (100.0%) |
| Mobile Home / Other | 0 (0.0%) | 37 (100.0%) |
| Total | 775 (61.3%) | 490 (38.7%) |
Housing Structures by Number of Rooms in Spencer
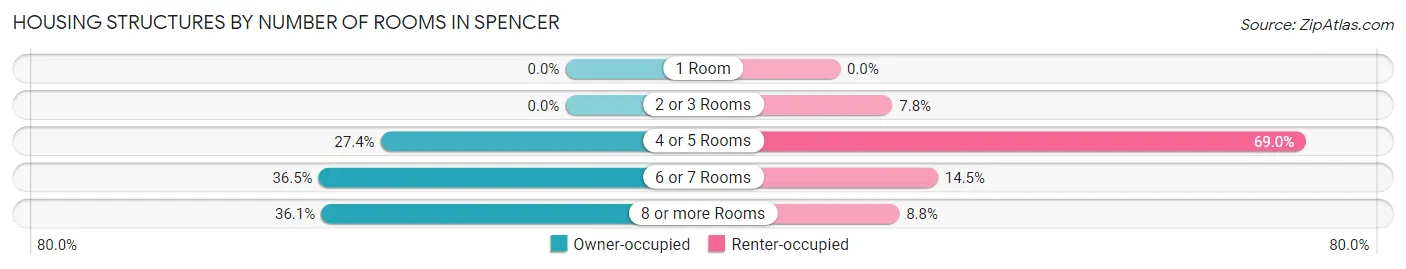
| Number of Rooms | Owner-occupied | Renter-occupied |
| 1 Room | 0 (0.0%) | 0 (0.0%) |
| 2 or 3 Rooms | 0 (0.0%) | 38 (7.8%) |
| 4 or 5 Rooms | 212 (27.4%) | 338 (69.0%) |
| 6 or 7 Rooms | 283 (36.5%) | 71 (14.5%) |
| 8 or more Rooms | 280 (36.1%) | 43 (8.8%) |
| Total | 775 (100.0%) | 490 (100.0%) |
Housing Structure by Heating Type in Spencer
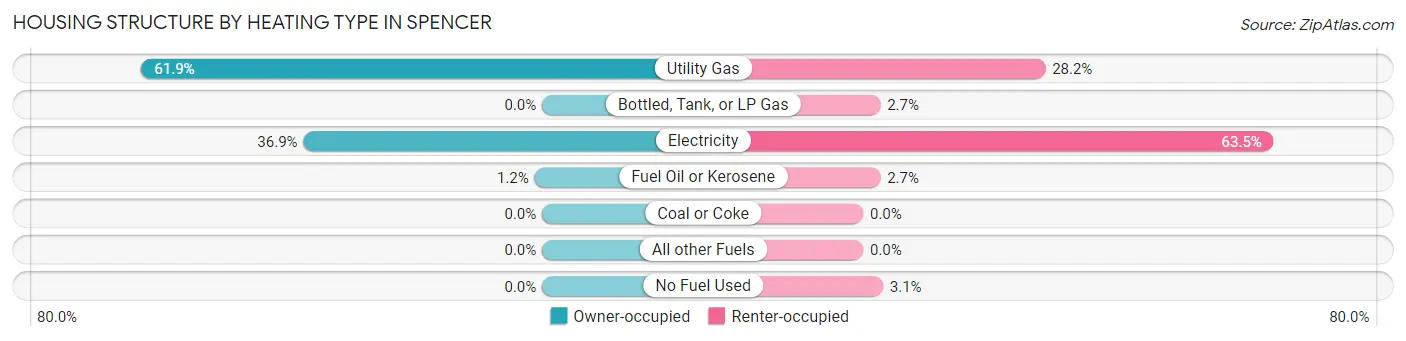
| Heating Type | Owner-occupied | Renter-occupied |
| Utility Gas | 480 (61.9%) | 138 (28.2%) |
| Bottled, Tank, or LP Gas | 0 (0.0%) | 13 (2.6%) |
| Electricity | 286 (36.9%) | 311 (63.5%) |
| Fuel Oil or Kerosene | 9 (1.2%) | 13 (2.6%) |
| Coal or Coke | 0 (0.0%) | 0 (0.0%) |
| All other Fuels | 0 (0.0%) | 0 (0.0%) |
| No Fuel Used | 0 (0.0%) | 15 (3.1%) |
| Total | 775 (100.0%) | 490 (100.0%) |
Household Vehicle Usage in Spencer
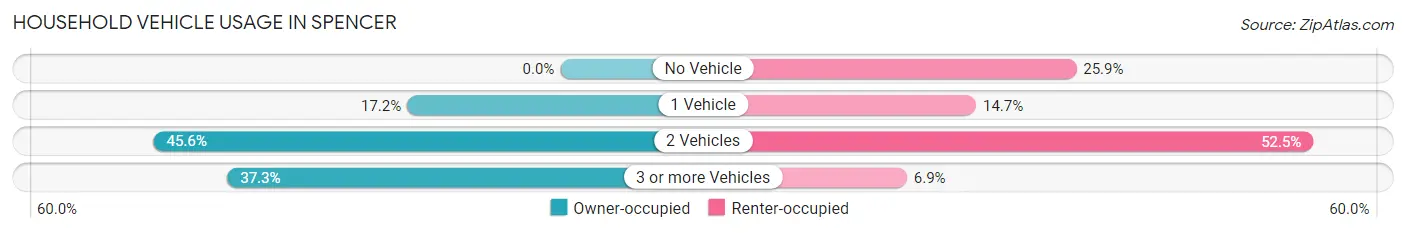
| Vehicles per Household | Owner-occupied | Renter-occupied |
| No Vehicle | 0 (0.0%) | 127 (25.9%) |
| 1 Vehicle | 133 (17.2%) | 72 (14.7%) |
| 2 Vehicles | 353 (45.6%) | 257 (52.4%) |
| 3 or more Vehicles | 289 (37.3%) | 34 (6.9%) |
| Total | 775 (100.0%) | 490 (100.0%) |
Real Estate & Mortgages in Spencer
Real Estate and Mortgage Overview in Spencer
| Characteristic | Without Mortgage | With Mortgage |
| Housing Units | 285 | 490 |
| Median Property Value | $178,400 | $140,700 |
| Median Household Income | $58,340 | $45 |
| Monthly Housing Costs | $508 | $0 |
| Real Estate Taxes | $1,597 | $0 |
Property Value by Mortgage Status in Spencer
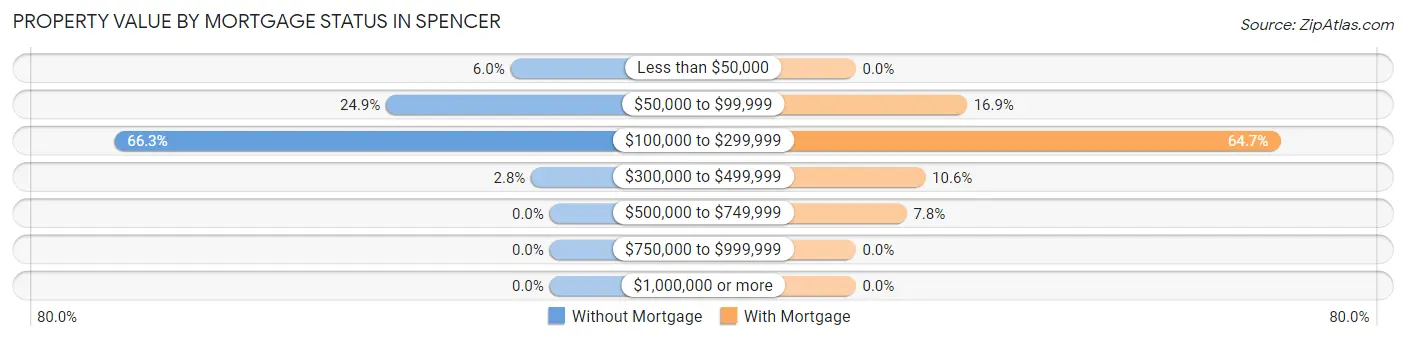
| Property Value | Without Mortgage | With Mortgage |
| Less than $50,000 | 17 (6.0%) | 0 (0.0%) |
| $50,000 to $99,999 | 71 (24.9%) | 83 (16.9%) |
| $100,000 to $299,999 | 189 (66.3%) | 317 (64.7%) |
| $300,000 to $499,999 | 8 (2.8%) | 52 (10.6%) |
| $500,000 to $749,999 | 0 (0.0%) | 38 (7.8%) |
| $750,000 to $999,999 | 0 (0.0%) | 0 (0.0%) |
| $1,000,000 or more | 0 (0.0%) | 0 (0.0%) |
| Total | 285 (100.0%) | 490 (100.0%) |
Household Income by Mortgage Status in Spencer
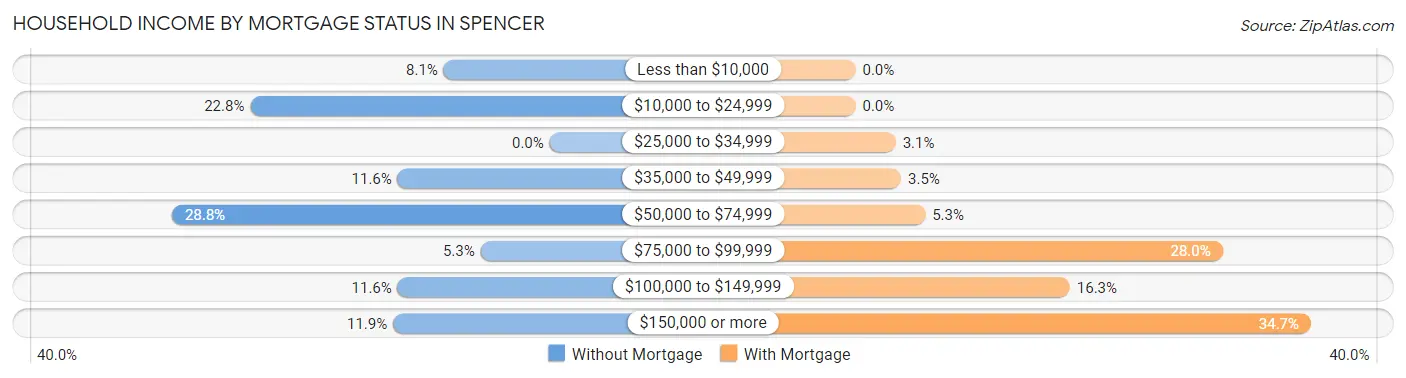
| Household Income | Without Mortgage | With Mortgage |
| Less than $10,000 | 23 (8.1%) | 0 (0.0%) |
| $10,000 to $24,999 | 65 (22.8%) | 0 (0.0%) |
| $25,000 to $34,999 | 0 (0.0%) | 15 (3.1%) |
| $35,000 to $49,999 | 33 (11.6%) | 17 (3.5%) |
| $50,000 to $74,999 | 82 (28.8%) | 26 (5.3%) |
| $75,000 to $99,999 | 15 (5.3%) | 137 (28.0%) |
| $100,000 to $149,999 | 33 (11.6%) | 80 (16.3%) |
| $150,000 or more | 34 (11.9%) | 170 (34.7%) |
| Total | 285 (100.0%) | 490 (100.0%) |
Property Value to Household Income Ratio in Spencer
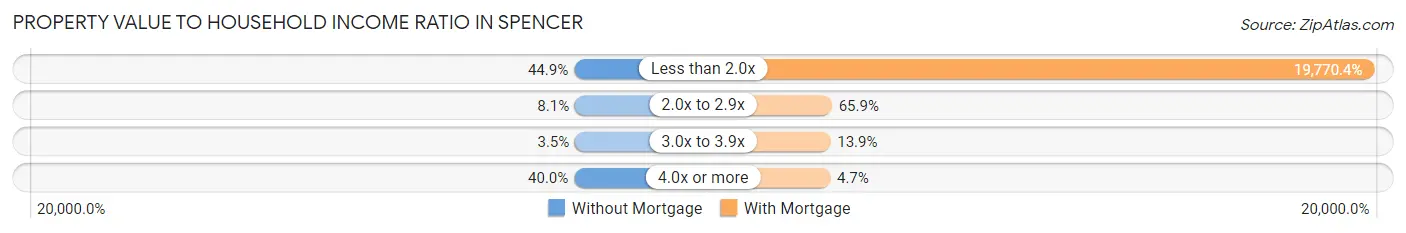
| Value-to-Income Ratio | Without Mortgage | With Mortgage |
| Less than 2.0x | 128 (44.9%) | 96,875 (19,770.4%) |
| 2.0x to 2.9x | 23 (8.1%) | 323 (65.9%) |
| 3.0x to 3.9x | 10 (3.5%) | 68 (13.9%) |
| 4.0x or more | 114 (40.0%) | 23 (4.7%) |
| Total | 285 (100.0%) | 490 (100.0%) |
Real Estate Taxes by Mortgage Status in Spencer
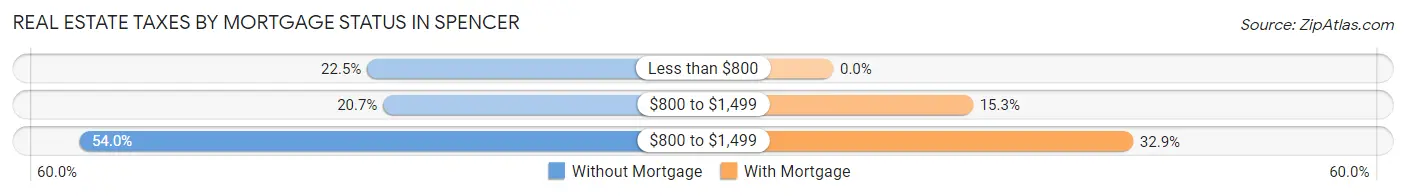
| Property Taxes | Without Mortgage | With Mortgage |
| Less than $800 | 64 (22.5%) | 0 (0.0%) |
| $800 to $1,499 | 59 (20.7%) | 75 (15.3%) |
| $800 to $1,499 | 154 (54.0%) | 161 (32.9%) |
| Total | 285 (100.0%) | 490 (100.0%) |
Health & Disability in Spencer
Health Insurance Coverage by Age in Spencer
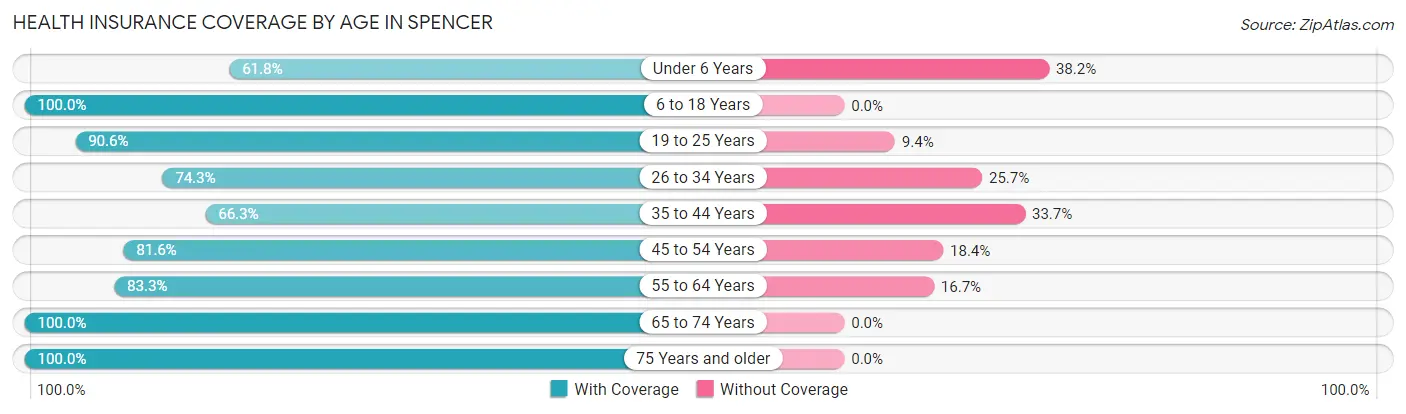
| Age Bracket | With Coverage | Without Coverage |
| Under 6 Years | 81 (61.8%) | 50 (38.2%) |
| 6 to 18 Years | 494 (100.0%) | 0 (0.0%) |
| 19 to 25 Years | 163 (90.6%) | 17 (9.4%) |
| 26 to 34 Years | 376 (74.3%) | 130 (25.7%) |
| 35 to 44 Years | 244 (66.3%) | 124 (33.7%) |
| 45 to 54 Years | 509 (81.6%) | 115 (18.4%) |
| 55 to 64 Years | 334 (83.3%) | 67 (16.7%) |
| 65 to 74 Years | 287 (100.0%) | 0 (0.0%) |
| 75 Years and older | 245 (100.0%) | 0 (0.0%) |
| Total | 2,733 (84.5%) | 503 (15.5%) |
Health Insurance Coverage by Citizenship Status in Spencer
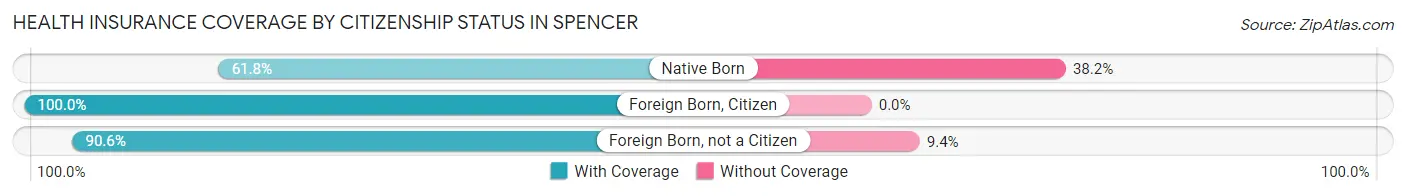
| Citizenship Status | With Coverage | Without Coverage |
| Native Born | 81 (61.8%) | 50 (38.2%) |
| Foreign Born, Citizen | 494 (100.0%) | 0 (0.0%) |
| Foreign Born, not a Citizen | 163 (90.6%) | 17 (9.4%) |
Health Insurance Coverage by Household Income in Spencer
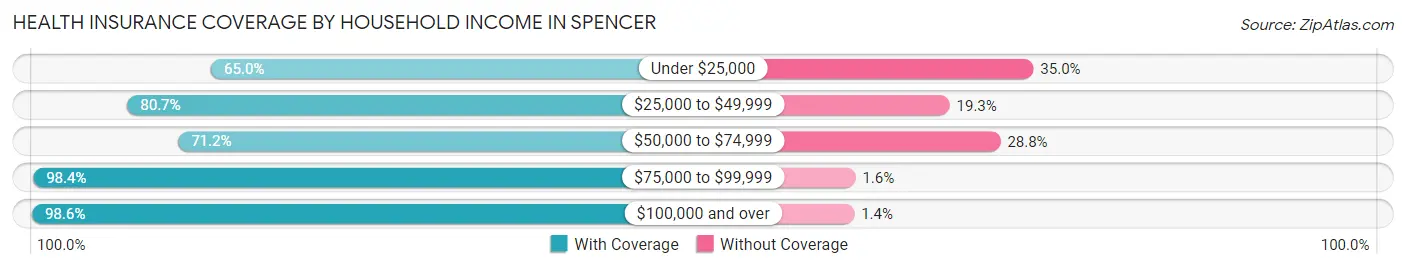
| Household Income | With Coverage | Without Coverage |
| Under $25,000 | 320 (65.0%) | 172 (35.0%) |
| $25,000 to $49,999 | 348 (80.7%) | 83 (19.3%) |
| $50,000 to $74,999 | 559 (71.2%) | 226 (28.8%) |
| $75,000 to $99,999 | 304 (98.4%) | 5 (1.6%) |
| $100,000 and over | 1,202 (98.6%) | 17 (1.4%) |
Public vs Private Health Insurance Coverage by Age in Spencer
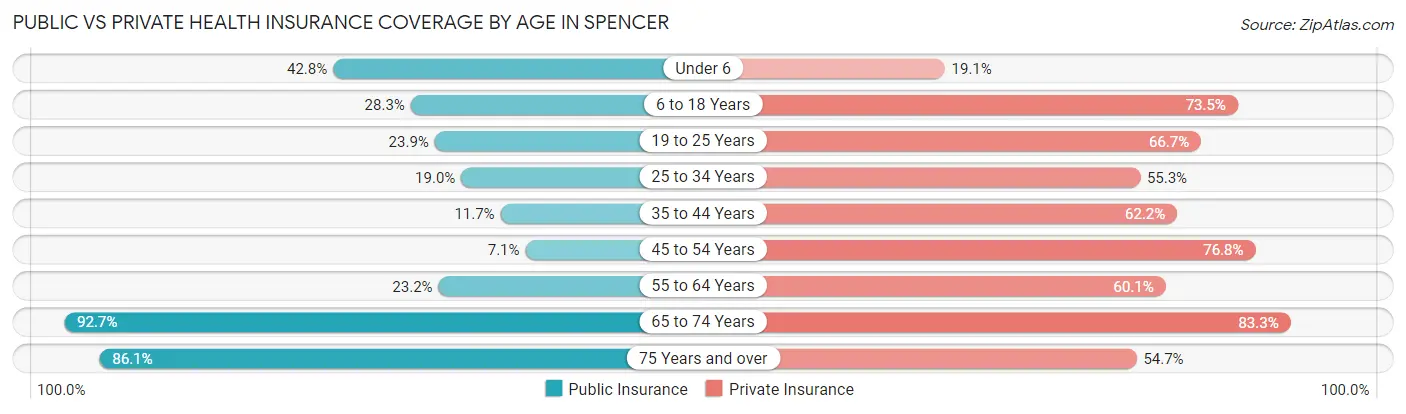
| Age Bracket | Public Insurance | Private Insurance |
| Under 6 | 56 (42.7%) | 25 (19.1%) |
| 6 to 18 Years | 140 (28.3%) | 363 (73.5%) |
| 19 to 25 Years | 43 (23.9%) | 120 (66.7%) |
| 25 to 34 Years | 96 (19.0%) | 280 (55.3%) |
| 35 to 44 Years | 43 (11.7%) | 229 (62.2%) |
| 45 to 54 Years | 44 (7.0%) | 479 (76.8%) |
| 55 to 64 Years | 93 (23.2%) | 241 (60.1%) |
| 65 to 74 Years | 266 (92.7%) | 239 (83.3%) |
| 75 Years and over | 211 (86.1%) | 134 (54.7%) |
| Total | 992 (30.7%) | 2,110 (65.2%) |
Disability Status by Sex by Age in Spencer
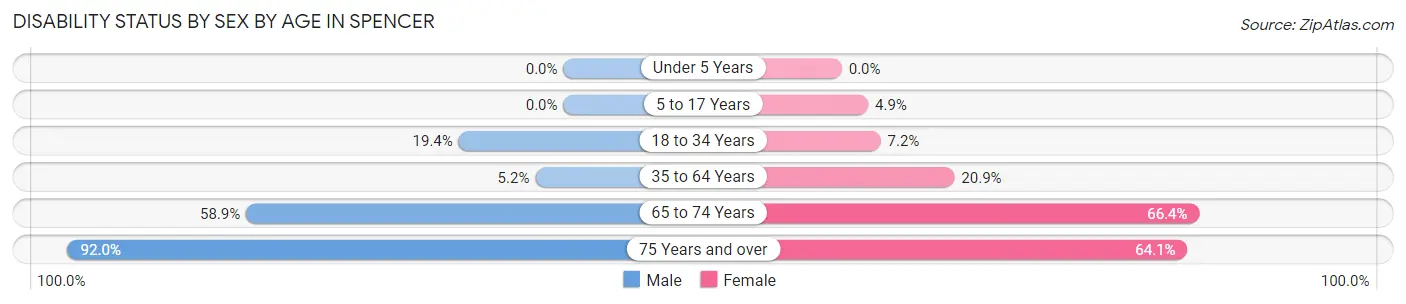
| Age Bracket | Male | Female |
| Under 5 Years | 0 (0.0%) | 0 (0.0%) |
| 5 to 17 Years | 0 (0.0%) | 9 (4.9%) |
| 18 to 34 Years | 91 (19.4%) | 17 (7.2%) |
| 35 to 64 Years | 39 (5.2%) | 135 (20.9%) |
| 65 to 74 Years | 43 (58.9%) | 142 (66.4%) |
| 75 Years and over | 92 (92.0%) | 93 (64.1%) |
Disability Class by Sex by Age in Spencer
Disability Class: Hearing Difficulty
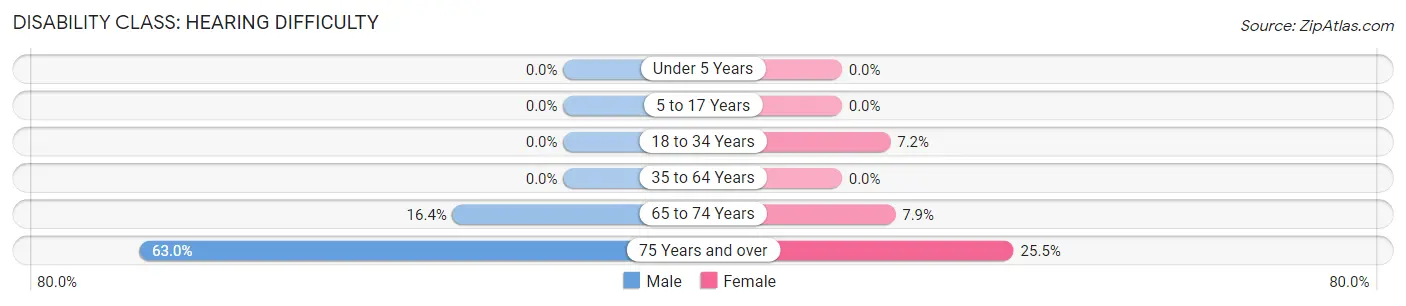
| Age Bracket | Male | Female |
| Under 5 Years | 0 (0.0%) | 0 (0.0%) |
| 5 to 17 Years | 0 (0.0%) | 0 (0.0%) |
| 18 to 34 Years | 0 (0.0%) | 17 (7.2%) |
| 35 to 64 Years | 0 (0.0%) | 0 (0.0%) |
| 65 to 74 Years | 12 (16.4%) | 17 (7.9%) |
| 75 Years and over | 63 (63.0%) | 37 (25.5%) |
Disability Class: Vision Difficulty
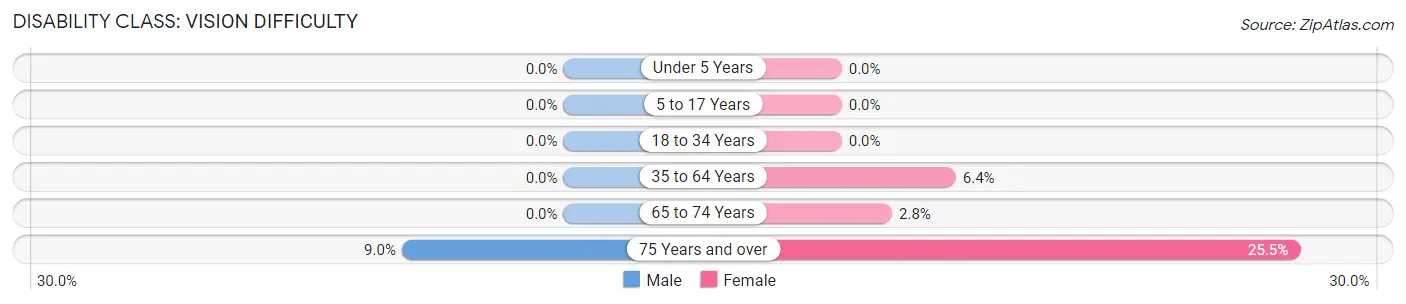
| Age Bracket | Male | Female |
| Under 5 Years | 0 (0.0%) | 0 (0.0%) |
| 5 to 17 Years | 0 (0.0%) | 0 (0.0%) |
| 18 to 34 Years | 0 (0.0%) | 0 (0.0%) |
| 35 to 64 Years | 0 (0.0%) | 41 (6.4%) |
| 65 to 74 Years | 0 (0.0%) | 6 (2.8%) |
| 75 Years and over | 9 (9.0%) | 37 (25.5%) |
Disability Class: Cognitive Difficulty
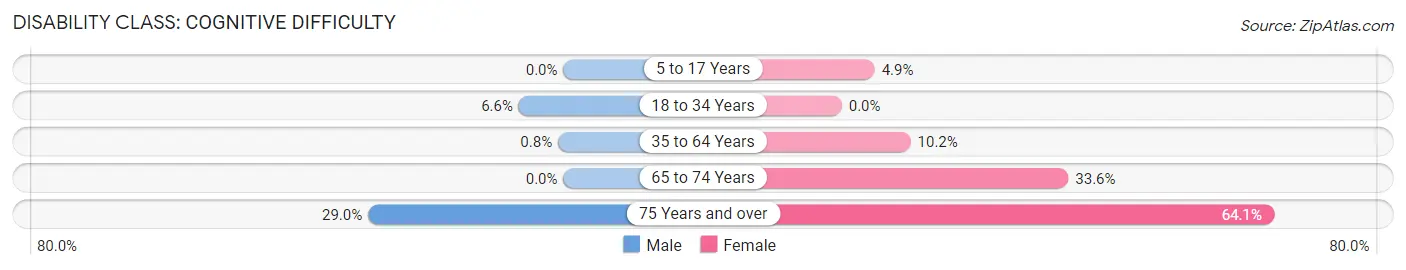
| Age Bracket | Male | Female |
| 5 to 17 Years | 0 (0.0%) | 9 (4.9%) |
| 18 to 34 Years | 31 (6.6%) | 0 (0.0%) |
| 35 to 64 Years | 6 (0.8%) | 66 (10.2%) |
| 65 to 74 Years | 0 (0.0%) | 72 (33.6%) |
| 75 Years and over | 29 (29.0%) | 93 (64.1%) |
Disability Class: Ambulatory Difficulty
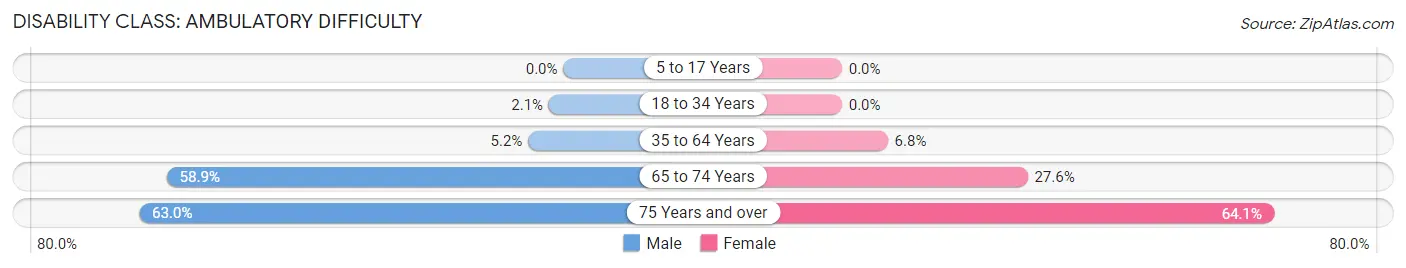
| Age Bracket | Male | Female |
| 5 to 17 Years | 0 (0.0%) | 0 (0.0%) |
| 18 to 34 Years | 10 (2.1%) | 0 (0.0%) |
| 35 to 64 Years | 39 (5.2%) | 44 (6.8%) |
| 65 to 74 Years | 43 (58.9%) | 59 (27.6%) |
| 75 Years and over | 63 (63.0%) | 93 (64.1%) |
Disability Class: Self-Care Difficulty
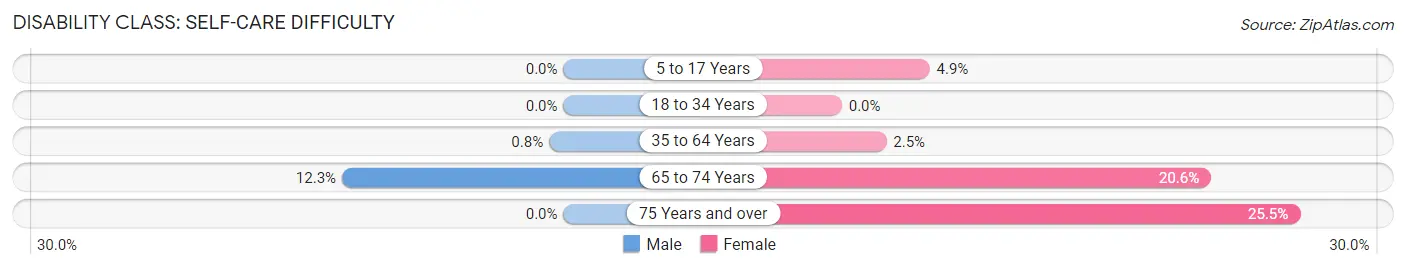
| Age Bracket | Male | Female |
| 5 to 17 Years | 0 (0.0%) | 9 (4.9%) |
| 18 to 34 Years | 0 (0.0%) | 0 (0.0%) |
| 35 to 64 Years | 6 (0.8%) | 16 (2.5%) |
| 65 to 74 Years | 9 (12.3%) | 44 (20.6%) |
| 75 Years and over | 0 (0.0%) | 37 (25.5%) |
Technology Access in Spencer
Computing Device Access in Spencer
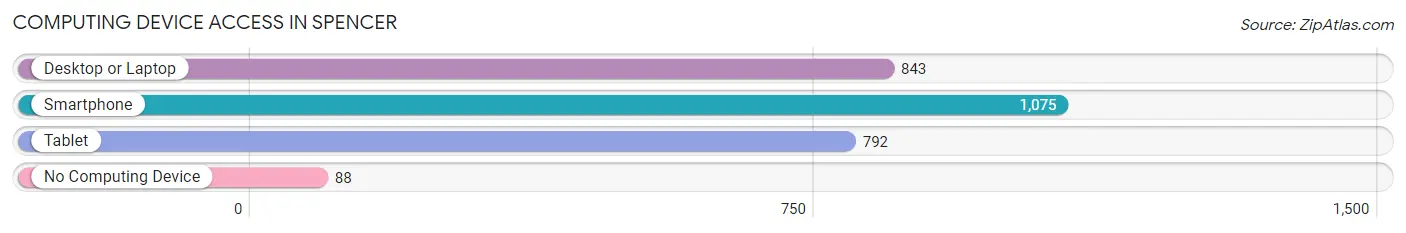
| Device Type | # Households | % Households |
| Desktop or Laptop | 843 | 66.6% |
| Smartphone | 1,075 | 85.0% |
| Tablet | 792 | 62.6% |
| No Computing Device | 88 | 7.0% |
| Total | 1,265 | 100.0% |
Internet Access in Spencer
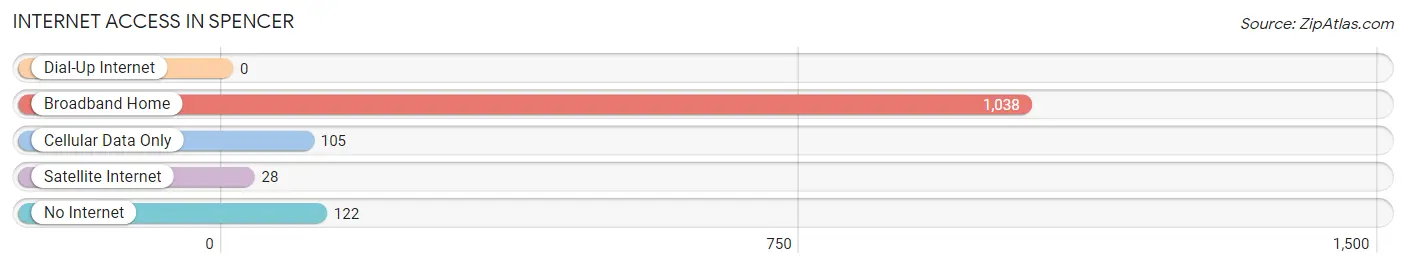
| Internet Type | # Households | % Households |
| Dial-Up Internet | 0 | 0.0% |
| Broadband Home | 1,038 | 82.1% |
| Cellular Data Only | 105 | 8.3% |
| Satellite Internet | 28 | 2.2% |
| No Internet | 122 | 9.6% |
| Total | 1,265 | 100.0% |
Spencer Summary
Spencer, North Carolina is a small town located in Rowan County, North Carolina. It is situated on the banks of the Yadkin River, and is part of the Charlotte metropolitan area. The town has a population of approximately 4,000 people, and is known for its historic downtown area and its proximity to the Uwharrie National Forest.
History
Spencer was founded in 1753 by a group of settlers from Pennsylvania. The town was named after the Spencer family, who were among the first settlers. The town was originally a farming community, and the Spencer family owned a large plantation in the area. In the late 19th century, the town began to grow as a railroad hub, and the town was incorporated in 1891.
In the early 20th century, Spencer was a major center for the textile industry. The town was home to several large mills, and the town's population grew rapidly. The town was also home to a large African-American population, and the town was a major center for the civil rights movement in the 1960s.
Geography
Spencer is located in the Piedmont region of North Carolina, and is situated on the banks of the Yadkin River. The town is located approximately 30 miles northeast of Charlotte, and is part of the Charlotte metropolitan area. The town is surrounded by rolling hills and forests, and is located near the Uwharrie National Forest.
Economy
Spencer's economy is largely based on agriculture and manufacturing. The town is home to several large farms, and the town is also home to several large manufacturing plants. The town is also home to several small businesses, including restaurants, shops, and other services.
Demographics
As of the 2010 census, Spencer had a population of 4,039 people. The town is approximately 75% white, 17% African-American, and 8% Hispanic. The median household income in Spencer is $37,000, and the median home value is $130,000. The town has a poverty rate of 17%, and the unemployment rate is 6%.
Conclusion
Spencer, North Carolina is a small town located in Rowan County, North Carolina. It is situated on the banks of the Yadkin River, and is part of the Charlotte metropolitan area. The town has a population of approximately 4,000 people, and is known for its historic downtown area and its proximity to the Uwharrie National Forest. The town's economy is largely based on agriculture and manufacturing, and the town is home to several small businesses. The town is approximately 75% white, 17% African-American, and 8% Hispanic. The median household income in Spencer is $37,000, and the median home value is $130,000.
Common Questions
What is Per Capita Income in Spencer?
Per Capita income in Spencer is $29,376.
What is the Median Family Income in Spencer?
Median Family Income in Spencer is $68,620.
What is the Median Household income in Spencer?
Median Household Income in Spencer is $61,079.
What is Income or Wage Gap in Spencer?
Income or Wage Gap in Spencer is 34.5%.
Women in Spencer earn 65.5 cents for every dollar earned by a man.
What is Inequality or Gini Index in Spencer?
Inequality or Gini Index in Spencer is 0.42.
What is the Total Population of Spencer?
Total Population of Spencer is 3,296.
What is the Total Male Population of Spencer?
Total Male Population of Spencer is 1,738.
What is the Total Female Population of Spencer?
Total Female Population of Spencer is 1,558.
What is the Ratio of Males per 100 Females in Spencer?
There are 111.55 Males per 100 Females in Spencer.
What is the Ratio of Females per 100 Males in Spencer?
There are 89.64 Females per 100 Males in Spencer.
What is the Median Population Age in Spencer?
Median Population Age in Spencer is 42.9 Years.
What is the Average Family Size in Spencer
Average Family Size in Spencer is 3.0 People.
What is the Average Household Size in Spencer
Average Household Size in Spencer is 2.6 People.
How Large is the Labor Force in Spencer?
There are 1,675 People in the Labor Forcein in Spencer.
What is the Percentage of People in the Labor Force in Spencer?
59.9% of People are in the Labor Force in Spencer.
What is the Unemployment Rate in Spencer?
Unemployment Rate in Spencer is 9.0%.