Swan Quarter, NC Map & Demographics
Swan Quarter Map
Swan Quarter Overview
$28,217
PER CAPITA INCOME
$55,625
AVG FAMILY INCOME
$65,806
AVG HOUSEHOLD INCOME
0.19
INEQUALITY / GINI INDEX
293
TOTAL POPULATION
126
MALE POPULATION
167
FEMALE POPULATION
75.45
MALES / 100 FEMALES
132.54
FEMALES / 100 MALES
66.8
MEDIAN AGE
1.6
AVG FAMILY SIZE
2.0
AVG HOUSEHOLD SIZE
186
LABOR FORCE [ PEOPLE ]
63.5%
PERCENT IN LABOR FORCE
Income in Swan Quarter
Income Overview in Swan Quarter
Per Capita Income in Swan Quarter is $28,217, while median incomes of families and households are $55,625 and $65,806 respectively.
| Characteristic | Number | Measure |
| Per Capita Income | 293 | $28,217 |
| Median Family Income | 148 | $55,625 |
| Mean Family Income | 148 | $53,078 |
| Median Household Income | 148 | $65,806 |
| Mean Household Income | 148 | $57,874 |
| Income Deficit | 148 | $0 |
| Wage / Income Gap (%) | 293 | 0.00% |
| Wage / Income Gap ($) | 293 | 100.00¢ per $1 |
| Gini / Inequality Index | 293 | 0.19 |
Earnings by Sex in Swan Quarter
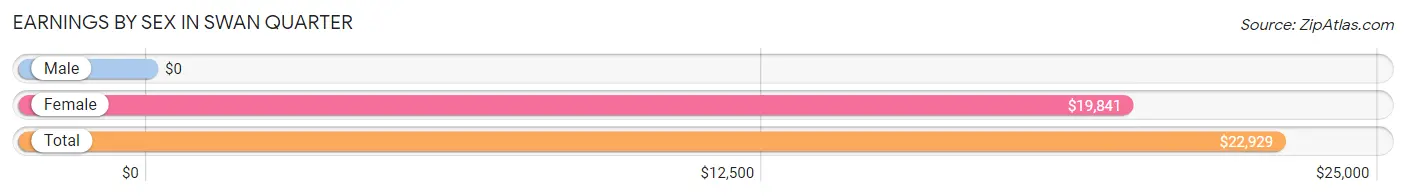
| Sex | Number | Average Earnings |
| Male | 83 (44.6%) | $0 |
| Female | 103 (55.4%) | $19,841 |
| Total | 186 (100.0%) | $22,929 |
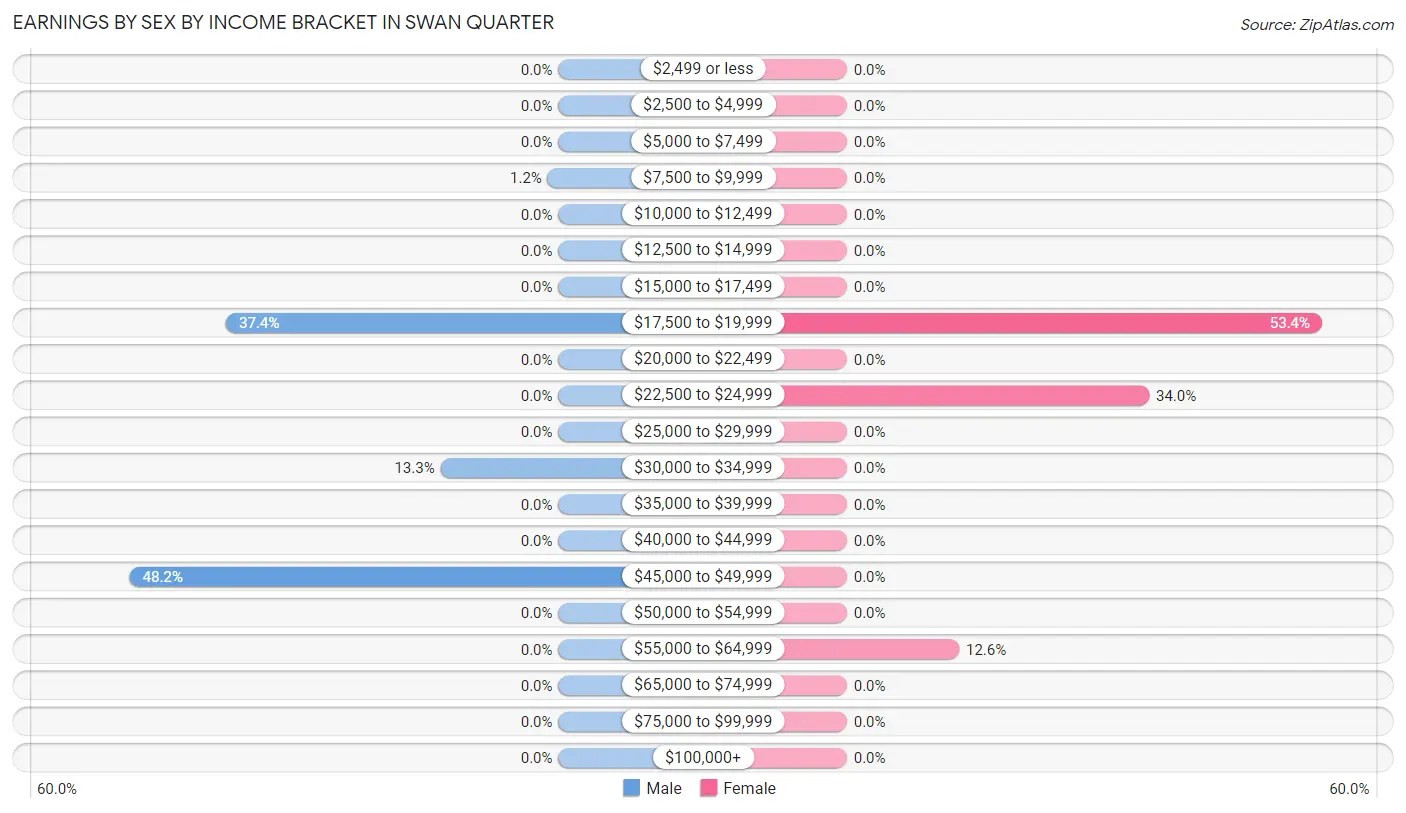
Earnings by Sex by Income Bracket in Swan Quarter
The most common earnings brackets in Swan Quarter are $45,000 to $49,999 for men (40 | 48.2%) and $17,500 to $19,999 for women (55 | 53.4%).
| Income | Male | Female |
| $2,499 or less | 0 (0.0%) | 0 (0.0%) |
| $2,500 to $4,999 | 0 (0.0%) | 0 (0.0%) |
| $5,000 to $7,499 | 0 (0.0%) | 0 (0.0%) |
| $7,500 to $9,999 | 1 (1.2%) | 0 (0.0%) |
| $10,000 to $12,499 | 0 (0.0%) | 0 (0.0%) |
| $12,500 to $14,999 | 0 (0.0%) | 0 (0.0%) |
| $15,000 to $17,499 | 0 (0.0%) | 0 (0.0%) |
| $17,500 to $19,999 | 31 (37.3%) | 55 (53.4%) |
| $20,000 to $22,499 | 0 (0.0%) | 0 (0.0%) |
| $22,500 to $24,999 | 0 (0.0%) | 35 (34.0%) |
| $25,000 to $29,999 | 0 (0.0%) | 0 (0.0%) |
| $30,000 to $34,999 | 11 (13.3%) | 0 (0.0%) |
| $35,000 to $39,999 | 0 (0.0%) | 0 (0.0%) |
| $40,000 to $44,999 | 0 (0.0%) | 0 (0.0%) |
| $45,000 to $49,999 | 40 (48.2%) | 0 (0.0%) |
| $50,000 to $54,999 | 0 (0.0%) | 0 (0.0%) |
| $55,000 to $64,999 | 0 (0.0%) | 13 (12.6%) |
| $65,000 to $74,999 | 0 (0.0%) | 0 (0.0%) |
| $75,000 to $99,999 | 0 (0.0%) | 0 (0.0%) |
| $100,000+ | 0 (0.0%) | 0 (0.0%) |
| Total | 83 (100.0%) | 103 (100.0%) |
Earnings by Sex by Educational Attainment in Swan Quarter
| Educational Attainment | Male Income | Female Income |
| Less than High School | - | - |
| High School Diploma | - | - |
| College or Associate's Degree | - | - |
| Bachelor's Degree | - | - |
| Graduate Degree | - | - |
| Total | - | - |
Family Income in Swan Quarter
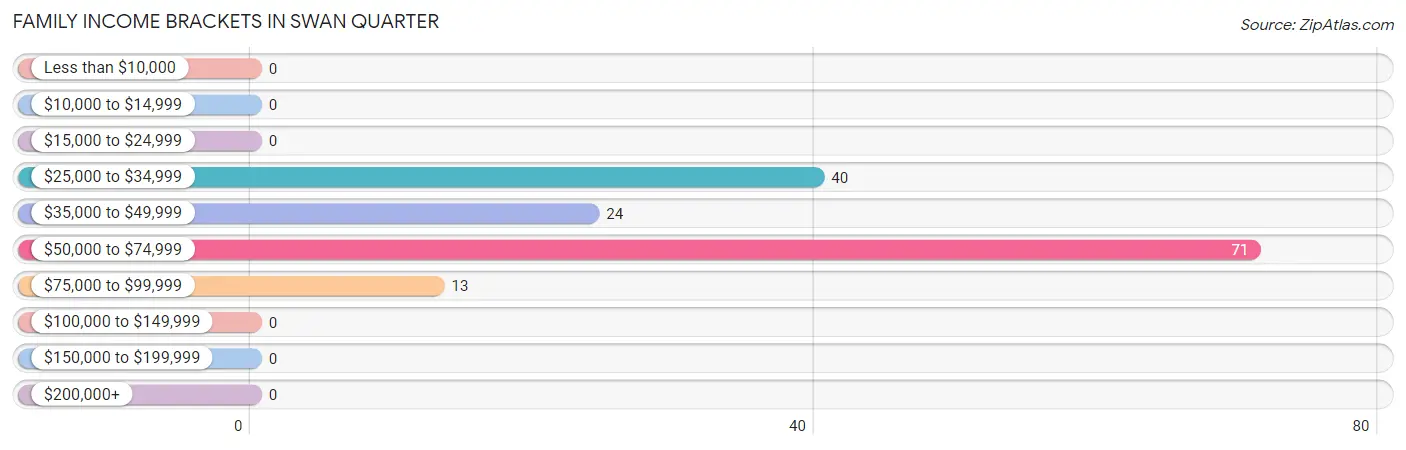
Family Income Brackets in Swan Quarter
According to the Swan Quarter family income data, there are 71 families falling into the $50,000 to $74,999 income range, which is the most common income bracket and makes up 48.0% of all families.
| Income Bracket | # Families | % Families |
| Less than $10,000 | 0 | 0.0% |
| $10,000 to $14,999 | 0 | 0.0% |
| $15,000 to $24,999 | 0 | 0.0% |
| $25,000 to $34,999 | 40 | 27.0% |
| $35,000 to $49,999 | 24 | 16.2% |
| $50,000 to $74,999 | 71 | 48.0% |
| $75,000 to $99,999 | 13 | 8.8% |
| $100,000 to $149,999 | 0 | 0.0% |
| $150,000 to $199,999 | 0 | 0.0% |
| $200,000+ | 0 | 0.0% |
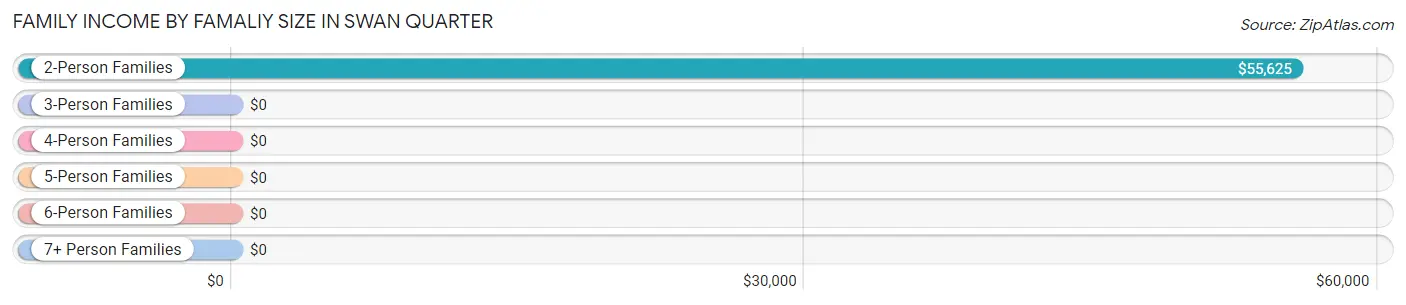
Family Income by Famaliy Size in Swan Quarter
2-person families (148 | 100.0%) account for the highest median family income in Swan Quarter with $55,625 per family, while 2-person families (148 | 100.0%) have the highest median income of $27,812 per family member.
| Income Bracket | # Families | Median Income |
| 2-Person Families | 148 (100.0%) | $55,625 |
| 3-Person Families | 0 (0.0%) | $0 |
| 4-Person Families | 0 (0.0%) | $0 |
| 5-Person Families | 0 (0.0%) | $0 |
| 6-Person Families | 0 (0.0%) | $0 |
| 7+ Person Families | 0 (0.0%) | $0 |
| Total | 148 (100.0%) | $55,625 |
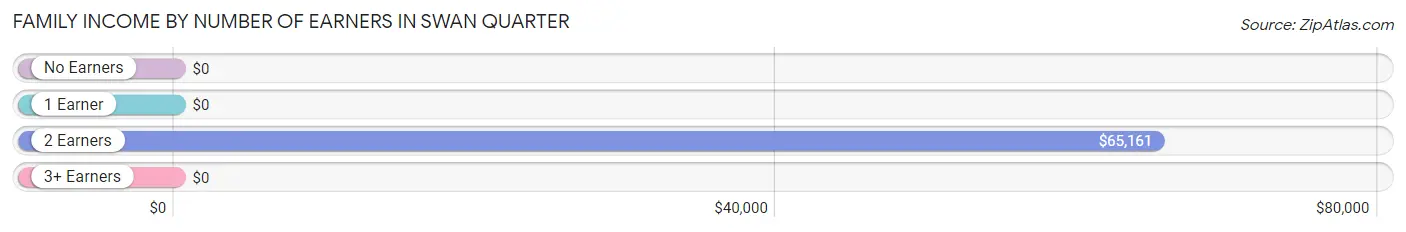
Family Income by Number of Earners in Swan Quarter
| Number of Earners | # Families | Median Income |
| No Earners | 64 (43.2%) | $0 |
| 1 Earner | 0 (0.0%) | $0 |
| 2 Earners | 84 (56.8%) | $65,161 |
| 3+ Earners | 0 (0.0%) | $0 |
| Total | 148 (100.0%) | $55,625 |
Household Income in Swan Quarter
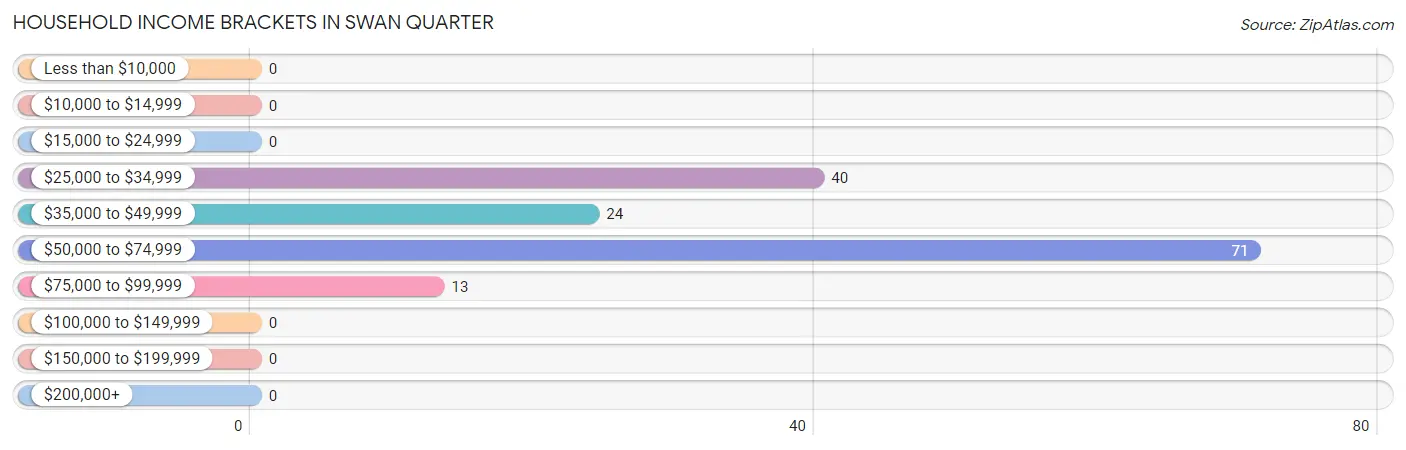
Household Income Brackets in Swan Quarter
With 71 households falling in the category, the $50,000 to $74,999 income range is the most frequent in Swan Quarter, accounting for 48.0% of all households.
| Income Bracket | # Households | % Households |
| Less than $10,000 | 0 | 0.0% |
| $10,000 to $14,999 | 0 | 0.0% |
| $15,000 to $24,999 | 0 | 0.0% |
| $25,000 to $34,999 | 40 | 27.0% |
| $35,000 to $49,999 | 24 | 16.2% |
| $50,000 to $74,999 | 71 | 48.0% |
| $75,000 to $99,999 | 13 | 8.8% |
| $100,000 to $149,999 | 0 | 0.0% |
| $150,000 to $199,999 | 0 | 0.0% |
| $200,000+ | 0 | 0.0% |
Household Income by Householder Age in Swan Quarter
The median household income in Swan Quarter is $65,806, with the highest median household income of $43,281 found in the 65+ years age bracket for the primary householder. A total of 95 households (64.2%) fall into this category.
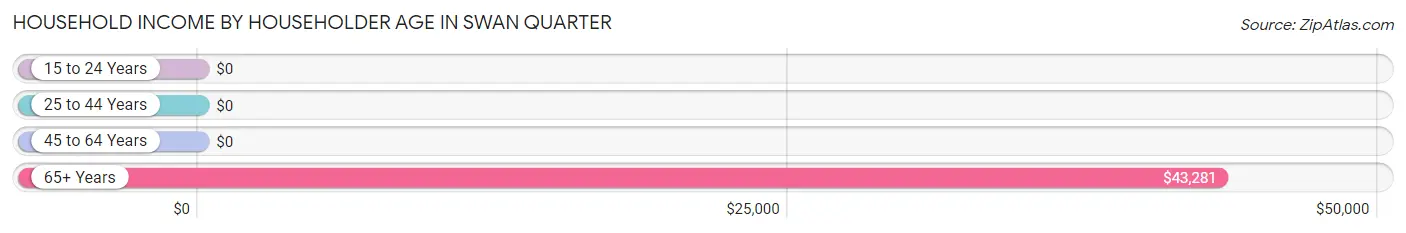
| Income Bracket | # Households | Median Income |
| 15 to 24 Years | 0 (0.0%) | $0 |
| 25 to 44 Years | 40 (27.0%) | $0 |
| 45 to 64 Years | 13 (8.8%) | $0 |
| 65+ Years | 95 (64.2%) | $43,281 |
| Total | 148 (100.0%) | $65,806 |
Poverty in Swan Quarter
Income Below Poverty by Sex and Age in Swan Quarter
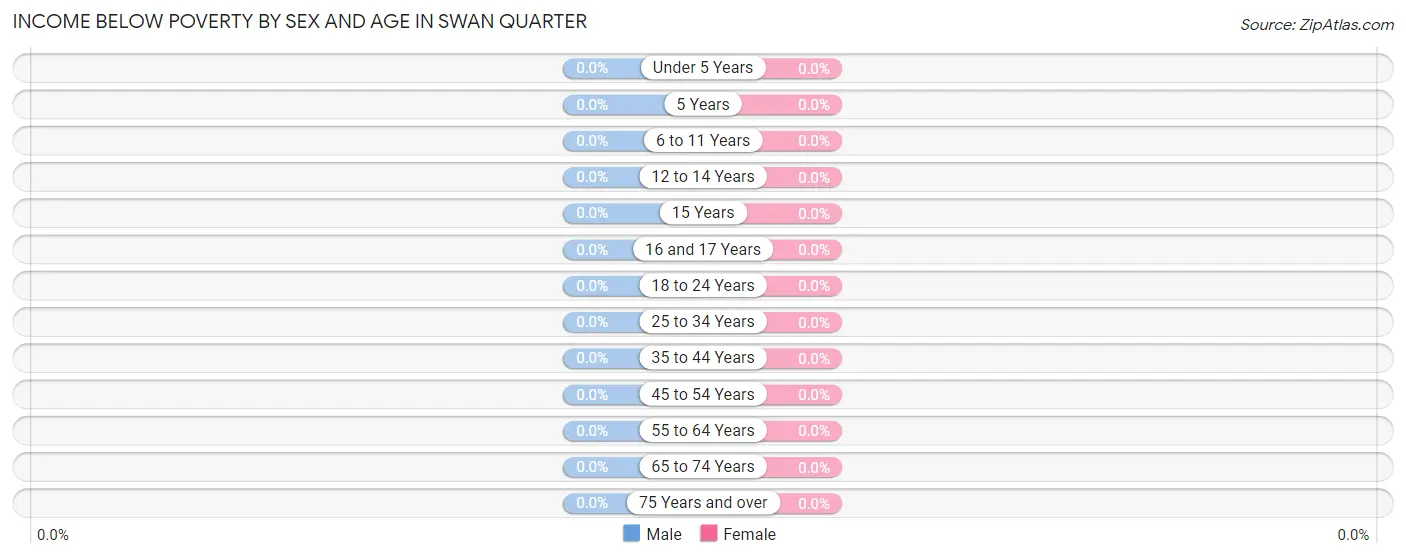
| Age Bracket | Male | Female |
| Under 5 Years | 0 (0.0%) | 0 (0.0%) |
| 5 Years | 0 (0.0%) | 0 (0.0%) |
| 6 to 11 Years | 0 (0.0%) | 0 (0.0%) |
| 12 to 14 Years | 0 (0.0%) | 0 (0.0%) |
| 15 Years | 0 (0.0%) | 0 (0.0%) |
| 16 and 17 Years | 0 (0.0%) | 0 (0.0%) |
| 18 to 24 Years | 0 (0.0%) | 0 (0.0%) |
| 25 to 34 Years | 0 (0.0%) | 0 (0.0%) |
| 35 to 44 Years | 0 (0.0%) | 0 (0.0%) |
| 45 to 54 Years | 0 (0.0%) | 0 (0.0%) |
| 55 to 64 Years | 0 (0.0%) | 0 (0.0%) |
| 65 to 74 Years | 0 (0.0%) | 0 (0.0%) |
| 75 Years and over | 0 (0.0%) | 0 (0.0%) |
| Total | 0 (0.0%) | 0 (0.0%) |
Income Above Poverty by Sex and Age in Swan Quarter
According to the poverty statistics in Swan Quarter, males aged 18 to 24 years and females aged 35 to 44 years are the age groups that are most secure financially, with 100.0% of males and 100.0% of females in these age groups living above the poverty line.
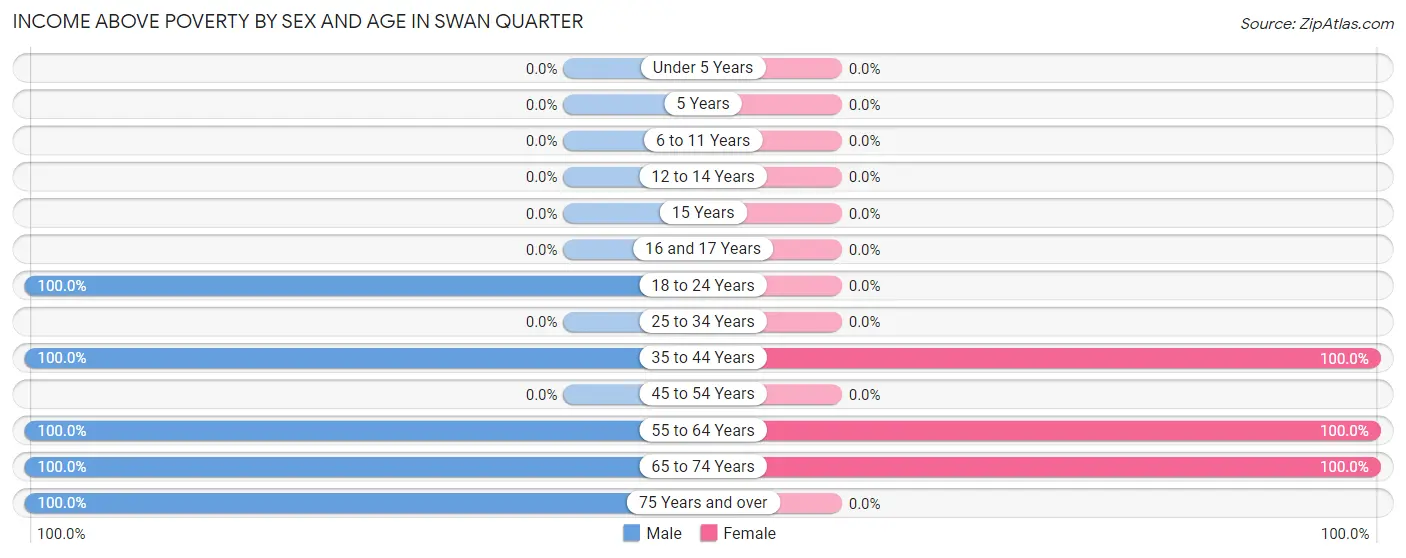
| Age Bracket | Male | Female |
| Under 5 Years | 0 (0.0%) | 0 (0.0%) |
| 5 Years | 0 (0.0%) | 0 (0.0%) |
| 6 to 11 Years | 0 (0.0%) | 0 (0.0%) |
| 12 to 14 Years | 0 (0.0%) | 0 (0.0%) |
| 15 Years | 0 (0.0%) | 0 (0.0%) |
| 16 and 17 Years | 0 (0.0%) | 0 (0.0%) |
| 18 to 24 Years | 1 (100.0%) | 0 (0.0%) |
| 25 to 34 Years | 0 (0.0%) | 0 (0.0%) |
| 35 to 44 Years | 40 (100.0%) | 55 (100.0%) |
| 45 to 54 Years | 0 (0.0%) | 0 (0.0%) |
| 55 to 64 Years | 11 (100.0%) | 13 (100.0%) |
| 65 to 74 Years | 55 (100.0%) | 99 (100.0%) |
| 75 Years and over | 19 (100.0%) | 0 (0.0%) |
| Total | 126 (100.0%) | 167 (100.0%) |
Income Below Poverty Among Married-Couple Families in Swan Quarter
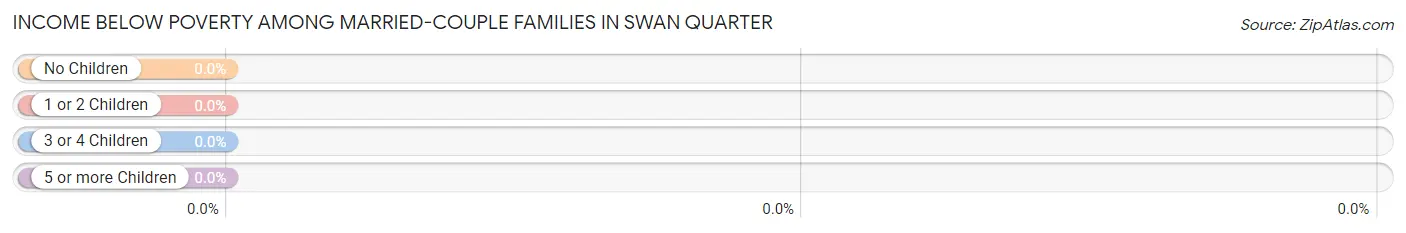
| Children | Above Poverty | Below Poverty |
| No Children | 108 (100.0%) | 0 (0.0%) |
| 1 or 2 Children | 0 (0.0%) | 0 (0.0%) |
| 3 or 4 Children | 0 (0.0%) | 0 (0.0%) |
| 5 or more Children | 0 (0.0%) | 0 (0.0%) |
| Total | 108 (100.0%) | 0 (0.0%) |
Income Below Poverty Among Single-Parent Households in Swan Quarter
| Children | Single Father | Single Mother |
| No Children | 0 (0.0%) | 0 (0.0%) |
| 1 or 2 Children | 0 (0.0%) | 0 (0.0%) |
| 3 or 4 Children | 0 (0.0%) | 0 (0.0%) |
| 5 or more Children | 0 (0.0%) | 0 (0.0%) |
| Total | 0 (0.0%) | 0 (0.0%) |
Income Below Poverty Among Married-Couple vs Single-Parent Households in Swan Quarter
| Children | Married-Couple Families | Single-Parent Households |
| No Children | 0 (0.0%) | 0 (0.0%) |
| 1 or 2 Children | 0 (0.0%) | 0 (0.0%) |
| 3 or 4 Children | 0 (0.0%) | 0 (0.0%) |
| 5 or more Children | 0 (0.0%) | 0 (0.0%) |
| Total | 0 (0.0%) | 0 (0.0%) |
Race in Swan Quarter
The most populous races in Swan Quarter are White / Caucasian (138 | 47.1%), Hispanic or Latino (96 | 32.8%), and Some other Race (96 | 32.8%).
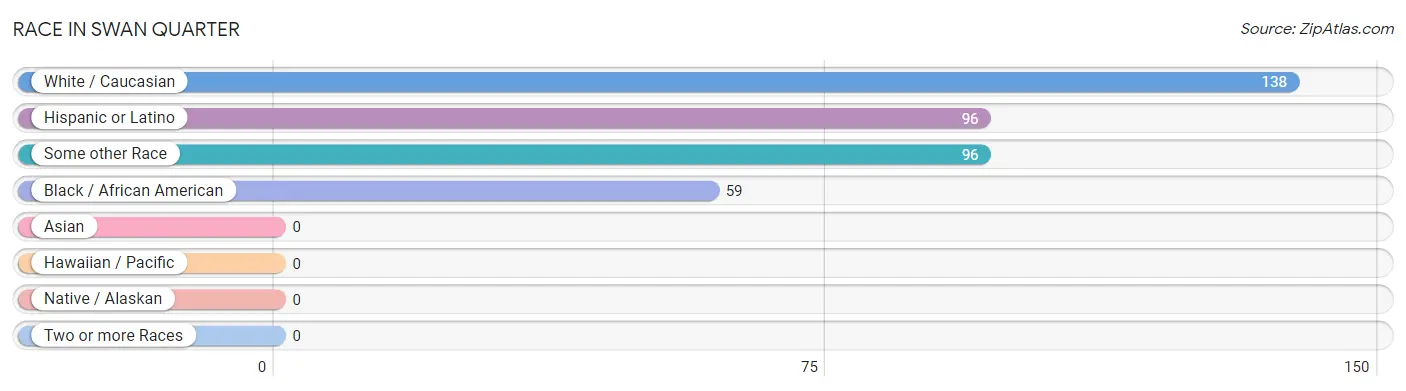
| Race | # Population | % Population |
| Asian | 0 | 0.0% |
| Black / African American | 59 | 20.1% |
| Hawaiian / Pacific | 0 | 0.0% |
| Hispanic or Latino | 96 | 32.8% |
| Native / Alaskan | 0 | 0.0% |
| White / Caucasian | 138 | 47.1% |
| Two or more Races | 0 | 0.0% |
| Some other Race | 96 | 32.8% |
| Total | 293 | 100.0% |
Ancestry in Swan Quarter
The most populous ancestries reported in Swan Quarter are Mexican (96 | 32.8%), Irish (35 | 11.9%), British (31 | 10.6%), European (24 | 8.2%), and Scottish (11 | 3.7%), together accounting for 67.2% of all Swan Quarter residents.
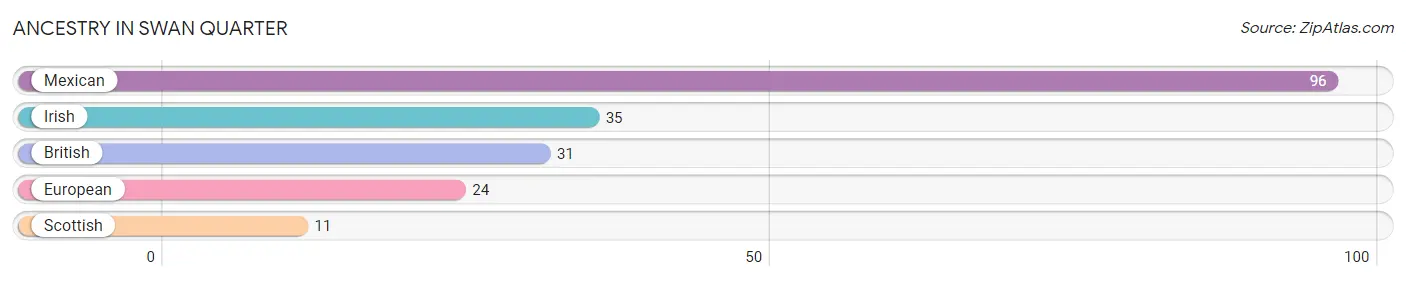
| Ancestry | # Population | % Population |
| British | 31 | 10.6% |
| European | 24 | 8.2% |
| Irish | 35 | 11.9% |
| Mexican | 96 | 32.8% |
| Scottish | 11 | 3.7% | View All 5 Rows |
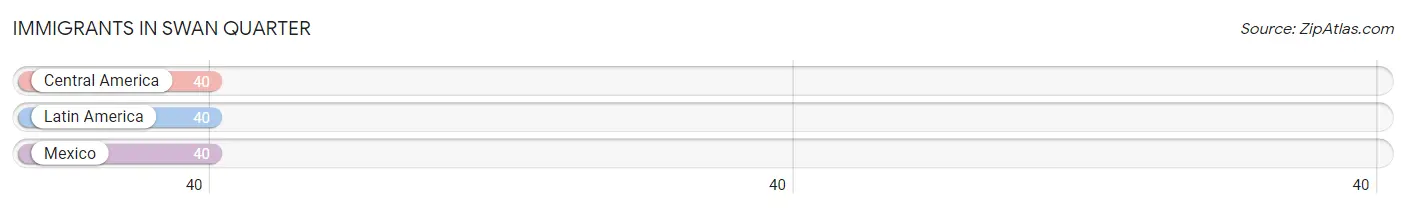
Immigrants in Swan Quarter
The most numerous immigrant groups reported in Swan Quarter came from Central America (40 | 13.7%), Latin America (40 | 13.7%), and Mexico (40 | 13.7%), together accounting for 41.0% of all Swan Quarter residents.
| Immigration Origin | # Population | % Population |
| Central America | 40 | 13.7% |
| Latin America | 40 | 13.7% |
| Mexico | 40 | 13.7% | View All 3 Rows |
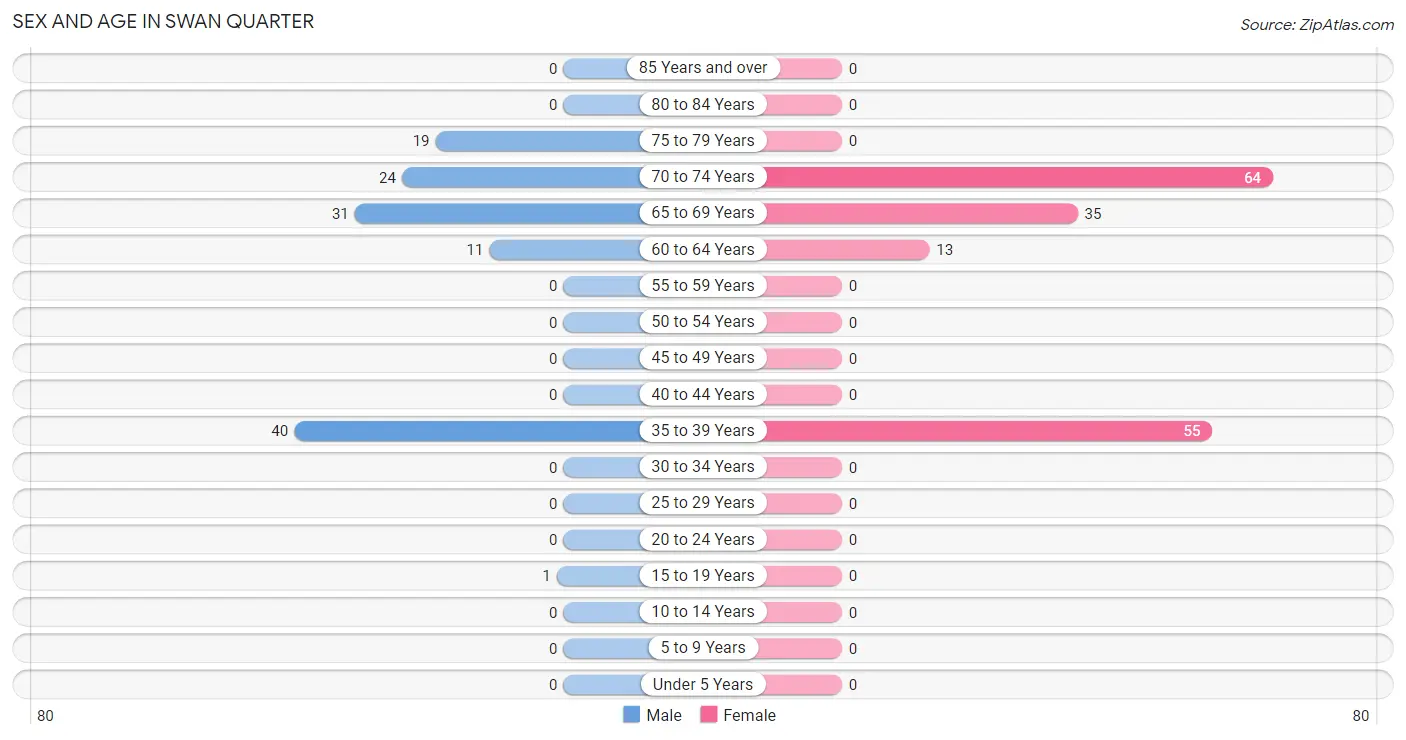
Sex and Age in Swan Quarter
Sex and Age in Swan Quarter
The most populous age groups in Swan Quarter are 35 to 39 Years (40 | 31.8%) for men and 70 to 74 Years (64 | 38.3%) for women.
| Age Bracket | Male | Female |
| Under 5 Years | 0 (0.0%) | 0 (0.0%) |
| 5 to 9 Years | 0 (0.0%) | 0 (0.0%) |
| 10 to 14 Years | 0 (0.0%) | 0 (0.0%) |
| 15 to 19 Years | 1 (0.8%) | 0 (0.0%) |
| 20 to 24 Years | 0 (0.0%) | 0 (0.0%) |
| 25 to 29 Years | 0 (0.0%) | 0 (0.0%) |
| 30 to 34 Years | 0 (0.0%) | 0 (0.0%) |
| 35 to 39 Years | 40 (31.8%) | 55 (32.9%) |
| 40 to 44 Years | 0 (0.0%) | 0 (0.0%) |
| 45 to 49 Years | 0 (0.0%) | 0 (0.0%) |
| 50 to 54 Years | 0 (0.0%) | 0 (0.0%) |
| 55 to 59 Years | 0 (0.0%) | 0 (0.0%) |
| 60 to 64 Years | 11 (8.7%) | 13 (7.8%) |
| 65 to 69 Years | 31 (24.6%) | 35 (21.0%) |
| 70 to 74 Years | 24 (19.1%) | 64 (38.3%) |
| 75 to 79 Years | 19 (15.1%) | 0 (0.0%) |
| 80 to 84 Years | 0 (0.0%) | 0 (0.0%) |
| 85 Years and over | 0 (0.0%) | 0 (0.0%) |
| Total | 126 (100.0%) | 167 (100.0%) |
Families and Households in Swan Quarter
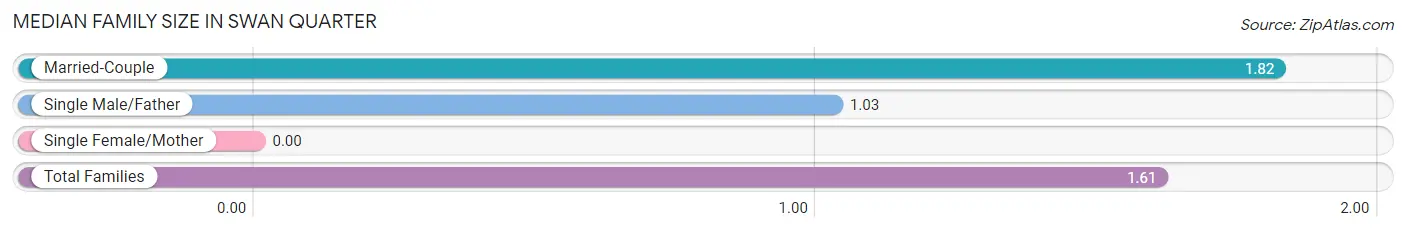
Median Family Size in Swan Quarter
| Family Type | # Families | Family Size |
| Married-Couple | 108 (73.0%) | 1.82 |
| Single Male/Father | 40 (27.0%) | 1.03 |
| Single Female/Mother | 0 (0.0%) | - |
| Total Families | 148 (100.0%) | 1.61 |
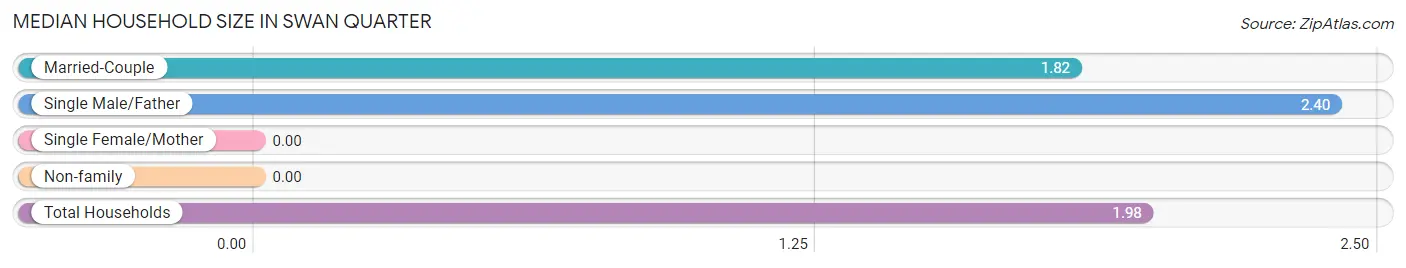
Median Household Size in Swan Quarter
| Household Type | # Households | Household Size |
| Married-Couple | 108 (73.0%) | 1.82 |
| Single Male/Father | 40 (27.0%) | 2.40 |
| Single Female/Mother | 0 (0.0%) | - |
| Non-family | 0 (0.0%) | - |
| Total Households | 148 (100.0%) | 1.98 |
Household Size by Marriage Status in Swan Quarter
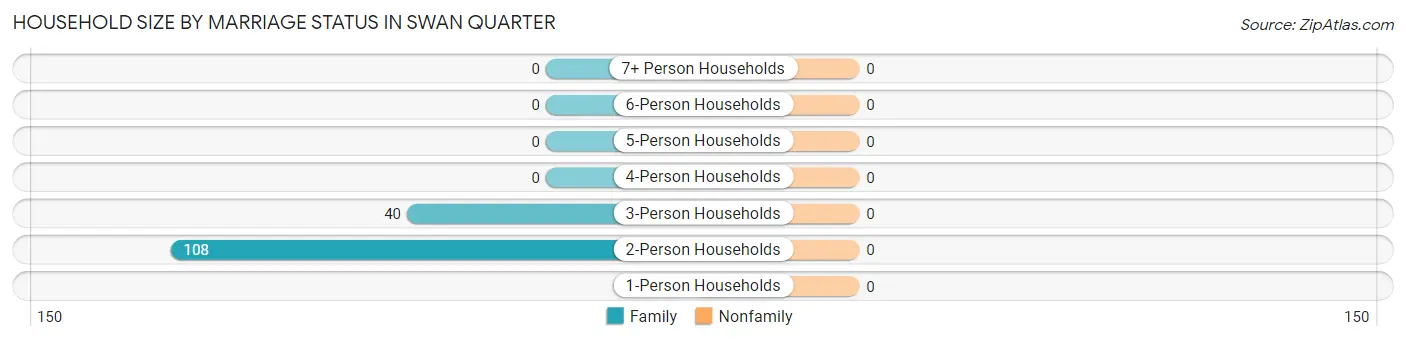
| Household Size | Family Households | Nonfamily Households |
| 1-Person Households | - | 0 (0.0%) |
| 2-Person Households | 108 (73.0%) | 0 (0.0%) |
| 3-Person Households | 40 (27.0%) | 0 (0.0%) |
| 4-Person Households | 0 (0.0%) | 0 (0.0%) |
| 5-Person Households | 0 (0.0%) | 0 (0.0%) |
| 6-Person Households | 0 (0.0%) | 0 (0.0%) |
| 7+ Person Households | 0 (0.0%) | 0 (0.0%) |
| Total | 148 (100.0%) | 0 (0.0%) |
Female Fertility in Swan Quarter
Fertility by Age in Swan Quarter
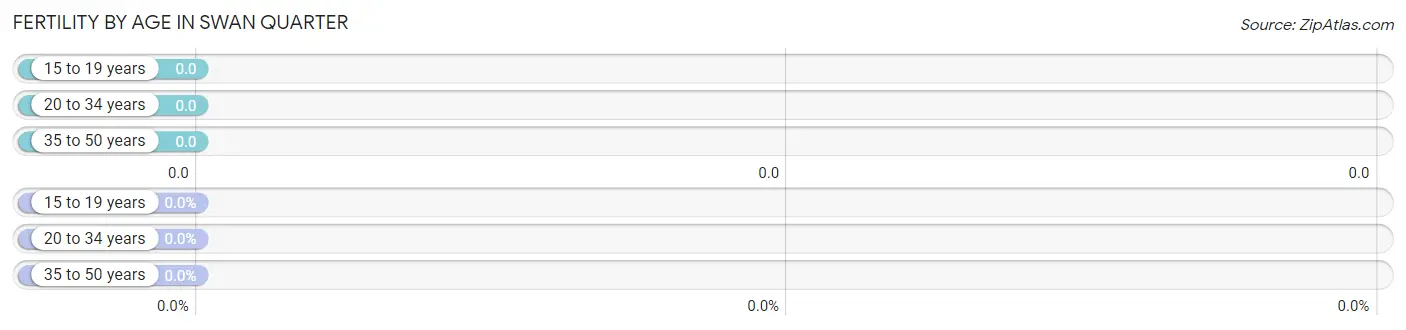
| Age Bracket | Women with Births | Births / 1,000 Women |
| 15 to 19 years | 0 (0.0%) | 0.0 |
| 20 to 34 years | 0 (0.0%) | 0.0 |
| 35 to 50 years | 0 (0.0%) | 0.0 |
| Total | 0 (0.0%) | 0.0 |
Fertility by Age by Marriage Status in Swan Quarter
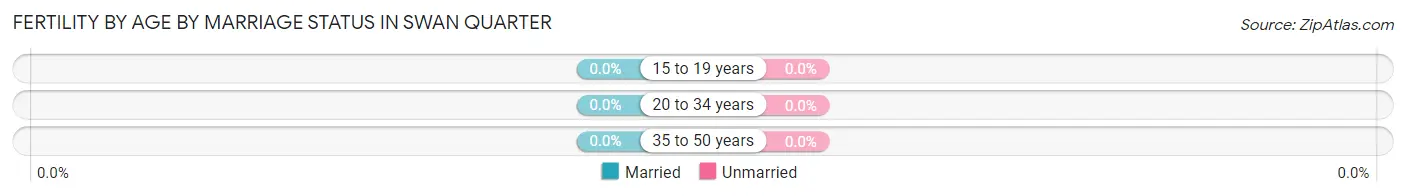
| Age Bracket | Married | Unmarried |
| 15 to 19 years | 0 (0.0%) | 0 (0.0%) |
| 20 to 34 years | 0 (0.0%) | 0 (0.0%) |
| 35 to 50 years | 0 (0.0%) | 0 (0.0%) |
| Total | 0 (0.0%) | 0 (0.0%) |
Fertility by Education in Swan Quarter
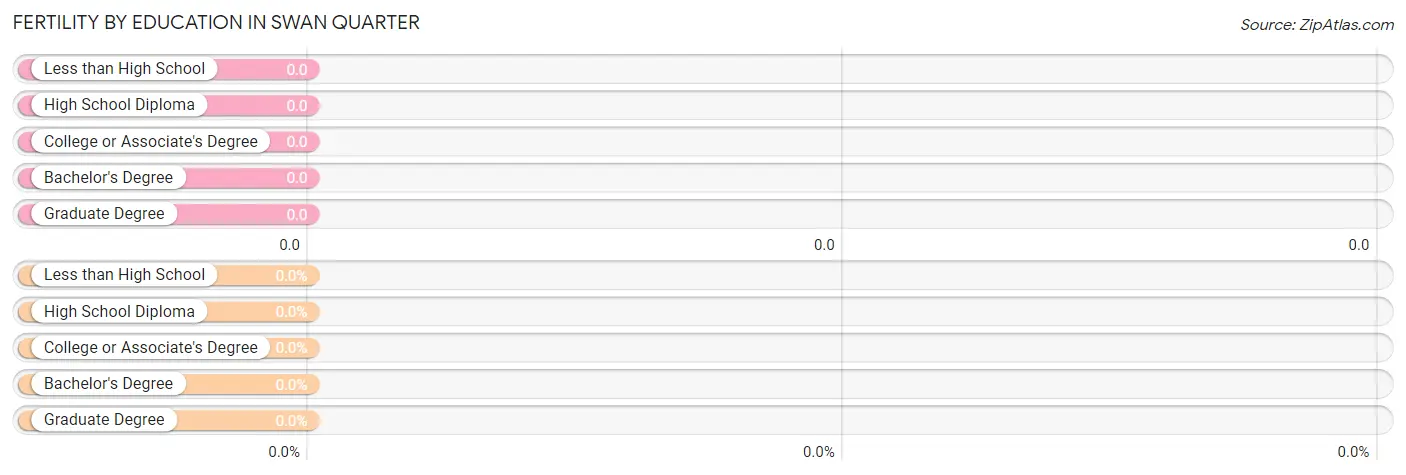
| Educational Attainment | Women with Births | Births / 1,000 Women |
| Less than High School | 0 (0.0%) | 0.0 |
| High School Diploma | 0 (0.0%) | 0.0 |
| College or Associate's Degree | 0 (0.0%) | 0.0 |
| Bachelor's Degree | 0 (0.0%) | 0.0 |
| Graduate Degree | 0 (0.0%) | 0.0 |
| Total | 0 (0.0%) | 0.0 |
Fertility by Education by Marriage Status in Swan Quarter
| Educational Attainment | Married | Unmarried |
| Less than High School | 0 (0.0%) | 0 (0.0%) |
| High School Diploma | 0 (0.0%) | 0 (0.0%) |
| College or Associate's Degree | 0 (0.0%) | 0 (0.0%) |
| Bachelor's Degree | 0 (0.0%) | 0 (0.0%) |
| Graduate Degree | 0 (0.0%) | 0 (0.0%) |
| Total | 0 (0.0%) | 0 (0.0%) |
Employment Characteristics in Swan Quarter
Employment by Class of Employer in Swan Quarter
Among the 186 employed individuals in Swan Quarter, private company employees (96 | 51.6%), self-employed (incorporated) (42 | 22.6%), and unpaid family workers (35 | 18.8%) make up the most common classes of employment.
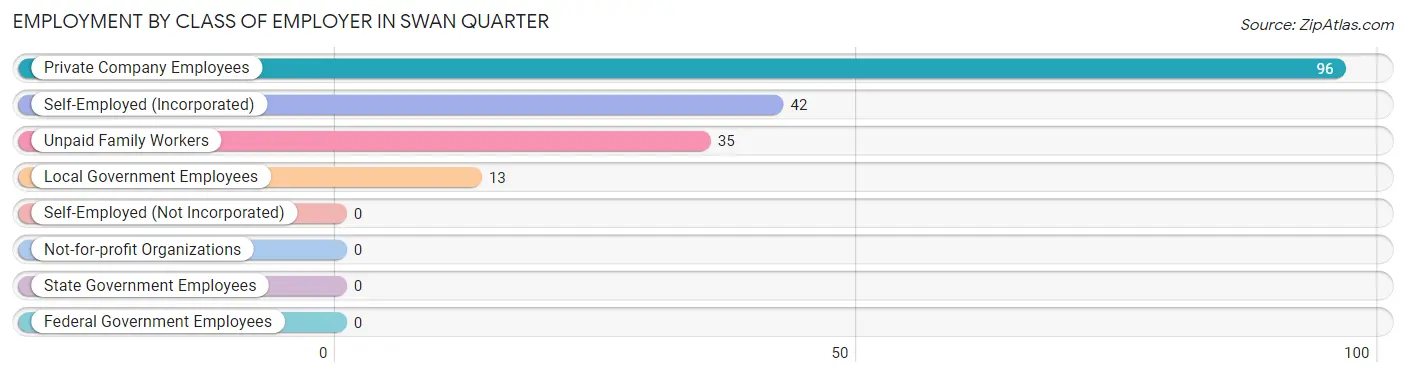
| Employer Class | # Employees | % Employees |
| Private Company Employees | 96 | 51.6% |
| Self-Employed (Incorporated) | 42 | 22.6% |
| Self-Employed (Not Incorporated) | 0 | 0.0% |
| Not-for-profit Organizations | 0 | 0.0% |
| Local Government Employees | 13 | 7.0% |
| State Government Employees | 0 | 0.0% |
| Federal Government Employees | 0 | 0.0% |
| Unpaid Family Workers | 35 | 18.8% |
| Total | 186 | 100.0% |
Employment Status by Age in Swan Quarter
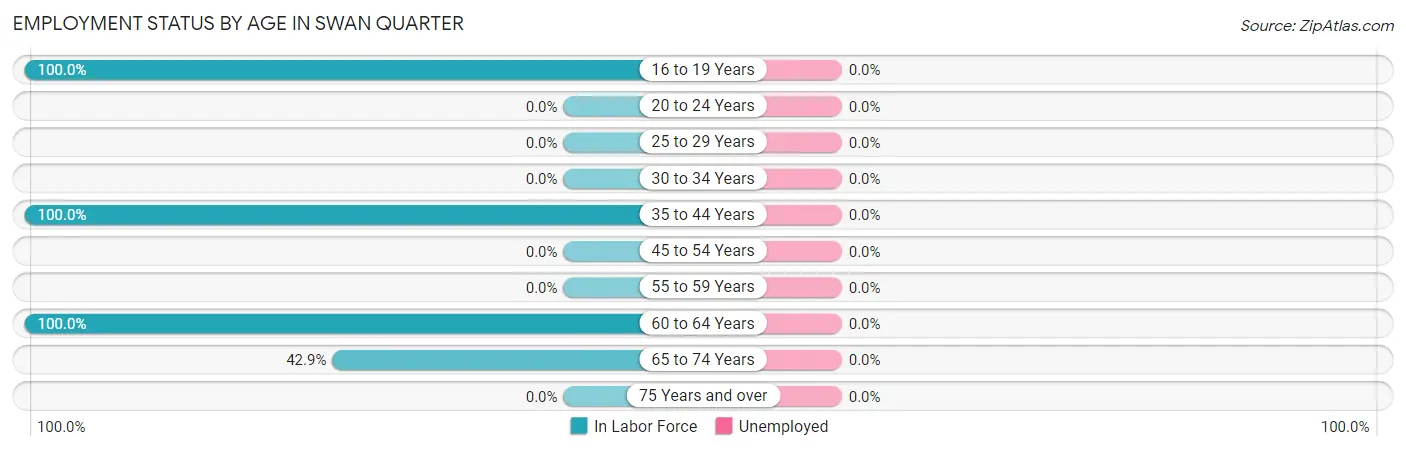
| Age Bracket | In Labor Force | Unemployed |
| 16 to 19 Years | 1 (100.0%) | 0 (0.0%) |
| 20 to 24 Years | 0 (0.0%) | 0 (0.0%) |
| 25 to 29 Years | 0 (0.0%) | 0 (0.0%) |
| 30 to 34 Years | 0 (0.0%) | 0 (0.0%) |
| 35 to 44 Years | 95 (100.0%) | 0 (0.0%) |
| 45 to 54 Years | 0 (0.0%) | 0 (0.0%) |
| 55 to 59 Years | 0 (0.0%) | 0 (0.0%) |
| 60 to 64 Years | 24 (100.0%) | 0 (0.0%) |
| 65 to 74 Years | 66 (42.9%) | 0 (0.0%) |
| 75 Years and over | 0 (0.0%) | 0 (0.0%) |
| Total | 186 (63.5%) | 0 (0.0%) |
Employment Status by Educational Attainment in Swan Quarter
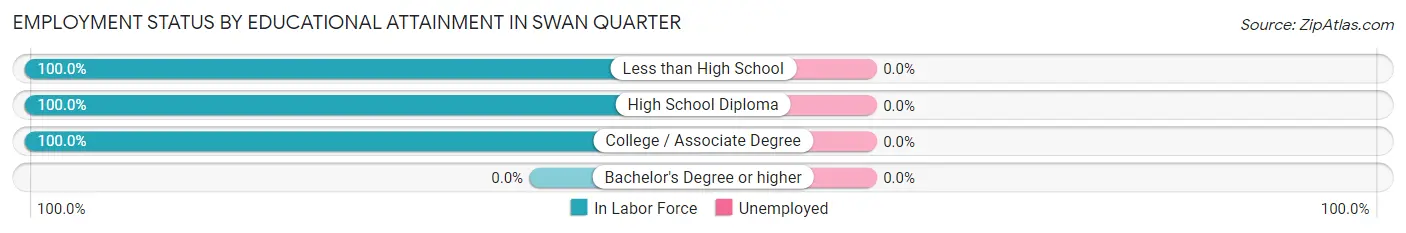
| Educational Attainment | In Labor Force | Unemployed |
| Less than High School | 40 (100.0%) | 0 (0.0%) |
| High School Diploma | 55 (100.0%) | 0 (0.0%) |
| College / Associate Degree | 24 (100.0%) | 0 (0.0%) |
| Bachelor's Degree or higher | 0 (0.0%) | 0 (0.0%) |
| Total | 119 (100.0%) | 0 (0.0%) |
Employment Occupations by Sex in Swan Quarter
Management, Business, Science and Arts Occupations
The most common Management, Business, Science and Arts occupations in Swan Quarter are Management (77 | 41.4%), and Business & Financial (13 | 7.0%).
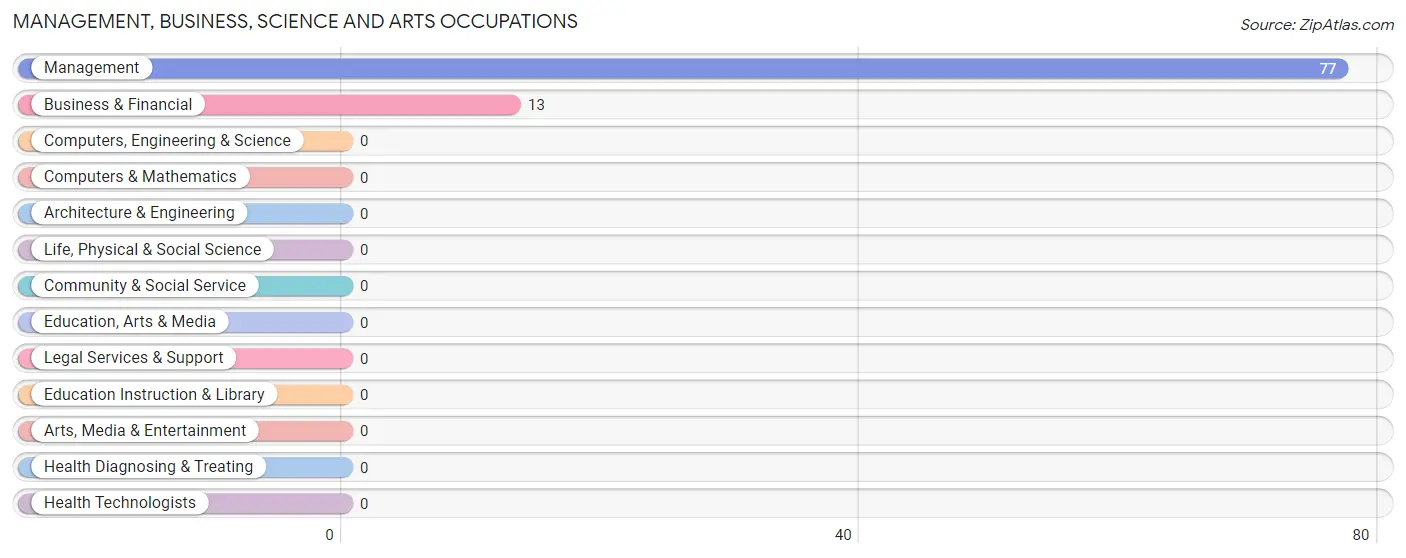
Management, Business, Science and Arts Occupations by Sex
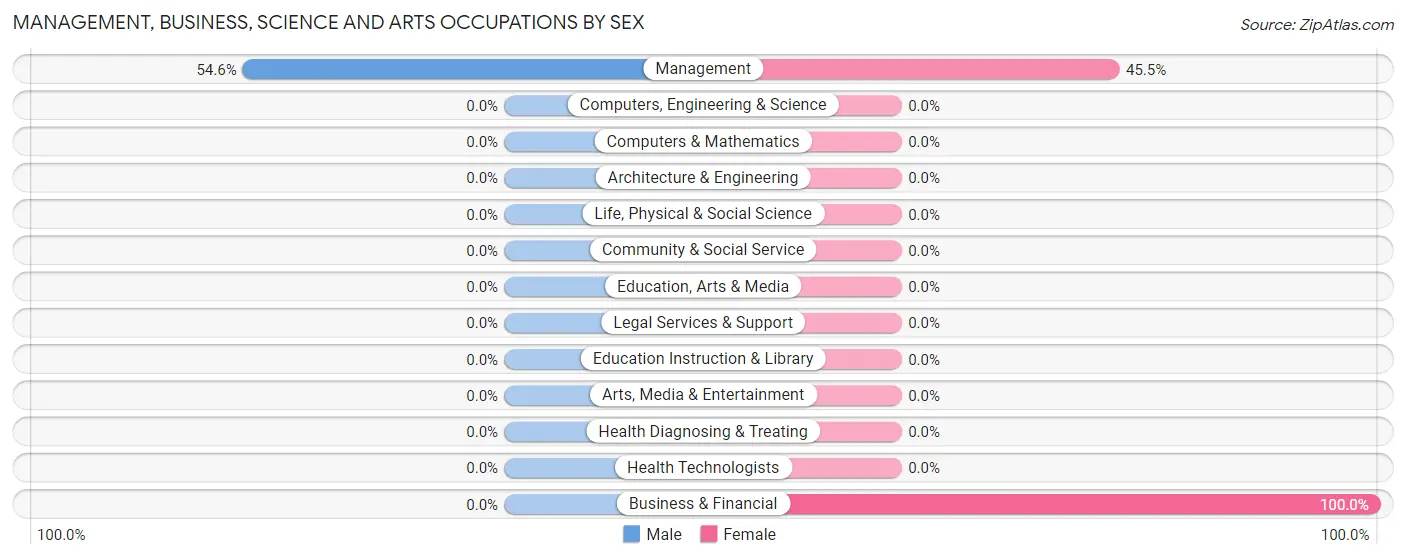
| Occupation | Male | Female |
| Management | 42 (54.5%) | 35 (45.5%) |
| Business & Financial | 0 (0.0%) | 13 (100.0%) |
| Computers, Engineering & Science | 0 (0.0%) | 0 (0.0%) |
| Computers & Mathematics | 0 (0.0%) | 0 (0.0%) |
| Architecture & Engineering | 0 (0.0%) | 0 (0.0%) |
| Life, Physical & Social Science | 0 (0.0%) | 0 (0.0%) |
| Community & Social Service | 0 (0.0%) | 0 (0.0%) |
| Education, Arts & Media | 0 (0.0%) | 0 (0.0%) |
| Legal Services & Support | 0 (0.0%) | 0 (0.0%) |
| Education Instruction & Library | 0 (0.0%) | 0 (0.0%) |
| Arts, Media & Entertainment | 0 (0.0%) | 0 (0.0%) |
| Health Diagnosing & Treating | 0 (0.0%) | 0 (0.0%) |
| Health Technologists | 0 (0.0%) | 0 (0.0%) |
| Total (Category) | 42 (46.7%) | 48 (53.3%) |
| Total (Overall) | 83 (44.6%) | 103 (55.4%) |
Services Occupations
The most common Services occupations in Swan Quarter are , and Food Preparation & Serving (1 | 0.5%).
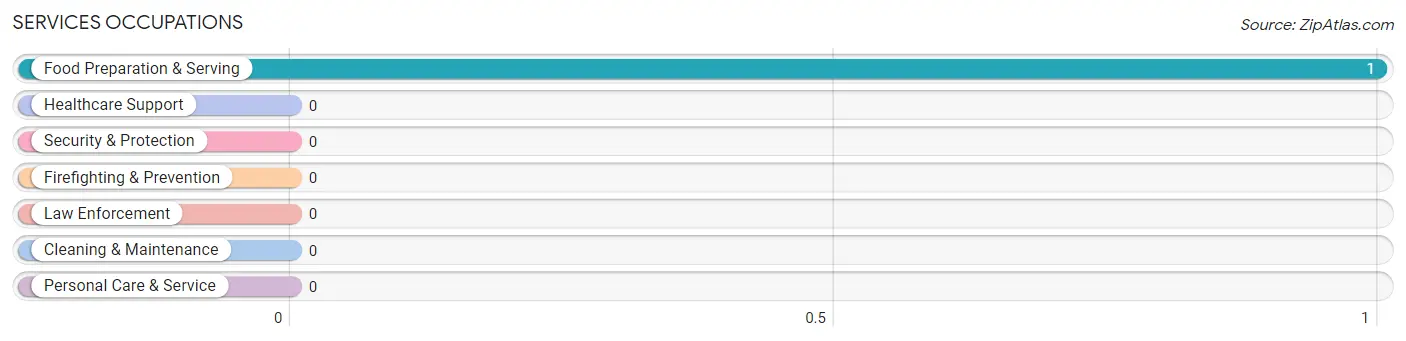
Services Occupations by Sex
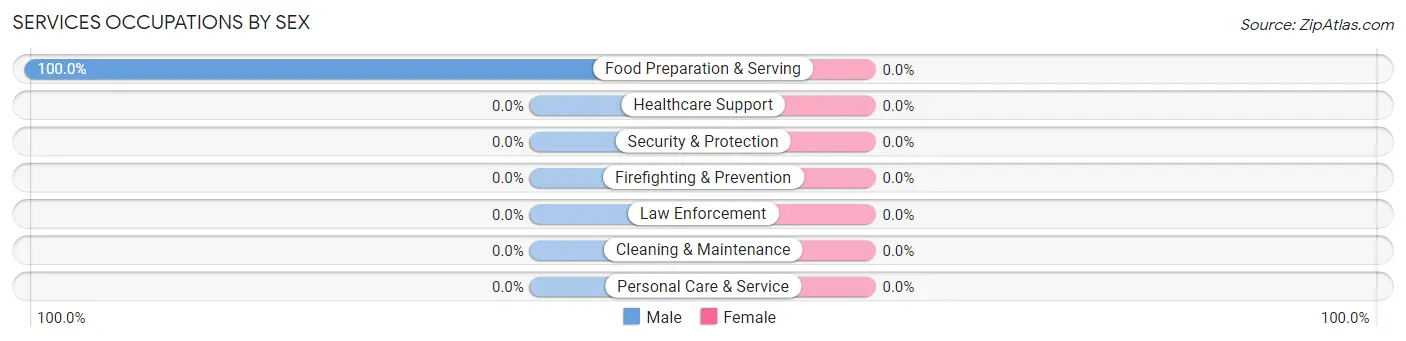
| Occupation | Male | Female |
| Healthcare Support | 0 (0.0%) | 0 (0.0%) |
| Security & Protection | 0 (0.0%) | 0 (0.0%) |
| Firefighting & Prevention | 0 (0.0%) | 0 (0.0%) |
| Law Enforcement | 0 (0.0%) | 0 (0.0%) |
| Food Preparation & Serving | 1 (100.0%) | 0 (0.0%) |
| Cleaning & Maintenance | 0 (0.0%) | 0 (0.0%) |
| Personal Care & Service | 0 (0.0%) | 0 (0.0%) |
| Total (Category) | 1 (100.0%) | 0 (0.0%) |
| Total (Overall) | 83 (44.6%) | 103 (55.4%) |
Sales and Office Occupations
Sales and Office Occupations by Sex
| Occupation | Male | Female |
| Sales & Related | 0 (0.0%) | 0 (0.0%) |
| Office & Administration | 0 (0.0%) | 0 (0.0%) |
| Total (Category) | 0 (0.0%) | 0 (0.0%) |
| Total (Overall) | 83 (44.6%) | 103 (55.4%) |
Natural Resources, Construction and Maintenance Occupations
Natural Resources, Construction and Maintenance Occupations by Sex
| Occupation | Male | Female |
| Farming, Fishing & Forestry | 0 (0.0%) | 0 (0.0%) |
| Construction & Extraction | 0 (0.0%) | 0 (0.0%) |
| Installation, Maintenance & Repair | 0 (0.0%) | 0 (0.0%) |
| Total (Category) | 0 (0.0%) | 0 (0.0%) |
| Total (Overall) | 83 (44.6%) | 103 (55.4%) |
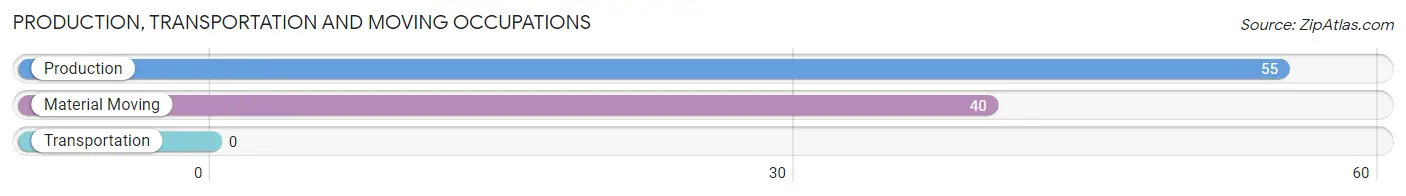
Production, Transportation and Moving Occupations
The most common Production, Transportation and Moving occupations in Swan Quarter are Production (55 | 29.6%), and Material Moving (40 | 21.5%).
Production, Transportation and Moving Occupations by Sex
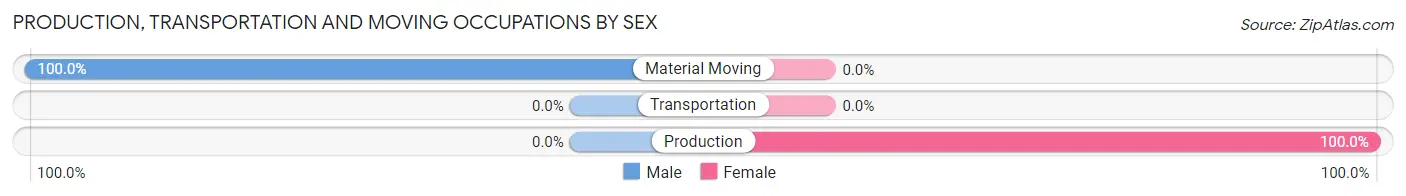
| Occupation | Male | Female |
| Production | 0 (0.0%) | 55 (100.0%) |
| Transportation | 0 (0.0%) | 0 (0.0%) |
| Material Moving | 40 (100.0%) | 0 (0.0%) |
| Total (Category) | 40 (42.1%) | 55 (57.9%) |
| Total (Overall) | 83 (44.6%) | 103 (55.4%) |
Employment Industries by Sex in Swan Quarter
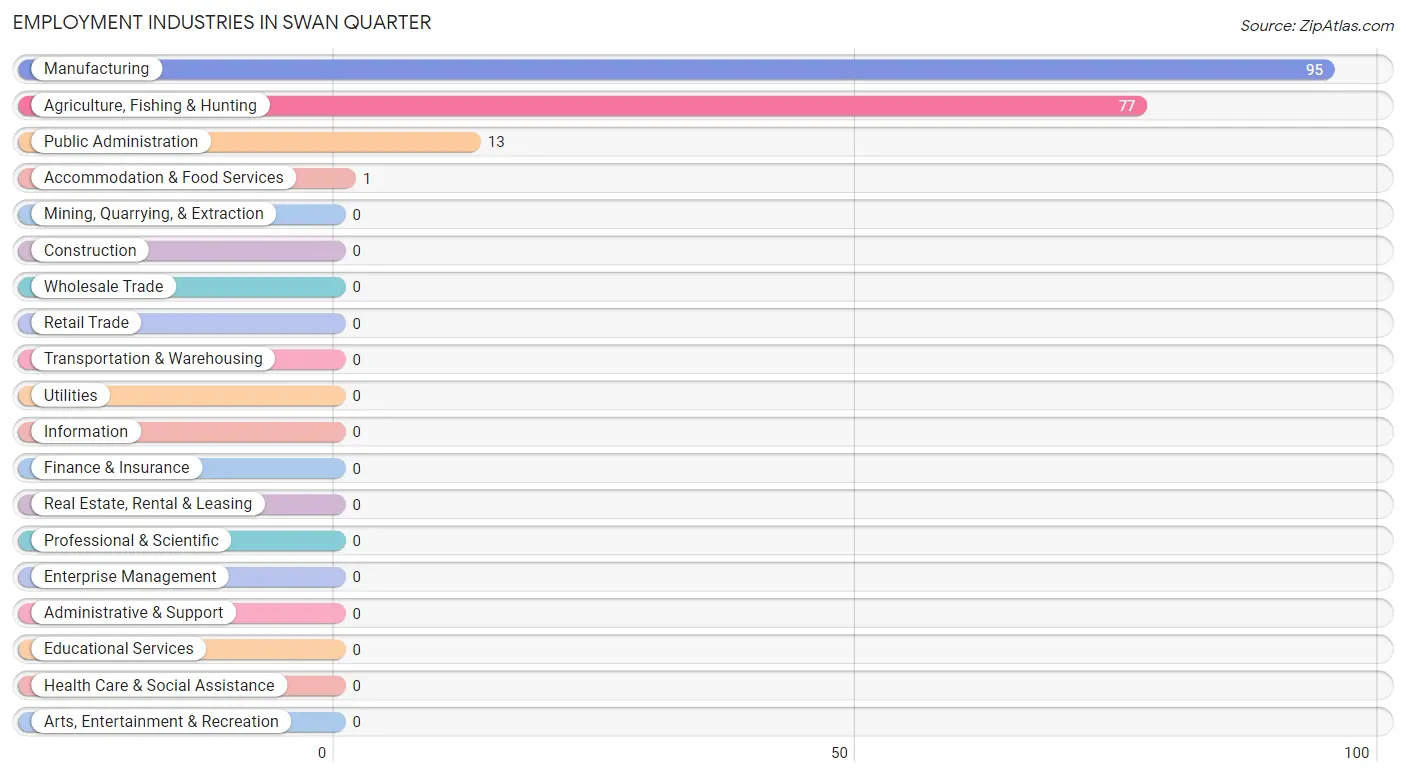
Employment Industries in Swan Quarter
The major employment industries in Swan Quarter include Manufacturing (95 | 51.1%), Agriculture, Fishing & Hunting (77 | 41.4%), Public Administration (13 | 7.0%), and Accommodation & Food Services (1 | 0.5%).
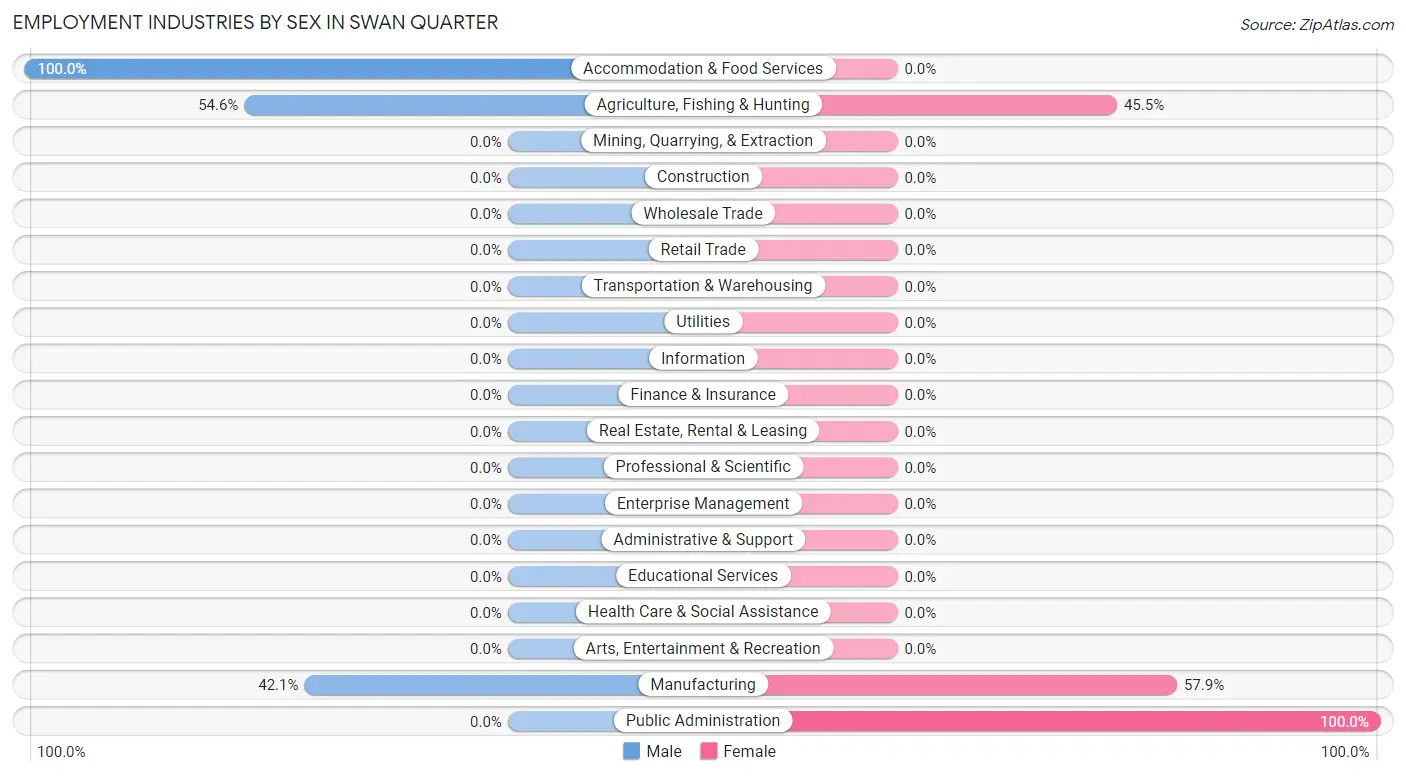
Employment Industries by Sex in Swan Quarter
The Swan Quarter industries that see more men than women are Accommodation & Food Services (100.0%), Agriculture, Fishing & Hunting (54.5%), and Manufacturing (42.1%), whereas the industries that tend to have a higher number of women are Public Administration (100.0%), Manufacturing (57.9%), and Agriculture, Fishing & Hunting (45.5%).
| Industry | Male | Female |
| Agriculture, Fishing & Hunting | 42 (54.5%) | 35 (45.5%) |
| Mining, Quarrying, & Extraction | 0 (0.0%) | 0 (0.0%) |
| Construction | 0 (0.0%) | 0 (0.0%) |
| Manufacturing | 40 (42.1%) | 55 (57.9%) |
| Wholesale Trade | 0 (0.0%) | 0 (0.0%) |
| Retail Trade | 0 (0.0%) | 0 (0.0%) |
| Transportation & Warehousing | 0 (0.0%) | 0 (0.0%) |
| Utilities | 0 (0.0%) | 0 (0.0%) |
| Information | 0 (0.0%) | 0 (0.0%) |
| Finance & Insurance | 0 (0.0%) | 0 (0.0%) |
| Real Estate, Rental & Leasing | 0 (0.0%) | 0 (0.0%) |
| Professional & Scientific | 0 (0.0%) | 0 (0.0%) |
| Enterprise Management | 0 (0.0%) | 0 (0.0%) |
| Administrative & Support | 0 (0.0%) | 0 (0.0%) |
| Educational Services | 0 (0.0%) | 0 (0.0%) |
| Health Care & Social Assistance | 0 (0.0%) | 0 (0.0%) |
| Arts, Entertainment & Recreation | 0 (0.0%) | 0 (0.0%) |
| Accommodation & Food Services | 1 (100.0%) | 0 (0.0%) |
| Public Administration | 0 (0.0%) | 13 (100.0%) |
| Total | 83 (44.6%) | 103 (55.4%) |
Education in Swan Quarter
School Enrollment in Swan Quarter
| School Level | # Students | % Students |
| Nursery / Preschool | 0 | 0.0% |
| Kindergarten | 0 | 0.0% |
| Elementary School | 0 | 0.0% |
| Middle School | 0 | 0.0% |
| High School | 0 | 0.0% |
| College / Undergraduate | 0 | 0.0% |
| Graduate / Professional | 0 | 0.0% |
| Total | 0 | 0.0% |
School Enrollment by Age by Funding Source in Swan Quarter
| Age Bracket | Public School | Private School |
| 3 to 4 Year Olds | 0 (0.0%) | 0 (0.0%) |
| 5 to 9 Year Old | 0 (0.0%) | 0 (0.0%) |
| 10 to 14 Year Olds | 0 (0.0%) | 0 (0.0%) |
| 15 to 17 Year Olds | 0 (0.0%) | 0 (0.0%) |
| 18 to 19 Year Olds | 0 (0.0%) | 0 (0.0%) |
| 20 to 24 Year Olds | 0 (0.0%) | 0 (0.0%) |
| 25 to 34 Year Olds | 0 (0.0%) | 0 (0.0%) |
| 35 Years and over | 0 (0.0%) | 0 (0.0%) |
| Total | 0 (0.0%) | 0 (0.0%) |
Educational Attainment by Field of Study in Swan Quarter
, and bio, nature & agricultural (31 | 100.0%) are the most common fields of study among 31 individuals in Swan Quarter who have obtained a bachelor's degree or higher.
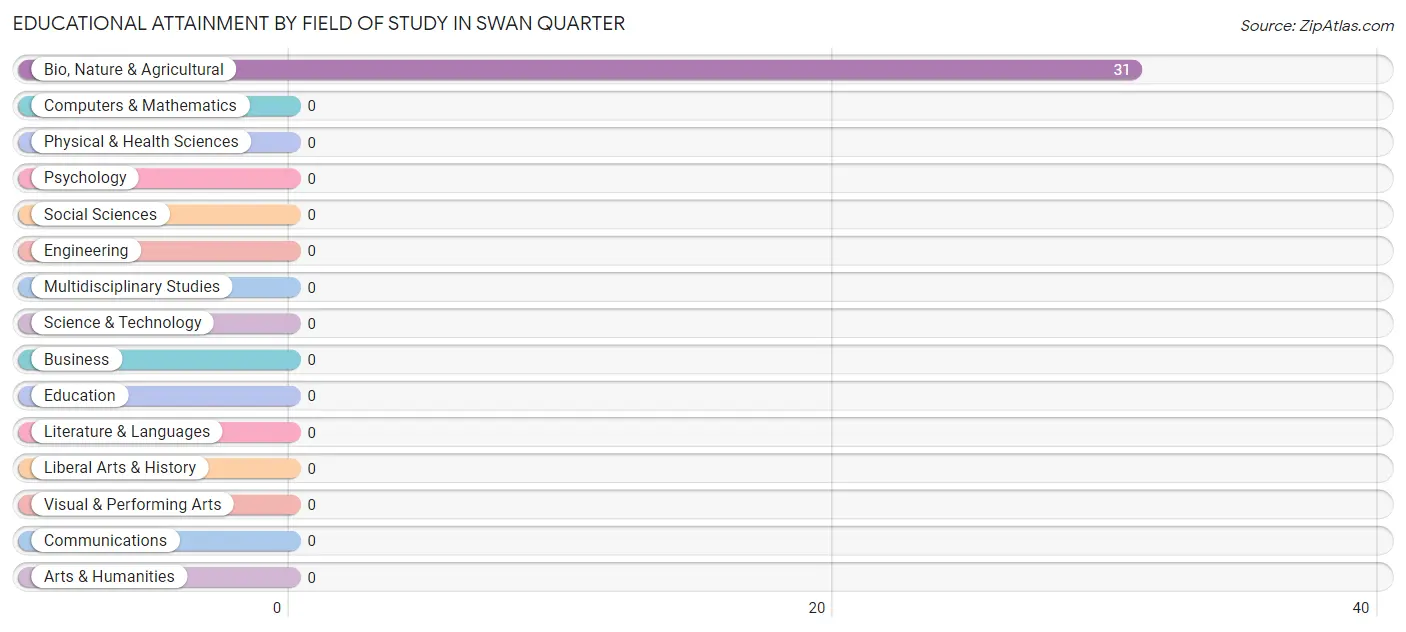
| Field of Study | # Graduates | % Graduates |
| Computers & Mathematics | 0 | 0.0% |
| Bio, Nature & Agricultural | 31 | 100.0% |
| Physical & Health Sciences | 0 | 0.0% |
| Psychology | 0 | 0.0% |
| Social Sciences | 0 | 0.0% |
| Engineering | 0 | 0.0% |
| Multidisciplinary Studies | 0 | 0.0% |
| Science & Technology | 0 | 0.0% |
| Business | 0 | 0.0% |
| Education | 0 | 0.0% |
| Literature & Languages | 0 | 0.0% |
| Liberal Arts & History | 0 | 0.0% |
| Visual & Performing Arts | 0 | 0.0% |
| Communications | 0 | 0.0% |
| Arts & Humanities | 0 | 0.0% |
| Total | 31 | 100.0% |
Transportation & Commute in Swan Quarter
Vehicle Availability by Sex in Swan Quarter
The most prevalent vehicle ownership categories in Swan Quarter are males with 2 vehicles (83, accounting for 100.0%) and females with 2 vehicles (103, making up 80.6%).
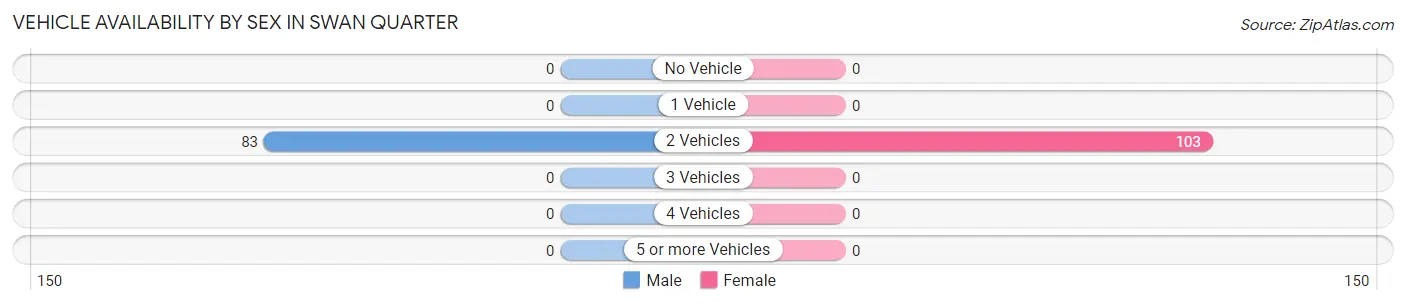
| Vehicles Available | Male | Female |
| No Vehicle | 0 (0.0%) | 0 (0.0%) |
| 1 Vehicle | 0 (0.0%) | 0 (0.0%) |
| 2 Vehicles | 83 (100.0%) | 103 (100.0%) |
| 3 Vehicles | 0 (0.0%) | 0 (0.0%) |
| 4 Vehicles | 0 (0.0%) | 0 (0.0%) |
| 5 or more Vehicles | 0 (0.0%) | 0 (0.0%) |
| Total | 83 (100.0%) | 103 (100.0%) |
Commute Time in Swan Quarter
The most frequently occuring commute durations in Swan Quarter are 5 to 9 minutes (55 commuters, 29.6%), 10 to 14 minutes (55 commuters, 29.6%), and 30 to 34 minutes (40 commuters, 21.5%).
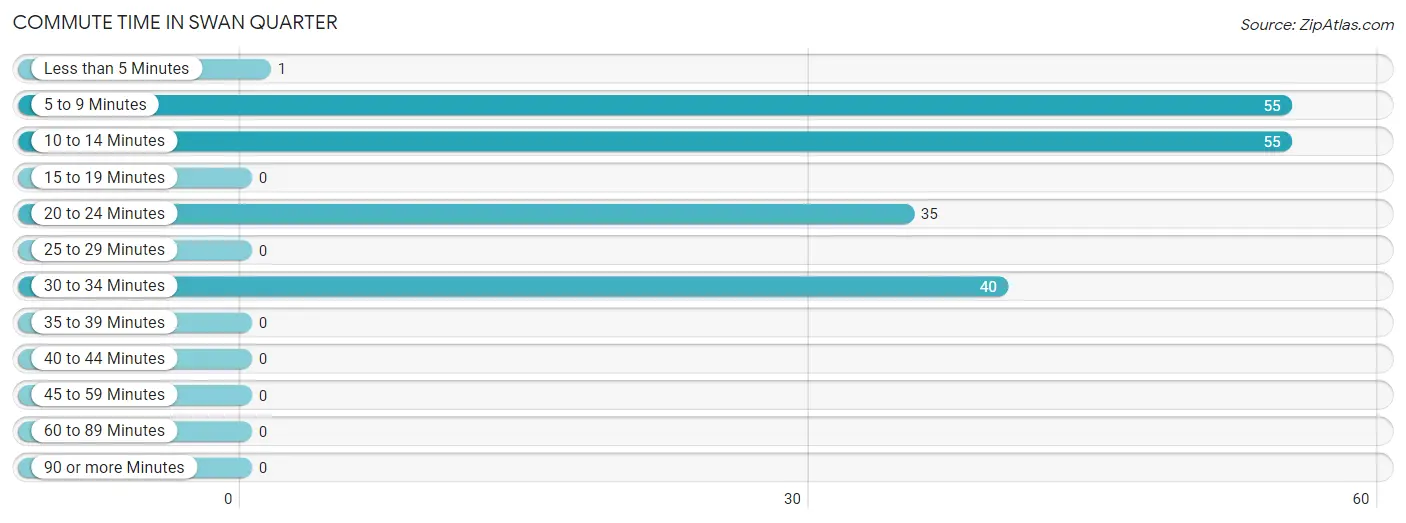
| Commute Time | # Commuters | % Commuters |
| Less than 5 Minutes | 1 | 0.5% |
| 5 to 9 Minutes | 55 | 29.6% |
| 10 to 14 Minutes | 55 | 29.6% |
| 15 to 19 Minutes | 0 | 0.0% |
| 20 to 24 Minutes | 35 | 18.8% |
| 25 to 29 Minutes | 0 | 0.0% |
| 30 to 34 Minutes | 40 | 21.5% |
| 35 to 39 Minutes | 0 | 0.0% |
| 40 to 44 Minutes | 0 | 0.0% |
| 45 to 59 Minutes | 0 | 0.0% |
| 60 to 89 Minutes | 0 | 0.0% |
| 90 or more Minutes | 0 | 0.0% |
Commute Time by Sex in Swan Quarter
The most common commute times in Swan Quarter are 5 to 9 minutes (42 commuters, 50.6%) for males and 10 to 14 minutes (55 commuters, 53.4%) for females.
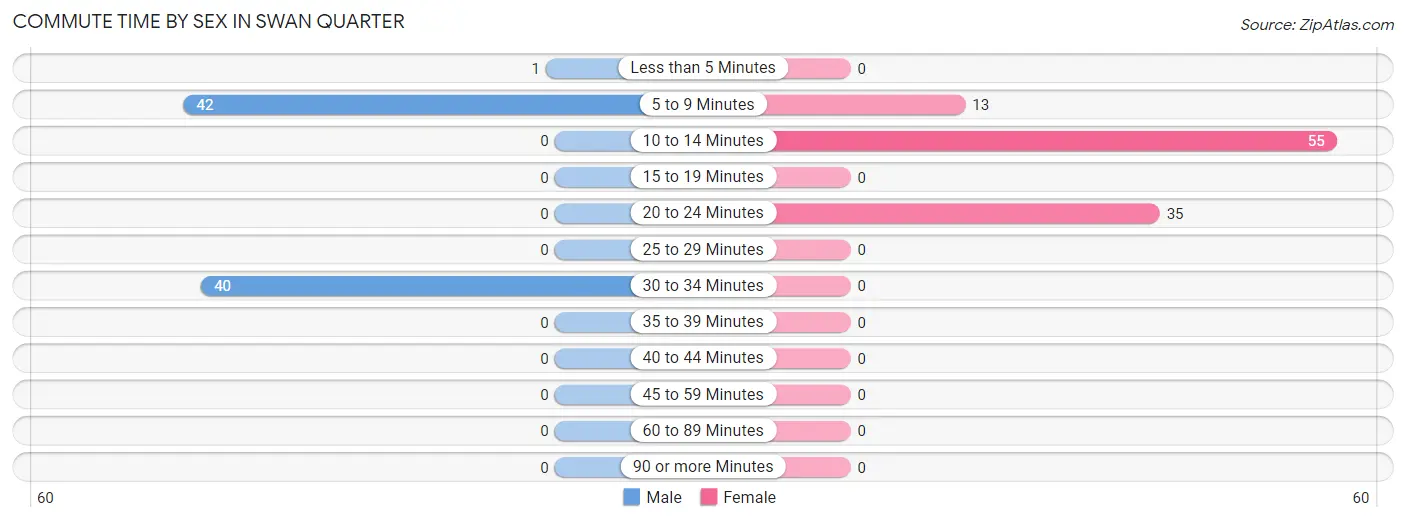
| Commute Time | Male | Female |
| Less than 5 Minutes | 1 (1.2%) | 0 (0.0%) |
| 5 to 9 Minutes | 42 (50.6%) | 13 (12.6%) |
| 10 to 14 Minutes | 0 (0.0%) | 55 (53.4%) |
| 15 to 19 Minutes | 0 (0.0%) | 0 (0.0%) |
| 20 to 24 Minutes | 0 (0.0%) | 35 (34.0%) |
| 25 to 29 Minutes | 0 (0.0%) | 0 (0.0%) |
| 30 to 34 Minutes | 40 (48.2%) | 0 (0.0%) |
| 35 to 39 Minutes | 0 (0.0%) | 0 (0.0%) |
| 40 to 44 Minutes | 0 (0.0%) | 0 (0.0%) |
| 45 to 59 Minutes | 0 (0.0%) | 0 (0.0%) |
| 60 to 89 Minutes | 0 (0.0%) | 0 (0.0%) |
| 90 or more Minutes | 0 (0.0%) | 0 (0.0%) |
Time of Departure to Work by Sex in Swan Quarter
The most frequent times of departure to work in Swan Quarter are 7:30 AM to 7:59 AM (42, 50.6%) for males and 7:30 AM to 7:59 AM (103, 100.0%) for females.
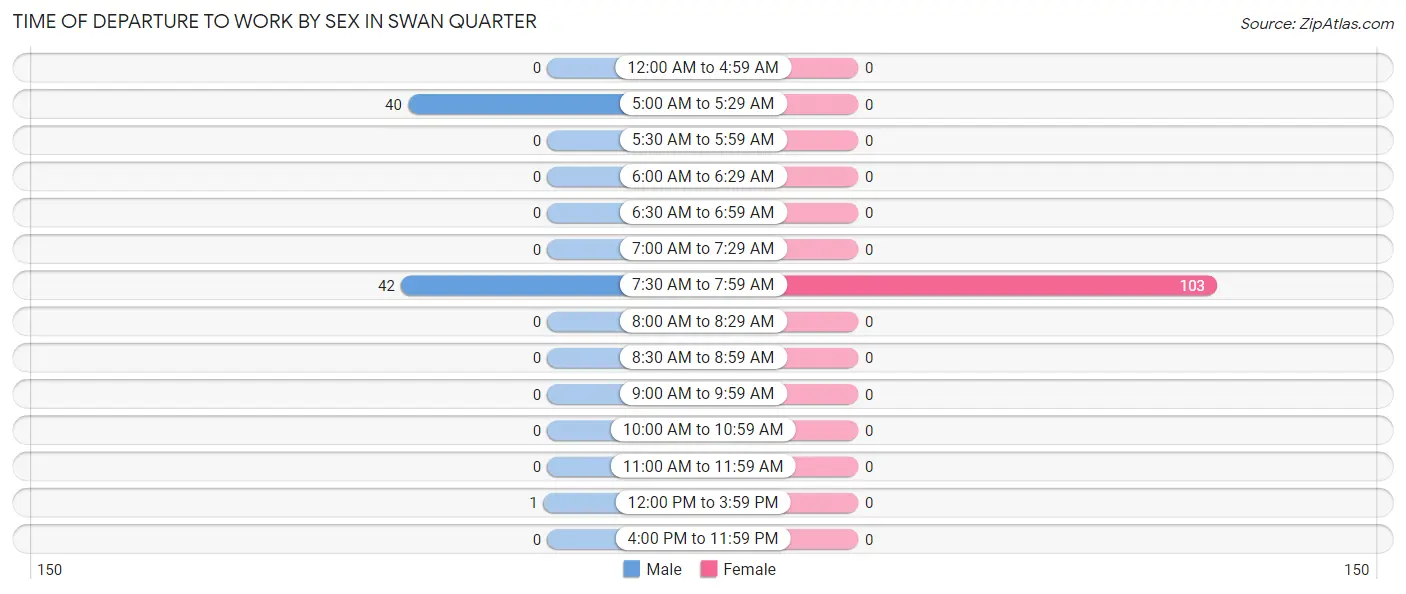
| Time of Departure | Male | Female |
| 12:00 AM to 4:59 AM | 0 (0.0%) | 0 (0.0%) |
| 5:00 AM to 5:29 AM | 40 (48.2%) | 0 (0.0%) |
| 5:30 AM to 5:59 AM | 0 (0.0%) | 0 (0.0%) |
| 6:00 AM to 6:29 AM | 0 (0.0%) | 0 (0.0%) |
| 6:30 AM to 6:59 AM | 0 (0.0%) | 0 (0.0%) |
| 7:00 AM to 7:29 AM | 0 (0.0%) | 0 (0.0%) |
| 7:30 AM to 7:59 AM | 42 (50.6%) | 103 (100.0%) |
| 8:00 AM to 8:29 AM | 0 (0.0%) | 0 (0.0%) |
| 8:30 AM to 8:59 AM | 0 (0.0%) | 0 (0.0%) |
| 9:00 AM to 9:59 AM | 0 (0.0%) | 0 (0.0%) |
| 10:00 AM to 10:59 AM | 0 (0.0%) | 0 (0.0%) |
| 11:00 AM to 11:59 AM | 0 (0.0%) | 0 (0.0%) |
| 12:00 PM to 3:59 PM | 1 (1.2%) | 0 (0.0%) |
| 4:00 PM to 11:59 PM | 0 (0.0%) | 0 (0.0%) |
| Total | 83 (100.0%) | 103 (100.0%) |
Housing Occupancy in Swan Quarter
Occupancy by Ownership in Swan Quarter
Of the total 148 dwellings in Swan Quarter, owner-occupied units account for 108 (73.0%), while renter-occupied units make up 40 (27.0%).
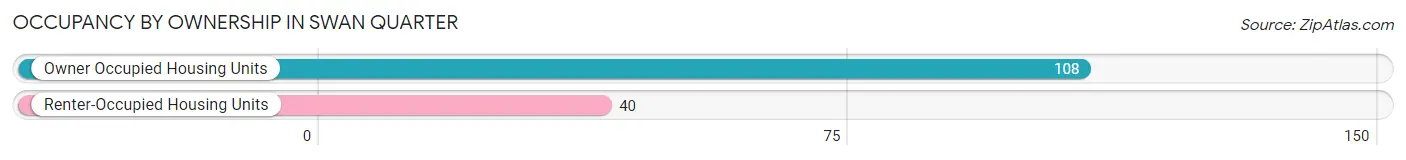
| Occupancy | # Housing Units | % Housing Units |
| Owner Occupied Housing Units | 108 | 73.0% |
| Renter-Occupied Housing Units | 40 | 27.0% |
| Total Occupied Housing Units | 148 | 100.0% |
Occupancy by Household Size in Swan Quarter
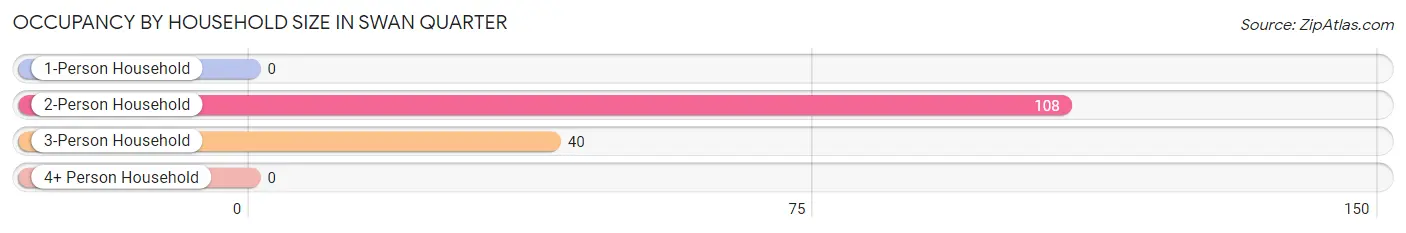
| Household Size | # Housing Units | % Housing Units |
| 1-Person Household | 0 | 0.0% |
| 2-Person Household | 108 | 73.0% |
| 3-Person Household | 40 | 27.0% |
| 4+ Person Household | 0 | 0.0% |
| Total Housing Units | 148 | 100.0% |
Occupancy by Ownership by Household Size in Swan Quarter
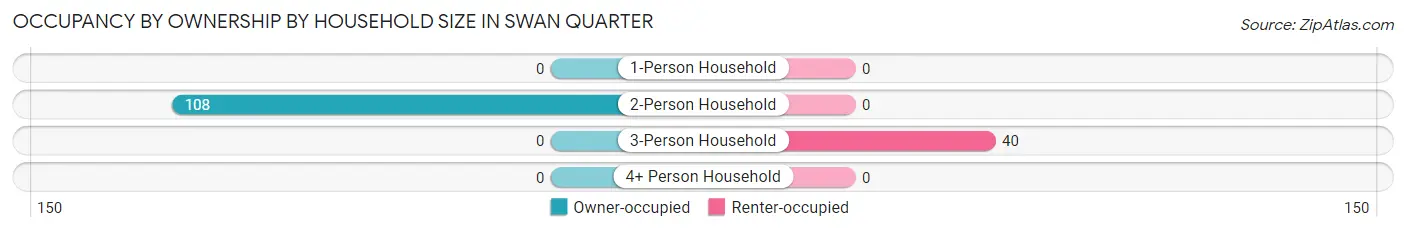
| Household Size | Owner-occupied | Renter-occupied |
| 1-Person Household | 0 (0.0%) | 0 (0.0%) |
| 2-Person Household | 108 (100.0%) | 0 (0.0%) |
| 3-Person Household | 0 (0.0%) | 40 (100.0%) |
| 4+ Person Household | 0 (0.0%) | 0 (0.0%) |
| Total Housing Units | 108 (73.0%) | 40 (27.0%) |
Occupancy by Educational Attainment in Swan Quarter
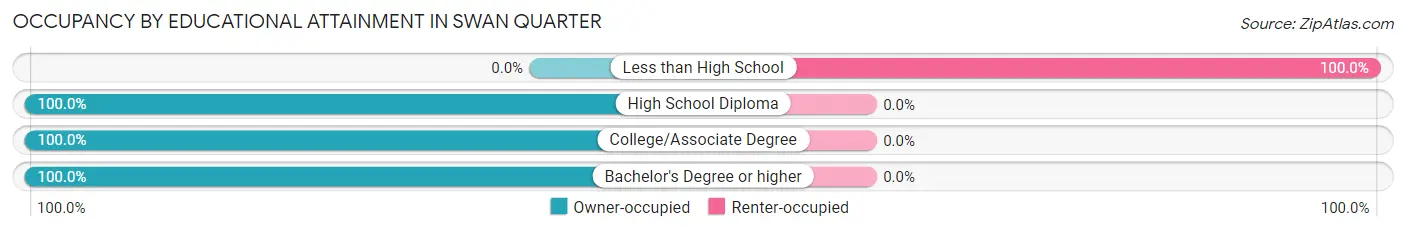
| Household Size | Owner-occupied | Renter-occupied |
| Less than High School | 0 (0.0%) | 40 (100.0%) |
| High School Diploma | 24 (100.0%) | 0 (0.0%) |
| College/Associate Degree | 53 (100.0%) | 0 (0.0%) |
| Bachelor's Degree or higher | 31 (100.0%) | 0 (0.0%) |
Occupancy by Age of Householder in Swan Quarter
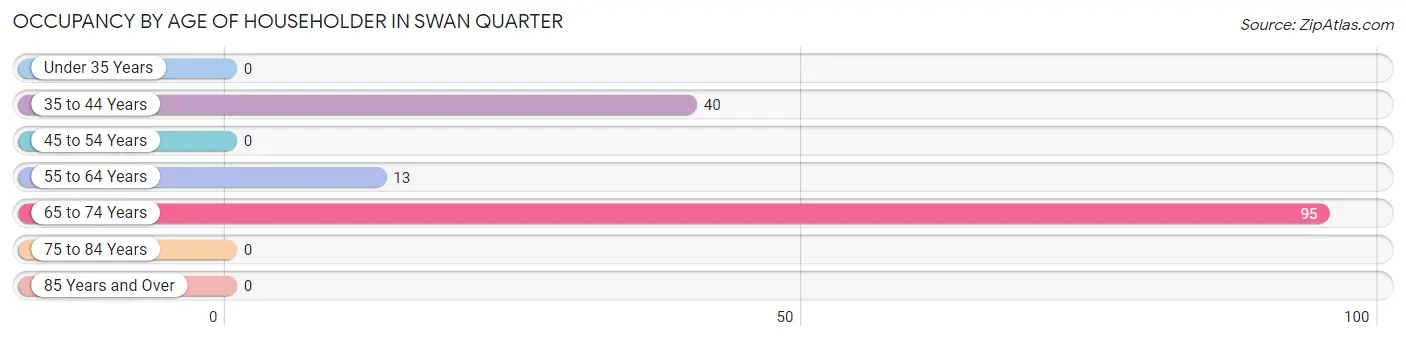
| Age Bracket | # Households | % Households |
| Under 35 Years | 0 | 0.0% |
| 35 to 44 Years | 40 | 27.0% |
| 45 to 54 Years | 0 | 0.0% |
| 55 to 64 Years | 13 | 8.8% |
| 65 to 74 Years | 95 | 64.2% |
| 75 to 84 Years | 0 | 0.0% |
| 85 Years and Over | 0 | 0.0% |
| Total | 148 | 100.0% |
Housing Finances in Swan Quarter
Median Income by Occupancy in Swan Quarter
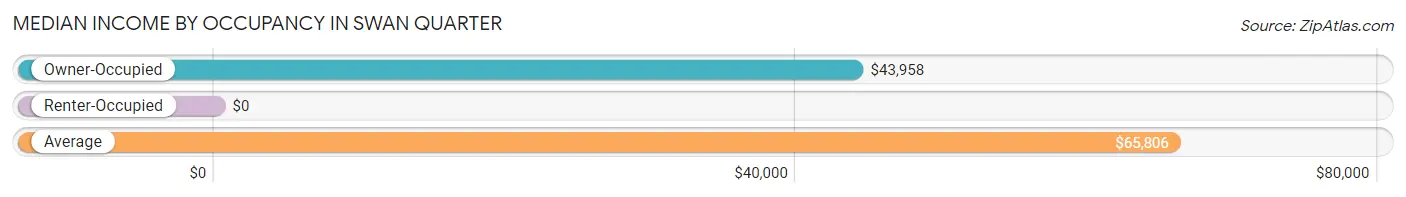
| Occupancy Type | # Households | Median Income |
| Owner-Occupied | 108 (73.0%) | $43,958 |
| Renter-Occupied | 40 (27.0%) | $0 |
| Average | 148 (100.0%) | $65,806 |
Occupancy by Householder Income Bracket in Swan Quarter
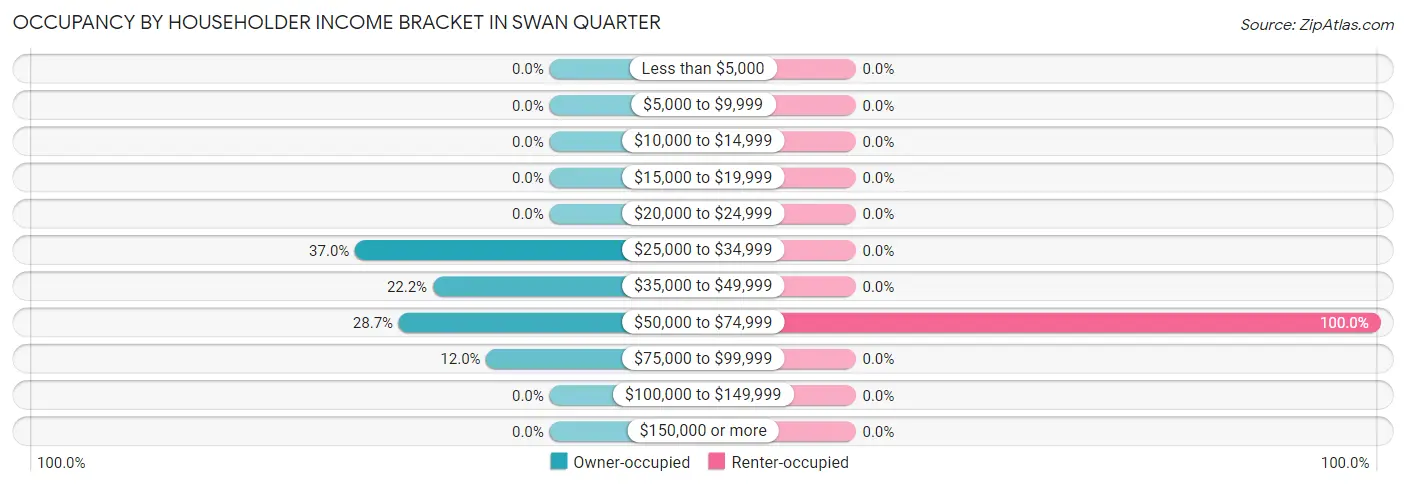
| Income Bracket | Owner-occupied | Renter-occupied |
| Less than $5,000 | 0 (0.0%) | 0 (0.0%) |
| $5,000 to $9,999 | 0 (0.0%) | 0 (0.0%) |
| $10,000 to $14,999 | 0 (0.0%) | 0 (0.0%) |
| $15,000 to $19,999 | 0 (0.0%) | 0 (0.0%) |
| $20,000 to $24,999 | 0 (0.0%) | 0 (0.0%) |
| $25,000 to $34,999 | 40 (37.0%) | 0 (0.0%) |
| $35,000 to $49,999 | 24 (22.2%) | 0 (0.0%) |
| $50,000 to $74,999 | 31 (28.7%) | 40 (100.0%) |
| $75,000 to $99,999 | 13 (12.0%) | 0 (0.0%) |
| $100,000 to $149,999 | 0 (0.0%) | 0 (0.0%) |
| $150,000 or more | 0 (0.0%) | 0 (0.0%) |
| Total | 108 (100.0%) | 40 (100.0%) |
Monthly Housing Cost Tiers in Swan Quarter
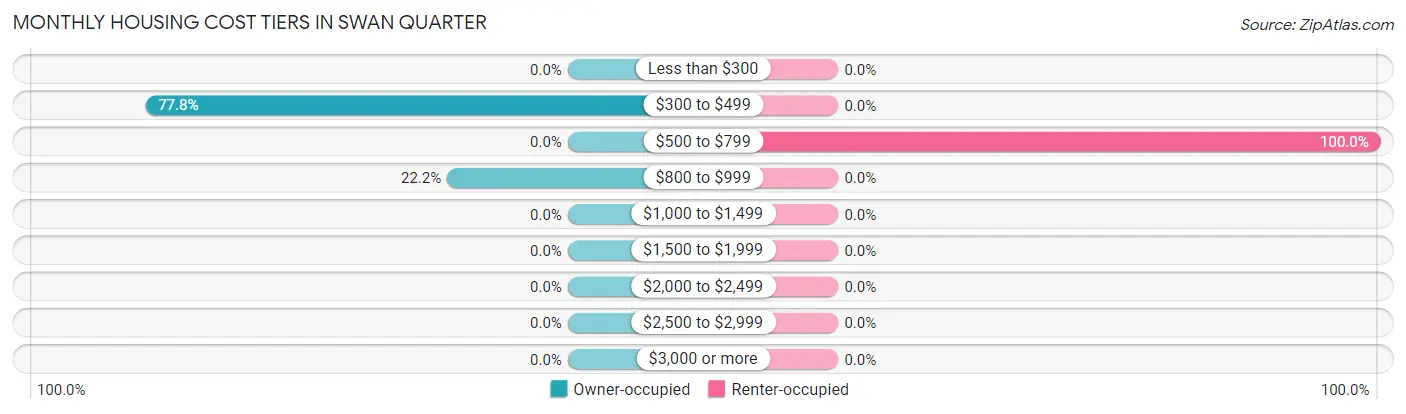
| Monthly Cost | Owner-occupied | Renter-occupied |
| Less than $300 | 0 (0.0%) | 0 (0.0%) |
| $300 to $499 | 84 (77.8%) | 0 (0.0%) |
| $500 to $799 | 0 (0.0%) | 40 (100.0%) |
| $800 to $999 | 24 (22.2%) | 0 (0.0%) |
| $1,000 to $1,499 | 0 (0.0%) | 0 (0.0%) |
| $1,500 to $1,999 | 0 (0.0%) | 0 (0.0%) |
| $2,000 to $2,499 | 0 (0.0%) | 0 (0.0%) |
| $2,500 to $2,999 | 0 (0.0%) | 0 (0.0%) |
| $3,000 or more | 0 (0.0%) | 0 (0.0%) |
| Total | 108 (100.0%) | 40 (100.0%) |
Physical Housing Characteristics in Swan Quarter
Housing Structures in Swan Quarter
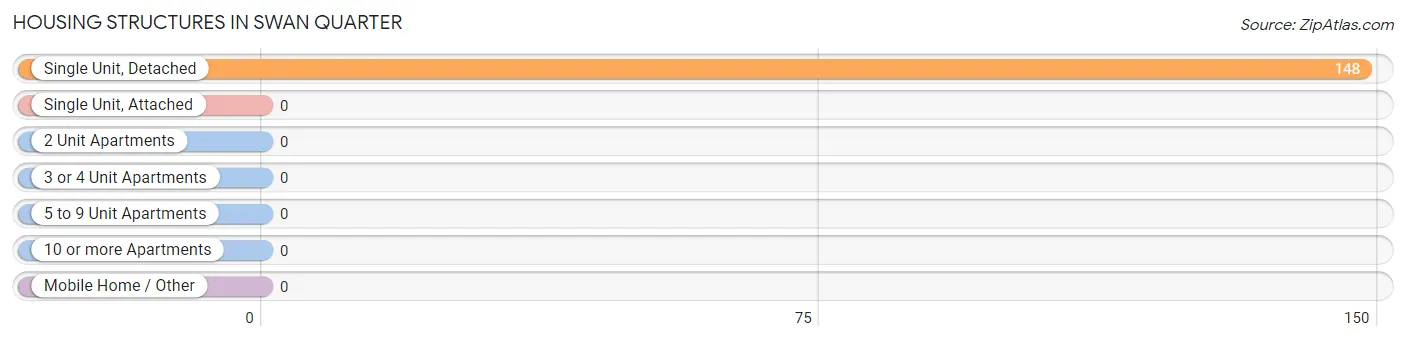
| Structure Type | # Housing Units | % Housing Units |
| Single Unit, Detached | 148 | 100.0% |
| Single Unit, Attached | 0 | 0.0% |
| 2 Unit Apartments | 0 | 0.0% |
| 3 or 4 Unit Apartments | 0 | 0.0% |
| 5 to 9 Unit Apartments | 0 | 0.0% |
| 10 or more Apartments | 0 | 0.0% |
| Mobile Home / Other | 0 | 0.0% |
| Total | 148 | 100.0% |
Housing Structures by Occupancy in Swan Quarter
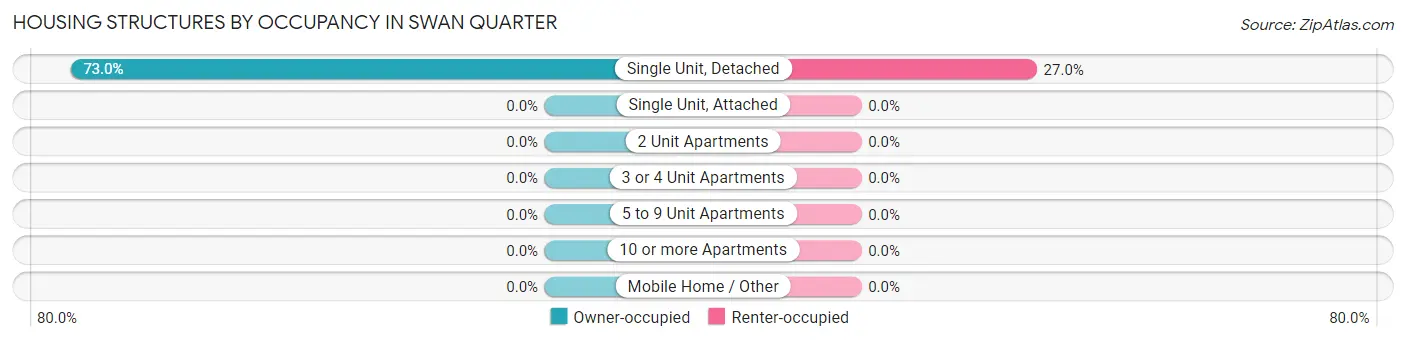
| Structure Type | Owner-occupied | Renter-occupied |
| Single Unit, Detached | 108 (73.0%) | 40 (27.0%) |
| Single Unit, Attached | 0 (0.0%) | 0 (0.0%) |
| 2 Unit Apartments | 0 (0.0%) | 0 (0.0%) |
| 3 or 4 Unit Apartments | 0 (0.0%) | 0 (0.0%) |
| 5 to 9 Unit Apartments | 0 (0.0%) | 0 (0.0%) |
| 10 or more Apartments | 0 (0.0%) | 0 (0.0%) |
| Mobile Home / Other | 0 (0.0%) | 0 (0.0%) |
| Total | 108 (73.0%) | 40 (27.0%) |
Housing Structures by Number of Rooms in Swan Quarter
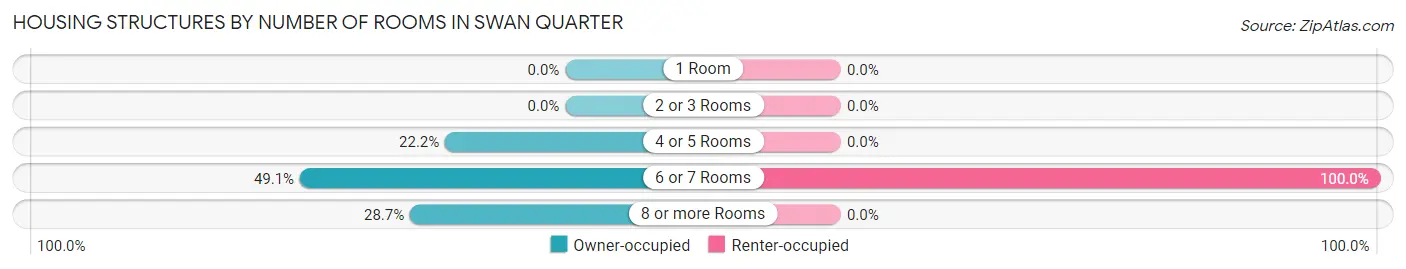
| Number of Rooms | Owner-occupied | Renter-occupied |
| 1 Room | 0 (0.0%) | 0 (0.0%) |
| 2 or 3 Rooms | 0 (0.0%) | 0 (0.0%) |
| 4 or 5 Rooms | 24 (22.2%) | 0 (0.0%) |
| 6 or 7 Rooms | 53 (49.1%) | 40 (100.0%) |
| 8 or more Rooms | 31 (28.7%) | 0 (0.0%) |
| Total | 108 (100.0%) | 40 (100.0%) |
Housing Structure by Heating Type in Swan Quarter
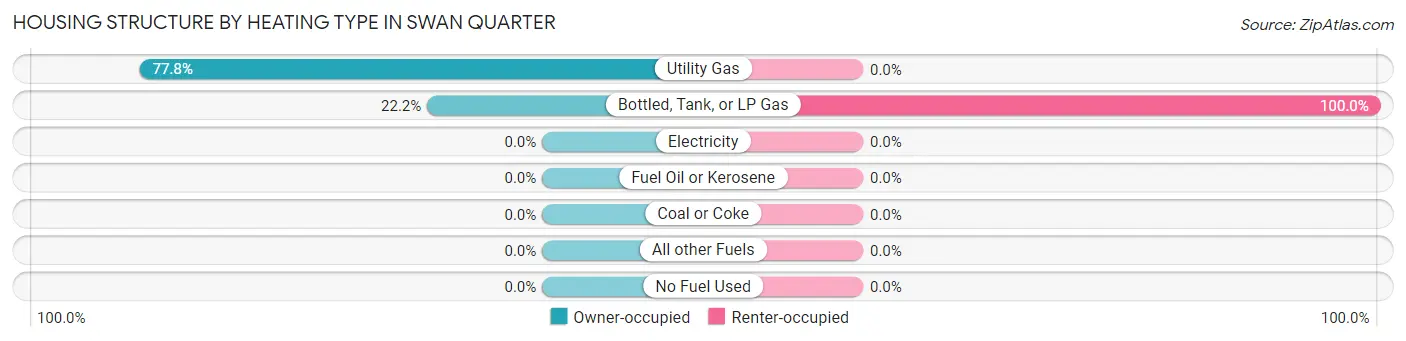
| Heating Type | Owner-occupied | Renter-occupied |
| Utility Gas | 84 (77.8%) | 0 (0.0%) |
| Bottled, Tank, or LP Gas | 24 (22.2%) | 40 (100.0%) |
| Electricity | 0 (0.0%) | 0 (0.0%) |
| Fuel Oil or Kerosene | 0 (0.0%) | 0 (0.0%) |
| Coal or Coke | 0 (0.0%) | 0 (0.0%) |
| All other Fuels | 0 (0.0%) | 0 (0.0%) |
| No Fuel Used | 0 (0.0%) | 0 (0.0%) |
| Total | 108 (100.0%) | 40 (100.0%) |
Household Vehicle Usage in Swan Quarter
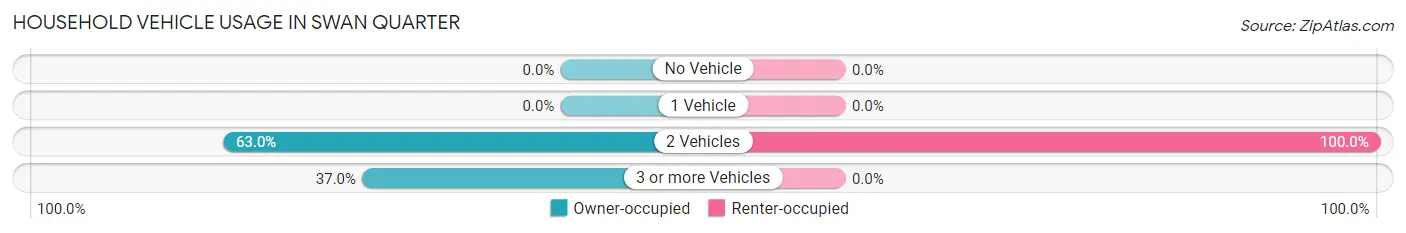
| Vehicles per Household | Owner-occupied | Renter-occupied |
| No Vehicle | 0 (0.0%) | 0 (0.0%) |
| 1 Vehicle | 0 (0.0%) | 0 (0.0%) |
| 2 Vehicles | 68 (63.0%) | 40 (100.0%) |
| 3 or more Vehicles | 40 (37.0%) | 0 (0.0%) |
| Total | 108 (100.0%) | 40 (100.0%) |
Real Estate & Mortgages in Swan Quarter
Real Estate and Mortgage Overview in Swan Quarter
| Characteristic | Without Mortgage | With Mortgage |
| Housing Units | 108 | 0 |
| Median Property Value | $97,500 | $0 |
| Median Household Income | $43,958 | $0 |
| Monthly Housing Costs | $443 | $0 |
| Real Estate Taxes | $1,103 | $0 |
Property Value by Mortgage Status in Swan Quarter
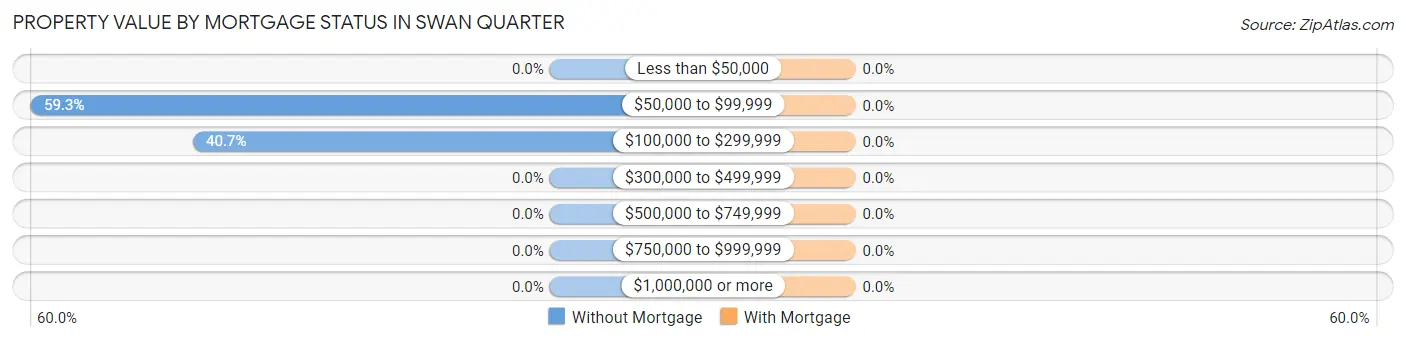
| Property Value | Without Mortgage | With Mortgage |
| Less than $50,000 | 0 (0.0%) | 0 (0.0%) |
| $50,000 to $99,999 | 64 (59.3%) | 0 (0.0%) |
| $100,000 to $299,999 | 44 (40.7%) | 0 (0.0%) |
| $300,000 to $499,999 | 0 (0.0%) | 0 (0.0%) |
| $500,000 to $749,999 | 0 (0.0%) | 0 (0.0%) |
| $750,000 to $999,999 | 0 (0.0%) | 0 (0.0%) |
| $1,000,000 or more | 0 (0.0%) | 0 (0.0%) |
| Total | 108 (100.0%) | 0 (0.0%) |
Household Income by Mortgage Status in Swan Quarter
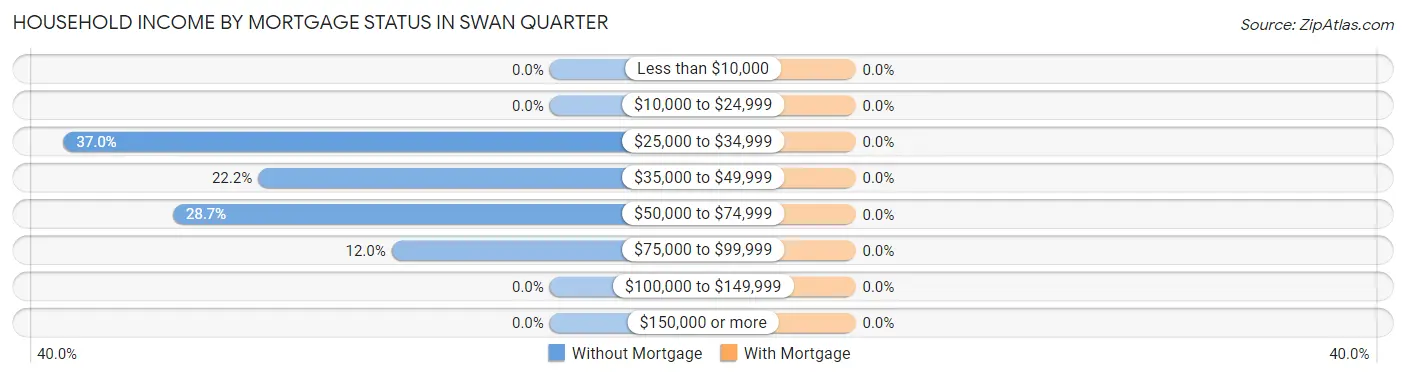
| Household Income | Without Mortgage | With Mortgage |
| Less than $10,000 | 0 (0.0%) | 0 (0.0%) |
| $10,000 to $24,999 | 0 (0.0%) | 0 (0.0%) |
| $25,000 to $34,999 | 40 (37.0%) | 0 (0.0%) |
| $35,000 to $49,999 | 24 (22.2%) | 0 (0.0%) |
| $50,000 to $74,999 | 31 (28.7%) | 0 (0.0%) |
| $75,000 to $99,999 | 13 (12.0%) | 0 (0.0%) |
| $100,000 to $149,999 | 0 (0.0%) | 0 (0.0%) |
| $150,000 or more | 0 (0.0%) | 0 (0.0%) |
| Total | 108 (100.0%) | 0 (0.0%) |
Property Value to Household Income Ratio in Swan Quarter
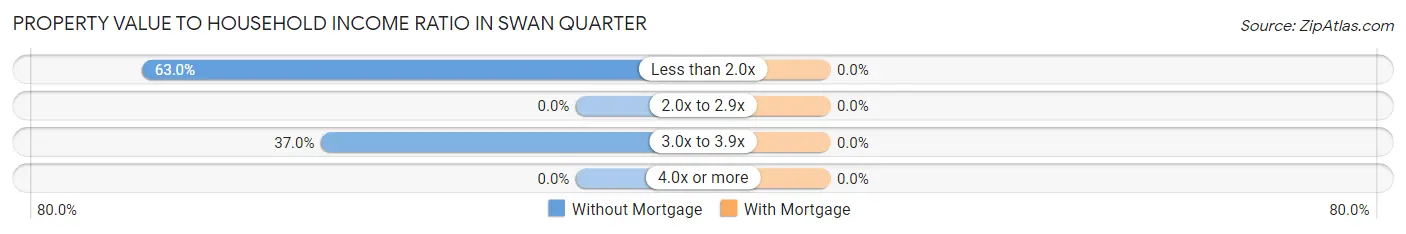
| Value-to-Income Ratio | Without Mortgage | With Mortgage |
| Less than 2.0x | 68 (63.0%) | 0 (0.0%) |
| 2.0x to 2.9x | 0 (0.0%) | 0 (0.0%) |
| 3.0x to 3.9x | 40 (37.0%) | 0 (0.0%) |
| 4.0x or more | 0 (0.0%) | 0 (0.0%) |
| Total | 108 (100.0%) | 0 (0.0%) |
Real Estate Taxes by Mortgage Status in Swan Quarter
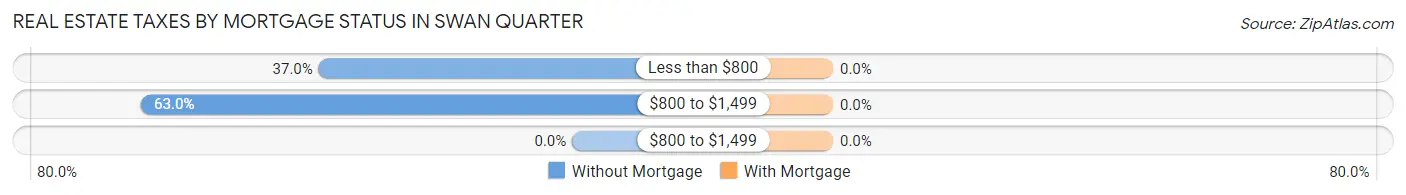
| Property Taxes | Without Mortgage | With Mortgage |
| Less than $800 | 40 (37.0%) | 0 (0.0%) |
| $800 to $1,499 | 68 (63.0%) | 0 (0.0%) |
| $800 to $1,499 | 0 (0.0%) | 0 (0.0%) |
| Total | 108 (100.0%) | 0 (0.0%) |
Health & Disability in Swan Quarter
Health Insurance Coverage by Age in Swan Quarter
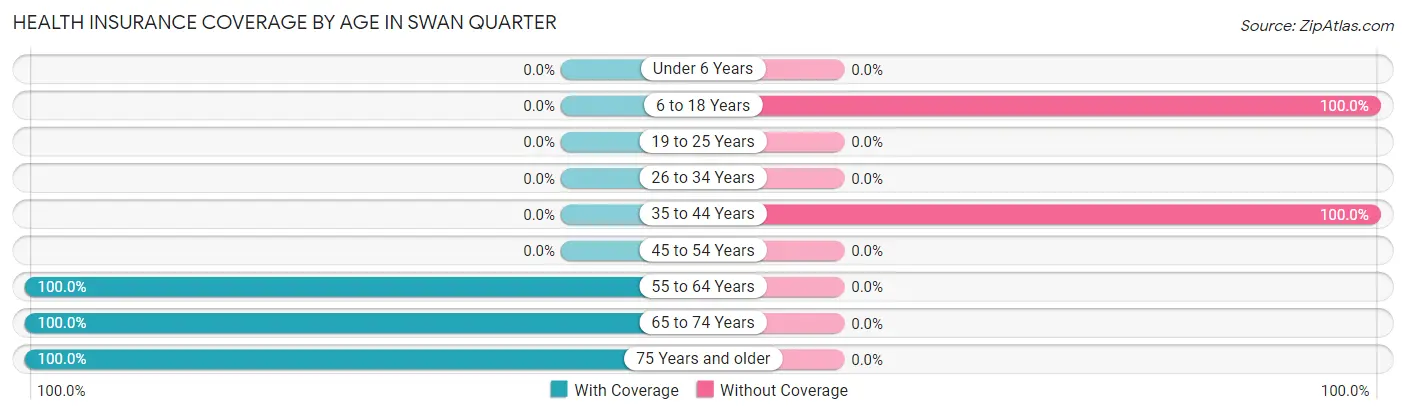
| Age Bracket | With Coverage | Without Coverage |
| Under 6 Years | 0 (0.0%) | 0 (0.0%) |
| 6 to 18 Years | 0 (0.0%) | 1 (100.0%) |
| 19 to 25 Years | 0 (0.0%) | 0 (0.0%) |
| 26 to 34 Years | 0 (0.0%) | 0 (0.0%) |
| 35 to 44 Years | 0 (0.0%) | 95 (100.0%) |
| 45 to 54 Years | 0 (0.0%) | 0 (0.0%) |
| 55 to 64 Years | 24 (100.0%) | 0 (0.0%) |
| 65 to 74 Years | 154 (100.0%) | 0 (0.0%) |
| 75 Years and older | 19 (100.0%) | 0 (0.0%) |
| Total | 197 (67.2%) | 96 (32.8%) |
Health Insurance Coverage by Citizenship Status in Swan Quarter
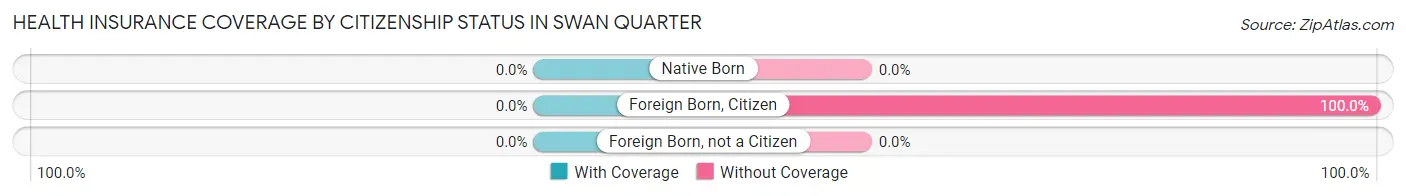
| Citizenship Status | With Coverage | Without Coverage |
| Native Born | 0 (0.0%) | 0 (0.0%) |
| Foreign Born, Citizen | 0 (0.0%) | 1 (100.0%) |
| Foreign Born, not a Citizen | 0 (0.0%) | 0 (0.0%) |
Health Insurance Coverage by Household Income in Swan Quarter
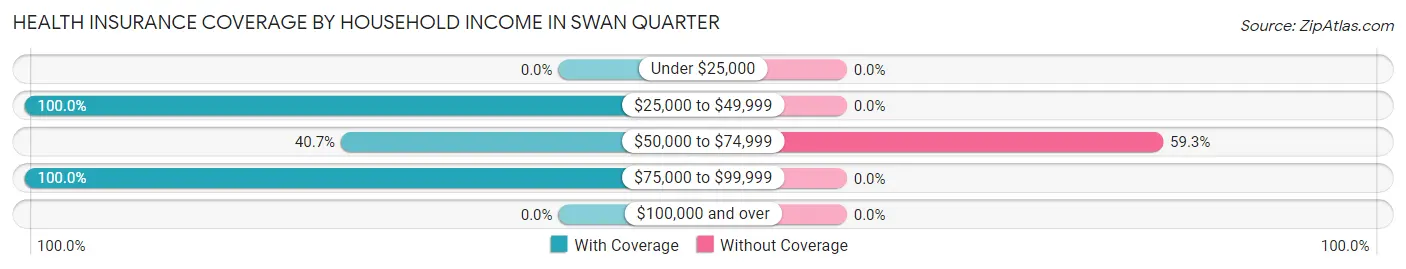
| Household Income | With Coverage | Without Coverage |
| Under $25,000 | 0 (0.0%) | 0 (0.0%) |
| $25,000 to $49,999 | 107 (100.0%) | 0 (0.0%) |
| $50,000 to $74,999 | 66 (40.7%) | 96 (59.3%) |
| $75,000 to $99,999 | 24 (100.0%) | 0 (0.0%) |
| $100,000 and over | 0 (0.0%) | 0 (0.0%) |
Public vs Private Health Insurance Coverage by Age in Swan Quarter
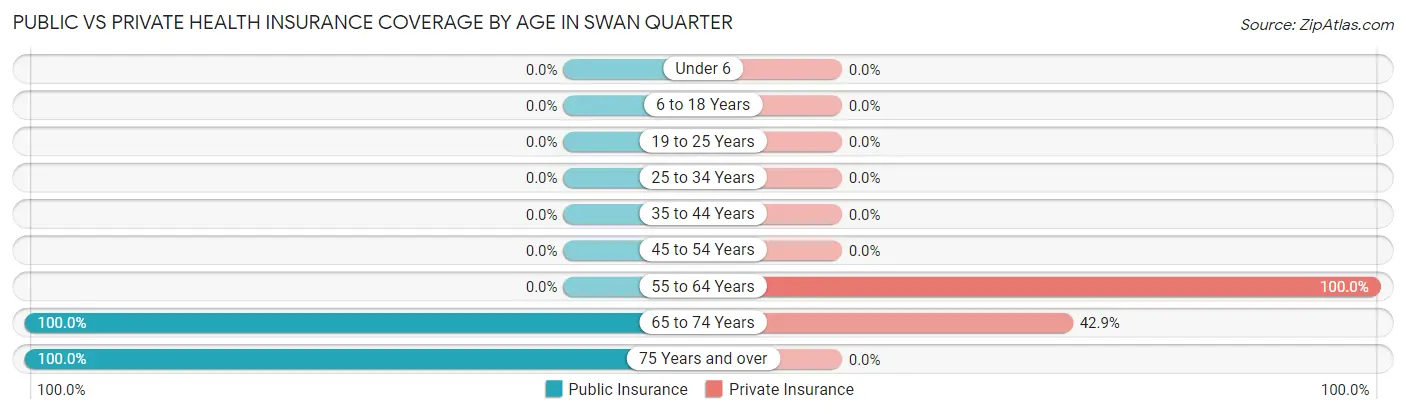
| Age Bracket | Public Insurance | Private Insurance |
| Under 6 | 0 (0.0%) | 0 (0.0%) |
| 6 to 18 Years | 0 (0.0%) | 0 (0.0%) |
| 19 to 25 Years | 0 (0.0%) | 0 (0.0%) |
| 25 to 34 Years | 0 (0.0%) | 0 (0.0%) |
| 35 to 44 Years | 0 (0.0%) | 0 (0.0%) |
| 45 to 54 Years | 0 (0.0%) | 0 (0.0%) |
| 55 to 64 Years | 0 (0.0%) | 24 (100.0%) |
| 65 to 74 Years | 154 (100.0%) | 66 (42.9%) |
| 75 Years and over | 19 (100.0%) | 0 (0.0%) |
| Total | 173 (59.0%) | 90 (30.7%) |
Disability Status by Sex by Age in Swan Quarter
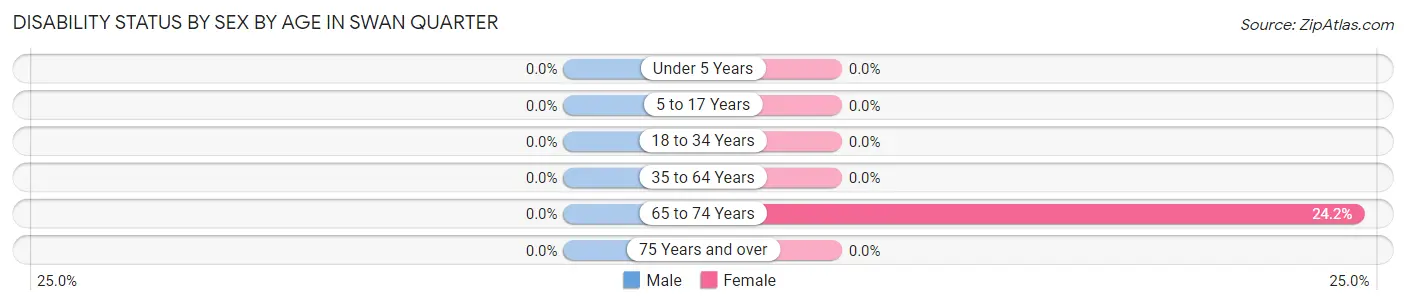
| Age Bracket | Male | Female |
| Under 5 Years | 0 (0.0%) | 0 (0.0%) |
| 5 to 17 Years | 0 (0.0%) | 0 (0.0%) |
| 18 to 34 Years | 0 (0.0%) | 0 (0.0%) |
| 35 to 64 Years | 0 (0.0%) | 0 (0.0%) |
| 65 to 74 Years | 0 (0.0%) | 24 (24.2%) |
| 75 Years and over | 0 (0.0%) | 0 (0.0%) |
Disability Class by Sex by Age in Swan Quarter
Disability Class: Hearing Difficulty
| Age Bracket | Male | Female |
| Under 5 Years | 0 (0.0%) | 0 (0.0%) |
| 5 to 17 Years | 0 (0.0%) | 0 (0.0%) |
| 18 to 34 Years | 0 (0.0%) | 0 (0.0%) |
| 35 to 64 Years | 0 (0.0%) | 0 (0.0%) |
| 65 to 74 Years | 0 (0.0%) | 0 (0.0%) |
| 75 Years and over | 0 (0.0%) | 0 (0.0%) |
Disability Class: Vision Difficulty
| Age Bracket | Male | Female |
| Under 5 Years | 0 (0.0%) | 0 (0.0%) |
| 5 to 17 Years | 0 (0.0%) | 0 (0.0%) |
| 18 to 34 Years | 0 (0.0%) | 0 (0.0%) |
| 35 to 64 Years | 0 (0.0%) | 0 (0.0%) |
| 65 to 74 Years | 0 (0.0%) | 0 (0.0%) |
| 75 Years and over | 0 (0.0%) | 0 (0.0%) |
Disability Class: Cognitive Difficulty
| Age Bracket | Male | Female |
| 5 to 17 Years | 0 (0.0%) | 0 (0.0%) |
| 18 to 34 Years | 0 (0.0%) | 0 (0.0%) |
| 35 to 64 Years | 0 (0.0%) | 0 (0.0%) |
| 65 to 74 Years | 0 (0.0%) | 0 (0.0%) |
| 75 Years and over | 0 (0.0%) | 0 (0.0%) |
Disability Class: Ambulatory Difficulty
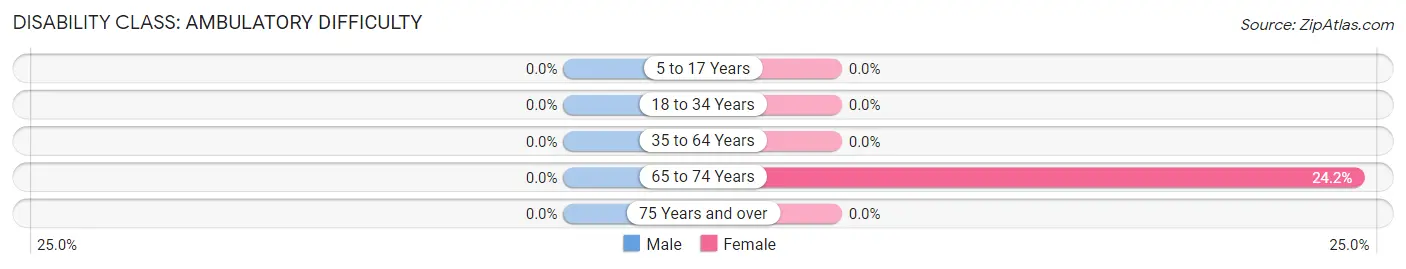
| Age Bracket | Male | Female |
| 5 to 17 Years | 0 (0.0%) | 0 (0.0%) |
| 18 to 34 Years | 0 (0.0%) | 0 (0.0%) |
| 35 to 64 Years | 0 (0.0%) | 0 (0.0%) |
| 65 to 74 Years | 0 (0.0%) | 24 (24.2%) |
| 75 Years and over | 0 (0.0%) | 0 (0.0%) |
Disability Class: Self-Care Difficulty
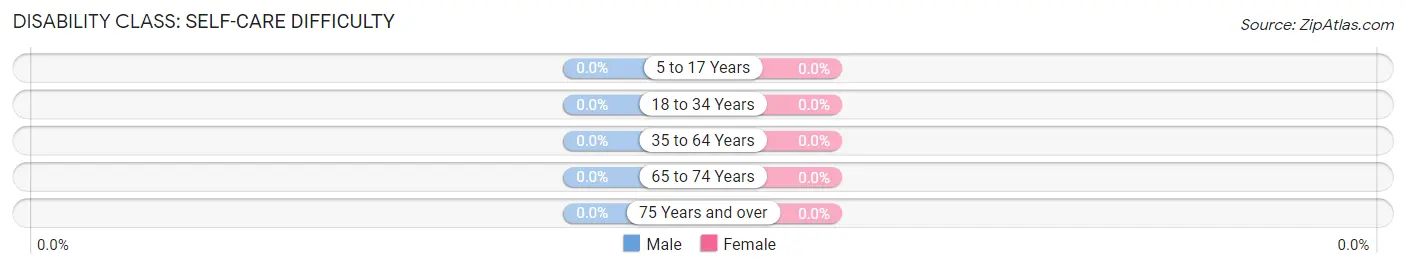
| Age Bracket | Male | Female |
| 5 to 17 Years | 0 (0.0%) | 0 (0.0%) |
| 18 to 34 Years | 0 (0.0%) | 0 (0.0%) |
| 35 to 64 Years | 0 (0.0%) | 0 (0.0%) |
| 65 to 74 Years | 0 (0.0%) | 0 (0.0%) |
| 75 Years and over | 0 (0.0%) | 0 (0.0%) |
Technology Access in Swan Quarter
Computing Device Access in Swan Quarter
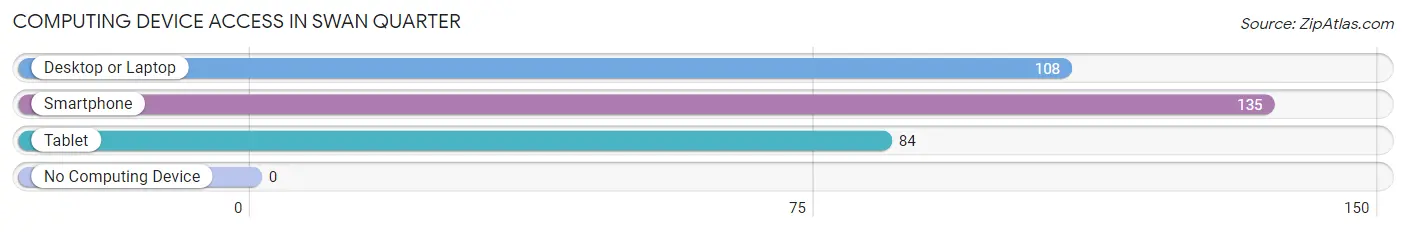
| Device Type | # Households | % Households |
| Desktop or Laptop | 108 | 73.0% |
| Smartphone | 135 | 91.2% |
| Tablet | 84 | 56.8% |
| No Computing Device | 0 | 0.0% |
| Total | 148 | 100.0% |
Internet Access in Swan Quarter
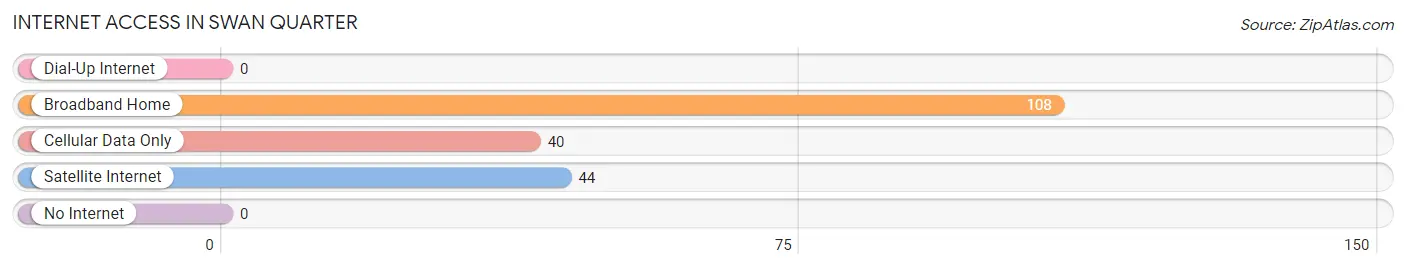
| Internet Type | # Households | % Households |
| Dial-Up Internet | 0 | 0.0% |
| Broadband Home | 108 | 73.0% |
| Cellular Data Only | 40 | 27.0% |
| Satellite Internet | 44 | 29.7% |
| No Internet | 0 | 0.0% |
| Total | 148 | 100.0% |
Swan Quarter Summary
Swan Quarter is a small town located in Hyde County, North Carolina. It is situated on the eastern shore of the Pamlico Sound, and is the county seat of Hyde County. The town has a population of approximately 500 people, and is a popular tourist destination due to its proximity to the Outer Banks and other attractions.
Geography
Swan Quarter is located in the eastern part of Hyde County, North Carolina. It is situated on the eastern shore of the Pamlico Sound, and is the county seat of Hyde County. The town is located at an elevation of 8 feet above sea level. The town is surrounded by the Pamlico Sound to the east, the Alligator River to the west, and the Pungo River to the south. The town is located approximately 50 miles from the Outer Banks, and is accessible by ferry from Ocracoke Island.
Climate
Swan Quarter has a humid subtropical climate, with hot, humid summers and mild winters. The average annual temperature is around 68°F, with an average high of around 86°F in the summer and an average low of around 50°F in the winter. The average annual precipitation is around 50 inches, with most of the precipitation occurring in the summer months.
Demographics
As of the 2010 census, Swan Quarter had a population of 498 people. The racial makeup of the town was 94.4% White, 3.2% African American, 0.2% Native American, 0.2% Asian, 0.2% from other races, and 1.8% from two or more races. Hispanic or Latino of any race were 1.2% of the population.
Economy
Swan Quarter is a small town with a limited economy. The town is primarily supported by tourism, as it is a popular destination for visitors to the Outer Banks. The town also has a few small businesses, including a grocery store, a hardware store, and a few restaurants. The town is also home to a few small fishing charters, which offer visitors the opportunity to go fishing in the Pamlico Sound.
History
Swan Quarter was first settled in the late 1700s by a group of Quakers from Pennsylvania. The town was originally known as “Quaker Quarter”, but was later changed to “Swan Quarter” in honor of the swans that were often seen in the area. The town was officially incorporated in 1887, and has remained a small, rural community ever since. The town was the site of a major battle during the Civil War, and was also the site of a major hurricane in 1933.
Common Questions
What is Per Capita Income in Swan Quarter?
Per Capita income in Swan Quarter is $28,217.
What is the Median Family Income in Swan Quarter?
Median Family Income in Swan Quarter is $55,625.
What is the Median Household income in Swan Quarter?
Median Household Income in Swan Quarter is $65,806.
What is Inequality or Gini Index in Swan Quarter?
Inequality or Gini Index in Swan Quarter is 0.19.
What is the Total Population of Swan Quarter?
Total Population of Swan Quarter is 293.
What is the Total Male Population of Swan Quarter?
Total Male Population of Swan Quarter is 126.
What is the Total Female Population of Swan Quarter?
Total Female Population of Swan Quarter is 167.
What is the Ratio of Males per 100 Females in Swan Quarter?
There are 75.45 Males per 100 Females in Swan Quarter.
What is the Ratio of Females per 100 Males in Swan Quarter?
There are 132.54 Females per 100 Males in Swan Quarter.
What is the Median Population Age in Swan Quarter?
Median Population Age in Swan Quarter is 66.8 Years.
What is the Average Family Size in Swan Quarter
Average Family Size in Swan Quarter is 1.6 People.
What is the Average Household Size in Swan Quarter
Average Household Size in Swan Quarter is 2.0 People.
How Large is the Labor Force in Swan Quarter?
There are 186 People in the Labor Forcein in Swan Quarter.
What is the Percentage of People in the Labor Force in Swan Quarter?
63.5% of People are in the Labor Force in Swan Quarter.