Pleasant Hill, NC Map & Demographics
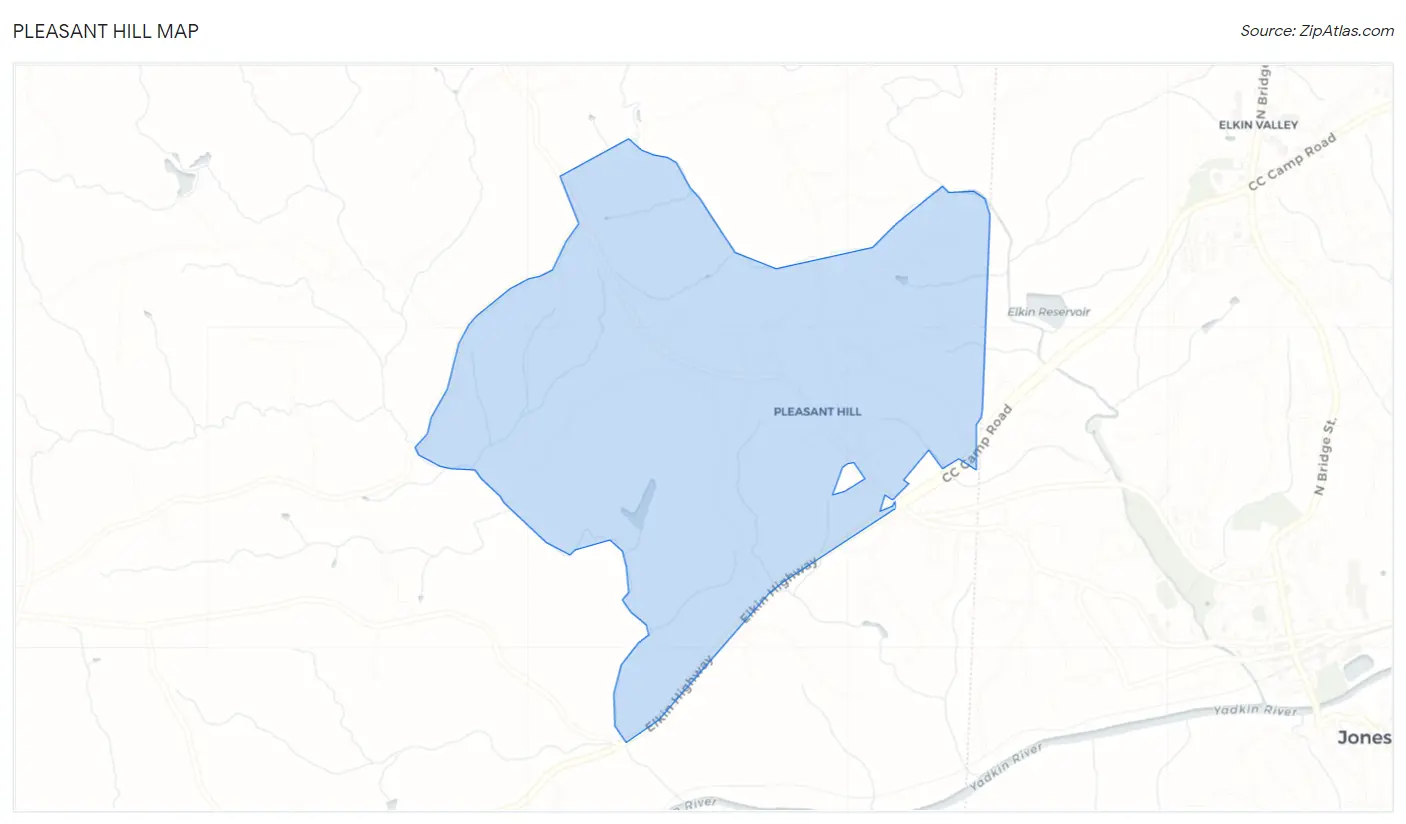
Pleasant Hill Map
Pleasant Hill Overview
$32,226
PER CAPITA INCOME
$83,500
AVG FAMILY INCOME
$80,313
AVG HOUSEHOLD INCOME
4.8%
WAGE / INCOME GAP [ % ]
95.2¢/ $1
WAGE / INCOME GAP [ $ ]
0.26
INEQUALITY / GINI INDEX
867
TOTAL POPULATION
422
MALE POPULATION
445
FEMALE POPULATION
94.83
MALES / 100 FEMALES
105.45
FEMALES / 100 MALES
51.8
MEDIAN AGE
2.5
AVG FAMILY SIZE
2.1
AVG HOUSEHOLD SIZE
605
LABOR FORCE [ PEOPLE ]
74.5%
PERCENT IN LABOR FORCE
14.0%
UNEMPLOYMENT RATE
Pleasant Hill Zip Codes
Pleasant Hill Area Codes
Income in Pleasant Hill
Income Overview in Pleasant Hill
Per Capita Income in Pleasant Hill is $32,226, while median incomes of families and households are $83,500 and $80,313 respectively.
| Characteristic | Number | Measure |
| Per Capita Income | 867 | $32,226 |
| Median Family Income | 300 | $83,500 |
| Mean Family Income | 300 | $78,626 |
| Median Household Income | 414 | $80,313 |
| Mean Household Income | 414 | $64,611 |
| Income Deficit | 300 | $0 |
| Wage / Income Gap (%) | 867 | 4.83% |
| Wage / Income Gap ($) | 867 | 95.17¢ per $1 |
| Gini / Inequality Index | 867 | 0.26 |
Earnings by Sex in Pleasant Hill
Average Earnings in Pleasant Hill are $42,837, $43,800 for men and $41,683 for women, a difference of 4.8%.
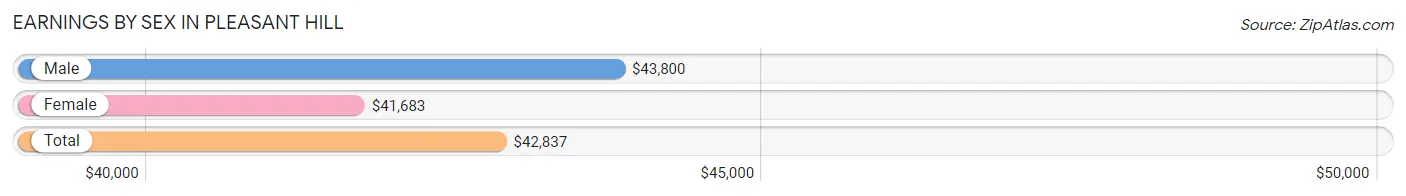
| Sex | Number | Average Earnings |
| Male | 340 (55.5%) | $43,800 |
| Female | 273 (44.5%) | $41,683 |
| Total | 613 (100.0%) | $42,837 |
Earnings by Sex by Income Bracket in Pleasant Hill
The most common earnings brackets in Pleasant Hill are $40,000 to $44,999 for men (125 | 36.8%) and $40,000 to $44,999 for women (181 | 66.3%).
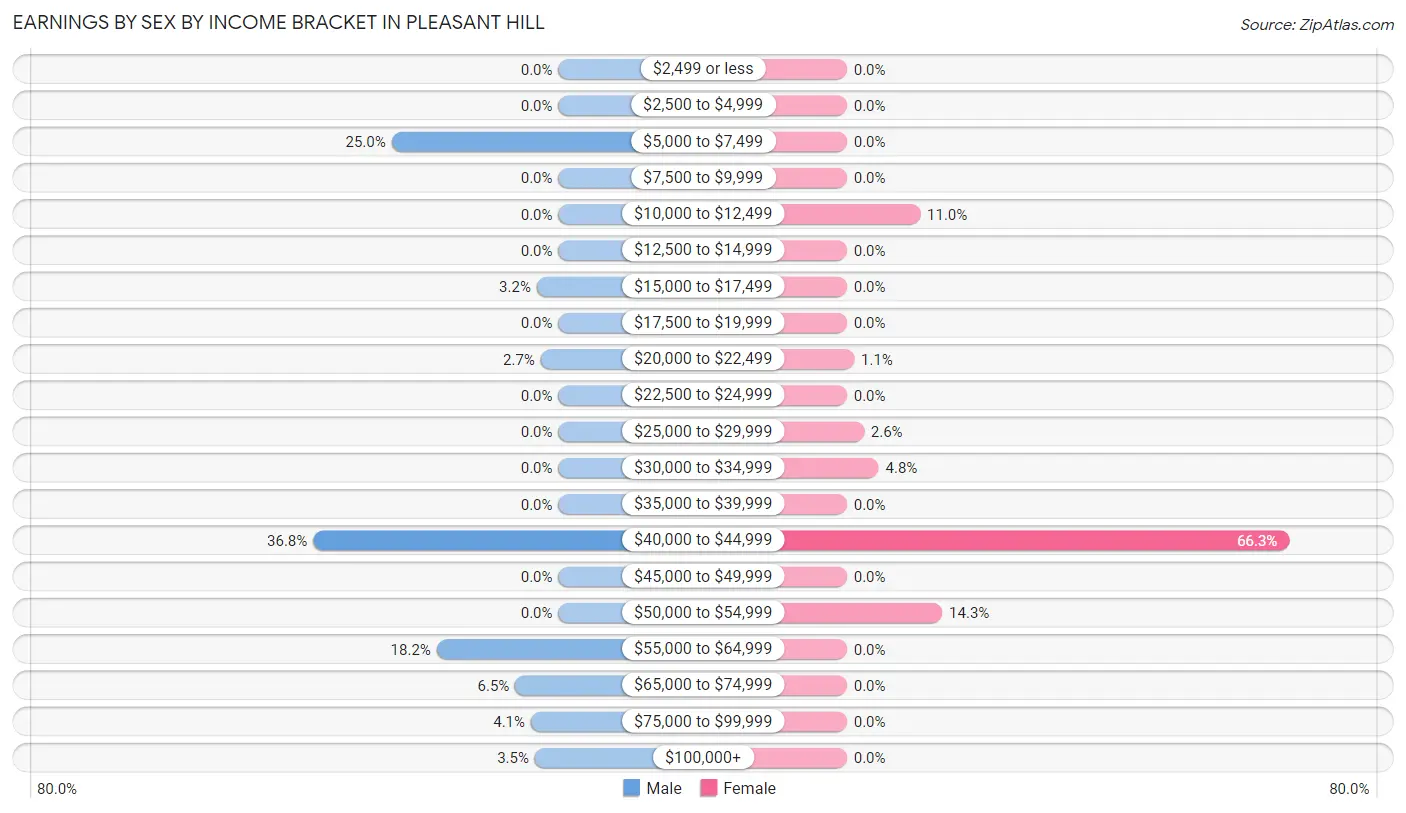
| Income | Male | Female |
| $2,499 or less | 0 (0.0%) | 0 (0.0%) |
| $2,500 to $4,999 | 0 (0.0%) | 0 (0.0%) |
| $5,000 to $7,499 | 85 (25.0%) | 0 (0.0%) |
| $7,500 to $9,999 | 0 (0.0%) | 0 (0.0%) |
| $10,000 to $12,499 | 0 (0.0%) | 30 (11.0%) |
| $12,500 to $14,999 | 0 (0.0%) | 0 (0.0%) |
| $15,000 to $17,499 | 11 (3.2%) | 0 (0.0%) |
| $17,500 to $19,999 | 0 (0.0%) | 0 (0.0%) |
| $20,000 to $22,499 | 9 (2.6%) | 3 (1.1%) |
| $22,500 to $24,999 | 0 (0.0%) | 0 (0.0%) |
| $25,000 to $29,999 | 0 (0.0%) | 7 (2.6%) |
| $30,000 to $34,999 | 0 (0.0%) | 13 (4.8%) |
| $35,000 to $39,999 | 0 (0.0%) | 0 (0.0%) |
| $40,000 to $44,999 | 125 (36.8%) | 181 (66.3%) |
| $45,000 to $49,999 | 0 (0.0%) | 0 (0.0%) |
| $50,000 to $54,999 | 0 (0.0%) | 39 (14.3%) |
| $55,000 to $64,999 | 62 (18.2%) | 0 (0.0%) |
| $65,000 to $74,999 | 22 (6.5%) | 0 (0.0%) |
| $75,000 to $99,999 | 14 (4.1%) | 0 (0.0%) |
| $100,000+ | 12 (3.5%) | 0 (0.0%) |
| Total | 340 (100.0%) | 273 (100.0%) |
Earnings by Sex by Educational Attainment in Pleasant Hill
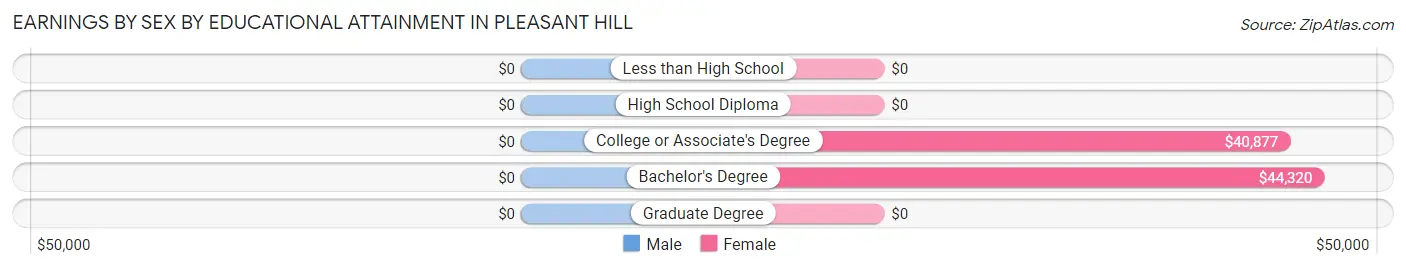
| Educational Attainment | Male Income | Female Income |
| Less than High School | - | - |
| High School Diploma | - | - |
| College or Associate's Degree | - | - |
| Bachelor's Degree | - | - |
| Graduate Degree | - | - |
| Total | $43,850 | $41,683 |
Family Income in Pleasant Hill
Family Income Brackets in Pleasant Hill
According to the Pleasant Hill family income data, there are 147 families falling into the $75,000 to $99,999 income range, which is the most common income bracket and makes up 49.0% of all families.
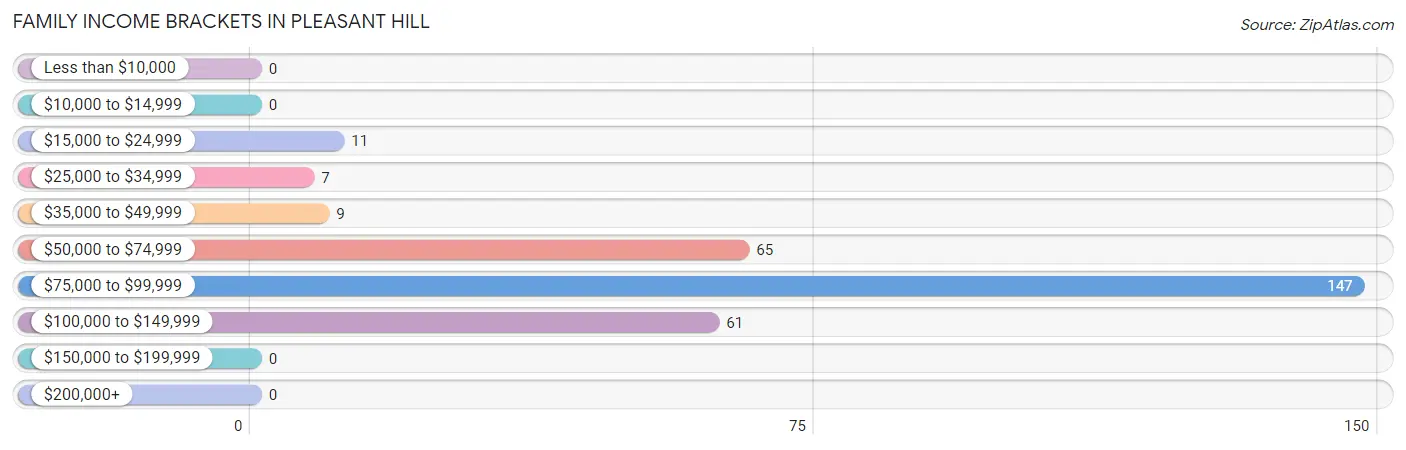
| Income Bracket | # Families | % Families |
| Less than $10,000 | 0 | 0.0% |
| $10,000 to $14,999 | 0 | 0.0% |
| $15,000 to $24,999 | 11 | 3.7% |
| $25,000 to $34,999 | 7 | 2.3% |
| $35,000 to $49,999 | 9 | 3.0% |
| $50,000 to $74,999 | 65 | 21.7% |
| $75,000 to $99,999 | 147 | 49.0% |
| $100,000 to $149,999 | 61 | 20.3% |
| $150,000 to $199,999 | 0 | 0.0% |
| $200,000+ | 0 | 0.0% |
Family Income by Famaliy Size in Pleasant Hill
2-person families (257 | 85.7%) account for the highest median family income in Pleasant Hill with $83,510 per family, while 2-person families (257 | 85.7%) have the highest median income of $41,755 per family member.
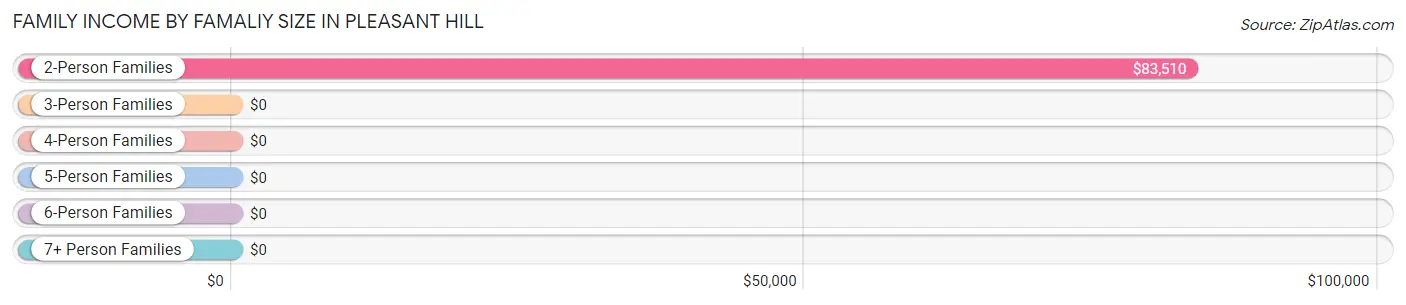
| Income Bracket | # Families | Median Income |
| 2-Person Families | 257 (85.7%) | $83,510 |
| 3-Person Families | 29 (9.7%) | $0 |
| 4-Person Families | 14 (4.7%) | $0 |
| 5-Person Families | 0 (0.0%) | $0 |
| 6-Person Families | 0 (0.0%) | $0 |
| 7+ Person Families | 0 (0.0%) | $0 |
| Total | 300 (100.0%) | $83,500 |
Family Income by Number of Earners in Pleasant Hill
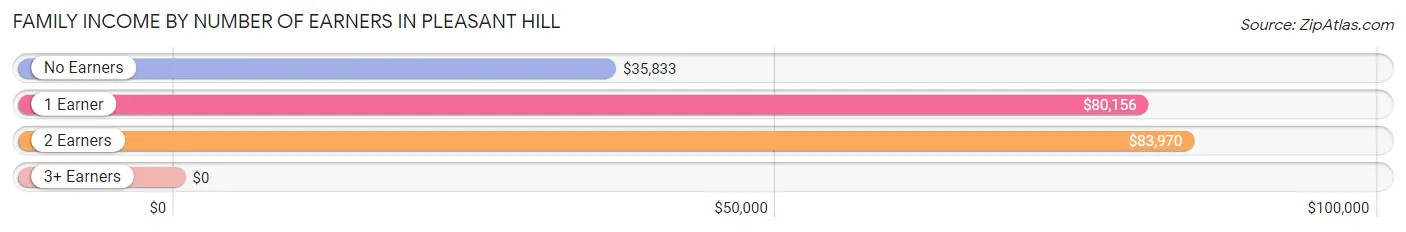
| Number of Earners | # Families | Median Income |
| No Earners | 28 (9.3%) | $35,833 |
| 1 Earner | 43 (14.3%) | $80,156 |
| 2 Earners | 225 (75.0%) | $83,970 |
| 3+ Earners | 4 (1.3%) | $0 |
| Total | 300 (100.0%) | $83,500 |
Household Income in Pleasant Hill
Household Income Brackets in Pleasant Hill
With 147 households falling in the category, the $75,000 to $99,999 income range is the most frequent in Pleasant Hill, accounting for 35.5% of all households.
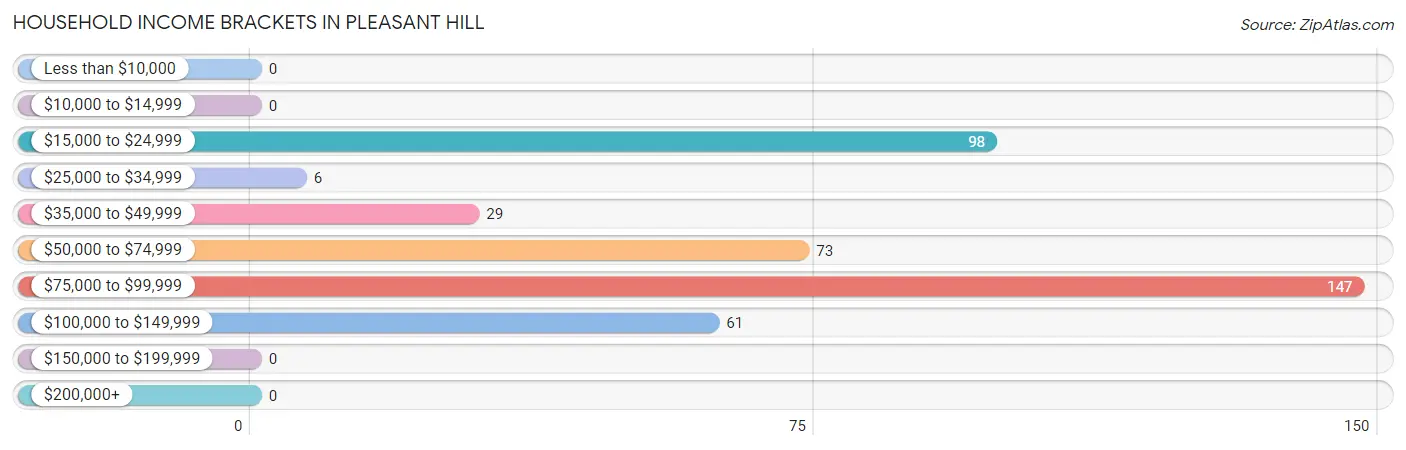
| Income Bracket | # Households | % Households |
| Less than $10,000 | 0 | 0.0% |
| $10,000 to $14,999 | 0 | 0.0% |
| $15,000 to $24,999 | 98 | 23.7% |
| $25,000 to $34,999 | 6 | 1.4% |
| $35,000 to $49,999 | 29 | 7.0% |
| $50,000 to $74,999 | 73 | 17.6% |
| $75,000 to $99,999 | 147 | 35.5% |
| $100,000 to $149,999 | 61 | 14.7% |
| $150,000 to $199,999 | 0 | 0.0% |
| $200,000+ | 0 | 0.0% |
Household Income by Householder Age in Pleasant Hill
The median household income in Pleasant Hill is $80,313, with the highest median household income of $83,390 found in the 45 to 64 years age bracket for the primary householder. A total of 189 households (45.7%) fall into this category.
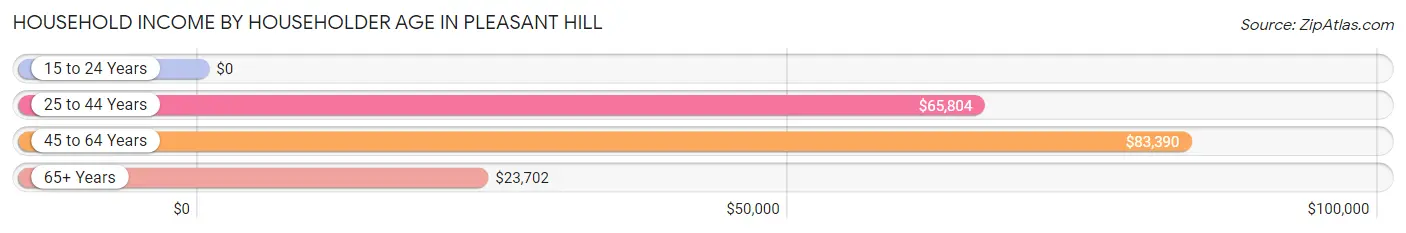
| Income Bracket | # Households | Median Income |
| 15 to 24 Years | 0 (0.0%) | $0 |
| 25 to 44 Years | 127 (30.7%) | $65,804 |
| 45 to 64 Years | 189 (45.7%) | $83,390 |
| 65+ Years | 98 (23.7%) | $23,702 |
| Total | 414 (100.0%) | $80,313 |
Poverty in Pleasant Hill
Income Below Poverty by Sex and Age in Pleasant Hill
With 4.7% poverty level for males and 2.2% for females among the residents of Pleasant Hill, 12 to 14 year old males and 45 to 54 year old females are the most vulnerable to poverty, with 9 males (100.0%) and 10 females (37.0%) in their respective age groups living below the poverty level.
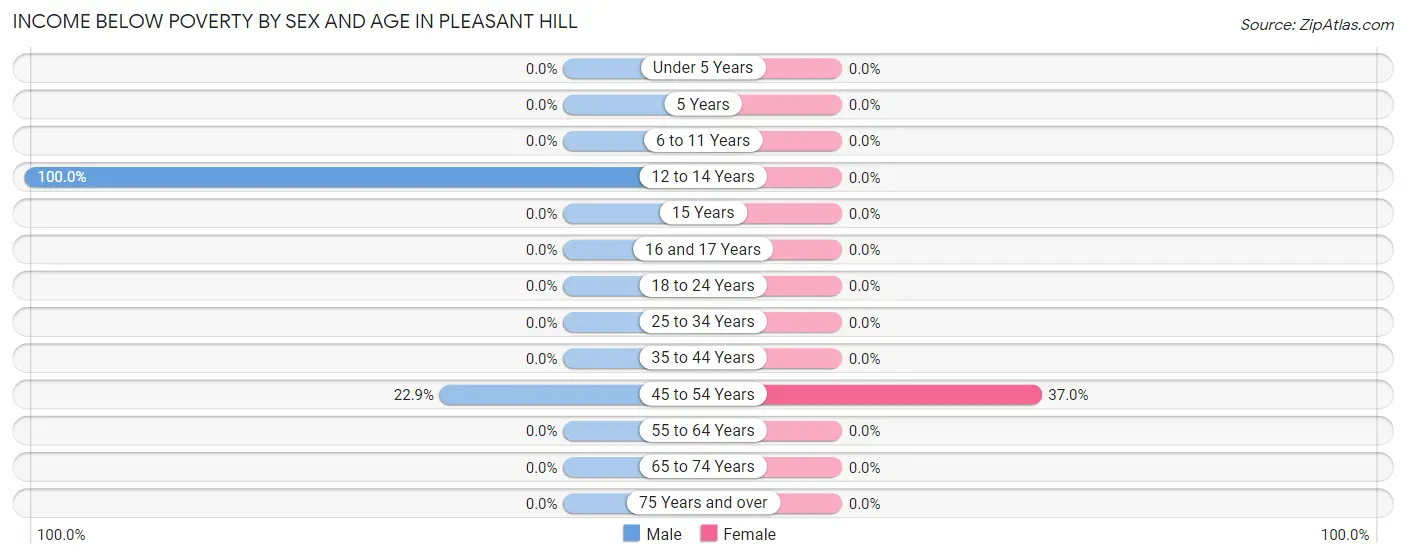
| Age Bracket | Male | Female |
| Under 5 Years | 0 (0.0%) | 0 (0.0%) |
| 5 Years | 0 (0.0%) | 0 (0.0%) |
| 6 to 11 Years | 0 (0.0%) | 0 (0.0%) |
| 12 to 14 Years | 9 (100.0%) | 0 (0.0%) |
| 15 Years | 0 (0.0%) | 0 (0.0%) |
| 16 and 17 Years | 0 (0.0%) | 0 (0.0%) |
| 18 to 24 Years | 0 (0.0%) | 0 (0.0%) |
| 25 to 34 Years | 0 (0.0%) | 0 (0.0%) |
| 35 to 44 Years | 0 (0.0%) | 0 (0.0%) |
| 45 to 54 Years | 11 (22.9%) | 10 (37.0%) |
| 55 to 64 Years | 0 (0.0%) | 0 (0.0%) |
| 65 to 74 Years | 0 (0.0%) | 0 (0.0%) |
| 75 Years and over | 0 (0.0%) | 0 (0.0%) |
| Total | 20 (4.7%) | 10 (2.2%) |
Income Above Poverty by Sex and Age in Pleasant Hill
According to the poverty statistics in Pleasant Hill, males aged under 5 years and females aged under 5 years are the age groups that are most secure financially, with 100.0% of males and 100.0% of females in these age groups living above the poverty line.
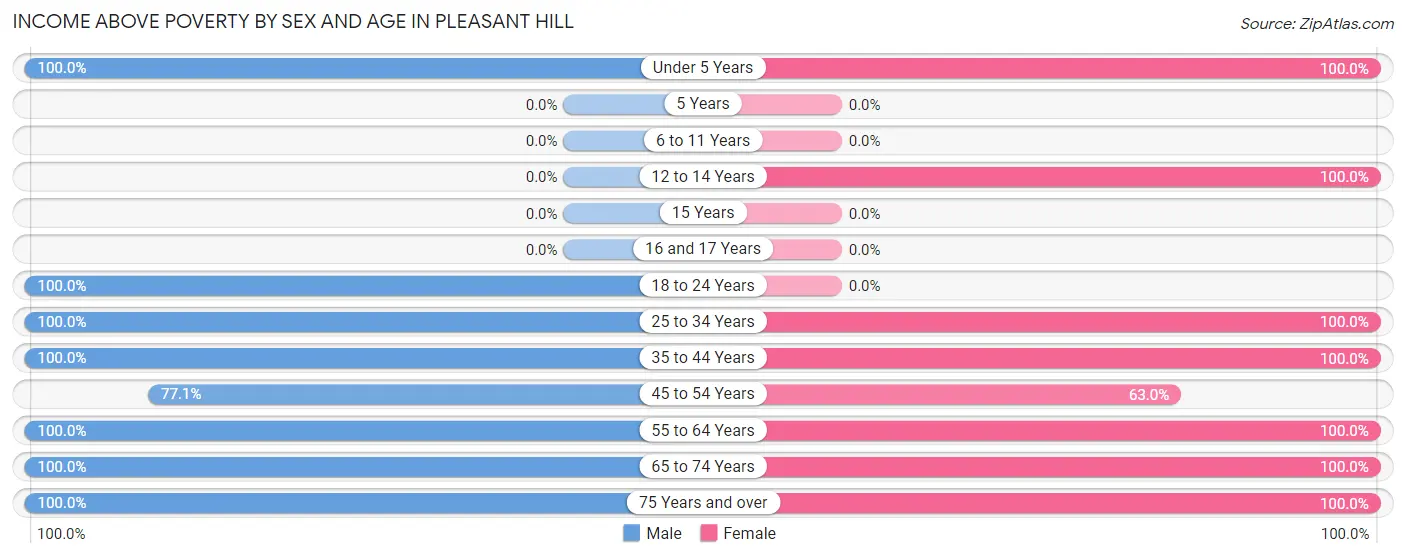
| Age Bracket | Male | Female |
| Under 5 Years | 19 (100.0%) | 12 (100.0%) |
| 5 Years | 0 (0.0%) | 0 (0.0%) |
| 6 to 11 Years | 0 (0.0%) | 0 (0.0%) |
| 12 to 14 Years | 0 (0.0%) | 15 (100.0%) |
| 15 Years | 0 (0.0%) | 0 (0.0%) |
| 16 and 17 Years | 0 (0.0%) | 0 (0.0%) |
| 18 to 24 Years | 25 (100.0%) | 0 (0.0%) |
| 25 to 34 Years | 139 (100.0%) | 109 (100.0%) |
| 35 to 44 Years | 14 (100.0%) | 40 (100.0%) |
| 45 to 54 Years | 37 (77.1%) | 17 (63.0%) |
| 55 to 64 Years | 141 (100.0%) | 159 (100.0%) |
| 65 to 74 Years | 21 (100.0%) | 31 (100.0%) |
| 75 Years and over | 6 (100.0%) | 52 (100.0%) |
| Total | 402 (95.3%) | 435 (97.8%) |
Income Below Poverty Among Married-Couple Families in Pleasant Hill
The poverty statistics for married-couple families in Pleasant Hill show that 4.6% or 11 of the total 240 families live below the poverty line. Families with 1 or 2 children have the highest poverty rate of 44.0%, comprising of 11 families. On the other hand, families with no children have the lowest poverty rate of 0.0%, which includes 0 families.
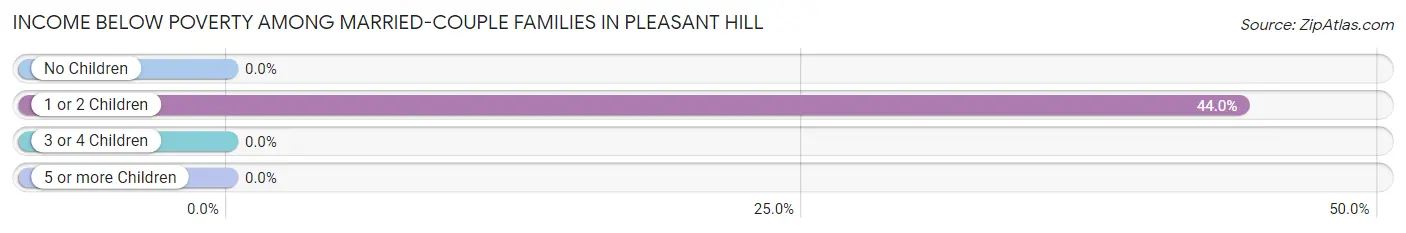
| Children | Above Poverty | Below Poverty |
| No Children | 215 (100.0%) | 0 (0.0%) |
| 1 or 2 Children | 14 (56.0%) | 11 (44.0%) |
| 3 or 4 Children | 0 (0.0%) | 0 (0.0%) |
| 5 or more Children | 0 (0.0%) | 0 (0.0%) |
| Total | 229 (95.4%) | 11 (4.6%) |
Income Below Poverty Among Single-Parent Households in Pleasant Hill
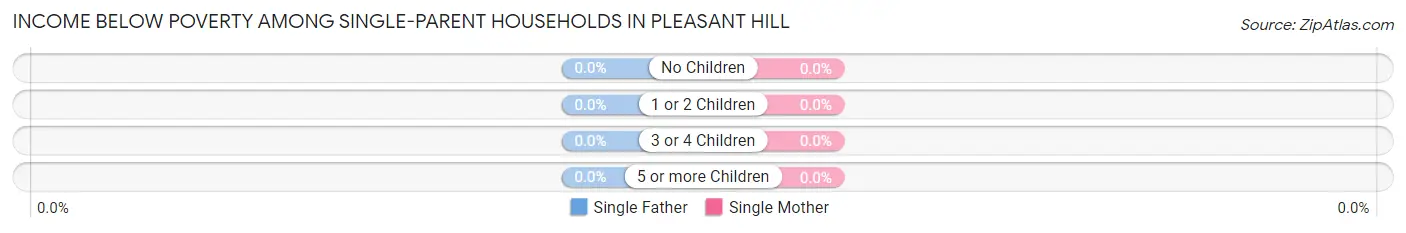
| Children | Single Father | Single Mother |
| No Children | 0 (0.0%) | 0 (0.0%) |
| 1 or 2 Children | 0 (0.0%) | 0 (0.0%) |
| 3 or 4 Children | 0 (0.0%) | 0 (0.0%) |
| 5 or more Children | 0 (0.0%) | 0 (0.0%) |
| Total | 0 (0.0%) | 0 (0.0%) |
Income Below Poverty Among Married-Couple vs Single-Parent Households in Pleasant Hill
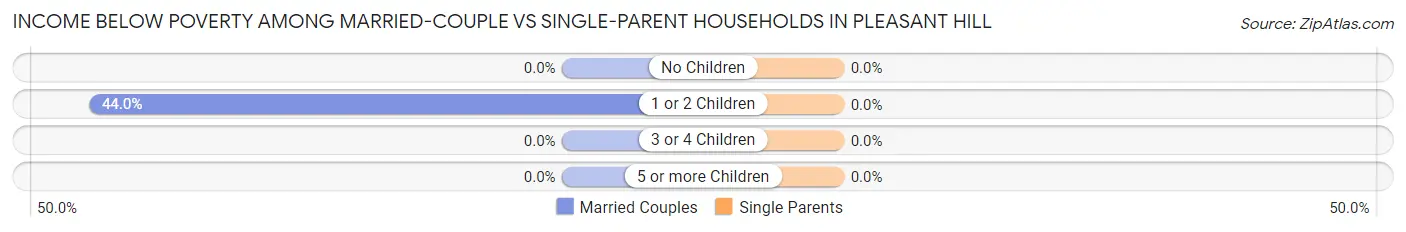
| Children | Married-Couple Families | Single-Parent Households |
| No Children | 0 (0.0%) | 0 (0.0%) |
| 1 or 2 Children | 11 (44.0%) | 0 (0.0%) |
| 3 or 4 Children | 0 (0.0%) | 0 (0.0%) |
| 5 or more Children | 0 (0.0%) | 0 (0.0%) |
| Total | 11 (4.6%) | 0 (0.0%) |
Race in Pleasant Hill
The most populous races in Pleasant Hill are White / Caucasian (743 | 85.7%), and Black / African American (124 | 14.3%).
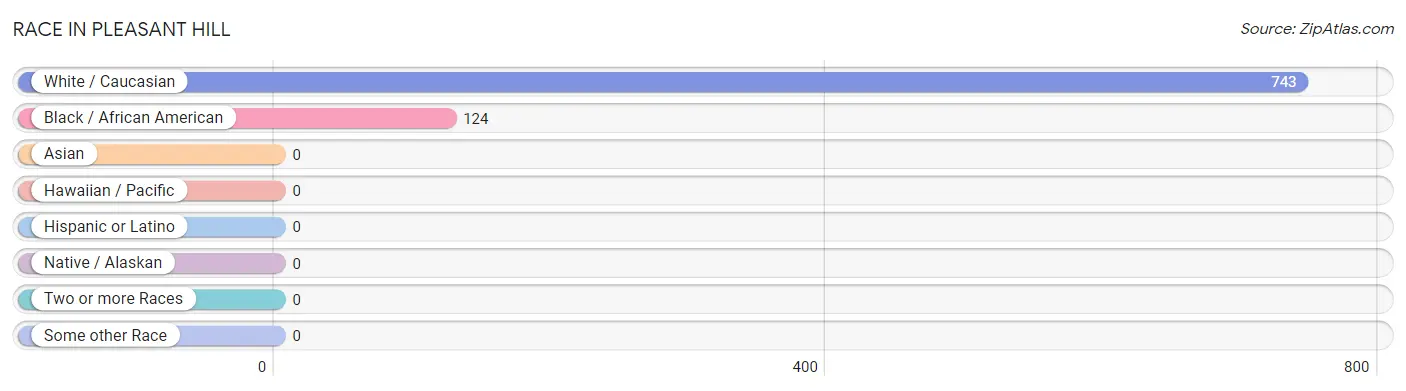
| Race | # Population | % Population |
| Asian | 0 | 0.0% |
| Black / African American | 124 | 14.3% |
| Hawaiian / Pacific | 0 | 0.0% |
| Hispanic or Latino | 0 | 0.0% |
| Native / Alaskan | 0 | 0.0% |
| White / Caucasian | 743 | 85.7% |
| Two or more Races | 0 | 0.0% |
| Some other Race | 0 | 0.0% |
| Total | 867 | 100.0% |
Ancestry in Pleasant Hill
The most populous ancestries reported in Pleasant Hill are American (445 | 51.3%), Irish (117 | 13.5%), Italian (56 | 6.5%), German (45 | 5.2%), and Swedish (24 | 2.8%), together accounting for 79.2% of all Pleasant Hill residents.
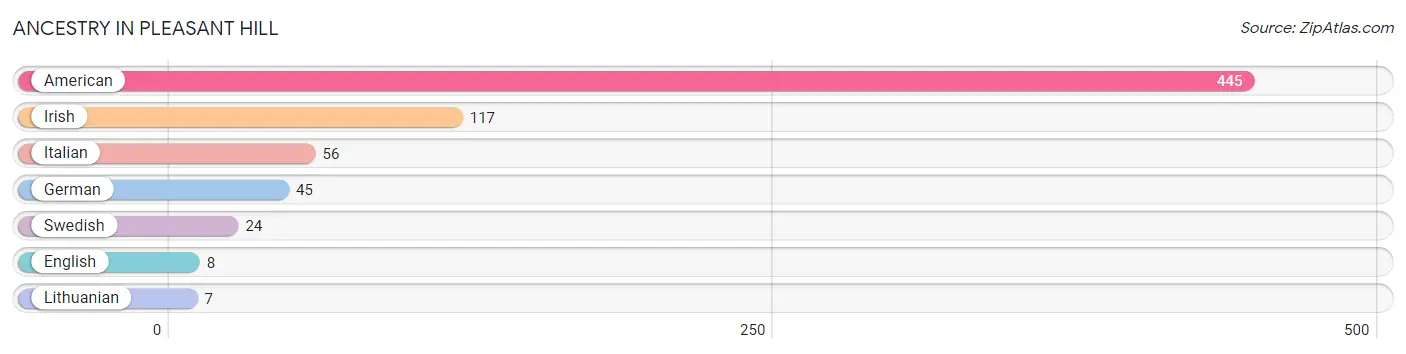
| Ancestry | # Population | % Population |
| American | 445 | 51.3% |
| English | 8 | 0.9% |
| German | 45 | 5.2% |
| Irish | 117 | 13.5% |
| Italian | 56 | 6.5% |
| Lithuanian | 7 | 0.8% |
| Swedish | 24 | 2.8% | View All 7 Rows |
Immigrants in Pleasant Hill

| Immigration Origin | # Population | % Population | View All 0 Rows |
Sex and Age in Pleasant Hill
Sex and Age in Pleasant Hill
The most populous age groups in Pleasant Hill are 55 to 59 Years (133 | 31.5%) for men and 55 to 59 Years (132 | 29.7%) for women.
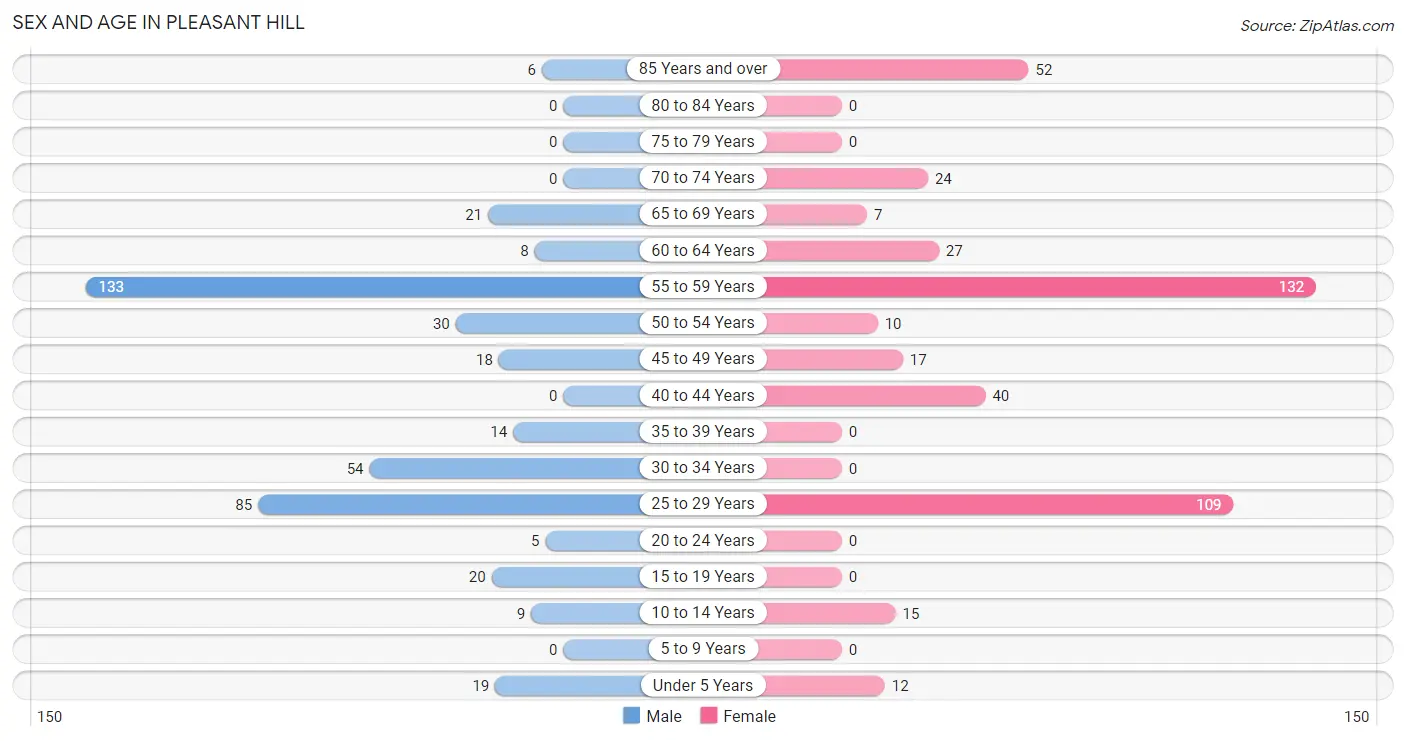
| Age Bracket | Male | Female |
| Under 5 Years | 19 (4.5%) | 12 (2.7%) |
| 5 to 9 Years | 0 (0.0%) | 0 (0.0%) |
| 10 to 14 Years | 9 (2.1%) | 15 (3.4%) |
| 15 to 19 Years | 20 (4.7%) | 0 (0.0%) |
| 20 to 24 Years | 5 (1.2%) | 0 (0.0%) |
| 25 to 29 Years | 85 (20.1%) | 109 (24.5%) |
| 30 to 34 Years | 54 (12.8%) | 0 (0.0%) |
| 35 to 39 Years | 14 (3.3%) | 0 (0.0%) |
| 40 to 44 Years | 0 (0.0%) | 40 (9.0%) |
| 45 to 49 Years | 18 (4.3%) | 17 (3.8%) |
| 50 to 54 Years | 30 (7.1%) | 10 (2.2%) |
| 55 to 59 Years | 133 (31.5%) | 132 (29.7%) |
| 60 to 64 Years | 8 (1.9%) | 27 (6.1%) |
| 65 to 69 Years | 21 (5.0%) | 7 (1.6%) |
| 70 to 74 Years | 0 (0.0%) | 24 (5.4%) |
| 75 to 79 Years | 0 (0.0%) | 0 (0.0%) |
| 80 to 84 Years | 0 (0.0%) | 0 (0.0%) |
| 85 Years and over | 6 (1.4%) | 52 (11.7%) |
| Total | 422 (100.0%) | 445 (100.0%) |
Families and Households in Pleasant Hill
Median Family Size in Pleasant Hill
The median family size in Pleasant Hill is 2.47 persons per family, with single female/mother families (46 | 15.3%) accounting for the largest median family size of 3.3 persons per family. On the other hand, single male/father families (14 | 4.7%) represent the smallest median family size with 1.71 persons per family.
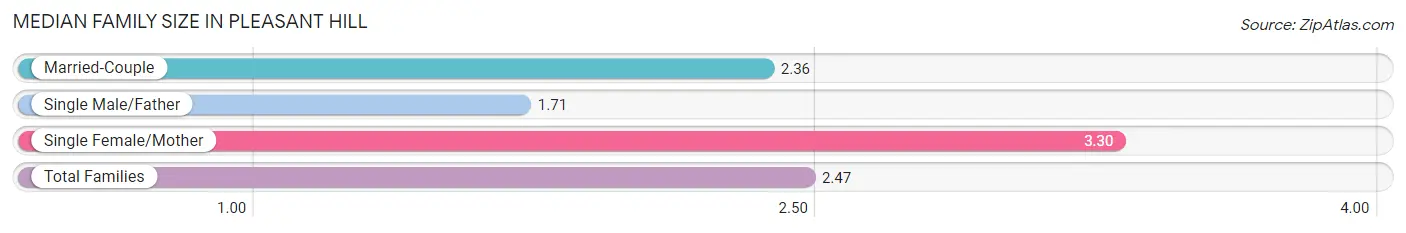
| Family Type | # Families | Family Size |
| Married-Couple | 240 (80.0%) | 2.36 |
| Single Male/Father | 14 (4.7%) | 1.71 |
| Single Female/Mother | 46 (15.3%) | 3.30 |
| Total Families | 300 (100.0%) | 2.47 |
Median Household Size in Pleasant Hill
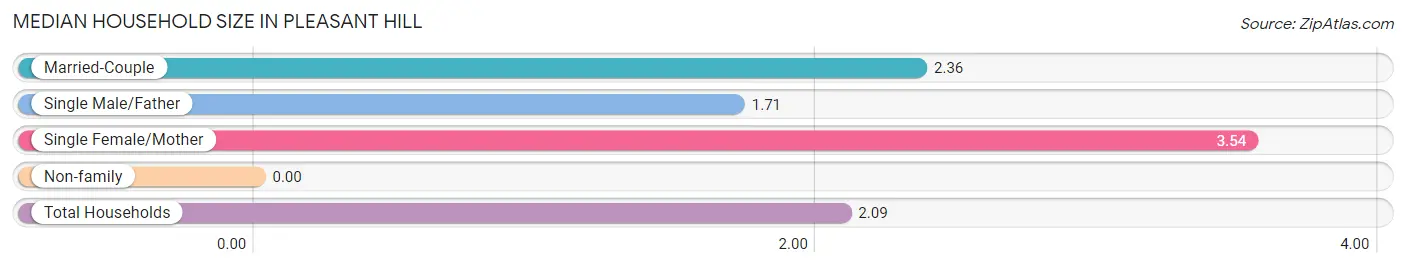
| Household Type | # Households | Household Size |
| Married-Couple | 240 (58.0%) | 2.36 |
| Single Male/Father | 14 (3.4%) | 1.71 |
| Single Female/Mother | 46 (11.1%) | 3.54 |
| Non-family | 114 (27.5%) | - |
| Total Households | 414 (100.0%) | 2.09 |
Household Size by Marriage Status in Pleasant Hill
Out of a total of 414 households in Pleasant Hill, 300 (72.5%) are family households, while 114 (27.5%) are nonfamily households. The most numerous type of family households are 2-person households, comprising 257, and the most common type of nonfamily households are 1-person households, comprising 114.
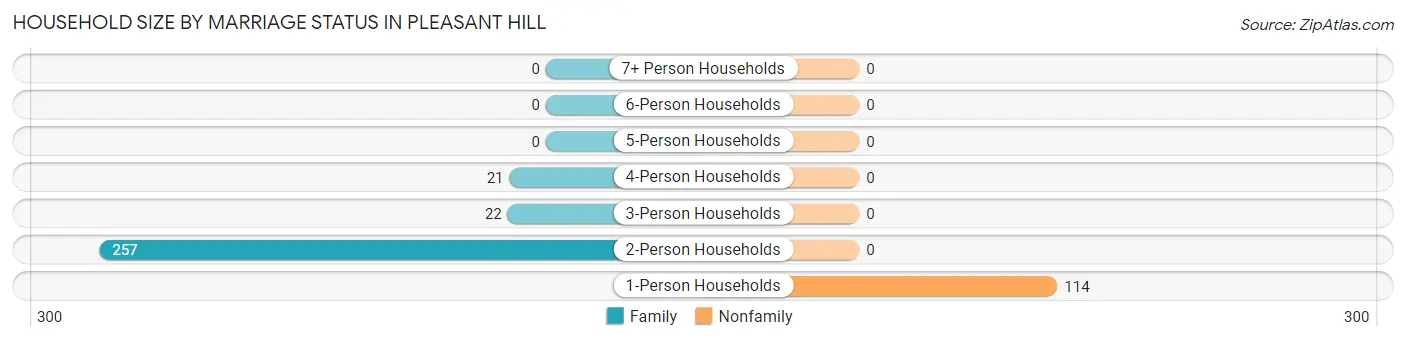
| Household Size | Family Households | Nonfamily Households |
| 1-Person Households | - | 114 (27.5%) |
| 2-Person Households | 257 (62.1%) | 0 (0.0%) |
| 3-Person Households | 22 (5.3%) | 0 (0.0%) |
| 4-Person Households | 21 (5.1%) | 0 (0.0%) |
| 5-Person Households | 0 (0.0%) | 0 (0.0%) |
| 6-Person Households | 0 (0.0%) | 0 (0.0%) |
| 7+ Person Households | 0 (0.0%) | 0 (0.0%) |
| Total | 300 (72.5%) | 114 (27.5%) |
Female Fertility in Pleasant Hill
Fertility by Age in Pleasant Hill
| Age Bracket | Women with Births | Births / 1,000 Women |
| 15 to 19 years | 0 (0.0%) | 0.0 |
| 20 to 34 years | 0 (0.0%) | 0.0 |
| 35 to 50 years | 0 (0.0%) | 0.0 |
| Total | 0 (0.0%) | 0.0 |
Fertility by Age by Marriage Status in Pleasant Hill
| Age Bracket | Married | Unmarried |
| 15 to 19 years | 0 (0.0%) | 0 (0.0%) |
| 20 to 34 years | 0 (0.0%) | 0 (0.0%) |
| 35 to 50 years | 0 (0.0%) | 0 (0.0%) |
| Total | 0 (0.0%) | 0 (0.0%) |
Fertility by Education in Pleasant Hill
| Educational Attainment | Women with Births | Births / 1,000 Women |
| Less than High School | 0 (0.0%) | 0.0 |
| High School Diploma | 0 (0.0%) | 0.0 |
| College or Associate's Degree | 0 (0.0%) | 0.0 |
| Bachelor's Degree | 0 (0.0%) | 0.0 |
| Graduate Degree | 0 (0.0%) | 0.0 |
| Total | 0 (0.0%) | 0.0 |
Fertility by Education by Marriage Status in Pleasant Hill
| Educational Attainment | Married | Unmarried |
| Less than High School | 0 (0.0%) | 0 (0.0%) |
| High School Diploma | 0 (0.0%) | 0 (0.0%) |
| College or Associate's Degree | 0 (0.0%) | 0 (0.0%) |
| Bachelor's Degree | 0 (0.0%) | 0 (0.0%) |
| Graduate Degree | 0 (0.0%) | 0 (0.0%) |
| Total | 0 (0.0%) | 0 (0.0%) |
Employment Characteristics in Pleasant Hill
Employment by Class of Employer in Pleasant Hill
Among the 506 employed individuals in Pleasant Hill, private company employees (426 | 84.2%), local government employees (54 | 10.7%), and state government employees (14 | 2.8%) make up the most common classes of employment.
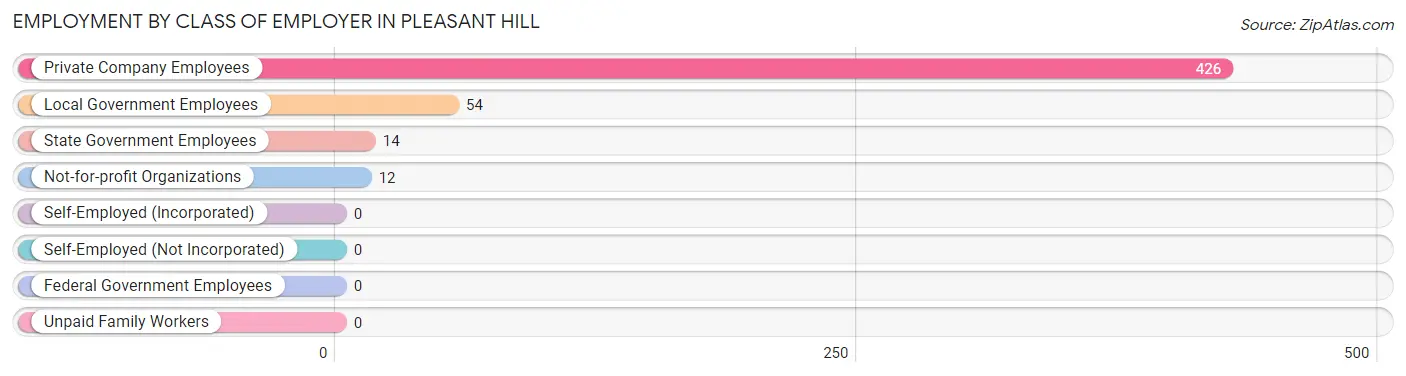
| Employer Class | # Employees | % Employees |
| Private Company Employees | 426 | 84.2% |
| Self-Employed (Incorporated) | 0 | 0.0% |
| Self-Employed (Not Incorporated) | 0 | 0.0% |
| Not-for-profit Organizations | 12 | 2.4% |
| Local Government Employees | 54 | 10.7% |
| State Government Employees | 14 | 2.8% |
| Federal Government Employees | 0 | 0.0% |
| Unpaid Family Workers | 0 | 0.0% |
| Total | 506 | 100.0% |
Employment Status by Age in Pleasant Hill
According to the labor force statistics for Pleasant Hill, out of the total population over 16 years of age (812), 74.5% or 605 individuals are in the labor force, with 14.0% or 85 of them unemployed. The age group with the highest labor force participation rate is 20 to 24 years, with 100.0% or 5 individuals in the labor force. Within the labor force, the 25 to 29 years age range has the highest percentage of unemployed individuals, with 43.8% or 85 of them being unemployed.
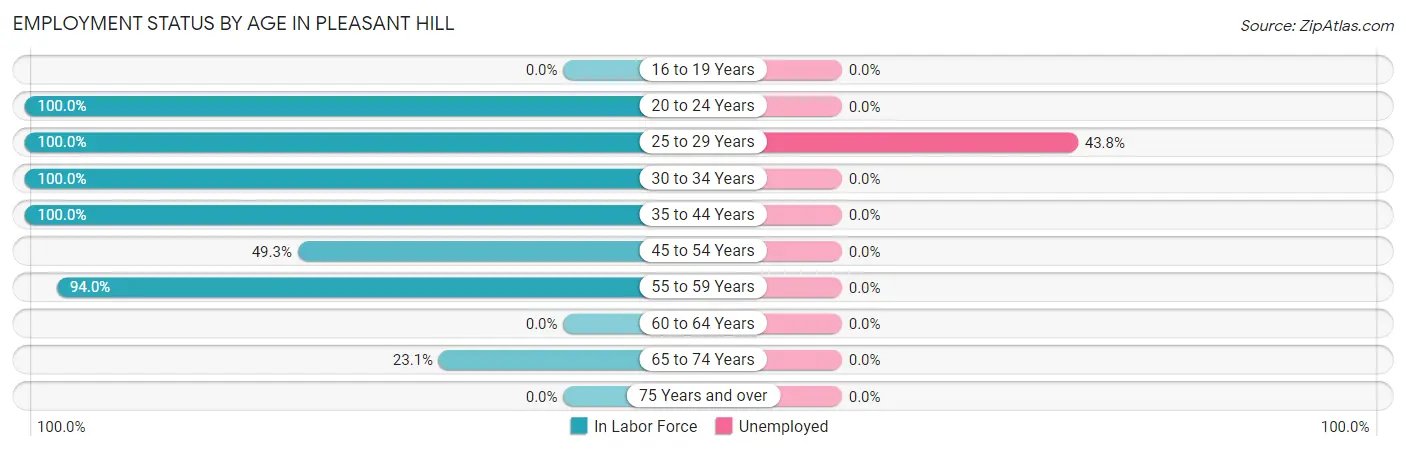
| Age Bracket | In Labor Force | Unemployed |
| 16 to 19 Years | 0 (0.0%) | 0 (0.0%) |
| 20 to 24 Years | 5 (100.0%) | 0 (0.0%) |
| 25 to 29 Years | 194 (100.0%) | 85 (43.8%) |
| 30 to 34 Years | 54 (100.0%) | 0 (0.0%) |
| 35 to 44 Years | 54 (100.0%) | 0 (0.0%) |
| 45 to 54 Years | 37 (49.3%) | 0 (0.0%) |
| 55 to 59 Years | 249 (94.0%) | 0 (0.0%) |
| 60 to 64 Years | 0 (0.0%) | 0 (0.0%) |
| 65 to 74 Years | 12 (23.1%) | 0 (0.0%) |
| 75 Years and over | 0 (0.0%) | 0 (0.0%) |
| Total | 605 (74.5%) | 85 (14.0%) |
Employment Status by Educational Attainment in Pleasant Hill
According to labor force statistics for Pleasant Hill, 86.9% of individuals (588) out of the total population between 25 and 64 years of age (677) are in the labor force, with 14.5% or 85 of them being unemployed. The group with the highest labor force participation rate are those with the educational attainment of bachelor's degree or higher, with 100.0% or 131 individuals in the labor force. Within the labor force, individuals with high school diploma education have the highest percentage of unemployment, with 72.6% or 85 of them being unemployed.
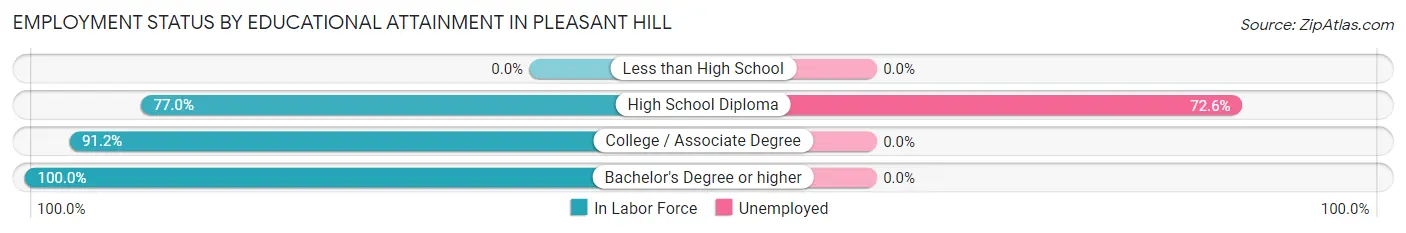
| Educational Attainment | In Labor Force | Unemployed |
| Less than High School | 0 (0.0%) | 0 (0.0%) |
| High School Diploma | 117 (77.0%) | 110 (72.6%) |
| College / Associate Degree | 340 (91.2%) | 0 (0.0%) |
| Bachelor's Degree or higher | 131 (100.0%) | 0 (0.0%) |
| Total | 588 (86.9%) | 98 (14.5%) |
Employment Occupations by Sex in Pleasant Hill
Management, Business, Science and Arts Occupations
The most common Management, Business, Science and Arts occupations in Pleasant Hill are Business & Financial (57 | 11.0%), Community & Social Service (40 | 7.7%), and Education, Arts & Media (40 | 7.7%).
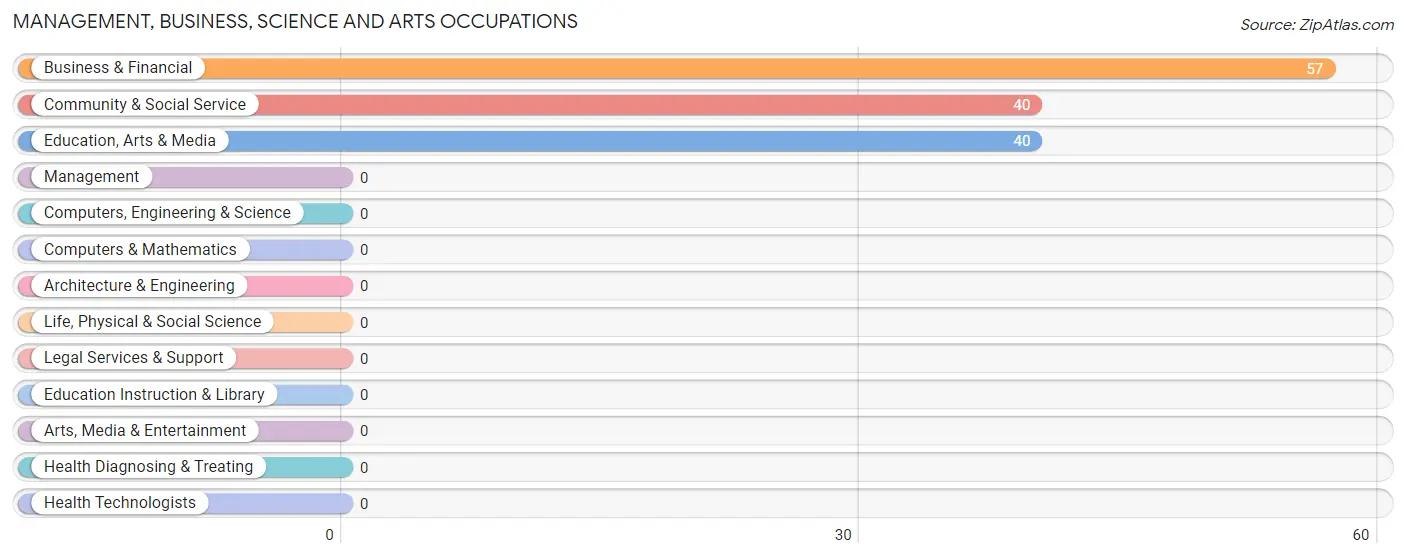
Management, Business, Science and Arts Occupations by Sex
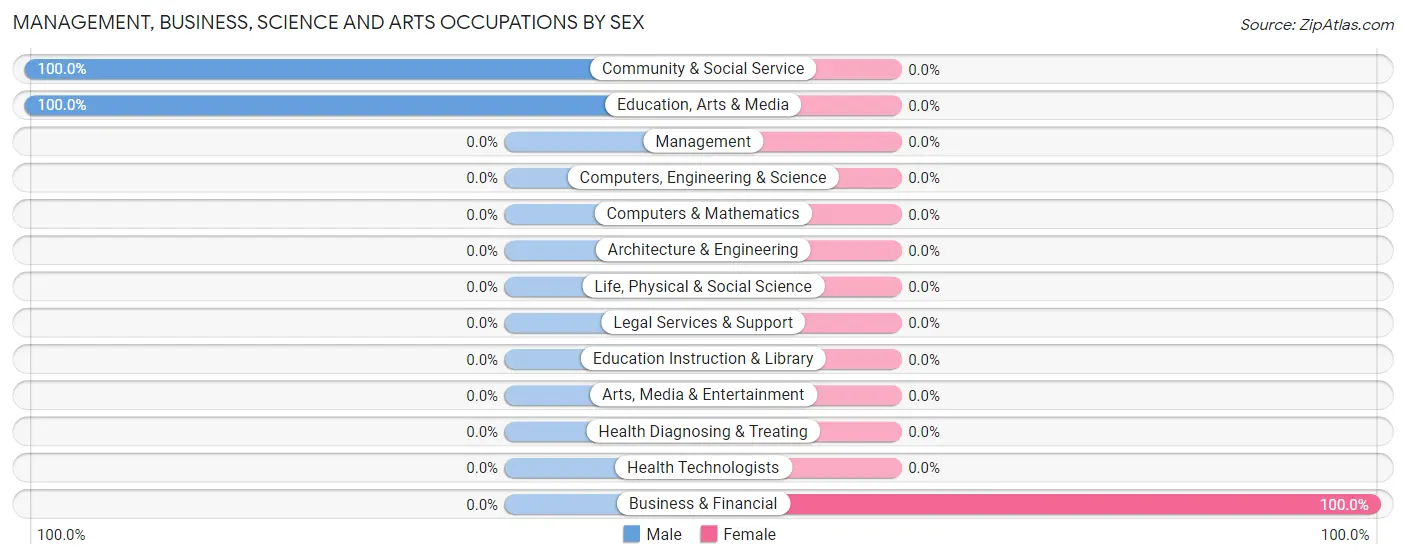
| Occupation | Male | Female |
| Management | 0 (0.0%) | 0 (0.0%) |
| Business & Financial | 0 (0.0%) | 57 (100.0%) |
| Computers, Engineering & Science | 0 (0.0%) | 0 (0.0%) |
| Computers & Mathematics | 0 (0.0%) | 0 (0.0%) |
| Architecture & Engineering | 0 (0.0%) | 0 (0.0%) |
| Life, Physical & Social Science | 0 (0.0%) | 0 (0.0%) |
| Community & Social Service | 40 (100.0%) | 0 (0.0%) |
| Education, Arts & Media | 40 (100.0%) | 0 (0.0%) |
| Legal Services & Support | 0 (0.0%) | 0 (0.0%) |
| Education Instruction & Library | 0 (0.0%) | 0 (0.0%) |
| Arts, Media & Entertainment | 0 (0.0%) | 0 (0.0%) |
| Health Diagnosing & Treating | 0 (0.0%) | 0 (0.0%) |
| Health Technologists | 0 (0.0%) | 0 (0.0%) |
| Total (Category) | 40 (41.2%) | 57 (58.8%) |
| Total (Overall) | 247 (47.5%) | 273 (52.5%) |
Services Occupations
The most common Services occupations in Pleasant Hill are Security & Protection (54 | 10.4%), Law Enforcement (54 | 10.4%), and Personal Care & Service (18 | 3.5%).
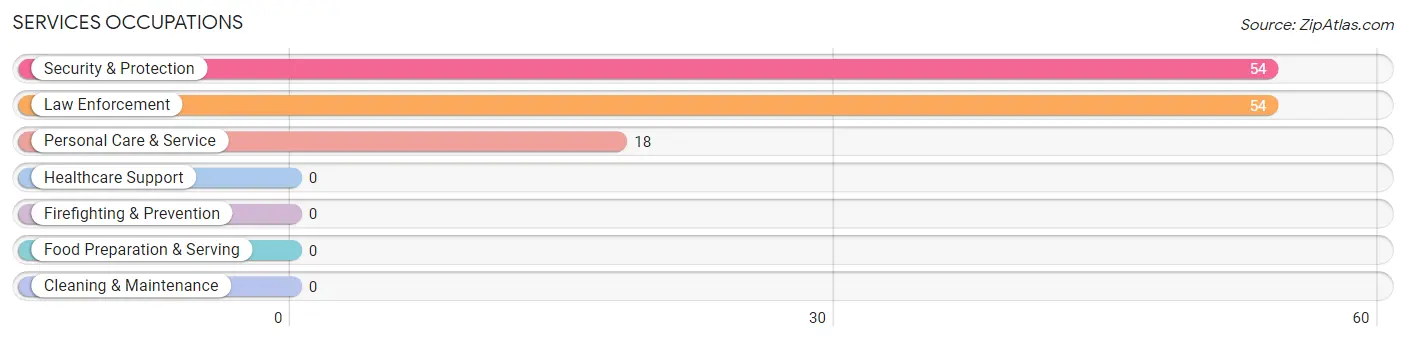
Services Occupations by Sex
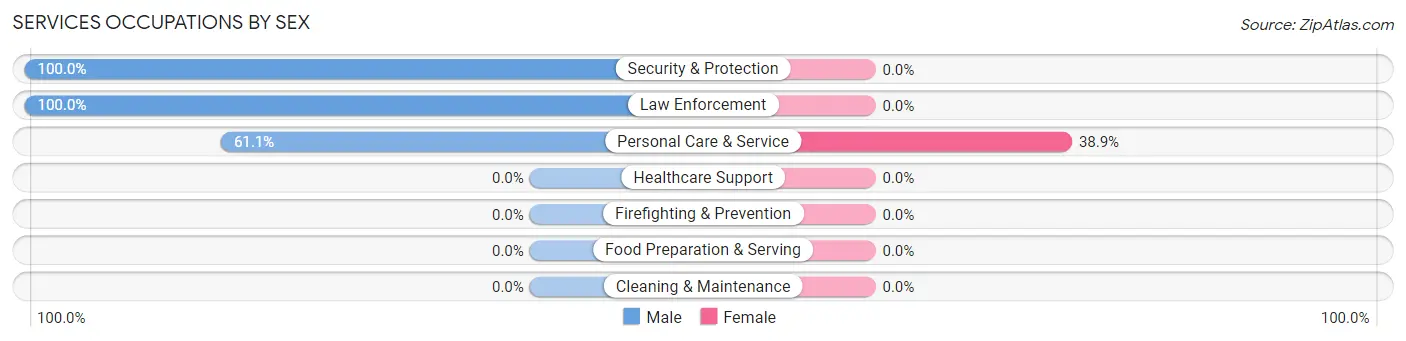
| Occupation | Male | Female |
| Healthcare Support | 0 (0.0%) | 0 (0.0%) |
| Security & Protection | 54 (100.0%) | 0 (0.0%) |
| Firefighting & Prevention | 0 (0.0%) | 0 (0.0%) |
| Law Enforcement | 54 (100.0%) | 0 (0.0%) |
| Food Preparation & Serving | 0 (0.0%) | 0 (0.0%) |
| Cleaning & Maintenance | 0 (0.0%) | 0 (0.0%) |
| Personal Care & Service | 11 (61.1%) | 7 (38.9%) |
| Total (Category) | 65 (90.3%) | 7 (9.7%) |
| Total (Overall) | 247 (47.5%) | 273 (52.5%) |
Sales and Office Occupations
The most common Sales and Office occupations in Pleasant Hill are , and Sales & Related (77 | 14.8%).
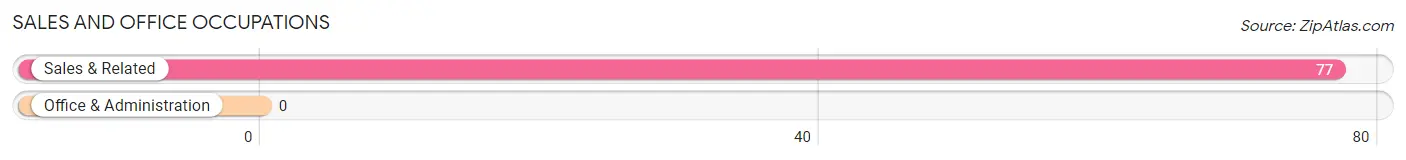
Sales and Office Occupations by Sex
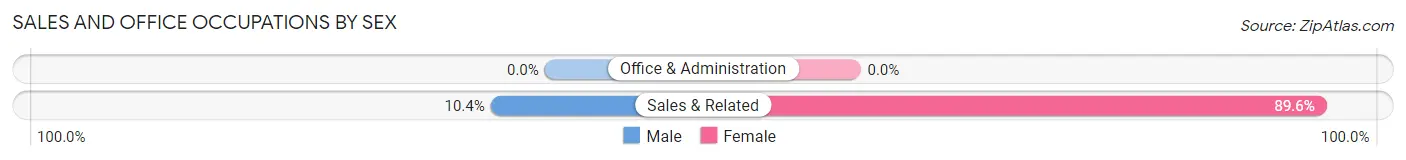
| Occupation | Male | Female |
| Sales & Related | 8 (10.4%) | 69 (89.6%) |
| Office & Administration | 0 (0.0%) | 0 (0.0%) |
| Total (Category) | 8 (10.4%) | 69 (89.6%) |
| Total (Overall) | 247 (47.5%) | 273 (52.5%) |
Natural Resources, Construction and Maintenance Occupations
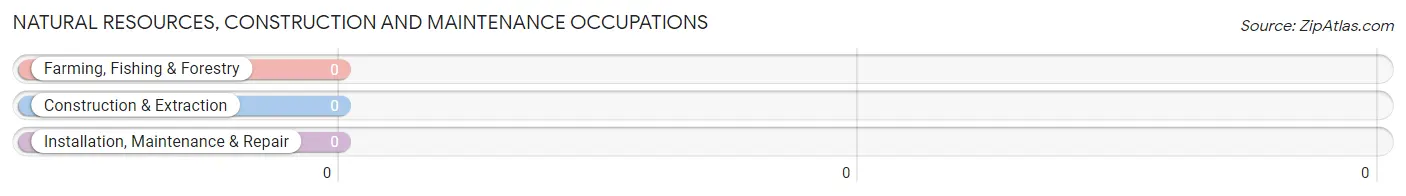
Natural Resources, Construction and Maintenance Occupations by Sex
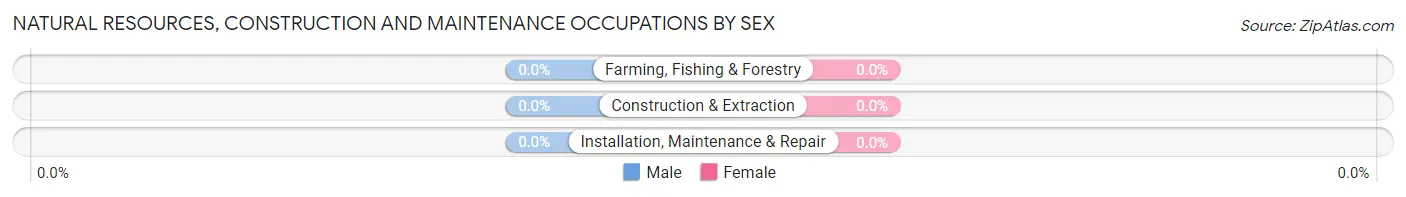
| Occupation | Male | Female |
| Farming, Fishing & Forestry | 0 (0.0%) | 0 (0.0%) |
| Construction & Extraction | 0 (0.0%) | 0 (0.0%) |
| Installation, Maintenance & Repair | 0 (0.0%) | 0 (0.0%) |
| Total (Category) | 0 (0.0%) | 0 (0.0%) |
| Total (Overall) | 247 (47.5%) | 273 (52.5%) |
Production, Transportation and Moving Occupations
The most common Production, Transportation and Moving occupations in Pleasant Hill are Production (134 | 25.8%), Material Moving (127 | 24.4%), and Transportation (13 | 2.5%).
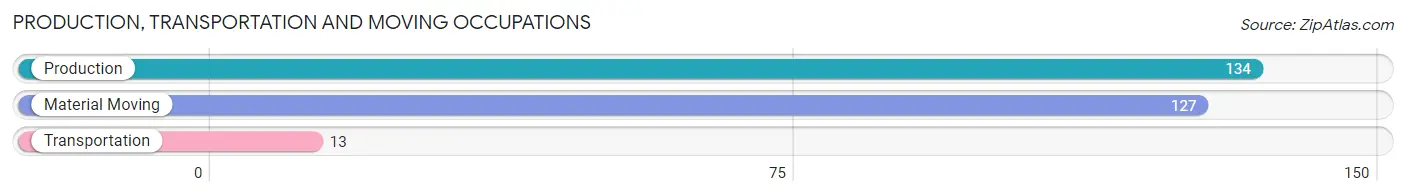
Production, Transportation and Moving Occupations by Sex
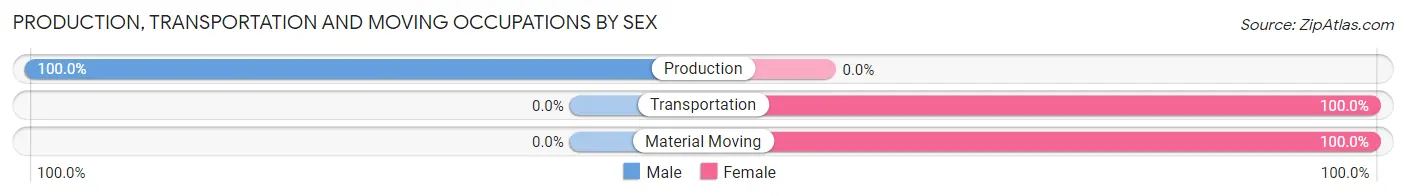
| Occupation | Male | Female |
| Production | 134 (100.0%) | 0 (0.0%) |
| Transportation | 0 (0.0%) | 13 (100.0%) |
| Material Moving | 0 (0.0%) | 127 (100.0%) |
| Total (Category) | 134 (48.9%) | 140 (51.1%) |
| Total (Overall) | 247 (47.5%) | 273 (52.5%) |
Employment Industries by Sex in Pleasant Hill
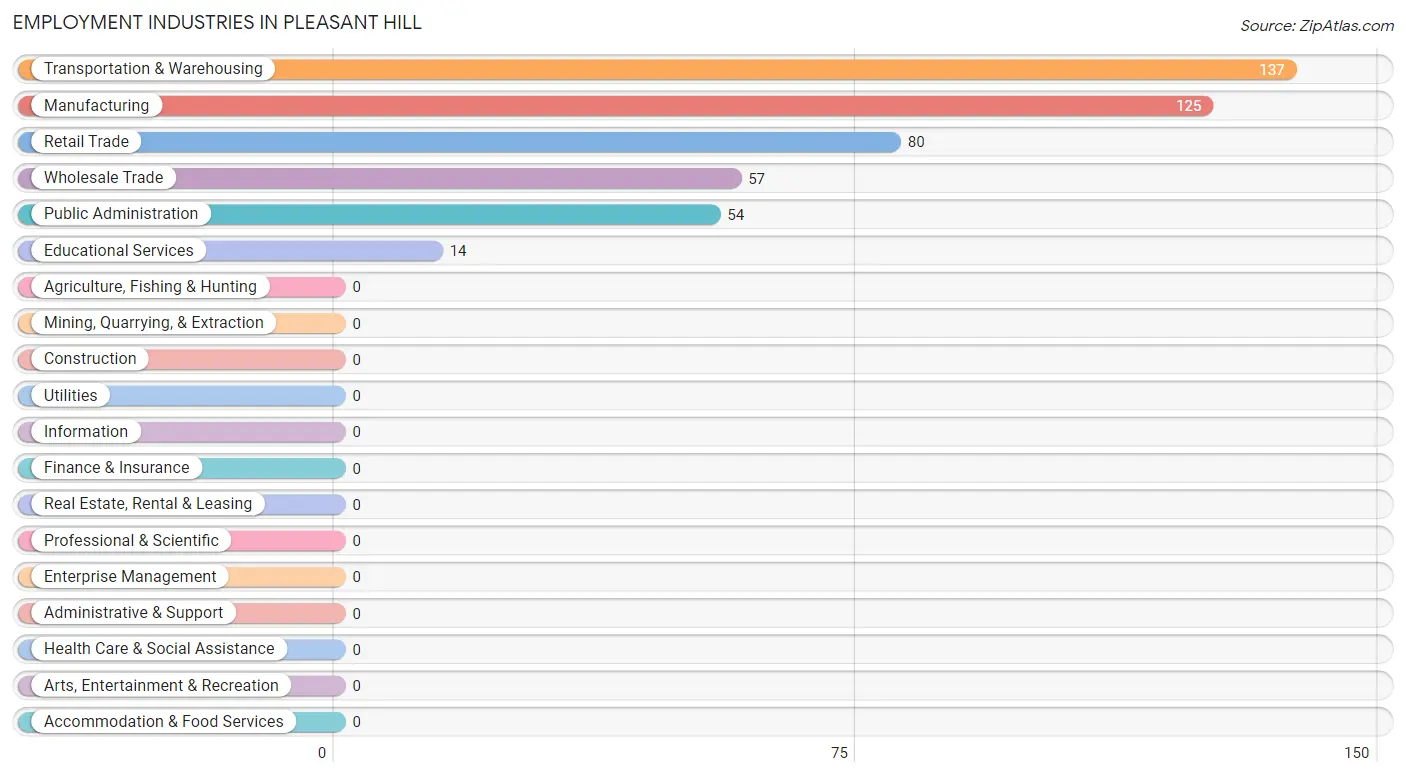
Employment Industries in Pleasant Hill
The major employment industries in Pleasant Hill include Transportation & Warehousing (137 | 26.4%), Manufacturing (125 | 24.0%), Retail Trade (80 | 15.4%), Wholesale Trade (57 | 11.0%), and Public Administration (54 | 10.4%).
Employment Industries by Sex in Pleasant Hill
The Pleasant Hill industries that see more men than women are Manufacturing (100.0%), Educational Services (100.0%), and Public Administration (100.0%), whereas the industries that tend to have a higher number of women are Wholesale Trade (100.0%), Transportation & Warehousing (100.0%), and Retail Trade (90.0%).
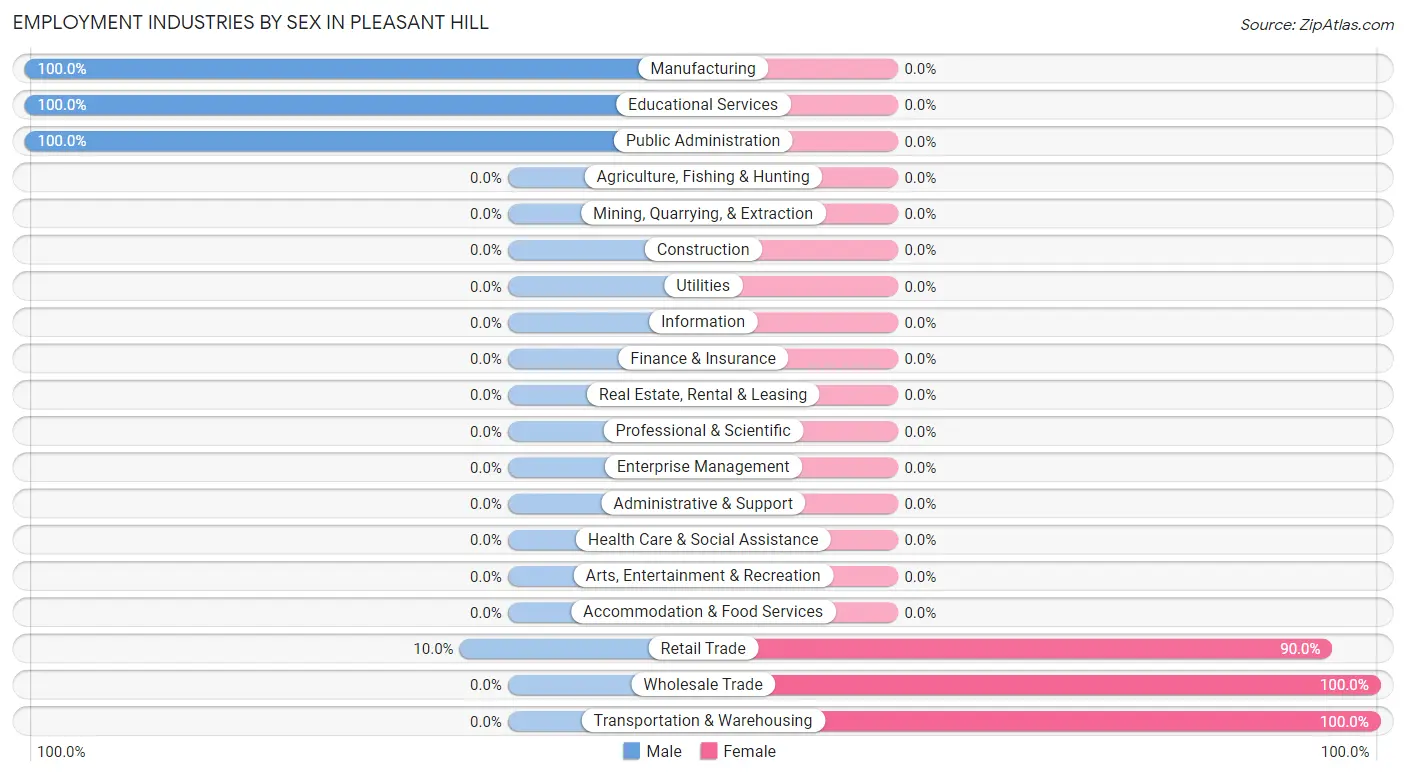
| Industry | Male | Female |
| Agriculture, Fishing & Hunting | 0 (0.0%) | 0 (0.0%) |
| Mining, Quarrying, & Extraction | 0 (0.0%) | 0 (0.0%) |
| Construction | 0 (0.0%) | 0 (0.0%) |
| Manufacturing | 125 (100.0%) | 0 (0.0%) |
| Wholesale Trade | 0 (0.0%) | 57 (100.0%) |
| Retail Trade | 8 (10.0%) | 72 (90.0%) |
| Transportation & Warehousing | 0 (0.0%) | 137 (100.0%) |
| Utilities | 0 (0.0%) | 0 (0.0%) |
| Information | 0 (0.0%) | 0 (0.0%) |
| Finance & Insurance | 0 (0.0%) | 0 (0.0%) |
| Real Estate, Rental & Leasing | 0 (0.0%) | 0 (0.0%) |
| Professional & Scientific | 0 (0.0%) | 0 (0.0%) |
| Enterprise Management | 0 (0.0%) | 0 (0.0%) |
| Administrative & Support | 0 (0.0%) | 0 (0.0%) |
| Educational Services | 14 (100.0%) | 0 (0.0%) |
| Health Care & Social Assistance | 0 (0.0%) | 0 (0.0%) |
| Arts, Entertainment & Recreation | 0 (0.0%) | 0 (0.0%) |
| Accommodation & Food Services | 0 (0.0%) | 0 (0.0%) |
| Public Administration | 54 (100.0%) | 0 (0.0%) |
| Total | 247 (47.5%) | 273 (52.5%) |
Education in Pleasant Hill
School Enrollment in Pleasant Hill
The most common levels of schooling among the 54 students in Pleasant Hill are middle school (24 | 44.4%), college / undergraduate (20 | 37.0%), and nursery / preschool (10 | 18.5%).
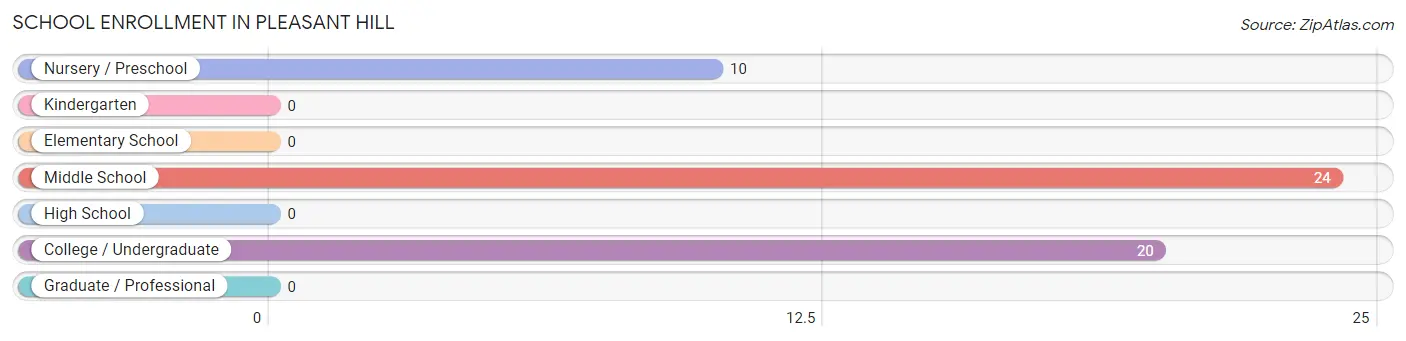
| School Level | # Students | % Students |
| Nursery / Preschool | 10 | 18.5% |
| Kindergarten | 0 | 0.0% |
| Elementary School | 0 | 0.0% |
| Middle School | 24 | 44.4% |
| High School | 0 | 0.0% |
| College / Undergraduate | 20 | 37.0% |
| Graduate / Professional | 0 | 0.0% |
| Total | 54 | 100.0% |
School Enrollment by Age by Funding Source in Pleasant Hill
Out of a total of 54 students who are enrolled in schools in Pleasant Hill, 10 (18.5%) attend a private institution, while the remaining 44 (81.5%) are enrolled in public schools. The age group of 3 to 4 year olds has the highest likelihood of being enrolled in private schools, with 10 (100.0% in the age bracket) enrolled. Conversely, the age group of 10 to 14 year olds has the lowest likelihood of being enrolled in a private school, with 24 (100.0% in the age bracket) attending a public institution.
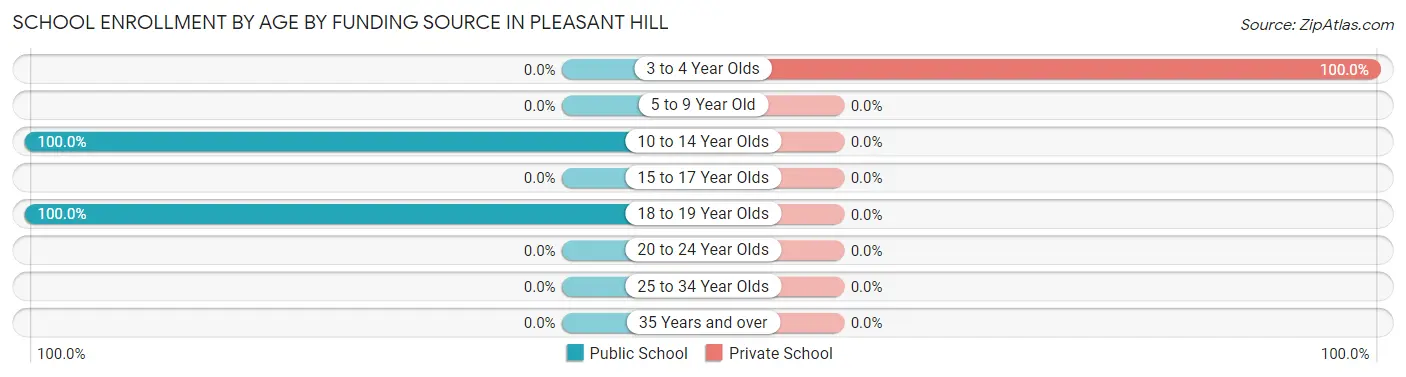
| Age Bracket | Public School | Private School |
| 3 to 4 Year Olds | 0 (0.0%) | 10 (100.0%) |
| 5 to 9 Year Old | 0 (0.0%) | 0 (0.0%) |
| 10 to 14 Year Olds | 24 (100.0%) | 0 (0.0%) |
| 15 to 17 Year Olds | 0 (0.0%) | 0 (0.0%) |
| 18 to 19 Year Olds | 20 (100.0%) | 0 (0.0%) |
| 20 to 24 Year Olds | 0 (0.0%) | 0 (0.0%) |
| 25 to 34 Year Olds | 0 (0.0%) | 0 (0.0%) |
| 35 Years and over | 0 (0.0%) | 0 (0.0%) |
| Total | 44 (81.5%) | 10 (18.5%) |
Educational Attainment by Field of Study in Pleasant Hill
Business (79 | 55.2%), science & technology (52 | 36.4%), and liberal arts & history (12 | 8.4%) are the most common fields of study among 143 individuals in Pleasant Hill who have obtained a bachelor's degree or higher.
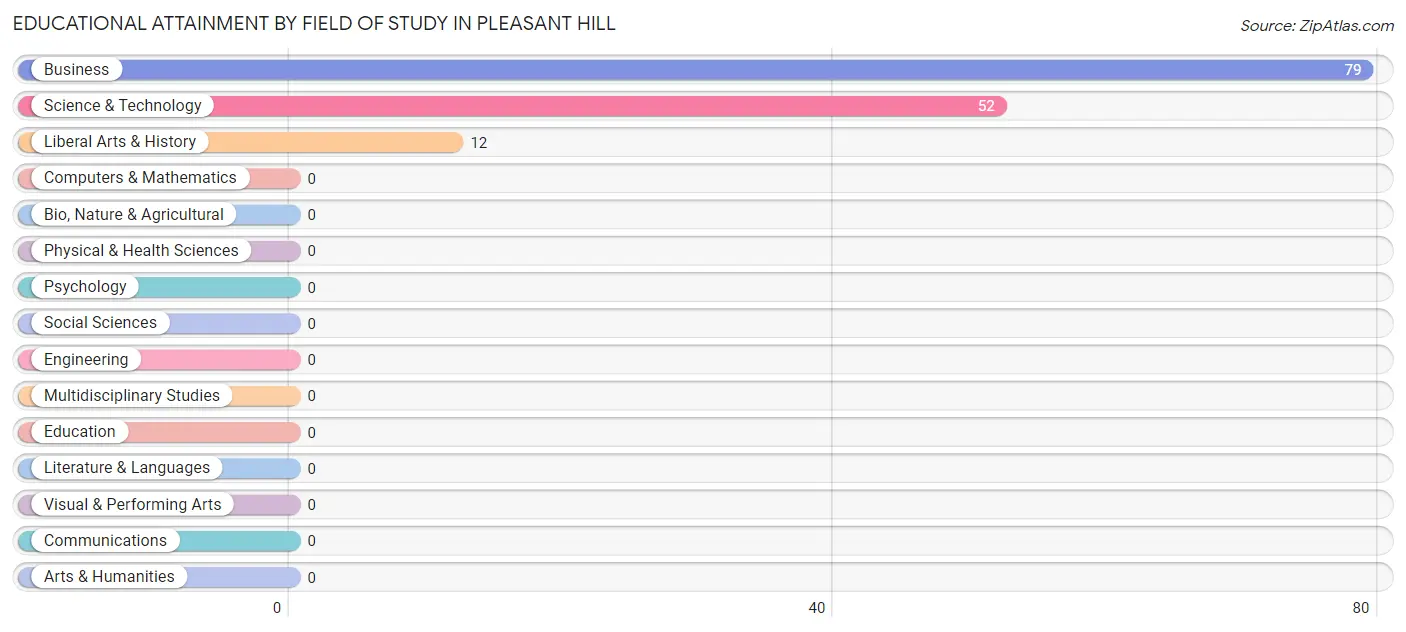
| Field of Study | # Graduates | % Graduates |
| Computers & Mathematics | 0 | 0.0% |
| Bio, Nature & Agricultural | 0 | 0.0% |
| Physical & Health Sciences | 0 | 0.0% |
| Psychology | 0 | 0.0% |
| Social Sciences | 0 | 0.0% |
| Engineering | 0 | 0.0% |
| Multidisciplinary Studies | 0 | 0.0% |
| Science & Technology | 52 | 36.4% |
| Business | 79 | 55.2% |
| Education | 0 | 0.0% |
| Literature & Languages | 0 | 0.0% |
| Liberal Arts & History | 12 | 8.4% |
| Visual & Performing Arts | 0 | 0.0% |
| Communications | 0 | 0.0% |
| Arts & Humanities | 0 | 0.0% |
| Total | 143 | 100.0% |
Transportation & Commute in Pleasant Hill
Vehicle Availability by Sex in Pleasant Hill
The most prevalent vehicle ownership categories in Pleasant Hill are males with 3 vehicles (133, accounting for 57.1%) and females with 3 vehicles (124, making up 48.7%).
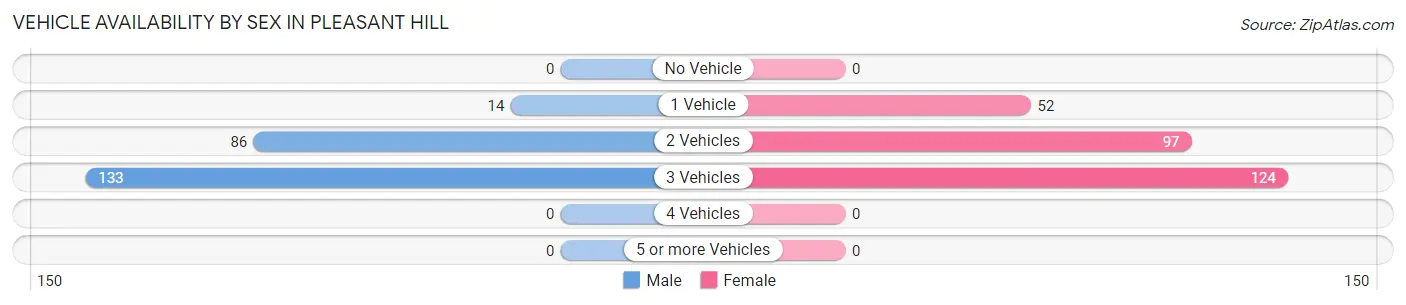
| Vehicles Available | Male | Female |
| No Vehicle | 0 (0.0%) | 0 (0.0%) |
| 1 Vehicle | 14 (6.0%) | 52 (19.1%) |
| 2 Vehicles | 86 (36.9%) | 97 (35.5%) |
| 3 Vehicles | 133 (57.1%) | 124 (45.4%) |
| 4 Vehicles | 0 (0.0%) | 0 (0.0%) |
| 5 or more Vehicles | 0 (0.0%) | 0 (0.0%) |
| Total | 233 (100.0%) | 273 (100.0%) |
Commute Time in Pleasant Hill
The most frequently occuring commute durations in Pleasant Hill are 5 to 9 minutes (141 commuters, 27.9%), 20 to 24 minutes (129 commuters, 25.5%), and 25 to 29 minutes (129 commuters, 25.5%).
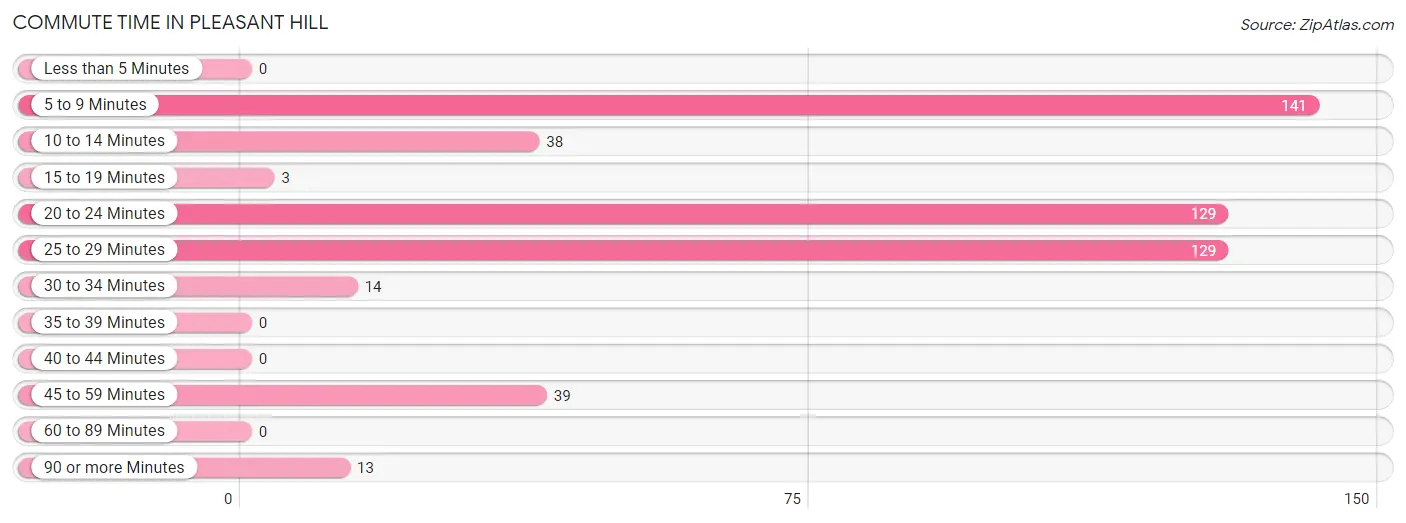
| Commute Time | # Commuters | % Commuters |
| Less than 5 Minutes | 0 | 0.0% |
| 5 to 9 Minutes | 141 | 27.9% |
| 10 to 14 Minutes | 38 | 7.5% |
| 15 to 19 Minutes | 3 | 0.6% |
| 20 to 24 Minutes | 129 | 25.5% |
| 25 to 29 Minutes | 129 | 25.5% |
| 30 to 34 Minutes | 14 | 2.8% |
| 35 to 39 Minutes | 0 | 0.0% |
| 40 to 44 Minutes | 0 | 0.0% |
| 45 to 59 Minutes | 39 | 7.7% |
| 60 to 89 Minutes | 0 | 0.0% |
| 90 or more Minutes | 13 | 2.6% |
Commute Time by Sex in Pleasant Hill
The most common commute times in Pleasant Hill are 25 to 29 minutes (129 commuters, 55.4%) for males and 20 to 24 minutes (124 commuters, 45.4%) for females.
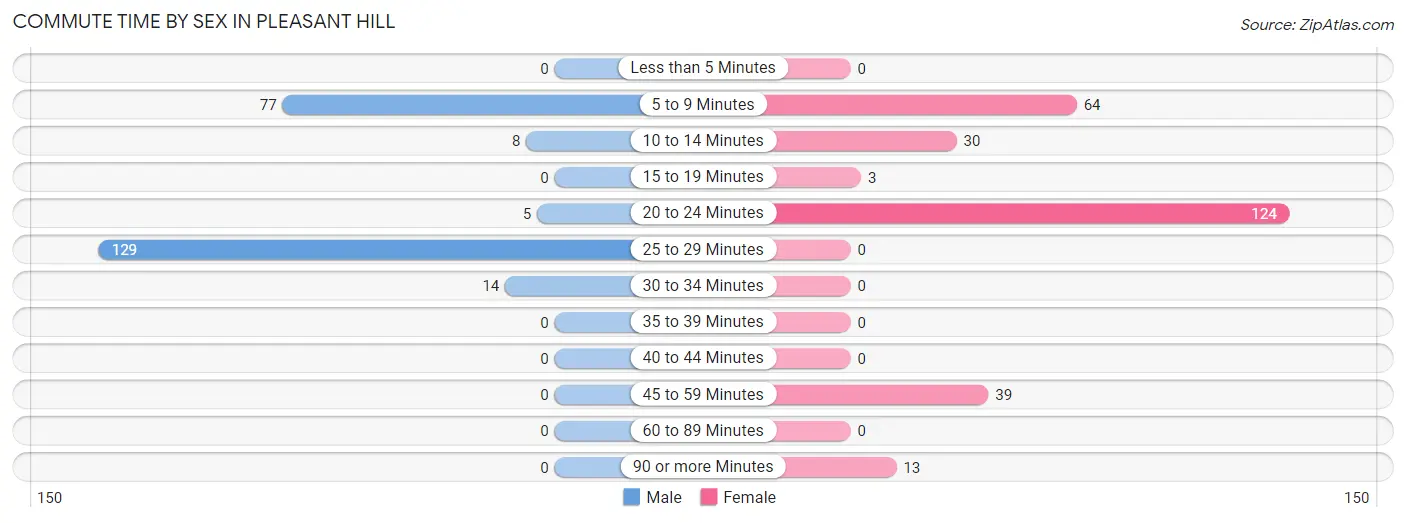
| Commute Time | Male | Female |
| Less than 5 Minutes | 0 (0.0%) | 0 (0.0%) |
| 5 to 9 Minutes | 77 (33.1%) | 64 (23.4%) |
| 10 to 14 Minutes | 8 (3.4%) | 30 (11.0%) |
| 15 to 19 Minutes | 0 (0.0%) | 3 (1.1%) |
| 20 to 24 Minutes | 5 (2.1%) | 124 (45.4%) |
| 25 to 29 Minutes | 129 (55.4%) | 0 (0.0%) |
| 30 to 34 Minutes | 14 (6.0%) | 0 (0.0%) |
| 35 to 39 Minutes | 0 (0.0%) | 0 (0.0%) |
| 40 to 44 Minutes | 0 (0.0%) | 0 (0.0%) |
| 45 to 59 Minutes | 0 (0.0%) | 39 (14.3%) |
| 60 to 89 Minutes | 0 (0.0%) | 0 (0.0%) |
| 90 or more Minutes | 0 (0.0%) | 13 (4.8%) |
Time of Departure to Work by Sex in Pleasant Hill
The most frequent times of departure to work in Pleasant Hill are 6:30 AM to 6:59 AM (125, 53.6%) for males and 6:30 AM to 6:59 AM (124, 45.4%) for females.
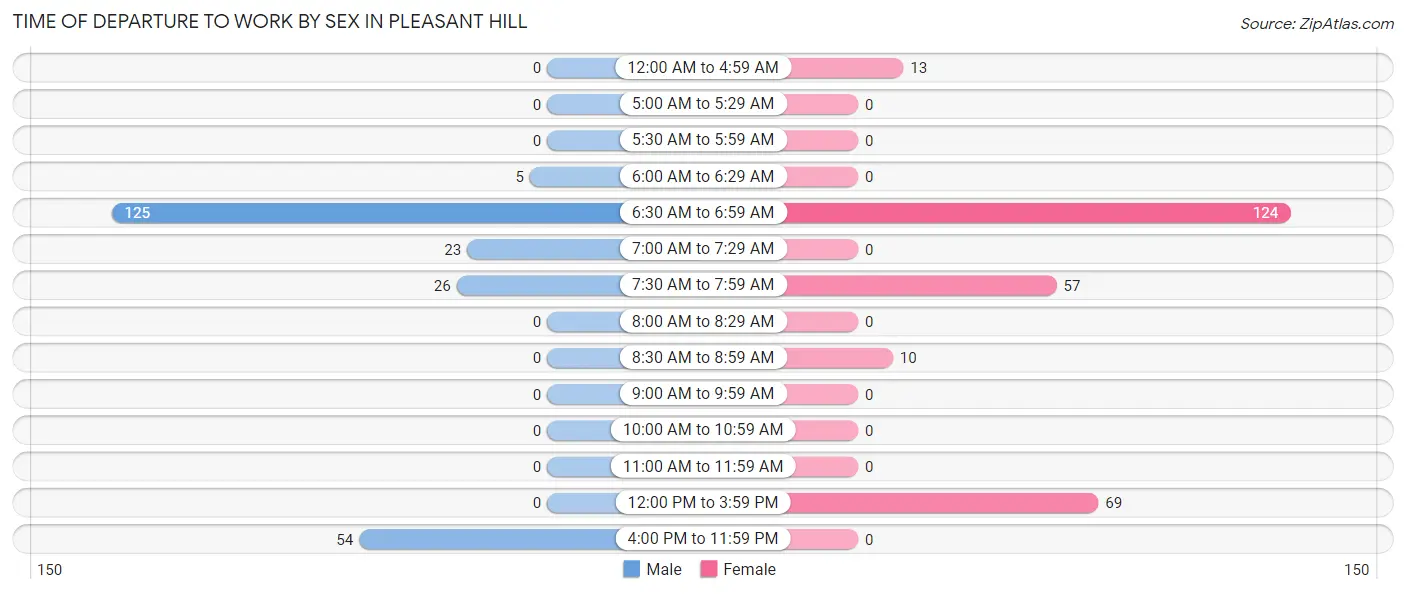
| Time of Departure | Male | Female |
| 12:00 AM to 4:59 AM | 0 (0.0%) | 13 (4.8%) |
| 5:00 AM to 5:29 AM | 0 (0.0%) | 0 (0.0%) |
| 5:30 AM to 5:59 AM | 0 (0.0%) | 0 (0.0%) |
| 6:00 AM to 6:29 AM | 5 (2.1%) | 0 (0.0%) |
| 6:30 AM to 6:59 AM | 125 (53.6%) | 124 (45.4%) |
| 7:00 AM to 7:29 AM | 23 (9.9%) | 0 (0.0%) |
| 7:30 AM to 7:59 AM | 26 (11.2%) | 57 (20.9%) |
| 8:00 AM to 8:29 AM | 0 (0.0%) | 0 (0.0%) |
| 8:30 AM to 8:59 AM | 0 (0.0%) | 10 (3.7%) |
| 9:00 AM to 9:59 AM | 0 (0.0%) | 0 (0.0%) |
| 10:00 AM to 10:59 AM | 0 (0.0%) | 0 (0.0%) |
| 11:00 AM to 11:59 AM | 0 (0.0%) | 0 (0.0%) |
| 12:00 PM to 3:59 PM | 0 (0.0%) | 69 (25.3%) |
| 4:00 PM to 11:59 PM | 54 (23.2%) | 0 (0.0%) |
| Total | 233 (100.0%) | 273 (100.0%) |
Housing Occupancy in Pleasant Hill
Occupancy by Ownership in Pleasant Hill
Of the total 414 dwellings in Pleasant Hill, owner-occupied units account for 341 (82.4%), while renter-occupied units make up 73 (17.6%).
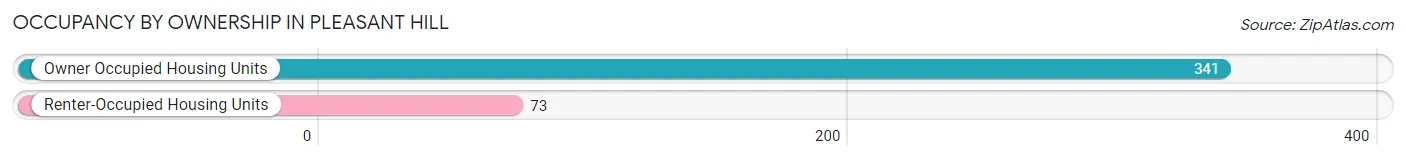
| Occupancy | # Housing Units | % Housing Units |
| Owner Occupied Housing Units | 341 | 82.4% |
| Renter-Occupied Housing Units | 73 | 17.6% |
| Total Occupied Housing Units | 414 | 100.0% |
Occupancy by Household Size in Pleasant Hill
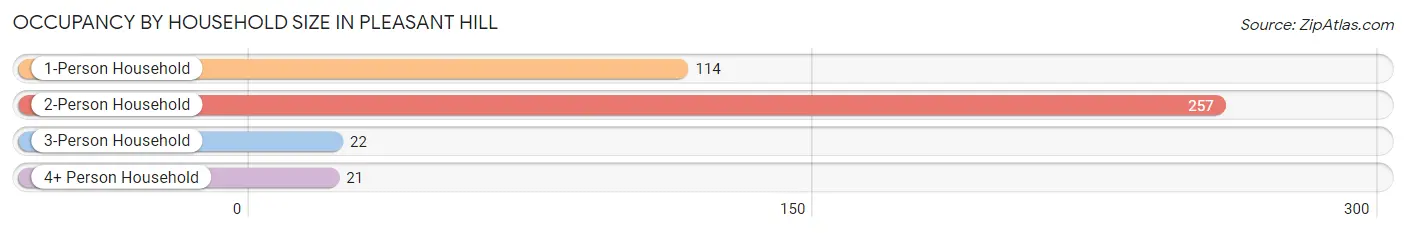
| Household Size | # Housing Units | % Housing Units |
| 1-Person Household | 114 | 27.5% |
| 2-Person Household | 257 | 62.1% |
| 3-Person Household | 22 | 5.3% |
| 4+ Person Household | 21 | 5.1% |
| Total Housing Units | 414 | 100.0% |
Occupancy by Ownership by Household Size in Pleasant Hill
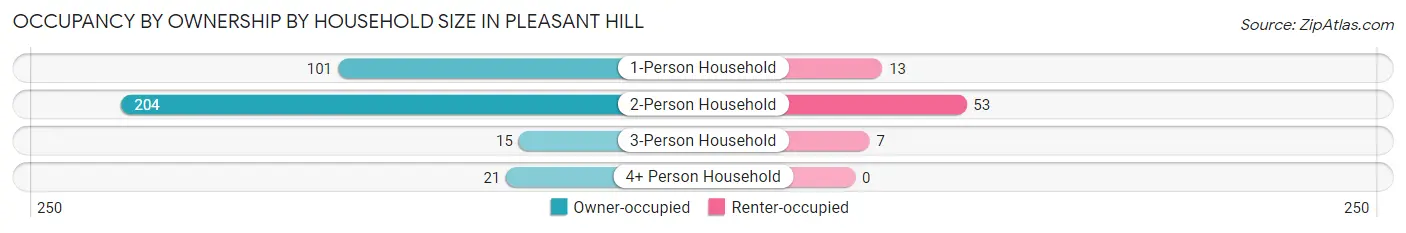
| Household Size | Owner-occupied | Renter-occupied |
| 1-Person Household | 101 (88.6%) | 13 (11.4%) |
| 2-Person Household | 204 (79.4%) | 53 (20.6%) |
| 3-Person Household | 15 (68.2%) | 7 (31.8%) |
| 4+ Person Household | 21 (100.0%) | 0 (0.0%) |
| Total Housing Units | 341 (82.4%) | 73 (17.6%) |
Occupancy by Educational Attainment in Pleasant Hill
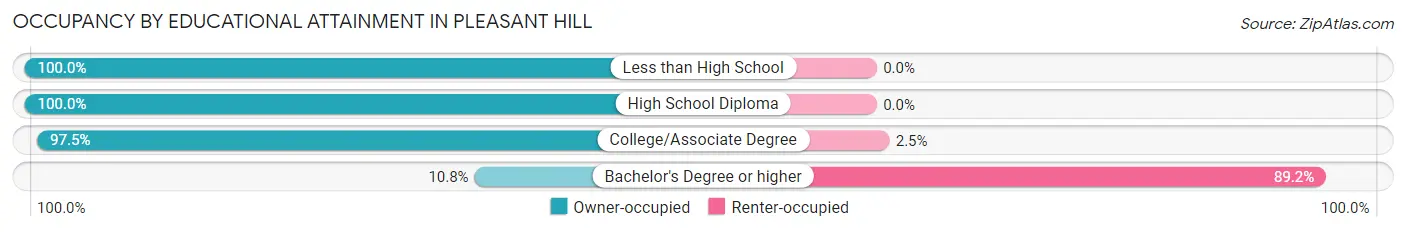
| Household Size | Owner-occupied | Renter-occupied |
| Less than High School | 17 (100.0%) | 0 (0.0%) |
| High School Diploma | 43 (100.0%) | 0 (0.0%) |
| College/Associate Degree | 273 (97.5%) | 7 (2.5%) |
| Bachelor's Degree or higher | 8 (10.8%) | 66 (89.2%) |
Occupancy by Age of Householder in Pleasant Hill
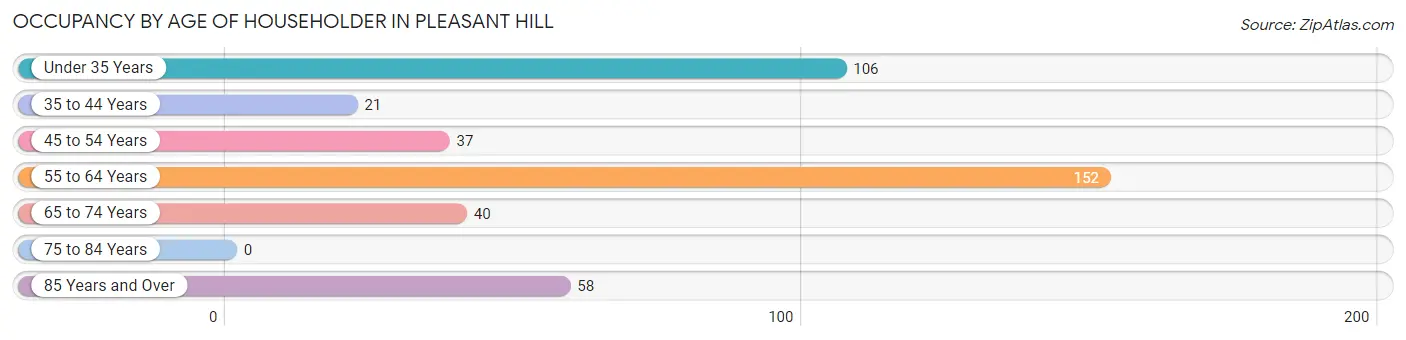
| Age Bracket | # Households | % Households |
| Under 35 Years | 106 | 25.6% |
| 35 to 44 Years | 21 | 5.1% |
| 45 to 54 Years | 37 | 8.9% |
| 55 to 64 Years | 152 | 36.7% |
| 65 to 74 Years | 40 | 9.7% |
| 75 to 84 Years | 0 | 0.0% |
| 85 Years and Over | 58 | 14.0% |
| Total | 414 | 100.0% |
Housing Finances in Pleasant Hill
Median Income by Occupancy in Pleasant Hill
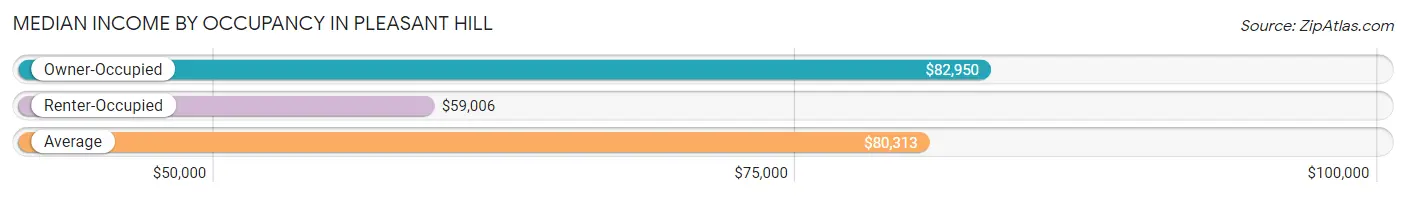
| Occupancy Type | # Households | Median Income |
| Owner-Occupied | 341 (82.4%) | $82,950 |
| Renter-Occupied | 73 (17.6%) | $59,006 |
| Average | 414 (100.0%) | $80,313 |
Occupancy by Householder Income Bracket in Pleasant Hill
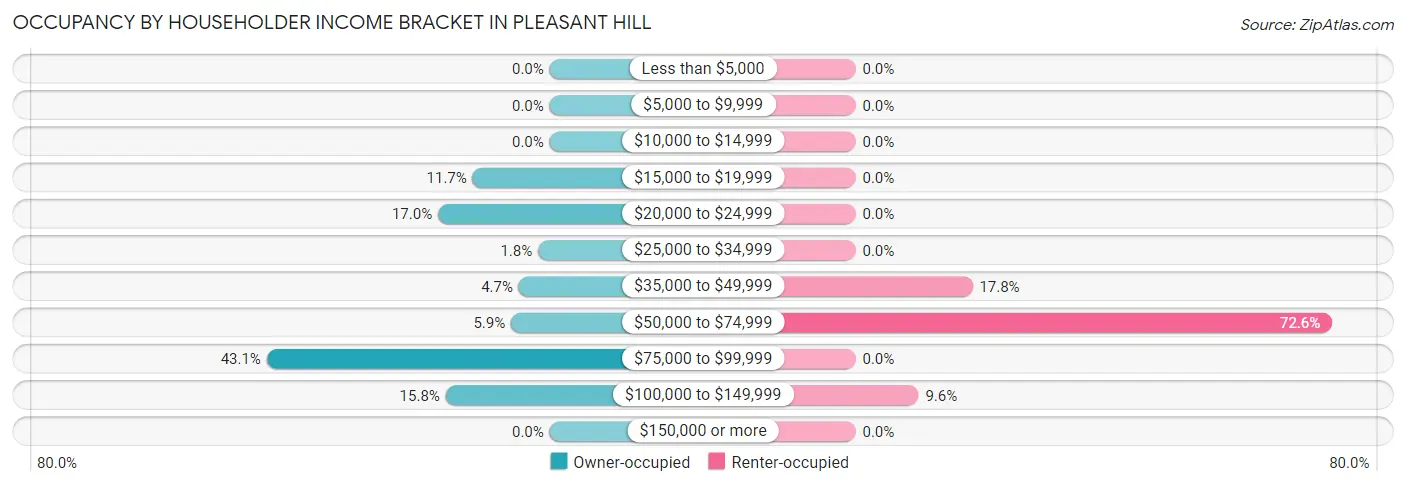
| Income Bracket | Owner-occupied | Renter-occupied |
| Less than $5,000 | 0 (0.0%) | 0 (0.0%) |
| $5,000 to $9,999 | 0 (0.0%) | 0 (0.0%) |
| $10,000 to $14,999 | 0 (0.0%) | 0 (0.0%) |
| $15,000 to $19,999 | 40 (11.7%) | 0 (0.0%) |
| $20,000 to $24,999 | 58 (17.0%) | 0 (0.0%) |
| $25,000 to $34,999 | 6 (1.8%) | 0 (0.0%) |
| $35,000 to $49,999 | 16 (4.7%) | 13 (17.8%) |
| $50,000 to $74,999 | 20 (5.9%) | 53 (72.6%) |
| $75,000 to $99,999 | 147 (43.1%) | 0 (0.0%) |
| $100,000 to $149,999 | 54 (15.8%) | 7 (9.6%) |
| $150,000 or more | 0 (0.0%) | 0 (0.0%) |
| Total | 341 (100.0%) | 73 (100.0%) |
Monthly Housing Cost Tiers in Pleasant Hill
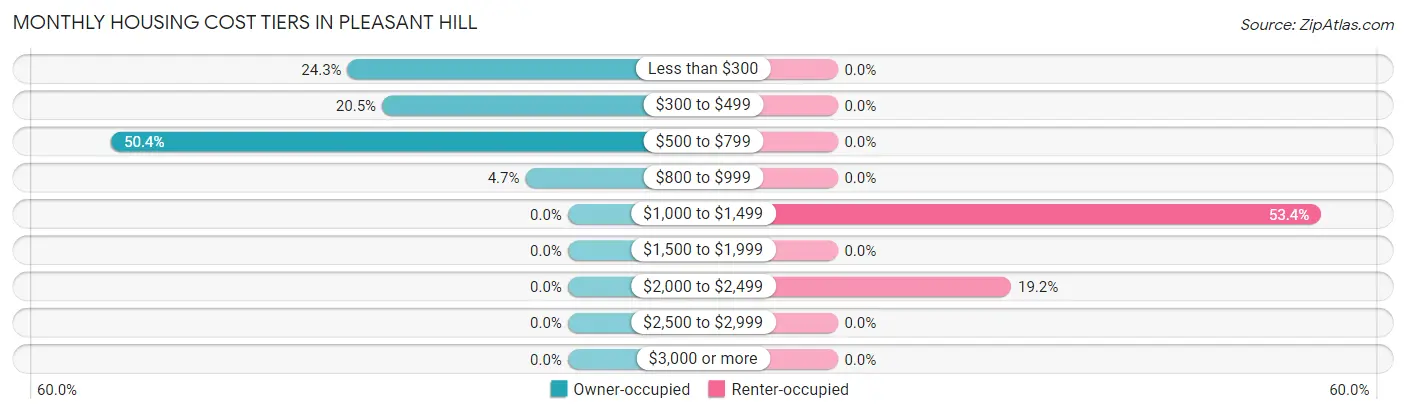
| Monthly Cost | Owner-occupied | Renter-occupied |
| Less than $300 | 83 (24.3%) | 0 (0.0%) |
| $300 to $499 | 70 (20.5%) | 0 (0.0%) |
| $500 to $799 | 172 (50.4%) | 0 (0.0%) |
| $800 to $999 | 16 (4.7%) | 0 (0.0%) |
| $1,000 to $1,499 | 0 (0.0%) | 39 (53.4%) |
| $1,500 to $1,999 | 0 (0.0%) | 0 (0.0%) |
| $2,000 to $2,499 | 0 (0.0%) | 14 (19.2%) |
| $2,500 to $2,999 | 0 (0.0%) | 0 (0.0%) |
| $3,000 or more | 0 (0.0%) | 0 (0.0%) |
| Total | 341 (100.0%) | 73 (100.0%) |
Physical Housing Characteristics in Pleasant Hill
Housing Structures in Pleasant Hill
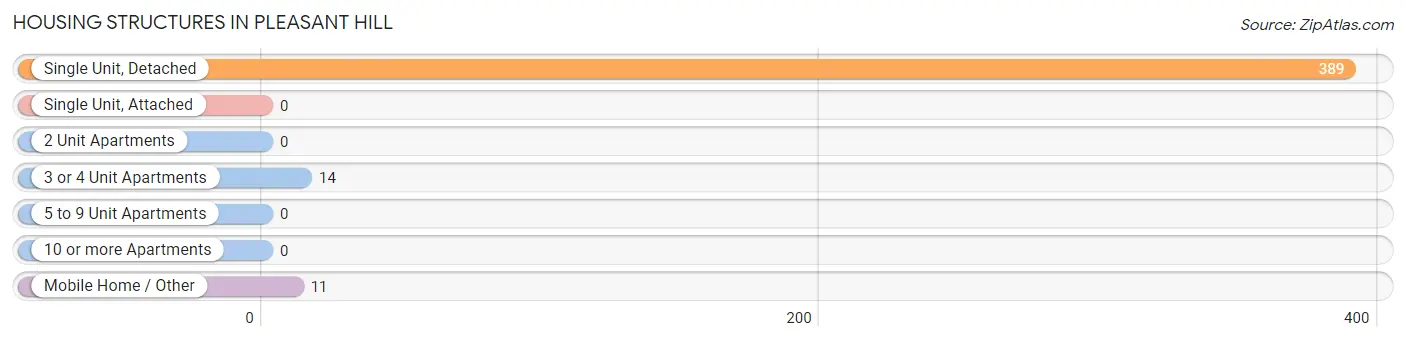
| Structure Type | # Housing Units | % Housing Units |
| Single Unit, Detached | 389 | 94.0% |
| Single Unit, Attached | 0 | 0.0% |
| 2 Unit Apartments | 0 | 0.0% |
| 3 or 4 Unit Apartments | 14 | 3.4% |
| 5 to 9 Unit Apartments | 0 | 0.0% |
| 10 or more Apartments | 0 | 0.0% |
| Mobile Home / Other | 11 | 2.7% |
| Total | 414 | 100.0% |
Housing Structures by Occupancy in Pleasant Hill
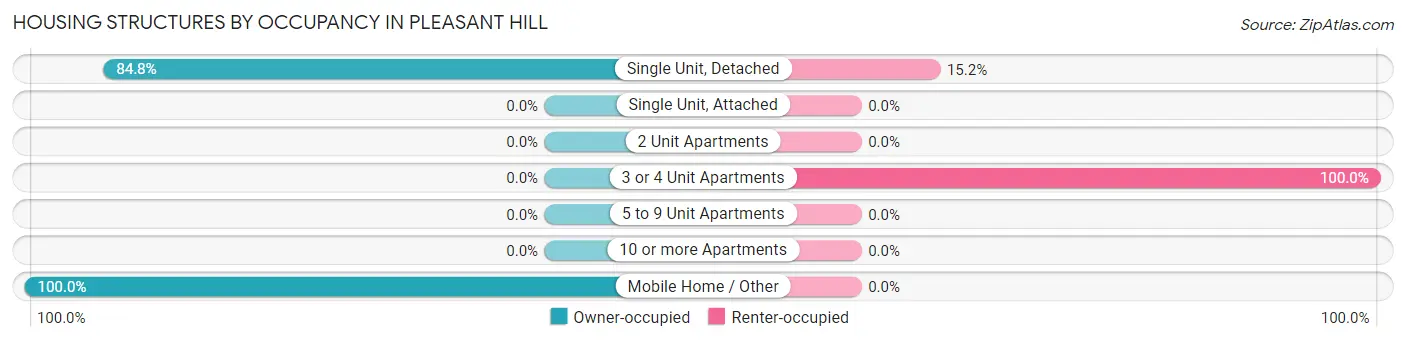
| Structure Type | Owner-occupied | Renter-occupied |
| Single Unit, Detached | 330 (84.8%) | 59 (15.2%) |
| Single Unit, Attached | 0 (0.0%) | 0 (0.0%) |
| 2 Unit Apartments | 0 (0.0%) | 0 (0.0%) |
| 3 or 4 Unit Apartments | 0 (0.0%) | 14 (100.0%) |
| 5 to 9 Unit Apartments | 0 (0.0%) | 0 (0.0%) |
| 10 or more Apartments | 0 (0.0%) | 0 (0.0%) |
| Mobile Home / Other | 11 (100.0%) | 0 (0.0%) |
| Total | 341 (82.4%) | 73 (17.6%) |
Housing Structures by Number of Rooms in Pleasant Hill
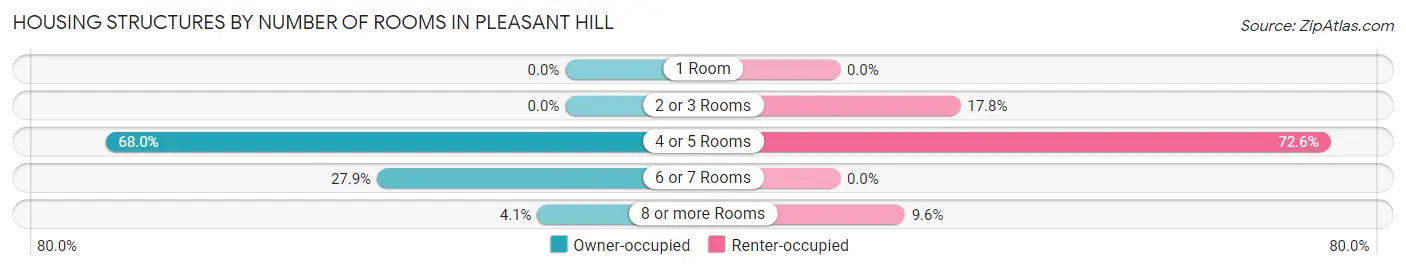
| Number of Rooms | Owner-occupied | Renter-occupied |
| 1 Room | 0 (0.0%) | 0 (0.0%) |
| 2 or 3 Rooms | 0 (0.0%) | 13 (17.8%) |
| 4 or 5 Rooms | 232 (68.0%) | 53 (72.6%) |
| 6 or 7 Rooms | 95 (27.9%) | 0 (0.0%) |
| 8 or more Rooms | 14 (4.1%) | 7 (9.6%) |
| Total | 341 (100.0%) | 73 (100.0%) |
Housing Structure by Heating Type in Pleasant Hill
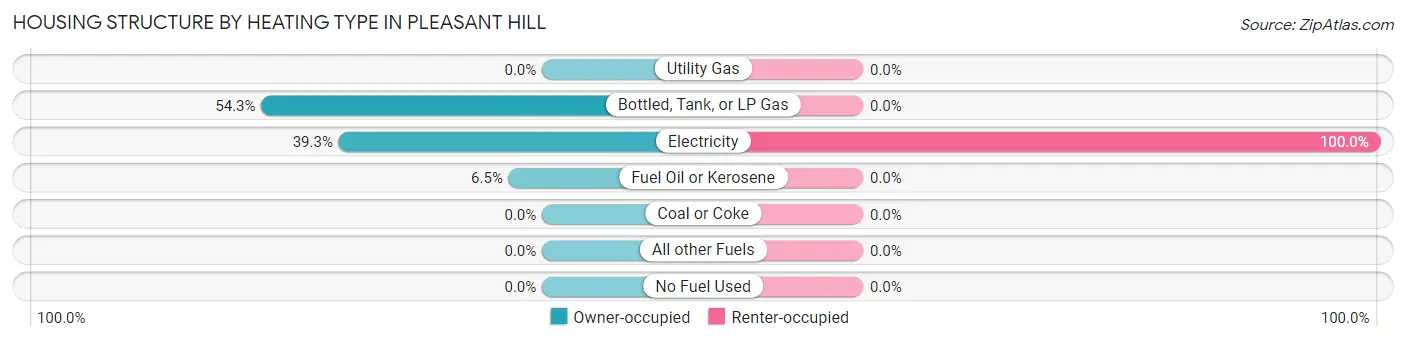
| Heating Type | Owner-occupied | Renter-occupied |
| Utility Gas | 0 (0.0%) | 0 (0.0%) |
| Bottled, Tank, or LP Gas | 185 (54.2%) | 0 (0.0%) |
| Electricity | 134 (39.3%) | 73 (100.0%) |
| Fuel Oil or Kerosene | 22 (6.5%) | 0 (0.0%) |
| Coal or Coke | 0 (0.0%) | 0 (0.0%) |
| All other Fuels | 0 (0.0%) | 0 (0.0%) |
| No Fuel Used | 0 (0.0%) | 0 (0.0%) |
| Total | 341 (100.0%) | 73 (100.0%) |
Household Vehicle Usage in Pleasant Hill
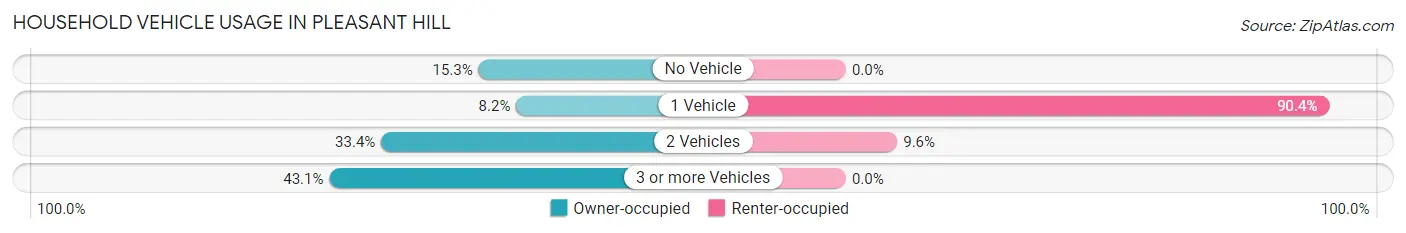
| Vehicles per Household | Owner-occupied | Renter-occupied |
| No Vehicle | 52 (15.2%) | 0 (0.0%) |
| 1 Vehicle | 28 (8.2%) | 66 (90.4%) |
| 2 Vehicles | 114 (33.4%) | 7 (9.6%) |
| 3 or more Vehicles | 147 (43.1%) | 0 (0.0%) |
| Total | 341 (100.0%) | 73 (100.0%) |
Real Estate & Mortgages in Pleasant Hill
Real Estate and Mortgage Overview in Pleasant Hill
| Characteristic | Without Mortgage | With Mortgage |
| Housing Units | 298 | 43 |
| Median Property Value | $140,300 | $158,600 |
| Median Household Income | $83,380 | $0 |
| Monthly Housing Costs | $492 | $0 |
| Real Estate Taxes | $1,421 | $0 |
Property Value by Mortgage Status in Pleasant Hill
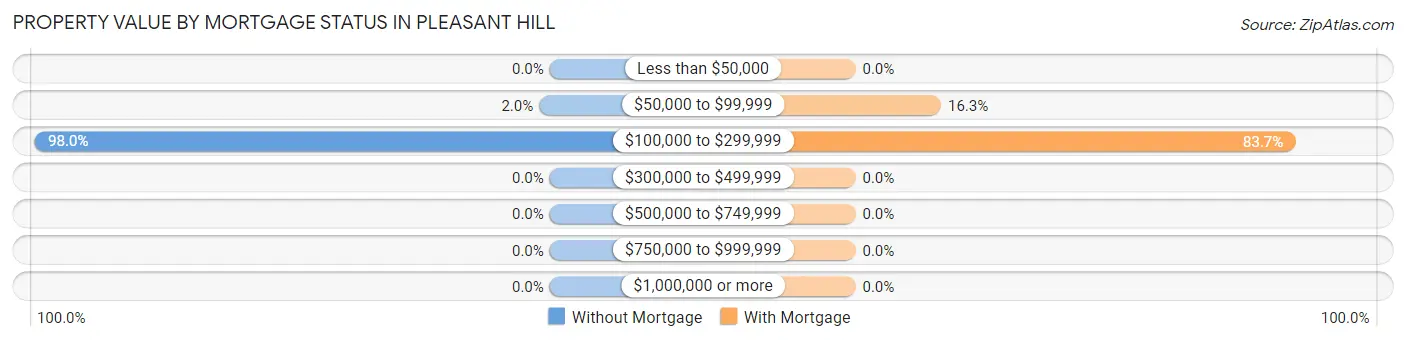
| Property Value | Without Mortgage | With Mortgage |
| Less than $50,000 | 0 (0.0%) | 0 (0.0%) |
| $50,000 to $99,999 | 6 (2.0%) | 7 (16.3%) |
| $100,000 to $299,999 | 292 (98.0%) | 36 (83.7%) |
| $300,000 to $499,999 | 0 (0.0%) | 0 (0.0%) |
| $500,000 to $749,999 | 0 (0.0%) | 0 (0.0%) |
| $750,000 to $999,999 | 0 (0.0%) | 0 (0.0%) |
| $1,000,000 or more | 0 (0.0%) | 0 (0.0%) |
| Total | 298 (100.0%) | 43 (100.0%) |
Household Income by Mortgage Status in Pleasant Hill
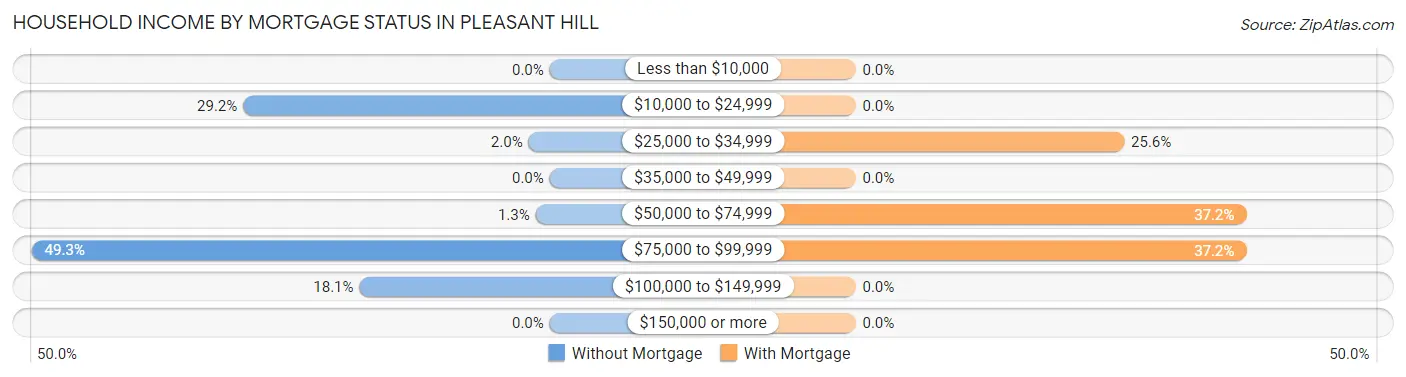
| Household Income | Without Mortgage | With Mortgage |
| Less than $10,000 | 0 (0.0%) | 0 (0.0%) |
| $10,000 to $24,999 | 87 (29.2%) | 0 (0.0%) |
| $25,000 to $34,999 | 6 (2.0%) | 11 (25.6%) |
| $35,000 to $49,999 | 0 (0.0%) | 0 (0.0%) |
| $50,000 to $74,999 | 4 (1.3%) | 16 (37.2%) |
| $75,000 to $99,999 | 147 (49.3%) | 16 (37.2%) |
| $100,000 to $149,999 | 54 (18.1%) | 0 (0.0%) |
| $150,000 or more | 0 (0.0%) | 0 (0.0%) |
| Total | 298 (100.0%) | 43 (100.0%) |
Property Value to Household Income Ratio in Pleasant Hill
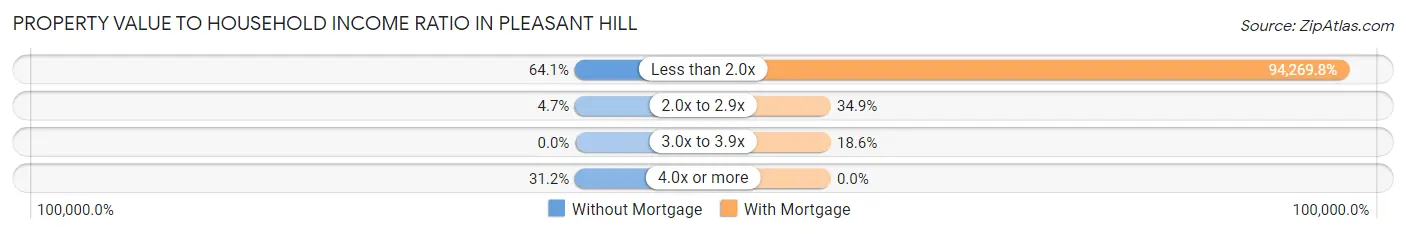
| Value-to-Income Ratio | Without Mortgage | With Mortgage |
| Less than 2.0x | 191 (64.1%) | 40,536 (94,269.8%) |
| 2.0x to 2.9x | 14 (4.7%) | 15 (34.9%) |
| 3.0x to 3.9x | 0 (0.0%) | 8 (18.6%) |
| 4.0x or more | 93 (31.2%) | 0 (0.0%) |
| Total | 298 (100.0%) | 43 (100.0%) |
Real Estate Taxes by Mortgage Status in Pleasant Hill
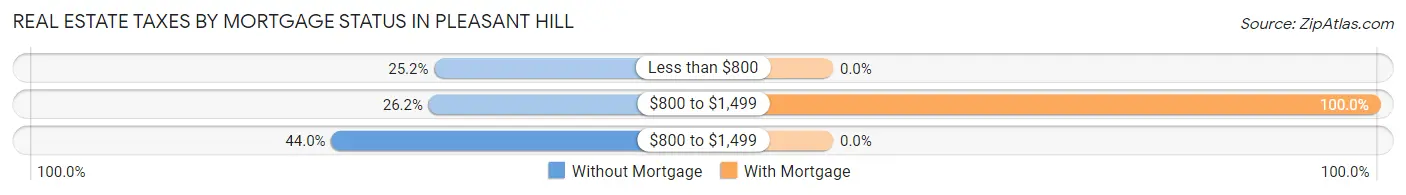
| Property Taxes | Without Mortgage | With Mortgage |
| Less than $800 | 75 (25.2%) | 0 (0.0%) |
| $800 to $1,499 | 78 (26.2%) | 43 (100.0%) |
| $800 to $1,499 | 131 (44.0%) | 0 (0.0%) |
| Total | 298 (100.0%) | 43 (100.0%) |
Health & Disability in Pleasant Hill
Health Insurance Coverage by Age in Pleasant Hill
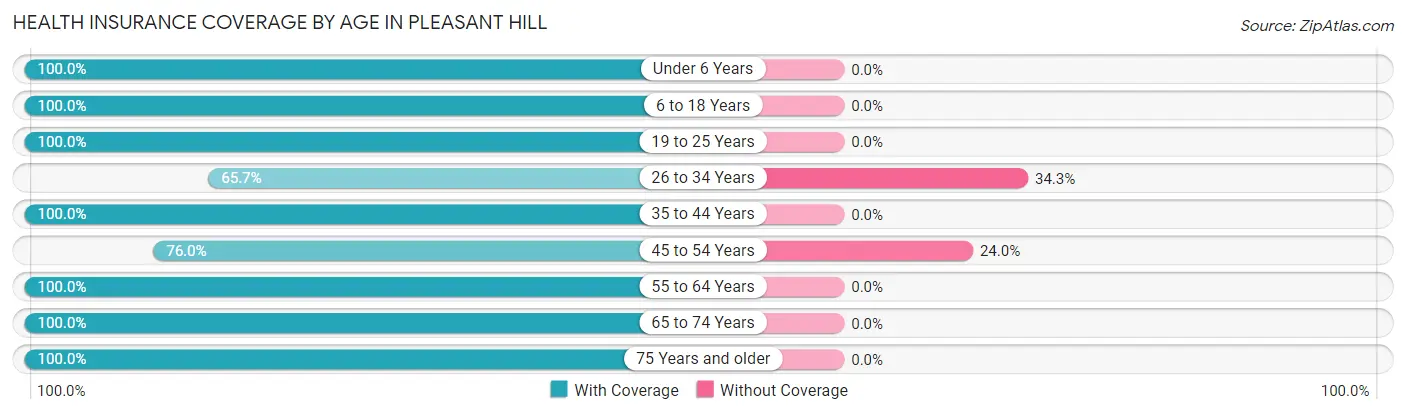
| Age Bracket | With Coverage | Without Coverage |
| Under 6 Years | 31 (100.0%) | 0 (0.0%) |
| 6 to 18 Years | 24 (100.0%) | 0 (0.0%) |
| 19 to 25 Years | 25 (100.0%) | 0 (0.0%) |
| 26 to 34 Years | 163 (65.7%) | 85 (34.3%) |
| 35 to 44 Years | 54 (100.0%) | 0 (0.0%) |
| 45 to 54 Years | 57 (76.0%) | 18 (24.0%) |
| 55 to 64 Years | 300 (100.0%) | 0 (0.0%) |
| 65 to 74 Years | 52 (100.0%) | 0 (0.0%) |
| 75 Years and older | 58 (100.0%) | 0 (0.0%) |
| Total | 764 (88.1%) | 103 (11.9%) |
Health Insurance Coverage by Citizenship Status in Pleasant Hill
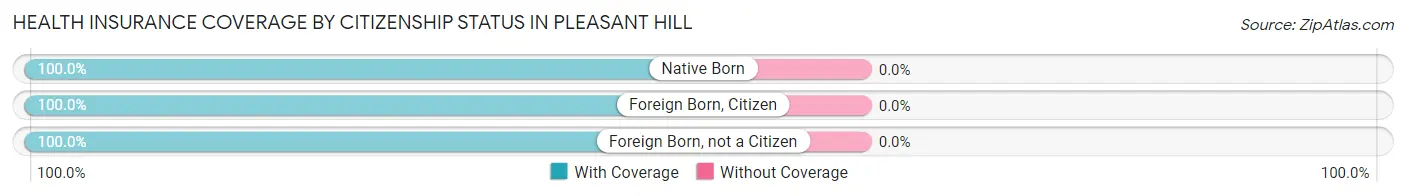
| Citizenship Status | With Coverage | Without Coverage |
| Native Born | 31 (100.0%) | 0 (0.0%) |
| Foreign Born, Citizen | 24 (100.0%) | 0 (0.0%) |
| Foreign Born, not a Citizen | 25 (100.0%) | 0 (0.0%) |
Health Insurance Coverage by Household Income in Pleasant Hill
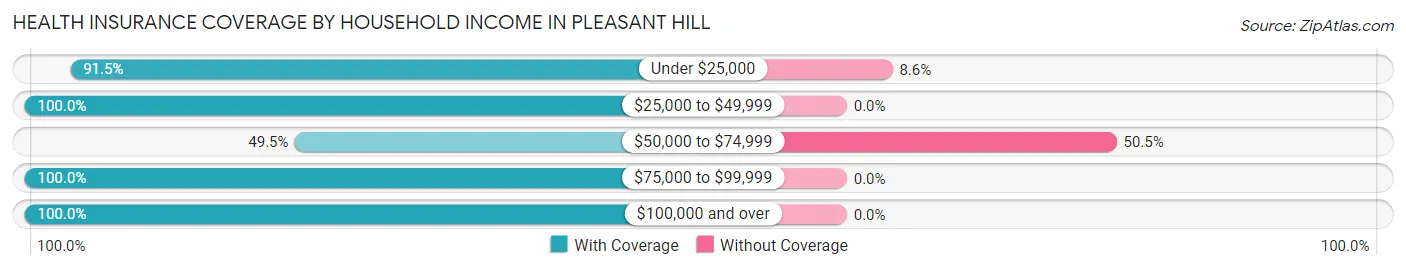
| Household Income | With Coverage | Without Coverage |
| Under $25,000 | 107 (91.4%) | 10 (8.6%) |
| $25,000 to $49,999 | 76 (100.0%) | 0 (0.0%) |
| $50,000 to $74,999 | 91 (49.5%) | 93 (50.5%) |
| $75,000 to $99,999 | 330 (100.0%) | 0 (0.0%) |
| $100,000 and over | 160 (100.0%) | 0 (0.0%) |
Public vs Private Health Insurance Coverage by Age in Pleasant Hill
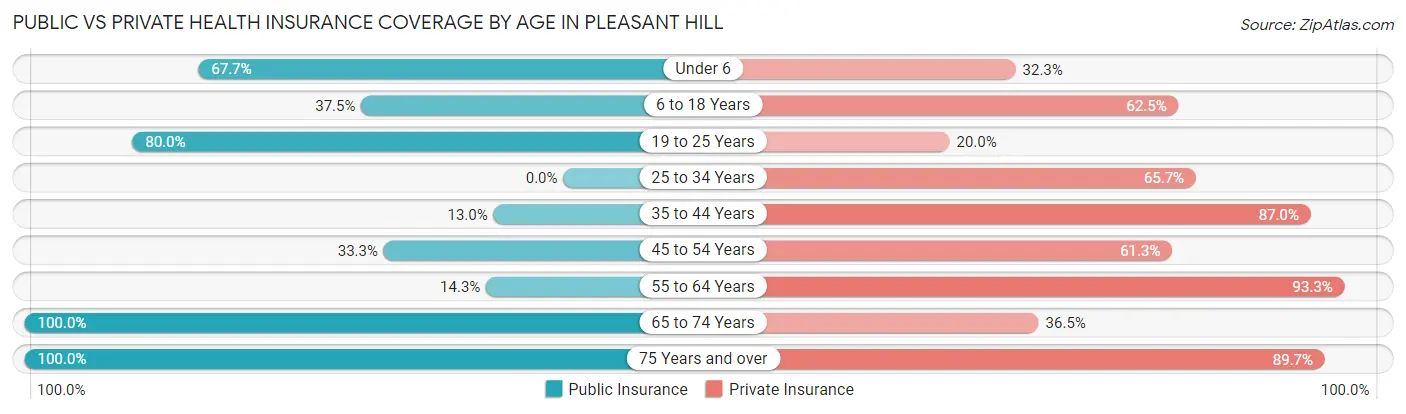
| Age Bracket | Public Insurance | Private Insurance |
| Under 6 | 21 (67.7%) | 10 (32.3%) |
| 6 to 18 Years | 9 (37.5%) | 15 (62.5%) |
| 19 to 25 Years | 20 (80.0%) | 5 (20.0%) |
| 25 to 34 Years | 0 (0.0%) | 163 (65.7%) |
| 35 to 44 Years | 7 (13.0%) | 47 (87.0%) |
| 45 to 54 Years | 25 (33.3%) | 46 (61.3%) |
| 55 to 64 Years | 43 (14.3%) | 280 (93.3%) |
| 65 to 74 Years | 52 (100.0%) | 19 (36.5%) |
| 75 Years and over | 58 (100.0%) | 52 (89.7%) |
| Total | 235 (27.1%) | 637 (73.5%) |
Disability Status by Sex by Age in Pleasant Hill
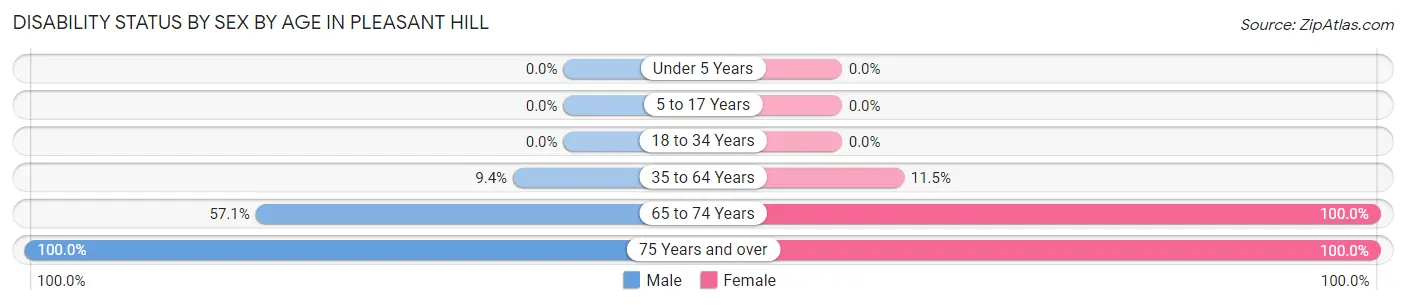
| Age Bracket | Male | Female |
| Under 5 Years | 0 (0.0%) | 0 (0.0%) |
| 5 to 17 Years | 0 (0.0%) | 0 (0.0%) |
| 18 to 34 Years | 0 (0.0%) | 0 (0.0%) |
| 35 to 64 Years | 19 (9.4%) | 26 (11.5%) |
| 65 to 74 Years | 12 (57.1%) | 31 (100.0%) |
| 75 Years and over | 6 (100.0%) | 52 (100.0%) |
Disability Class by Sex by Age in Pleasant Hill
Disability Class: Hearing Difficulty
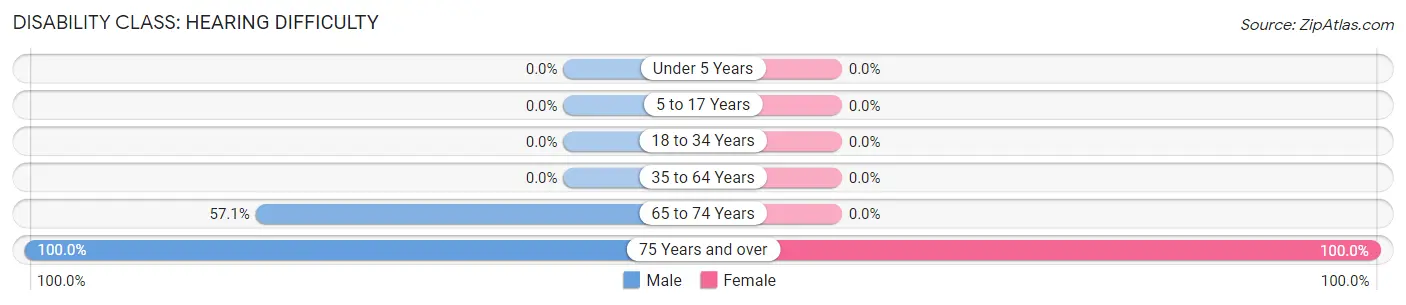
| Age Bracket | Male | Female |
| Under 5 Years | 0 (0.0%) | 0 (0.0%) |
| 5 to 17 Years | 0 (0.0%) | 0 (0.0%) |
| 18 to 34 Years | 0 (0.0%) | 0 (0.0%) |
| 35 to 64 Years | 0 (0.0%) | 0 (0.0%) |
| 65 to 74 Years | 12 (57.1%) | 0 (0.0%) |
| 75 Years and over | 6 (100.0%) | 52 (100.0%) |
Disability Class: Vision Difficulty
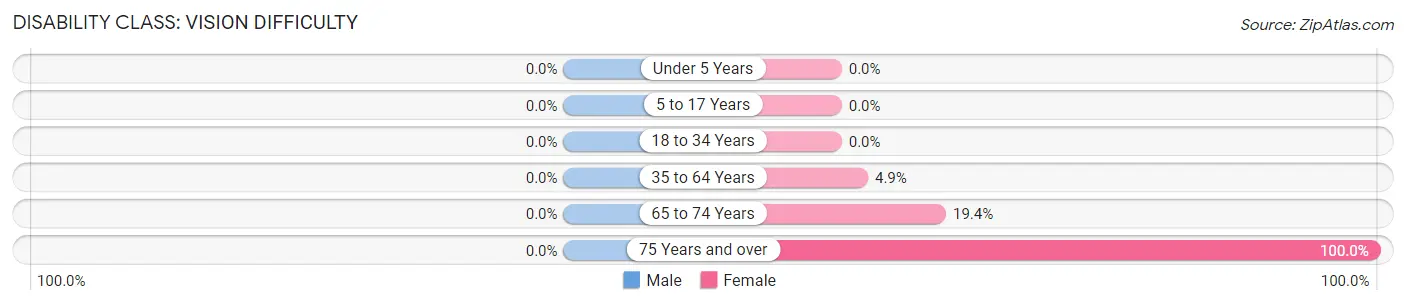
| Age Bracket | Male | Female |
| Under 5 Years | 0 (0.0%) | 0 (0.0%) |
| 5 to 17 Years | 0 (0.0%) | 0 (0.0%) |
| 18 to 34 Years | 0 (0.0%) | 0 (0.0%) |
| 35 to 64 Years | 0 (0.0%) | 11 (4.9%) |
| 65 to 74 Years | 0 (0.0%) | 6 (19.4%) |
| 75 Years and over | 0 (0.0%) | 52 (100.0%) |
Disability Class: Cognitive Difficulty
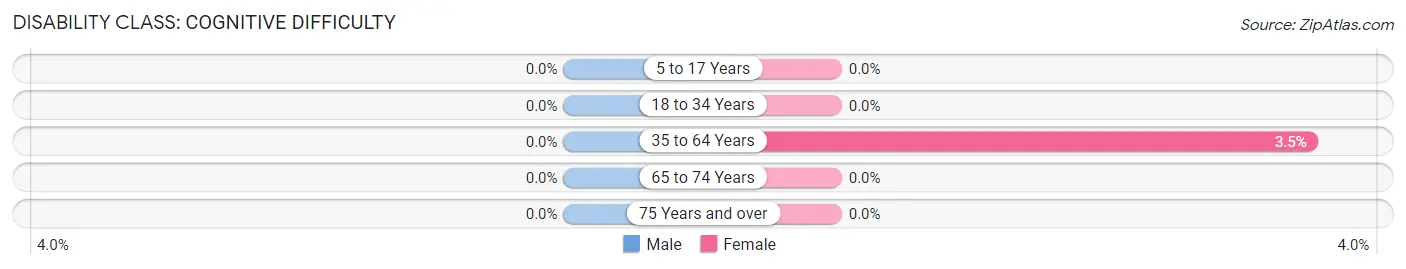
| Age Bracket | Male | Female |
| 5 to 17 Years | 0 (0.0%) | 0 (0.0%) |
| 18 to 34 Years | 0 (0.0%) | 0 (0.0%) |
| 35 to 64 Years | 0 (0.0%) | 8 (3.5%) |
| 65 to 74 Years | 0 (0.0%) | 0 (0.0%) |
| 75 Years and over | 0 (0.0%) | 0 (0.0%) |
Disability Class: Ambulatory Difficulty
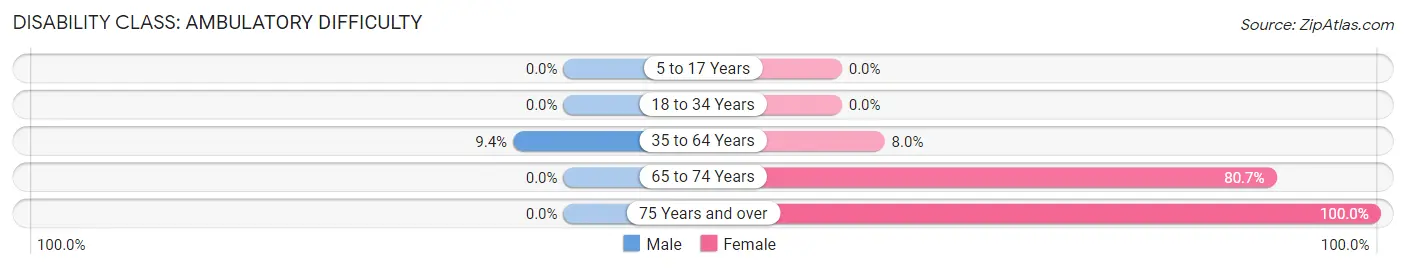
| Age Bracket | Male | Female |
| 5 to 17 Years | 0 (0.0%) | 0 (0.0%) |
| 18 to 34 Years | 0 (0.0%) | 0 (0.0%) |
| 35 to 64 Years | 19 (9.4%) | 18 (8.0%) |
| 65 to 74 Years | 0 (0.0%) | 25 (80.6%) |
| 75 Years and over | 0 (0.0%) | 52 (100.0%) |
Disability Class: Self-Care Difficulty
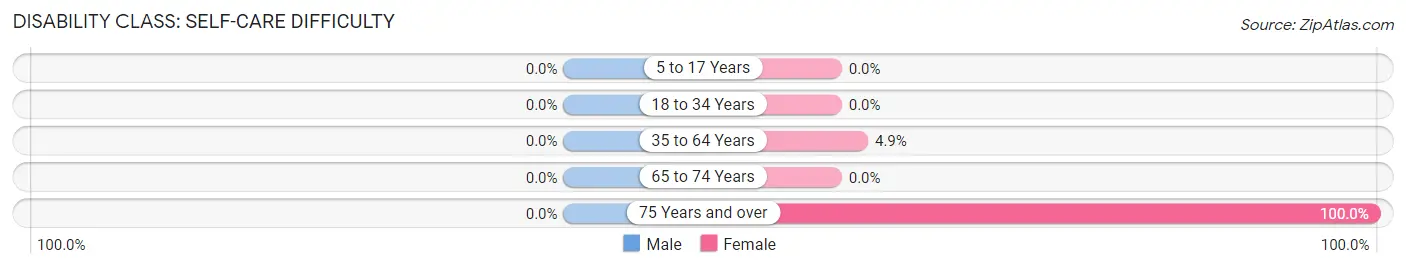
| Age Bracket | Male | Female |
| 5 to 17 Years | 0 (0.0%) | 0 (0.0%) |
| 18 to 34 Years | 0 (0.0%) | 0 (0.0%) |
| 35 to 64 Years | 0 (0.0%) | 11 (4.9%) |
| 65 to 74 Years | 0 (0.0%) | 0 (0.0%) |
| 75 Years and over | 0 (0.0%) | 52 (100.0%) |
Technology Access in Pleasant Hill
Computing Device Access in Pleasant Hill
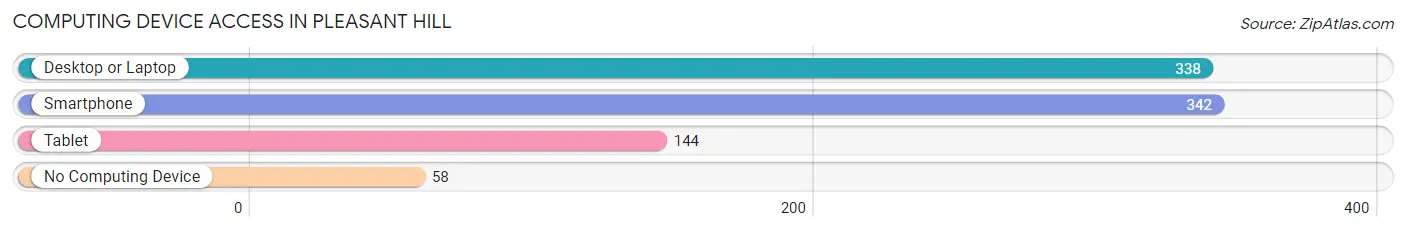
| Device Type | # Households | % Households |
| Desktop or Laptop | 338 | 81.6% |
| Smartphone | 342 | 82.6% |
| Tablet | 144 | 34.8% |
| No Computing Device | 58 | 14.0% |
| Total | 414 | 100.0% |
Internet Access in Pleasant Hill
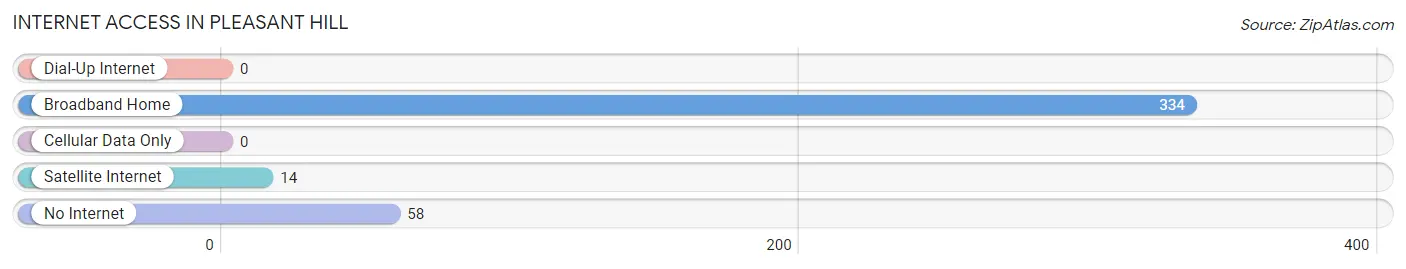
| Internet Type | # Households | % Households |
| Dial-Up Internet | 0 | 0.0% |
| Broadband Home | 334 | 80.7% |
| Cellular Data Only | 0 | 0.0% |
| Satellite Internet | 14 | 3.4% |
| No Internet | 58 | 14.0% |
| Total | 414 | 100.0% |
Pleasant Hill Summary
Pleasant Hill is a small unincorporated community located in the western part of North Carolina, in the foothills of the Blue Ridge Mountains. It is situated in the county of McDowell, and is part of the Marion Micropolitan Statistical Area. The population of Pleasant Hill was estimated to be around 1,000 in 2020.
History
Pleasant Hill was first settled in the early 1800s by a group of settlers from the nearby town of Marion. The settlers were attracted to the area due to its fertile soil and abundant natural resources. The town was originally known as “Pleasant Hill Settlement” and was later shortened to “Pleasant Hill”. The town was officially incorporated in 1883.
The town was a popular destination for tourists in the late 19th and early 20th centuries. It was known for its scenic beauty and its abundance of outdoor activities, such as fishing, hunting, and camping. The town was also home to several resorts, including the Pleasant Hill Inn, which was built in 1887.
Geography
Pleasant Hill is located in the foothills of the Blue Ridge Mountains in western North Carolina. The town is situated in the county of McDowell, and is part of the Marion Micropolitan Statistical Area. The town is located at an elevation of 1,400 feet above sea level.
The town is surrounded by several mountain ranges, including the Black Mountains, the Great Smoky Mountains, and the Blue Ridge Mountains. The town is also located near several rivers, including the Catawba River, the French Broad River, and the Pigeon River.
Economy
The economy of Pleasant Hill is largely based on agriculture and tourism. The town is home to several farms, which produce a variety of crops, including corn, soybeans, and tobacco. The town is also home to several wineries, which produce a variety of wines.
The town is also a popular tourist destination, due to its scenic beauty and abundance of outdoor activities. The town is home to several resorts, including the Pleasant Hill Inn, which was built in 1887. The town is also home to several restaurants, shops, and other businesses.
Demographics
The population of Pleasant Hill was estimated to be around 1,000 in 2020. The town is predominantly white, with a small African American population. The median household income in the town is around $35,000, and the median home value is around $150,000. The town has a low unemployment rate, and the poverty rate is below the national average.
Common Questions
What is Per Capita Income in Pleasant Hill?
Per Capita income in Pleasant Hill is $32,226.
What is the Median Family Income in Pleasant Hill?
Median Family Income in Pleasant Hill is $83,500.
What is the Median Household income in Pleasant Hill?
Median Household Income in Pleasant Hill is $80,313.
What is Income or Wage Gap in Pleasant Hill?
Income or Wage Gap in Pleasant Hill is 4.8%.
Women in Pleasant Hill earn 95.2 cents for every dollar earned by a man.
What is Inequality or Gini Index in Pleasant Hill?
Inequality or Gini Index in Pleasant Hill is 0.26.
What is the Total Population of Pleasant Hill?
Total Population of Pleasant Hill is 867.
What is the Total Male Population of Pleasant Hill?
Total Male Population of Pleasant Hill is 422.
What is the Total Female Population of Pleasant Hill?
Total Female Population of Pleasant Hill is 445.
What is the Ratio of Males per 100 Females in Pleasant Hill?
There are 94.83 Males per 100 Females in Pleasant Hill.
What is the Ratio of Females per 100 Males in Pleasant Hill?
There are 105.45 Females per 100 Males in Pleasant Hill.
What is the Median Population Age in Pleasant Hill?
Median Population Age in Pleasant Hill is 51.8 Years.
What is the Average Family Size in Pleasant Hill
Average Family Size in Pleasant Hill is 2.5 People.
What is the Average Household Size in Pleasant Hill
Average Household Size in Pleasant Hill is 2.1 People.
How Large is the Labor Force in Pleasant Hill?
There are 605 People in the Labor Forcein in Pleasant Hill.
What is the Percentage of People in the Labor Force in Pleasant Hill?
74.5% of People are in the Labor Force in Pleasant Hill.
What is the Unemployment Rate in Pleasant Hill?
Unemployment Rate in Pleasant Hill is 14.0%.