North Topsail Beach, NC Map & Demographics
North Topsail Beach Map
North Topsail Beach Overview
$67,603
PER CAPITA INCOME
$116,719
AVG FAMILY INCOME
$82,857
AVG HOUSEHOLD INCOME
30.5%
WAGE / INCOME GAP [ % ]
69.5¢/ $1
WAGE / INCOME GAP [ $ ]
0.52
INEQUALITY / GINI INDEX
775
TOTAL POPULATION
422
MALE POPULATION
353
FEMALE POPULATION
119.55
MALES / 100 FEMALES
83.65
FEMALES / 100 MALES
60.0
MEDIAN AGE
2.5
AVG FAMILY SIZE
1.9
AVG HOUSEHOLD SIZE
383
LABOR FORCE [ PEOPLE ]
51.5%
PERCENT IN LABOR FORCE
8.1%
UNEMPLOYMENT RATE
Income in North Topsail Beach
Income Overview in North Topsail Beach
Per Capita Income in North Topsail Beach is $67,603, while median incomes of families and households are $116,719 and $82,857 respectively.
| Characteristic | Number | Measure |
| Per Capita Income | 775 | $67,603 |
| Median Family Income | 223 | $116,719 |
| Mean Family Income | 223 | $138,504 |
| Median Household Income | 406 | $82,857 |
| Mean Household Income | 406 | $124,238 |
| Income Deficit | 223 | $0 |
| Wage / Income Gap (%) | 775 | 30.52% |
| Wage / Income Gap ($) | 775 | 69.48¢ per $1 |
| Gini / Inequality Index | 775 | 0.52 |
Earnings by Sex in North Topsail Beach
Average Earnings in North Topsail Beach are $47,386, $34,643 for men and $49,861 for women, a difference of 30.5%.
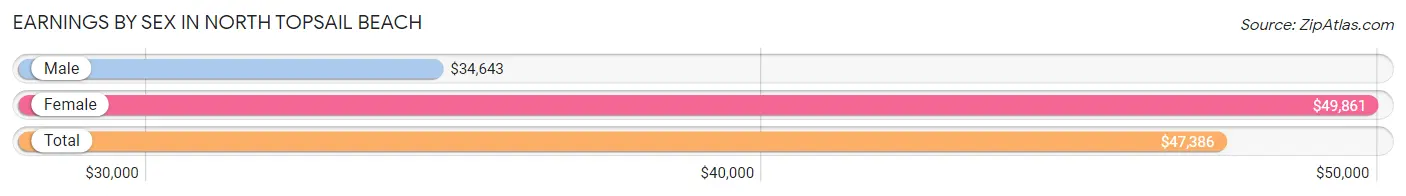
| Sex | Number | Average Earnings |
| Male | 252 (59.0%) | $34,643 |
| Female | 175 (41.0%) | $49,861 |
| Total | 427 (100.0%) | $47,386 |
Earnings by Sex by Income Bracket in North Topsail Beach
The most common earnings brackets in North Topsail Beach are $100,000+ for men (62 | 24.6%) and $100,000+ for women (47 | 26.9%).
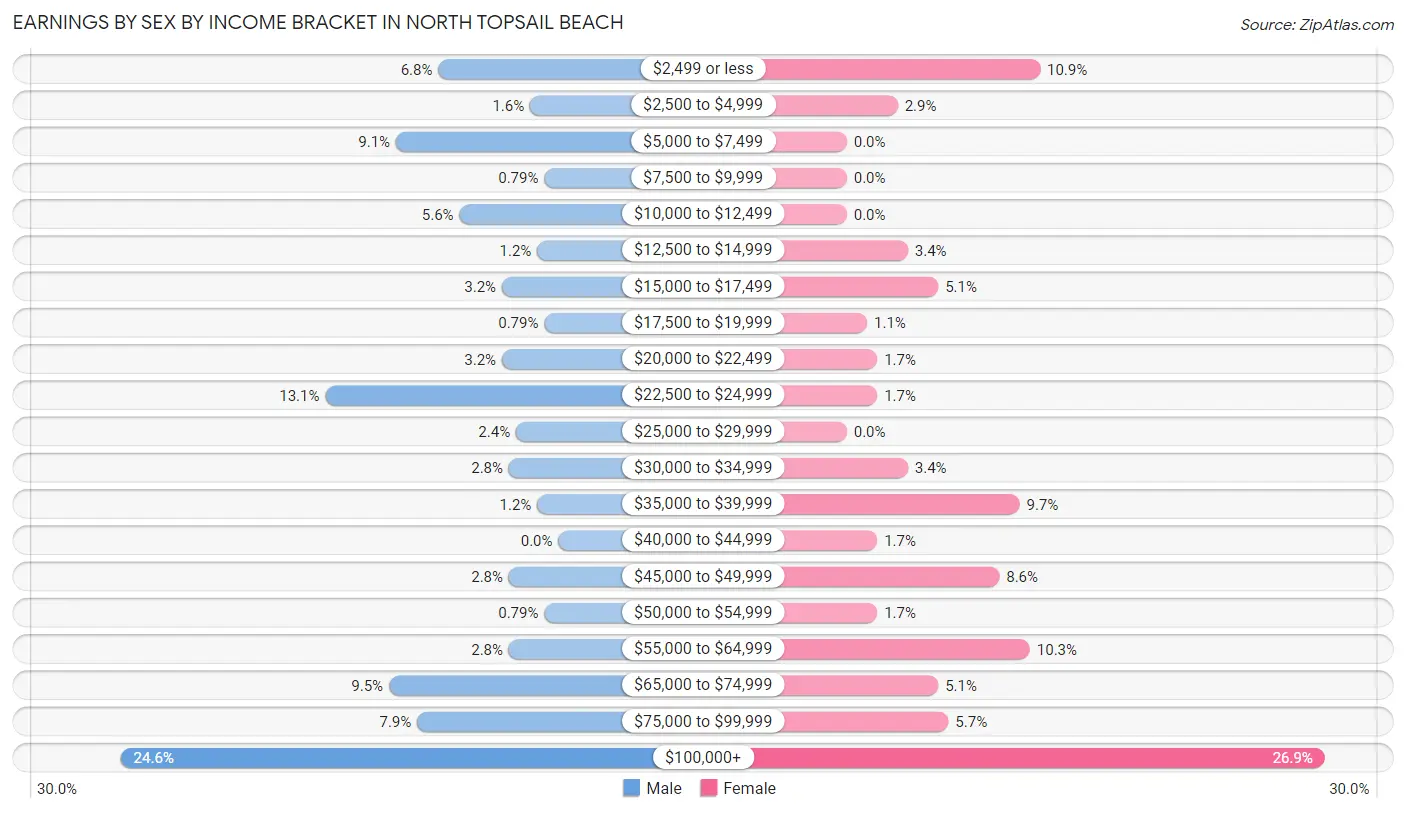
| Income | Male | Female |
| $2,499 or less | 17 (6.8%) | 19 (10.9%) |
| $2,500 to $4,999 | 4 (1.6%) | 5 (2.9%) |
| $5,000 to $7,499 | 23 (9.1%) | 0 (0.0%) |
| $7,500 to $9,999 | 2 (0.8%) | 0 (0.0%) |
| $10,000 to $12,499 | 14 (5.6%) | 0 (0.0%) |
| $12,500 to $14,999 | 3 (1.2%) | 6 (3.4%) |
| $15,000 to $17,499 | 8 (3.2%) | 9 (5.1%) |
| $17,500 to $19,999 | 2 (0.8%) | 2 (1.1%) |
| $20,000 to $22,499 | 8 (3.2%) | 3 (1.7%) |
| $22,500 to $24,999 | 33 (13.1%) | 3 (1.7%) |
| $25,000 to $29,999 | 6 (2.4%) | 0 (0.0%) |
| $30,000 to $34,999 | 7 (2.8%) | 6 (3.4%) |
| $35,000 to $39,999 | 3 (1.2%) | 17 (9.7%) |
| $40,000 to $44,999 | 0 (0.0%) | 3 (1.7%) |
| $45,000 to $49,999 | 7 (2.8%) | 15 (8.6%) |
| $50,000 to $54,999 | 2 (0.8%) | 3 (1.7%) |
| $55,000 to $64,999 | 7 (2.8%) | 18 (10.3%) |
| $65,000 to $74,999 | 24 (9.5%) | 9 (5.1%) |
| $75,000 to $99,999 | 20 (7.9%) | 10 (5.7%) |
| $100,000+ | 62 (24.6%) | 47 (26.9%) |
| Total | 252 (100.0%) | 175 (100.0%) |
Earnings by Sex by Educational Attainment in North Topsail Beach
Average earnings in North Topsail Beach are $65,729 for men and $53,750 for women, a difference of 18.2%. Men with an educational attainment of graduate degree enjoy the highest average annual earnings of $145,000, while those with high school diploma education earn the least with $68,125. Women with an educational attainment of graduate degree earn the most with the average annual earnings of $77,917, while those with graduate degree education have the smallest earnings of $77,917.
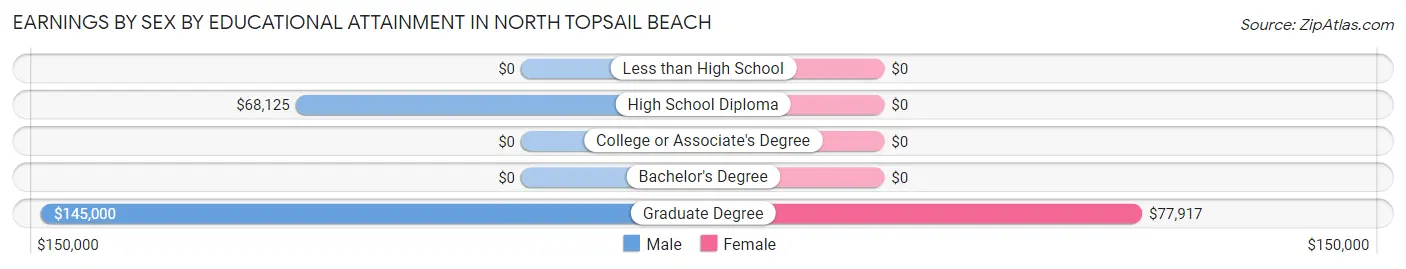
| Educational Attainment | Male Income | Female Income |
| Less than High School | - | - |
| High School Diploma | $68,125 | $0 |
| College or Associate's Degree | - | - |
| Bachelor's Degree | - | - |
| Graduate Degree | $145,000 | $77,917 |
| Total | $65,729 | $53,750 |
Family Income in North Topsail Beach
Family Income Brackets in North Topsail Beach
According to the North Topsail Beach family income data, there are 62 families falling into the $100,000 to $149,999 income range, which is the most common income bracket and makes up 27.8% of all families.
| Income Bracket | # Families | % Families |
| Less than $10,000 | 3 | 1.3% |
| $10,000 to $14,999 | 0 | 0.0% |
| $15,000 to $24,999 | 8 | 3.6% |
| $25,000 to $34,999 | 22 | 9.9% |
| $35,000 to $49,999 | 11 | 4.9% |
| $50,000 to $74,999 | 37 | 16.6% |
| $75,000 to $99,999 | 12 | 5.4% |
| $100,000 to $149,999 | 62 | 27.8% |
| $150,000 to $199,999 | 27 | 12.1% |
| $200,000+ | 41 | 18.4% |
Family Income by Famaliy Size in North Topsail Beach
2-person families (181 | 81.2%) account for the highest median family income in North Topsail Beach with $122,969 per family, while 2-person families (181 | 81.2%) have the highest median income of $61,484 per family member.
| Income Bracket | # Families | Median Income |
| 2-Person Families | 181 (81.2%) | $122,969 |
| 3-Person Families | 34 (15.2%) | $102,500 |
| 4-Person Families | 8 (3.6%) | $0 |
| 5-Person Families | 0 (0.0%) | $0 |
| 6-Person Families | 0 (0.0%) | $0 |
| 7+ Person Families | 0 (0.0%) | $0 |
| Total | 223 (100.0%) | $116,719 |
Family Income by Number of Earners in North Topsail Beach
| Number of Earners | # Families | Median Income |
| No Earners | 52 (23.3%) | $73,750 |
| 1 Earner | 74 (33.2%) | $123,438 |
| 2 Earners | 97 (43.5%) | $125,417 |
| 3+ Earners | 0 (0.0%) | $0 |
| Total | 223 (100.0%) | $116,719 |
Household Income in North Topsail Beach
Household Income Brackets in North Topsail Beach
With 90 households falling in the category, the $100,000 to $149,999 income range is the most frequent in North Topsail Beach, accounting for 22.2% of all households. In contrast, only 5 households (1.2%) fall into the $10,000 to $14,999 income bracket, making it the least populous group.
| Income Bracket | # Households | % Households |
| Less than $10,000 | 22 | 5.4% |
| $10,000 to $14,999 | 5 | 1.2% |
| $15,000 to $24,999 | 28 | 6.9% |
| $25,000 to $34,999 | 49 | 12.1% |
| $35,000 to $49,999 | 25 | 6.2% |
| $50,000 to $74,999 | 64 | 15.8% |
| $75,000 to $99,999 | 27 | 6.7% |
| $100,000 to $149,999 | 90 | 22.2% |
| $150,000 to $199,999 | 38 | 9.4% |
| $200,000+ | 58 | 14.3% |
Household Income by Householder Age in North Topsail Beach
The median household income in North Topsail Beach is $82,857, with the highest median household income of $115,469 found in the 25 to 44 years age bracket for the primary householder. A total of 47 households (11.6%) fall into this category. Meanwhile, the 15 to 24 years age bracket for the primary householder has the lowest median household income of $0, with 4 households (1.0%) in this group.
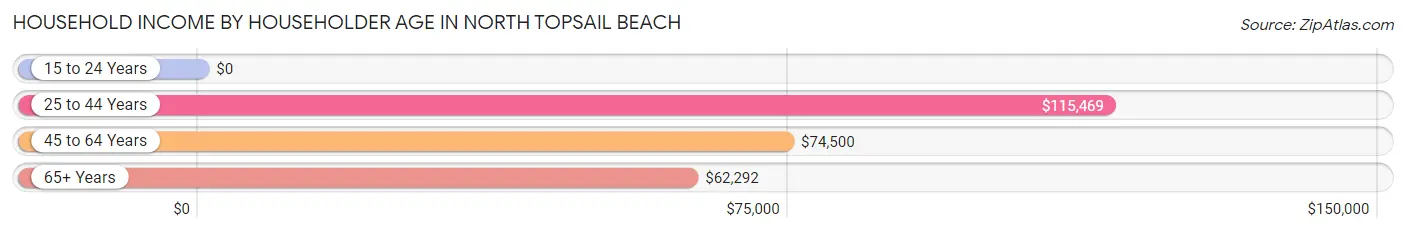
| Income Bracket | # Households | Median Income |
| 15 to 24 Years | 4 (1.0%) | $0 |
| 25 to 44 Years | 47 (11.6%) | $115,469 |
| 45 to 64 Years | 174 (42.9%) | $74,500 |
| 65+ Years | 181 (44.6%) | $62,292 |
| Total | 406 (100.0%) | $82,857 |
Poverty in North Topsail Beach
Income Below Poverty by Sex and Age in North Topsail Beach
With 5.7% poverty level for males and 13.3% for females among the residents of North Topsail Beach, 45 to 54 year old males and 35 to 44 year old females are the most vulnerable to poverty, with 15 males (38.5%) and 12 females (34.3%) in their respective age groups living below the poverty level.
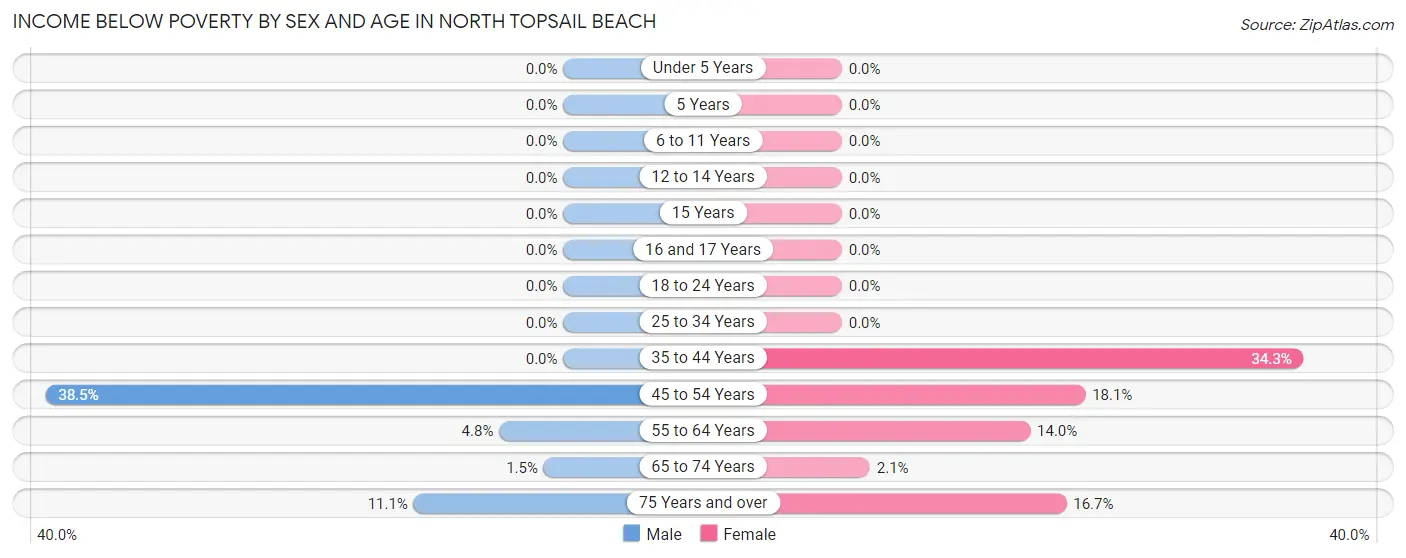
| Age Bracket | Male | Female |
| Under 5 Years | 0 (0.0%) | 0 (0.0%) |
| 5 Years | 0 (0.0%) | 0 (0.0%) |
| 6 to 11 Years | 0 (0.0%) | 0 (0.0%) |
| 12 to 14 Years | 0 (0.0%) | 0 (0.0%) |
| 15 Years | 0 (0.0%) | 0 (0.0%) |
| 16 and 17 Years | 0 (0.0%) | 0 (0.0%) |
| 18 to 24 Years | 0 (0.0%) | 0 (0.0%) |
| 25 to 34 Years | 0 (0.0%) | 0 (0.0%) |
| 35 to 44 Years | 0 (0.0%) | 12 (34.3%) |
| 45 to 54 Years | 15 (38.5%) | 15 (18.1%) |
| 55 to 64 Years | 4 (4.8%) | 13 (14.0%) |
| 65 to 74 Years | 2 (1.5%) | 2 (2.1%) |
| 75 Years and over | 3 (11.1%) | 5 (16.7%) |
| Total | 24 (5.7%) | 47 (13.3%) |
Income Above Poverty by Sex and Age in North Topsail Beach
According to the poverty statistics in North Topsail Beach, males aged 6 to 11 years and females aged under 5 years are the age groups that are most secure financially, with 100.0% of males and 100.0% of females in these age groups living above the poverty line.
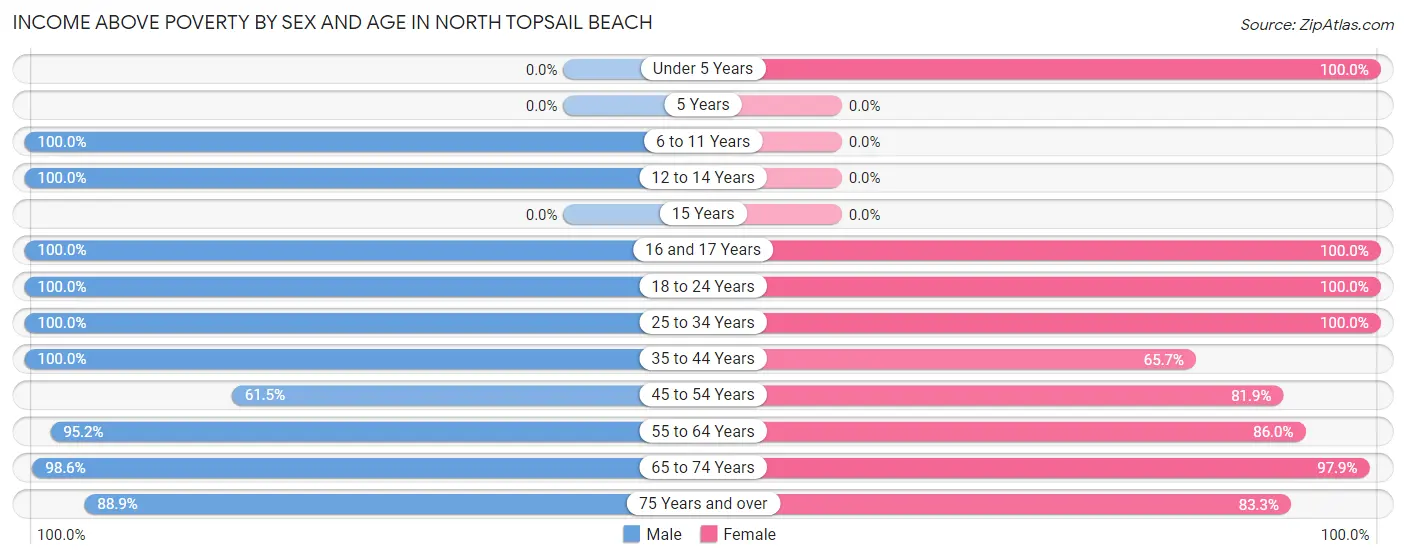
| Age Bracket | Male | Female |
| Under 5 Years | 0 (0.0%) | 3 (100.0%) |
| 5 Years | 0 (0.0%) | 0 (0.0%) |
| 6 to 11 Years | 19 (100.0%) | 0 (0.0%) |
| 12 to 14 Years | 10 (100.0%) | 0 (0.0%) |
| 15 Years | 0 (0.0%) | 0 (0.0%) |
| 16 and 17 Years | 10 (100.0%) | 3 (100.0%) |
| 18 to 24 Years | 47 (100.0%) | 4 (100.0%) |
| 25 to 34 Years | 14 (100.0%) | 6 (100.0%) |
| 35 to 44 Years | 34 (100.0%) | 23 (65.7%) |
| 45 to 54 Years | 24 (61.5%) | 68 (81.9%) |
| 55 to 64 Years | 80 (95.2%) | 80 (86.0%) |
| 65 to 74 Years | 136 (98.6%) | 94 (97.9%) |
| 75 Years and over | 24 (88.9%) | 25 (83.3%) |
| Total | 398 (94.3%) | 306 (86.7%) |
Income Below Poverty Among Married-Couple Families in North Topsail Beach
The poverty statistics for married-couple families in North Topsail Beach show that 1.6% or 3 of the total 190 families live below the poverty line. Families with no children have the highest poverty rate of 1.7%, comprising of 3 families. On the other hand, families with 1 or 2 children have the lowest poverty rate of 0.0%, which includes 0 families.
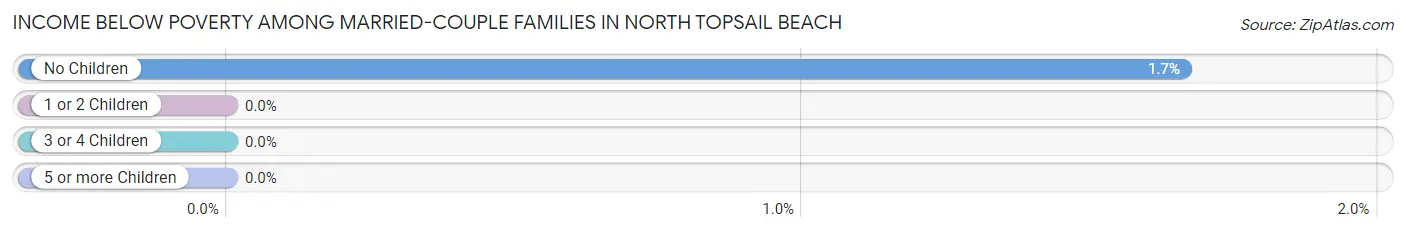
| Children | Above Poverty | Below Poverty |
| No Children | 178 (98.3%) | 3 (1.7%) |
| 1 or 2 Children | 9 (100.0%) | 0 (0.0%) |
| 3 or 4 Children | 0 (0.0%) | 0 (0.0%) |
| 5 or more Children | 0 (0.0%) | 0 (0.0%) |
| Total | 187 (98.4%) | 3 (1.6%) |
Income Below Poverty Among Single-Parent Households in North Topsail Beach
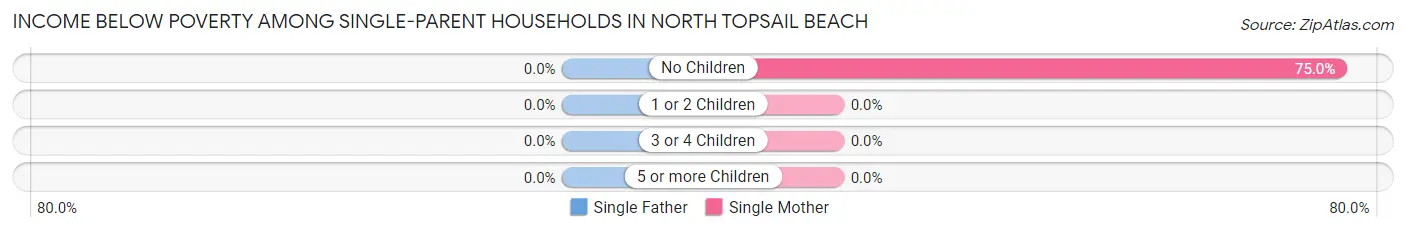
| Children | Single Father | Single Mother |
| No Children | 0 (0.0%) | 6 (75.0%) |
| 1 or 2 Children | 0 (0.0%) | 0 (0.0%) |
| 3 or 4 Children | 0 (0.0%) | 0 (0.0%) |
| 5 or more Children | 0 (0.0%) | 0 (0.0%) |
| Total | 0 (0.0%) | 6 (26.1%) |
Income Below Poverty Among Married-Couple vs Single-Parent Households in North Topsail Beach
The poverty data for North Topsail Beach shows that 3 of the married-couple family households (1.6%) and 6 of the single-parent households (18.2%) are living below the poverty level. Within the married-couple family households, those with no children have the highest poverty rate, with 3 households (1.7%) falling below the poverty line. Among the single-parent households, those with no children have the highest poverty rate, with 6 household (75.0%) living below poverty.
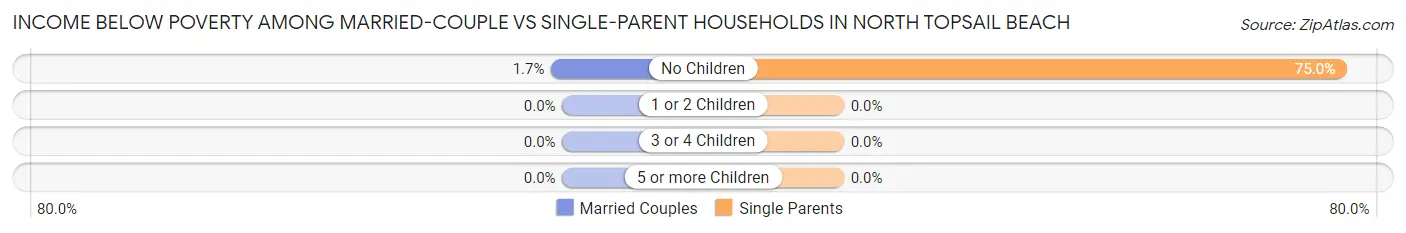
| Children | Married-Couple Families | Single-Parent Households |
| No Children | 3 (1.7%) | 6 (75.0%) |
| 1 or 2 Children | 0 (0.0%) | 0 (0.0%) |
| 3 or 4 Children | 0 (0.0%) | 0 (0.0%) |
| 5 or more Children | 0 (0.0%) | 0 (0.0%) |
| Total | 3 (1.6%) | 6 (18.2%) |
Race in North Topsail Beach
The most populous races in North Topsail Beach are White / Caucasian (710 | 91.6%), Two or more Races (41 | 5.3%), and Black / African American (20 | 2.6%).
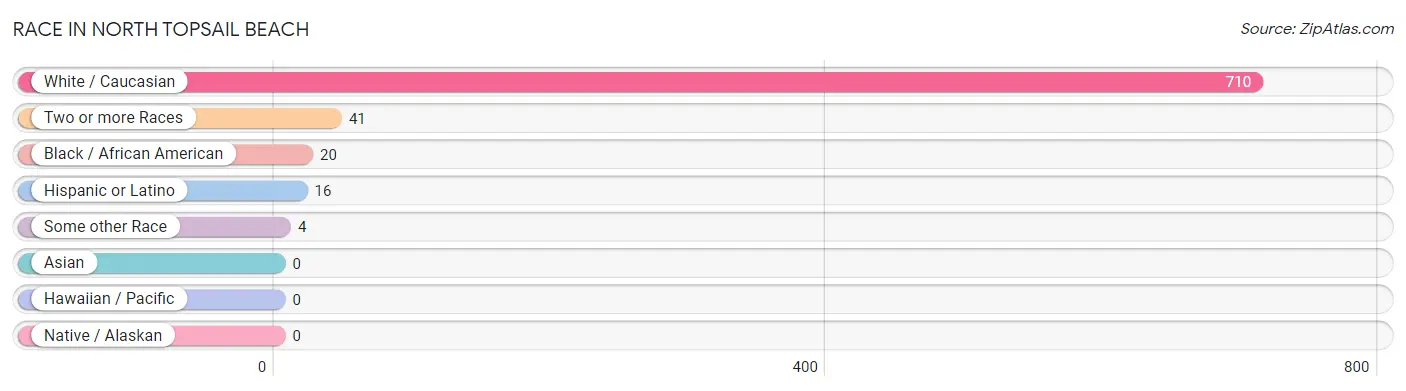
| Race | # Population | % Population |
| Asian | 0 | 0.0% |
| Black / African American | 20 | 2.6% |
| Hawaiian / Pacific | 0 | 0.0% |
| Hispanic or Latino | 16 | 2.1% |
| Native / Alaskan | 0 | 0.0% |
| White / Caucasian | 710 | 91.6% |
| Two or more Races | 41 | 5.3% |
| Some other Race | 4 | 0.5% |
| Total | 775 | 100.0% |
Ancestry in North Topsail Beach
The most populous ancestries reported in North Topsail Beach are Irish (180 | 23.2%), German (143 | 18.4%), English (138 | 17.8%), Scottish (48 | 6.2%), and Italian (40 | 5.2%), together accounting for 70.8% of all North Topsail Beach residents.
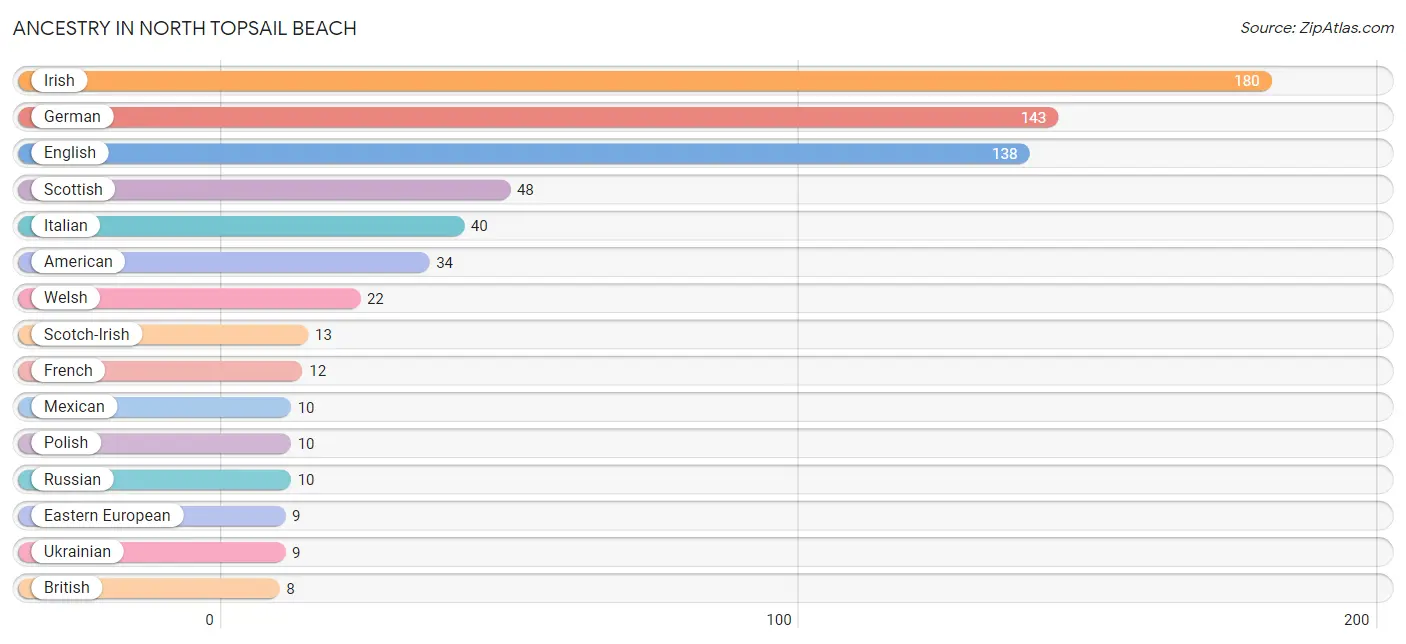
| Ancestry | # Population | % Population |
| American | 34 | 4.4% |
| Apache | 4 | 0.5% |
| British | 8 | 1.0% |
| Burmese | 3 | 0.4% |
| Cajun | 8 | 1.0% |
| Cuban | 6 | 0.8% |
| Czech | 7 | 0.9% |
| Eastern European | 9 | 1.2% |
| English | 138 | 17.8% |
| European | 7 | 0.9% |
| French | 12 | 1.5% |
| French American Indian | 5 | 0.6% |
| French Canadian | 7 | 0.9% |
| German | 143 | 18.4% |
| Hungarian | 6 | 0.8% |
| Indian (Asian) | 2 | 0.3% |
| Irish | 180 | 23.2% |
| Italian | 40 | 5.2% |
| Lithuanian | 5 | 0.6% |
| Mexican | 10 | 1.3% |
| Norwegian | 3 | 0.4% |
| Pennsylvania German | 2 | 0.3% |
| Polish | 10 | 1.3% |
| Romanian | 3 | 0.4% |
| Russian | 10 | 1.3% |
| Scotch-Irish | 13 | 1.7% |
| Scottish | 48 | 6.2% |
| Slovak | 4 | 0.5% |
| Swedish | 3 | 0.4% |
| Swiss | 2 | 0.3% |
| Ukrainian | 9 | 1.2% |
| Welsh | 22 | 2.8% | View All 32 Rows |
Immigrants in North Topsail Beach
The most numerous immigrant groups reported in North Topsail Beach came from Europe (7 | 0.9%), Eastern Europe (5 | 0.6%), Lithuania (5 | 0.6%), Germany (2 | 0.3%), and Western Europe (2 | 0.3%), together accounting for 2.7% of all North Topsail Beach residents.
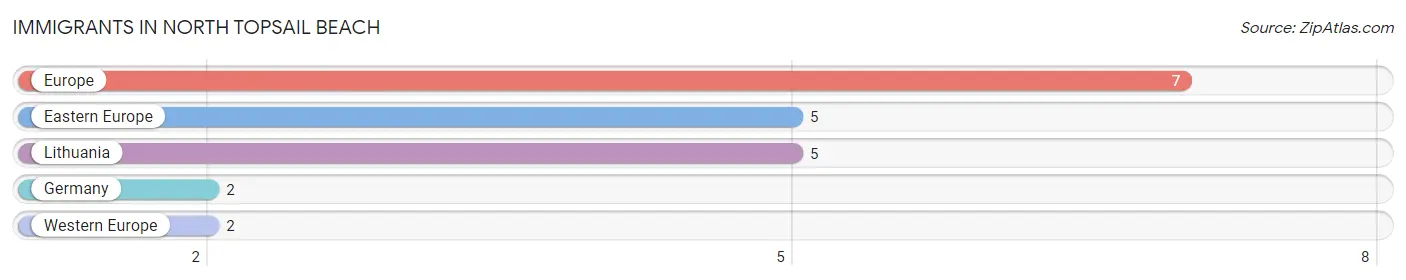
| Immigration Origin | # Population | % Population |
| Eastern Europe | 5 | 0.6% |
| Europe | 7 | 0.9% |
| Germany | 2 | 0.3% |
| Lithuania | 5 | 0.6% |
| Western Europe | 2 | 0.3% | View All 5 Rows |
Sex and Age in North Topsail Beach
Sex and Age in North Topsail Beach
The most populous age groups in North Topsail Beach are 65 to 69 Years (91 | 21.6%) for men and 65 to 69 Years (72 | 20.4%) for women.
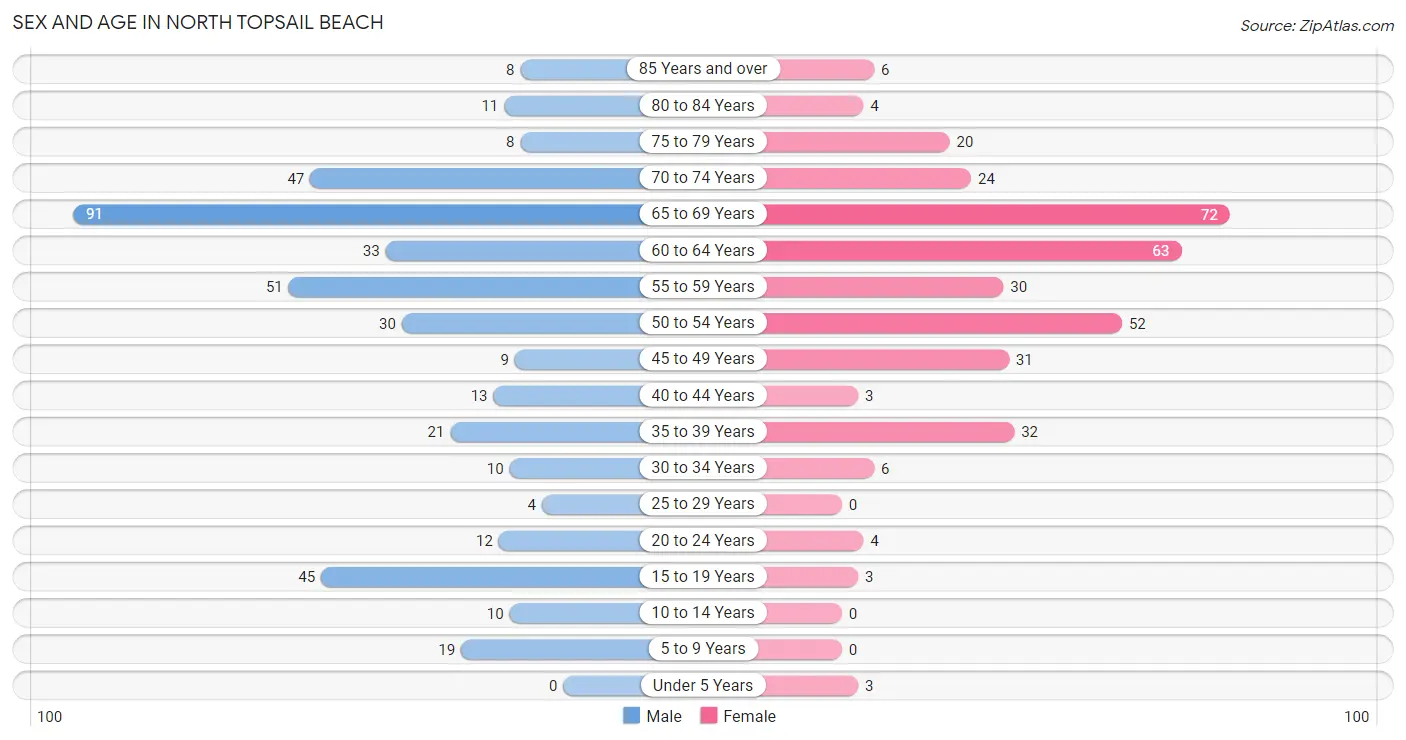
| Age Bracket | Male | Female |
| Under 5 Years | 0 (0.0%) | 3 (0.9%) |
| 5 to 9 Years | 19 (4.5%) | 0 (0.0%) |
| 10 to 14 Years | 10 (2.4%) | 0 (0.0%) |
| 15 to 19 Years | 45 (10.7%) | 3 (0.9%) |
| 20 to 24 Years | 12 (2.8%) | 4 (1.1%) |
| 25 to 29 Years | 4 (0.9%) | 0 (0.0%) |
| 30 to 34 Years | 10 (2.4%) | 6 (1.7%) |
| 35 to 39 Years | 21 (5.0%) | 32 (9.1%) |
| 40 to 44 Years | 13 (3.1%) | 3 (0.9%) |
| 45 to 49 Years | 9 (2.1%) | 31 (8.8%) |
| 50 to 54 Years | 30 (7.1%) | 52 (14.7%) |
| 55 to 59 Years | 51 (12.1%) | 30 (8.5%) |
| 60 to 64 Years | 33 (7.8%) | 63 (17.8%) |
| 65 to 69 Years | 91 (21.6%) | 72 (20.4%) |
| 70 to 74 Years | 47 (11.1%) | 24 (6.8%) |
| 75 to 79 Years | 8 (1.9%) | 20 (5.7%) |
| 80 to 84 Years | 11 (2.6%) | 4 (1.1%) |
| 85 Years and over | 8 (1.9%) | 6 (1.7%) |
| Total | 422 (100.0%) | 353 (100.0%) |
Families and Households in North Topsail Beach
Median Family Size in North Topsail Beach
The median family size in North Topsail Beach is 2.45 persons per family, with single female/mother families (23 | 10.3%) accounting for the largest median family size of 3.52 persons per family. On the other hand, married-couple families (190 | 85.2%) represent the smallest median family size with 2.30 persons per family.
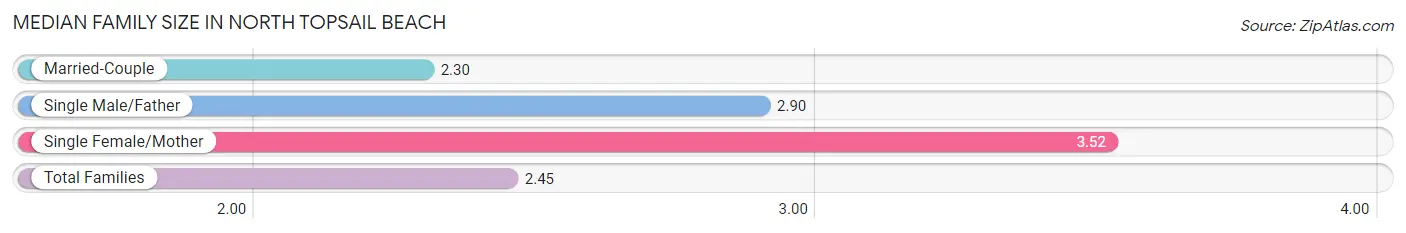
| Family Type | # Families | Family Size |
| Married-Couple | 190 (85.2%) | 2.30 |
| Single Male/Father | 10 (4.5%) | 2.90 |
| Single Female/Mother | 23 (10.3%) | 3.52 |
| Total Families | 223 (100.0%) | 2.45 |
Median Household Size in North Topsail Beach
The median household size in North Topsail Beach is 1.91 persons per household, with single female/mother households (23 | 5.7%) accounting for the largest median household size of 3.61 persons per household. non-family households (183 | 45.1%) represent the smallest median household size with 1.23 persons per household.
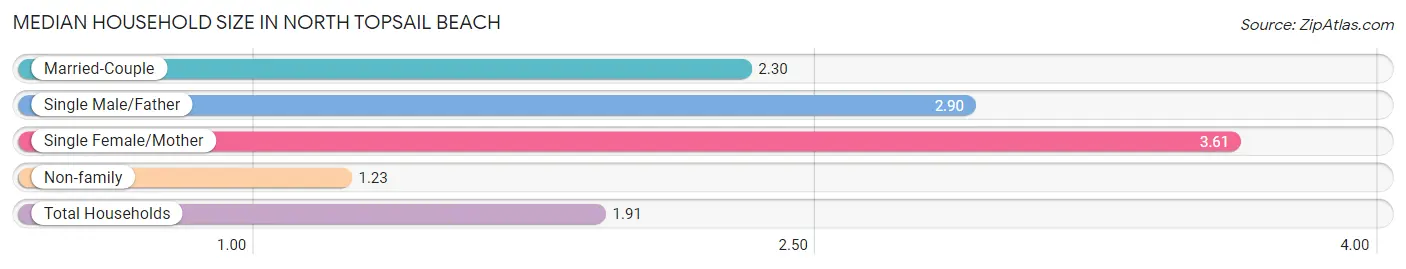
| Household Type | # Households | Household Size |
| Married-Couple | 190 (46.8%) | 2.30 |
| Single Male/Father | 10 (2.5%) | 2.90 |
| Single Female/Mother | 23 (5.7%) | 3.61 |
| Non-family | 183 (45.1%) | 1.23 |
| Total Households | 406 (100.0%) | 1.91 |
Household Size by Marriage Status in North Topsail Beach
Out of a total of 406 households in North Topsail Beach, 223 (54.9%) are family households, while 183 (45.1%) are nonfamily households. The most numerous type of family households are 2-person households, comprising 179, and the most common type of nonfamily households are 1-person households, comprising 151.
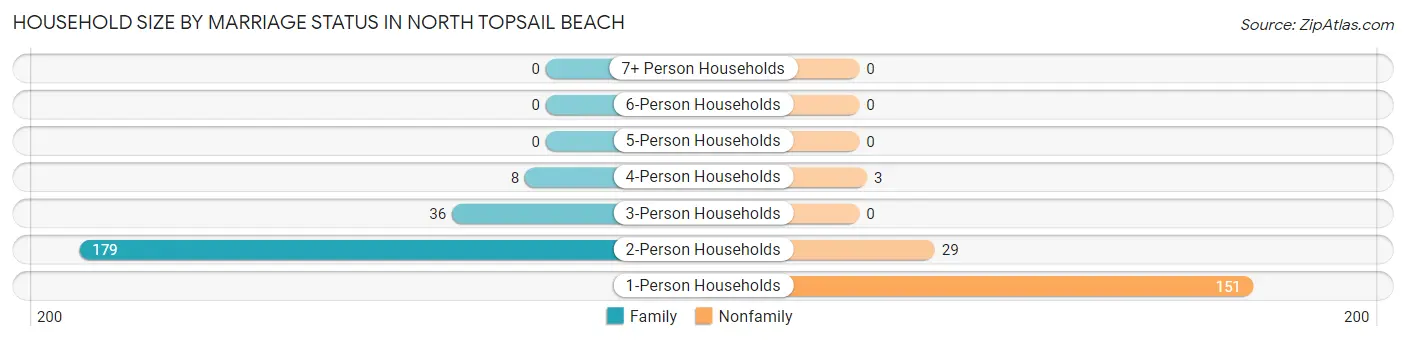
| Household Size | Family Households | Nonfamily Households |
| 1-Person Households | - | 151 (37.2%) |
| 2-Person Households | 179 (44.1%) | 29 (7.1%) |
| 3-Person Households | 36 (8.9%) | 0 (0.0%) |
| 4-Person Households | 8 (2.0%) | 3 (0.7%) |
| 5-Person Households | 0 (0.0%) | 0 (0.0%) |
| 6-Person Households | 0 (0.0%) | 0 (0.0%) |
| 7+ Person Households | 0 (0.0%) | 0 (0.0%) |
| Total | 223 (54.9%) | 183 (45.1%) |
Female Fertility in North Topsail Beach
Fertility by Age in North Topsail Beach
Average fertility rate in North Topsail Beach is 38.0 births per 1,000 women. Women in the age bracket of 20 to 34 years have the highest fertility rate with 300.0 births per 1,000 women. Women in the age bracket of 20 to 34 years acount for 100.0% of all women with births.
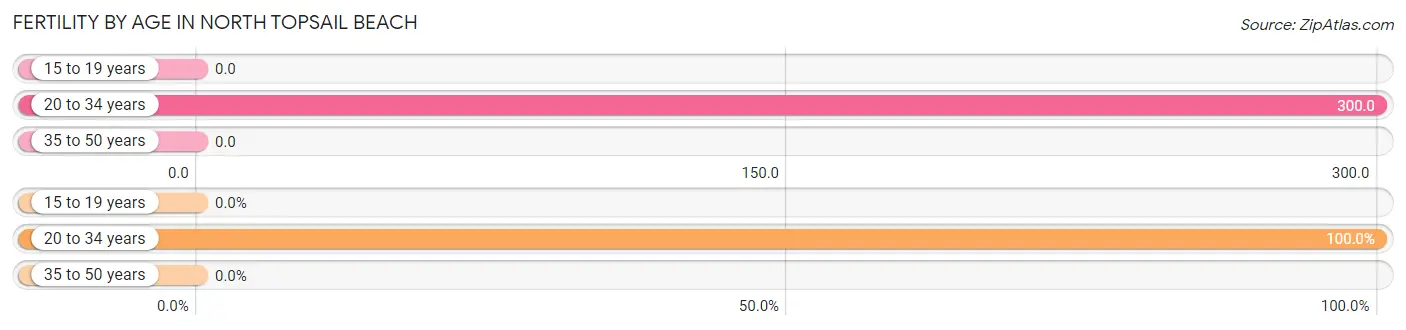
| Age Bracket | Women with Births | Births / 1,000 Women |
| 15 to 19 years | 0 (0.0%) | 0.0 |
| 20 to 34 years | 3 (100.0%) | 300.0 |
| 35 to 50 years | 0 (0.0%) | 0.0 |
| Total | 3 (100.0%) | 38.0 |
Fertility by Age by Marriage Status in North Topsail Beach
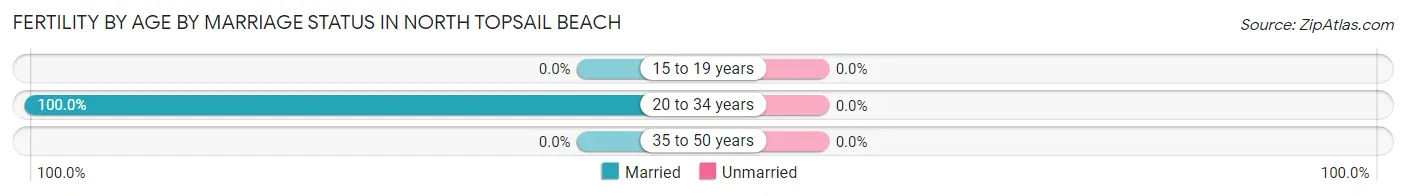
| Age Bracket | Married | Unmarried |
| 15 to 19 years | 0 (0.0%) | 0 (0.0%) |
| 20 to 34 years | 3 (100.0%) | 0 (0.0%) |
| 35 to 50 years | 0 (0.0%) | 0 (0.0%) |
| Total | 3 (100.0%) | 0 (0.0%) |
Fertility by Education in North Topsail Beach
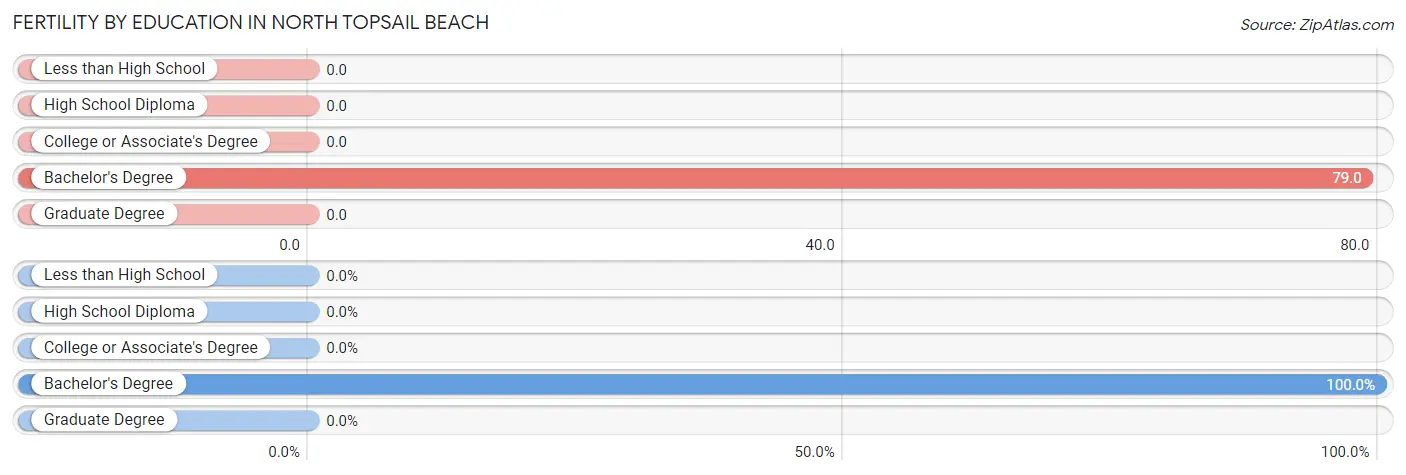
| Educational Attainment | Women with Births | Births / 1,000 Women |
| Less than High School | 0 (0.0%) | 0.0 |
| High School Diploma | 0 (0.0%) | 0.0 |
| College or Associate's Degree | 0 (0.0%) | 0.0 |
| Bachelor's Degree | 3 (100.0%) | 79.0 |
| Graduate Degree | 0 (0.0%) | 0.0 |
| Total | 3 (100.0%) | 38.0 |
Fertility by Education by Marriage Status in North Topsail Beach

| Educational Attainment | Married | Unmarried |
| Less than High School | 0 (0.0%) | 0 (0.0%) |
| High School Diploma | 0 (0.0%) | 0 (0.0%) |
| College or Associate's Degree | 0 (0.0%) | 0 (0.0%) |
| Bachelor's Degree | 3 (100.0%) | 0 (0.0%) |
| Graduate Degree | 0 (0.0%) | 0 (0.0%) |
| Total | 3 (100.0%) | 0 (0.0%) |
Employment Characteristics in North Topsail Beach
Employment by Class of Employer in North Topsail Beach
Among the 345 employed individuals in North Topsail Beach, private company employees (227 | 65.8%), federal government employees (31 | 9.0%), and not-for-profit organizations (30 | 8.7%) make up the most common classes of employment.
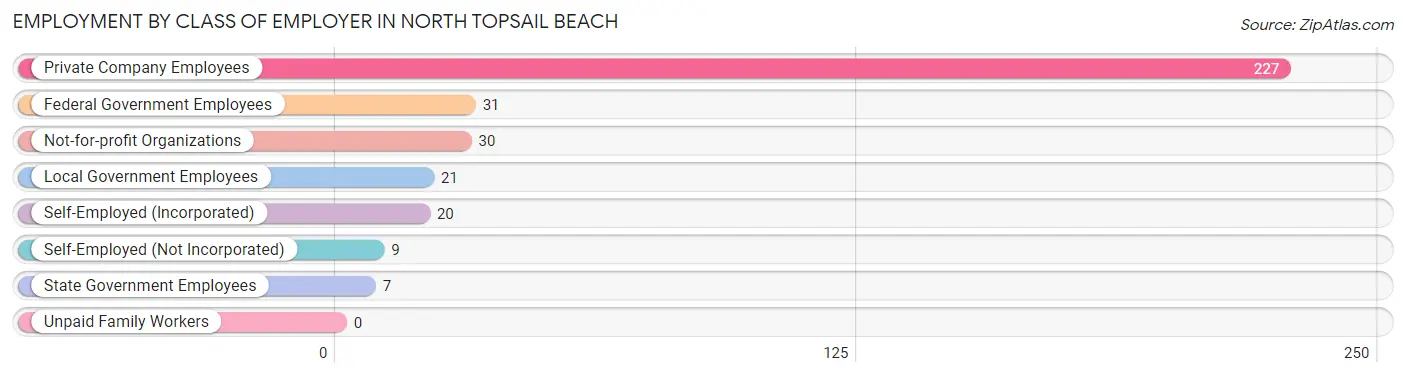
| Employer Class | # Employees | % Employees |
| Private Company Employees | 227 | 65.8% |
| Self-Employed (Incorporated) | 20 | 5.8% |
| Self-Employed (Not Incorporated) | 9 | 2.6% |
| Not-for-profit Organizations | 30 | 8.7% |
| Local Government Employees | 21 | 6.1% |
| State Government Employees | 7 | 2.0% |
| Federal Government Employees | 31 | 9.0% |
| Unpaid Family Workers | 0 | 0.0% |
| Total | 345 | 100.0% |
Employment Status by Age in North Topsail Beach
According to the labor force statistics for North Topsail Beach, out of the total population over 16 years of age (743), 51.5% or 383 individuals are in the labor force, with 8.1% or 31 of them unemployed. The age group with the highest labor force participation rate is 25 to 29 years, with 100.0% or 4 individuals in the labor force. Within the labor force, the 35 to 44 years age range has the highest percentage of unemployed individuals, with 21.3% or 14 of them being unemployed.
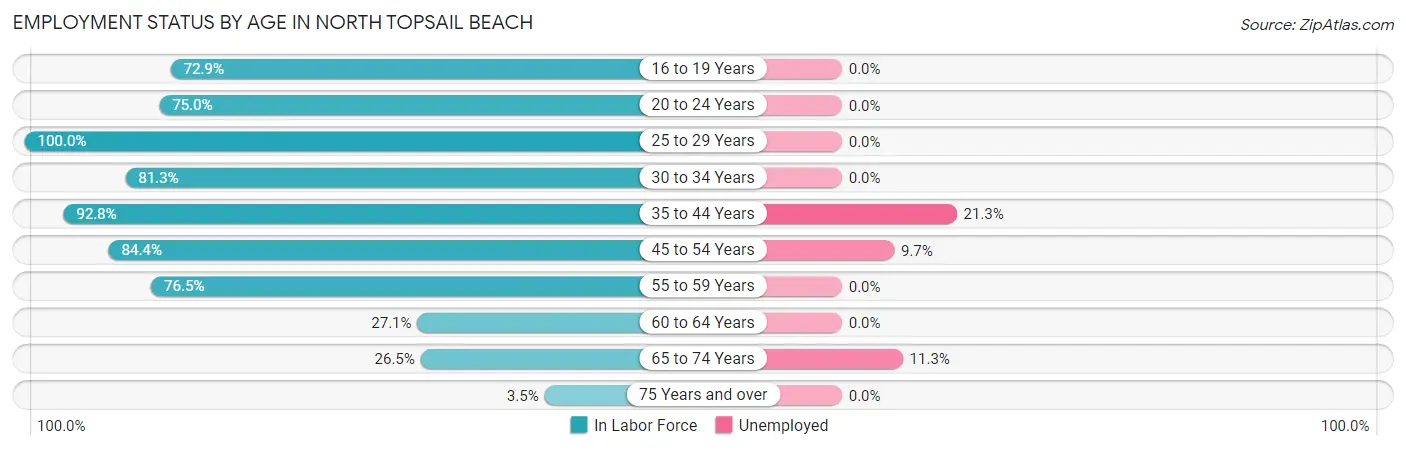
| Age Bracket | In Labor Force | Unemployed |
| 16 to 19 Years | 35 (72.9%) | 0 (0.0%) |
| 20 to 24 Years | 12 (75.0%) | 0 (0.0%) |
| 25 to 29 Years | 4 (100.0%) | 0 (0.0%) |
| 30 to 34 Years | 13 (81.3%) | 0 (0.0%) |
| 35 to 44 Years | 64 (92.8%) | 14 (21.3%) |
| 45 to 54 Years | 103 (84.4%) | 10 (9.7%) |
| 55 to 59 Years | 62 (76.5%) | 0 (0.0%) |
| 60 to 64 Years | 26 (27.1%) | 0 (0.0%) |
| 65 to 74 Years | 62 (26.5%) | 7 (11.3%) |
| 75 Years and over | 2 (3.5%) | 0 (0.0%) |
| Total | 383 (51.5%) | 31 (8.1%) |
Employment Status by Educational Attainment in North Topsail Beach
According to labor force statistics for North Topsail Beach, 70.1% of individuals (272) out of the total population between 25 and 64 years of age (388) are in the labor force, with 8.8% or 24 of them being unemployed. The group with the highest labor force participation rate are those with the educational attainment of college / associate degree, with 75.4% or 98 individuals in the labor force. Within the labor force, individuals with college / associate degree education have the highest percentage of unemployment, with 17.9% or 18 of them being unemployed.
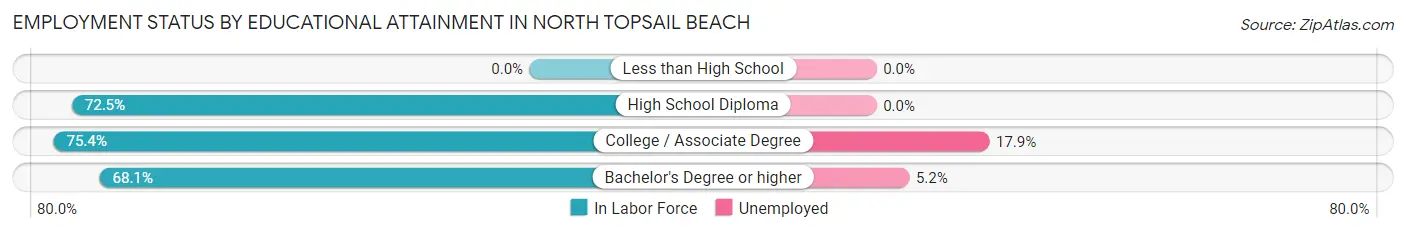
| Educational Attainment | In Labor Force | Unemployed |
| Less than High School | 0 (0.0%) | 0 (0.0%) |
| High School Diploma | 50 (72.5%) | 0 (0.0%) |
| College / Associate Degree | 98 (75.4%) | 23 (17.9%) |
| Bachelor's Degree or higher | 124 (68.1%) | 9 (5.2%) |
| Total | 272 (70.1%) | 34 (8.8%) |
Employment Occupations by Sex in North Topsail Beach
Management, Business, Science and Arts Occupations
The most common Management, Business, Science and Arts occupations in North Topsail Beach are Management (49 | 14.4%), Community & Social Service (42 | 12.3%), Health Diagnosing & Treating (40 | 11.7%), Business & Financial (32 | 9.4%), and Health Technologists (31 | 9.1%).
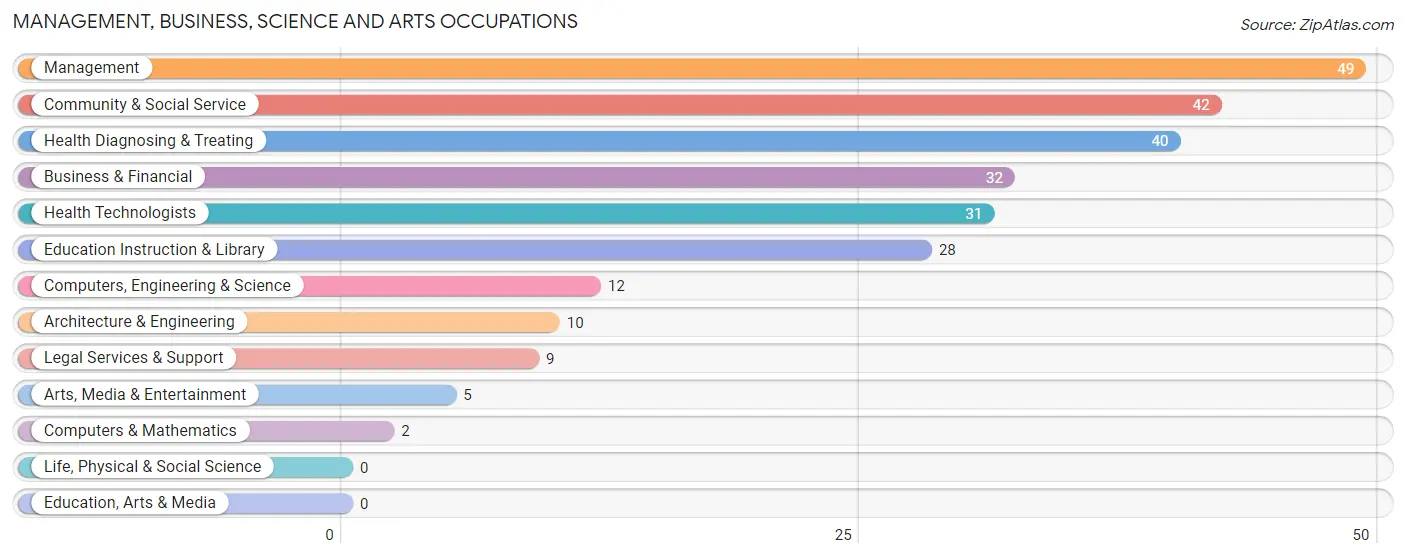
Management, Business, Science and Arts Occupations by Sex
Within the Management, Business, Science and Arts occupations in North Topsail Beach, the most male-oriented occupations are Computers, Engineering & Science (100.0%), Computers & Mathematics (100.0%), and Architecture & Engineering (100.0%), while the most female-oriented occupations are Health Diagnosing & Treating (70.0%), Education Instruction & Library (64.3%), and Business & Financial (62.5%).
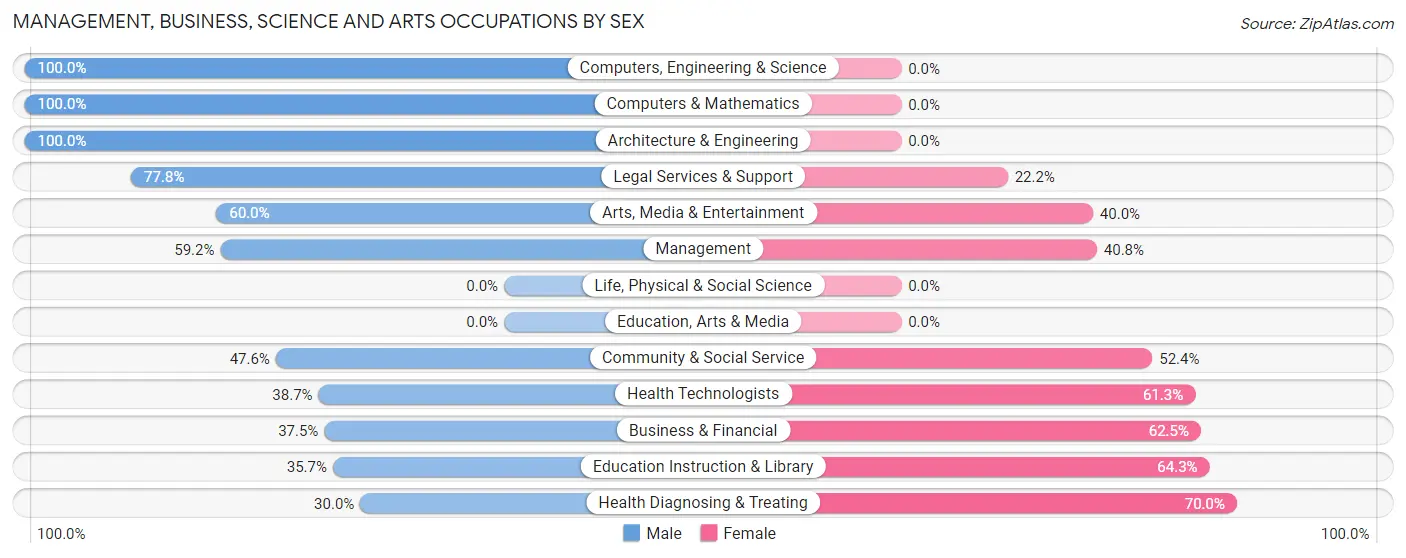
| Occupation | Male | Female |
| Management | 29 (59.2%) | 20 (40.8%) |
| Business & Financial | 12 (37.5%) | 20 (62.5%) |
| Computers, Engineering & Science | 12 (100.0%) | 0 (0.0%) |
| Computers & Mathematics | 2 (100.0%) | 0 (0.0%) |
| Architecture & Engineering | 10 (100.0%) | 0 (0.0%) |
| Life, Physical & Social Science | 0 (0.0%) | 0 (0.0%) |
| Community & Social Service | 20 (47.6%) | 22 (52.4%) |
| Education, Arts & Media | 0 (0.0%) | 0 (0.0%) |
| Legal Services & Support | 7 (77.8%) | 2 (22.2%) |
| Education Instruction & Library | 10 (35.7%) | 18 (64.3%) |
| Arts, Media & Entertainment | 3 (60.0%) | 2 (40.0%) |
| Health Diagnosing & Treating | 12 (30.0%) | 28 (70.0%) |
| Health Technologists | 12 (38.7%) | 19 (61.3%) |
| Total (Category) | 85 (48.6%) | 90 (51.4%) |
| Total (Overall) | 196 (57.5%) | 145 (42.5%) |
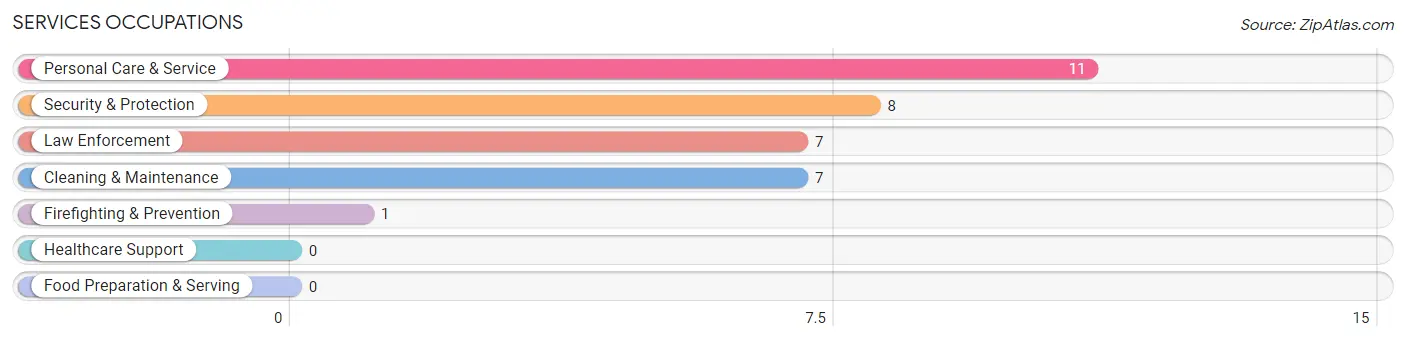
Services Occupations
The most common Services occupations in North Topsail Beach are Personal Care & Service (11 | 3.2%), Security & Protection (8 | 2.4%), Law Enforcement (7 | 2.1%), Cleaning & Maintenance (7 | 2.1%), and Firefighting & Prevention (1 | 0.3%).
Services Occupations by Sex
Within the Services occupations in North Topsail Beach, the most male-oriented occupations are Firefighting & Prevention (100.0%), Personal Care & Service (63.6%), and Cleaning & Maintenance (42.9%), while the most female-oriented occupations are Law Enforcement (100.0%), Security & Protection (87.5%), and Cleaning & Maintenance (57.1%).
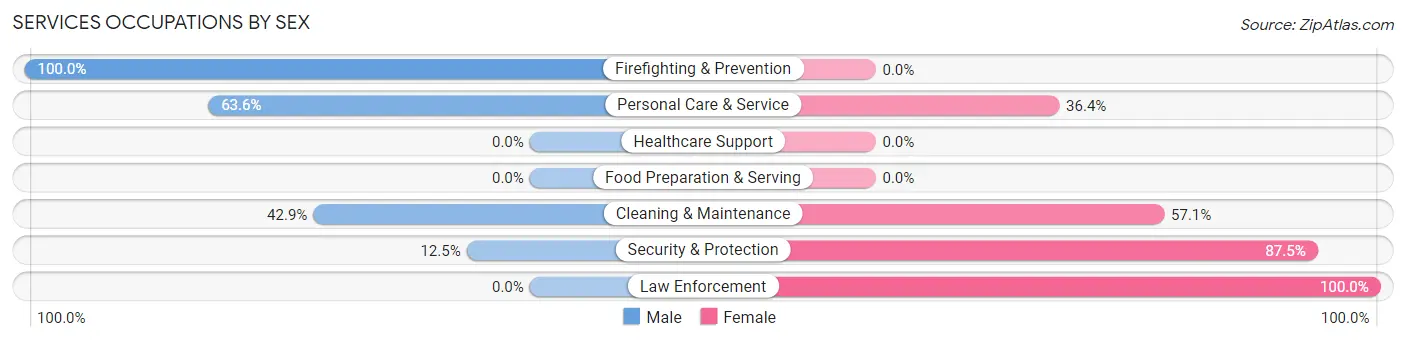
| Occupation | Male | Female |
| Healthcare Support | 0 (0.0%) | 0 (0.0%) |
| Security & Protection | 1 (12.5%) | 7 (87.5%) |
| Firefighting & Prevention | 1 (100.0%) | 0 (0.0%) |
| Law Enforcement | 0 (0.0%) | 7 (100.0%) |
| Food Preparation & Serving | 0 (0.0%) | 0 (0.0%) |
| Cleaning & Maintenance | 3 (42.9%) | 4 (57.1%) |
| Personal Care & Service | 7 (63.6%) | 4 (36.4%) |
| Total (Category) | 11 (42.3%) | 15 (57.7%) |
| Total (Overall) | 196 (57.5%) | 145 (42.5%) |
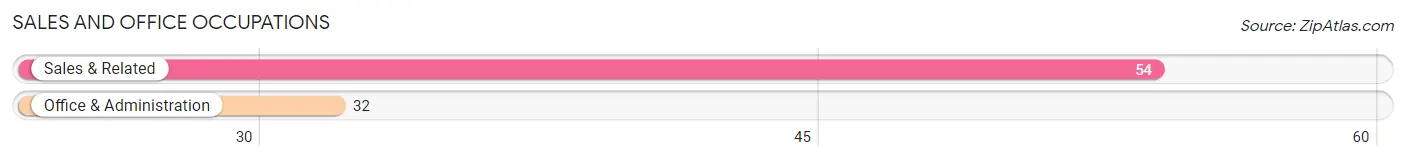
Sales and Office Occupations
The most common Sales and Office occupations in North Topsail Beach are Sales & Related (54 | 15.8%), and Office & Administration (32 | 9.4%).
Sales and Office Occupations by Sex
| Occupation | Male | Female |
| Sales & Related | 45 (83.3%) | 9 (16.7%) |
| Office & Administration | 7 (21.9%) | 25 (78.1%) |
| Total (Category) | 52 (60.5%) | 34 (39.5%) |
| Total (Overall) | 196 (57.5%) | 145 (42.5%) |
Natural Resources, Construction and Maintenance Occupations
The most common Natural Resources, Construction and Maintenance occupations in North Topsail Beach are Installation, Maintenance & Repair (6 | 1.8%), and Construction & Extraction (2 | 0.6%).
Natural Resources, Construction and Maintenance Occupations by Sex
| Occupation | Male | Female |
| Farming, Fishing & Forestry | 0 (0.0%) | 0 (0.0%) |
| Construction & Extraction | 2 (100.0%) | 0 (0.0%) |
| Installation, Maintenance & Repair | 6 (100.0%) | 0 (0.0%) |
| Total (Category) | 8 (100.0%) | 0 (0.0%) |
| Total (Overall) | 196 (57.5%) | 145 (42.5%) |
Production, Transportation and Moving Occupations
The most common Production, Transportation and Moving occupations in North Topsail Beach are Material Moving (38 | 11.1%), Production (5 | 1.5%), and Transportation (3 | 0.9%).
Production, Transportation and Moving Occupations by Sex
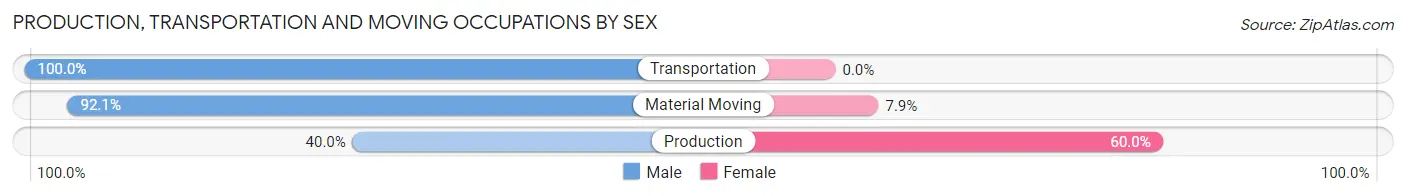
| Occupation | Male | Female |
| Production | 2 (40.0%) | 3 (60.0%) |
| Transportation | 3 (100.0%) | 0 (0.0%) |
| Material Moving | 35 (92.1%) | 3 (7.9%) |
| Total (Category) | 40 (87.0%) | 6 (13.0%) |
| Total (Overall) | 196 (57.5%) | 145 (42.5%) |
Employment Industries by Sex in North Topsail Beach
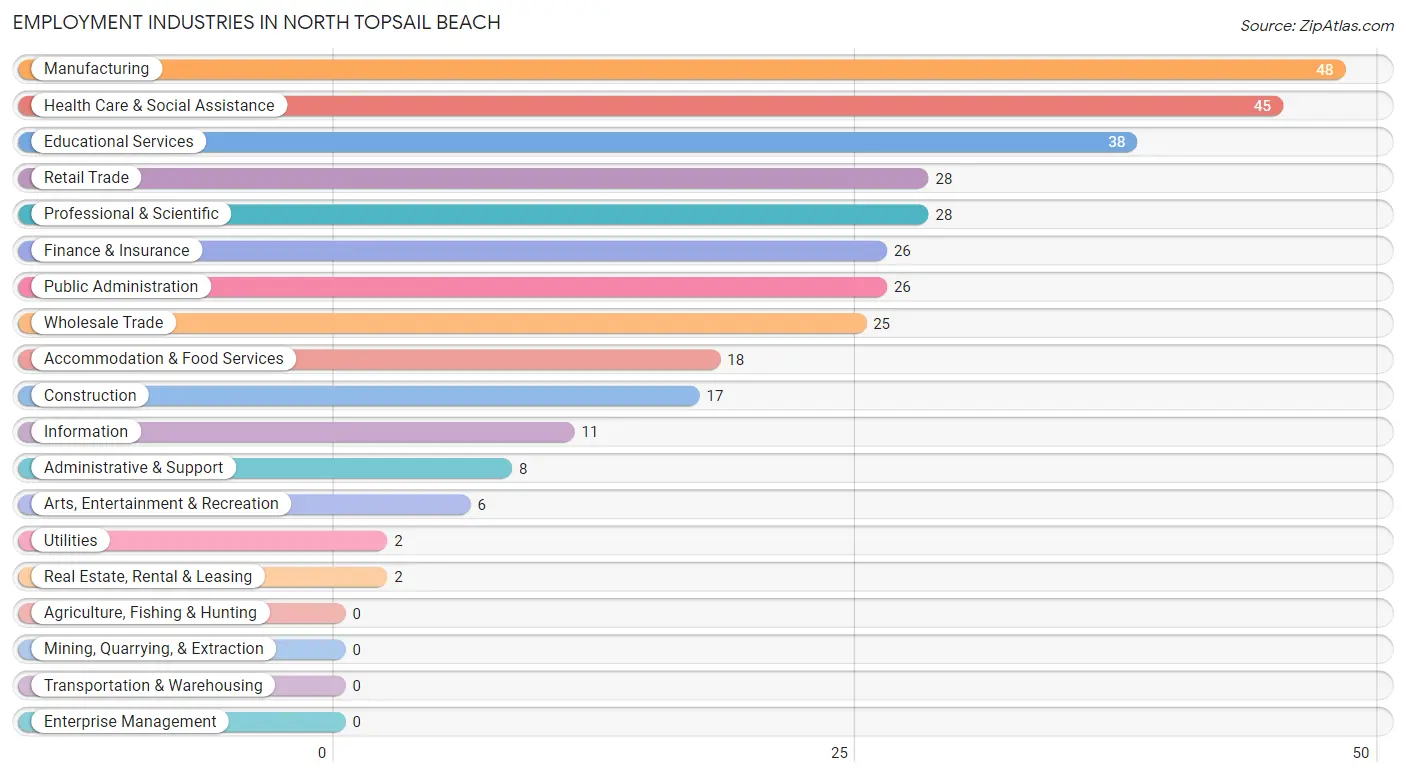
Employment Industries in North Topsail Beach
The major employment industries in North Topsail Beach include Manufacturing (48 | 14.1%), Health Care & Social Assistance (45 | 13.2%), Educational Services (38 | 11.1%), Retail Trade (28 | 8.2%), and Professional & Scientific (28 | 8.2%).
Employment Industries by Sex in North Topsail Beach
The North Topsail Beach industries that see more men than women are Arts, Entertainment & Recreation (100.0%), Accommodation & Food Services (100.0%), and Wholesale Trade (88.0%), whereas the industries that tend to have a higher number of women are Utilities (100.0%), Finance & Insurance (100.0%), and Real Estate, Rental & Leasing (100.0%).
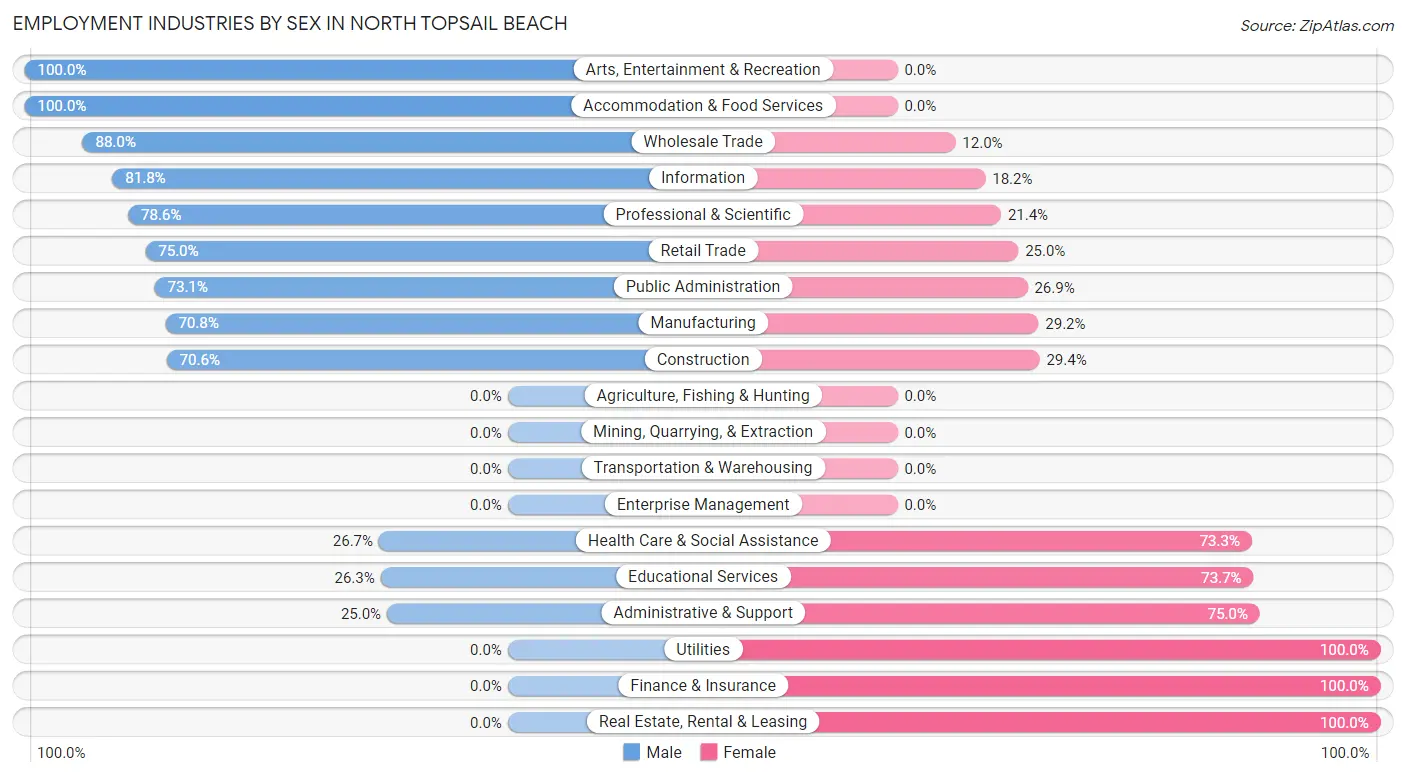
| Industry | Male | Female |
| Agriculture, Fishing & Hunting | 0 (0.0%) | 0 (0.0%) |
| Mining, Quarrying, & Extraction | 0 (0.0%) | 0 (0.0%) |
| Construction | 12 (70.6%) | 5 (29.4%) |
| Manufacturing | 34 (70.8%) | 14 (29.2%) |
| Wholesale Trade | 22 (88.0%) | 3 (12.0%) |
| Retail Trade | 21 (75.0%) | 7 (25.0%) |
| Transportation & Warehousing | 0 (0.0%) | 0 (0.0%) |
| Utilities | 0 (0.0%) | 2 (100.0%) |
| Information | 9 (81.8%) | 2 (18.2%) |
| Finance & Insurance | 0 (0.0%) | 26 (100.0%) |
| Real Estate, Rental & Leasing | 0 (0.0%) | 2 (100.0%) |
| Professional & Scientific | 22 (78.6%) | 6 (21.4%) |
| Enterprise Management | 0 (0.0%) | 0 (0.0%) |
| Administrative & Support | 2 (25.0%) | 6 (75.0%) |
| Educational Services | 10 (26.3%) | 28 (73.7%) |
| Health Care & Social Assistance | 12 (26.7%) | 33 (73.3%) |
| Arts, Entertainment & Recreation | 6 (100.0%) | 0 (0.0%) |
| Accommodation & Food Services | 18 (100.0%) | 0 (0.0%) |
| Public Administration | 19 (73.1%) | 7 (26.9%) |
| Total | 196 (57.5%) | 145 (42.5%) |
Education in North Topsail Beach
School Enrollment in North Topsail Beach
The most common levels of schooling among the 68 students in North Topsail Beach are high school (24 | 35.3%), elementary school (19 | 27.9%), and college / undergraduate (19 | 27.9%).
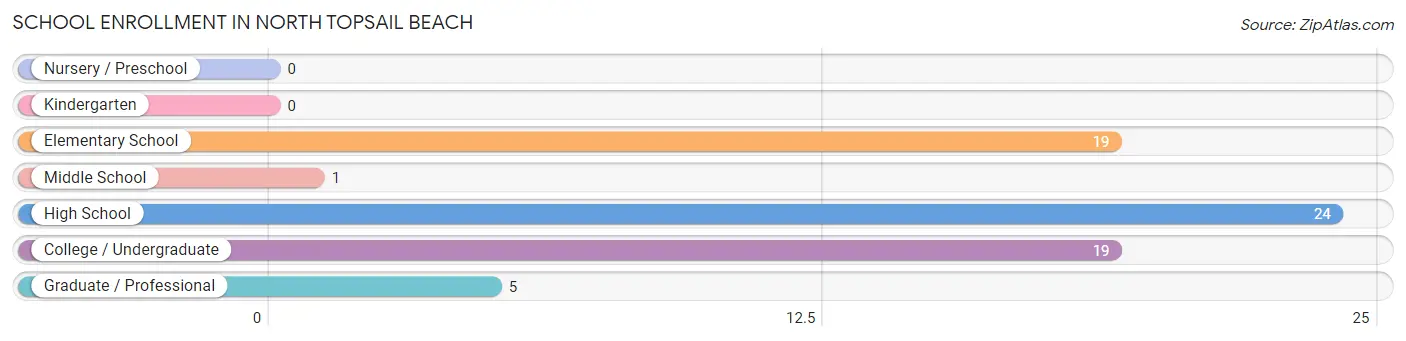
| School Level | # Students | % Students |
| Nursery / Preschool | 0 | 0.0% |
| Kindergarten | 0 | 0.0% |
| Elementary School | 19 | 27.9% |
| Middle School | 1 | 1.5% |
| High School | 24 | 35.3% |
| College / Undergraduate | 19 | 27.9% |
| Graduate / Professional | 5 | 7.3% |
| Total | 68 | 100.0% |
School Enrollment by Age by Funding Source in North Topsail Beach
Out of a total of 68 students who are enrolled in schools in North Topsail Beach, 2 (2.9%) attend a private institution, while the remaining 66 (97.1%) are enrolled in public schools. The age group of 35 years and over has the highest likelihood of being enrolled in private schools, with 2 (16.7% in the age bracket) enrolled. Conversely, the age group of 5 to 9 year old has the lowest likelihood of being enrolled in a private school, with 19 (100.0% in the age bracket) attending a public institution.
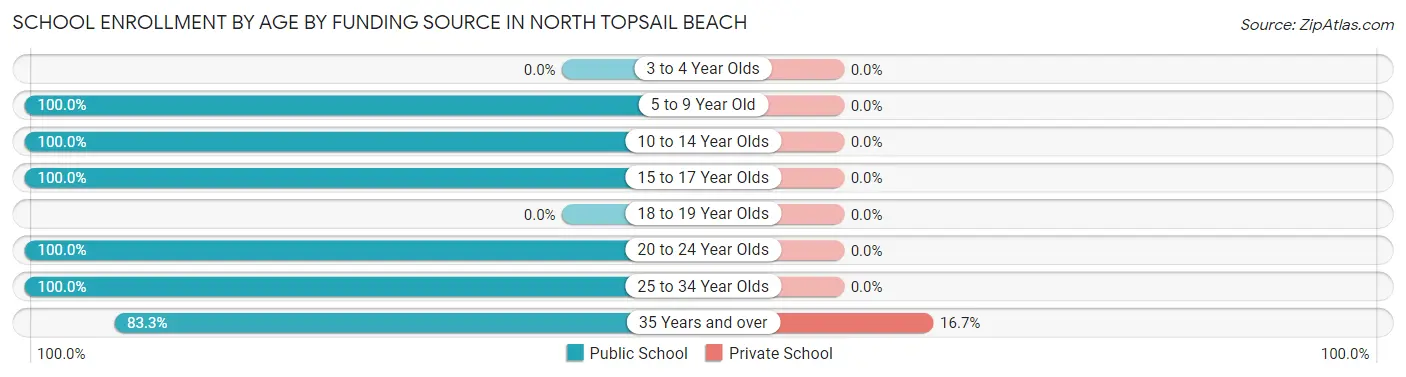
| Age Bracket | Public School | Private School |
| 3 to 4 Year Olds | 0 (0.0%) | 0 (0.0%) |
| 5 to 9 Year Old | 19 (100.0%) | 0 (0.0%) |
| 10 to 14 Year Olds | 10 (100.0%) | 0 (0.0%) |
| 15 to 17 Year Olds | 13 (100.0%) | 0 (0.0%) |
| 18 to 19 Year Olds | 0 (0.0%) | 0 (0.0%) |
| 20 to 24 Year Olds | 11 (100.0%) | 0 (0.0%) |
| 25 to 34 Year Olds | 3 (100.0%) | 0 (0.0%) |
| 35 Years and over | 10 (83.3%) | 2 (16.7%) |
| Total | 66 (97.1%) | 2 (2.9%) |
Educational Attainment by Field of Study in North Topsail Beach
Business (73 | 20.4%), science & technology (60 | 16.8%), psychology (39 | 10.9%), education (32 | 9.0%), and arts & humanities (25 | 7.0%) are the most common fields of study among 357 individuals in North Topsail Beach who have obtained a bachelor's degree or higher.
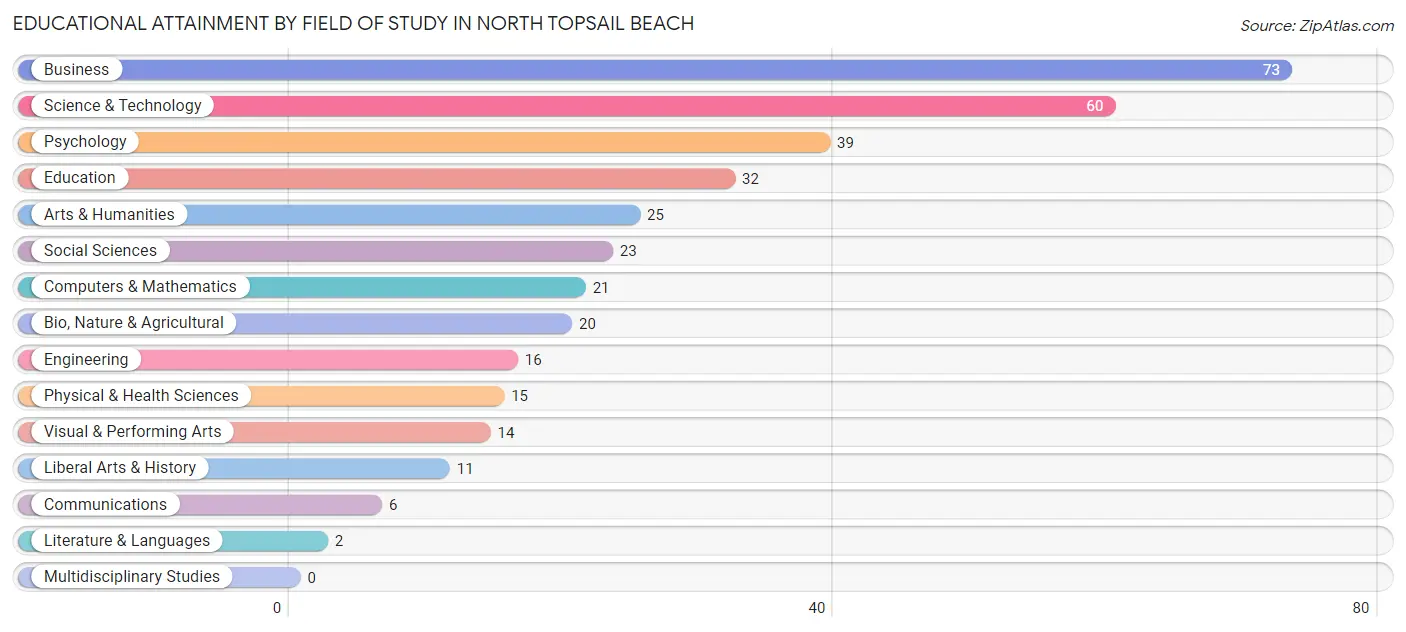
| Field of Study | # Graduates | % Graduates |
| Computers & Mathematics | 21 | 5.9% |
| Bio, Nature & Agricultural | 20 | 5.6% |
| Physical & Health Sciences | 15 | 4.2% |
| Psychology | 39 | 10.9% |
| Social Sciences | 23 | 6.4% |
| Engineering | 16 | 4.5% |
| Multidisciplinary Studies | 0 | 0.0% |
| Science & Technology | 60 | 16.8% |
| Business | 73 | 20.4% |
| Education | 32 | 9.0% |
| Literature & Languages | 2 | 0.6% |
| Liberal Arts & History | 11 | 3.1% |
| Visual & Performing Arts | 14 | 3.9% |
| Communications | 6 | 1.7% |
| Arts & Humanities | 25 | 7.0% |
| Total | 357 | 100.0% |
Transportation & Commute in North Topsail Beach
Vehicle Availability by Sex in North Topsail Beach
The most prevalent vehicle ownership categories in North Topsail Beach are males with 2 vehicles (119, accounting for 57.8%) and females with 2 vehicles (65, making up 85.6%).
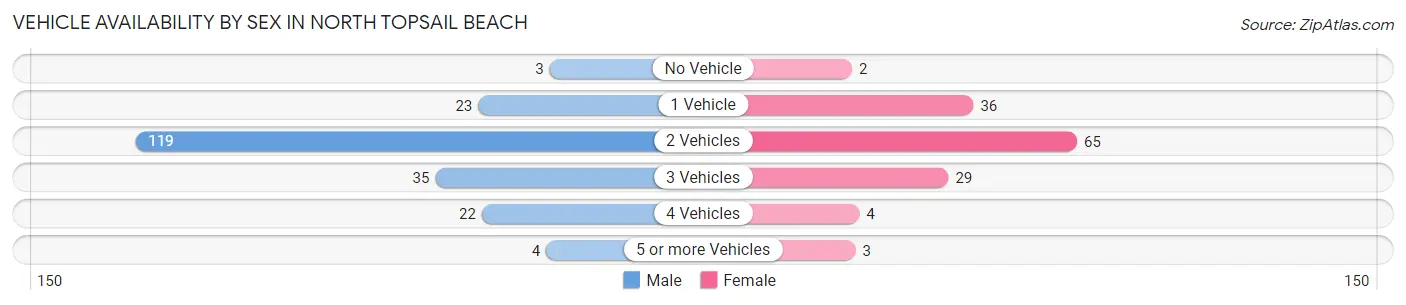
| Vehicles Available | Male | Female |
| No Vehicle | 3 (1.5%) | 2 (1.4%) |
| 1 Vehicle | 23 (11.2%) | 36 (25.9%) |
| 2 Vehicles | 119 (57.8%) | 65 (46.8%) |
| 3 Vehicles | 35 (17.0%) | 29 (20.9%) |
| 4 Vehicles | 22 (10.7%) | 4 (2.9%) |
| 5 or more Vehicles | 4 (1.9%) | 3 (2.2%) |
| Total | 206 (100.0%) | 139 (100.0%) |
Commute Time in North Topsail Beach
The most frequently occuring commute durations in North Topsail Beach are 40 to 44 minutes (61 commuters, 26.6%), 45 to 59 minutes (34 commuters, 14.8%), and 30 to 34 minutes (31 commuters, 13.5%).
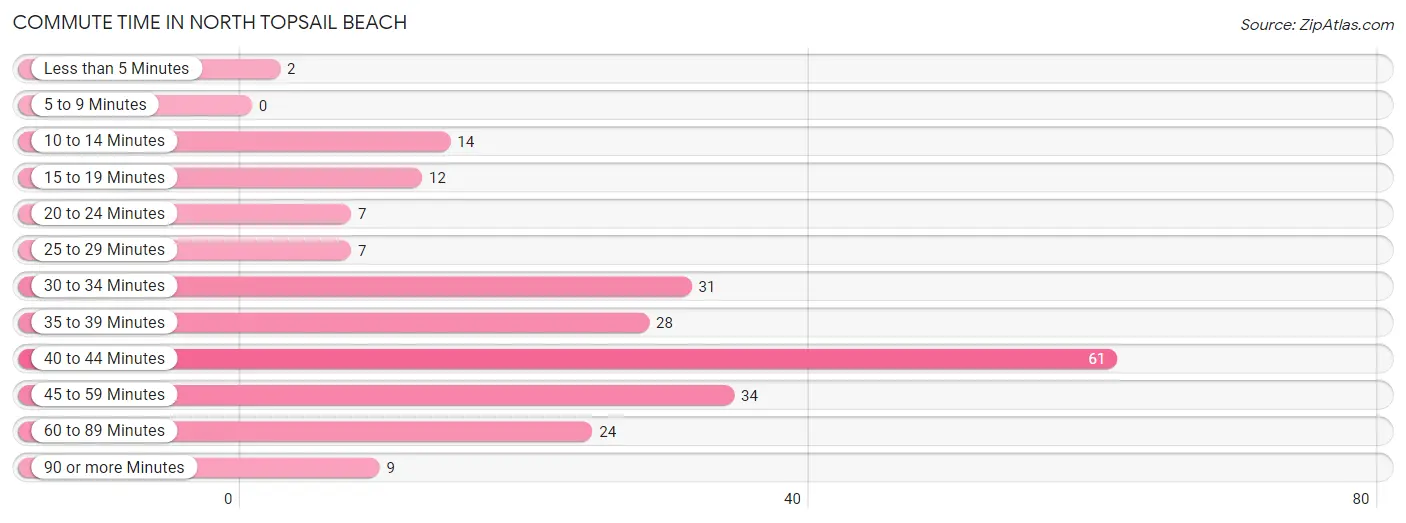
| Commute Time | # Commuters | % Commuters |
| Less than 5 Minutes | 2 | 0.9% |
| 5 to 9 Minutes | 0 | 0.0% |
| 10 to 14 Minutes | 14 | 6.1% |
| 15 to 19 Minutes | 12 | 5.2% |
| 20 to 24 Minutes | 7 | 3.1% |
| 25 to 29 Minutes | 7 | 3.1% |
| 30 to 34 Minutes | 31 | 13.5% |
| 35 to 39 Minutes | 28 | 12.2% |
| 40 to 44 Minutes | 61 | 26.6% |
| 45 to 59 Minutes | 34 | 14.8% |
| 60 to 89 Minutes | 24 | 10.5% |
| 90 or more Minutes | 9 | 3.9% |
Commute Time by Sex in North Topsail Beach
The most common commute times in North Topsail Beach are 40 to 44 minutes (46 commuters, 31.7%) for males and 30 to 34 minutes (17 commuters, 20.2%) for females.
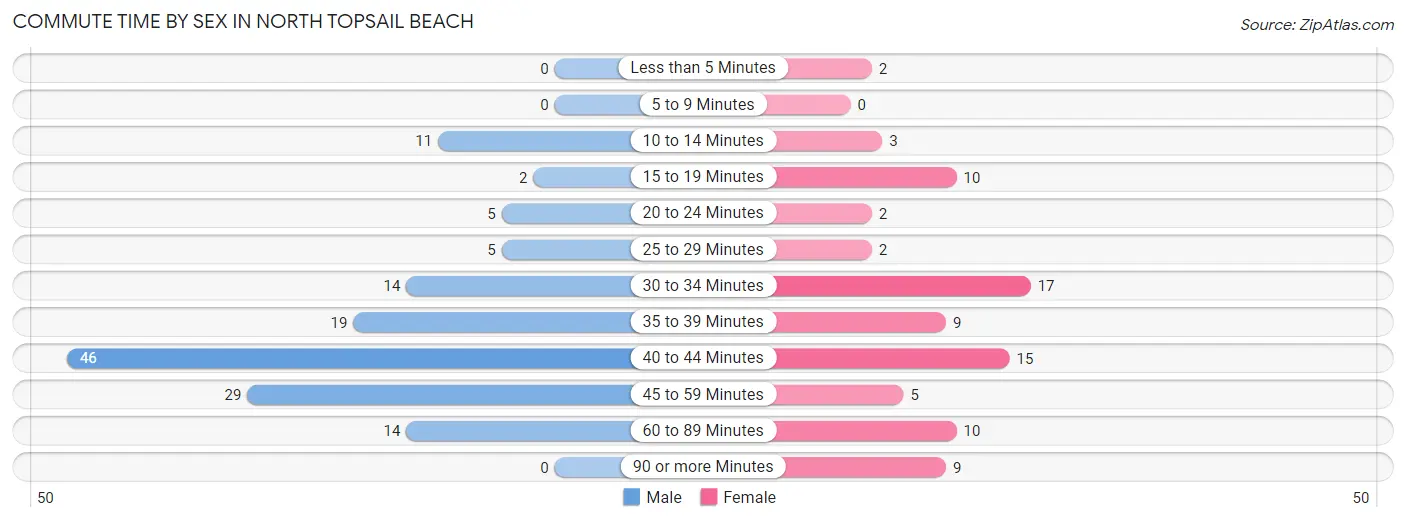
| Commute Time | Male | Female |
| Less than 5 Minutes | 0 (0.0%) | 2 (2.4%) |
| 5 to 9 Minutes | 0 (0.0%) | 0 (0.0%) |
| 10 to 14 Minutes | 11 (7.6%) | 3 (3.6%) |
| 15 to 19 Minutes | 2 (1.4%) | 10 (11.9%) |
| 20 to 24 Minutes | 5 (3.5%) | 2 (2.4%) |
| 25 to 29 Minutes | 5 (3.5%) | 2 (2.4%) |
| 30 to 34 Minutes | 14 (9.7%) | 17 (20.2%) |
| 35 to 39 Minutes | 19 (13.1%) | 9 (10.7%) |
| 40 to 44 Minutes | 46 (31.7%) | 15 (17.9%) |
| 45 to 59 Minutes | 29 (20.0%) | 5 (5.9%) |
| 60 to 89 Minutes | 14 (9.7%) | 10 (11.9%) |
| 90 or more Minutes | 0 (0.0%) | 9 (10.7%) |
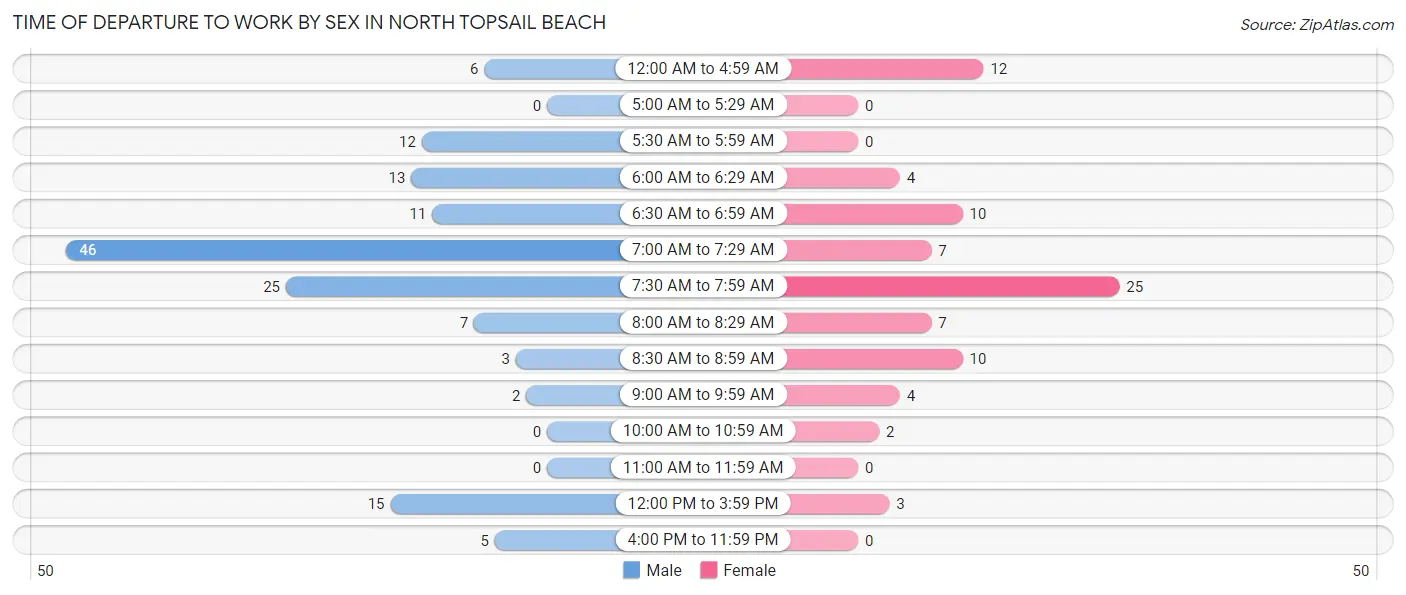
Time of Departure to Work by Sex in North Topsail Beach
The most frequent times of departure to work in North Topsail Beach are 7:00 AM to 7:29 AM (46, 31.7%) for males and 7:30 AM to 7:59 AM (25, 29.8%) for females.
| Time of Departure | Male | Female |
| 12:00 AM to 4:59 AM | 6 (4.1%) | 12 (14.3%) |
| 5:00 AM to 5:29 AM | 0 (0.0%) | 0 (0.0%) |
| 5:30 AM to 5:59 AM | 12 (8.3%) | 0 (0.0%) |
| 6:00 AM to 6:29 AM | 13 (9.0%) | 4 (4.8%) |
| 6:30 AM to 6:59 AM | 11 (7.6%) | 10 (11.9%) |
| 7:00 AM to 7:29 AM | 46 (31.7%) | 7 (8.3%) |
| 7:30 AM to 7:59 AM | 25 (17.2%) | 25 (29.8%) |
| 8:00 AM to 8:29 AM | 7 (4.8%) | 7 (8.3%) |
| 8:30 AM to 8:59 AM | 3 (2.1%) | 10 (11.9%) |
| 9:00 AM to 9:59 AM | 2 (1.4%) | 4 (4.8%) |
| 10:00 AM to 10:59 AM | 0 (0.0%) | 2 (2.4%) |
| 11:00 AM to 11:59 AM | 0 (0.0%) | 0 (0.0%) |
| 12:00 PM to 3:59 PM | 15 (10.3%) | 3 (3.6%) |
| 4:00 PM to 11:59 PM | 5 (3.5%) | 0 (0.0%) |
| Total | 145 (100.0%) | 84 (100.0%) |
Housing Occupancy in North Topsail Beach
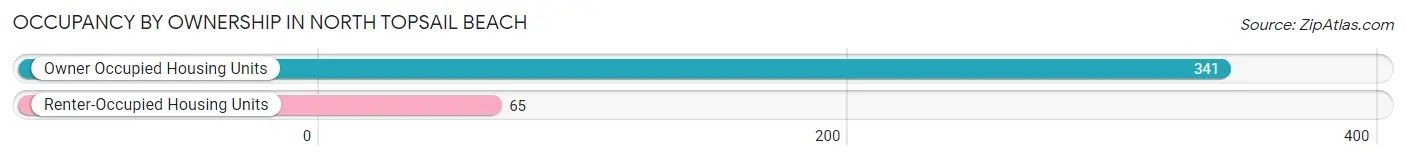
Occupancy by Ownership in North Topsail Beach
Of the total 406 dwellings in North Topsail Beach, owner-occupied units account for 341 (84.0%), while renter-occupied units make up 65 (16.0%).
| Occupancy | # Housing Units | % Housing Units |
| Owner Occupied Housing Units | 341 | 84.0% |
| Renter-Occupied Housing Units | 65 | 16.0% |
| Total Occupied Housing Units | 406 | 100.0% |
Occupancy by Household Size in North Topsail Beach
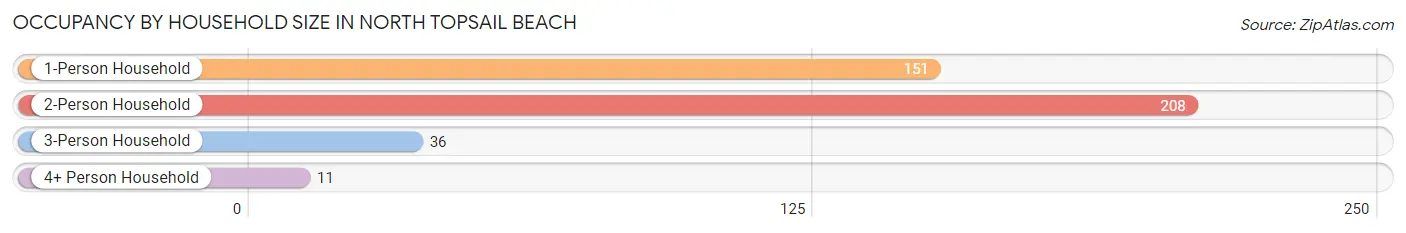
| Household Size | # Housing Units | % Housing Units |
| 1-Person Household | 151 | 37.2% |
| 2-Person Household | 208 | 51.2% |
| 3-Person Household | 36 | 8.9% |
| 4+ Person Household | 11 | 2.7% |
| Total Housing Units | 406 | 100.0% |
Occupancy by Ownership by Household Size in North Topsail Beach
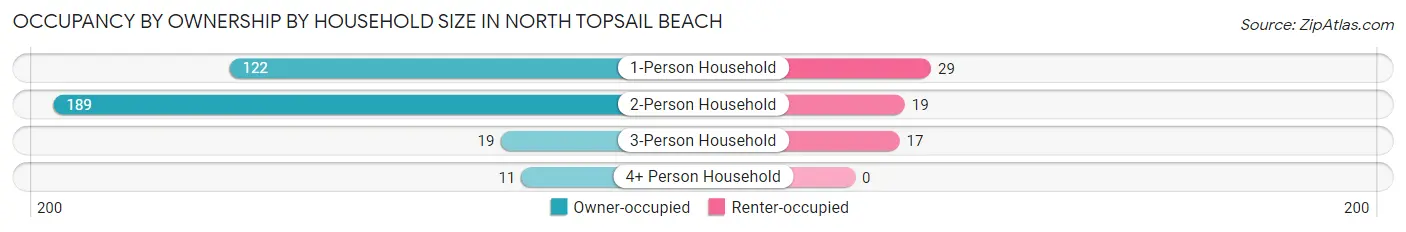
| Household Size | Owner-occupied | Renter-occupied |
| 1-Person Household | 122 (80.8%) | 29 (19.2%) |
| 2-Person Household | 189 (90.9%) | 19 (9.1%) |
| 3-Person Household | 19 (52.8%) | 17 (47.2%) |
| 4+ Person Household | 11 (100.0%) | 0 (0.0%) |
| Total Housing Units | 341 (84.0%) | 65 (16.0%) |
Occupancy by Educational Attainment in North Topsail Beach
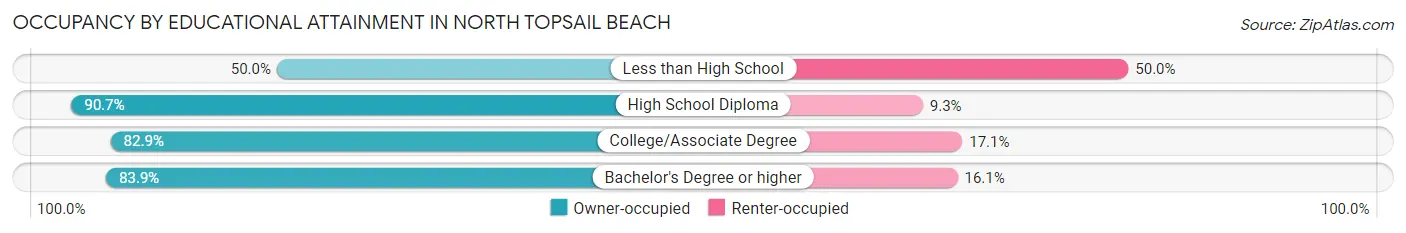
| Household Size | Owner-occupied | Renter-occupied |
| Less than High School | 3 (50.0%) | 3 (50.0%) |
| High School Diploma | 49 (90.7%) | 5 (9.3%) |
| College/Associate Degree | 102 (82.9%) | 21 (17.1%) |
| Bachelor's Degree or higher | 187 (83.9%) | 36 (16.1%) |
Occupancy by Age of Householder in North Topsail Beach
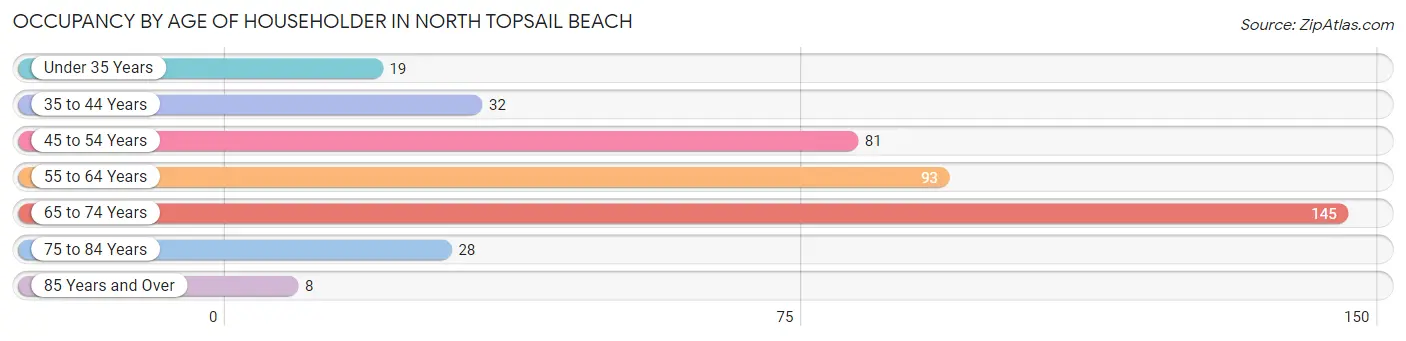
| Age Bracket | # Households | % Households |
| Under 35 Years | 19 | 4.7% |
| 35 to 44 Years | 32 | 7.9% |
| 45 to 54 Years | 81 | 20.0% |
| 55 to 64 Years | 93 | 22.9% |
| 65 to 74 Years | 145 | 35.7% |
| 75 to 84 Years | 28 | 6.9% |
| 85 Years and Over | 8 | 2.0% |
| Total | 406 | 100.0% |
Housing Finances in North Topsail Beach
Median Income by Occupancy in North Topsail Beach
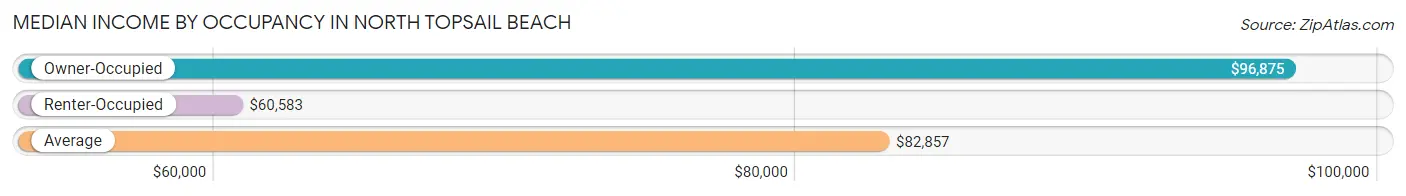
| Occupancy Type | # Households | Median Income |
| Owner-Occupied | 341 (84.0%) | $96,875 |
| Renter-Occupied | 65 (16.0%) | $60,583 |
| Average | 406 (100.0%) | $82,857 |
Occupancy by Householder Income Bracket in North Topsail Beach
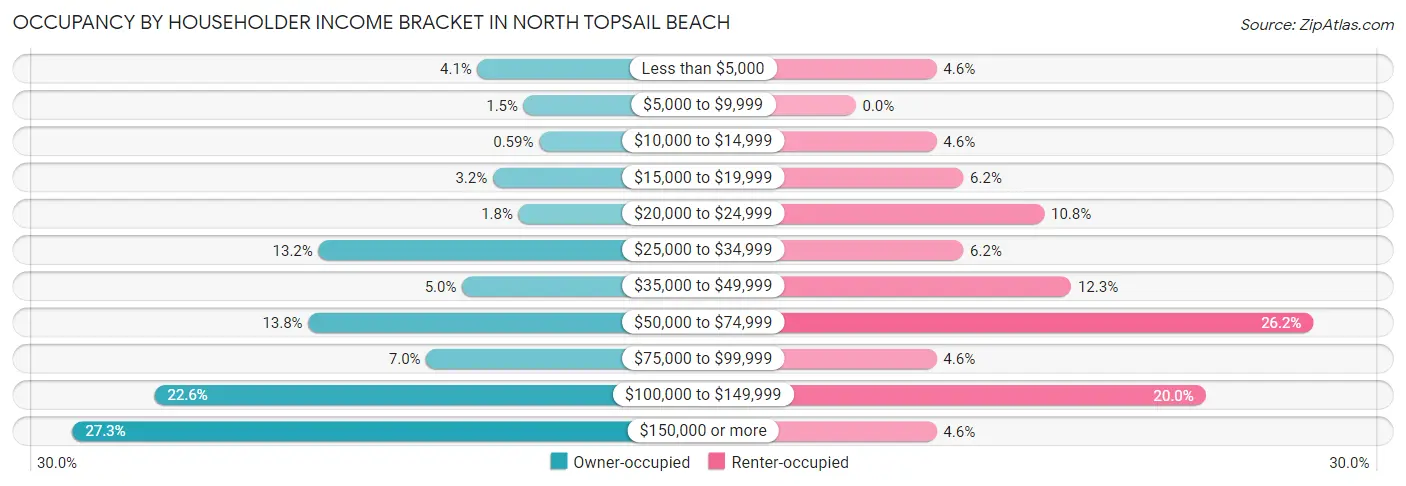
| Income Bracket | Owner-occupied | Renter-occupied |
| Less than $5,000 | 14 (4.1%) | 3 (4.6%) |
| $5,000 to $9,999 | 5 (1.5%) | 0 (0.0%) |
| $10,000 to $14,999 | 2 (0.6%) | 3 (4.6%) |
| $15,000 to $19,999 | 11 (3.2%) | 4 (6.1%) |
| $20,000 to $24,999 | 6 (1.8%) | 7 (10.8%) |
| $25,000 to $34,999 | 45 (13.2%) | 4 (6.1%) |
| $35,000 to $49,999 | 17 (5.0%) | 8 (12.3%) |
| $50,000 to $74,999 | 47 (13.8%) | 17 (26.2%) |
| $75,000 to $99,999 | 24 (7.0%) | 3 (4.6%) |
| $100,000 to $149,999 | 77 (22.6%) | 13 (20.0%) |
| $150,000 or more | 93 (27.3%) | 3 (4.6%) |
| Total | 341 (100.0%) | 65 (100.0%) |
Monthly Housing Cost Tiers in North Topsail Beach
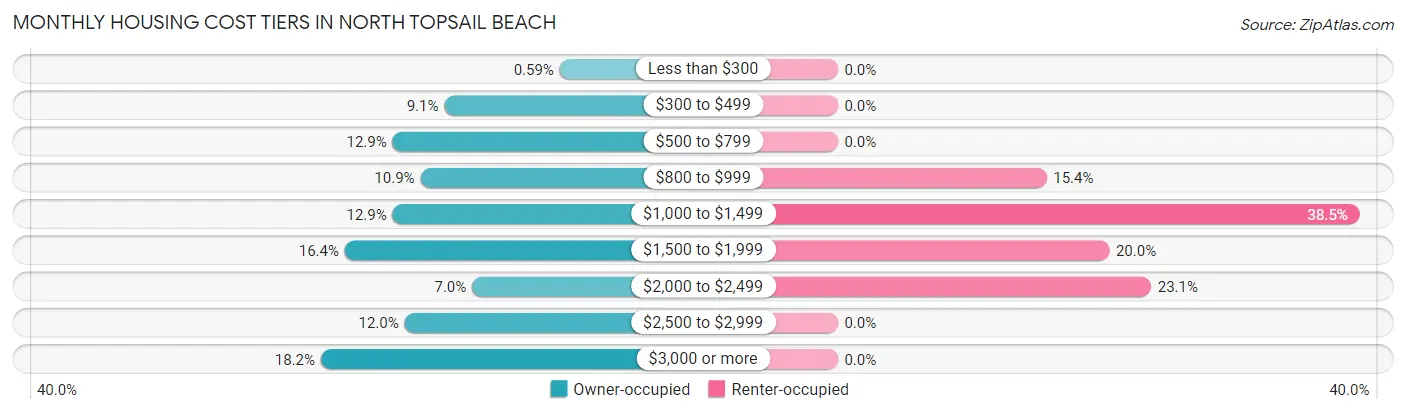
| Monthly Cost | Owner-occupied | Renter-occupied |
| Less than $300 | 2 (0.6%) | 0 (0.0%) |
| $300 to $499 | 31 (9.1%) | 0 (0.0%) |
| $500 to $799 | 44 (12.9%) | 0 (0.0%) |
| $800 to $999 | 37 (10.8%) | 10 (15.4%) |
| $1,000 to $1,499 | 44 (12.9%) | 25 (38.5%) |
| $1,500 to $1,999 | 56 (16.4%) | 13 (20.0%) |
| $2,000 to $2,499 | 24 (7.0%) | 15 (23.1%) |
| $2,500 to $2,999 | 41 (12.0%) | 0 (0.0%) |
| $3,000 or more | 62 (18.2%) | 0 (0.0%) |
| Total | 341 (100.0%) | 65 (100.0%) |
Physical Housing Characteristics in North Topsail Beach
Housing Structures in North Topsail Beach
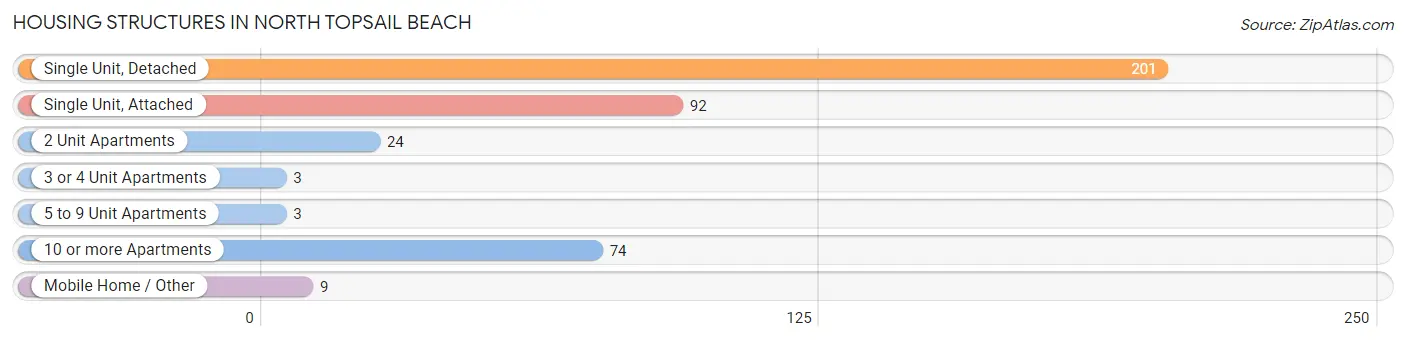
| Structure Type | # Housing Units | % Housing Units |
| Single Unit, Detached | 201 | 49.5% |
| Single Unit, Attached | 92 | 22.7% |
| 2 Unit Apartments | 24 | 5.9% |
| 3 or 4 Unit Apartments | 3 | 0.7% |
| 5 to 9 Unit Apartments | 3 | 0.7% |
| 10 or more Apartments | 74 | 18.2% |
| Mobile Home / Other | 9 | 2.2% |
| Total | 406 | 100.0% |
Housing Structures by Occupancy in North Topsail Beach
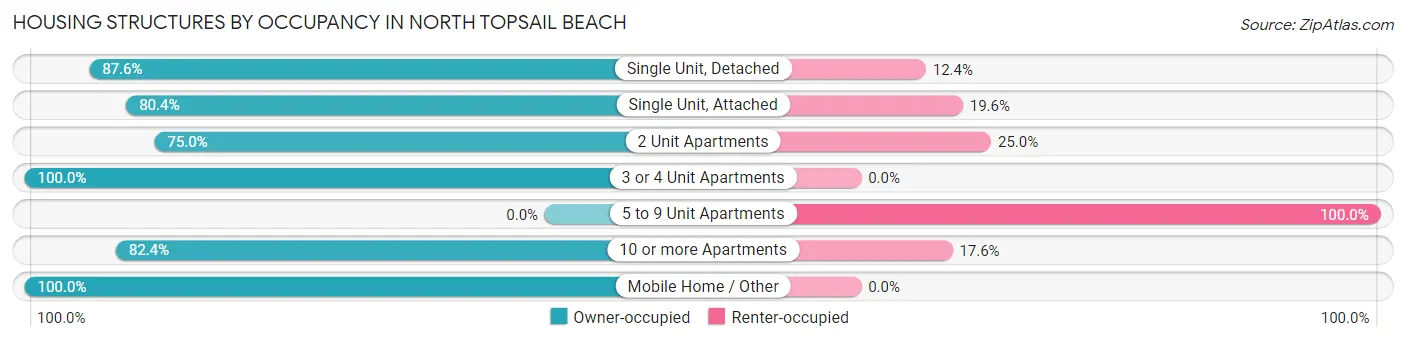
| Structure Type | Owner-occupied | Renter-occupied |
| Single Unit, Detached | 176 (87.6%) | 25 (12.4%) |
| Single Unit, Attached | 74 (80.4%) | 18 (19.6%) |
| 2 Unit Apartments | 18 (75.0%) | 6 (25.0%) |
| 3 or 4 Unit Apartments | 3 (100.0%) | 0 (0.0%) |
| 5 to 9 Unit Apartments | 0 (0.0%) | 3 (100.0%) |
| 10 or more Apartments | 61 (82.4%) | 13 (17.6%) |
| Mobile Home / Other | 9 (100.0%) | 0 (0.0%) |
| Total | 341 (84.0%) | 65 (16.0%) |
Housing Structures by Number of Rooms in North Topsail Beach
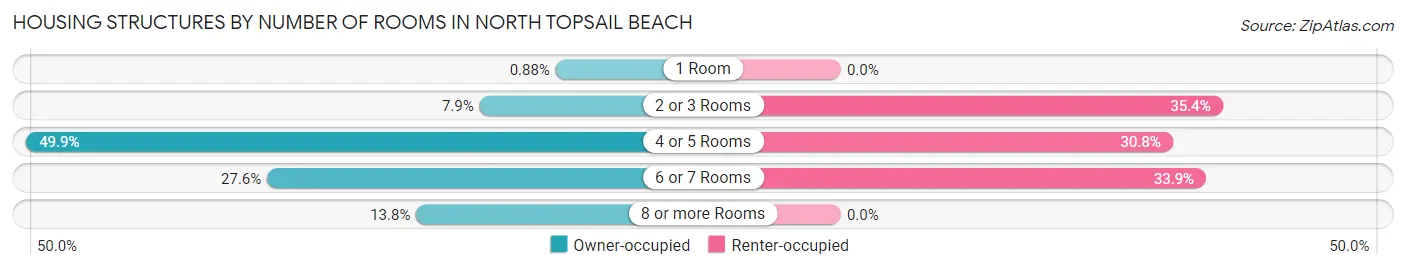
| Number of Rooms | Owner-occupied | Renter-occupied |
| 1 Room | 3 (0.9%) | 0 (0.0%) |
| 2 or 3 Rooms | 27 (7.9%) | 23 (35.4%) |
| 4 or 5 Rooms | 170 (49.8%) | 20 (30.8%) |
| 6 or 7 Rooms | 94 (27.6%) | 22 (33.9%) |
| 8 or more Rooms | 47 (13.8%) | 0 (0.0%) |
| Total | 341 (100.0%) | 65 (100.0%) |
Housing Structure by Heating Type in North Topsail Beach
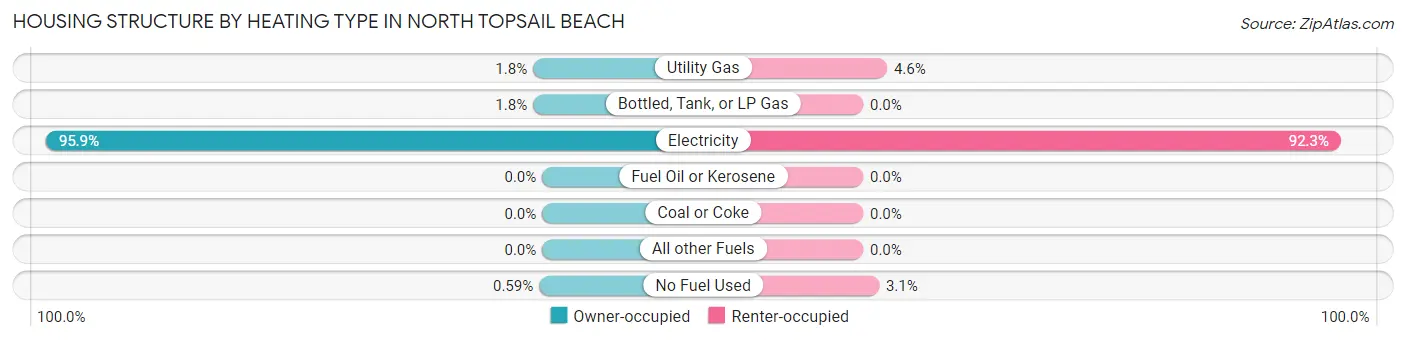
| Heating Type | Owner-occupied | Renter-occupied |
| Utility Gas | 6 (1.8%) | 3 (4.6%) |
| Bottled, Tank, or LP Gas | 6 (1.8%) | 0 (0.0%) |
| Electricity | 327 (95.9%) | 60 (92.3%) |
| Fuel Oil or Kerosene | 0 (0.0%) | 0 (0.0%) |
| Coal or Coke | 0 (0.0%) | 0 (0.0%) |
| All other Fuels | 0 (0.0%) | 0 (0.0%) |
| No Fuel Used | 2 (0.6%) | 2 (3.1%) |
| Total | 341 (100.0%) | 65 (100.0%) |
Household Vehicle Usage in North Topsail Beach
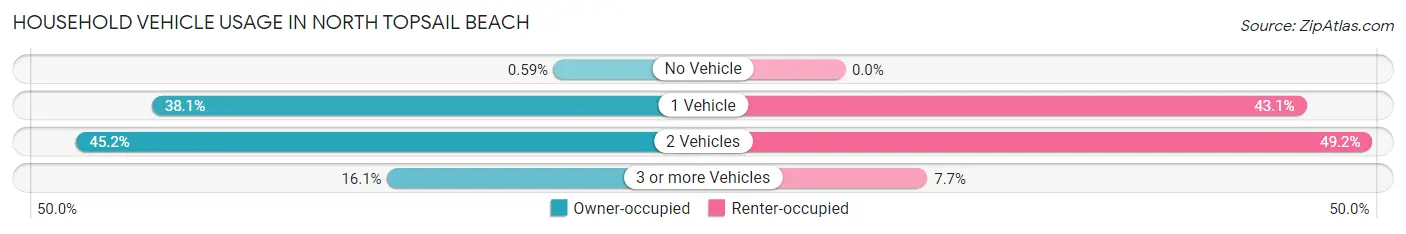
| Vehicles per Household | Owner-occupied | Renter-occupied |
| No Vehicle | 2 (0.6%) | 0 (0.0%) |
| 1 Vehicle | 130 (38.1%) | 28 (43.1%) |
| 2 Vehicles | 154 (45.2%) | 32 (49.2%) |
| 3 or more Vehicles | 55 (16.1%) | 5 (7.7%) |
| Total | 341 (100.0%) | 65 (100.0%) |
Real Estate & Mortgages in North Topsail Beach
Real Estate and Mortgage Overview in North Topsail Beach
| Characteristic | Without Mortgage | With Mortgage |
| Housing Units | 136 | 205 |
| Median Property Value | $350,000 | $439,700 |
| Median Household Income | $78,125 | $55 |
| Monthly Housing Costs | $800 | $62 |
| Real Estate Taxes | $2,271 | $0 |
Property Value by Mortgage Status in North Topsail Beach
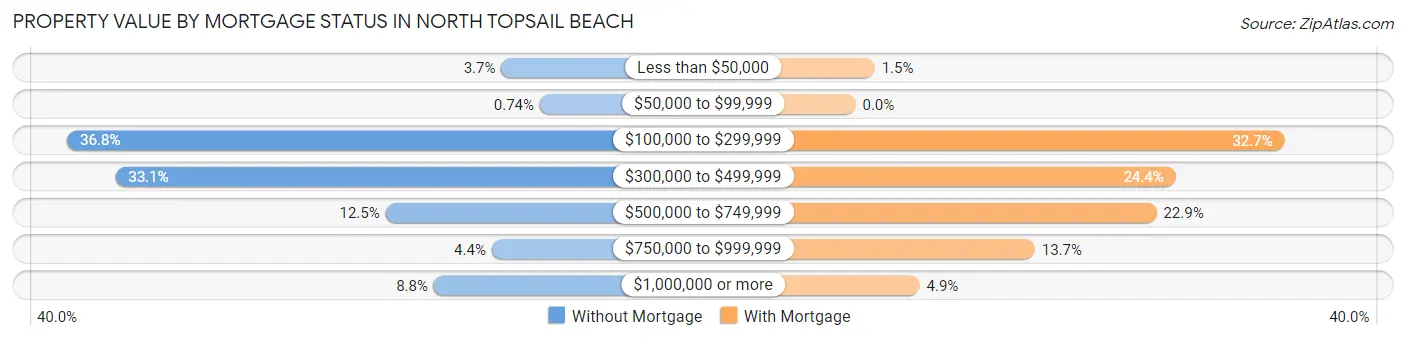
| Property Value | Without Mortgage | With Mortgage |
| Less than $50,000 | 5 (3.7%) | 3 (1.5%) |
| $50,000 to $99,999 | 1 (0.7%) | 0 (0.0%) |
| $100,000 to $299,999 | 50 (36.8%) | 67 (32.7%) |
| $300,000 to $499,999 | 45 (33.1%) | 50 (24.4%) |
| $500,000 to $749,999 | 17 (12.5%) | 47 (22.9%) |
| $750,000 to $999,999 | 6 (4.4%) | 28 (13.7%) |
| $1,000,000 or more | 12 (8.8%) | 10 (4.9%) |
| Total | 136 (100.0%) | 205 (100.0%) |
Household Income by Mortgage Status in North Topsail Beach
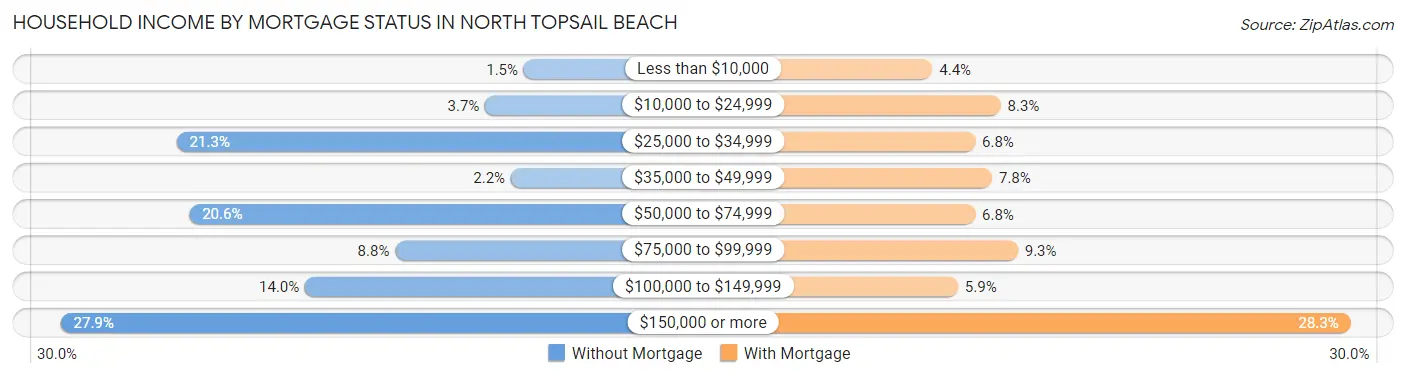
| Household Income | Without Mortgage | With Mortgage |
| Less than $10,000 | 2 (1.5%) | 9 (4.4%) |
| $10,000 to $24,999 | 5 (3.7%) | 17 (8.3%) |
| $25,000 to $34,999 | 29 (21.3%) | 14 (6.8%) |
| $35,000 to $49,999 | 3 (2.2%) | 16 (7.8%) |
| $50,000 to $74,999 | 28 (20.6%) | 14 (6.8%) |
| $75,000 to $99,999 | 12 (8.8%) | 19 (9.3%) |
| $100,000 to $149,999 | 19 (14.0%) | 12 (5.9%) |
| $150,000 or more | 38 (27.9%) | 58 (28.3%) |
| Total | 136 (100.0%) | 205 (100.0%) |
Property Value to Household Income Ratio in North Topsail Beach
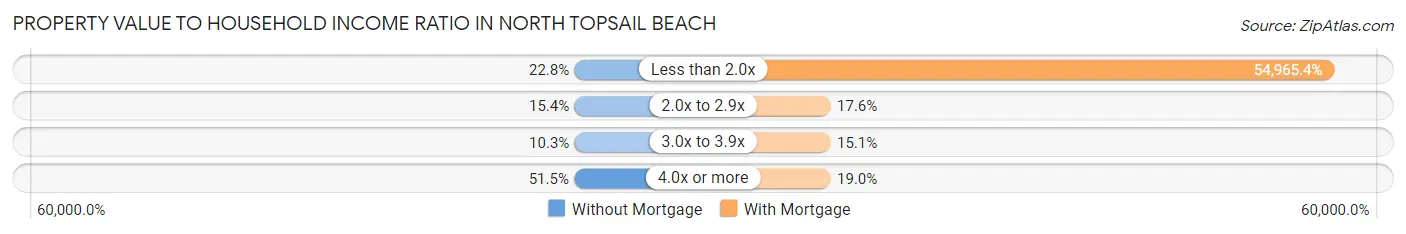
| Value-to-Income Ratio | Without Mortgage | With Mortgage |
| Less than 2.0x | 31 (22.8%) | 112,679 (54,965.4%) |
| 2.0x to 2.9x | 21 (15.4%) | 36 (17.6%) |
| 3.0x to 3.9x | 14 (10.3%) | 31 (15.1%) |
| 4.0x or more | 70 (51.5%) | 39 (19.0%) |
| Total | 136 (100.0%) | 205 (100.0%) |
Real Estate Taxes by Mortgage Status in North Topsail Beach
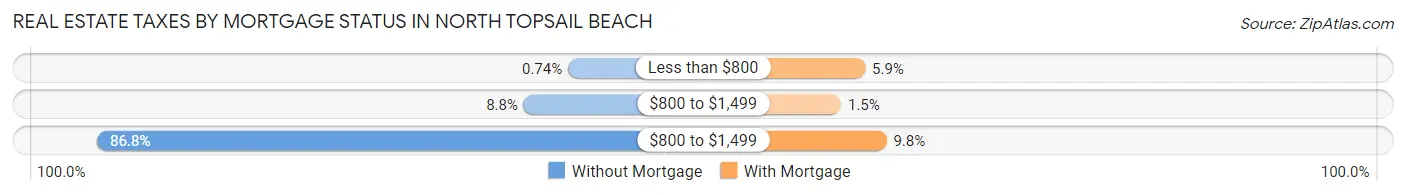
| Property Taxes | Without Mortgage | With Mortgage |
| Less than $800 | 1 (0.7%) | 12 (5.9%) |
| $800 to $1,499 | 12 (8.8%) | 3 (1.5%) |
| $800 to $1,499 | 118 (86.8%) | 20 (9.8%) |
| Total | 136 (100.0%) | 205 (100.0%) |
Health & Disability in North Topsail Beach
Health Insurance Coverage by Age in North Topsail Beach
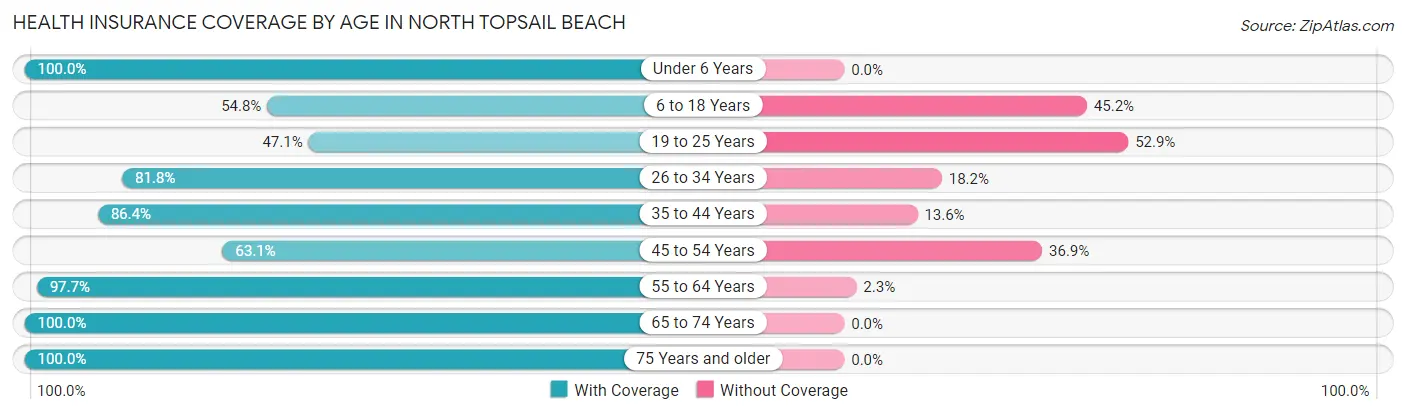
| Age Bracket | With Coverage | Without Coverage |
| Under 6 Years | 3 (100.0%) | 0 (0.0%) |
| 6 to 18 Years | 23 (54.8%) | 19 (45.2%) |
| 19 to 25 Years | 24 (47.1%) | 27 (52.9%) |
| 26 to 34 Years | 9 (81.8%) | 2 (18.2%) |
| 35 to 44 Years | 57 (86.4%) | 9 (13.6%) |
| 45 to 54 Years | 77 (63.1%) | 45 (36.9%) |
| 55 to 64 Years | 173 (97.7%) | 4 (2.3%) |
| 65 to 74 Years | 234 (100.0%) | 0 (0.0%) |
| 75 Years and older | 57 (100.0%) | 0 (0.0%) |
| Total | 657 (86.1%) | 106 (13.9%) |
Health Insurance Coverage by Citizenship Status in North Topsail Beach
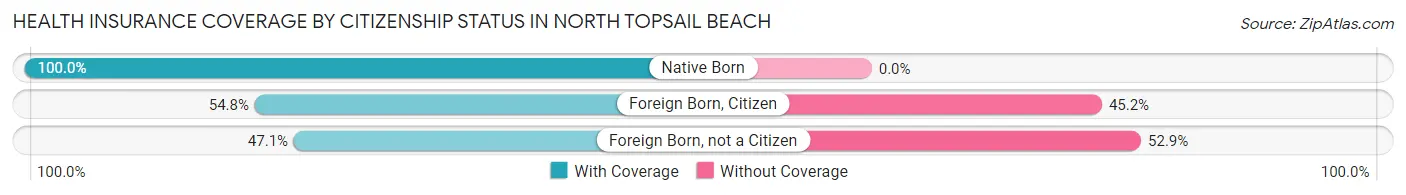
| Citizenship Status | With Coverage | Without Coverage |
| Native Born | 3 (100.0%) | 0 (0.0%) |
| Foreign Born, Citizen | 23 (54.8%) | 19 (45.2%) |
| Foreign Born, not a Citizen | 24 (47.1%) | 27 (52.9%) |
Health Insurance Coverage by Household Income in North Topsail Beach
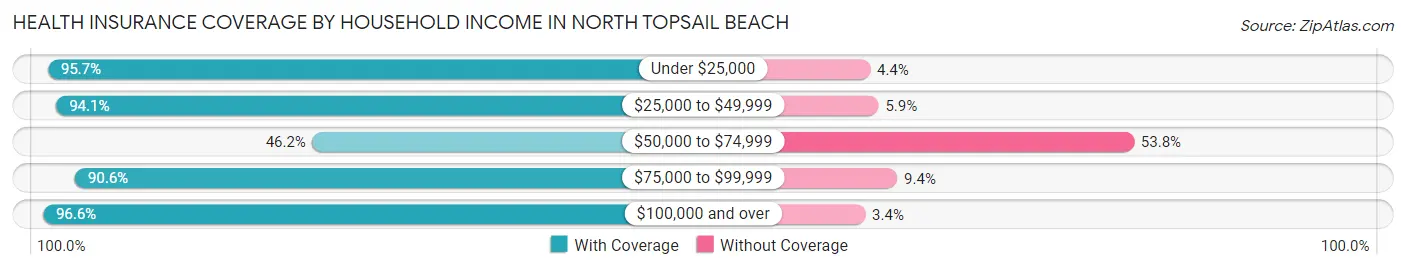
| Household Income | With Coverage | Without Coverage |
| Under $25,000 | 66 (95.7%) | 3 (4.3%) |
| $25,000 to $49,999 | 111 (94.1%) | 7 (5.9%) |
| $50,000 to $74,999 | 67 (46.2%) | 78 (53.8%) |
| $75,000 to $99,999 | 48 (90.6%) | 5 (9.4%) |
| $100,000 and over | 365 (96.6%) | 13 (3.4%) |
Public vs Private Health Insurance Coverage by Age in North Topsail Beach
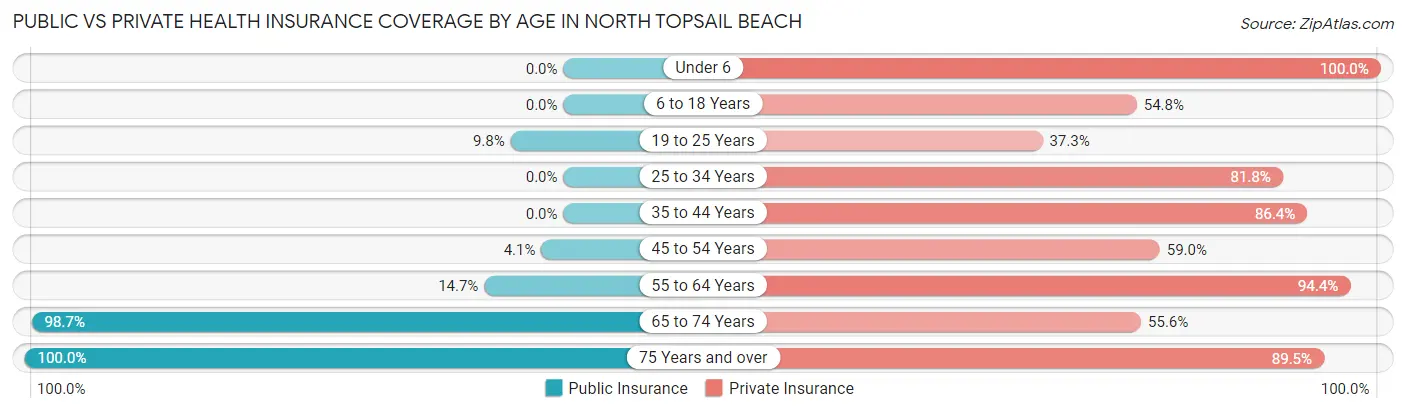
| Age Bracket | Public Insurance | Private Insurance |
| Under 6 | 0 (0.0%) | 3 (100.0%) |
| 6 to 18 Years | 0 (0.0%) | 23 (54.8%) |
| 19 to 25 Years | 5 (9.8%) | 19 (37.2%) |
| 25 to 34 Years | 0 (0.0%) | 9 (81.8%) |
| 35 to 44 Years | 0 (0.0%) | 57 (86.4%) |
| 45 to 54 Years | 5 (4.1%) | 72 (59.0%) |
| 55 to 64 Years | 26 (14.7%) | 167 (94.4%) |
| 65 to 74 Years | 231 (98.7%) | 130 (55.6%) |
| 75 Years and over | 57 (100.0%) | 51 (89.5%) |
| Total | 324 (42.5%) | 531 (69.6%) |
Disability Status by Sex by Age in North Topsail Beach
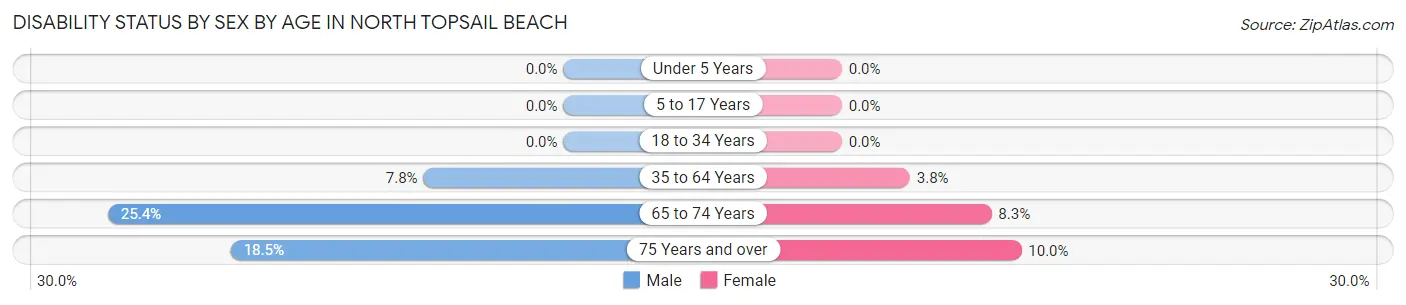
| Age Bracket | Male | Female |
| Under 5 Years | 0 (0.0%) | 0 (0.0%) |
| 5 to 17 Years | 0 (0.0%) | 0 (0.0%) |
| 18 to 34 Years | 0 (0.0%) | 0 (0.0%) |
| 35 to 64 Years | 12 (7.8%) | 8 (3.8%) |
| 65 to 74 Years | 35 (25.4%) | 8 (8.3%) |
| 75 Years and over | 5 (18.5%) | 3 (10.0%) |
Disability Class by Sex by Age in North Topsail Beach
Disability Class: Hearing Difficulty
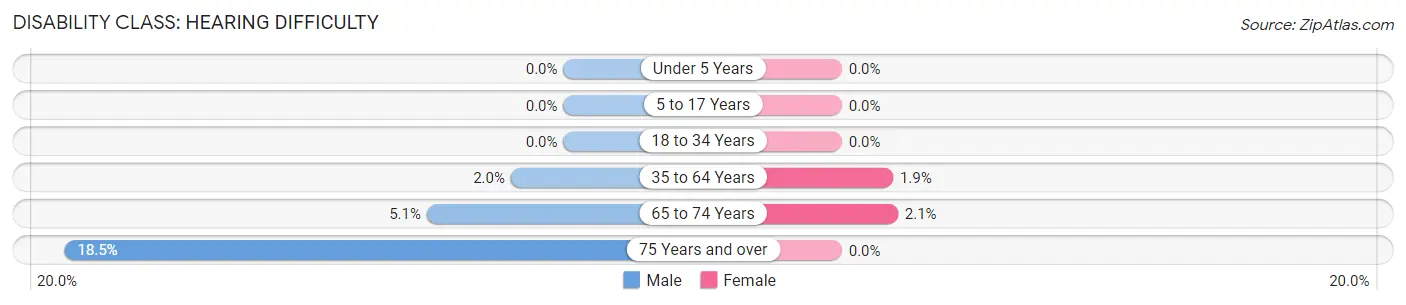
| Age Bracket | Male | Female |
| Under 5 Years | 0 (0.0%) | 0 (0.0%) |
| 5 to 17 Years | 0 (0.0%) | 0 (0.0%) |
| 18 to 34 Years | 0 (0.0%) | 0 (0.0%) |
| 35 to 64 Years | 3 (1.9%) | 4 (1.9%) |
| 65 to 74 Years | 7 (5.1%) | 2 (2.1%) |
| 75 Years and over | 5 (18.5%) | 0 (0.0%) |
Disability Class: Vision Difficulty
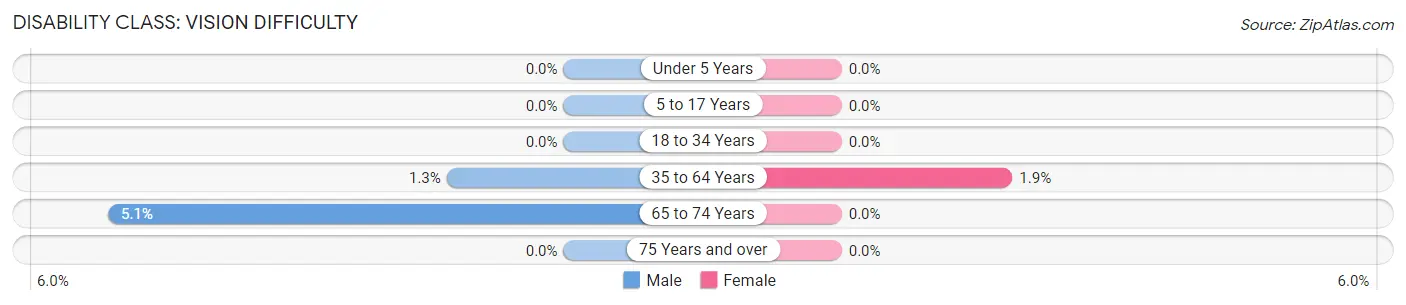
| Age Bracket | Male | Female |
| Under 5 Years | 0 (0.0%) | 0 (0.0%) |
| 5 to 17 Years | 0 (0.0%) | 0 (0.0%) |
| 18 to 34 Years | 0 (0.0%) | 0 (0.0%) |
| 35 to 64 Years | 2 (1.3%) | 4 (1.9%) |
| 65 to 74 Years | 7 (5.1%) | 0 (0.0%) |
| 75 Years and over | 0 (0.0%) | 0 (0.0%) |
Disability Class: Cognitive Difficulty
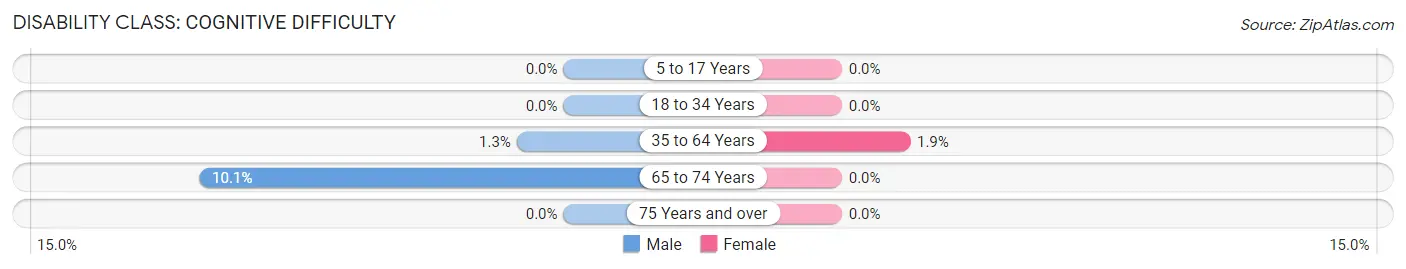
| Age Bracket | Male | Female |
| 5 to 17 Years | 0 (0.0%) | 0 (0.0%) |
| 18 to 34 Years | 0 (0.0%) | 0 (0.0%) |
| 35 to 64 Years | 2 (1.3%) | 4 (1.9%) |
| 65 to 74 Years | 14 (10.1%) | 0 (0.0%) |
| 75 Years and over | 0 (0.0%) | 0 (0.0%) |
Disability Class: Ambulatory Difficulty
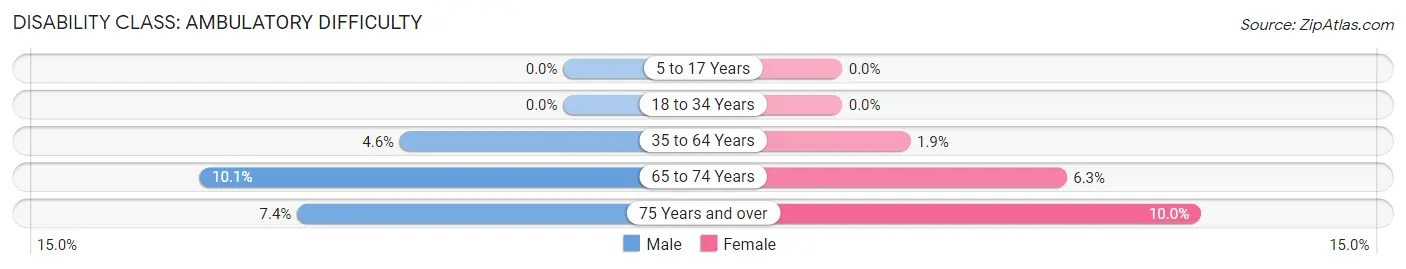
| Age Bracket | Male | Female |
| 5 to 17 Years | 0 (0.0%) | 0 (0.0%) |
| 18 to 34 Years | 0 (0.0%) | 0 (0.0%) |
| 35 to 64 Years | 7 (4.5%) | 4 (1.9%) |
| 65 to 74 Years | 14 (10.1%) | 6 (6.2%) |
| 75 Years and over | 2 (7.4%) | 3 (10.0%) |
Disability Class: Self-Care Difficulty
| Age Bracket | Male | Female |
| 5 to 17 Years | 0 (0.0%) | 0 (0.0%) |
| 18 to 34 Years | 0 (0.0%) | 0 (0.0%) |
| 35 to 64 Years | 0 (0.0%) | 0 (0.0%) |
| 65 to 74 Years | 7 (5.1%) | 0 (0.0%) |
| 75 Years and over | 2 (7.4%) | 0 (0.0%) |
Technology Access in North Topsail Beach
Computing Device Access in North Topsail Beach
| Device Type | # Households | % Households |
| Desktop or Laptop | 368 | 90.6% |
| Smartphone | 395 | 97.3% |
| Tablet | 264 | 65.0% |
| No Computing Device | 2 | 0.5% |
| Total | 406 | 100.0% |
Internet Access in North Topsail Beach
| Internet Type | # Households | % Households |
| Dial-Up Internet | 0 | 0.0% |
| Broadband Home | 333 | 82.0% |
| Cellular Data Only | 18 | 4.4% |
| Satellite Internet | 15 | 3.7% |
| No Internet | 51 | 12.6% |
| Total | 406 | 100.0% |
North Topsail Beach Summary
North Topsail Beach is a town located in Onslow County, North Carolina, United States. It is situated on the northern end of Topsail Island, a barrier island along the Atlantic Ocean. The town was incorporated in 1963 and has a population of approximately 1,500 people.
Geography
North Topsail Beach is located on the northern end of Topsail Island, a 26-mile long barrier island along the Atlantic Ocean. The town is bordered by the Intracoastal Waterway to the west and the Atlantic Ocean to the east. The town is approximately 25 miles north of Wilmington and 40 miles south of Jacksonville.
The town has a total area of 2.2 square miles, all of which is land. The town is located in the humid subtropical climate zone, with hot, humid summers and mild winters. The average temperature in the summer is around 80°F and the average temperature in the winter is around 50°F.
History
The area that is now North Topsail Beach was first inhabited by Native Americans, including the Croatan, Coree, and Tuscarora tribes. The first European settlers arrived in the area in the late 1700s. The town was originally known as “Topsail Beach” and was incorporated in 1963.
In the late 1960s, the town was the site of a major beach replenishment project. The project involved the dredging of sand from the Intracoastal Waterway and the placement of the sand on the beach. This project was completed in 1969 and resulted in the creation of a wide, sandy beach.
Economy
The economy of North Topsail Beach is largely based on tourism. The town is a popular destination for beachgoers, and there are numerous hotels, restaurants, and other businesses catering to tourists. The town also has a number of marinas and boat ramps, making it a popular destination for boaters.
Demographics
As of the 2010 census, there were 1,491 people, 690 households, and 441 families residing in the town. The population density was 676.2 people per square mile. The racial makeup of the town was 97.2% White, 0.7% African American, 0.2% Native American, 0.7% Asian, 0.1% Pacific Islander, 0.3% from other races, and 0.9% from two or more races. Hispanic or Latino of any race were 1.3% of the population.
The median income for a household in the town was $50,000, and the median income for a family was $60,000. The per capita income for the town was $25,000. About 8.2% of families and 10.2% of the population were below the poverty line, including 14.3% of those under age 18 and 4.2% of those age 65 or over.
Conclusion
North Topsail Beach is a small town located on the northern end of Topsail Island in North Carolina. The town was incorporated in 1963 and has a population of approximately 1,500 people. The economy of the town is largely based on tourism, and the town is a popular destination for beachgoers and boaters. The town has a diverse population, with a median income of $50,000 for households and $60,000 for families.
Common Questions
What is Per Capita Income in North Topsail Beach?
Per Capita income in North Topsail Beach is $67,603.
What is the Median Family Income in North Topsail Beach?
Median Family Income in North Topsail Beach is $116,719.
What is the Median Household income in North Topsail Beach?
Median Household Income in North Topsail Beach is $82,857.
What is Income or Wage Gap in North Topsail Beach?
Income or Wage Gap in North Topsail Beach is 30.5%.
Women in North Topsail Beach earn 69.5 cents for every dollar earned by a man.
What is Inequality or Gini Index in North Topsail Beach?
Inequality or Gini Index in North Topsail Beach is 0.52.
What is the Total Population of North Topsail Beach?
Total Population of North Topsail Beach is 775.
What is the Total Male Population of North Topsail Beach?
Total Male Population of North Topsail Beach is 422.
What is the Total Female Population of North Topsail Beach?
Total Female Population of North Topsail Beach is 353.
What is the Ratio of Males per 100 Females in North Topsail Beach?
There are 119.55 Males per 100 Females in North Topsail Beach.
What is the Ratio of Females per 100 Males in North Topsail Beach?
There are 83.65 Females per 100 Males in North Topsail Beach.
What is the Median Population Age in North Topsail Beach?
Median Population Age in North Topsail Beach is 60.0 Years.
What is the Average Family Size in North Topsail Beach
Average Family Size in North Topsail Beach is 2.5 People.
What is the Average Household Size in North Topsail Beach
Average Household Size in North Topsail Beach is 1.9 People.
How Large is the Labor Force in North Topsail Beach?
There are 383 People in the Labor Forcein in North Topsail Beach.
What is the Percentage of People in the Labor Force in North Topsail Beach?
51.5% of People are in the Labor Force in North Topsail Beach.
What is the Unemployment Rate in North Topsail Beach?
Unemployment Rate in North Topsail Beach is 8.1%.