White Plains, NC Map & Demographics
White Plains Map
White Plains Overview
$30,832
PER CAPITA INCOME
$76,512
AVG FAMILY INCOME
$47,375
AVG HOUSEHOLD INCOME
20.4%
WAGE / INCOME GAP [ % ]
79.6¢/ $1
WAGE / INCOME GAP [ $ ]
0.33
INEQUALITY / GINI INDEX
767
TOTAL POPULATION
366
MALE POPULATION
401
FEMALE POPULATION
91.27
MALES / 100 FEMALES
109.56
FEMALES / 100 MALES
54.1
MEDIAN AGE
2.6
AVG FAMILY SIZE
1.9
AVG HOUSEHOLD SIZE
376
LABOR FORCE [ PEOPLE ]
61.1%
PERCENT IN LABOR FORCE
Income in White Plains
Income Overview in White Plains
Per Capita Income in White Plains is $30,832, while median incomes of families and households are $76,512 and $47,375 respectively.
| Characteristic | Number | Measure |
| Per Capita Income | 767 | $30,832 |
| Median Family Income | 212 | $76,512 |
| Mean Family Income | 212 | $73,019 |
| Median Household Income | 401 | $47,375 |
| Mean Household Income | 401 | $59,314 |
| Income Deficit | 212 | $0 |
| Wage / Income Gap (%) | 767 | 20.38% |
| Wage / Income Gap ($) | 767 | 79.62¢ per $1 |
| Gini / Inequality Index | 767 | 0.33 |
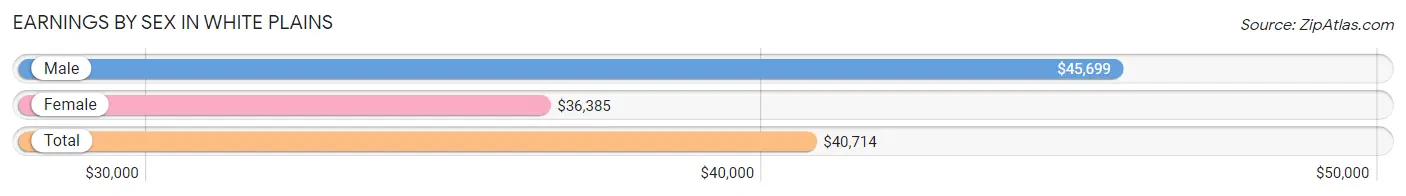
Earnings by Sex in White Plains
Average Earnings in White Plains are $40,714, $45,699 for men and $36,385 for women, a difference of 20.4%.
| Sex | Number | Average Earnings |
| Male | 253 (65.9%) | $45,699 |
| Female | 131 (34.1%) | $36,385 |
| Total | 384 (100.0%) | $40,714 |
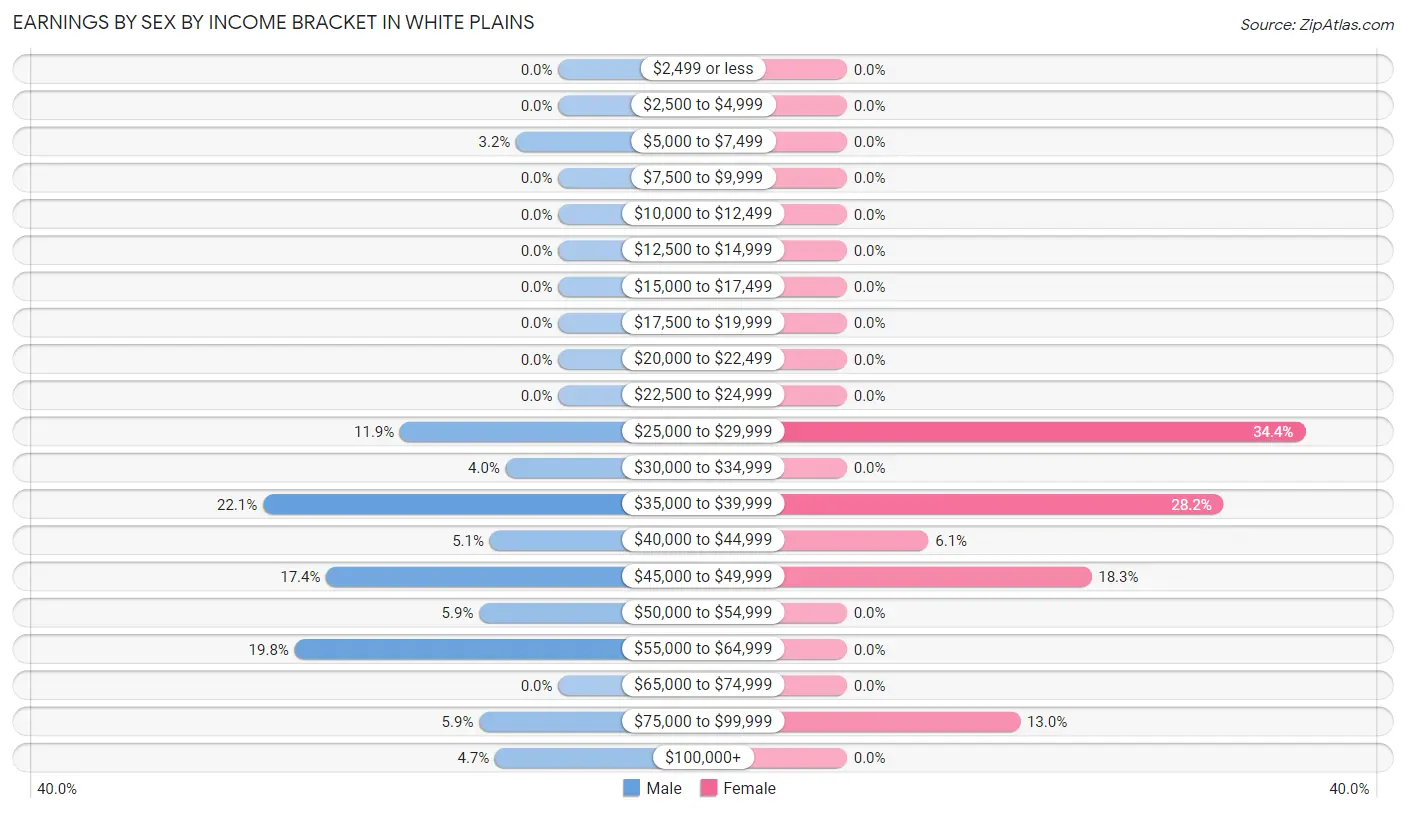
Earnings by Sex by Income Bracket in White Plains
The most common earnings brackets in White Plains are $35,000 to $39,999 for men (56 | 22.1%) and $25,000 to $29,999 for women (45 | 34.4%).
| Income | Male | Female |
| $2,499 or less | 0 (0.0%) | 0 (0.0%) |
| $2,500 to $4,999 | 0 (0.0%) | 0 (0.0%) |
| $5,000 to $7,499 | 8 (3.2%) | 0 (0.0%) |
| $7,500 to $9,999 | 0 (0.0%) | 0 (0.0%) |
| $10,000 to $12,499 | 0 (0.0%) | 0 (0.0%) |
| $12,500 to $14,999 | 0 (0.0%) | 0 (0.0%) |
| $15,000 to $17,499 | 0 (0.0%) | 0 (0.0%) |
| $17,500 to $19,999 | 0 (0.0%) | 0 (0.0%) |
| $20,000 to $22,499 | 0 (0.0%) | 0 (0.0%) |
| $22,500 to $24,999 | 0 (0.0%) | 0 (0.0%) |
| $25,000 to $29,999 | 30 (11.9%) | 45 (34.4%) |
| $30,000 to $34,999 | 10 (4.0%) | 0 (0.0%) |
| $35,000 to $39,999 | 56 (22.1%) | 37 (28.2%) |
| $40,000 to $44,999 | 13 (5.1%) | 8 (6.1%) |
| $45,000 to $49,999 | 44 (17.4%) | 24 (18.3%) |
| $50,000 to $54,999 | 15 (5.9%) | 0 (0.0%) |
| $55,000 to $64,999 | 50 (19.8%) | 0 (0.0%) |
| $65,000 to $74,999 | 0 (0.0%) | 0 (0.0%) |
| $75,000 to $99,999 | 15 (5.9%) | 17 (13.0%) |
| $100,000+ | 12 (4.7%) | 0 (0.0%) |
| Total | 253 (100.0%) | 131 (100.0%) |
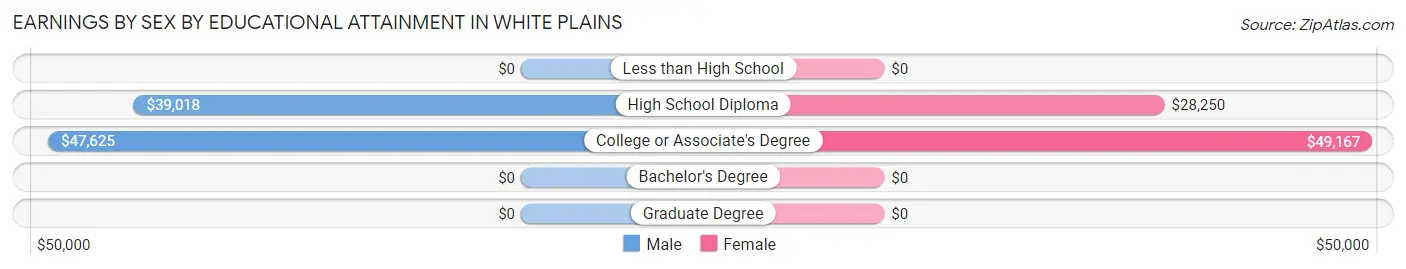
Earnings by Sex by Educational Attainment in White Plains
Average earnings in White Plains are $45,699 for men and $36,477 for women, a difference of 20.2%. Men with an educational attainment of college or associate's degree enjoy the highest average annual earnings of $47,625, while those with high school diploma education earn the least with $39,018. Women with an educational attainment of college or associate's degree earn the most with the average annual earnings of $49,167, while those with high school diploma education have the smallest earnings of $28,250.
| Educational Attainment | Male Income | Female Income |
| Less than High School | - | - |
| High School Diploma | $39,018 | $28,250 |
| College or Associate's Degree | $47,625 | $49,167 |
| Bachelor's Degree | - | - |
| Graduate Degree | - | - |
| Total | $45,699 | $36,477 |
Family Income in White Plains
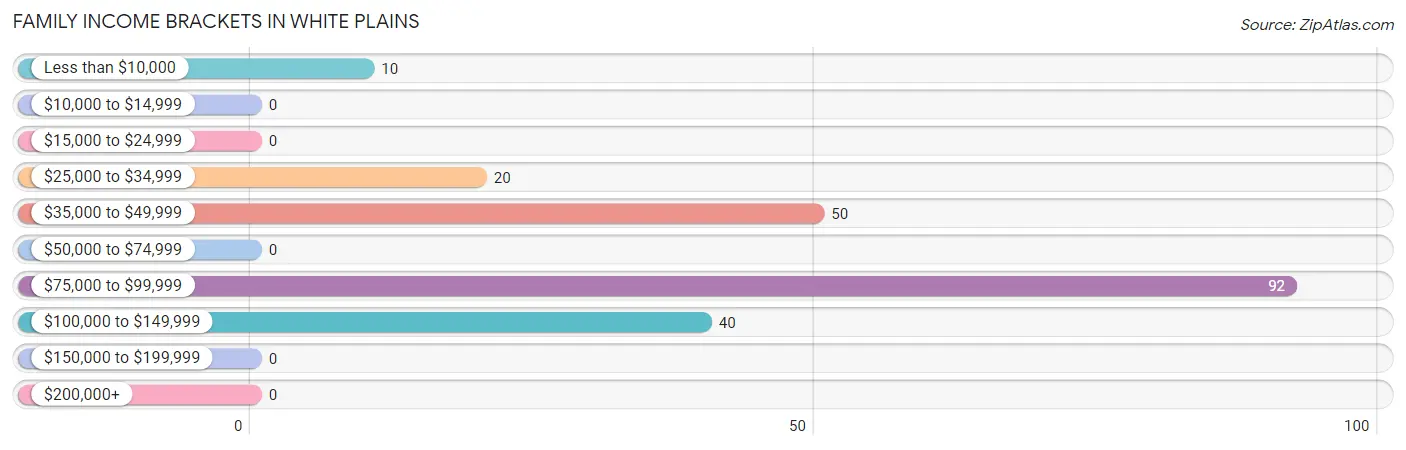
Family Income Brackets in White Plains
According to the White Plains family income data, there are 92 families falling into the $75,000 to $99,999 income range, which is the most common income bracket and makes up 43.4% of all families.
| Income Bracket | # Families | % Families |
| Less than $10,000 | 10 | 4.7% |
| $10,000 to $14,999 | 0 | 0.0% |
| $15,000 to $24,999 | 0 | 0.0% |
| $25,000 to $34,999 | 20 | 9.4% |
| $35,000 to $49,999 | 50 | 23.6% |
| $50,000 to $74,999 | 0 | 0.0% |
| $75,000 to $99,999 | 92 | 43.4% |
| $100,000 to $149,999 | 40 | 18.9% |
| $150,000 to $199,999 | 0 | 0.0% |
| $200,000+ | 0 | 0.0% |
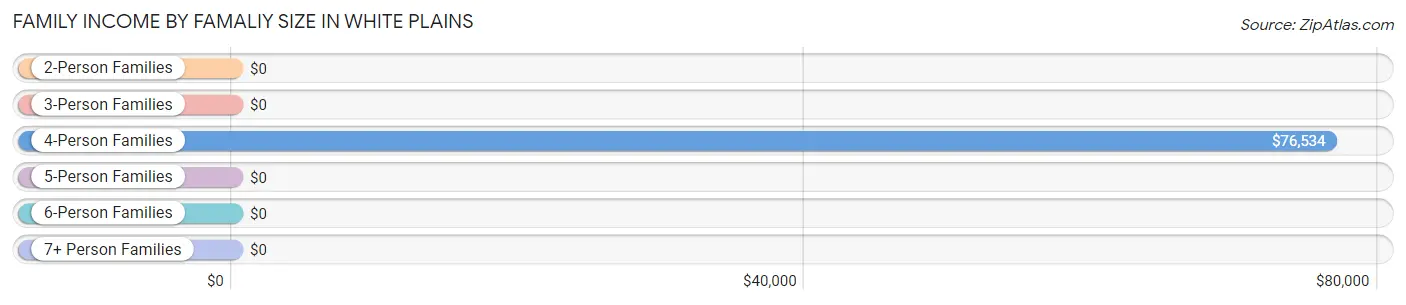
Family Income by Famaliy Size in White Plains
4-person families (47 | 22.2%) account for the highest median family income in White Plains with $76,534 per family, while 4-person families (47 | 22.2%) have the highest median income of $19,134 per family member.
| Income Bracket | # Families | Median Income |
| 2-Person Families | 129 (60.9%) | $0 |
| 3-Person Families | 36 (17.0%) | $0 |
| 4-Person Families | 47 (22.2%) | $76,534 |
| 5-Person Families | 0 (0.0%) | $0 |
| 6-Person Families | 0 (0.0%) | $0 |
| 7+ Person Families | 0 (0.0%) | $0 |
| Total | 212 (100.0%) | $76,512 |
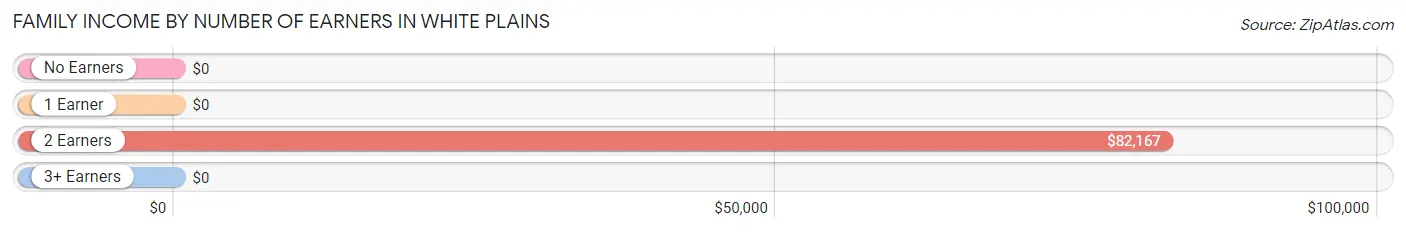
Family Income by Number of Earners in White Plains
| Number of Earners | # Families | Median Income |
| No Earners | 38 (17.9%) | $0 |
| 1 Earner | 78 (36.8%) | $0 |
| 2 Earners | 96 (45.3%) | $82,167 |
| 3+ Earners | 0 (0.0%) | $0 |
| Total | 212 (100.0%) | $76,512 |
Household Income in White Plains
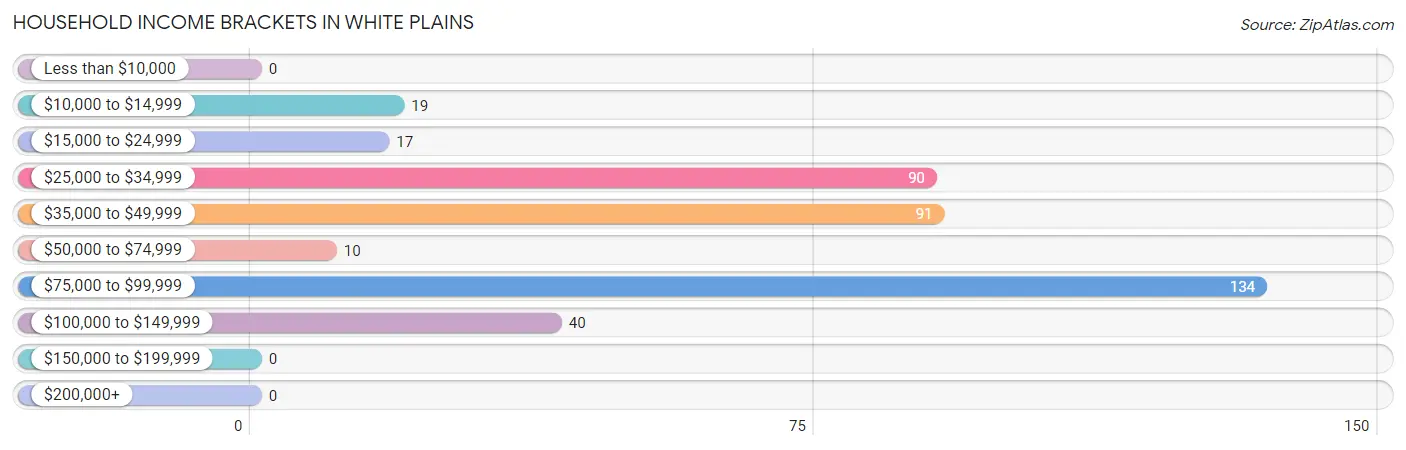
Household Income Brackets in White Plains
With 134 households falling in the category, the $75,000 to $99,999 income range is the most frequent in White Plains, accounting for 33.4% of all households.
| Income Bracket | # Households | % Households |
| Less than $10,000 | 0 | 0.0% |
| $10,000 to $14,999 | 19 | 4.7% |
| $15,000 to $24,999 | 17 | 4.2% |
| $25,000 to $34,999 | 90 | 22.4% |
| $35,000 to $49,999 | 91 | 22.7% |
| $50,000 to $74,999 | 10 | 2.5% |
| $75,000 to $99,999 | 134 | 33.4% |
| $100,000 to $149,999 | 40 | 10.0% |
| $150,000 to $199,999 | 0 | 0.0% |
| $200,000+ | 0 | 0.0% |
Household Income by Householder Age in White Plains
The median household income in White Plains is $47,375, with the highest median household income of $88,167 found in the 25 to 44 years age bracket for the primary householder. A total of 70 households (17.5%) fall into this category. Meanwhile, the 15 to 24 years age bracket for the primary householder has the lowest median household income of $0, with 15 households (3.7%) in this group.
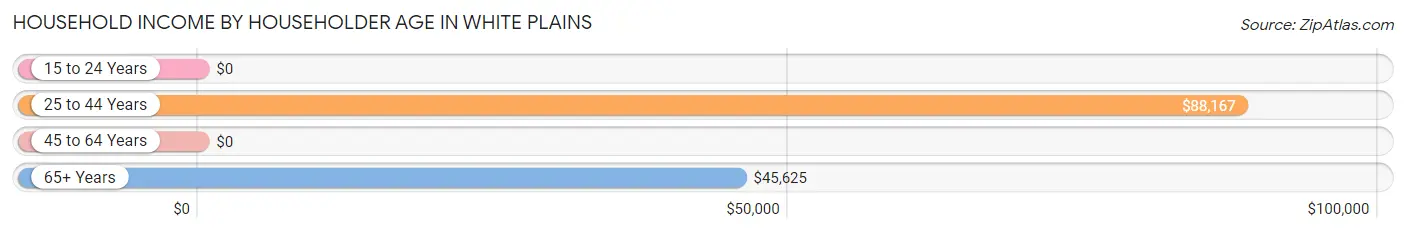
| Income Bracket | # Households | Median Income |
| 15 to 24 Years | 15 (3.7%) | $0 |
| 25 to 44 Years | 70 (17.5%) | $88,167 |
| 45 to 64 Years | 179 (44.6%) | $0 |
| 65+ Years | 137 (34.2%) | $45,625 |
| Total | 401 (100.0%) | $47,375 |
Poverty in White Plains
Income Below Poverty by Sex and Age in White Plains
With 7.1% poverty level for males and 16.0% for females among the residents of White Plains, 12 to 14 year old males and 35 to 44 year old females are the most vulnerable to poverty, with 10 males (100.0%) and 12 females (46.2%) in their respective age groups living below the poverty level.
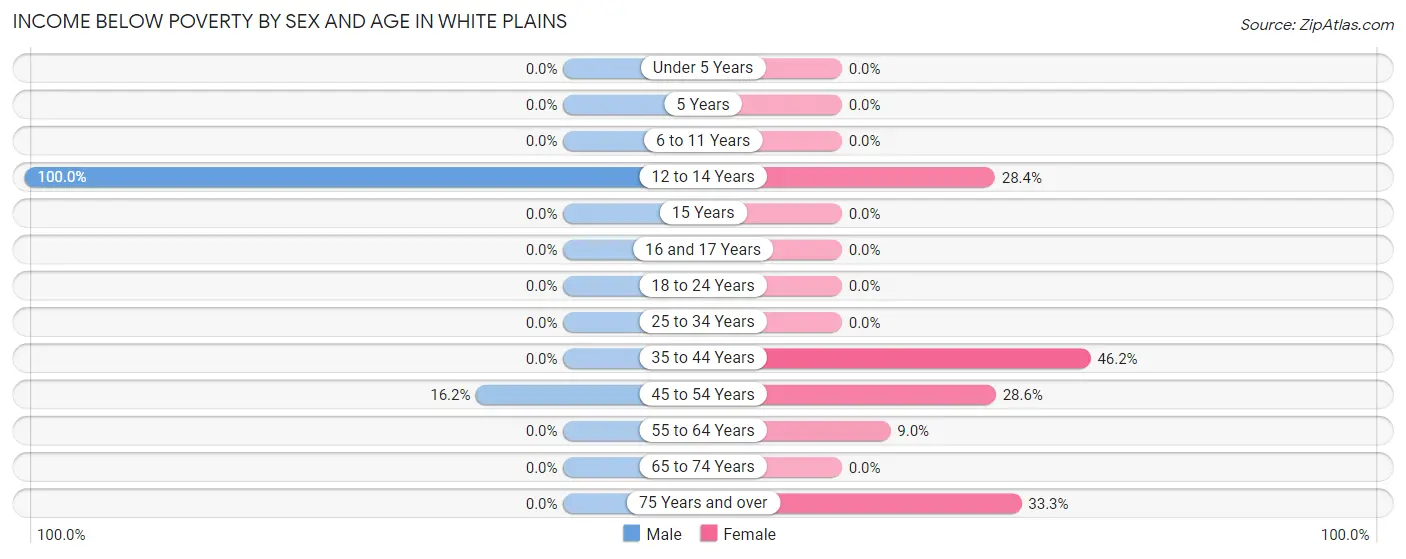
| Age Bracket | Male | Female |
| Under 5 Years | 0 (0.0%) | 0 (0.0%) |
| 5 Years | 0 (0.0%) | 0 (0.0%) |
| 6 to 11 Years | 0 (0.0%) | 0 (0.0%) |
| 12 to 14 Years | 10 (100.0%) | 23 (28.4%) |
| 15 Years | 0 (0.0%) | 0 (0.0%) |
| 16 and 17 Years | 0 (0.0%) | 0 (0.0%) |
| 18 to 24 Years | 0 (0.0%) | 0 (0.0%) |
| 25 to 34 Years | 0 (0.0%) | 0 (0.0%) |
| 35 to 44 Years | 0 (0.0%) | 12 (46.2%) |
| 45 to 54 Years | 16 (16.2%) | 10 (28.6%) |
| 55 to 64 Years | 0 (0.0%) | 10 (9.0%) |
| 65 to 74 Years | 0 (0.0%) | 0 (0.0%) |
| 75 Years and over | 0 (0.0%) | 9 (33.3%) |
| Total | 26 (7.1%) | 64 (16.0%) |
Income Above Poverty by Sex and Age in White Plains
According to the poverty statistics in White Plains, males aged 6 to 11 years and females aged under 5 years are the age groups that are most secure financially, with 100.0% of males and 100.0% of females in these age groups living above the poverty line.
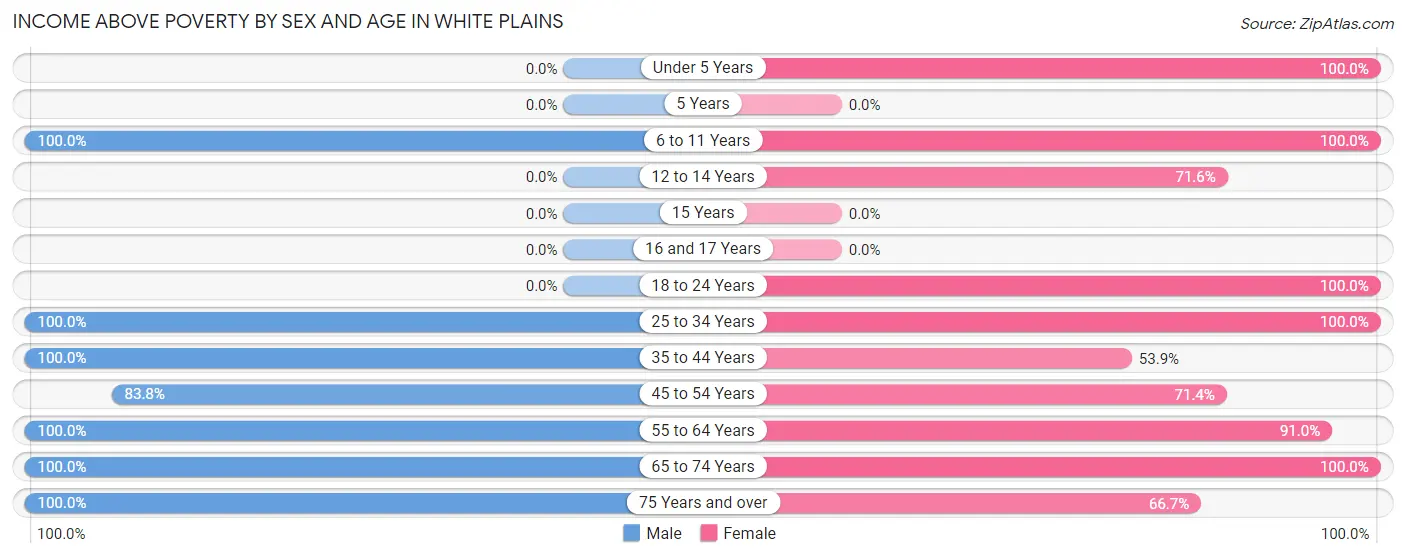
| Age Bracket | Male | Female |
| Under 5 Years | 0 (0.0%) | 22 (100.0%) |
| 5 Years | 0 (0.0%) | 0 (0.0%) |
| 6 to 11 Years | 23 (100.0%) | 16 (100.0%) |
| 12 to 14 Years | 0 (0.0%) | 58 (71.6%) |
| 15 Years | 0 (0.0%) | 0 (0.0%) |
| 16 and 17 Years | 0 (0.0%) | 0 (0.0%) |
| 18 to 24 Years | 0 (0.0%) | 15 (100.0%) |
| 25 to 34 Years | 41 (100.0%) | 24 (100.0%) |
| 35 to 44 Years | 30 (100.0%) | 14 (53.8%) |
| 45 to 54 Years | 83 (83.8%) | 25 (71.4%) |
| 55 to 64 Years | 60 (100.0%) | 101 (91.0%) |
| 65 to 74 Years | 45 (100.0%) | 44 (100.0%) |
| 75 Years and over | 58 (100.0%) | 18 (66.7%) |
| Total | 340 (92.9%) | 337 (84.0%) |
Income Below Poverty Among Married-Couple Families in White Plains
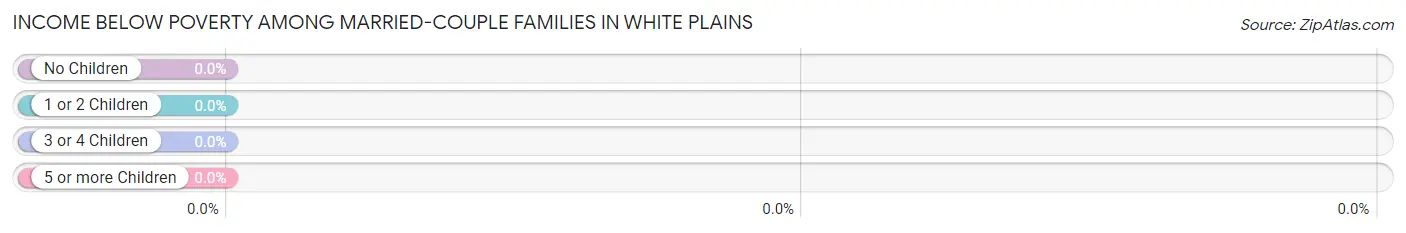
| Children | Above Poverty | Below Poverty |
| No Children | 119 (100.0%) | 0 (0.0%) |
| 1 or 2 Children | 73 (100.0%) | 0 (0.0%) |
| 3 or 4 Children | 0 (0.0%) | 0 (0.0%) |
| 5 or more Children | 0 (0.0%) | 0 (0.0%) |
| Total | 192 (100.0%) | 0 (0.0%) |
Income Below Poverty Among Single-Parent Households in White Plains
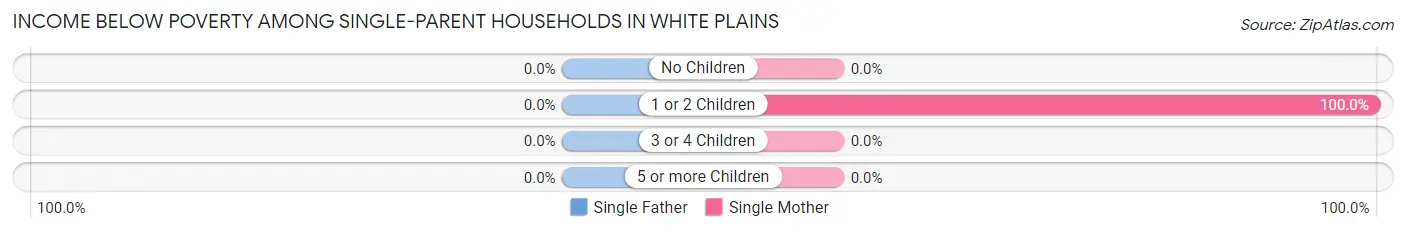
| Children | Single Father | Single Mother |
| No Children | 0 (0.0%) | 0 (0.0%) |
| 1 or 2 Children | 0 (0.0%) | 20 (100.0%) |
| 3 or 4 Children | 0 (0.0%) | 0 (0.0%) |
| 5 or more Children | 0 (0.0%) | 0 (0.0%) |
| Total | 0 (0.0%) | 20 (100.0%) |
Income Below Poverty Among Married-Couple vs Single-Parent Households in White Plains
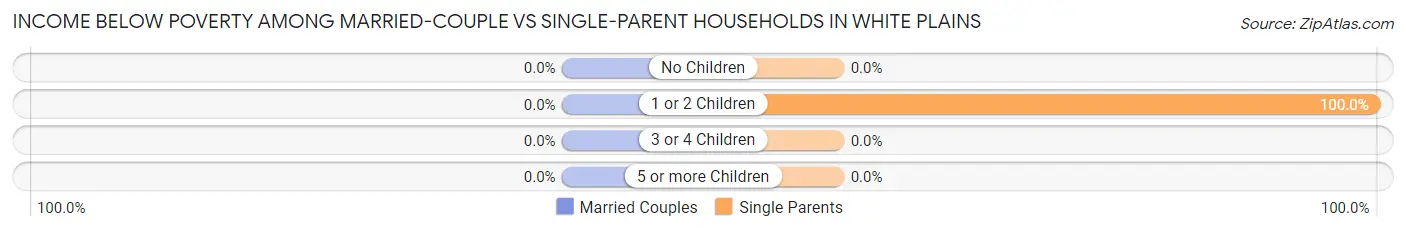
| Children | Married-Couple Families | Single-Parent Households |
| No Children | 0 (0.0%) | 0 (0.0%) |
| 1 or 2 Children | 0 (0.0%) | 20 (100.0%) |
| 3 or 4 Children | 0 (0.0%) | 0 (0.0%) |
| 5 or more Children | 0 (0.0%) | 0 (0.0%) |
| Total | 0 (0.0%) | 20 (100.0%) |
Race in White Plains
The most populous races in White Plains are , and White / Caucasian (767 | 100.0%).
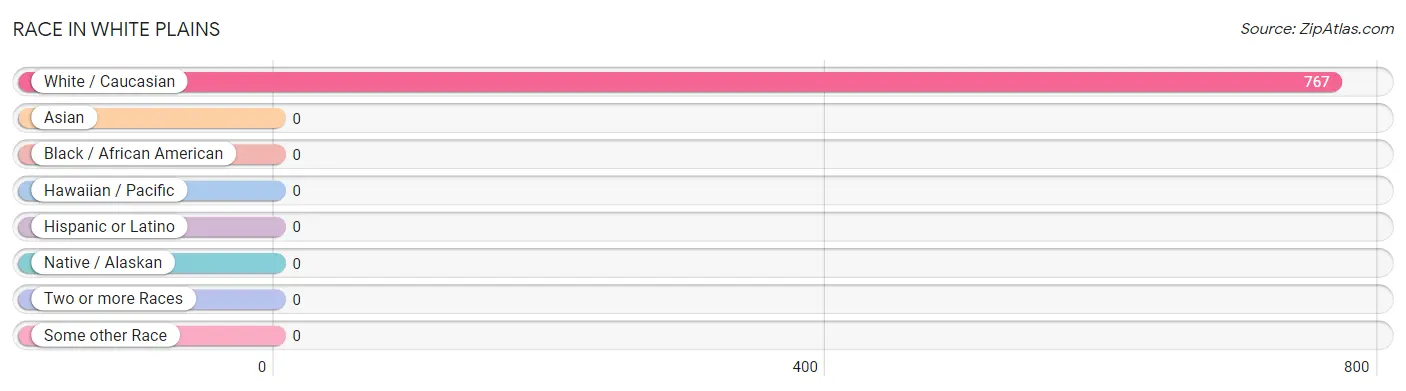
| Race | # Population | % Population |
| Asian | 0 | 0.0% |
| Black / African American | 0 | 0.0% |
| Hawaiian / Pacific | 0 | 0.0% |
| Hispanic or Latino | 0 | 0.0% |
| Native / Alaskan | 0 | 0.0% |
| White / Caucasian | 767 | 100.0% |
| Two or more Races | 0 | 0.0% |
| Some other Race | 0 | 0.0% |
| Total | 767 | 100.0% |
Ancestry in White Plains
The most populous ancestries reported in White Plains are English (314 | 40.9%), American (192 | 25.0%), German (95 | 12.4%), Scotch-Irish (40 | 5.2%), and British (33 | 4.3%), together accounting for 87.9% of all White Plains residents.
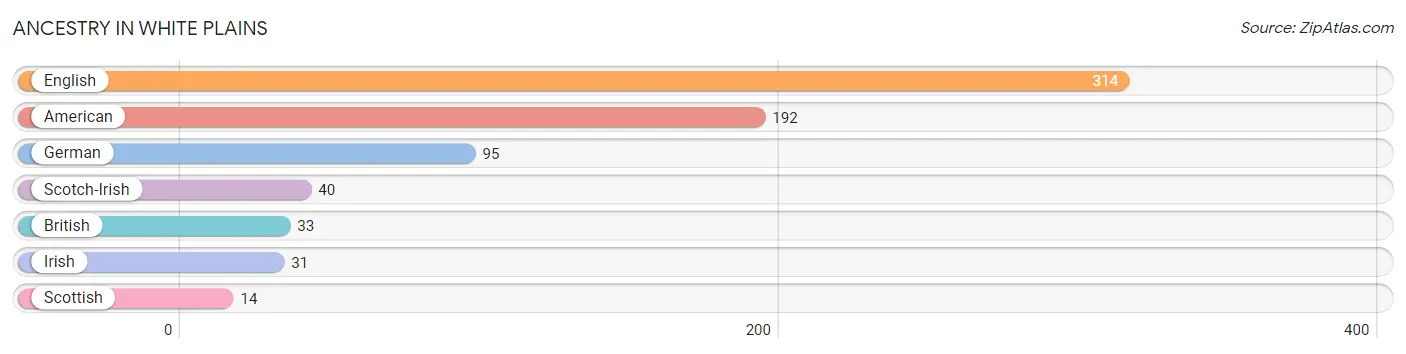
| Ancestry | # Population | % Population |
| American | 192 | 25.0% |
| British | 33 | 4.3% |
| English | 314 | 40.9% |
| German | 95 | 12.4% |
| Irish | 31 | 4.0% |
| Scotch-Irish | 40 | 5.2% |
| Scottish | 14 | 1.8% | View All 7 Rows |
Immigrants in White Plains

| Immigration Origin | # Population | % Population | View All 0 Rows |
Sex and Age in White Plains
Sex and Age in White Plains
The most populous age groups in White Plains are 50 to 54 Years (63 | 17.2%) for men and 10 to 14 Years (97 | 24.2%) for women.
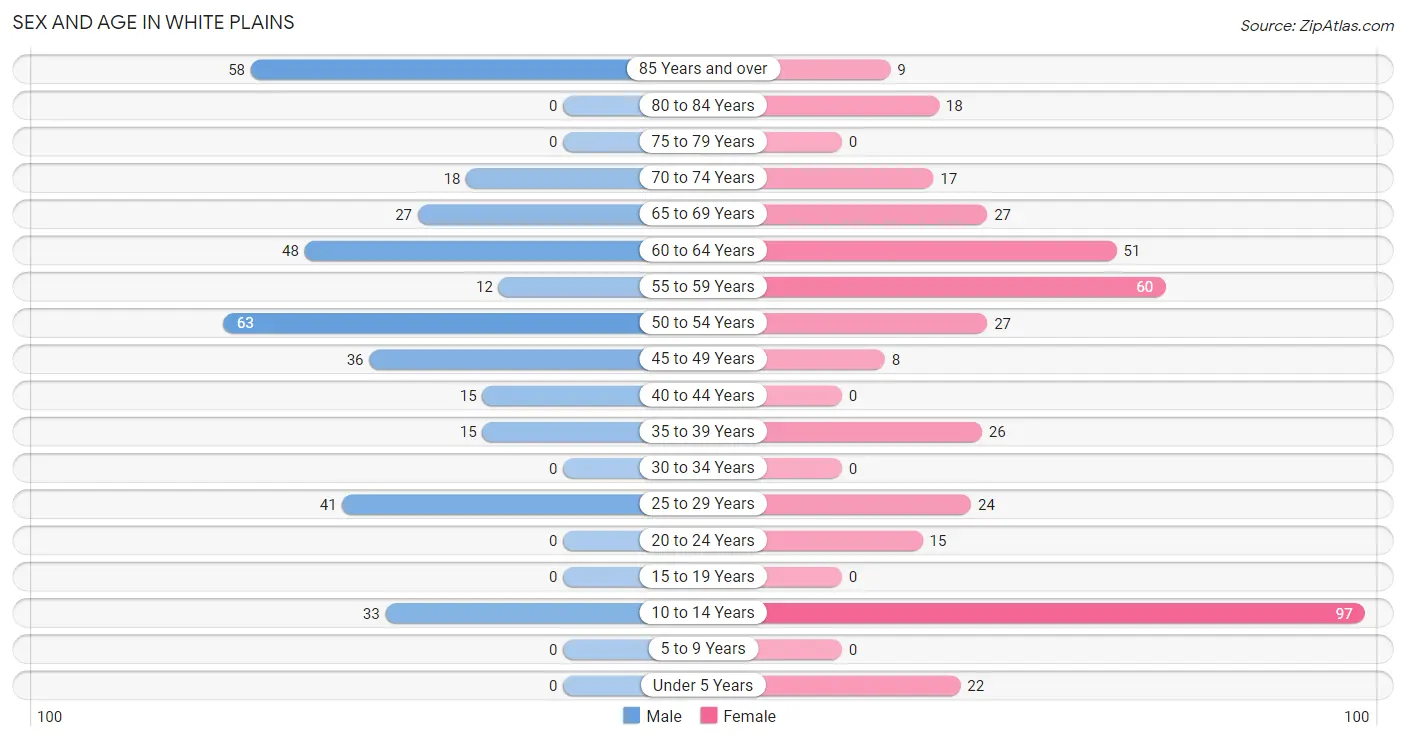
| Age Bracket | Male | Female |
| Under 5 Years | 0 (0.0%) | 22 (5.5%) |
| 5 to 9 Years | 0 (0.0%) | 0 (0.0%) |
| 10 to 14 Years | 33 (9.0%) | 97 (24.2%) |
| 15 to 19 Years | 0 (0.0%) | 0 (0.0%) |
| 20 to 24 Years | 0 (0.0%) | 15 (3.7%) |
| 25 to 29 Years | 41 (11.2%) | 24 (6.0%) |
| 30 to 34 Years | 0 (0.0%) | 0 (0.0%) |
| 35 to 39 Years | 15 (4.1%) | 26 (6.5%) |
| 40 to 44 Years | 15 (4.1%) | 0 (0.0%) |
| 45 to 49 Years | 36 (9.8%) | 8 (2.0%) |
| 50 to 54 Years | 63 (17.2%) | 27 (6.7%) |
| 55 to 59 Years | 12 (3.3%) | 60 (15.0%) |
| 60 to 64 Years | 48 (13.1%) | 51 (12.7%) |
| 65 to 69 Years | 27 (7.4%) | 27 (6.7%) |
| 70 to 74 Years | 18 (4.9%) | 17 (4.2%) |
| 75 to 79 Years | 0 (0.0%) | 0 (0.0%) |
| 80 to 84 Years | 0 (0.0%) | 18 (4.5%) |
| 85 Years and over | 58 (15.9%) | 9 (2.2%) |
| Total | 366 (100.0%) | 401 (100.0%) |
Families and Households in White Plains
Median Family Size in White Plains
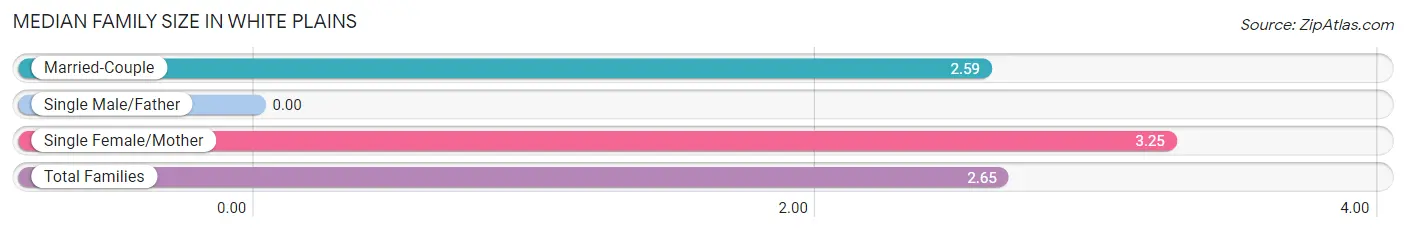
| Family Type | # Families | Family Size |
| Married-Couple | 192 (90.6%) | 2.59 |
| Single Male/Father | 0 (0.0%) | - |
| Single Female/Mother | 20 (9.4%) | 3.25 |
| Total Families | 212 (100.0%) | 2.65 |
Median Household Size in White Plains
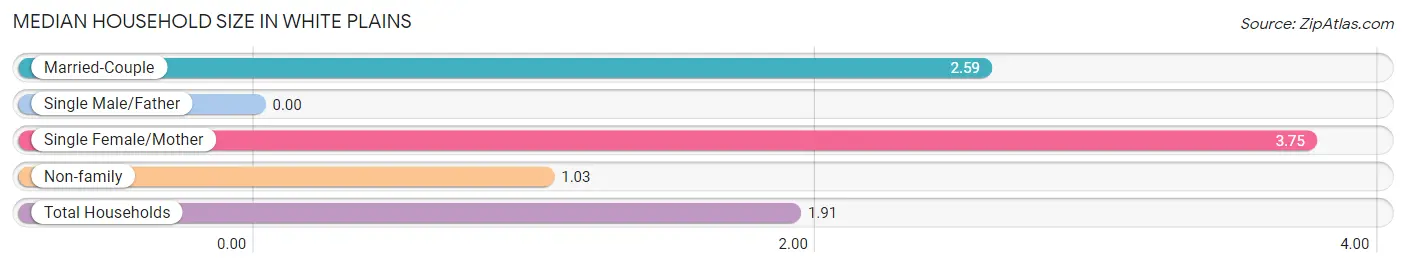
| Household Type | # Households | Household Size |
| Married-Couple | 192 (47.9%) | 2.59 |
| Single Male/Father | 0 (0.0%) | - |
| Single Female/Mother | 20 (5.0%) | 3.75 |
| Non-family | 189 (47.1%) | 1.03 |
| Total Households | 401 (100.0%) | 1.91 |
Household Size by Marriage Status in White Plains
Out of a total of 401 households in White Plains, 212 (52.9%) are family households, while 189 (47.1%) are nonfamily households. The most numerous type of family households are 2-person households, comprising 119, and the most common type of nonfamily households are 1-person households, comprising 181.
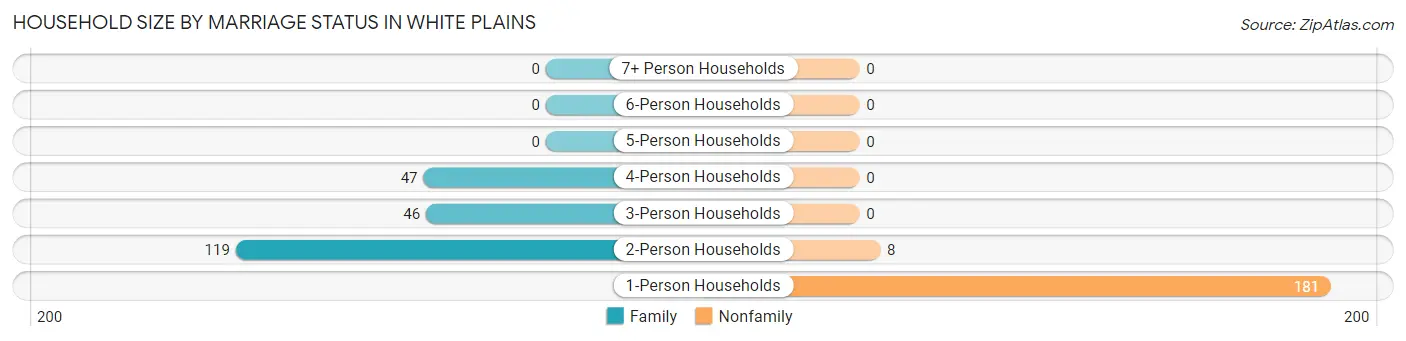
| Household Size | Family Households | Nonfamily Households |
| 1-Person Households | - | 181 (45.1%) |
| 2-Person Households | 119 (29.7%) | 8 (2.0%) |
| 3-Person Households | 46 (11.5%) | 0 (0.0%) |
| 4-Person Households | 47 (11.7%) | 0 (0.0%) |
| 5-Person Households | 0 (0.0%) | 0 (0.0%) |
| 6-Person Households | 0 (0.0%) | 0 (0.0%) |
| 7+ Person Households | 0 (0.0%) | 0 (0.0%) |
| Total | 212 (52.9%) | 189 (47.1%) |
Female Fertility in White Plains
Fertility by Age in White Plains
Average fertility rate in White Plains is 255.0 births per 1,000 women. Women in the age bracket of 20 to 34 years have the highest fertility rate with 615.0 births per 1,000 women. Women in the age bracket of 20 to 34 years acount for 100.0% of all women with births.
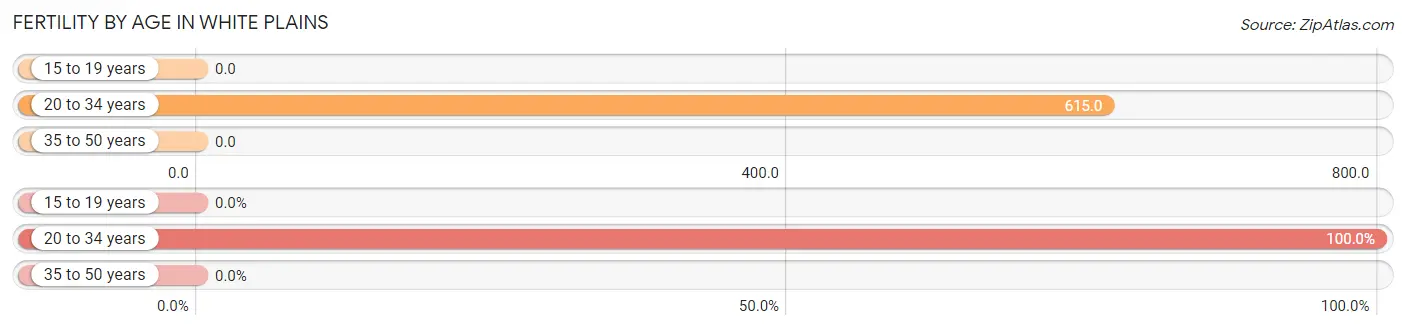
| Age Bracket | Women with Births | Births / 1,000 Women |
| 15 to 19 years | 0 (0.0%) | 0.0 |
| 20 to 34 years | 24 (100.0%) | 615.0 |
| 35 to 50 years | 0 (0.0%) | 0.0 |
| Total | 24 (100.0%) | 255.0 |
Fertility by Age by Marriage Status in White Plains
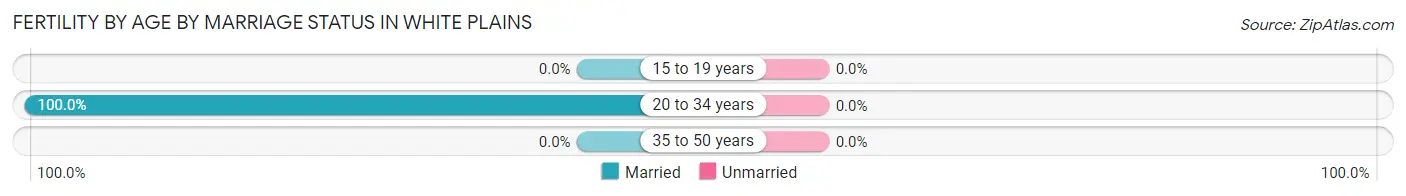
| Age Bracket | Married | Unmarried |
| 15 to 19 years | 0 (0.0%) | 0 (0.0%) |
| 20 to 34 years | 24 (100.0%) | 0 (0.0%) |
| 35 to 50 years | 0 (0.0%) | 0 (0.0%) |
| Total | 24 (100.0%) | 0 (0.0%) |
Fertility by Education in White Plains
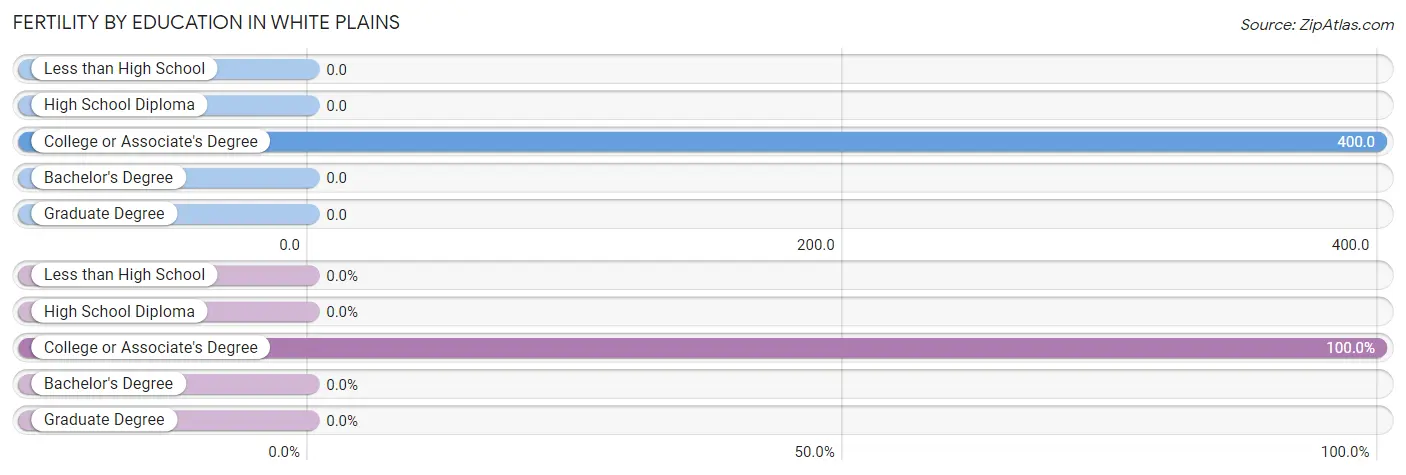
| Educational Attainment | Women with Births | Births / 1,000 Women |
| Less than High School | 0 (0.0%) | 0.0 |
| High School Diploma | 0 (0.0%) | 0.0 |
| College or Associate's Degree | 24 (100.0%) | 400.0 |
| Bachelor's Degree | 0 (0.0%) | 0.0 |
| Graduate Degree | 0 (0.0%) | 0.0 |
| Total | 24 (100.0%) | 255.0 |
Fertility by Education by Marriage Status in White Plains
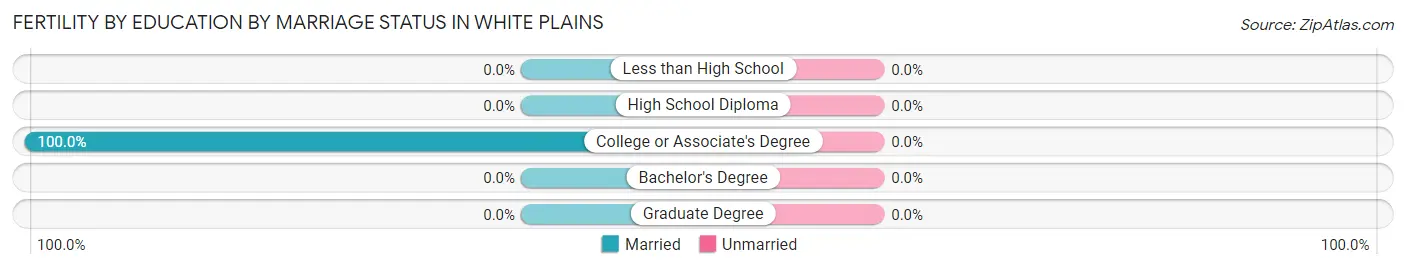
| Educational Attainment | Married | Unmarried |
| Less than High School | 0 (0.0%) | 0 (0.0%) |
| High School Diploma | 0 (0.0%) | 0 (0.0%) |
| College or Associate's Degree | 24 (100.0%) | 0 (0.0%) |
| Bachelor's Degree | 0 (0.0%) | 0 (0.0%) |
| Graduate Degree | 0 (0.0%) | 0 (0.0%) |
| Total | 24 (100.0%) | 0 (0.0%) |
Employment Characteristics in White Plains
Employment by Class of Employer in White Plains
Among the 352 employed individuals in White Plains, private company employees (243 | 69.0%), local government employees (59 | 16.8%), and self-employed (incorporated) (35 | 9.9%) make up the most common classes of employment.
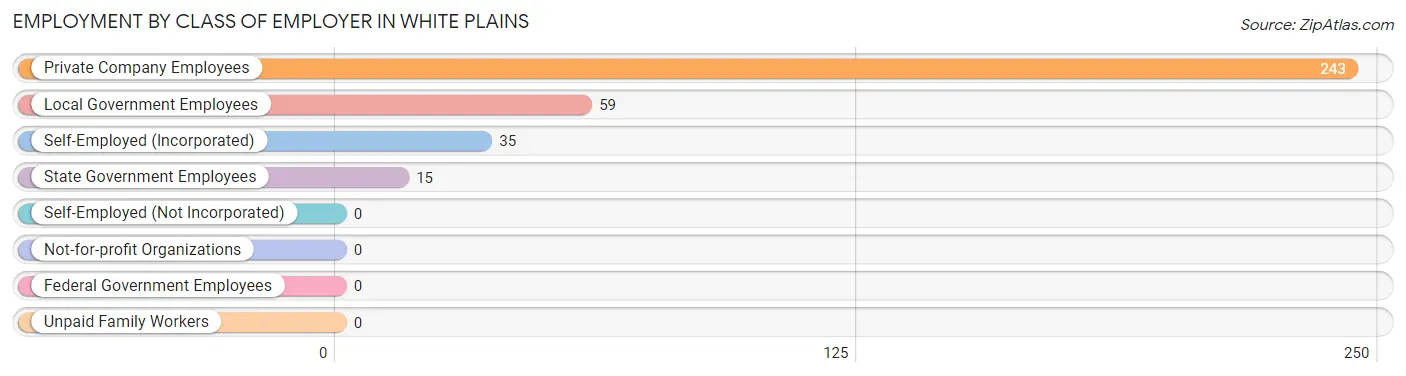
| Employer Class | # Employees | % Employees |
| Private Company Employees | 243 | 69.0% |
| Self-Employed (Incorporated) | 35 | 9.9% |
| Self-Employed (Not Incorporated) | 0 | 0.0% |
| Not-for-profit Organizations | 0 | 0.0% |
| Local Government Employees | 59 | 16.8% |
| State Government Employees | 15 | 4.3% |
| Federal Government Employees | 0 | 0.0% |
| Unpaid Family Workers | 0 | 0.0% |
| Total | 352 | 100.0% |
Employment Status by Age in White Plains
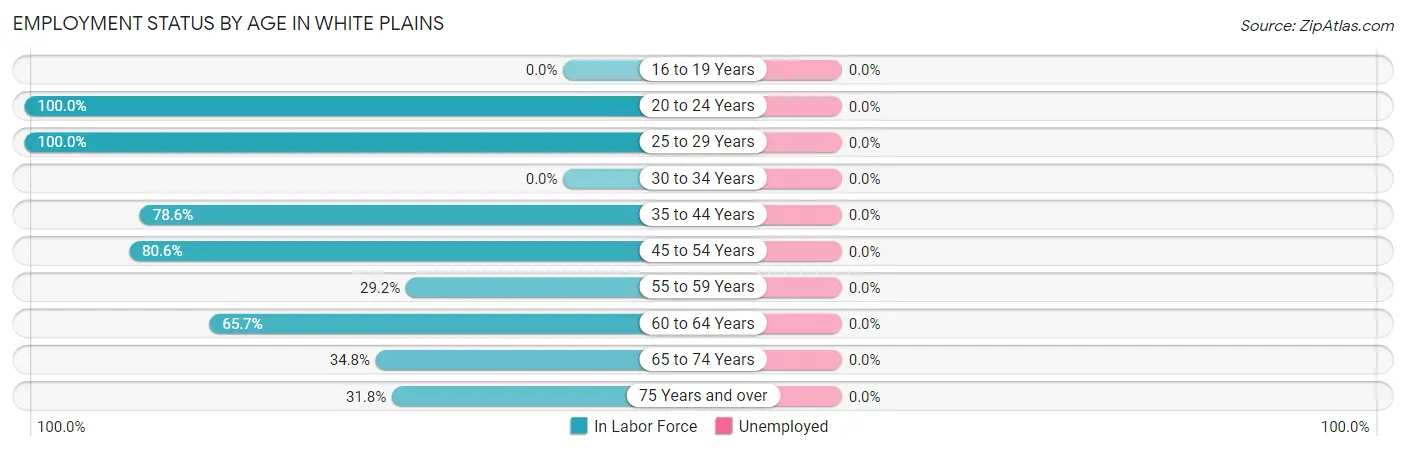
| Age Bracket | In Labor Force | Unemployed |
| 16 to 19 Years | 0 (0.0%) | 0 (0.0%) |
| 20 to 24 Years | 15 (100.0%) | 0 (0.0%) |
| 25 to 29 Years | 65 (100.0%) | 0 (0.0%) |
| 30 to 34 Years | 0 (0.0%) | 0 (0.0%) |
| 35 to 44 Years | 44 (78.6%) | 0 (0.0%) |
| 45 to 54 Years | 108 (80.6%) | 0 (0.0%) |
| 55 to 59 Years | 21 (29.2%) | 0 (0.0%) |
| 60 to 64 Years | 65 (65.7%) | 0 (0.0%) |
| 65 to 74 Years | 31 (34.8%) | 0 (0.0%) |
| 75 Years and over | 27 (31.8%) | 0 (0.0%) |
| Total | 376 (61.1%) | 0 (0.0%) |
Employment Status by Educational Attainment in White Plains
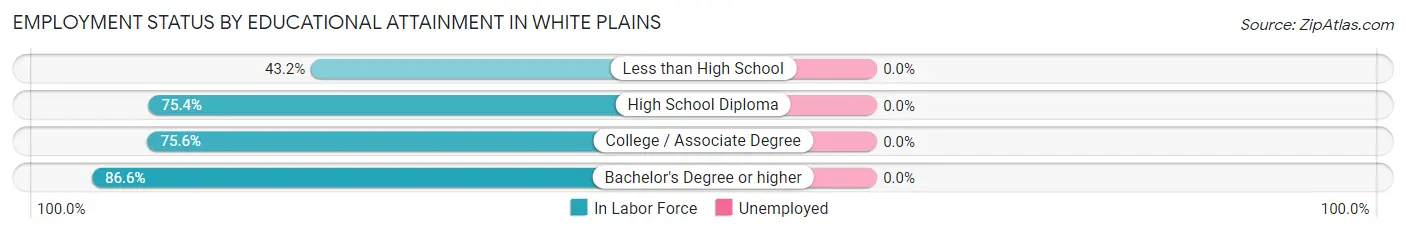
| Educational Attainment | In Labor Force | Unemployed |
| Less than High School | 35 (43.2%) | 0 (0.0%) |
| High School Diploma | 86 (75.4%) | 0 (0.0%) |
| College / Associate Degree | 124 (75.6%) | 0 (0.0%) |
| Bachelor's Degree or higher | 58 (86.6%) | 0 (0.0%) |
| Total | 303 (71.1%) | 0 (0.0%) |
Employment Occupations by Sex in White Plains
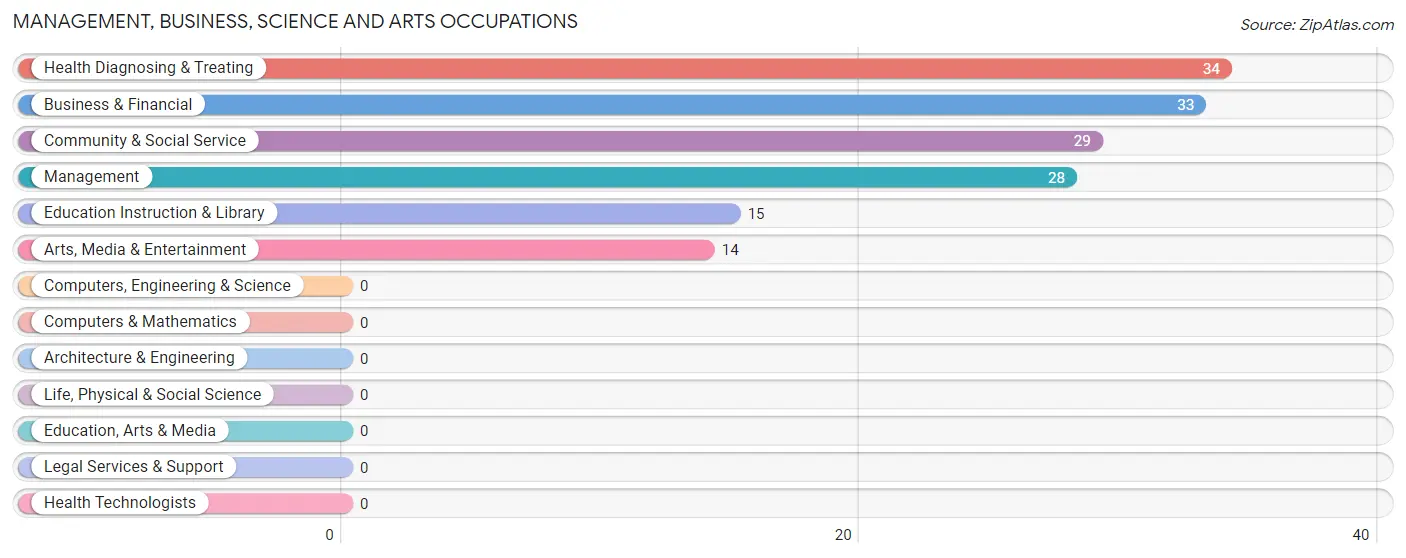
Management, Business, Science and Arts Occupations
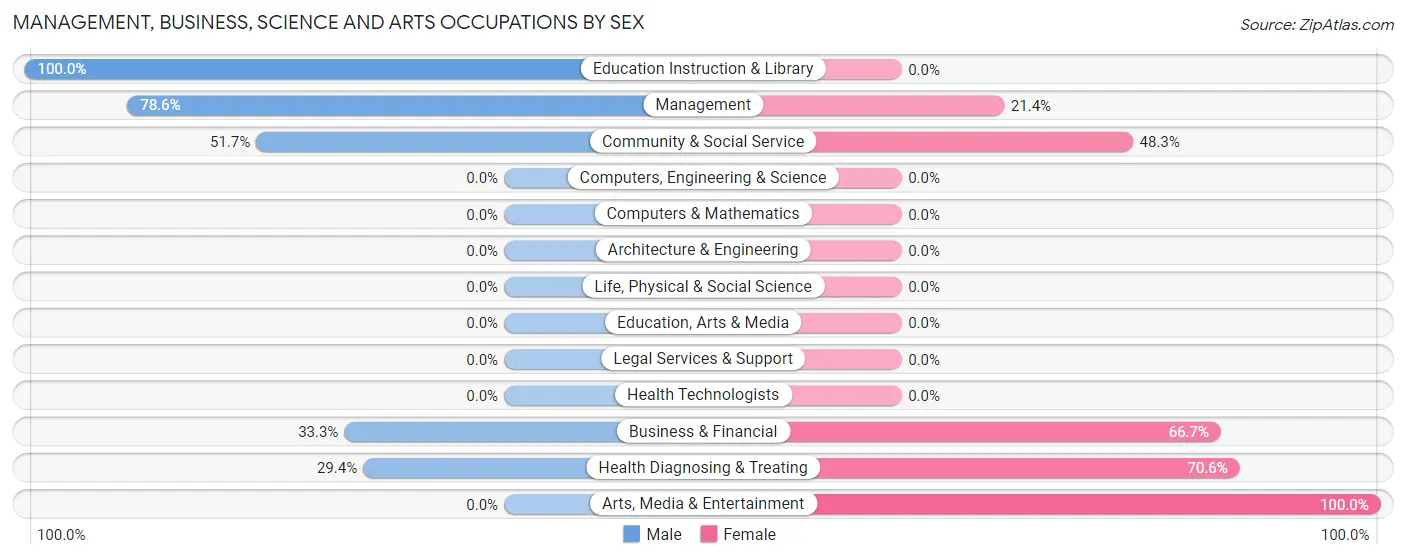
The most common Management, Business, Science and Arts occupations in White Plains are Health Diagnosing & Treating (34 | 9.0%), Business & Financial (33 | 8.8%), Community & Social Service (29 | 7.7%), Management (28 | 7.4%), and Education Instruction & Library (15 | 4.0%).
Management, Business, Science and Arts Occupations by Sex
Within the Management, Business, Science and Arts occupations in White Plains, the most male-oriented occupations are Education Instruction & Library (100.0%), Management (78.6%), and Community & Social Service (51.7%), while the most female-oriented occupations are Arts, Media & Entertainment (100.0%), Health Diagnosing & Treating (70.6%), and Business & Financial (66.7%).
| Occupation | Male | Female |
| Management | 22 (78.6%) | 6 (21.4%) |
| Business & Financial | 11 (33.3%) | 22 (66.7%) |
| Computers, Engineering & Science | 0 (0.0%) | 0 (0.0%) |
| Computers & Mathematics | 0 (0.0%) | 0 (0.0%) |
| Architecture & Engineering | 0 (0.0%) | 0 (0.0%) |
| Life, Physical & Social Science | 0 (0.0%) | 0 (0.0%) |
| Community & Social Service | 15 (51.7%) | 14 (48.3%) |
| Education, Arts & Media | 0 (0.0%) | 0 (0.0%) |
| Legal Services & Support | 0 (0.0%) | 0 (0.0%) |
| Education Instruction & Library | 15 (100.0%) | 0 (0.0%) |
| Arts, Media & Entertainment | 0 (0.0%) | 14 (100.0%) |
| Health Diagnosing & Treating | 10 (29.4%) | 24 (70.6%) |
| Health Technologists | 0 (0.0%) | 0 (0.0%) |
| Total (Category) | 58 (46.8%) | 66 (53.2%) |
| Total (Overall) | 245 (65.2%) | 131 (34.8%) |
Services Occupations
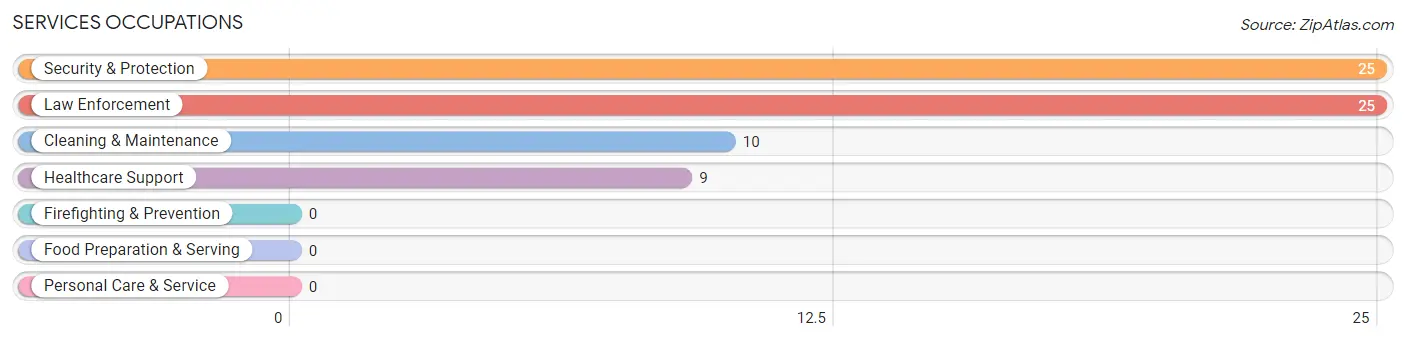
The most common Services occupations in White Plains are Security & Protection (25 | 6.7%), Law Enforcement (25 | 6.7%), Cleaning & Maintenance (10 | 2.7%), and Healthcare Support (9 | 2.4%).
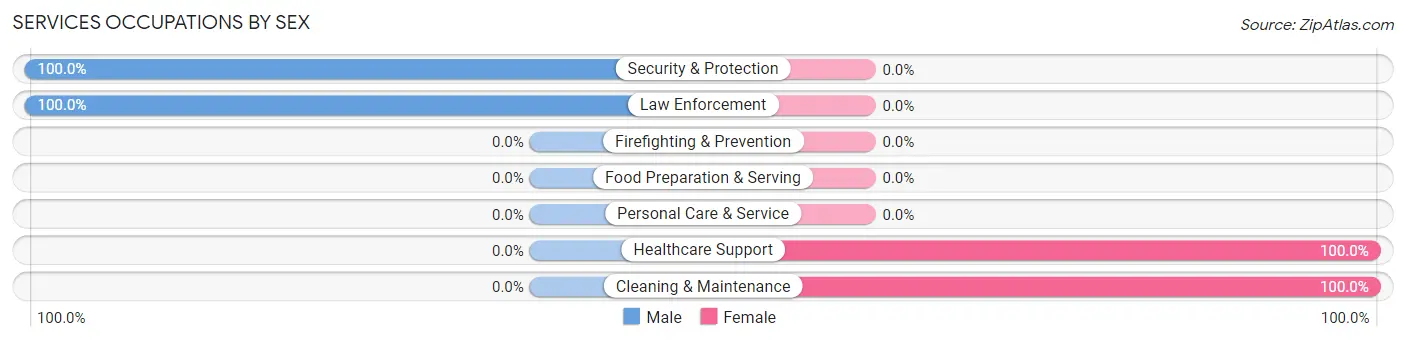
Services Occupations by Sex
Within the Services occupations in White Plains, the most male-oriented occupations are Security & Protection (100.0%), and Law Enforcement (100.0%), while the most female-oriented occupations are Healthcare Support (100.0%), and Cleaning & Maintenance (100.0%).
| Occupation | Male | Female |
| Healthcare Support | 0 (0.0%) | 9 (100.0%) |
| Security & Protection | 25 (100.0%) | 0 (0.0%) |
| Firefighting & Prevention | 0 (0.0%) | 0 (0.0%) |
| Law Enforcement | 25 (100.0%) | 0 (0.0%) |
| Food Preparation & Serving | 0 (0.0%) | 0 (0.0%) |
| Cleaning & Maintenance | 0 (0.0%) | 10 (100.0%) |
| Personal Care & Service | 0 (0.0%) | 0 (0.0%) |
| Total (Category) | 25 (56.8%) | 19 (43.2%) |
| Total (Overall) | 245 (65.2%) | 131 (34.8%) |
Sales and Office Occupations
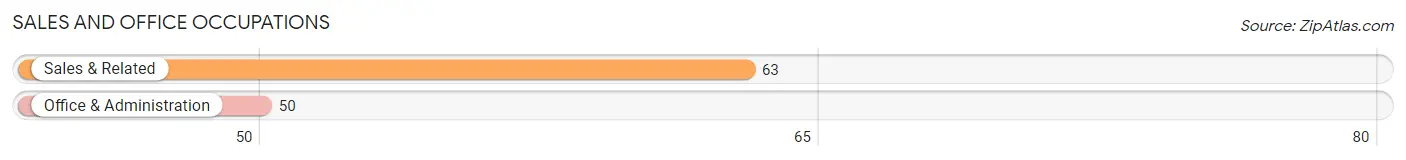
The most common Sales and Office occupations in White Plains are Sales & Related (63 | 16.8%), and Office & Administration (50 | 13.3%).
Sales and Office Occupations by Sex
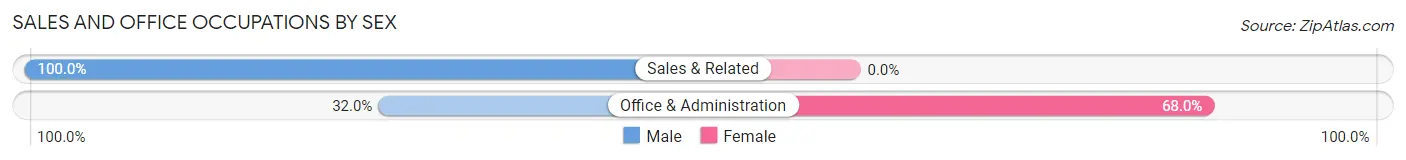
| Occupation | Male | Female |
| Sales & Related | 63 (100.0%) | 0 (0.0%) |
| Office & Administration | 16 (32.0%) | 34 (68.0%) |
| Total (Category) | 79 (69.9%) | 34 (30.1%) |
| Total (Overall) | 245 (65.2%) | 131 (34.8%) |
Natural Resources, Construction and Maintenance Occupations
Natural Resources, Construction and Maintenance Occupations by Sex
| Occupation | Male | Female |
| Farming, Fishing & Forestry | 0 (0.0%) | 0 (0.0%) |
| Construction & Extraction | 0 (0.0%) | 0 (0.0%) |
| Installation, Maintenance & Repair | 0 (0.0%) | 0 (0.0%) |
| Total (Category) | 0 (0.0%) | 0 (0.0%) |
| Total (Overall) | 245 (65.2%) | 131 (34.8%) |
Production, Transportation and Moving Occupations
The most common Production, Transportation and Moving occupations in White Plains are Material Moving (70 | 18.6%), and Production (25 | 6.7%).
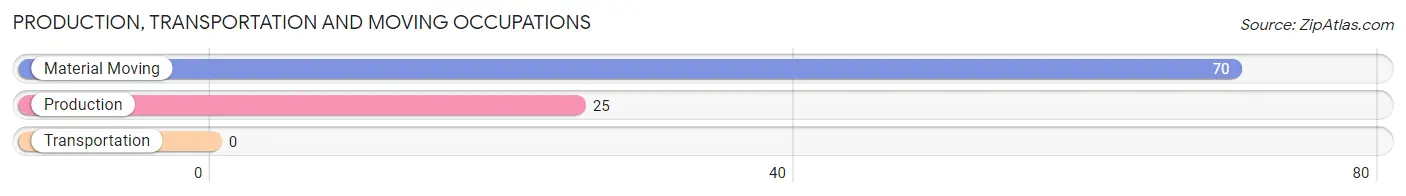
Production, Transportation and Moving Occupations by Sex
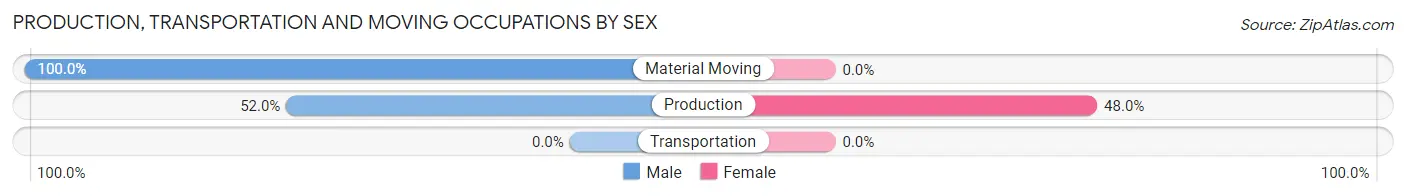
| Occupation | Male | Female |
| Production | 13 (52.0%) | 12 (48.0%) |
| Transportation | 0 (0.0%) | 0 (0.0%) |
| Material Moving | 70 (100.0%) | 0 (0.0%) |
| Total (Category) | 83 (87.4%) | 12 (12.6%) |
| Total (Overall) | 245 (65.2%) | 131 (34.8%) |
Employment Industries by Sex in White Plains
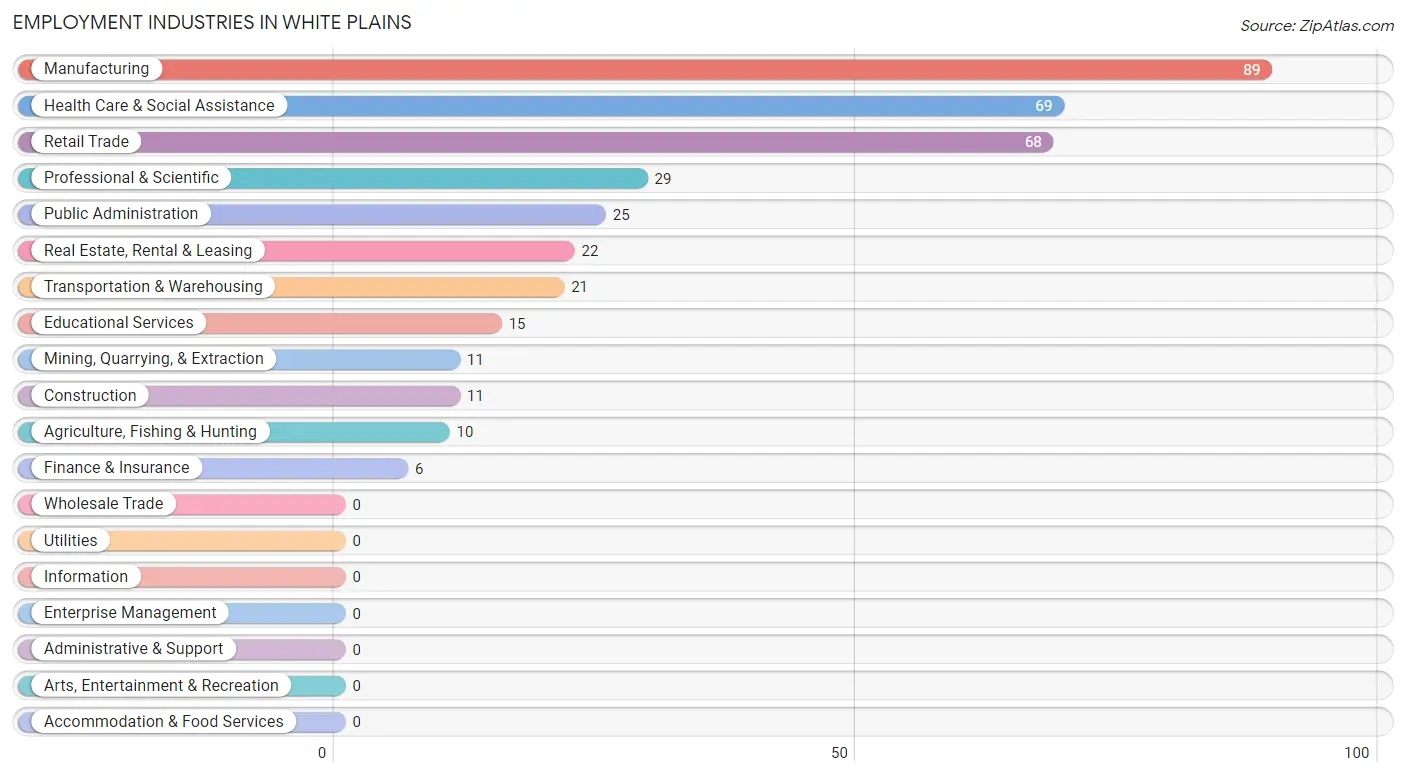
Employment Industries in White Plains
The major employment industries in White Plains include Manufacturing (89 | 23.7%), Health Care & Social Assistance (69 | 18.3%), Retail Trade (68 | 18.1%), Professional & Scientific (29 | 7.7%), and Public Administration (25 | 6.7%).
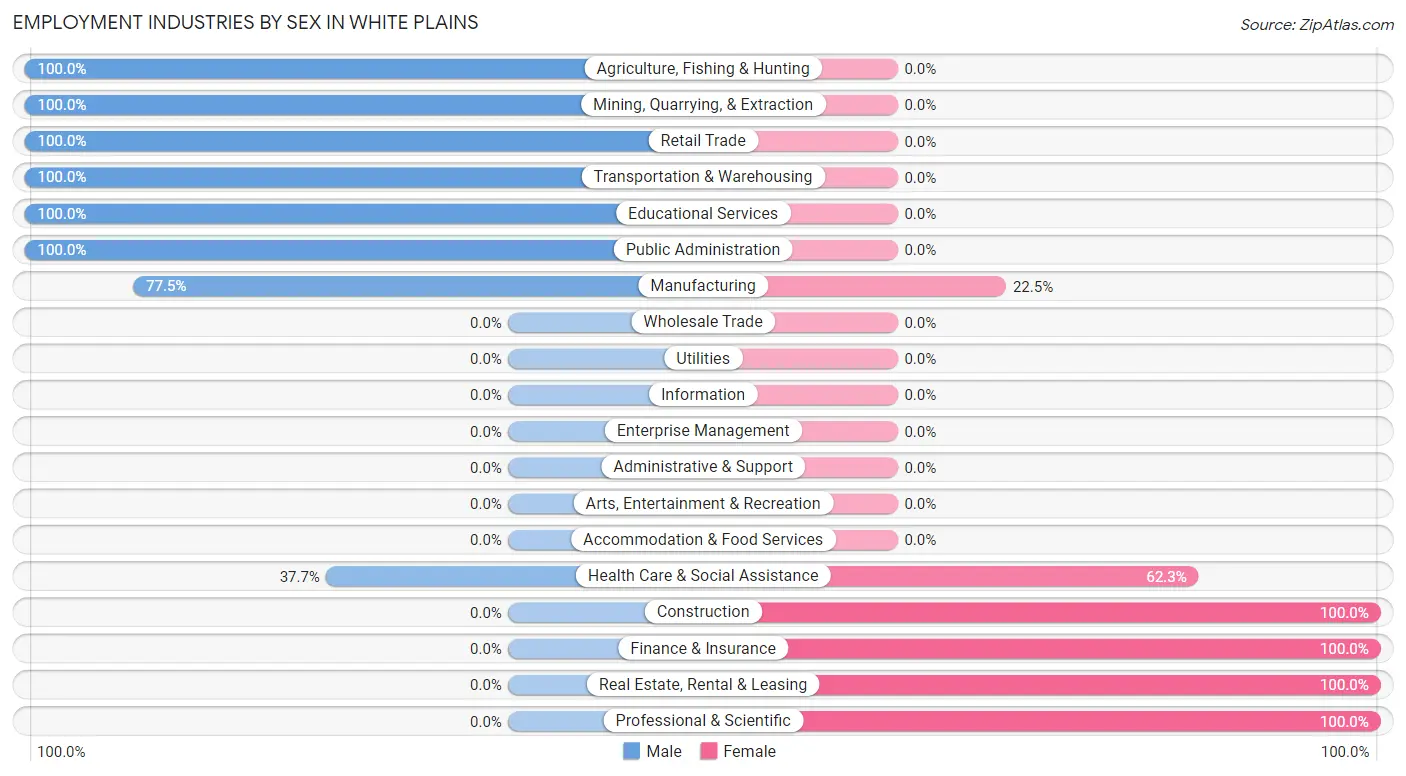
Employment Industries by Sex in White Plains
The White Plains industries that see more men than women are Agriculture, Fishing & Hunting (100.0%), Mining, Quarrying, & Extraction (100.0%), and Retail Trade (100.0%), whereas the industries that tend to have a higher number of women are Construction (100.0%), Finance & Insurance (100.0%), and Real Estate, Rental & Leasing (100.0%).
| Industry | Male | Female |
| Agriculture, Fishing & Hunting | 10 (100.0%) | 0 (0.0%) |
| Mining, Quarrying, & Extraction | 11 (100.0%) | 0 (0.0%) |
| Construction | 0 (0.0%) | 11 (100.0%) |
| Manufacturing | 69 (77.5%) | 20 (22.5%) |
| Wholesale Trade | 0 (0.0%) | 0 (0.0%) |
| Retail Trade | 68 (100.0%) | 0 (0.0%) |
| Transportation & Warehousing | 21 (100.0%) | 0 (0.0%) |
| Utilities | 0 (0.0%) | 0 (0.0%) |
| Information | 0 (0.0%) | 0 (0.0%) |
| Finance & Insurance | 0 (0.0%) | 6 (100.0%) |
| Real Estate, Rental & Leasing | 0 (0.0%) | 22 (100.0%) |
| Professional & Scientific | 0 (0.0%) | 29 (100.0%) |
| Enterprise Management | 0 (0.0%) | 0 (0.0%) |
| Administrative & Support | 0 (0.0%) | 0 (0.0%) |
| Educational Services | 15 (100.0%) | 0 (0.0%) |
| Health Care & Social Assistance | 26 (37.7%) | 43 (62.3%) |
| Arts, Entertainment & Recreation | 0 (0.0%) | 0 (0.0%) |
| Accommodation & Food Services | 0 (0.0%) | 0 (0.0%) |
| Public Administration | 25 (100.0%) | 0 (0.0%) |
| Total | 245 (65.2%) | 131 (34.8%) |
Education in White Plains
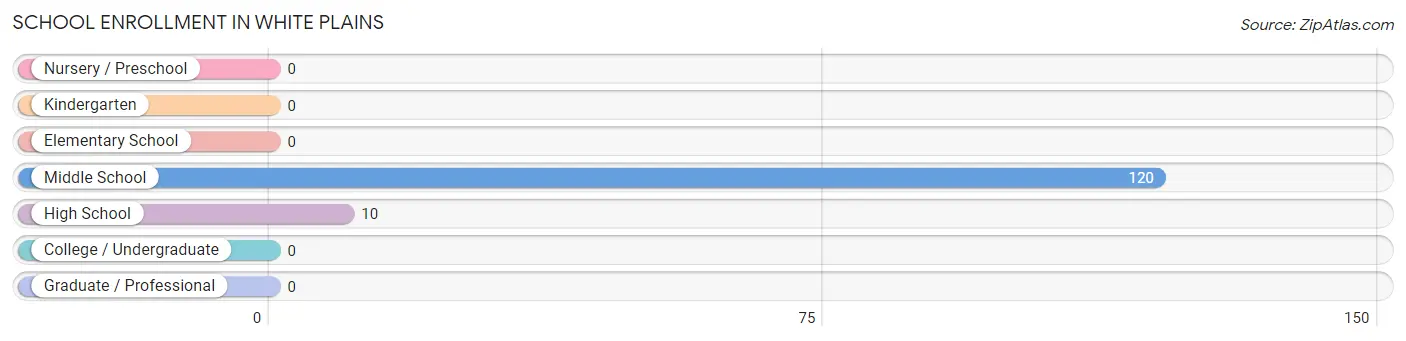
School Enrollment in White Plains
The most common levels of schooling among the 130 students in White Plains are middle school (120 | 92.3%), and high school (10 | 7.7%).
| School Level | # Students | % Students |
| Nursery / Preschool | 0 | 0.0% |
| Kindergarten | 0 | 0.0% |
| Elementary School | 0 | 0.0% |
| Middle School | 120 | 92.3% |
| High School | 10 | 7.7% |
| College / Undergraduate | 0 | 0.0% |
| Graduate / Professional | 0 | 0.0% |
| Total | 130 | 100.0% |
School Enrollment by Age by Funding Source in White Plains
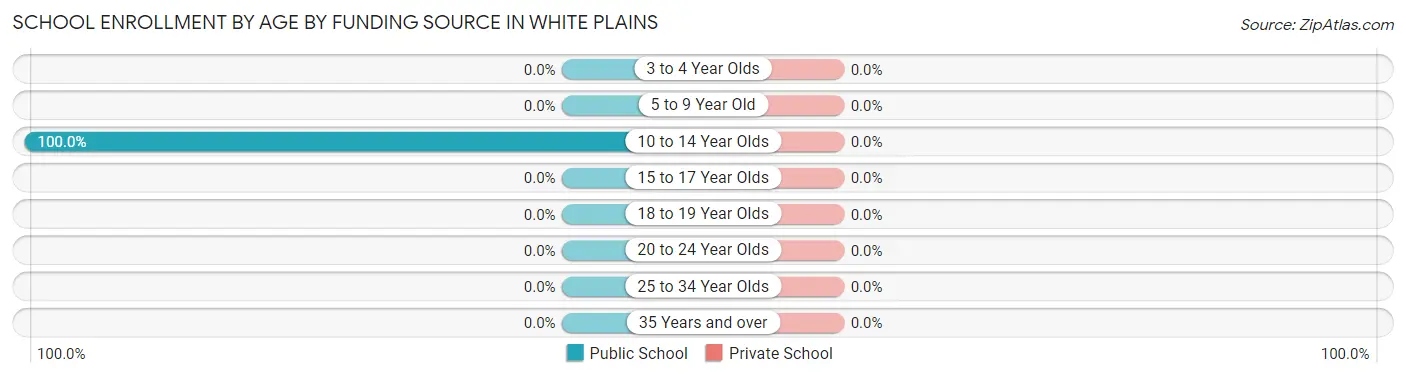
| Age Bracket | Public School | Private School |
| 3 to 4 Year Olds | 0 (0.0%) | 0 (0.0%) |
| 5 to 9 Year Old | 0 (0.0%) | 0 (0.0%) |
| 10 to 14 Year Olds | 130 (100.0%) | 0 (0.0%) |
| 15 to 17 Year Olds | 0 (0.0%) | 0 (0.0%) |
| 18 to 19 Year Olds | 0 (0.0%) | 0 (0.0%) |
| 20 to 24 Year Olds | 0 (0.0%) | 0 (0.0%) |
| 25 to 34 Year Olds | 0 (0.0%) | 0 (0.0%) |
| 35 Years and over | 0 (0.0%) | 0 (0.0%) |
| Total | 130 (100.0%) | 0 (0.0%) |
Educational Attainment by Field of Study in White Plains
Business (33 | 36.3%), literature & languages (29 | 31.9%), liberal arts & history (15 | 16.5%), and communications (14 | 15.4%) are the most common fields of study among 91 individuals in White Plains who have obtained a bachelor's degree or higher.
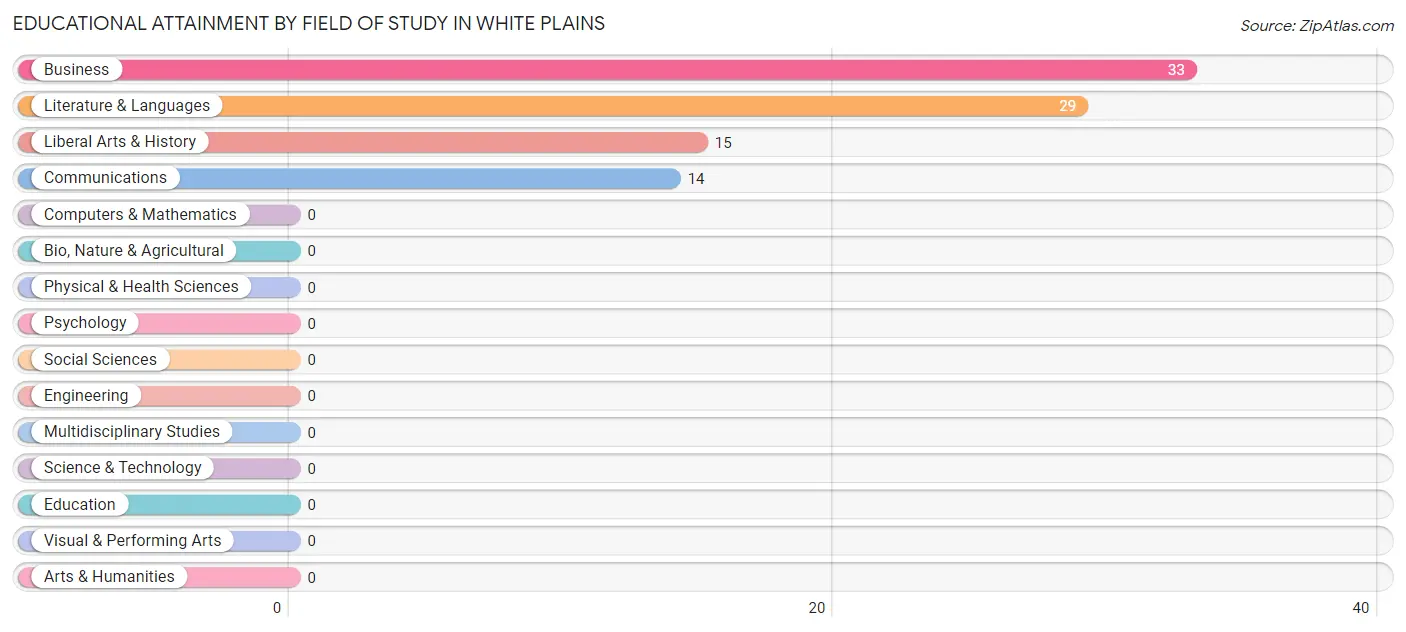
| Field of Study | # Graduates | % Graduates |
| Computers & Mathematics | 0 | 0.0% |
| Bio, Nature & Agricultural | 0 | 0.0% |
| Physical & Health Sciences | 0 | 0.0% |
| Psychology | 0 | 0.0% |
| Social Sciences | 0 | 0.0% |
| Engineering | 0 | 0.0% |
| Multidisciplinary Studies | 0 | 0.0% |
| Science & Technology | 0 | 0.0% |
| Business | 33 | 36.3% |
| Education | 0 | 0.0% |
| Literature & Languages | 29 | 31.9% |
| Liberal Arts & History | 15 | 16.5% |
| Visual & Performing Arts | 0 | 0.0% |
| Communications | 14 | 15.4% |
| Arts & Humanities | 0 | 0.0% |
| Total | 91 | 100.0% |
Transportation & Commute in White Plains
Vehicle Availability by Sex in White Plains
The most prevalent vehicle ownership categories in White Plains are males with 1 vehicle (100, accounting for 45.3%) and females with 1 vehicle (0, making up 76.3%).
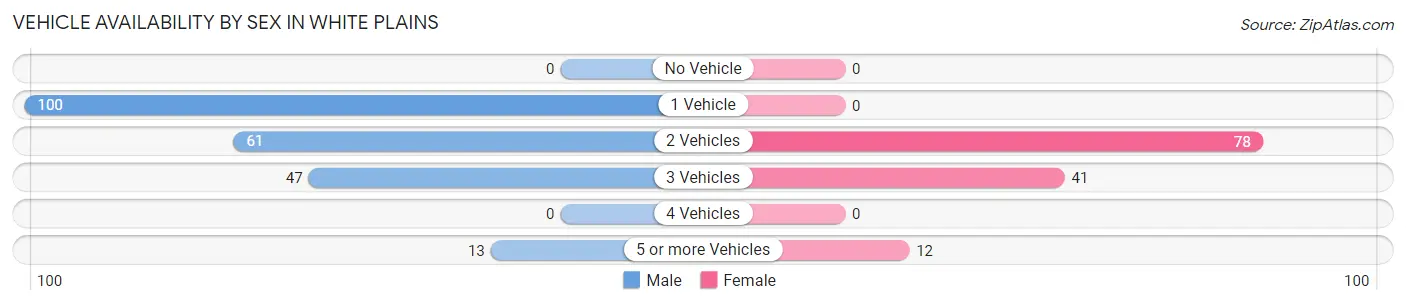
| Vehicles Available | Male | Female |
| No Vehicle | 0 (0.0%) | 0 (0.0%) |
| 1 Vehicle | 100 (45.3%) | 0 (0.0%) |
| 2 Vehicles | 61 (27.6%) | 78 (59.5%) |
| 3 Vehicles | 47 (21.3%) | 41 (31.3%) |
| 4 Vehicles | 0 (0.0%) | 0 (0.0%) |
| 5 or more Vehicles | 13 (5.9%) | 12 (9.2%) |
| Total | 221 (100.0%) | 131 (100.0%) |
Commute Time in White Plains
The most frequently occuring commute durations in White Plains are 15 to 19 minutes (123 commuters, 35.9%), 10 to 14 minutes (86 commuters, 25.1%), and 60 to 89 minutes (50 commuters, 14.6%).
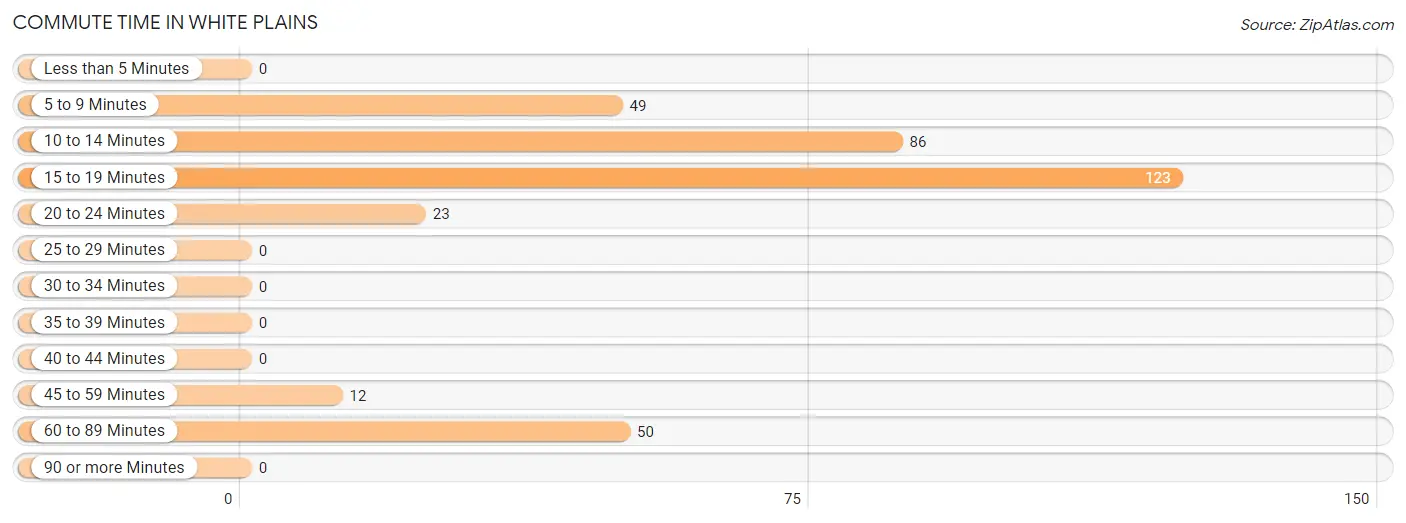
| Commute Time | # Commuters | % Commuters |
| Less than 5 Minutes | 0 | 0.0% |
| 5 to 9 Minutes | 49 | 14.3% |
| 10 to 14 Minutes | 86 | 25.1% |
| 15 to 19 Minutes | 123 | 35.9% |
| 20 to 24 Minutes | 23 | 6.7% |
| 25 to 29 Minutes | 0 | 0.0% |
| 30 to 34 Minutes | 0 | 0.0% |
| 35 to 39 Minutes | 0 | 0.0% |
| 40 to 44 Minutes | 0 | 0.0% |
| 45 to 59 Minutes | 12 | 3.5% |
| 60 to 89 Minutes | 50 | 14.6% |
| 90 or more Minutes | 0 | 0.0% |
Commute Time by Sex in White Plains
The most common commute times in White Plains are 10 to 14 minutes (86 commuters, 40.6%) for males and 15 to 19 minutes (76 commuters, 58.0%) for females.
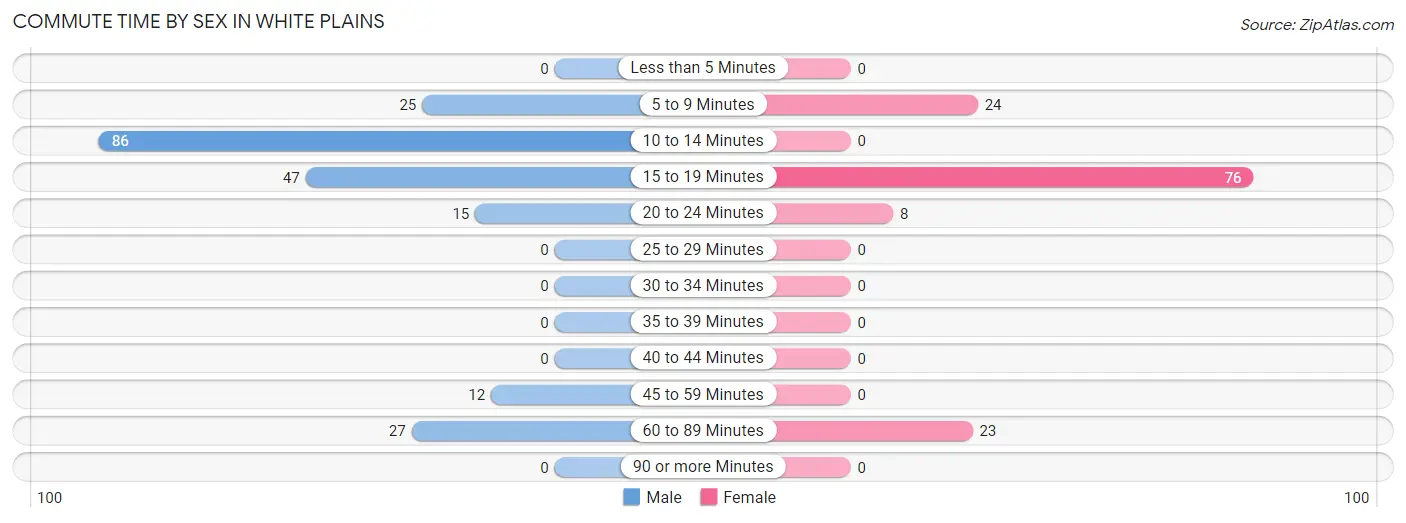
| Commute Time | Male | Female |
| Less than 5 Minutes | 0 (0.0%) | 0 (0.0%) |
| 5 to 9 Minutes | 25 (11.8%) | 24 (18.3%) |
| 10 to 14 Minutes | 86 (40.6%) | 0 (0.0%) |
| 15 to 19 Minutes | 47 (22.2%) | 76 (58.0%) |
| 20 to 24 Minutes | 15 (7.1%) | 8 (6.1%) |
| 25 to 29 Minutes | 0 (0.0%) | 0 (0.0%) |
| 30 to 34 Minutes | 0 (0.0%) | 0 (0.0%) |
| 35 to 39 Minutes | 0 (0.0%) | 0 (0.0%) |
| 40 to 44 Minutes | 0 (0.0%) | 0 (0.0%) |
| 45 to 59 Minutes | 12 (5.7%) | 0 (0.0%) |
| 60 to 89 Minutes | 27 (12.7%) | 23 (17.6%) |
| 90 or more Minutes | 0 (0.0%) | 0 (0.0%) |
Time of Departure to Work by Sex in White Plains
The most frequent times of departure to work in White Plains are 10:00 AM to 10:59 AM (65, 30.7%) for males and 6:30 AM to 6:59 AM (30, 22.9%) for females.
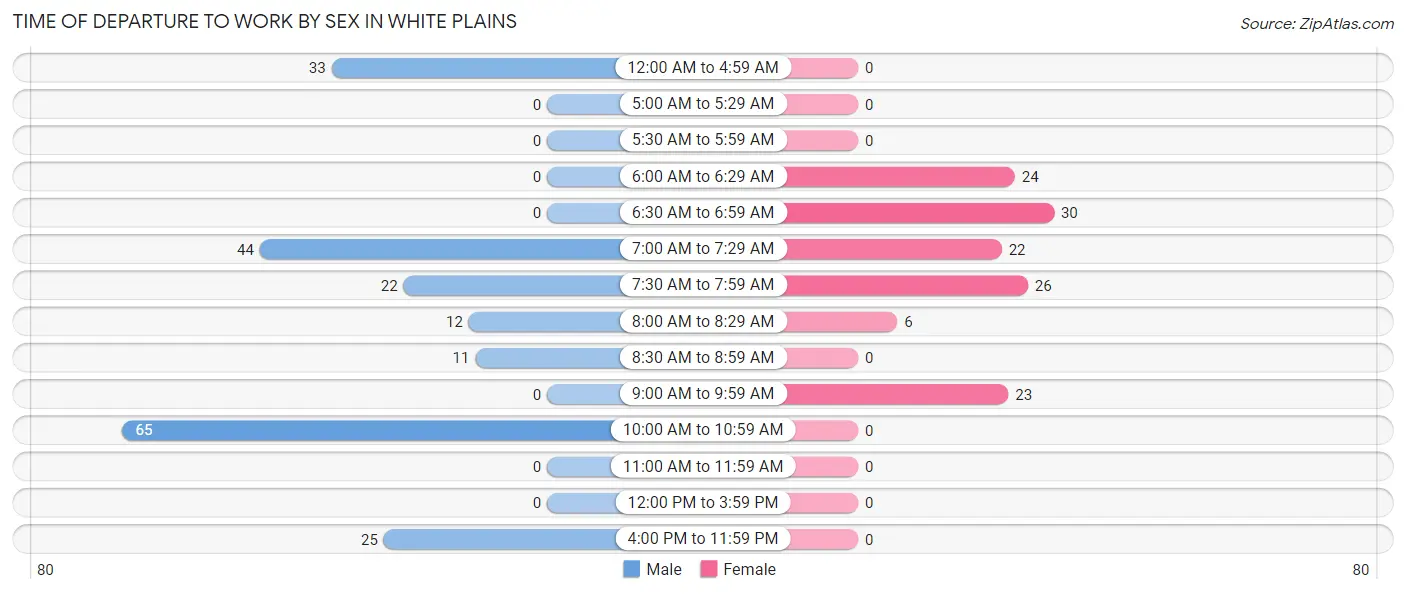
| Time of Departure | Male | Female |
| 12:00 AM to 4:59 AM | 33 (15.6%) | 0 (0.0%) |
| 5:00 AM to 5:29 AM | 0 (0.0%) | 0 (0.0%) |
| 5:30 AM to 5:59 AM | 0 (0.0%) | 0 (0.0%) |
| 6:00 AM to 6:29 AM | 0 (0.0%) | 24 (18.3%) |
| 6:30 AM to 6:59 AM | 0 (0.0%) | 30 (22.9%) |
| 7:00 AM to 7:29 AM | 44 (20.7%) | 22 (16.8%) |
| 7:30 AM to 7:59 AM | 22 (10.4%) | 26 (19.9%) |
| 8:00 AM to 8:29 AM | 12 (5.7%) | 6 (4.6%) |
| 8:30 AM to 8:59 AM | 11 (5.2%) | 0 (0.0%) |
| 9:00 AM to 9:59 AM | 0 (0.0%) | 23 (17.6%) |
| 10:00 AM to 10:59 AM | 65 (30.7%) | 0 (0.0%) |
| 11:00 AM to 11:59 AM | 0 (0.0%) | 0 (0.0%) |
| 12:00 PM to 3:59 PM | 0 (0.0%) | 0 (0.0%) |
| 4:00 PM to 11:59 PM | 25 (11.8%) | 0 (0.0%) |
| Total | 212 (100.0%) | 131 (100.0%) |
Housing Occupancy in White Plains
Occupancy by Ownership in White Plains
Of the total 401 dwellings in White Plains, owner-occupied units account for 261 (65.1%), while renter-occupied units make up 140 (34.9%).
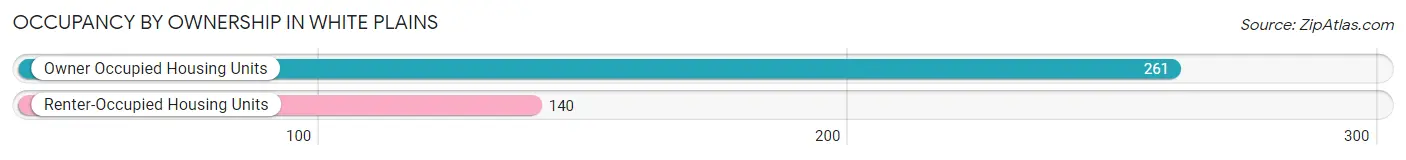
| Occupancy | # Housing Units | % Housing Units |
| Owner Occupied Housing Units | 261 | 65.1% |
| Renter-Occupied Housing Units | 140 | 34.9% |
| Total Occupied Housing Units | 401 | 100.0% |
Occupancy by Household Size in White Plains
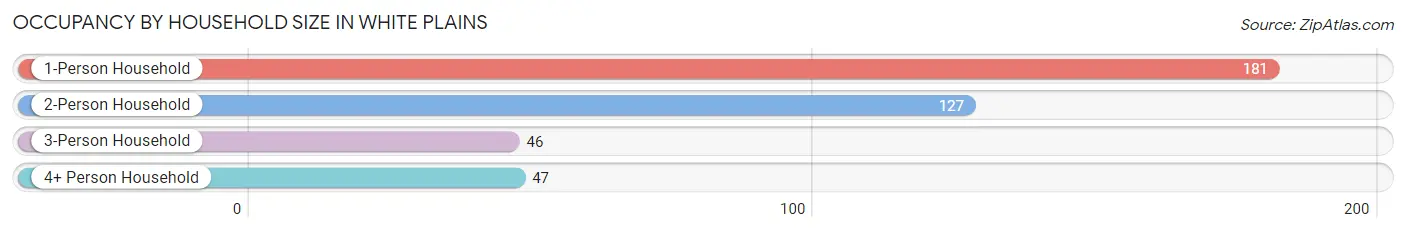
| Household Size | # Housing Units | % Housing Units |
| 1-Person Household | 181 | 45.1% |
| 2-Person Household | 127 | 31.7% |
| 3-Person Household | 46 | 11.5% |
| 4+ Person Household | 47 | 11.7% |
| Total Housing Units | 401 | 100.0% |
Occupancy by Ownership by Household Size in White Plains
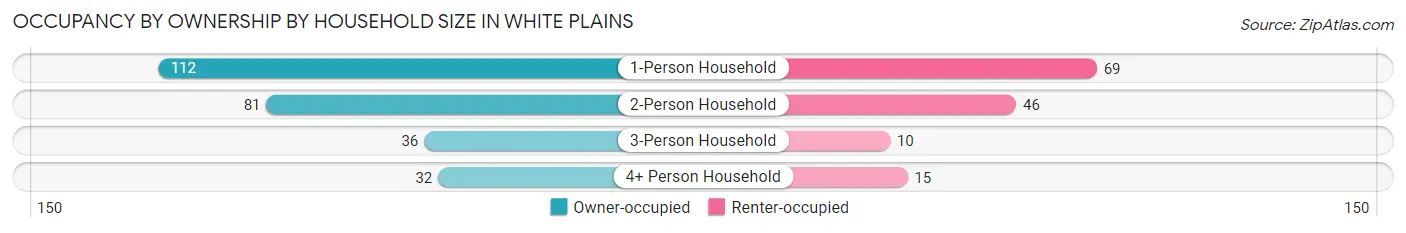
| Household Size | Owner-occupied | Renter-occupied |
| 1-Person Household | 112 (61.9%) | 69 (38.1%) |
| 2-Person Household | 81 (63.8%) | 46 (36.2%) |
| 3-Person Household | 36 (78.3%) | 10 (21.7%) |
| 4+ Person Household | 32 (68.1%) | 15 (31.9%) |
| Total Housing Units | 261 (65.1%) | 140 (34.9%) |
Occupancy by Educational Attainment in White Plains
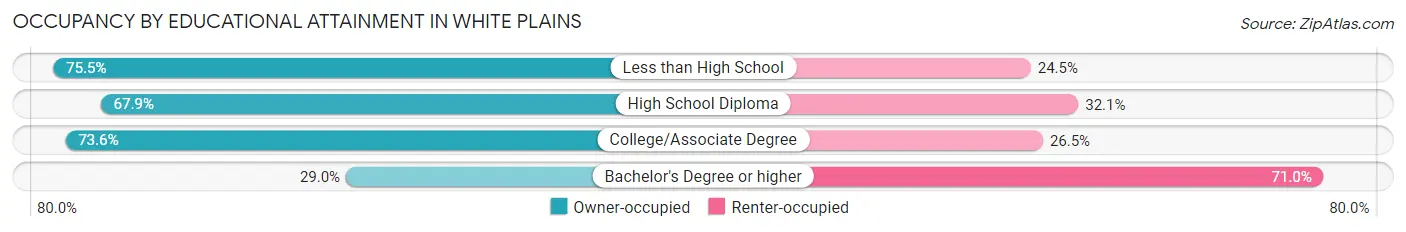
| Household Size | Owner-occupied | Renter-occupied |
| Less than High School | 40 (75.5%) | 13 (24.5%) |
| High School Diploma | 89 (67.9%) | 42 (32.1%) |
| College/Associate Degree | 114 (73.6%) | 41 (26.5%) |
| Bachelor's Degree or higher | 18 (29.0%) | 44 (71.0%) |
Occupancy by Age of Householder in White Plains
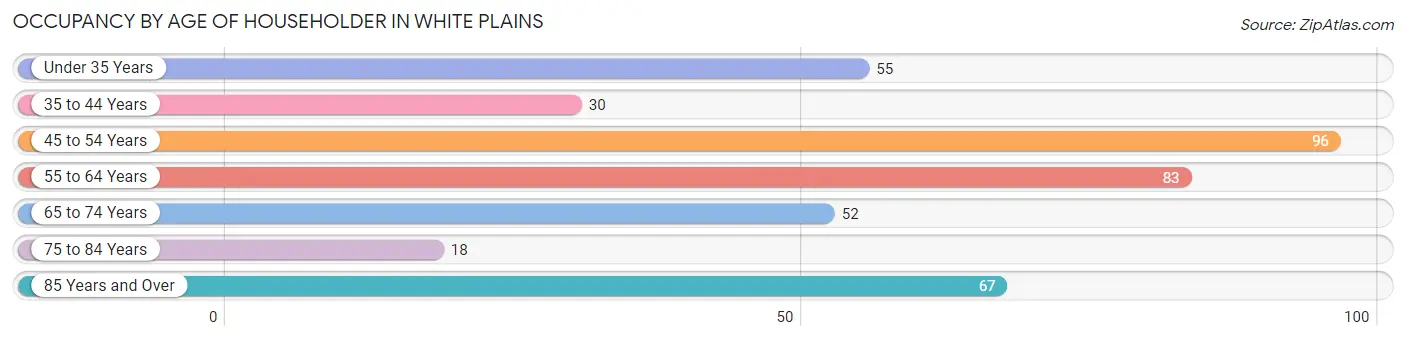
| Age Bracket | # Households | % Households |
| Under 35 Years | 55 | 13.7% |
| 35 to 44 Years | 30 | 7.5% |
| 45 to 54 Years | 96 | 23.9% |
| 55 to 64 Years | 83 | 20.7% |
| 65 to 74 Years | 52 | 13.0% |
| 75 to 84 Years | 18 | 4.5% |
| 85 Years and Over | 67 | 16.7% |
| Total | 401 | 100.0% |
Housing Finances in White Plains
Median Income by Occupancy in White Plains
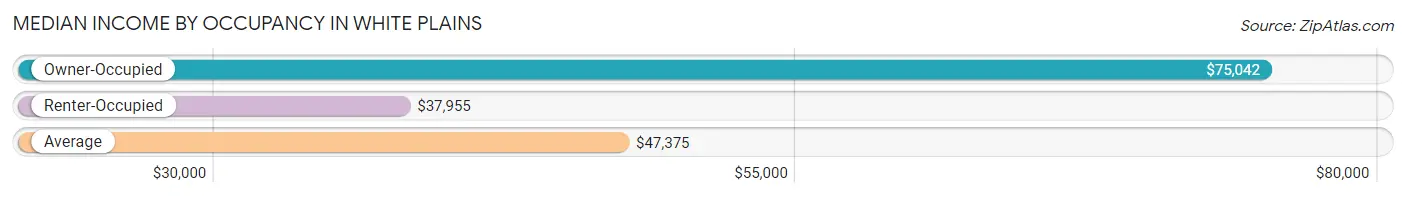
| Occupancy Type | # Households | Median Income |
| Owner-Occupied | 261 (65.1%) | $75,042 |
| Renter-Occupied | 140 (34.9%) | $37,955 |
| Average | 401 (100.0%) | $47,375 |
Occupancy by Householder Income Bracket in White Plains
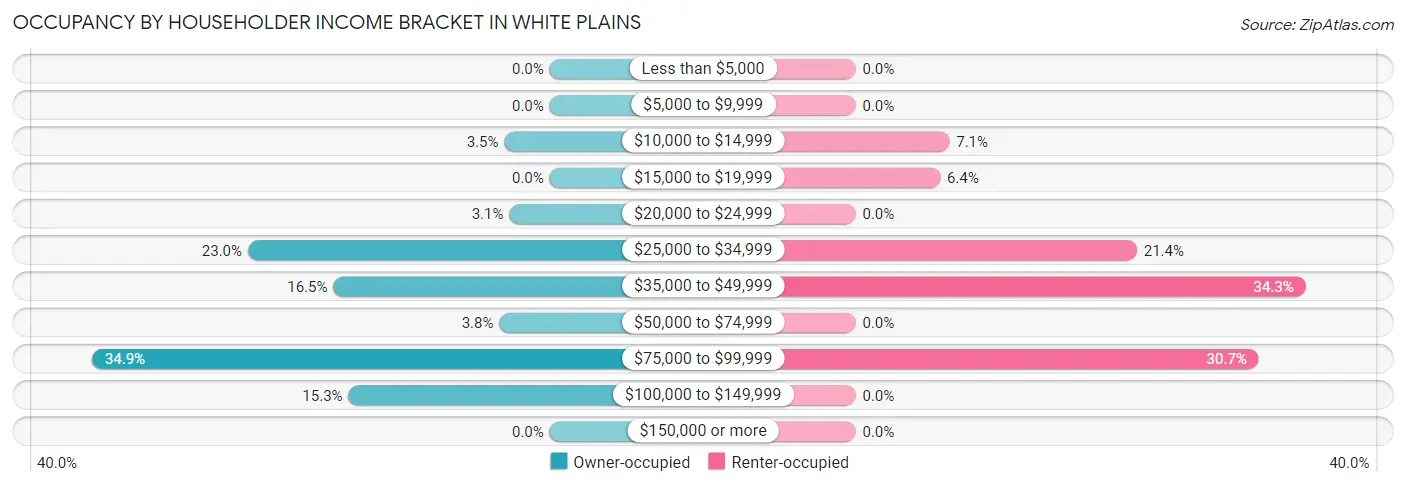
| Income Bracket | Owner-occupied | Renter-occupied |
| Less than $5,000 | 0 (0.0%) | 0 (0.0%) |
| $5,000 to $9,999 | 0 (0.0%) | 0 (0.0%) |
| $10,000 to $14,999 | 9 (3.5%) | 10 (7.1%) |
| $15,000 to $19,999 | 0 (0.0%) | 9 (6.4%) |
| $20,000 to $24,999 | 8 (3.1%) | 0 (0.0%) |
| $25,000 to $34,999 | 60 (23.0%) | 30 (21.4%) |
| $35,000 to $49,999 | 43 (16.5%) | 48 (34.3%) |
| $50,000 to $74,999 | 10 (3.8%) | 0 (0.0%) |
| $75,000 to $99,999 | 91 (34.9%) | 43 (30.7%) |
| $100,000 to $149,999 | 40 (15.3%) | 0 (0.0%) |
| $150,000 or more | 0 (0.0%) | 0 (0.0%) |
| Total | 261 (100.0%) | 140 (100.0%) |
Monthly Housing Cost Tiers in White Plains
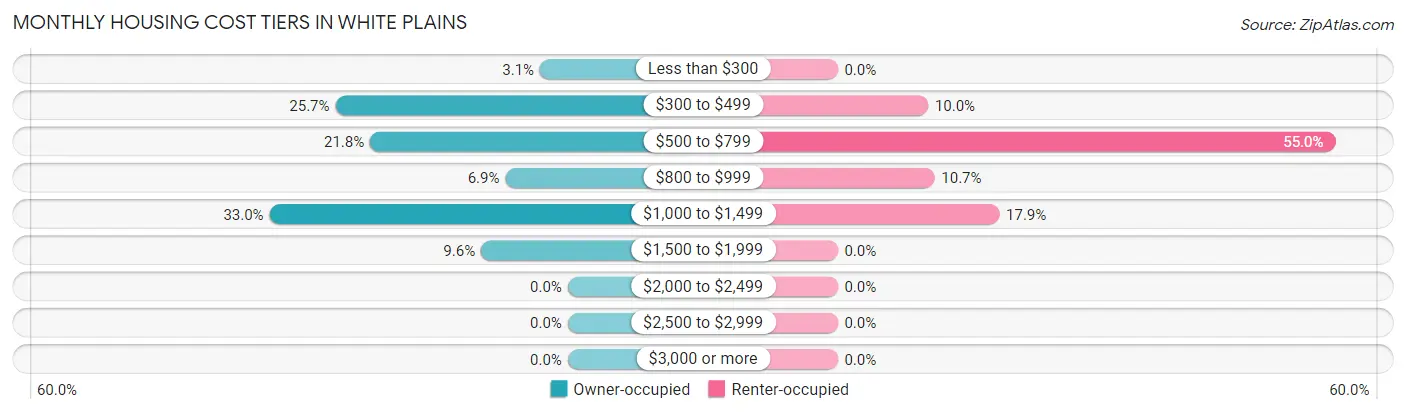
| Monthly Cost | Owner-occupied | Renter-occupied |
| Less than $300 | 8 (3.1%) | 0 (0.0%) |
| $300 to $499 | 67 (25.7%) | 14 (10.0%) |
| $500 to $799 | 57 (21.8%) | 77 (55.0%) |
| $800 to $999 | 18 (6.9%) | 15 (10.7%) |
| $1,000 to $1,499 | 86 (33.0%) | 25 (17.9%) |
| $1,500 to $1,999 | 25 (9.6%) | 0 (0.0%) |
| $2,000 to $2,499 | 0 (0.0%) | 0 (0.0%) |
| $2,500 to $2,999 | 0 (0.0%) | 0 (0.0%) |
| $3,000 or more | 0 (0.0%) | 0 (0.0%) |
| Total | 261 (100.0%) | 140 (100.0%) |
Physical Housing Characteristics in White Plains
Housing Structures in White Plains
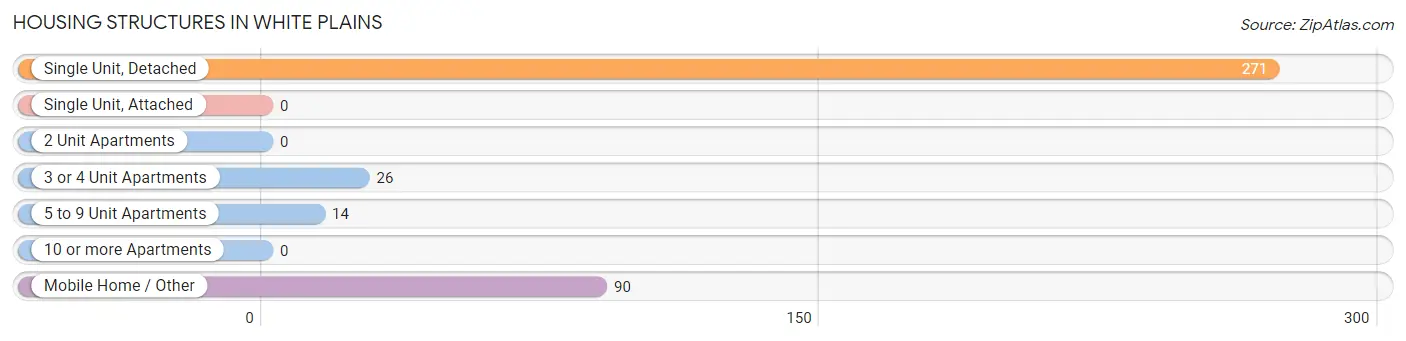
| Structure Type | # Housing Units | % Housing Units |
| Single Unit, Detached | 271 | 67.6% |
| Single Unit, Attached | 0 | 0.0% |
| 2 Unit Apartments | 0 | 0.0% |
| 3 or 4 Unit Apartments | 26 | 6.5% |
| 5 to 9 Unit Apartments | 14 | 3.5% |
| 10 or more Apartments | 0 | 0.0% |
| Mobile Home / Other | 90 | 22.4% |
| Total | 401 | 100.0% |
Housing Structures by Occupancy in White Plains
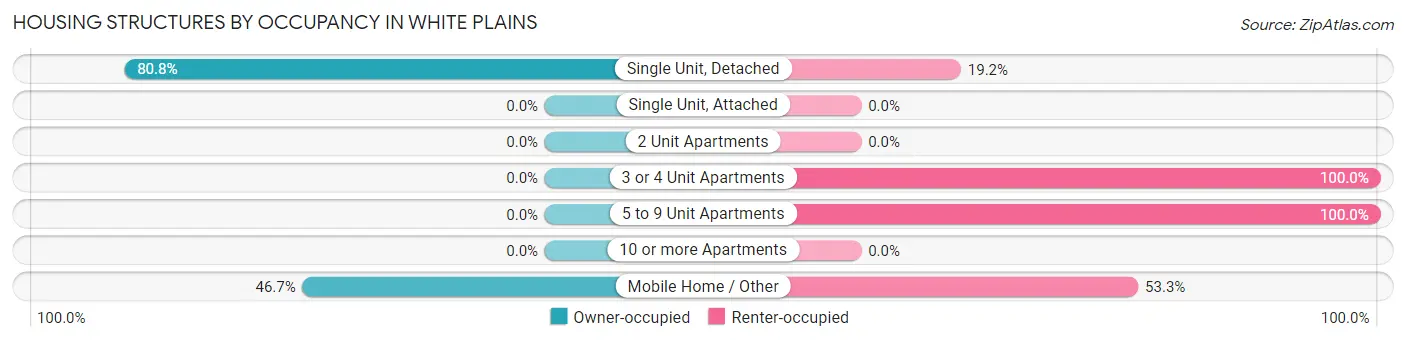
| Structure Type | Owner-occupied | Renter-occupied |
| Single Unit, Detached | 219 (80.8%) | 52 (19.2%) |
| Single Unit, Attached | 0 (0.0%) | 0 (0.0%) |
| 2 Unit Apartments | 0 (0.0%) | 0 (0.0%) |
| 3 or 4 Unit Apartments | 0 (0.0%) | 26 (100.0%) |
| 5 to 9 Unit Apartments | 0 (0.0%) | 14 (100.0%) |
| 10 or more Apartments | 0 (0.0%) | 0 (0.0%) |
| Mobile Home / Other | 42 (46.7%) | 48 (53.3%) |
| Total | 261 (65.1%) | 140 (34.9%) |
Housing Structures by Number of Rooms in White Plains
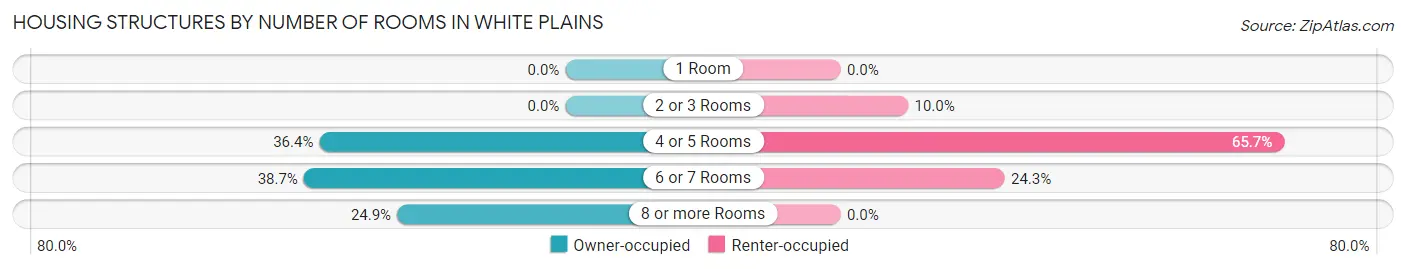
| Number of Rooms | Owner-occupied | Renter-occupied |
| 1 Room | 0 (0.0%) | 0 (0.0%) |
| 2 or 3 Rooms | 0 (0.0%) | 14 (10.0%) |
| 4 or 5 Rooms | 95 (36.4%) | 92 (65.7%) |
| 6 or 7 Rooms | 101 (38.7%) | 34 (24.3%) |
| 8 or more Rooms | 65 (24.9%) | 0 (0.0%) |
| Total | 261 (100.0%) | 140 (100.0%) |
Housing Structure by Heating Type in White Plains
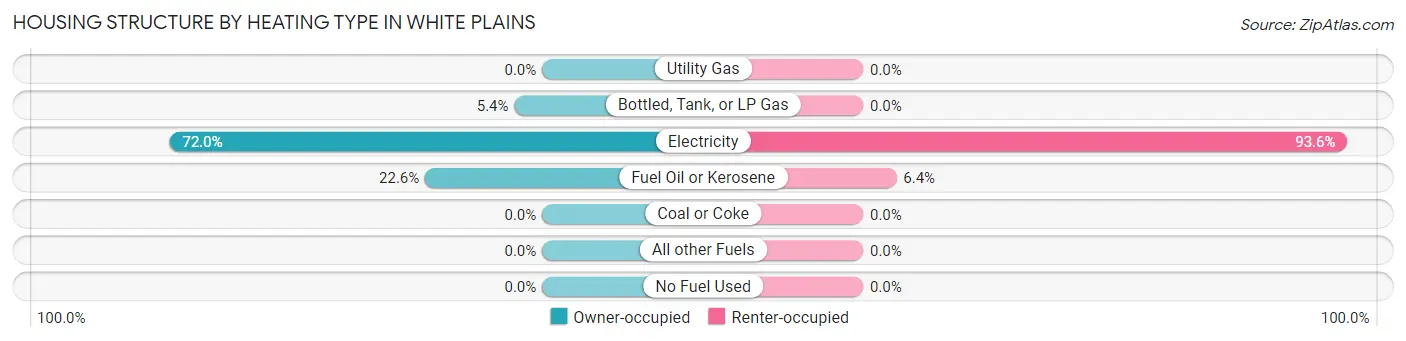
| Heating Type | Owner-occupied | Renter-occupied |
| Utility Gas | 0 (0.0%) | 0 (0.0%) |
| Bottled, Tank, or LP Gas | 14 (5.4%) | 0 (0.0%) |
| Electricity | 188 (72.0%) | 131 (93.6%) |
| Fuel Oil or Kerosene | 59 (22.6%) | 9 (6.4%) |
| Coal or Coke | 0 (0.0%) | 0 (0.0%) |
| All other Fuels | 0 (0.0%) | 0 (0.0%) |
| No Fuel Used | 0 (0.0%) | 0 (0.0%) |
| Total | 261 (100.0%) | 140 (100.0%) |
Household Vehicle Usage in White Plains
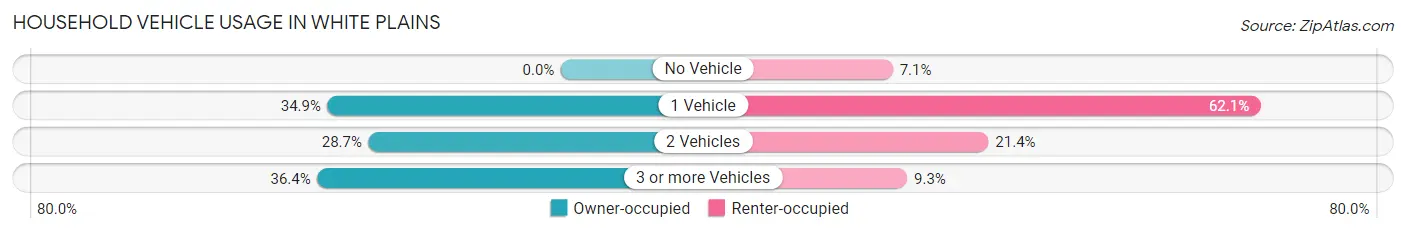
| Vehicles per Household | Owner-occupied | Renter-occupied |
| No Vehicle | 0 (0.0%) | 10 (7.1%) |
| 1 Vehicle | 91 (34.9%) | 87 (62.1%) |
| 2 Vehicles | 75 (28.7%) | 30 (21.4%) |
| 3 or more Vehicles | 95 (36.4%) | 13 (9.3%) |
| Total | 261 (100.0%) | 140 (100.0%) |
Real Estate & Mortgages in White Plains
Real Estate and Mortgage Overview in White Plains
| Characteristic | Without Mortgage | With Mortgage |
| Housing Units | 114 | 147 |
| Median Property Value | $200,000 | $206,500 |
| Median Household Income | - | - |
| Monthly Housing Costs | $431 | $0 |
| Real Estate Taxes | $1,250 | $0 |
Property Value by Mortgage Status in White Plains
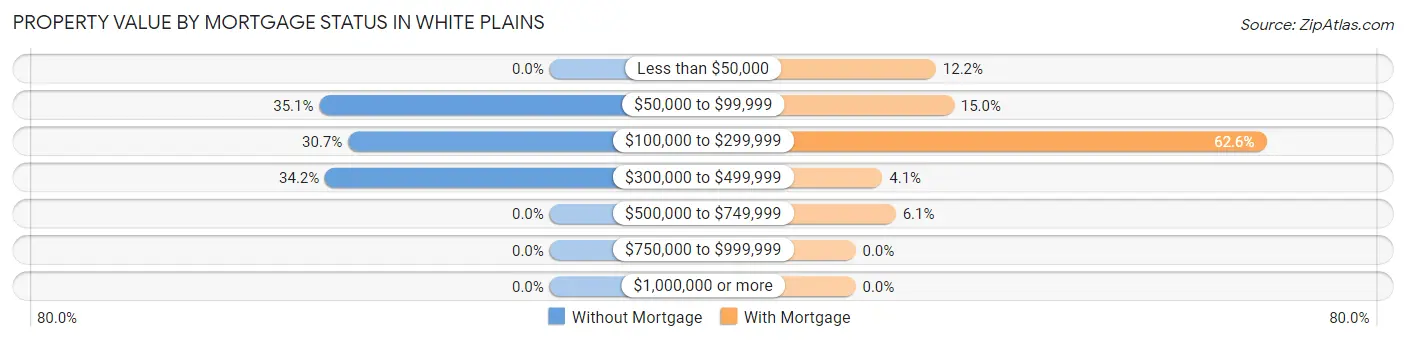
| Property Value | Without Mortgage | With Mortgage |
| Less than $50,000 | 0 (0.0%) | 18 (12.2%) |
| $50,000 to $99,999 | 40 (35.1%) | 22 (15.0%) |
| $100,000 to $299,999 | 35 (30.7%) | 92 (62.6%) |
| $300,000 to $499,999 | 39 (34.2%) | 6 (4.1%) |
| $500,000 to $749,999 | 0 (0.0%) | 9 (6.1%) |
| $750,000 to $999,999 | 0 (0.0%) | 0 (0.0%) |
| $1,000,000 or more | 0 (0.0%) | 0 (0.0%) |
| Total | 114 (100.0%) | 147 (100.0%) |
Household Income by Mortgage Status in White Plains
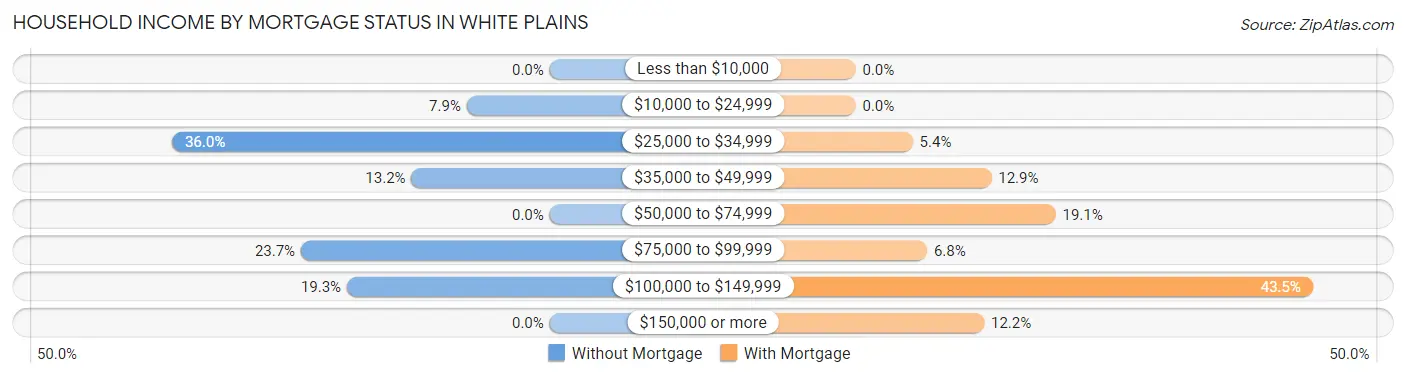
| Household Income | Without Mortgage | With Mortgage |
| Less than $10,000 | 0 (0.0%) | 0 (0.0%) |
| $10,000 to $24,999 | 9 (7.9%) | 0 (0.0%) |
| $25,000 to $34,999 | 41 (36.0%) | 8 (5.4%) |
| $35,000 to $49,999 | 15 (13.2%) | 19 (12.9%) |
| $50,000 to $74,999 | 0 (0.0%) | 28 (19.1%) |
| $75,000 to $99,999 | 27 (23.7%) | 10 (6.8%) |
| $100,000 to $149,999 | 22 (19.3%) | 64 (43.5%) |
| $150,000 or more | 0 (0.0%) | 18 (12.2%) |
| Total | 114 (100.0%) | 147 (100.0%) |
Property Value to Household Income Ratio in White Plains
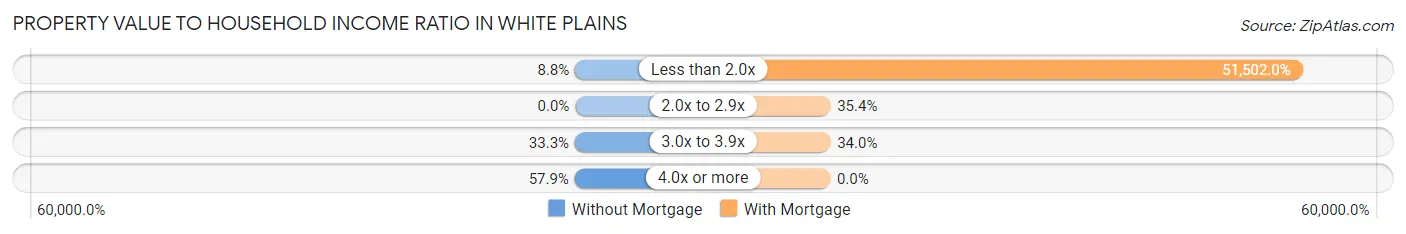
| Value-to-Income Ratio | Without Mortgage | With Mortgage |
| Less than 2.0x | 10 (8.8%) | 75,708 (51,502.0%) |
| 2.0x to 2.9x | 0 (0.0%) | 52 (35.4%) |
| 3.0x to 3.9x | 38 (33.3%) | 50 (34.0%) |
| 4.0x or more | 66 (57.9%) | 0 (0.0%) |
| Total | 114 (100.0%) | 147 (100.0%) |
Real Estate Taxes by Mortgage Status in White Plains
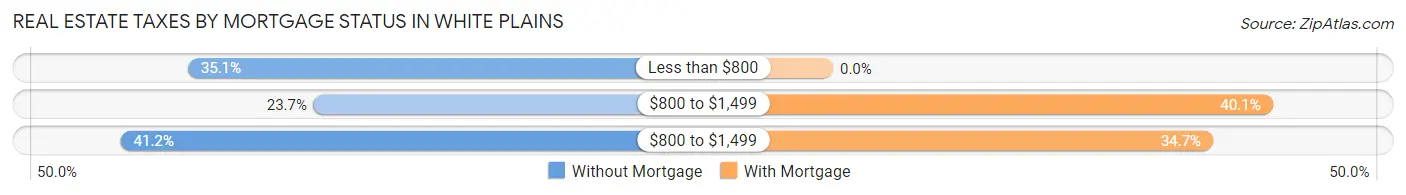
| Property Taxes | Without Mortgage | With Mortgage |
| Less than $800 | 40 (35.1%) | 0 (0.0%) |
| $800 to $1,499 | 27 (23.7%) | 59 (40.1%) |
| $800 to $1,499 | 47 (41.2%) | 51 (34.7%) |
| Total | 114 (100.0%) | 147 (100.0%) |
Health & Disability in White Plains
Health Insurance Coverage by Age in White Plains
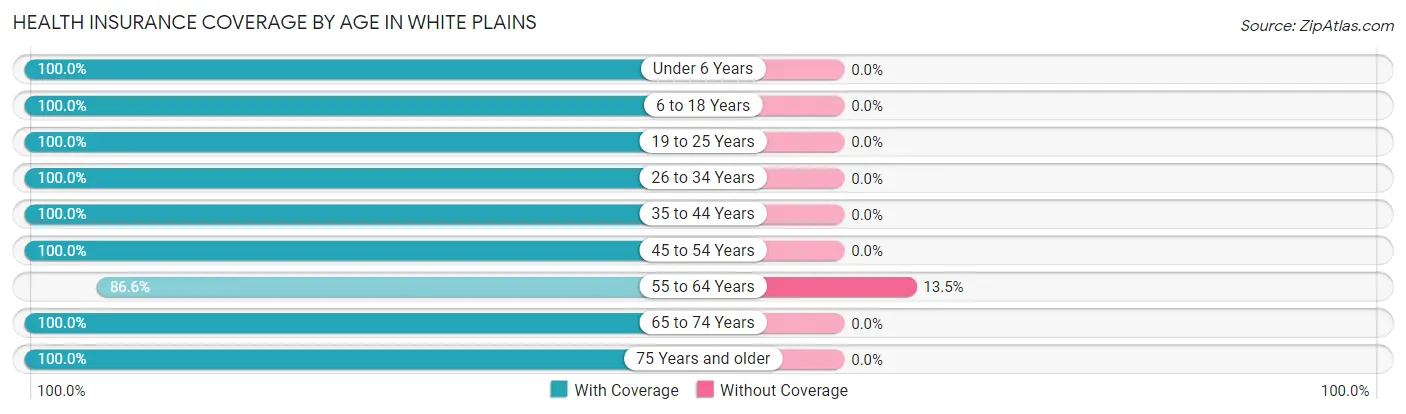
| Age Bracket | With Coverage | Without Coverage |
| Under 6 Years | 22 (100.0%) | 0 (0.0%) |
| 6 to 18 Years | 130 (100.0%) | 0 (0.0%) |
| 19 to 25 Years | 39 (100.0%) | 0 (0.0%) |
| 26 to 34 Years | 41 (100.0%) | 0 (0.0%) |
| 35 to 44 Years | 56 (100.0%) | 0 (0.0%) |
| 45 to 54 Years | 134 (100.0%) | 0 (0.0%) |
| 55 to 64 Years | 148 (86.6%) | 23 (13.5%) |
| 65 to 74 Years | 89 (100.0%) | 0 (0.0%) |
| 75 Years and older | 85 (100.0%) | 0 (0.0%) |
| Total | 744 (97.0%) | 23 (3.0%) |
Health Insurance Coverage by Citizenship Status in White Plains
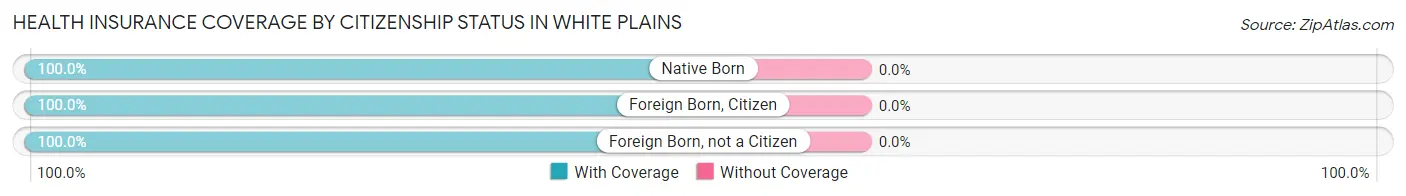
| Citizenship Status | With Coverage | Without Coverage |
| Native Born | 22 (100.0%) | 0 (0.0%) |
| Foreign Born, Citizen | 130 (100.0%) | 0 (0.0%) |
| Foreign Born, not a Citizen | 39 (100.0%) | 0 (0.0%) |
Health Insurance Coverage by Household Income in White Plains
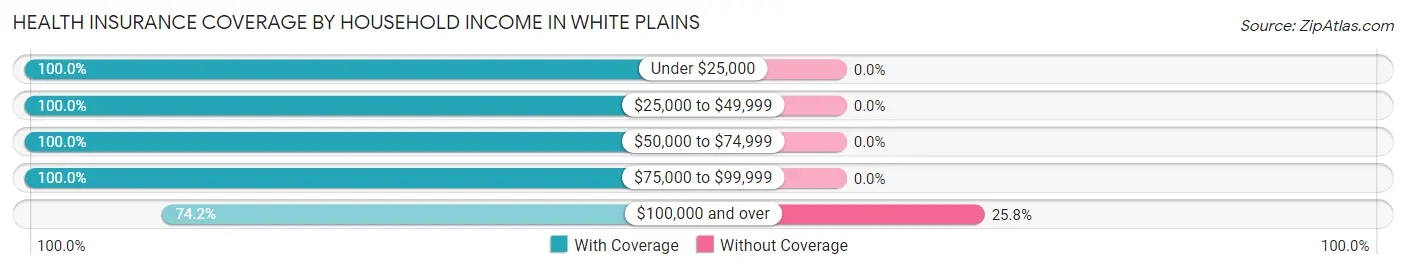
| Household Income | With Coverage | Without Coverage |
| Under $25,000 | 56 (100.0%) | 0 (0.0%) |
| $25,000 to $49,999 | 280 (100.0%) | 0 (0.0%) |
| $50,000 to $74,999 | 10 (100.0%) | 0 (0.0%) |
| $75,000 to $99,999 | 332 (100.0%) | 0 (0.0%) |
| $100,000 and over | 66 (74.2%) | 23 (25.8%) |
Public vs Private Health Insurance Coverage by Age in White Plains
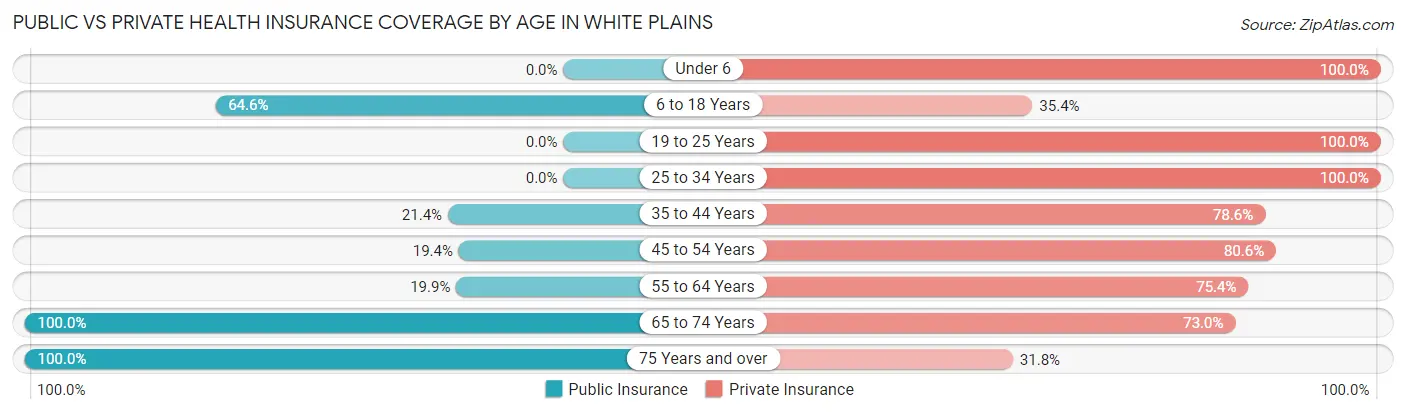
| Age Bracket | Public Insurance | Private Insurance |
| Under 6 | 0 (0.0%) | 22 (100.0%) |
| 6 to 18 Years | 84 (64.6%) | 46 (35.4%) |
| 19 to 25 Years | 0 (0.0%) | 39 (100.0%) |
| 25 to 34 Years | 0 (0.0%) | 41 (100.0%) |
| 35 to 44 Years | 12 (21.4%) | 44 (78.6%) |
| 45 to 54 Years | 26 (19.4%) | 108 (80.6%) |
| 55 to 64 Years | 34 (19.9%) | 129 (75.4%) |
| 65 to 74 Years | 89 (100.0%) | 65 (73.0%) |
| 75 Years and over | 85 (100.0%) | 27 (31.8%) |
| Total | 330 (43.0%) | 521 (67.9%) |
Disability Status by Sex by Age in White Plains
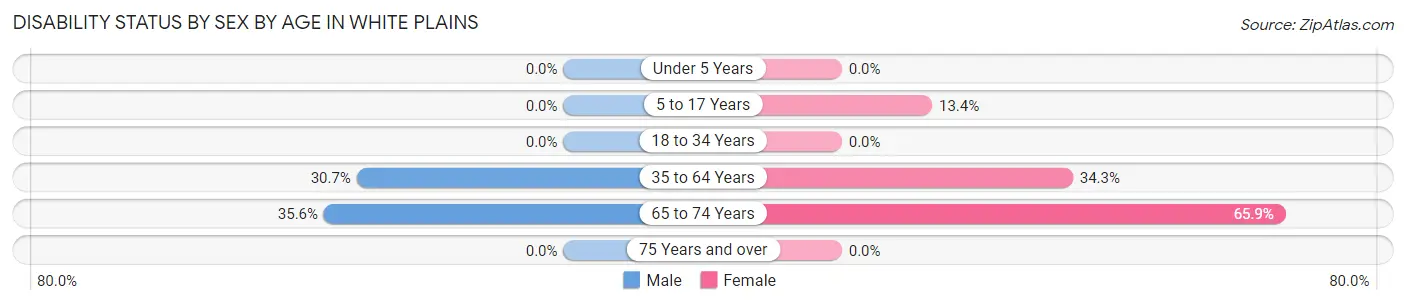
| Age Bracket | Male | Female |
| Under 5 Years | 0 (0.0%) | 0 (0.0%) |
| 5 to 17 Years | 0 (0.0%) | 13 (13.4%) |
| 18 to 34 Years | 0 (0.0%) | 0 (0.0%) |
| 35 to 64 Years | 58 (30.7%) | 59 (34.3%) |
| 65 to 74 Years | 16 (35.6%) | 29 (65.9%) |
| 75 Years and over | 0 (0.0%) | 0 (0.0%) |
Disability Class by Sex by Age in White Plains
Disability Class: Hearing Difficulty
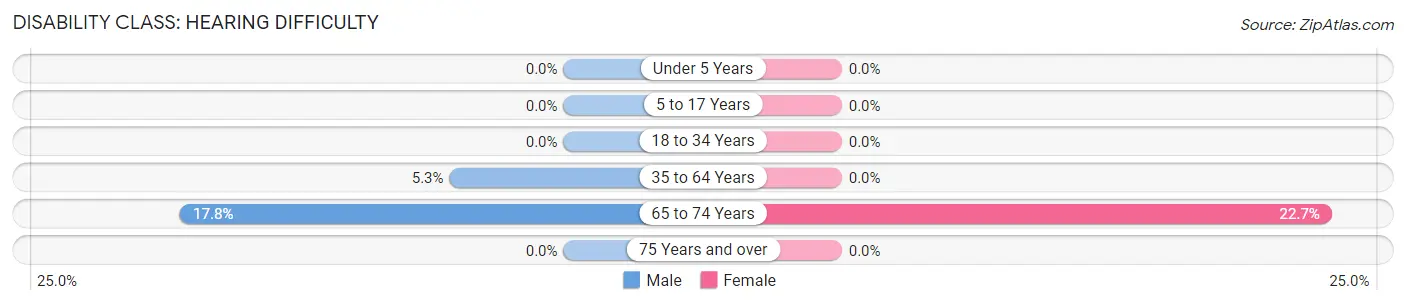
| Age Bracket | Male | Female |
| Under 5 Years | 0 (0.0%) | 0 (0.0%) |
| 5 to 17 Years | 0 (0.0%) | 0 (0.0%) |
| 18 to 34 Years | 0 (0.0%) | 0 (0.0%) |
| 35 to 64 Years | 10 (5.3%) | 0 (0.0%) |
| 65 to 74 Years | 8 (17.8%) | 10 (22.7%) |
| 75 Years and over | 0 (0.0%) | 0 (0.0%) |
Disability Class: Vision Difficulty
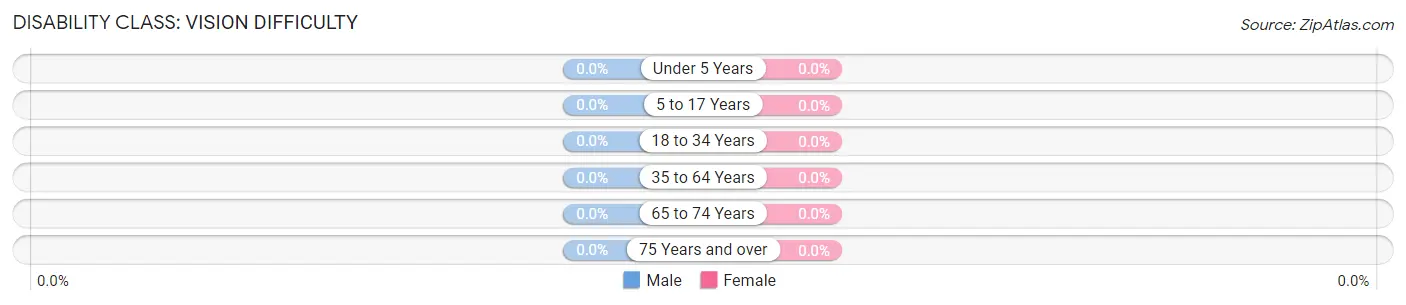
| Age Bracket | Male | Female |
| Under 5 Years | 0 (0.0%) | 0 (0.0%) |
| 5 to 17 Years | 0 (0.0%) | 0 (0.0%) |
| 18 to 34 Years | 0 (0.0%) | 0 (0.0%) |
| 35 to 64 Years | 0 (0.0%) | 0 (0.0%) |
| 65 to 74 Years | 0 (0.0%) | 0 (0.0%) |
| 75 Years and over | 0 (0.0%) | 0 (0.0%) |
Disability Class: Cognitive Difficulty
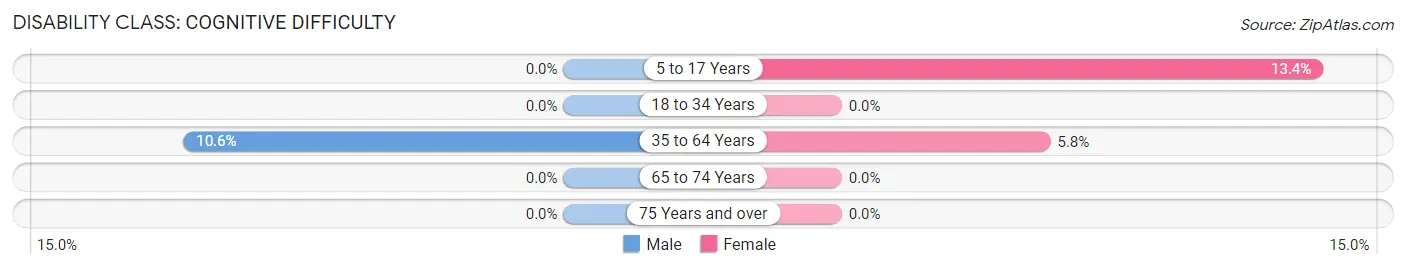
| Age Bracket | Male | Female |
| 5 to 17 Years | 0 (0.0%) | 13 (13.4%) |
| 18 to 34 Years | 0 (0.0%) | 0 (0.0%) |
| 35 to 64 Years | 20 (10.6%) | 10 (5.8%) |
| 65 to 74 Years | 0 (0.0%) | 0 (0.0%) |
| 75 Years and over | 0 (0.0%) | 0 (0.0%) |
Disability Class: Ambulatory Difficulty
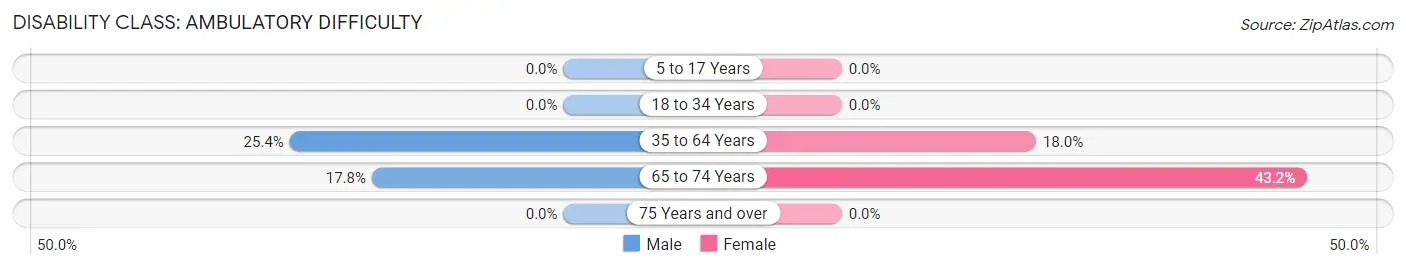
| Age Bracket | Male | Female |
| 5 to 17 Years | 0 (0.0%) | 0 (0.0%) |
| 18 to 34 Years | 0 (0.0%) | 0 (0.0%) |
| 35 to 64 Years | 48 (25.4%) | 31 (18.0%) |
| 65 to 74 Years | 8 (17.8%) | 19 (43.2%) |
| 75 Years and over | 0 (0.0%) | 0 (0.0%) |
Disability Class: Self-Care Difficulty
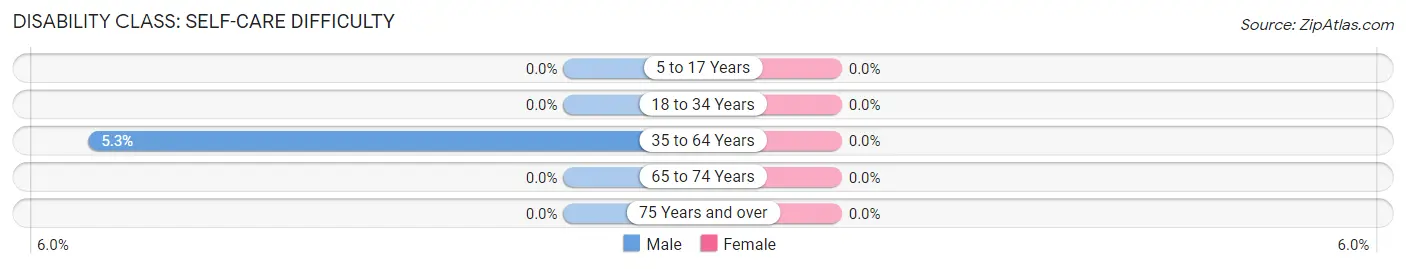
| Age Bracket | Male | Female |
| 5 to 17 Years | 0 (0.0%) | 0 (0.0%) |
| 18 to 34 Years | 0 (0.0%) | 0 (0.0%) |
| 35 to 64 Years | 10 (5.3%) | 0 (0.0%) |
| 65 to 74 Years | 0 (0.0%) | 0 (0.0%) |
| 75 Years and over | 0 (0.0%) | 0 (0.0%) |
Technology Access in White Plains
Computing Device Access in White Plains
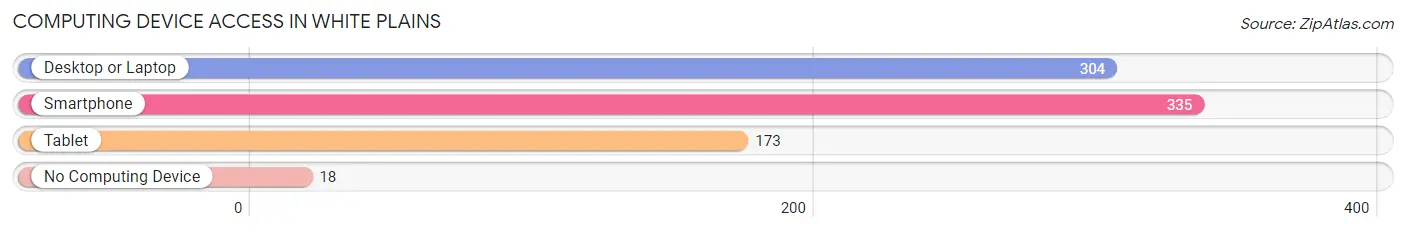
| Device Type | # Households | % Households |
| Desktop or Laptop | 304 | 75.8% |
| Smartphone | 335 | 83.5% |
| Tablet | 173 | 43.1% |
| No Computing Device | 18 | 4.5% |
| Total | 401 | 100.0% |
Internet Access in White Plains
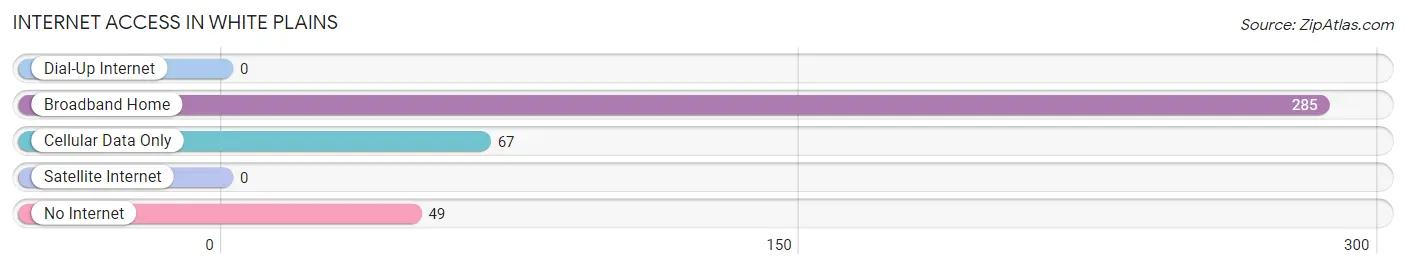
| Internet Type | # Households | % Households |
| Dial-Up Internet | 0 | 0.0% |
| Broadband Home | 285 | 71.1% |
| Cellular Data Only | 67 | 16.7% |
| Satellite Internet | 0 | 0.0% |
| No Internet | 49 | 12.2% |
| Total | 401 | 100.0% |
White Plains Summary
White Plains is a small unincorporated community located in the western part of Davidson County, North Carolina. It is situated along the Yadkin River, approximately 10 miles south of Lexington and 25 miles north of Winston-Salem. The population of White Plains was estimated to be around 1,000 in 2020.
History
White Plains was first settled in the late 1700s by a group of German immigrants. The town was originally known as “White’s Plains” after the family who owned the land. The name was later shortened to White Plains. The town was officially incorporated in 1891.
White Plains was a thriving agricultural community in the late 19th and early 20th centuries. The town was home to several cotton mills, a grist mill, and a sawmill. The town also had a post office, a general store, and a hotel.
Geography
White Plains is located in the western part of Davidson County, North Carolina. It is situated along the Yadkin River, approximately 10 miles south of Lexington and 25 miles north of Winston-Salem. The town is surrounded by rolling hills and farmland.
The climate in White Plains is mild and humid. Summers are hot and humid, with temperatures reaching into the 90s. Winters are mild, with temperatures rarely dropping below freezing.
Economy
White Plains is a small, rural community with a limited economy. The town is home to several small businesses, including a general store, a gas station, and a few restaurants. The town also has a post office and a few churches.
The town is also home to several farms, which produce a variety of crops, including corn, soybeans, and tobacco. The town is also home to several wineries, which produce a variety of wines.
Demographics
White Plains is a small, rural community with a population of around 1,000. The town is predominantly white, with a small African American population. The median household income in White Plains is around $35,000. The town has a high rate of poverty, with around 25% of the population living below the poverty line.
Common Questions
What is Per Capita Income in White Plains?
Per Capita income in White Plains is $30,832.
What is the Median Family Income in White Plains?
Median Family Income in White Plains is $76,512.
What is the Median Household income in White Plains?
Median Household Income in White Plains is $47,375.
What is Income or Wage Gap in White Plains?
Income or Wage Gap in White Plains is 20.4%.
Women in White Plains earn 79.6 cents for every dollar earned by a man.
What is Inequality or Gini Index in White Plains?
Inequality or Gini Index in White Plains is 0.33.
What is the Total Population of White Plains?
Total Population of White Plains is 767.
What is the Total Male Population of White Plains?
Total Male Population of White Plains is 366.
What is the Total Female Population of White Plains?
Total Female Population of White Plains is 401.
What is the Ratio of Males per 100 Females in White Plains?
There are 91.27 Males per 100 Females in White Plains.
What is the Ratio of Females per 100 Males in White Plains?
There are 109.56 Females per 100 Males in White Plains.
What is the Median Population Age in White Plains?
Median Population Age in White Plains is 54.1 Years.
What is the Average Family Size in White Plains
Average Family Size in White Plains is 2.6 People.
What is the Average Household Size in White Plains
Average Household Size in White Plains is 1.9 People.
How Large is the Labor Force in White Plains?
There are 376 People in the Labor Forcein in White Plains.
What is the Percentage of People in the Labor Force in White Plains?
61.1% of People are in the Labor Force in White Plains.