Speed, NC Map & Demographics
Speed Map
Speed Overview
$26,451
PER CAPITA INCOME
0.35
INEQUALITY / GINI INDEX
59
TOTAL POPULATION
28
MALE POPULATION
31
FEMALE POPULATION
90.32
MALES / 100 FEMALES
110.71
FEMALES / 100 MALES
67.1
MEDIAN AGE
2.0
AVG FAMILY SIZE
2.0
AVG HOUSEHOLD SIZE
27
LABOR FORCE [ PEOPLE ]
49.1%
PERCENT IN LABOR FORCE
Speed Zip Codes
Speed Area Codes
Income in Speed
Income Overview in Speed
| Characteristic | Number | Measure |
| Per Capita Income | 59 | $26,451 |
| Median Family Income | 23 | $0 |
| Mean Family Income | 23 | $59,952 |
| Median Household Income | 29 | $0 |
| Mean Household Income | 29 | $56,252 |
| Income Deficit | 23 | $0 |
| Wage / Income Gap (%) | 59 | 0.00% |
| Wage / Income Gap ($) | 59 | 100.00¢ per $1 |
| Gini / Inequality Index | 59 | 0.35 |
Earnings by Sex in Speed
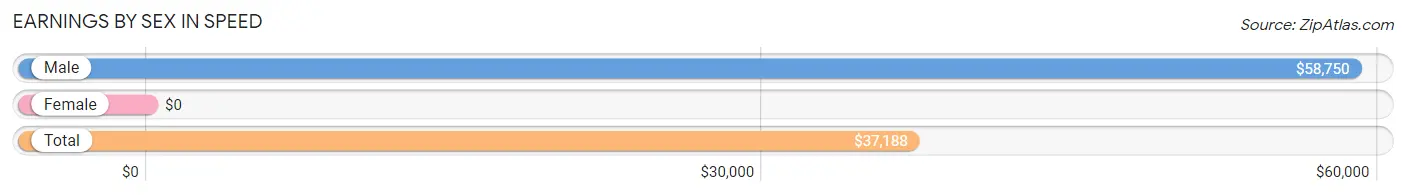
| Sex | Number | Average Earnings |
| Male | 13 (48.1%) | $58,750 |
| Female | 14 (51.8%) | $0 |
| Total | 27 (100.0%) | $37,188 |
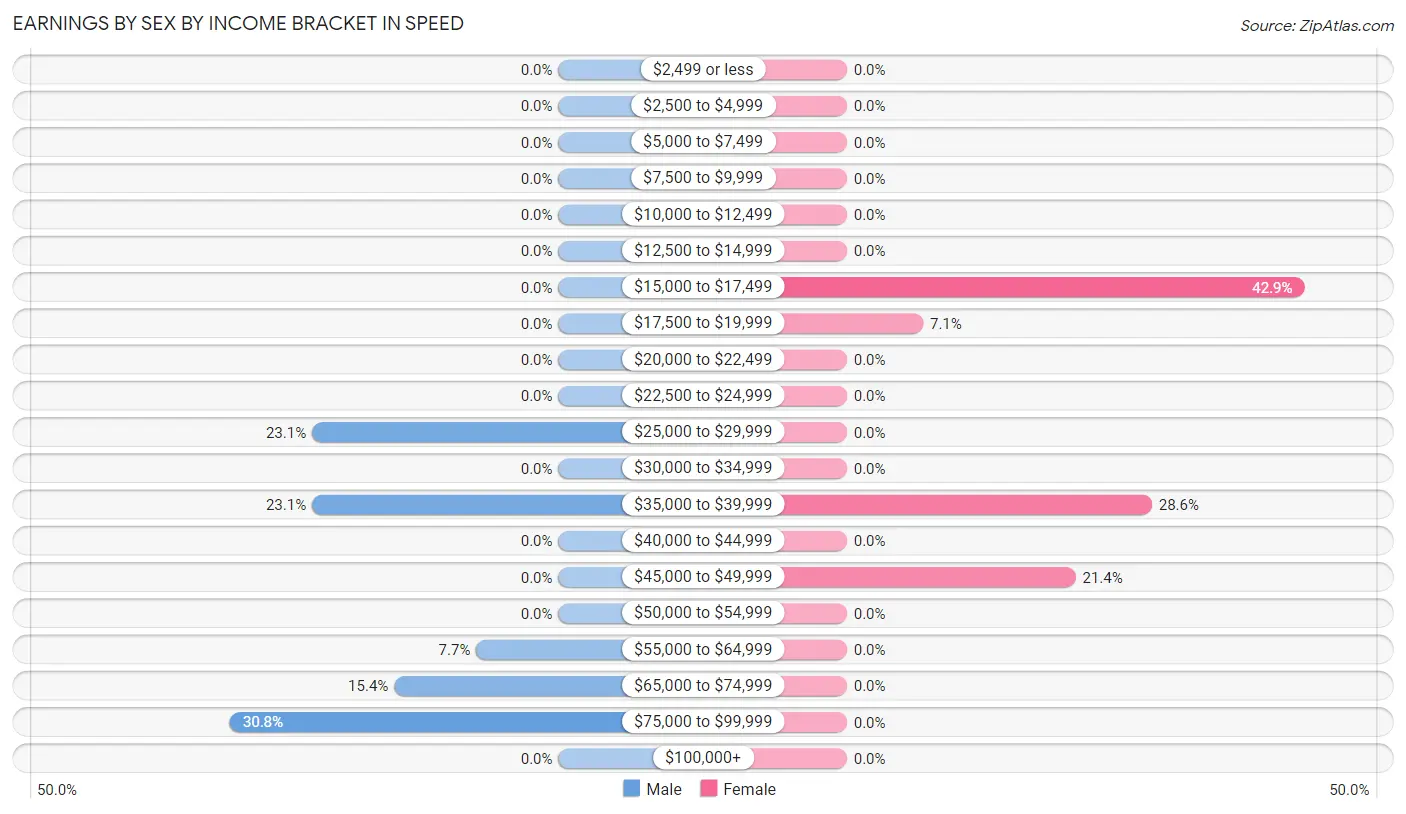
Earnings by Sex by Income Bracket in Speed
The most common earnings brackets in Speed are $75,000 to $99,999 for men (4 | 30.8%) and $15,000 to $17,499 for women (6 | 42.9%).
| Income | Male | Female |
| $2,499 or less | 0 (0.0%) | 0 (0.0%) |
| $2,500 to $4,999 | 0 (0.0%) | 0 (0.0%) |
| $5,000 to $7,499 | 0 (0.0%) | 0 (0.0%) |
| $7,500 to $9,999 | 0 (0.0%) | 0 (0.0%) |
| $10,000 to $12,499 | 0 (0.0%) | 0 (0.0%) |
| $12,500 to $14,999 | 0 (0.0%) | 0 (0.0%) |
| $15,000 to $17,499 | 0 (0.0%) | 6 (42.9%) |
| $17,500 to $19,999 | 0 (0.0%) | 1 (7.1%) |
| $20,000 to $22,499 | 0 (0.0%) | 0 (0.0%) |
| $22,500 to $24,999 | 0 (0.0%) | 0 (0.0%) |
| $25,000 to $29,999 | 3 (23.1%) | 0 (0.0%) |
| $30,000 to $34,999 | 0 (0.0%) | 0 (0.0%) |
| $35,000 to $39,999 | 3 (23.1%) | 4 (28.6%) |
| $40,000 to $44,999 | 0 (0.0%) | 0 (0.0%) |
| $45,000 to $49,999 | 0 (0.0%) | 3 (21.4%) |
| $50,000 to $54,999 | 0 (0.0%) | 0 (0.0%) |
| $55,000 to $64,999 | 1 (7.7%) | 0 (0.0%) |
| $65,000 to $74,999 | 2 (15.4%) | 0 (0.0%) |
| $75,000 to $99,999 | 4 (30.8%) | 0 (0.0%) |
| $100,000+ | 0 (0.0%) | 0 (0.0%) |
| Total | 13 (100.0%) | 14 (100.0%) |
Earnings by Sex by Educational Attainment in Speed
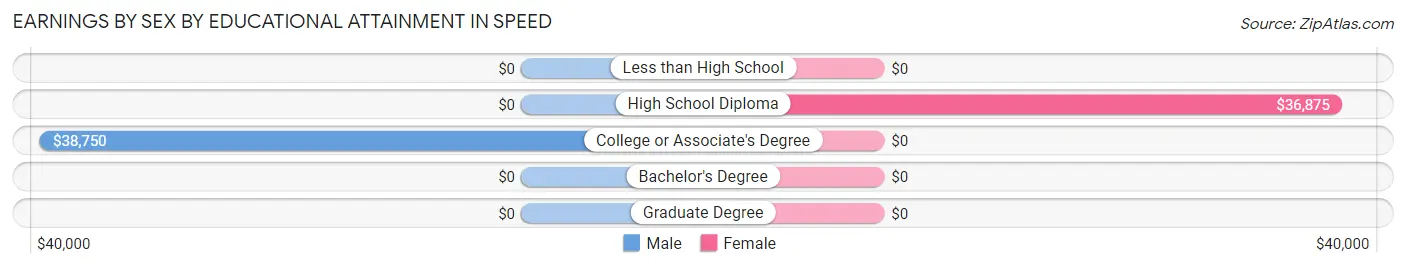
| Educational Attainment | Male Income | Female Income |
| Less than High School | - | - |
| High School Diploma | - | - |
| College or Associate's Degree | $38,750 | $0 |
| Bachelor's Degree | - | - |
| Graduate Degree | - | - |
| Total | $58,750 | $0 |
Family Income in Speed
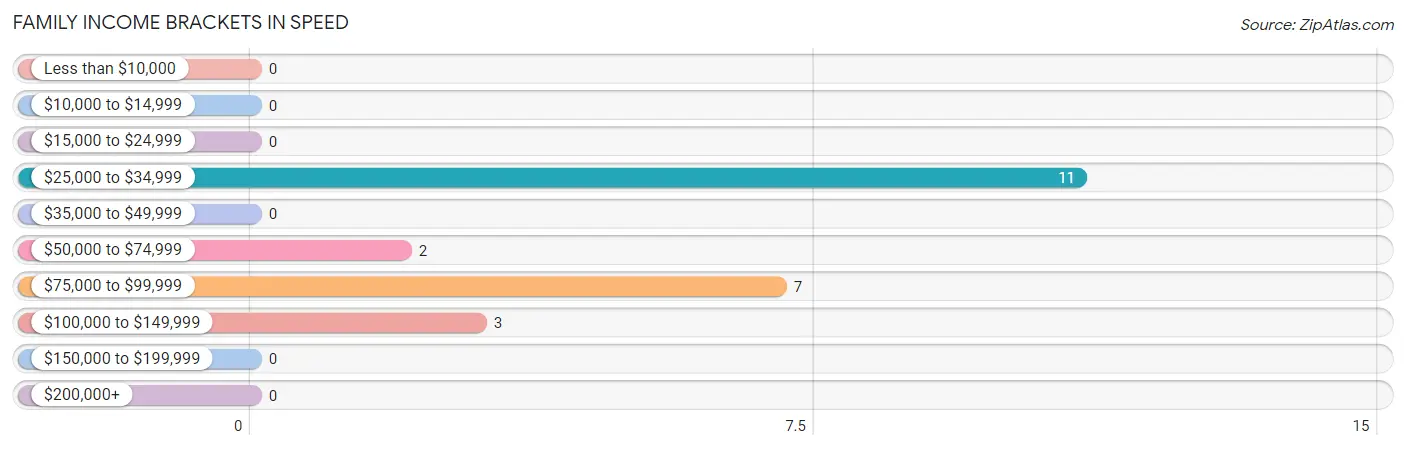
Family Income Brackets in Speed
According to the Speed family income data, there are 11 families falling into the $25,000 to $34,999 income range, which is the most common income bracket and makes up 47.8% of all families.
| Income Bracket | # Families | % Families |
| Less than $10,000 | 0 | 0.0% |
| $10,000 to $14,999 | 0 | 0.0% |
| $15,000 to $24,999 | 0 | 0.0% |
| $25,000 to $34,999 | 11 | 47.8% |
| $35,000 to $49,999 | 0 | 0.0% |
| $50,000 to $74,999 | 2 | 8.7% |
| $75,000 to $99,999 | 7 | 30.4% |
| $100,000 to $149,999 | 3 | 13.0% |
| $150,000 to $199,999 | 0 | 0.0% |
| $200,000+ | 0 | 0.0% |
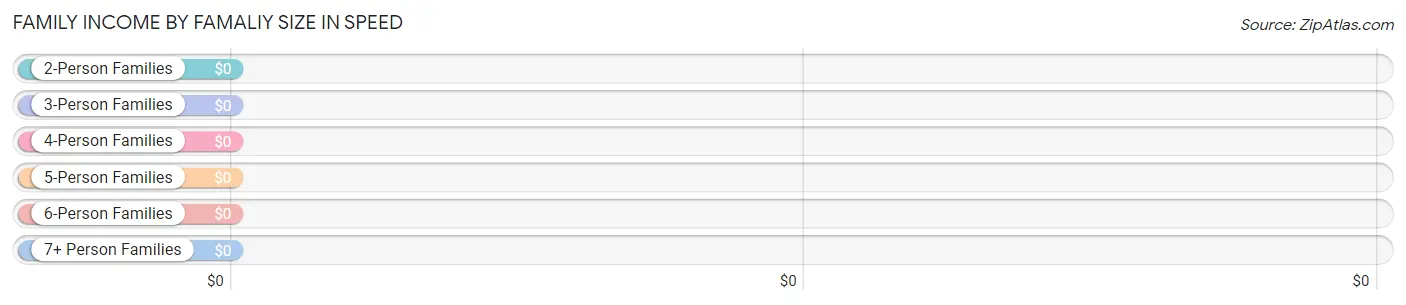
Family Income by Famaliy Size in Speed
| Income Bracket | # Families | Median Income |
| 2-Person Families | 21 (91.3%) | $0 |
| 3-Person Families | 2 (8.7%) | $0 |
| 4-Person Families | 0 (0.0%) | $0 |
| 5-Person Families | 0 (0.0%) | $0 |
| 6-Person Families | 0 (0.0%) | $0 |
| 7+ Person Families | 0 (0.0%) | $0 |
| Total | 23 (100.0%) | $0 |
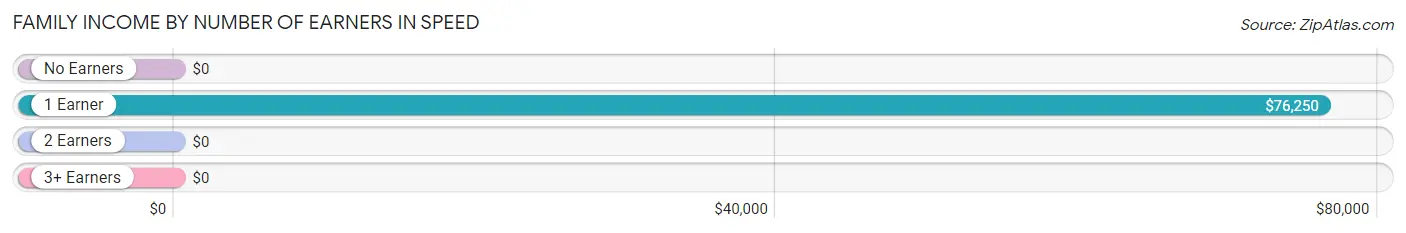
Family Income by Number of Earners in Speed
| Number of Earners | # Families | Median Income |
| No Earners | 9 (39.1%) | $0 |
| 1 Earner | 8 (34.8%) | $76,250 |
| 2 Earners | 6 (26.1%) | $0 |
| 3+ Earners | 0 (0.0%) | $0 |
| Total | 23 (100.0%) | $0 |
Household Income in Speed
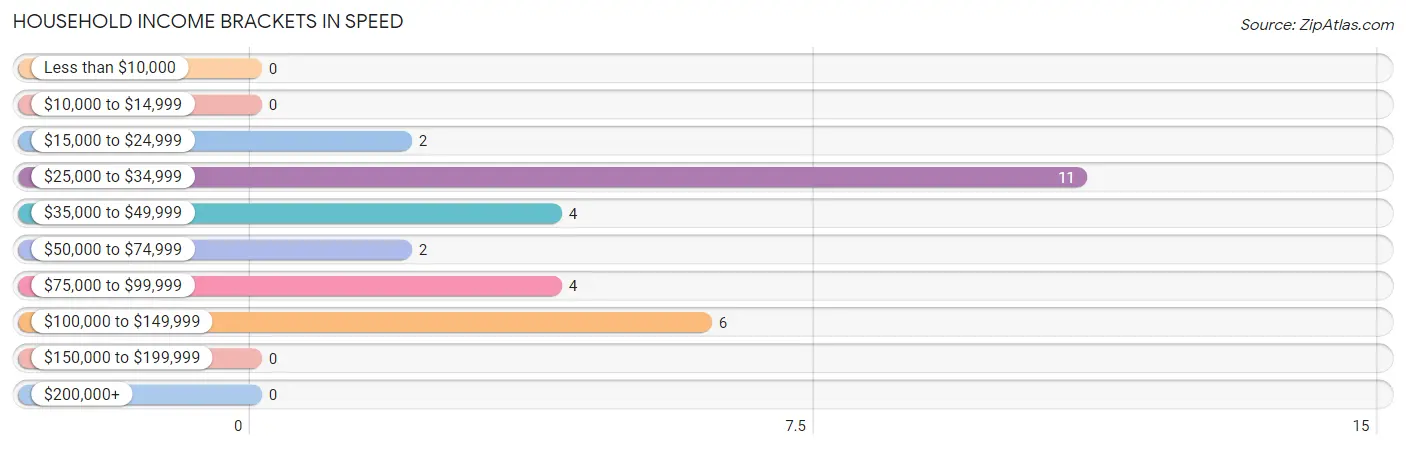
Household Income Brackets in Speed
With 11 households falling in the category, the $25,000 to $34,999 income range is the most frequent in Speed, accounting for 37.9% of all households.
| Income Bracket | # Households | % Households |
| Less than $10,000 | 0 | 0.0% |
| $10,000 to $14,999 | 0 | 0.0% |
| $15,000 to $24,999 | 2 | 6.9% |
| $25,000 to $34,999 | 11 | 37.9% |
| $35,000 to $49,999 | 4 | 13.8% |
| $50,000 to $74,999 | 2 | 6.9% |
| $75,000 to $99,999 | 4 | 13.8% |
| $100,000 to $149,999 | 6 | 20.7% |
| $150,000 to $199,999 | 0 | 0.0% |
| $200,000+ | 0 | 0.0% |
Household Income by Householder Age in Speed
The median household income in Speed is $0, with the highest median household income of $88,438 found in the 45 to 64 years age bracket for the primary householder. A total of 11 households (37.9%) fall into this category.
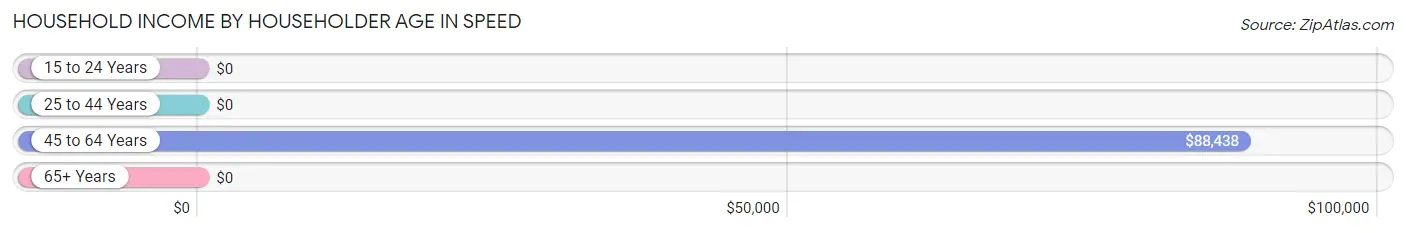
| Income Bracket | # Households | Median Income |
| 15 to 24 Years | 0 (0.0%) | $0 |
| 25 to 44 Years | 0 (0.0%) | $0 |
| 45 to 64 Years | 11 (37.9%) | $88,438 |
| 65+ Years | 18 (62.1%) | $0 |
| Total | 29 (100.0%) | $0 |
Poverty in Speed
Income Below Poverty by Sex and Age in Speed
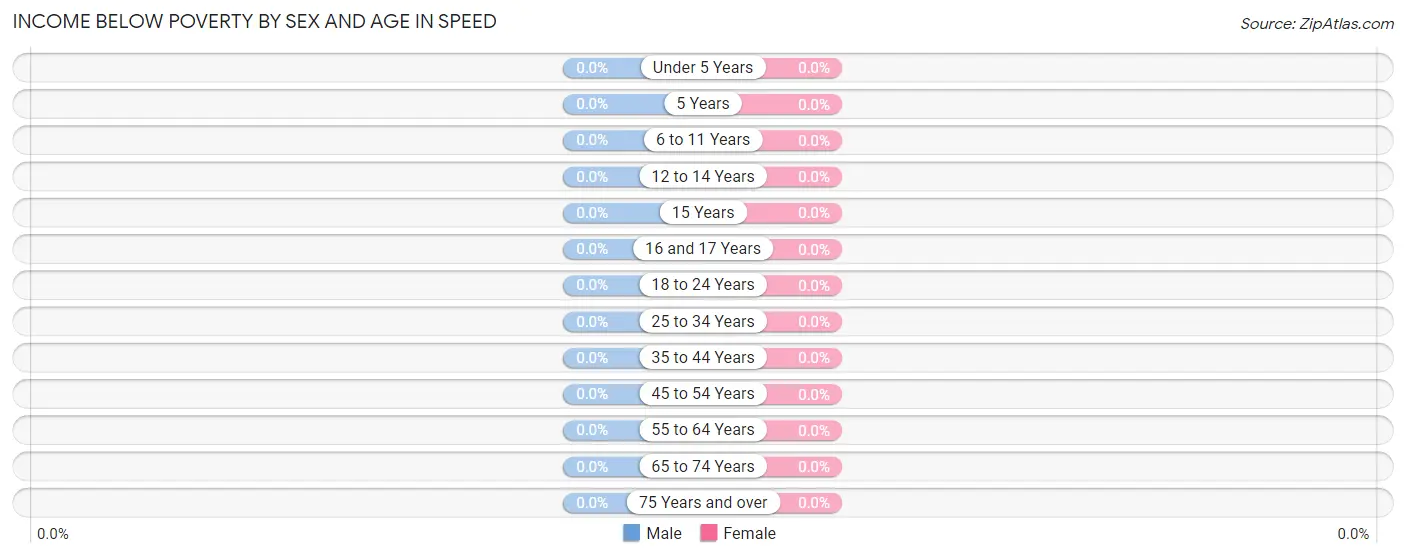
| Age Bracket | Male | Female |
| Under 5 Years | 0 (0.0%) | 0 (0.0%) |
| 5 Years | 0 (0.0%) | 0 (0.0%) |
| 6 to 11 Years | 0 (0.0%) | 0 (0.0%) |
| 12 to 14 Years | 0 (0.0%) | 0 (0.0%) |
| 15 Years | 0 (0.0%) | 0 (0.0%) |
| 16 and 17 Years | 0 (0.0%) | 0 (0.0%) |
| 18 to 24 Years | 0 (0.0%) | 0 (0.0%) |
| 25 to 34 Years | 0 (0.0%) | 0 (0.0%) |
| 35 to 44 Years | 0 (0.0%) | 0 (0.0%) |
| 45 to 54 Years | 0 (0.0%) | 0 (0.0%) |
| 55 to 64 Years | 0 (0.0%) | 0 (0.0%) |
| 65 to 74 Years | 0 (0.0%) | 0 (0.0%) |
| 75 Years and over | 0 (0.0%) | 0 (0.0%) |
| Total | 0 (0.0%) | 0 (0.0%) |
Income Above Poverty by Sex and Age in Speed
According to the poverty statistics in Speed, males aged 15 years and females aged 45 to 54 years are the age groups that are most secure financially, with 100.0% of males and 100.0% of females in these age groups living above the poverty line.
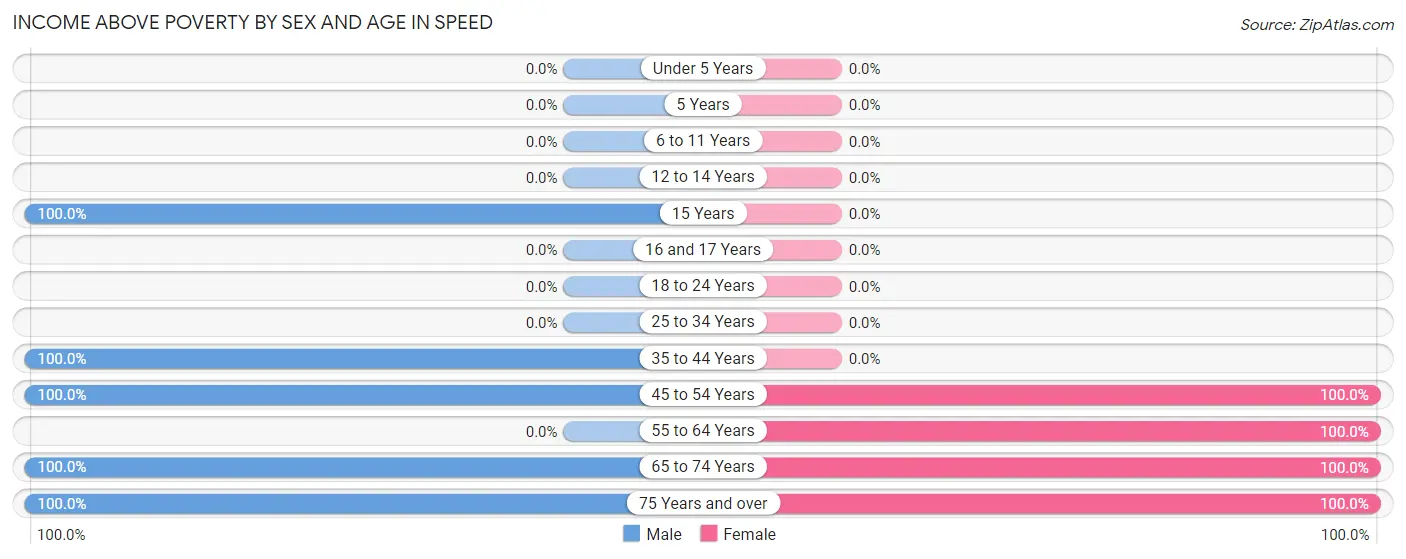
| Age Bracket | Male | Female |
| Under 5 Years | 0 (0.0%) | 0 (0.0%) |
| 5 Years | 0 (0.0%) | 0 (0.0%) |
| 6 to 11 Years | 0 (0.0%) | 0 (0.0%) |
| 12 to 14 Years | 0 (0.0%) | 0 (0.0%) |
| 15 Years | 4 (100.0%) | 0 (0.0%) |
| 16 and 17 Years | 0 (0.0%) | 0 (0.0%) |
| 18 to 24 Years | 0 (0.0%) | 0 (0.0%) |
| 25 to 34 Years | 0 (0.0%) | 0 (0.0%) |
| 35 to 44 Years | 2 (100.0%) | 0 (0.0%) |
| 45 to 54 Years | 8 (100.0%) | 4 (100.0%) |
| 55 to 64 Years | 0 (0.0%) | 4 (100.0%) |
| 65 to 74 Years | 12 (100.0%) | 19 (100.0%) |
| 75 Years and over | 2 (100.0%) | 4 (100.0%) |
| Total | 28 (100.0%) | 31 (100.0%) |
Income Below Poverty Among Married-Couple Families in Speed
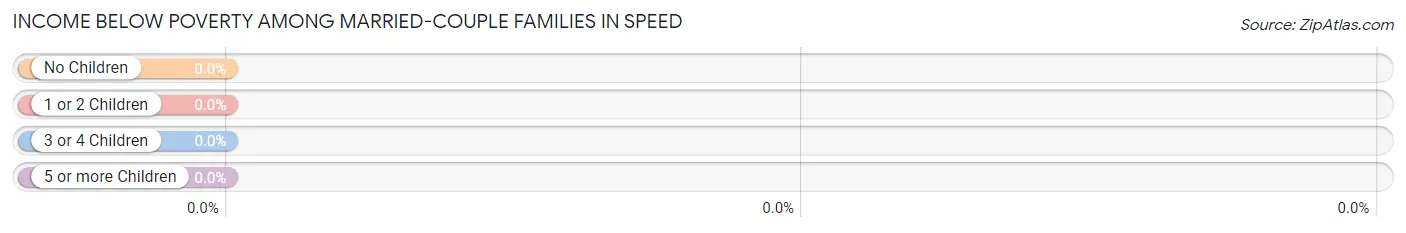
| Children | Above Poverty | Below Poverty |
| No Children | 14 (100.0%) | 0 (0.0%) |
| 1 or 2 Children | 0 (0.0%) | 0 (0.0%) |
| 3 or 4 Children | 0 (0.0%) | 0 (0.0%) |
| 5 or more Children | 0 (0.0%) | 0 (0.0%) |
| Total | 14 (100.0%) | 0 (0.0%) |
Income Below Poverty Among Single-Parent Households in Speed
| Children | Single Father | Single Mother |
| No Children | 0 (0.0%) | 0 (0.0%) |
| 1 or 2 Children | 0 (0.0%) | 0 (0.0%) |
| 3 or 4 Children | 0 (0.0%) | 0 (0.0%) |
| 5 or more Children | 0 (0.0%) | 0 (0.0%) |
| Total | 0 (0.0%) | 0 (0.0%) |
Income Below Poverty Among Married-Couple vs Single-Parent Households in Speed
| Children | Married-Couple Families | Single-Parent Households |
| No Children | 0 (0.0%) | 0 (0.0%) |
| 1 or 2 Children | 0 (0.0%) | 0 (0.0%) |
| 3 or 4 Children | 0 (0.0%) | 0 (0.0%) |
| 5 or more Children | 0 (0.0%) | 0 (0.0%) |
| Total | 0 (0.0%) | 0 (0.0%) |
Race in Speed
The most populous races in Speed are Black / African American (33 | 55.9%), and White / Caucasian (26 | 44.1%).
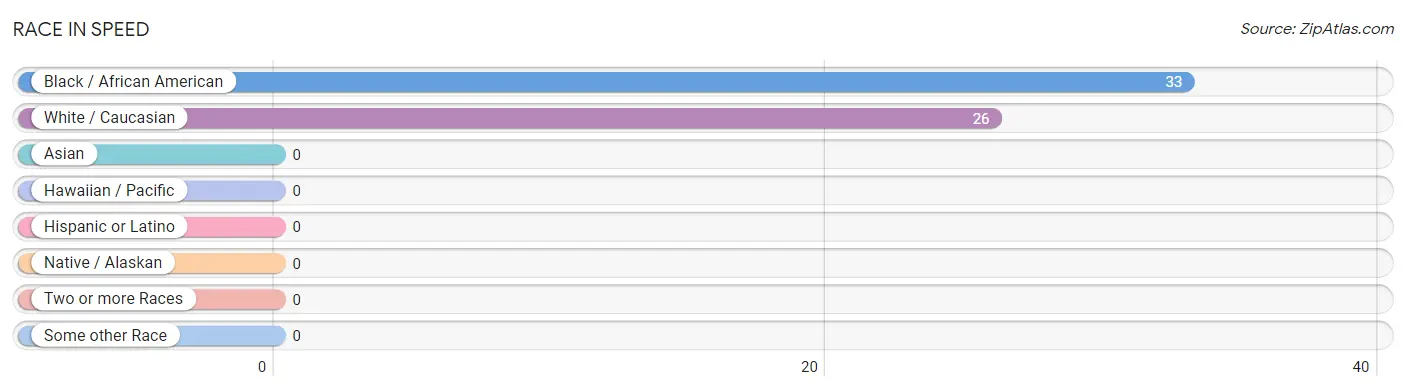
| Race | # Population | % Population |
| Asian | 0 | 0.0% |
| Black / African American | 33 | 55.9% |
| Hawaiian / Pacific | 0 | 0.0% |
| Hispanic or Latino | 0 | 0.0% |
| Native / Alaskan | 0 | 0.0% |
| White / Caucasian | 26 | 44.1% |
| Two or more Races | 0 | 0.0% |
| Some other Race | 0 | 0.0% |
| Total | 59 | 100.0% |
Ancestry in Speed
The most populous ancestries reported in Speed are , and American (7 | 11.9%), together accounting for 11.9% of all Speed residents.

| Ancestry | # Population | % Population |
| American | 7 | 11.9% | View All 1 Rows |
Immigrants in Speed

| Immigration Origin | # Population | % Population | View All 0 Rows |
Sex and Age in Speed
Sex and Age in Speed
The most populous age groups in Speed are 65 to 69 Years (12 | 42.9%) for men and 65 to 69 Years (17 | 54.8%) for women.
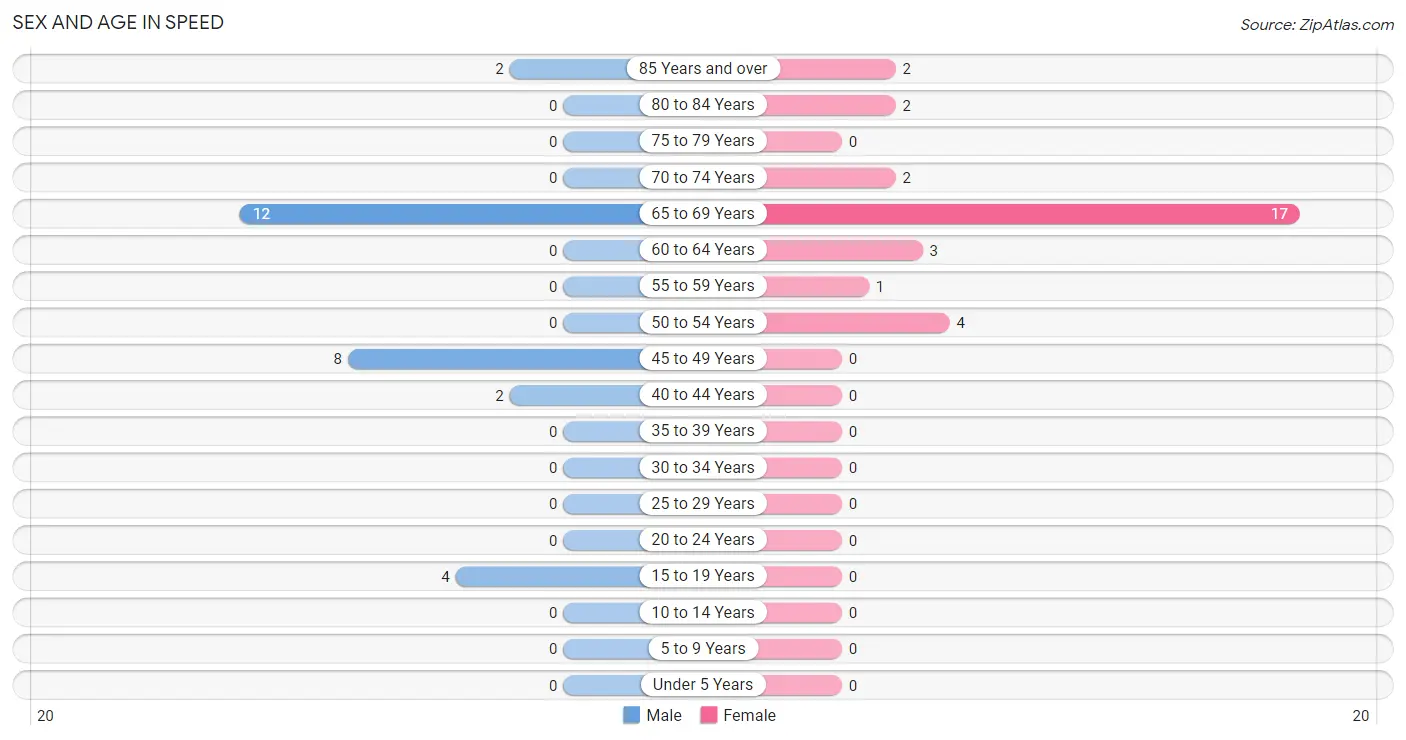
| Age Bracket | Male | Female |
| Under 5 Years | 0 (0.0%) | 0 (0.0%) |
| 5 to 9 Years | 0 (0.0%) | 0 (0.0%) |
| 10 to 14 Years | 0 (0.0%) | 0 (0.0%) |
| 15 to 19 Years | 4 (14.3%) | 0 (0.0%) |
| 20 to 24 Years | 0 (0.0%) | 0 (0.0%) |
| 25 to 29 Years | 0 (0.0%) | 0 (0.0%) |
| 30 to 34 Years | 0 (0.0%) | 0 (0.0%) |
| 35 to 39 Years | 0 (0.0%) | 0 (0.0%) |
| 40 to 44 Years | 2 (7.1%) | 0 (0.0%) |
| 45 to 49 Years | 8 (28.6%) | 0 (0.0%) |
| 50 to 54 Years | 0 (0.0%) | 4 (12.9%) |
| 55 to 59 Years | 0 (0.0%) | 1 (3.2%) |
| 60 to 64 Years | 0 (0.0%) | 3 (9.7%) |
| 65 to 69 Years | 12 (42.9%) | 17 (54.8%) |
| 70 to 74 Years | 0 (0.0%) | 2 (6.5%) |
| 75 to 79 Years | 0 (0.0%) | 0 (0.0%) |
| 80 to 84 Years | 0 (0.0%) | 2 (6.5%) |
| 85 Years and over | 2 (7.1%) | 2 (6.5%) |
| Total | 28 (100.0%) | 31 (100.0%) |
Families and Households in Speed
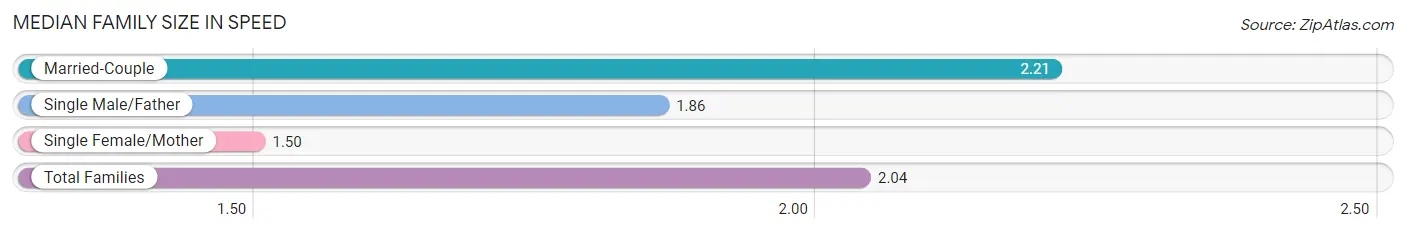
Median Family Size in Speed
The median family size in Speed is 2.04 persons per family, with married-couple families (14 | 60.9%) accounting for the largest median family size of 2.21 persons per family. On the other hand, single female/mother families (2 | 8.7%) represent the smallest median family size with 1.50 persons per family.
| Family Type | # Families | Family Size |
| Married-Couple | 14 (60.9%) | 2.21 |
| Single Male/Father | 7 (30.4%) | 1.86 |
| Single Female/Mother | 2 (8.7%) | 1.50 |
| Total Families | 23 (100.0%) | 2.04 |
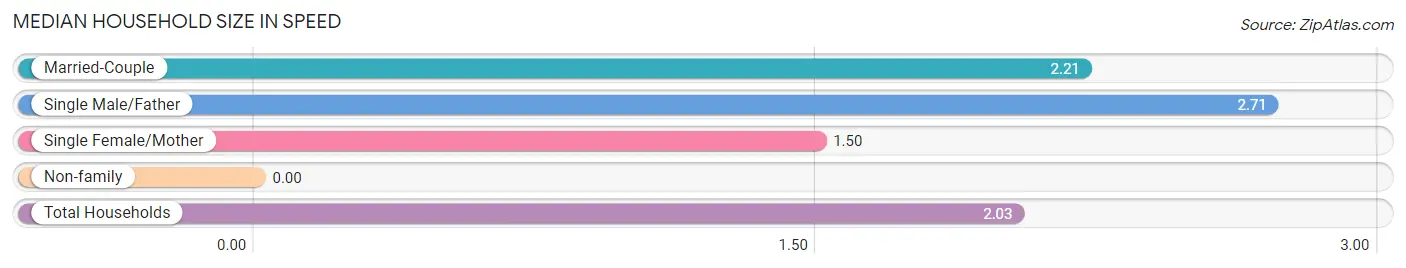
Median Household Size in Speed
| Household Type | # Households | Household Size |
| Married-Couple | 14 (48.3%) | 2.21 |
| Single Male/Father | 7 (24.1%) | 2.71 |
| Single Female/Mother | 2 (6.9%) | 1.50 |
| Non-family | 6 (20.7%) | - |
| Total Households | 29 (100.0%) | 2.03 |
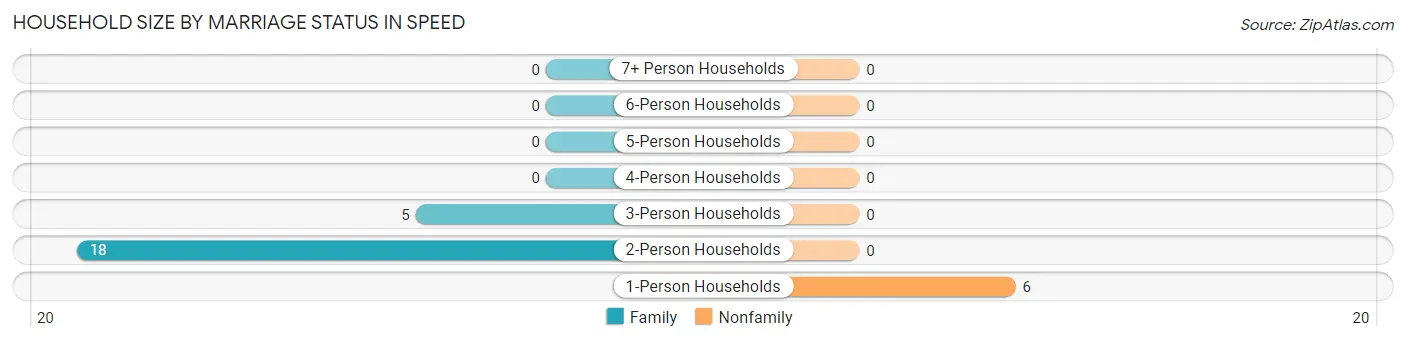
Household Size by Marriage Status in Speed
Out of a total of 29 households in Speed, 23 (79.3%) are family households, while 6 (20.7%) are nonfamily households. The most numerous type of family households are 2-person households, comprising 18, and the most common type of nonfamily households are 1-person households, comprising 6.
| Household Size | Family Households | Nonfamily Households |
| 1-Person Households | - | 6 (20.7%) |
| 2-Person Households | 18 (62.1%) | 0 (0.0%) |
| 3-Person Households | 5 (17.2%) | 0 (0.0%) |
| 4-Person Households | 0 (0.0%) | 0 (0.0%) |
| 5-Person Households | 0 (0.0%) | 0 (0.0%) |
| 6-Person Households | 0 (0.0%) | 0 (0.0%) |
| 7+ Person Households | 0 (0.0%) | 0 (0.0%) |
| Total | 23 (79.3%) | 6 (20.7%) |
Female Fertility in Speed
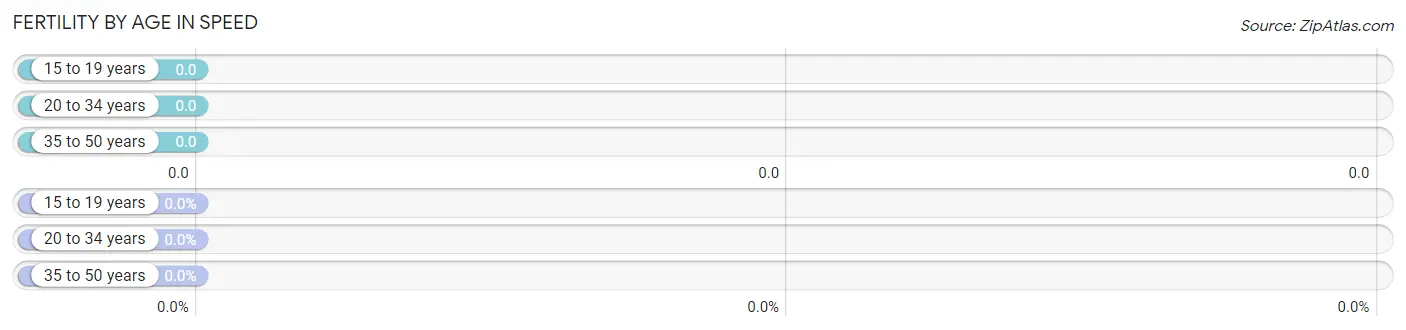
Fertility by Age in Speed
| Age Bracket | Women with Births | Births / 1,000 Women |
| 15 to 19 years | 0 (0.0%) | 0.0 |
| 20 to 34 years | 0 (0.0%) | 0.0 |
| 35 to 50 years | 0 (0.0%) | 0.0 |
| Total | 0 (0.0%) | 0.0 |
Fertility by Age by Marriage Status in Speed
| Age Bracket | Married | Unmarried |
| 15 to 19 years | 0 (0.0%) | 0 (0.0%) |
| 20 to 34 years | 0 (0.0%) | 0 (0.0%) |
| 35 to 50 years | 0 (0.0%) | 0 (0.0%) |
| Total | 0 (0.0%) | 0 (0.0%) |
Fertility by Education in Speed
| Educational Attainment | Women with Births | Births / 1,000 Women |
| Less than High School | 0 (0.0%) | 0.0 |
| High School Diploma | 0 (0.0%) | 0.0 |
| College or Associate's Degree | 0 (0.0%) | 0.0 |
| Bachelor's Degree | 0 (0.0%) | 0.0 |
| Graduate Degree | 0 (0.0%) | 0.0 |
| Total | 0 (0.0%) | 0.0 |
Fertility by Education by Marriage Status in Speed
| Educational Attainment | Married | Unmarried |
| Less than High School | 0 (0.0%) | 0 (0.0%) |
| High School Diploma | 0 (0.0%) | 0 (0.0%) |
| College or Associate's Degree | 0 (0.0%) | 0 (0.0%) |
| Bachelor's Degree | 0 (0.0%) | 0 (0.0%) |
| Graduate Degree | 0 (0.0%) | 0 (0.0%) |
| Total | 0 (0.0%) | 0 (0.0%) |
Employment Characteristics in Speed
Employment by Class of Employer in Speed
Among the 25 employed individuals in Speed, private company employees (18 | 72.0%), not-for-profit organizations (4 | 16.0%), and state government employees (3 | 12.0%) make up the most common classes of employment.

| Employer Class | # Employees | % Employees |
| Private Company Employees | 18 | 72.0% |
| Self-Employed (Incorporated) | 0 | 0.0% |
| Self-Employed (Not Incorporated) | 0 | 0.0% |
| Not-for-profit Organizations | 4 | 16.0% |
| Local Government Employees | 0 | 0.0% |
| State Government Employees | 3 | 12.0% |
| Federal Government Employees | 0 | 0.0% |
| Unpaid Family Workers | 0 | 0.0% |
| Total | 25 | 100.0% |
Employment Status by Age in Speed
| Age Bracket | In Labor Force | Unemployed |
| 16 to 19 Years | 0 (0.0%) | 0 (0.0%) |
| 20 to 24 Years | 0 (0.0%) | 0 (0.0%) |
| 25 to 29 Years | 0 (0.0%) | 0 (0.0%) |
| 30 to 34 Years | 0 (0.0%) | 0 (0.0%) |
| 35 to 44 Years | 2 (100.0%) | 0 (0.0%) |
| 45 to 54 Years | 12 (100.0%) | 0 (0.0%) |
| 55 to 59 Years | 1 (100.0%) | 0 (0.0%) |
| 60 to 64 Years | 3 (100.0%) | 0 (0.0%) |
| 65 to 74 Years | 9 (29.0%) | 0 (0.0%) |
| 75 Years and over | 0 (0.0%) | 0 (0.0%) |
| Total | 27 (49.1%) | 0 (0.0%) |
Employment Status by Educational Attainment in Speed
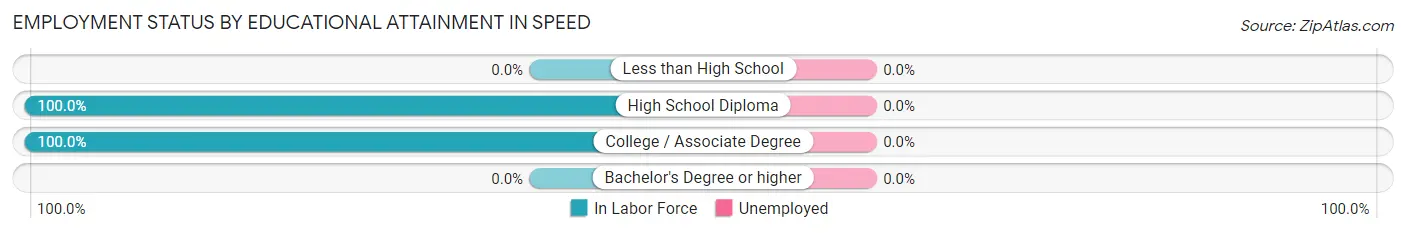
| Educational Attainment | In Labor Force | Unemployed |
| Less than High School | 0 (0.0%) | 0 (0.0%) |
| High School Diploma | 12 (100.0%) | 0 (0.0%) |
| College / Associate Degree | 6 (100.0%) | 0 (0.0%) |
| Bachelor's Degree or higher | 0 (0.0%) | 0 (0.0%) |
| Total | 18 (100.0%) | 0 (0.0%) |
Employment Occupations by Sex in Speed
Management, Business, Science and Arts Occupations
The most common Management, Business, Science and Arts occupations in Speed are , and Business & Financial (6 | 22.2%).
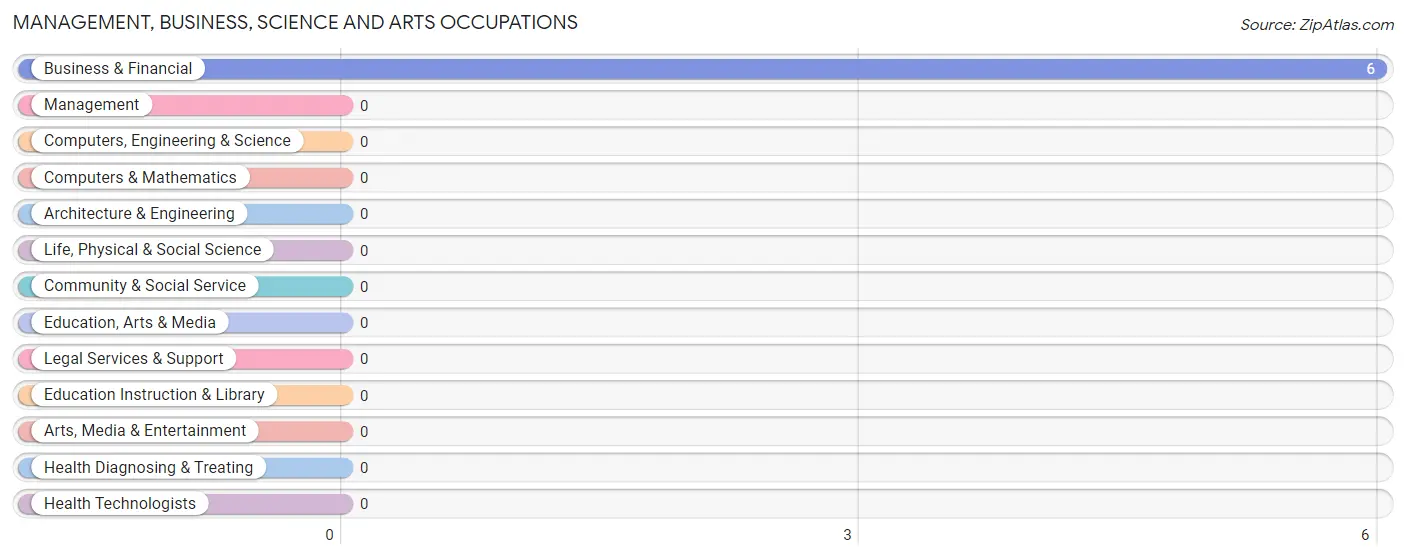
Management, Business, Science and Arts Occupations by Sex
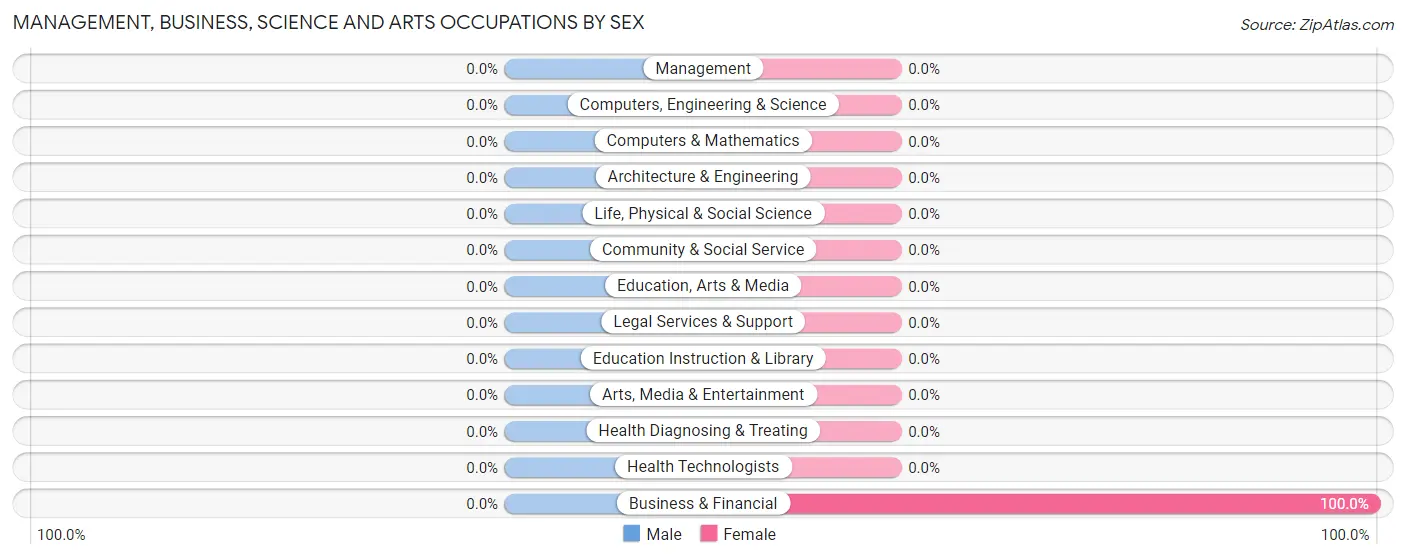
| Occupation | Male | Female |
| Management | 0 (0.0%) | 0 (0.0%) |
| Business & Financial | 0 (0.0%) | 6 (100.0%) |
| Computers, Engineering & Science | 0 (0.0%) | 0 (0.0%) |
| Computers & Mathematics | 0 (0.0%) | 0 (0.0%) |
| Architecture & Engineering | 0 (0.0%) | 0 (0.0%) |
| Life, Physical & Social Science | 0 (0.0%) | 0 (0.0%) |
| Community & Social Service | 0 (0.0%) | 0 (0.0%) |
| Education, Arts & Media | 0 (0.0%) | 0 (0.0%) |
| Legal Services & Support | 0 (0.0%) | 0 (0.0%) |
| Education Instruction & Library | 0 (0.0%) | 0 (0.0%) |
| Arts, Media & Entertainment | 0 (0.0%) | 0 (0.0%) |
| Health Diagnosing & Treating | 0 (0.0%) | 0 (0.0%) |
| Health Technologists | 0 (0.0%) | 0 (0.0%) |
| Total (Category) | 0 (0.0%) | 6 (100.0%) |
| Total (Overall) | 13 (48.1%) | 14 (51.8%) |
Services Occupations
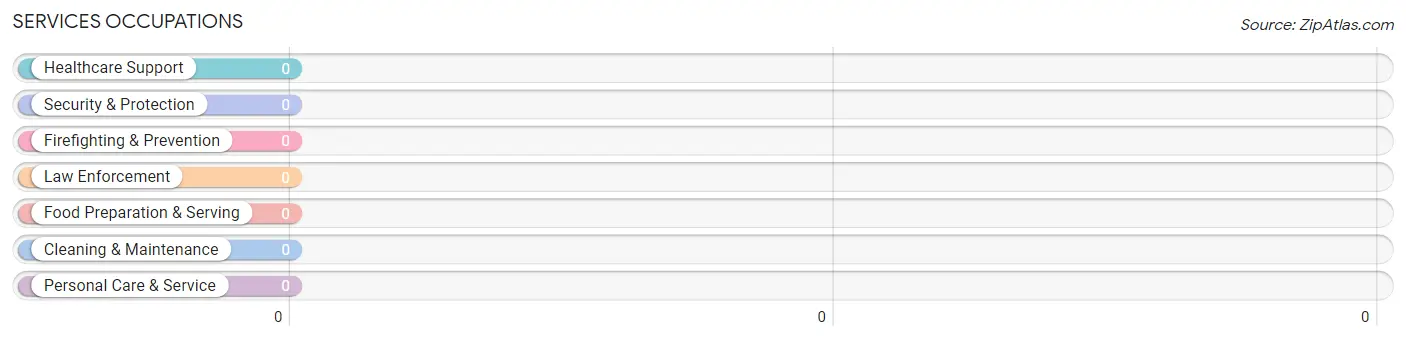
Services Occupations by Sex
| Occupation | Male | Female |
| Healthcare Support | 0 (0.0%) | 0 (0.0%) |
| Security & Protection | 0 (0.0%) | 0 (0.0%) |
| Firefighting & Prevention | 0 (0.0%) | 0 (0.0%) |
| Law Enforcement | 0 (0.0%) | 0 (0.0%) |
| Food Preparation & Serving | 0 (0.0%) | 0 (0.0%) |
| Cleaning & Maintenance | 0 (0.0%) | 0 (0.0%) |
| Personal Care & Service | 0 (0.0%) | 0 (0.0%) |
| Total (Category) | 0 (0.0%) | 0 (0.0%) |
| Total (Overall) | 13 (48.1%) | 14 (51.8%) |
Sales and Office Occupations
The most common Sales and Office occupations in Speed are Sales & Related (3 | 11.1%), and Office & Administration (3 | 11.1%).
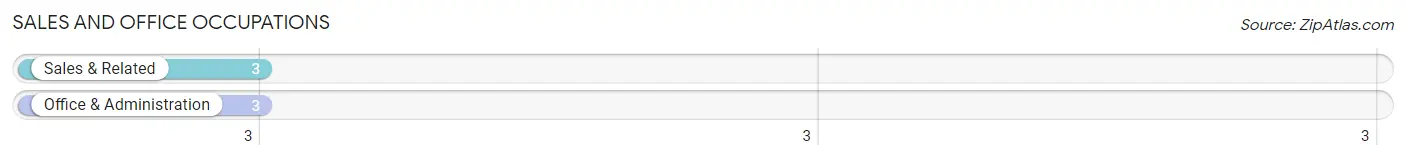
Sales and Office Occupations by Sex
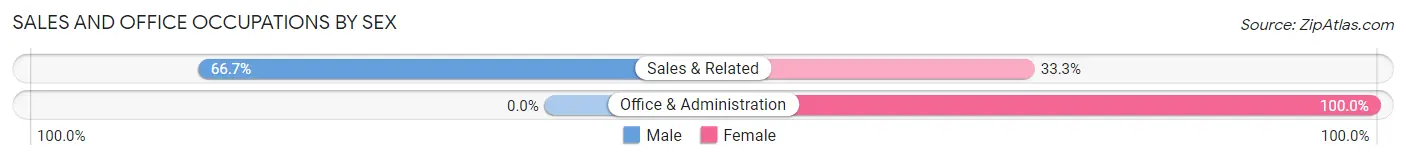
| Occupation | Male | Female |
| Sales & Related | 2 (66.7%) | 1 (33.3%) |
| Office & Administration | 0 (0.0%) | 3 (100.0%) |
| Total (Category) | 2 (33.3%) | 4 (66.7%) |
| Total (Overall) | 13 (48.1%) | 14 (51.8%) |
Natural Resources, Construction and Maintenance Occupations
The most common Natural Resources, Construction and Maintenance occupations in Speed are Installation, Maintenance & Repair (4 | 14.8%), and Farming, Fishing & Forestry (1 | 3.7%).
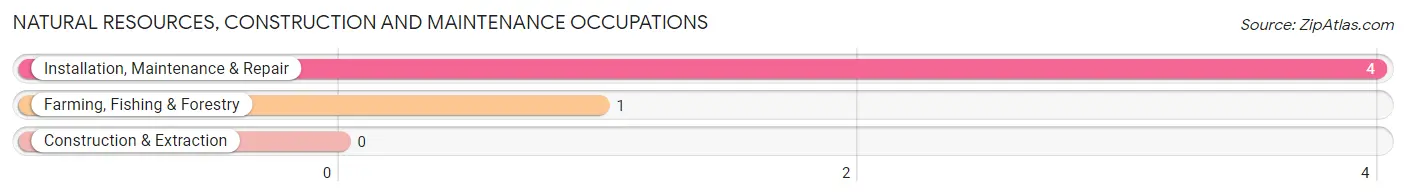
Natural Resources, Construction and Maintenance Occupations by Sex
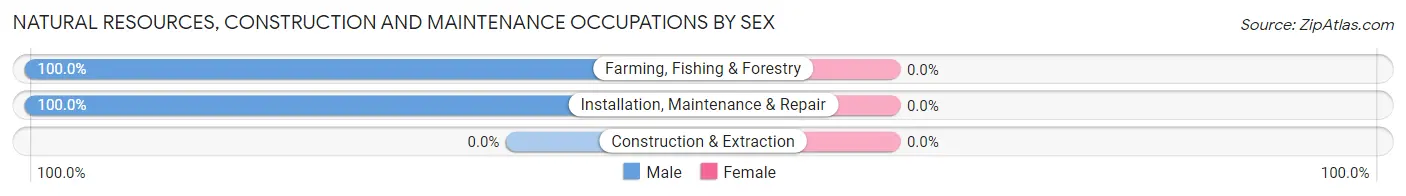
| Occupation | Male | Female |
| Farming, Fishing & Forestry | 1 (100.0%) | 0 (0.0%) |
| Construction & Extraction | 0 (0.0%) | 0 (0.0%) |
| Installation, Maintenance & Repair | 4 (100.0%) | 0 (0.0%) |
| Total (Category) | 5 (100.0%) | 0 (0.0%) |
| Total (Overall) | 13 (48.1%) | 14 (51.8%) |
Production, Transportation and Moving Occupations
The most common Production, Transportation and Moving occupations in Speed are Material Moving (7 | 25.9%), and Production (3 | 11.1%).
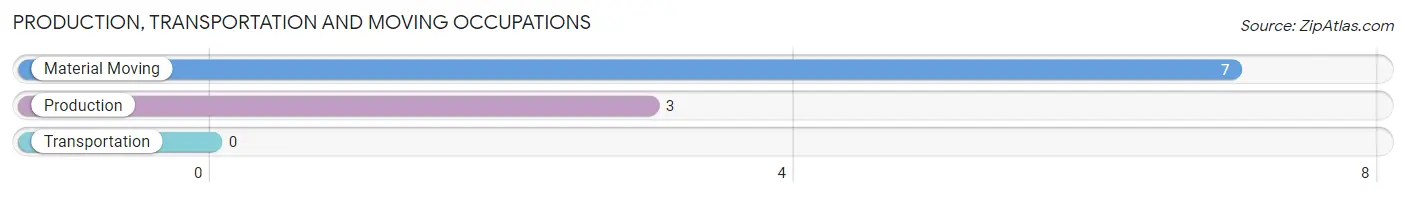
Production, Transportation and Moving Occupations by Sex
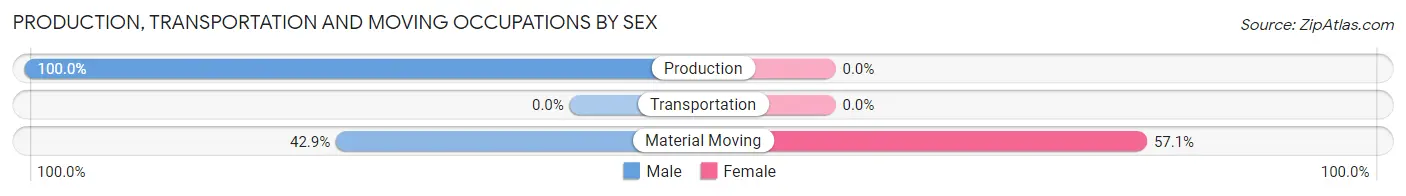
| Occupation | Male | Female |
| Production | 3 (100.0%) | 0 (0.0%) |
| Transportation | 0 (0.0%) | 0 (0.0%) |
| Material Moving | 3 (42.9%) | 4 (57.1%) |
| Total (Category) | 6 (60.0%) | 4 (40.0%) |
| Total (Overall) | 13 (48.1%) | 14 (51.8%) |
Employment Industries by Sex in Speed
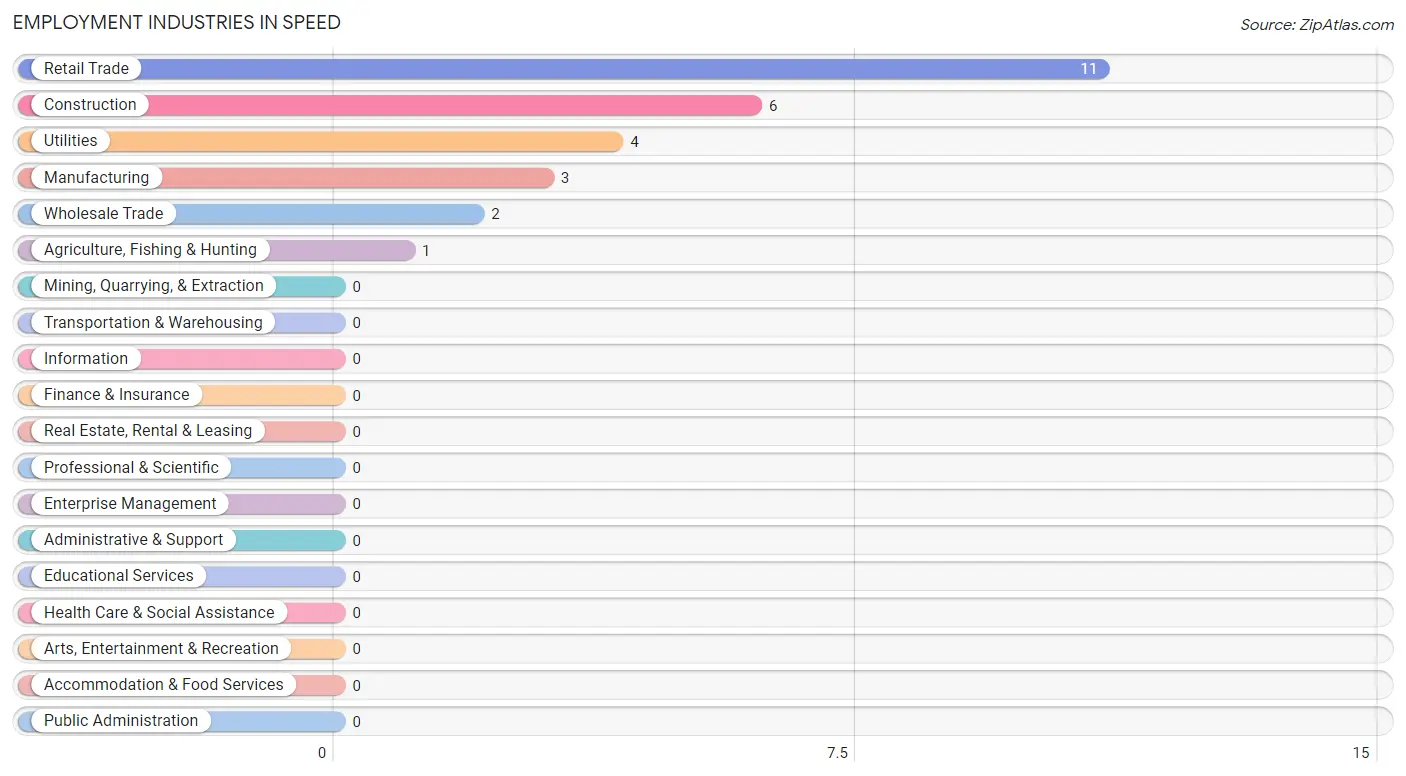
Employment Industries in Speed
The major employment industries in Speed include Retail Trade (11 | 40.7%), Construction (6 | 22.2%), Utilities (4 | 14.8%), Manufacturing (3 | 11.1%), and Wholesale Trade (2 | 7.4%).
Employment Industries by Sex in Speed
The Speed industries that see more men than women are Agriculture, Fishing & Hunting (100.0%), Manufacturing (100.0%), and Wholesale Trade (100.0%), whereas the industries that tend to have a higher number of women are Retail Trade (100.0%), and Construction (50.0%).
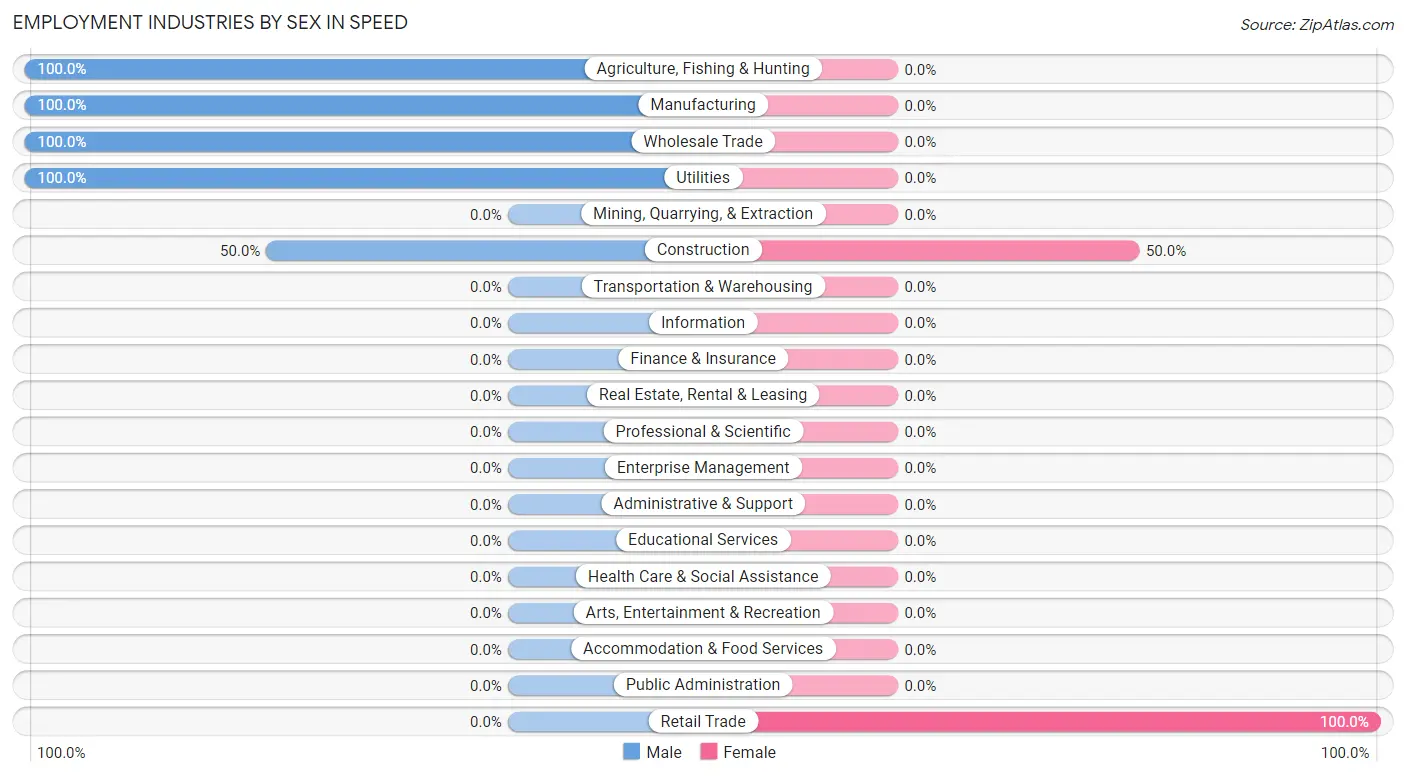
| Industry | Male | Female |
| Agriculture, Fishing & Hunting | 1 (100.0%) | 0 (0.0%) |
| Mining, Quarrying, & Extraction | 0 (0.0%) | 0 (0.0%) |
| Construction | 3 (50.0%) | 3 (50.0%) |
| Manufacturing | 3 (100.0%) | 0 (0.0%) |
| Wholesale Trade | 2 (100.0%) | 0 (0.0%) |
| Retail Trade | 0 (0.0%) | 11 (100.0%) |
| Transportation & Warehousing | 0 (0.0%) | 0 (0.0%) |
| Utilities | 4 (100.0%) | 0 (0.0%) |
| Information | 0 (0.0%) | 0 (0.0%) |
| Finance & Insurance | 0 (0.0%) | 0 (0.0%) |
| Real Estate, Rental & Leasing | 0 (0.0%) | 0 (0.0%) |
| Professional & Scientific | 0 (0.0%) | 0 (0.0%) |
| Enterprise Management | 0 (0.0%) | 0 (0.0%) |
| Administrative & Support | 0 (0.0%) | 0 (0.0%) |
| Educational Services | 0 (0.0%) | 0 (0.0%) |
| Health Care & Social Assistance | 0 (0.0%) | 0 (0.0%) |
| Arts, Entertainment & Recreation | 0 (0.0%) | 0 (0.0%) |
| Accommodation & Food Services | 0 (0.0%) | 0 (0.0%) |
| Public Administration | 0 (0.0%) | 0 (0.0%) |
| Total | 13 (48.1%) | 14 (51.8%) |
Education in Speed
School Enrollment in Speed
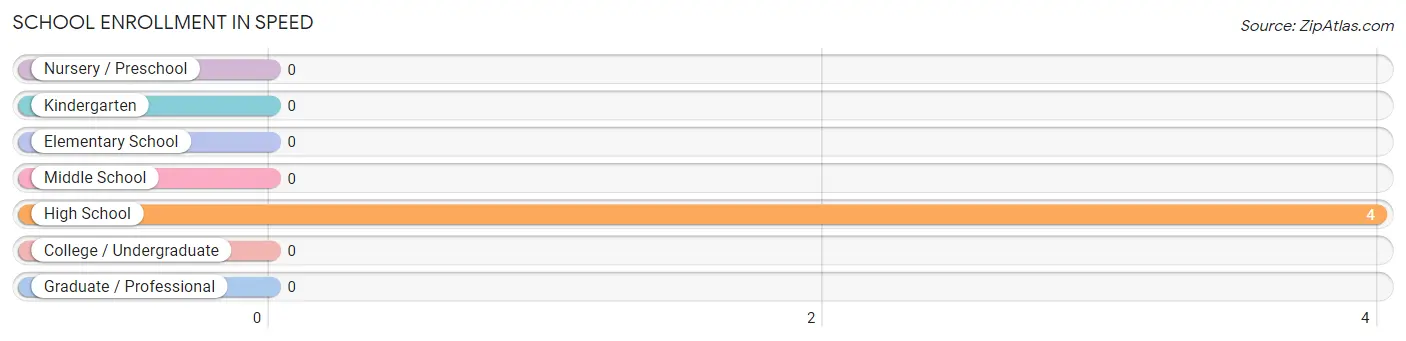
| School Level | # Students | % Students |
| Nursery / Preschool | 0 | 0.0% |
| Kindergarten | 0 | 0.0% |
| Elementary School | 0 | 0.0% |
| Middle School | 0 | 0.0% |
| High School | 4 | 100.0% |
| College / Undergraduate | 0 | 0.0% |
| Graduate / Professional | 0 | 0.0% |
| Total | 4 | 100.0% |
School Enrollment by Age by Funding Source in Speed
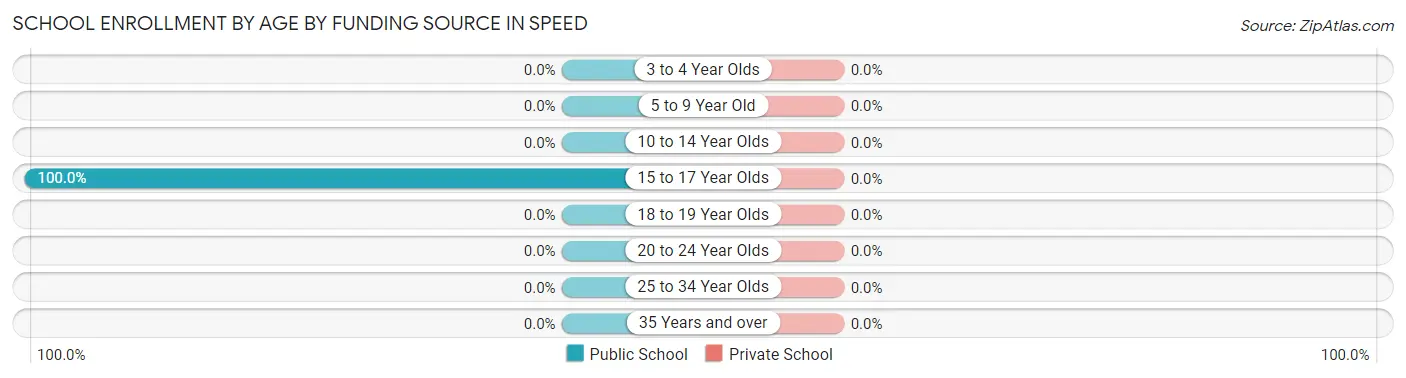
| Age Bracket | Public School | Private School |
| 3 to 4 Year Olds | 0 (0.0%) | 0 (0.0%) |
| 5 to 9 Year Old | 0 (0.0%) | 0 (0.0%) |
| 10 to 14 Year Olds | 0 (0.0%) | 0 (0.0%) |
| 15 to 17 Year Olds | 4 (100.0%) | 0 (0.0%) |
| 18 to 19 Year Olds | 0 (0.0%) | 0 (0.0%) |
| 20 to 24 Year Olds | 0 (0.0%) | 0 (0.0%) |
| 25 to 34 Year Olds | 0 (0.0%) | 0 (0.0%) |
| 35 Years and over | 0 (0.0%) | 0 (0.0%) |
| Total | 4 (100.0%) | 0 (0.0%) |
Educational Attainment by Field of Study in Speed
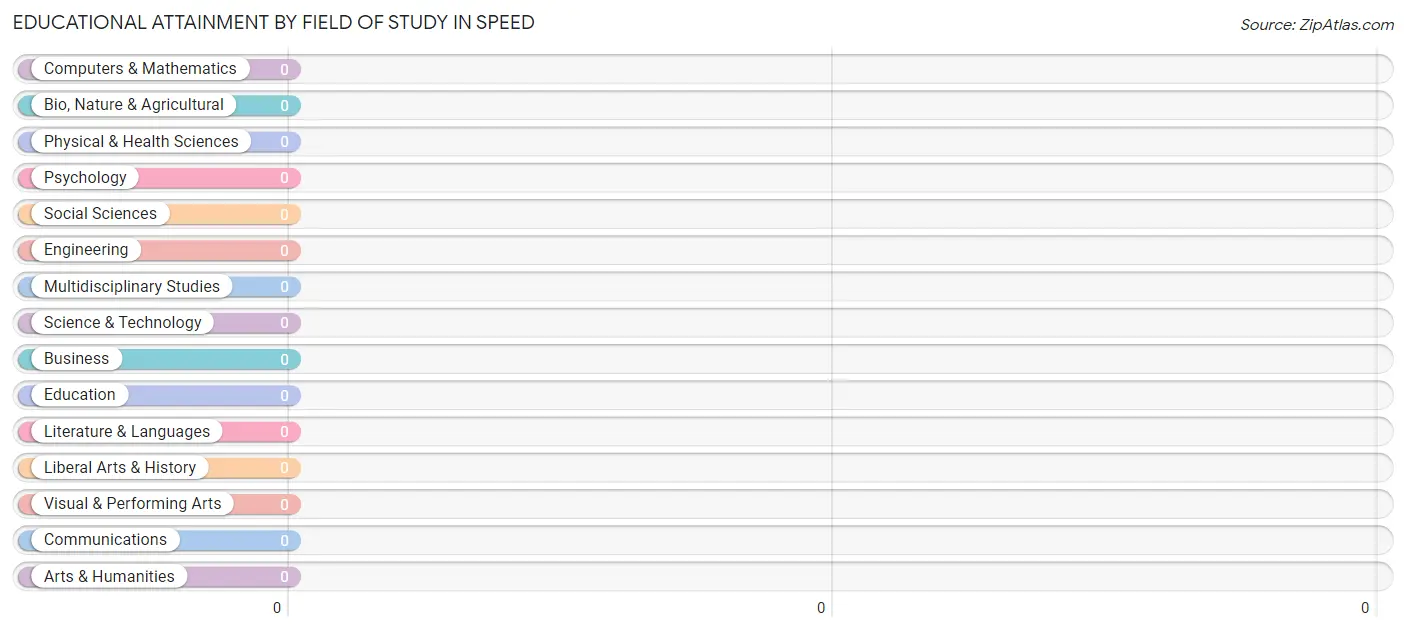
| Field of Study | # Graduates | % Graduates |
| Computers & Mathematics | 0 | 0.0% |
| Bio, Nature & Agricultural | 0 | 0.0% |
| Physical & Health Sciences | 0 | 0.0% |
| Psychology | 0 | 0.0% |
| Social Sciences | 0 | 0.0% |
| Engineering | 0 | 0.0% |
| Multidisciplinary Studies | 0 | 0.0% |
| Science & Technology | 0 | 0.0% |
| Business | 0 | 0.0% |
| Education | 0 | 0.0% |
| Literature & Languages | 0 | 0.0% |
| Liberal Arts & History | 0 | 0.0% |
| Visual & Performing Arts | 0 | 0.0% |
| Communications | 0 | 0.0% |
| Arts & Humanities | 0 | 0.0% |
| Total | 0 | 0.0% |
Transportation & Commute in Speed
Vehicle Availability by Sex in Speed
The most prevalent vehicle ownership categories in Speed are males with 2 vehicles (5, accounting for 45.5%) and females with 2 vehicles (4, making up 35.7%).
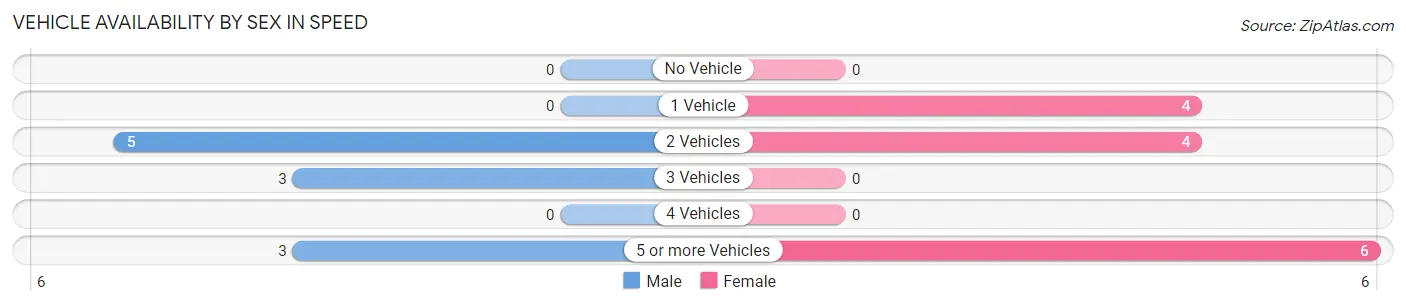
| Vehicles Available | Male | Female |
| No Vehicle | 0 (0.0%) | 0 (0.0%) |
| 1 Vehicle | 0 (0.0%) | 4 (28.6%) |
| 2 Vehicles | 5 (45.5%) | 4 (28.6%) |
| 3 Vehicles | 3 (27.3%) | 0 (0.0%) |
| 4 Vehicles | 0 (0.0%) | 0 (0.0%) |
| 5 or more Vehicles | 3 (27.3%) | 6 (42.9%) |
| Total | 11 (100.0%) | 14 (100.0%) |
Commute Time in Speed
The most frequently occuring commute durations in Speed are 15 to 19 minutes (18 commuters, 72.0%), 25 to 29 minutes (4 commuters, 16.0%), and 45 to 59 minutes (3 commuters, 12.0%).
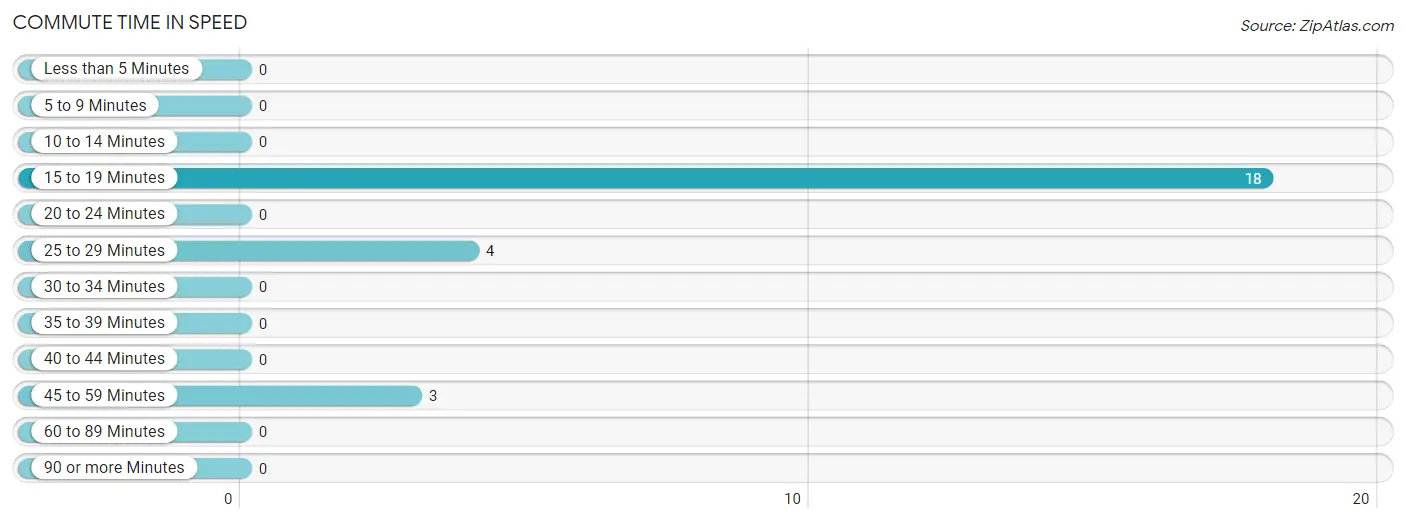
| Commute Time | # Commuters | % Commuters |
| Less than 5 Minutes | 0 | 0.0% |
| 5 to 9 Minutes | 0 | 0.0% |
| 10 to 14 Minutes | 0 | 0.0% |
| 15 to 19 Minutes | 18 | 72.0% |
| 20 to 24 Minutes | 0 | 0.0% |
| 25 to 29 Minutes | 4 | 16.0% |
| 30 to 34 Minutes | 0 | 0.0% |
| 35 to 39 Minutes | 0 | 0.0% |
| 40 to 44 Minutes | 0 | 0.0% |
| 45 to 59 Minutes | 3 | 12.0% |
| 60 to 89 Minutes | 0 | 0.0% |
| 90 or more Minutes | 0 | 0.0% |
Commute Time by Sex in Speed
The most common commute times in Speed are 15 to 19 minutes (4 commuters, 36.4%) for males and 15 to 19 minutes (14 commuters, 100.0%) for females.
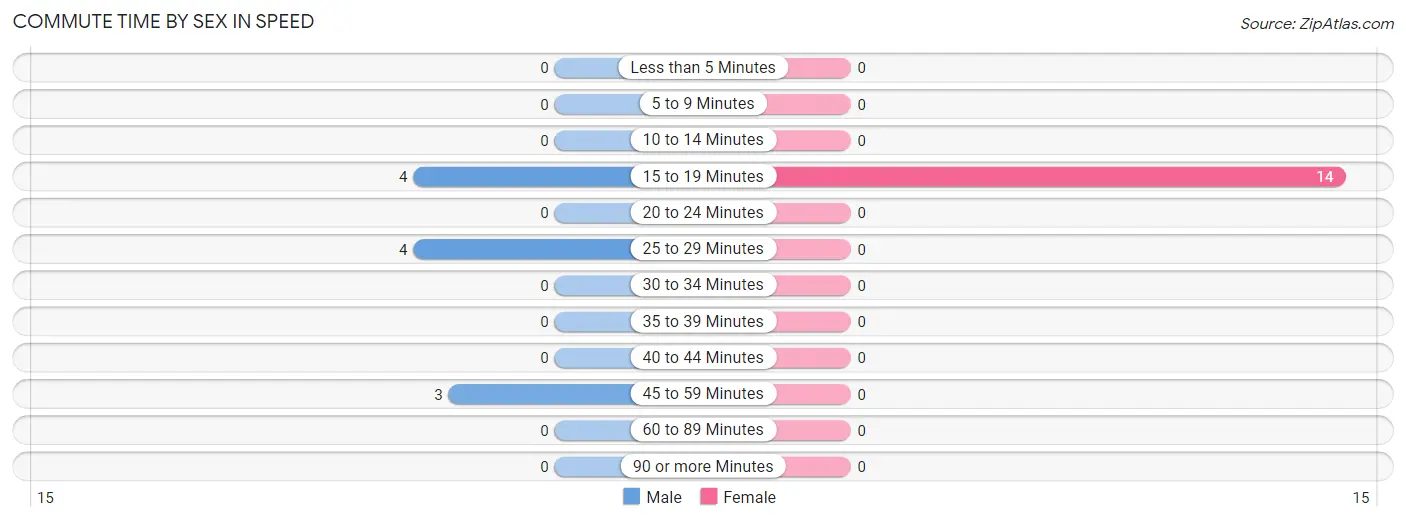
| Commute Time | Male | Female |
| Less than 5 Minutes | 0 (0.0%) | 0 (0.0%) |
| 5 to 9 Minutes | 0 (0.0%) | 0 (0.0%) |
| 10 to 14 Minutes | 0 (0.0%) | 0 (0.0%) |
| 15 to 19 Minutes | 4 (36.4%) | 14 (100.0%) |
| 20 to 24 Minutes | 0 (0.0%) | 0 (0.0%) |
| 25 to 29 Minutes | 4 (36.4%) | 0 (0.0%) |
| 30 to 34 Minutes | 0 (0.0%) | 0 (0.0%) |
| 35 to 39 Minutes | 0 (0.0%) | 0 (0.0%) |
| 40 to 44 Minutes | 0 (0.0%) | 0 (0.0%) |
| 45 to 59 Minutes | 3 (27.3%) | 0 (0.0%) |
| 60 to 89 Minutes | 0 (0.0%) | 0 (0.0%) |
| 90 or more Minutes | 0 (0.0%) | 0 (0.0%) |
Time of Departure to Work by Sex in Speed
The most frequent times of departure to work in Speed are 6:30 AM to 6:59 AM (4, 36.4%) for males and 7:30 AM to 7:59 AM (10, 71.4%) for females.
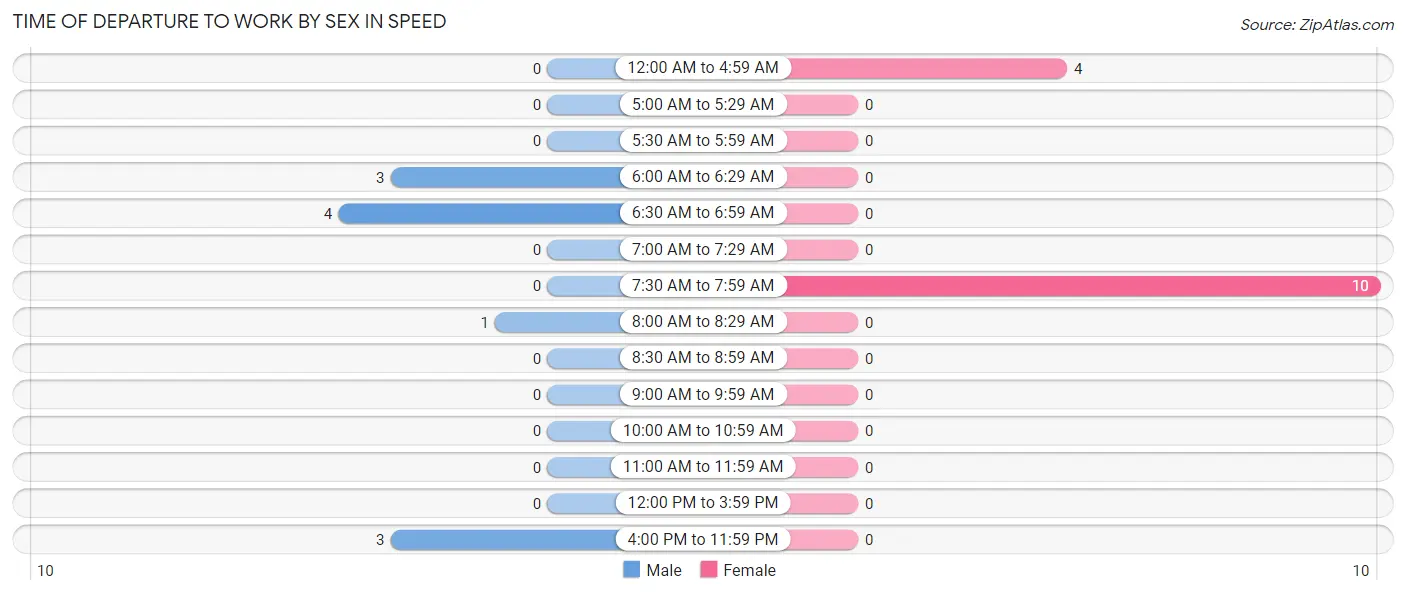
| Time of Departure | Male | Female |
| 12:00 AM to 4:59 AM | 0 (0.0%) | 4 (28.6%) |
| 5:00 AM to 5:29 AM | 0 (0.0%) | 0 (0.0%) |
| 5:30 AM to 5:59 AM | 0 (0.0%) | 0 (0.0%) |
| 6:00 AM to 6:29 AM | 3 (27.3%) | 0 (0.0%) |
| 6:30 AM to 6:59 AM | 4 (36.4%) | 0 (0.0%) |
| 7:00 AM to 7:29 AM | 0 (0.0%) | 0 (0.0%) |
| 7:30 AM to 7:59 AM | 0 (0.0%) | 10 (71.4%) |
| 8:00 AM to 8:29 AM | 1 (9.1%) | 0 (0.0%) |
| 8:30 AM to 8:59 AM | 0 (0.0%) | 0 (0.0%) |
| 9:00 AM to 9:59 AM | 0 (0.0%) | 0 (0.0%) |
| 10:00 AM to 10:59 AM | 0 (0.0%) | 0 (0.0%) |
| 11:00 AM to 11:59 AM | 0 (0.0%) | 0 (0.0%) |
| 12:00 PM to 3:59 PM | 0 (0.0%) | 0 (0.0%) |
| 4:00 PM to 11:59 PM | 3 (27.3%) | 0 (0.0%) |
| Total | 11 (100.0%) | 14 (100.0%) |
Housing Occupancy in Speed
Occupancy by Ownership in Speed
Of the total 29 dwellings in Speed, owner-occupied units account for 29 (100.0%), while renter-occupied units make up 0 (0.0%).
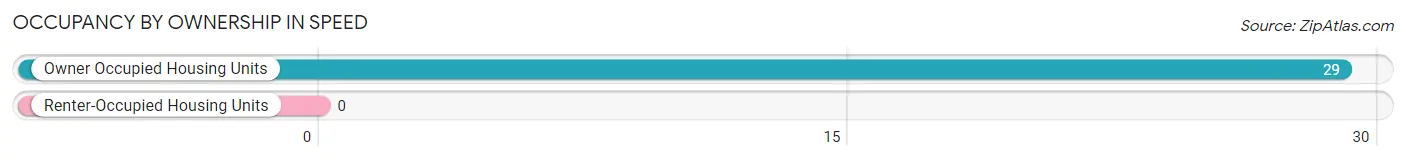
| Occupancy | # Housing Units | % Housing Units |
| Owner Occupied Housing Units | 29 | 100.0% |
| Renter-Occupied Housing Units | 0 | 0.0% |
| Total Occupied Housing Units | 29 | 100.0% |
Occupancy by Household Size in Speed
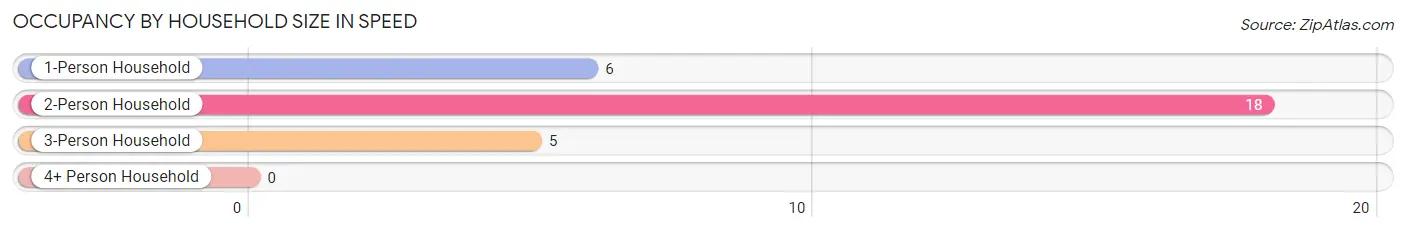
| Household Size | # Housing Units | % Housing Units |
| 1-Person Household | 6 | 20.7% |
| 2-Person Household | 18 | 62.1% |
| 3-Person Household | 5 | 17.2% |
| 4+ Person Household | 0 | 0.0% |
| Total Housing Units | 29 | 100.0% |
Occupancy by Ownership by Household Size in Speed
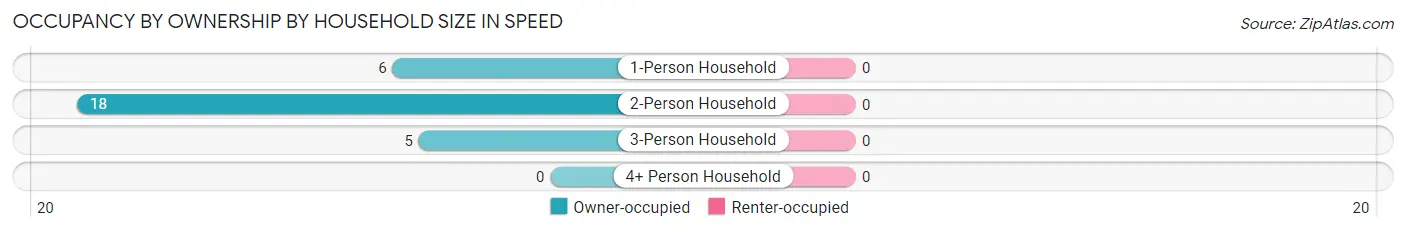
| Household Size | Owner-occupied | Renter-occupied |
| 1-Person Household | 6 (100.0%) | 0 (0.0%) |
| 2-Person Household | 18 (100.0%) | 0 (0.0%) |
| 3-Person Household | 5 (100.0%) | 0 (0.0%) |
| 4+ Person Household | 0 (0.0%) | 0 (0.0%) |
| Total Housing Units | 29 (100.0%) | 0 (0.0%) |
Occupancy by Educational Attainment in Speed
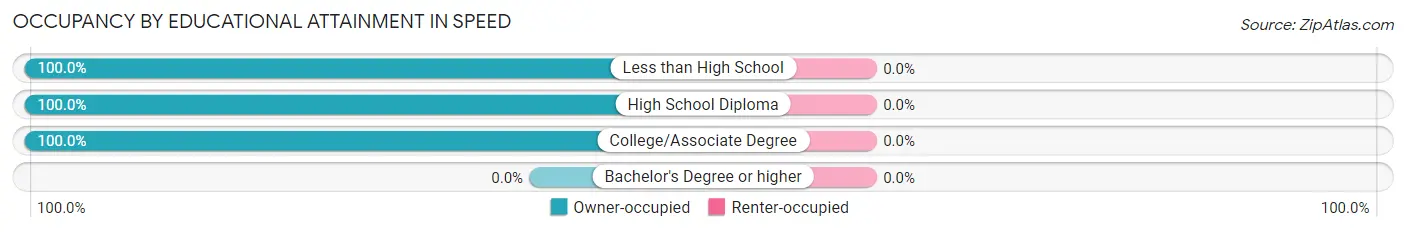
| Household Size | Owner-occupied | Renter-occupied |
| Less than High School | 4 (100.0%) | 0 (0.0%) |
| High School Diploma | 13 (100.0%) | 0 (0.0%) |
| College/Associate Degree | 12 (100.0%) | 0 (0.0%) |
| Bachelor's Degree or higher | 0 (0.0%) | 0 (0.0%) |
Occupancy by Age of Householder in Speed
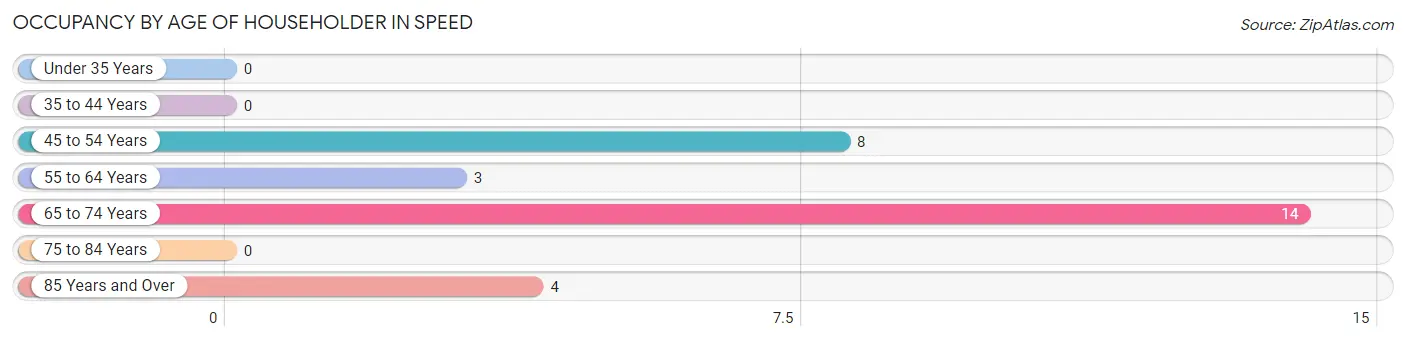
| Age Bracket | # Households | % Households |
| Under 35 Years | 0 | 0.0% |
| 35 to 44 Years | 0 | 0.0% |
| 45 to 54 Years | 8 | 27.6% |
| 55 to 64 Years | 3 | 10.3% |
| 65 to 74 Years | 14 | 48.3% |
| 75 to 84 Years | 0 | 0.0% |
| 85 Years and Over | 4 | 13.8% |
| Total | 29 | 100.0% |
Housing Finances in Speed
Median Income by Occupancy in Speed
| Occupancy Type | # Households | Median Income |
| Owner-Occupied | 29 (100.0%) | $0 |
| Renter-Occupied | 0 (0.0%) | $0 |
| Average | 29 (100.0%) | $0 |
Occupancy by Householder Income Bracket in Speed
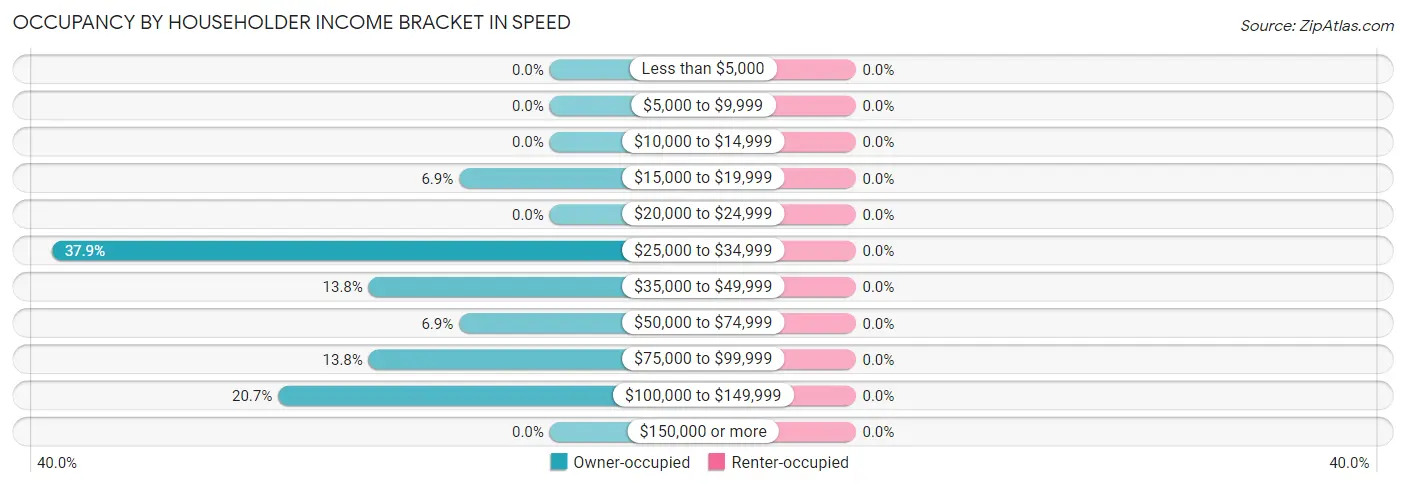
| Income Bracket | Owner-occupied | Renter-occupied |
| Less than $5,000 | 0 (0.0%) | 0 (0.0%) |
| $5,000 to $9,999 | 0 (0.0%) | 0 (0.0%) |
| $10,000 to $14,999 | 0 (0.0%) | 0 (0.0%) |
| $15,000 to $19,999 | 2 (6.9%) | 0 (0.0%) |
| $20,000 to $24,999 | 0 (0.0%) | 0 (0.0%) |
| $25,000 to $34,999 | 11 (37.9%) | 0 (0.0%) |
| $35,000 to $49,999 | 4 (13.8%) | 0 (0.0%) |
| $50,000 to $74,999 | 2 (6.9%) | 0 (0.0%) |
| $75,000 to $99,999 | 4 (13.8%) | 0 (0.0%) |
| $100,000 to $149,999 | 6 (20.7%) | 0 (0.0%) |
| $150,000 or more | 0 (0.0%) | 0 (0.0%) |
| Total | 29 (100.0%) | 0 (0.0%) |
Monthly Housing Cost Tiers in Speed
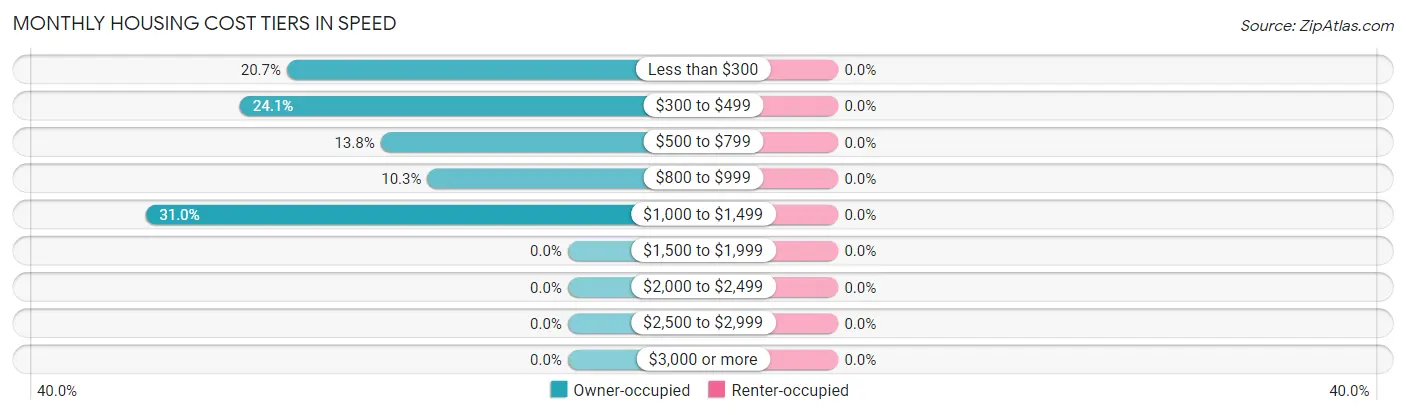
| Monthly Cost | Owner-occupied | Renter-occupied |
| Less than $300 | 6 (20.7%) | 0 (0.0%) |
| $300 to $499 | 7 (24.1%) | 0 (0.0%) |
| $500 to $799 | 4 (13.8%) | 0 (0.0%) |
| $800 to $999 | 3 (10.3%) | 0 (0.0%) |
| $1,000 to $1,499 | 9 (31.0%) | 0 (0.0%) |
| $1,500 to $1,999 | 0 (0.0%) | 0 (0.0%) |
| $2,000 to $2,499 | 0 (0.0%) | 0 (0.0%) |
| $2,500 to $2,999 | 0 (0.0%) | 0 (0.0%) |
| $3,000 or more | 0 (0.0%) | 0 (0.0%) |
| Total | 29 (100.0%) | 0 (0.0%) |
Physical Housing Characteristics in Speed
Housing Structures in Speed
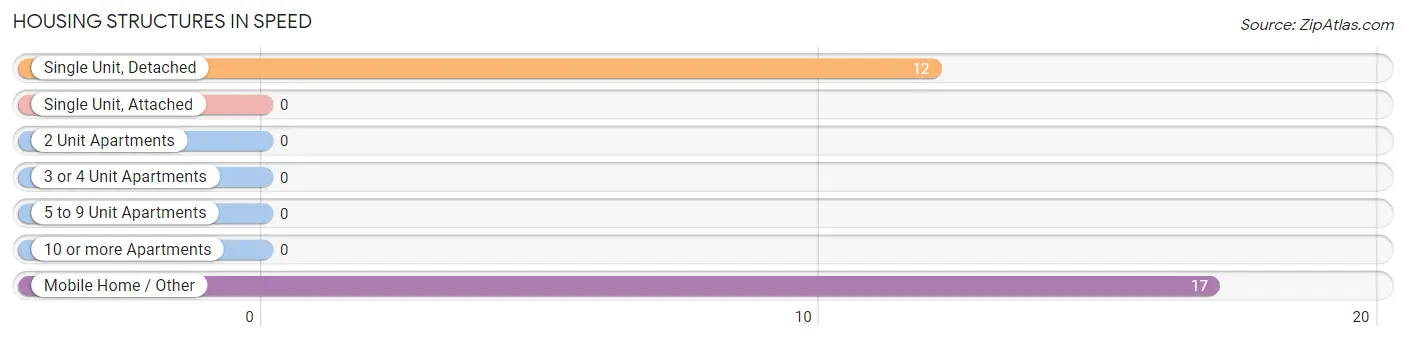
| Structure Type | # Housing Units | % Housing Units |
| Single Unit, Detached | 12 | 41.4% |
| Single Unit, Attached | 0 | 0.0% |
| 2 Unit Apartments | 0 | 0.0% |
| 3 or 4 Unit Apartments | 0 | 0.0% |
| 5 to 9 Unit Apartments | 0 | 0.0% |
| 10 or more Apartments | 0 | 0.0% |
| Mobile Home / Other | 17 | 58.6% |
| Total | 29 | 100.0% |
Housing Structures by Occupancy in Speed
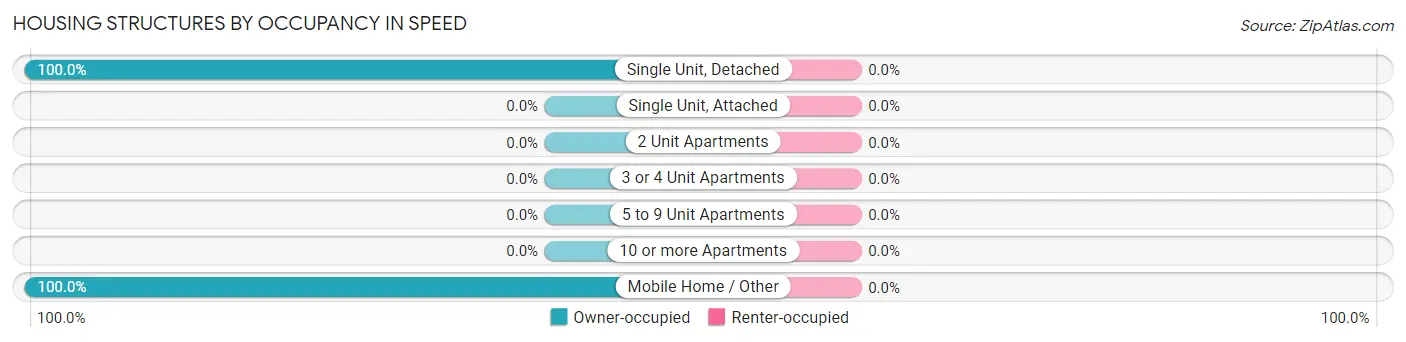
| Structure Type | Owner-occupied | Renter-occupied |
| Single Unit, Detached | 12 (100.0%) | 0 (0.0%) |
| Single Unit, Attached | 0 (0.0%) | 0 (0.0%) |
| 2 Unit Apartments | 0 (0.0%) | 0 (0.0%) |
| 3 or 4 Unit Apartments | 0 (0.0%) | 0 (0.0%) |
| 5 to 9 Unit Apartments | 0 (0.0%) | 0 (0.0%) |
| 10 or more Apartments | 0 (0.0%) | 0 (0.0%) |
| Mobile Home / Other | 17 (100.0%) | 0 (0.0%) |
| Total | 29 (100.0%) | 0 (0.0%) |
Housing Structures by Number of Rooms in Speed
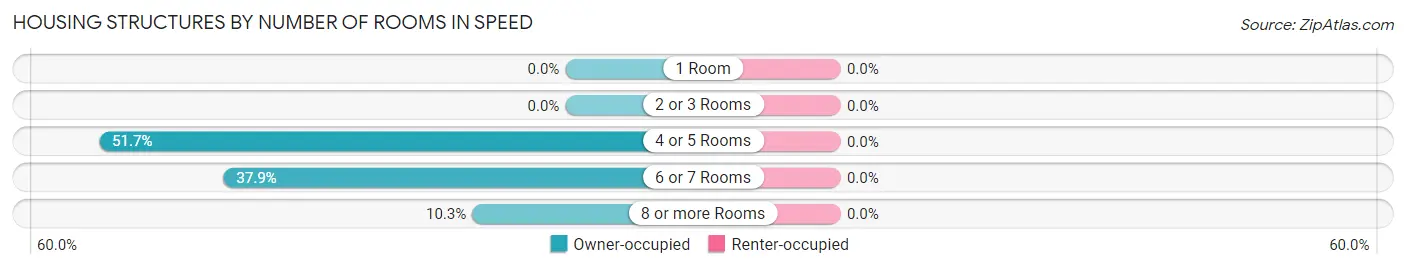
| Number of Rooms | Owner-occupied | Renter-occupied |
| 1 Room | 0 (0.0%) | 0 (0.0%) |
| 2 or 3 Rooms | 0 (0.0%) | 0 (0.0%) |
| 4 or 5 Rooms | 15 (51.7%) | 0 (0.0%) |
| 6 or 7 Rooms | 11 (37.9%) | 0 (0.0%) |
| 8 or more Rooms | 3 (10.3%) | 0 (0.0%) |
| Total | 29 (100.0%) | 0 (0.0%) |
Housing Structure by Heating Type in Speed
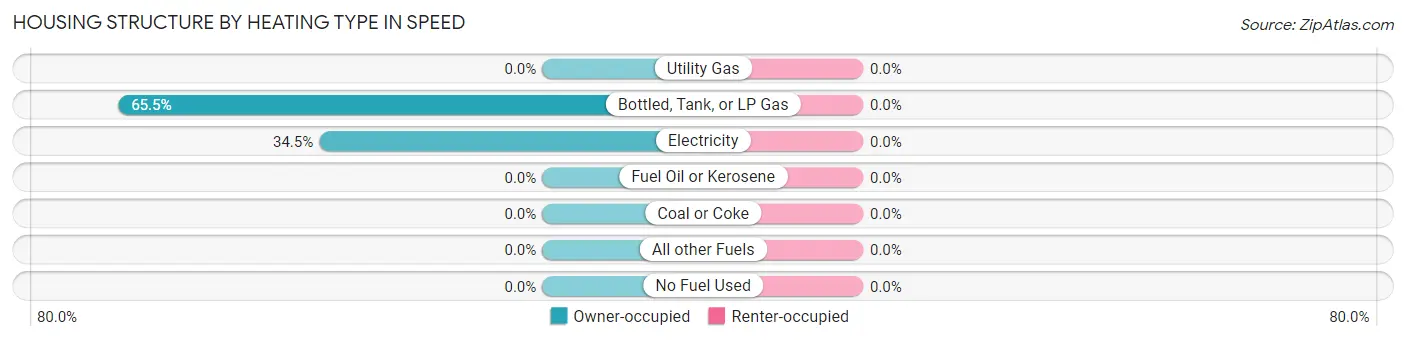
| Heating Type | Owner-occupied | Renter-occupied |
| Utility Gas | 0 (0.0%) | 0 (0.0%) |
| Bottled, Tank, or LP Gas | 19 (65.5%) | 0 (0.0%) |
| Electricity | 10 (34.5%) | 0 (0.0%) |
| Fuel Oil or Kerosene | 0 (0.0%) | 0 (0.0%) |
| Coal or Coke | 0 (0.0%) | 0 (0.0%) |
| All other Fuels | 0 (0.0%) | 0 (0.0%) |
| No Fuel Used | 0 (0.0%) | 0 (0.0%) |
| Total | 29 (100.0%) | 0 (0.0%) |
Household Vehicle Usage in Speed
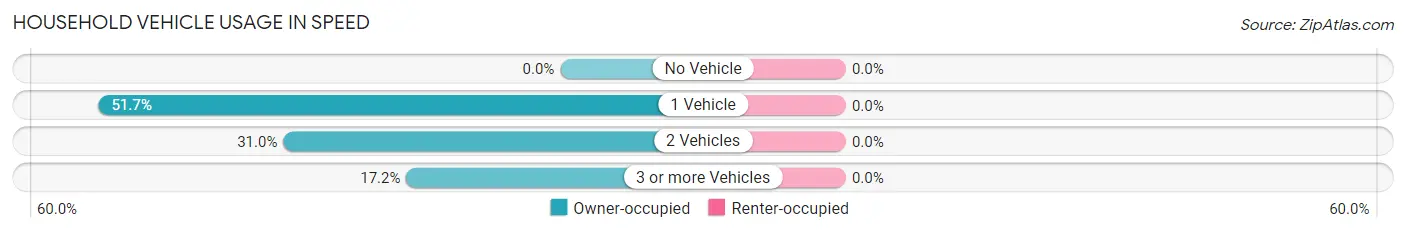
| Vehicles per Household | Owner-occupied | Renter-occupied |
| No Vehicle | 0 (0.0%) | 0 (0.0%) |
| 1 Vehicle | 15 (51.7%) | 0 (0.0%) |
| 2 Vehicles | 9 (31.0%) | 0 (0.0%) |
| 3 or more Vehicles | 5 (17.2%) | 0 (0.0%) |
| Total | 29 (100.0%) | 0 (0.0%) |
Real Estate & Mortgages in Speed
Real Estate and Mortgage Overview in Speed
| Characteristic | Without Mortgage | With Mortgage |
| Housing Units | 13 | 16 |
| Median Property Value | $31,900 | $75,600 |
| Median Household Income | $87,813 | $0 |
| Monthly Housing Costs | $355 | $0 |
| Real Estate Taxes | $290 | $0 |
Property Value by Mortgage Status in Speed
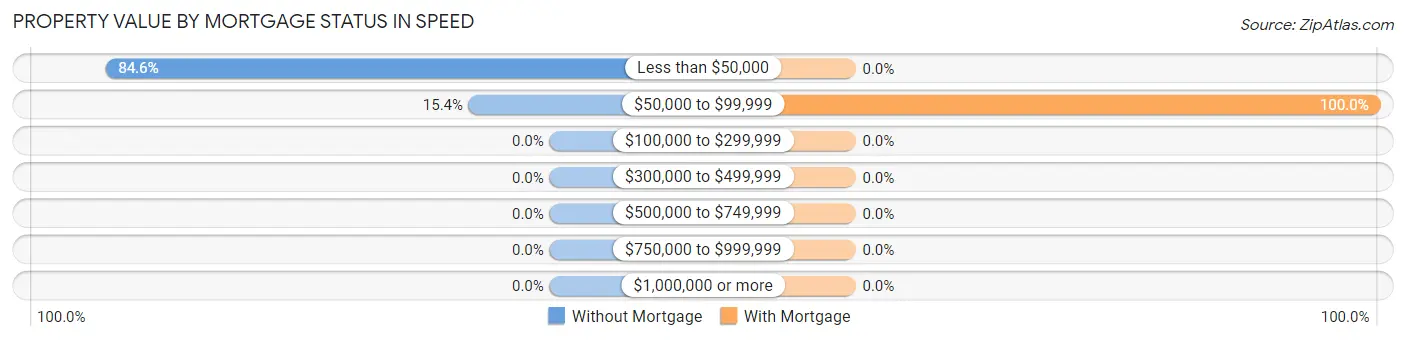
| Property Value | Without Mortgage | With Mortgage |
| Less than $50,000 | 11 (84.6%) | 0 (0.0%) |
| $50,000 to $99,999 | 2 (15.4%) | 16 (100.0%) |
| $100,000 to $299,999 | 0 (0.0%) | 0 (0.0%) |
| $300,000 to $499,999 | 0 (0.0%) | 0 (0.0%) |
| $500,000 to $749,999 | 0 (0.0%) | 0 (0.0%) |
| $750,000 to $999,999 | 0 (0.0%) | 0 (0.0%) |
| $1,000,000 or more | 0 (0.0%) | 0 (0.0%) |
| Total | 13 (100.0%) | 16 (100.0%) |
Household Income by Mortgage Status in Speed
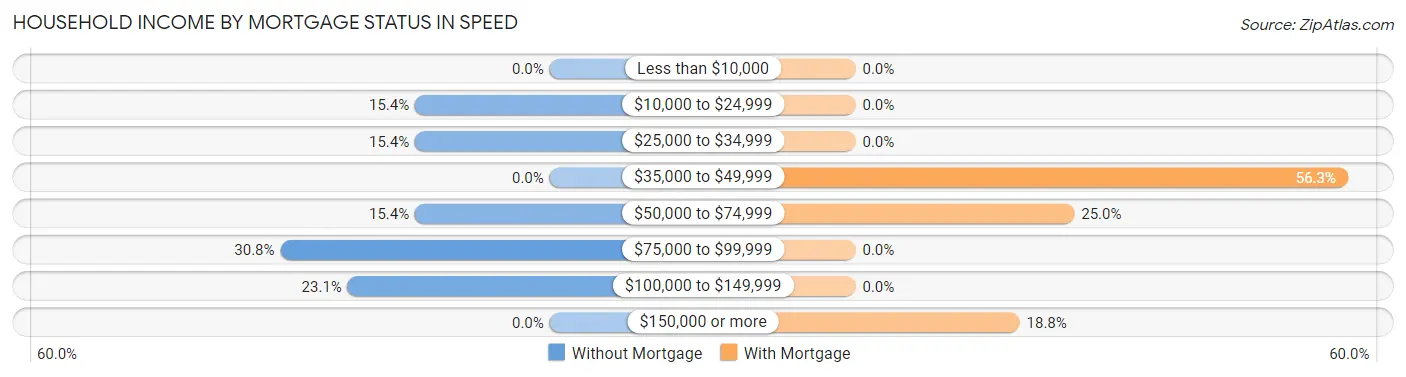
| Household Income | Without Mortgage | With Mortgage |
| Less than $10,000 | 0 (0.0%) | 0 (0.0%) |
| $10,000 to $24,999 | 2 (15.4%) | 0 (0.0%) |
| $25,000 to $34,999 | 2 (15.4%) | 0 (0.0%) |
| $35,000 to $49,999 | 0 (0.0%) | 9 (56.2%) |
| $50,000 to $74,999 | 2 (15.4%) | 4 (25.0%) |
| $75,000 to $99,999 | 4 (30.8%) | 0 (0.0%) |
| $100,000 to $149,999 | 3 (23.1%) | 0 (0.0%) |
| $150,000 or more | 0 (0.0%) | 3 (18.8%) |
| Total | 13 (100.0%) | 16 (100.0%) |
Property Value to Household Income Ratio in Speed
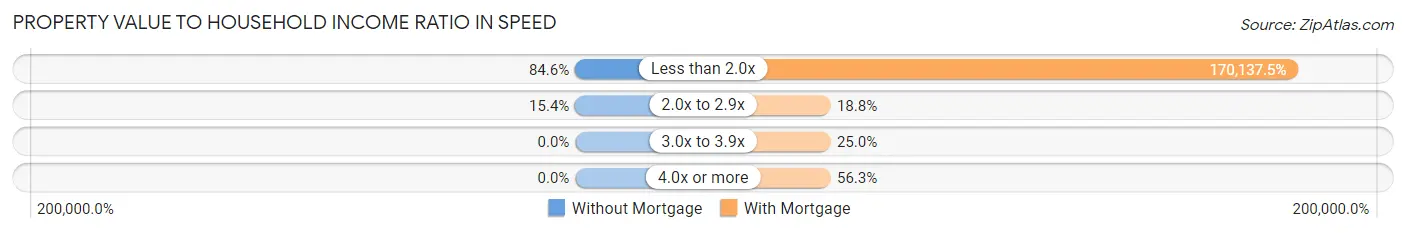
| Value-to-Income Ratio | Without Mortgage | With Mortgage |
| Less than 2.0x | 11 (84.6%) | 27,222 (170,137.5%) |
| 2.0x to 2.9x | 2 (15.4%) | 3 (18.8%) |
| 3.0x to 3.9x | 0 (0.0%) | 4 (25.0%) |
| 4.0x or more | 0 (0.0%) | 9 (56.2%) |
| Total | 13 (100.0%) | 16 (100.0%) |
Real Estate Taxes by Mortgage Status in Speed
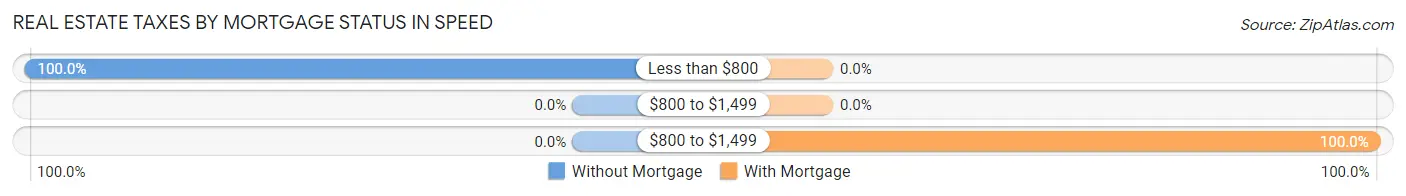
| Property Taxes | Without Mortgage | With Mortgage |
| Less than $800 | 13 (100.0%) | 0 (0.0%) |
| $800 to $1,499 | 0 (0.0%) | 0 (0.0%) |
| $800 to $1,499 | 0 (0.0%) | 16 (100.0%) |
| Total | 13 (100.0%) | 16 (100.0%) |
Health & Disability in Speed
Health Insurance Coverage by Age in Speed
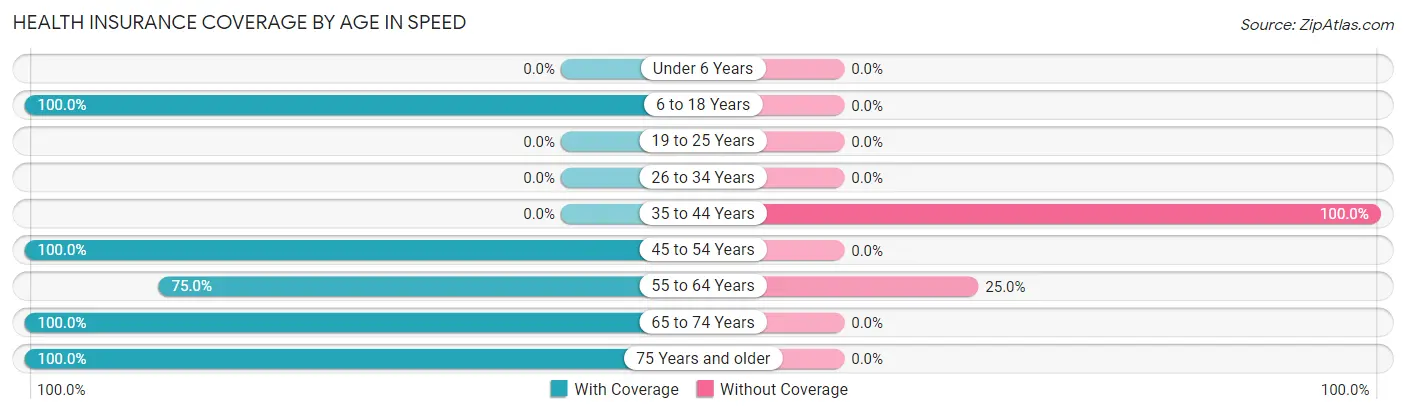
| Age Bracket | With Coverage | Without Coverage |
| Under 6 Years | 0 (0.0%) | 0 (0.0%) |
| 6 to 18 Years | 4 (100.0%) | 0 (0.0%) |
| 19 to 25 Years | 0 (0.0%) | 0 (0.0%) |
| 26 to 34 Years | 0 (0.0%) | 0 (0.0%) |
| 35 to 44 Years | 0 (0.0%) | 2 (100.0%) |
| 45 to 54 Years | 12 (100.0%) | 0 (0.0%) |
| 55 to 64 Years | 3 (75.0%) | 1 (25.0%) |
| 65 to 74 Years | 31 (100.0%) | 0 (0.0%) |
| 75 Years and older | 6 (100.0%) | 0 (0.0%) |
| Total | 56 (94.9%) | 3 (5.1%) |
Health Insurance Coverage by Citizenship Status in Speed
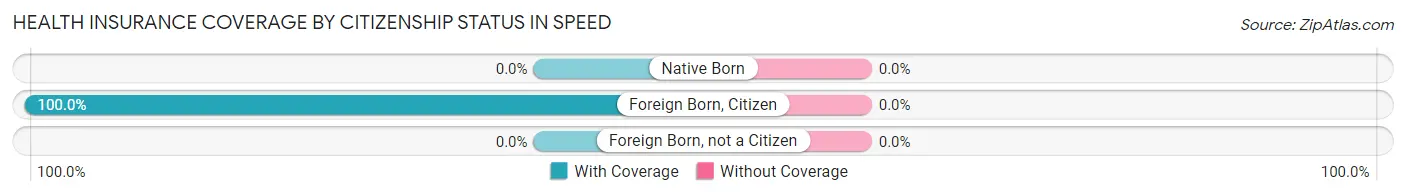
| Citizenship Status | With Coverage | Without Coverage |
| Native Born | 0 (0.0%) | 0 (0.0%) |
| Foreign Born, Citizen | 4 (100.0%) | 0 (0.0%) |
| Foreign Born, not a Citizen | 0 (0.0%) | 0 (0.0%) |
Health Insurance Coverage by Household Income in Speed
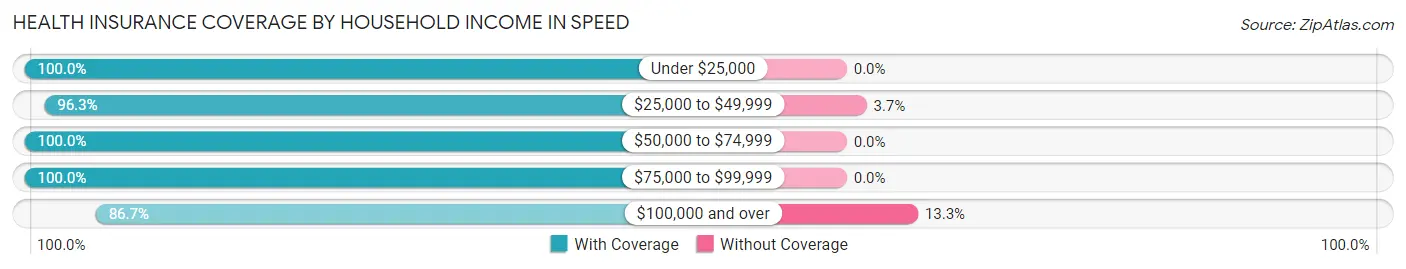
| Household Income | With Coverage | Without Coverage |
| Under $25,000 | 2 (100.0%) | 0 (0.0%) |
| $25,000 to $49,999 | 26 (96.3%) | 1 (3.7%) |
| $50,000 to $74,999 | 7 (100.0%) | 0 (0.0%) |
| $75,000 to $99,999 | 8 (100.0%) | 0 (0.0%) |
| $100,000 and over | 13 (86.7%) | 2 (13.3%) |
Public vs Private Health Insurance Coverage by Age in Speed
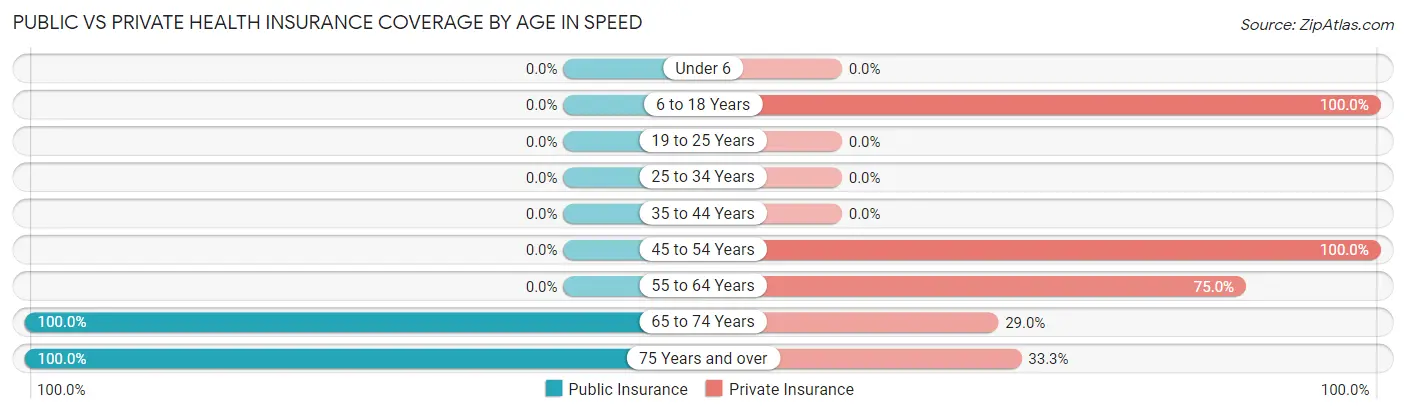
| Age Bracket | Public Insurance | Private Insurance |
| Under 6 | 0 (0.0%) | 0 (0.0%) |
| 6 to 18 Years | 0 (0.0%) | 4 (100.0%) |
| 19 to 25 Years | 0 (0.0%) | 0 (0.0%) |
| 25 to 34 Years | 0 (0.0%) | 0 (0.0%) |
| 35 to 44 Years | 0 (0.0%) | 0 (0.0%) |
| 45 to 54 Years | 0 (0.0%) | 12 (100.0%) |
| 55 to 64 Years | 0 (0.0%) | 3 (75.0%) |
| 65 to 74 Years | 31 (100.0%) | 9 (29.0%) |
| 75 Years and over | 6 (100.0%) | 2 (33.3%) |
| Total | 37 (62.7%) | 30 (50.8%) |
Disability Status by Sex by Age in Speed
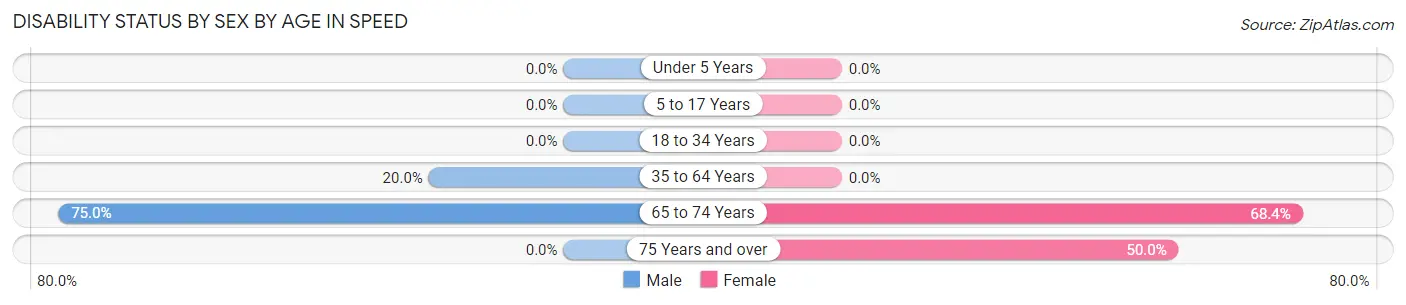
| Age Bracket | Male | Female |
| Under 5 Years | 0 (0.0%) | 0 (0.0%) |
| 5 to 17 Years | 0 (0.0%) | 0 (0.0%) |
| 18 to 34 Years | 0 (0.0%) | 0 (0.0%) |
| 35 to 64 Years | 2 (20.0%) | 0 (0.0%) |
| 65 to 74 Years | 9 (75.0%) | 13 (68.4%) |
| 75 Years and over | 0 (0.0%) | 2 (50.0%) |
Disability Class by Sex by Age in Speed
Disability Class: Hearing Difficulty
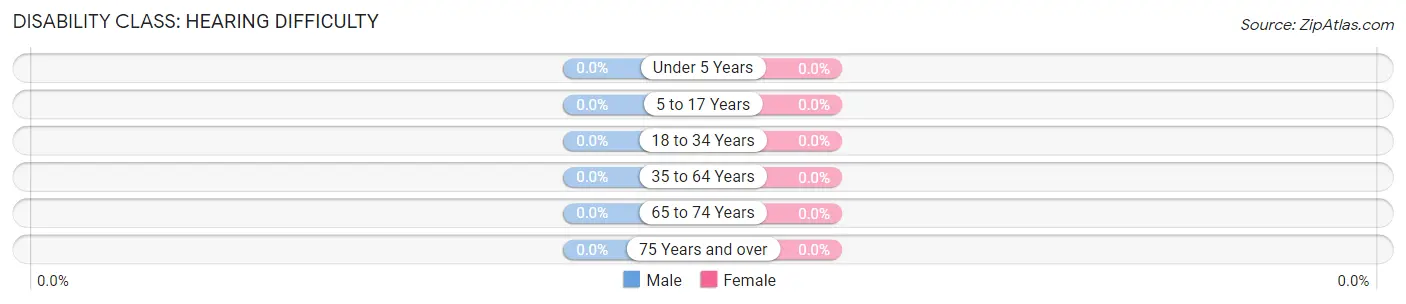
| Age Bracket | Male | Female |
| Under 5 Years | 0 (0.0%) | 0 (0.0%) |
| 5 to 17 Years | 0 (0.0%) | 0 (0.0%) |
| 18 to 34 Years | 0 (0.0%) | 0 (0.0%) |
| 35 to 64 Years | 0 (0.0%) | 0 (0.0%) |
| 65 to 74 Years | 0 (0.0%) | 0 (0.0%) |
| 75 Years and over | 0 (0.0%) | 0 (0.0%) |
Disability Class: Vision Difficulty
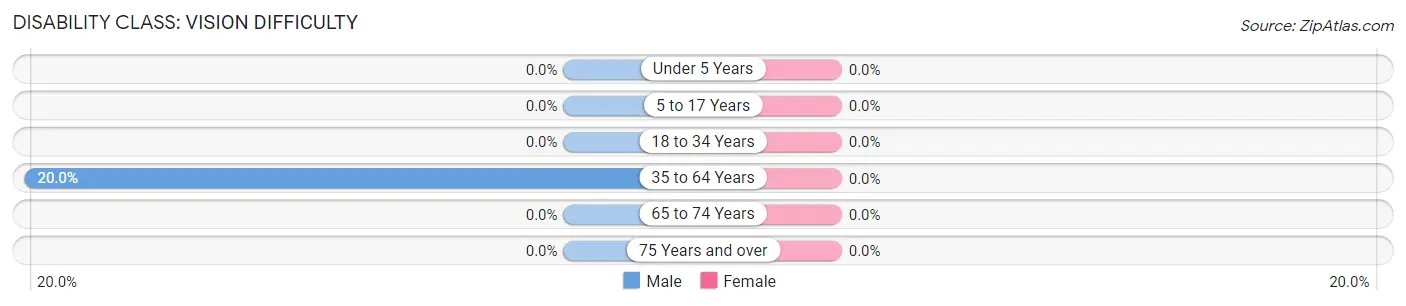
| Age Bracket | Male | Female |
| Under 5 Years | 0 (0.0%) | 0 (0.0%) |
| 5 to 17 Years | 0 (0.0%) | 0 (0.0%) |
| 18 to 34 Years | 0 (0.0%) | 0 (0.0%) |
| 35 to 64 Years | 2 (20.0%) | 0 (0.0%) |
| 65 to 74 Years | 0 (0.0%) | 0 (0.0%) |
| 75 Years and over | 0 (0.0%) | 0 (0.0%) |
Disability Class: Cognitive Difficulty
| Age Bracket | Male | Female |
| 5 to 17 Years | 0 (0.0%) | 0 (0.0%) |
| 18 to 34 Years | 0 (0.0%) | 0 (0.0%) |
| 35 to 64 Years | 0 (0.0%) | 0 (0.0%) |
| 65 to 74 Years | 0 (0.0%) | 0 (0.0%) |
| 75 Years and over | 0 (0.0%) | 0 (0.0%) |
Disability Class: Ambulatory Difficulty
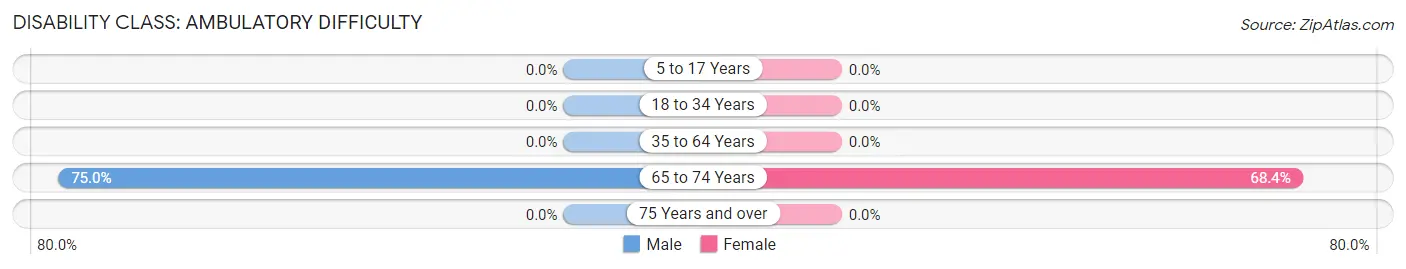
| Age Bracket | Male | Female |
| 5 to 17 Years | 0 (0.0%) | 0 (0.0%) |
| 18 to 34 Years | 0 (0.0%) | 0 (0.0%) |
| 35 to 64 Years | 0 (0.0%) | 0 (0.0%) |
| 65 to 74 Years | 9 (75.0%) | 13 (68.4%) |
| 75 Years and over | 0 (0.0%) | 0 (0.0%) |
Disability Class: Self-Care Difficulty
| Age Bracket | Male | Female |
| 5 to 17 Years | 0 (0.0%) | 0 (0.0%) |
| 18 to 34 Years | 0 (0.0%) | 0 (0.0%) |
| 35 to 64 Years | 0 (0.0%) | 0 (0.0%) |
| 65 to 74 Years | 0 (0.0%) | 0 (0.0%) |
| 75 Years and over | 0 (0.0%) | 0 (0.0%) |
Technology Access in Speed
Computing Device Access in Speed
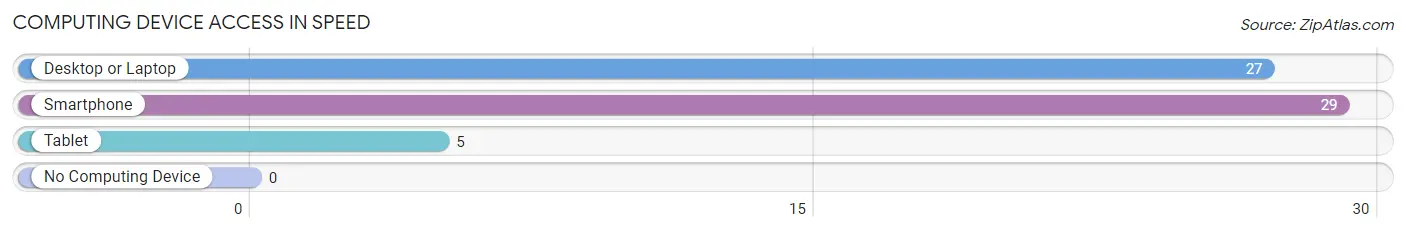
| Device Type | # Households | % Households |
| Desktop or Laptop | 27 | 93.1% |
| Smartphone | 29 | 100.0% |
| Tablet | 5 | 17.2% |
| No Computing Device | 0 | 0.0% |
| Total | 29 | 100.0% |
Internet Access in Speed
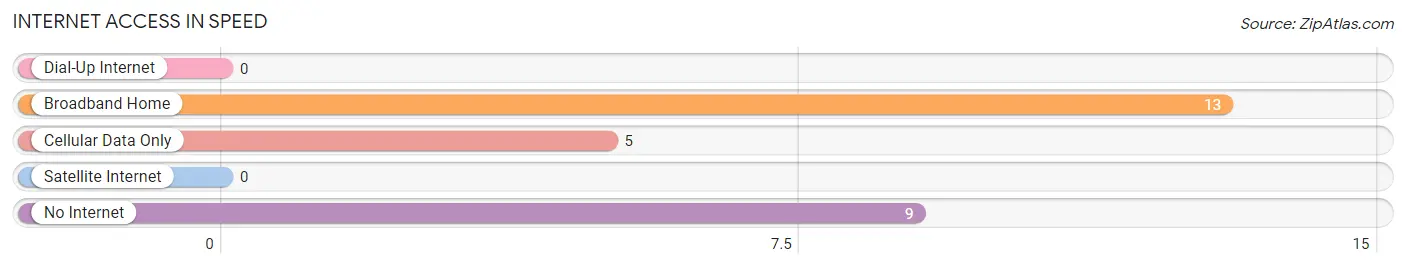
| Internet Type | # Households | % Households |
| Dial-Up Internet | 0 | 0.0% |
| Broadband Home | 13 | 44.8% |
| Cellular Data Only | 5 | 17.2% |
| Satellite Internet | 0 | 0.0% |
| No Internet | 9 | 31.0% |
| Total | 29 | 100.0% |
Speed Summary
North Carolina is a state located in the southeastern United States. It is bordered by South Carolina to the south, Georgia to the southwest, Tennessee to the west, Virginia to the north, and the Atlantic Ocean to the east. North Carolina is the 28th most populous state in the United States, with an estimated population of 10.4 million in 2019. The state is divided into 100 counties and contains five major metropolitan areas.
Geography
North Carolina is located in the southeastern United States, between South Carolina and Virginia. It is bordered by the Atlantic Ocean to the east, Tennessee to the west, and Georgia to the southwest. The state has a total area of 53,819 square miles, making it the 28th largest state in the country. North Carolina is divided into three distinct geographic regions: the Coastal Plain, the Piedmont, and the Appalachian Mountains.
The Coastal Plain is a flat, low-lying region that stretches along the Atlantic Ocean. It is home to the state’s largest cities, including Charlotte, Raleigh, and Wilmington. The Piedmont is a hilly region located in the central part of the state. It is home to the state capital, Raleigh, as well as other major cities such as Greensboro and Winston-Salem. The Appalachian Mountains are located in the western part of the state and are home to the Great Smoky Mountains National Park.
History
North Carolina was first inhabited by Native American tribes, including the Cherokee, Catawba, and Tuscarora. The first European settlers arrived in the late 16th century, and the area was eventually colonized by the English in the 17th century. North Carolina was one of the original 13 colonies and was the first state to declare independence from Britain in 1776.
The state was a major battleground during the American Revolution and the Civil War. After the Civil War, North Carolina experienced a period of economic growth and industrialization. The state was also a major center of the civil rights movement in the 1950s and 1960s.
Economy
North Carolina’s economy is largely driven by agriculture, manufacturing, and technology. The state is a major producer of tobacco, cotton, and other agricultural products. It is also home to a number of major manufacturing companies, including furniture, textiles, and electronics.
The state is also home to a number of major technology companies, including IBM, Cisco Systems, and Red Hat. North Carolina is also a major center for banking and finance, with Bank of America, Wells Fargo, and BB&T all having major operations in the state.
Demographics
North Carolina has an estimated population of 10.4 million, making it the 28th most populous state in the country. The state is racially diverse, with a population that is 63.5% white, 22.2% African American, 8.3% Hispanic or Latino, and 2.7% Asian. The state’s largest cities are Charlotte, Raleigh, Greensboro, Durham, and Winston-Salem.
North Carolina is also home to a number of major universities, including the University of North Carolina at Chapel Hill, Duke University, and North Carolina State University. The state is also home to a number of professional sports teams, including the Carolina Panthers (NFL), Charlotte Hornets (NBA), and Carolina Hurricanes (NHL).
Common Questions
What is Per Capita Income in Speed?
Per Capita income in Speed is $26,451.
What is Inequality or Gini Index in Speed?
Inequality or Gini Index in Speed is 0.35.
What is the Total Population of Speed?
Total Population of Speed is 59.
What is the Total Male Population of Speed?
Total Male Population of Speed is 28.
What is the Total Female Population of Speed?
Total Female Population of Speed is 31.
What is the Ratio of Males per 100 Females in Speed?
There are 90.32 Males per 100 Females in Speed.
What is the Ratio of Females per 100 Males in Speed?
There are 110.71 Females per 100 Males in Speed.
What is the Median Population Age in Speed?
Median Population Age in Speed is 67.1 Years.
What is the Average Family Size in Speed
Average Family Size in Speed is 2.0 People.
What is the Average Household Size in Speed
Average Household Size in Speed is 2.0 People.
How Large is the Labor Force in Speed?
There are 27 People in the Labor Forcein in Speed.
What is the Percentage of People in the Labor Force in Speed?
49.1% of People are in the Labor Force in Speed.