Welcome, NC Map & Demographics
Welcome Map
Welcome Overview
$29,741
PER CAPITA INCOME
$73,235
AVG FAMILY INCOME
$59,348
AVG HOUSEHOLD INCOME
20.2%
WAGE / INCOME GAP [ % ]
79.8¢/ $1
WAGE / INCOME GAP [ $ ]
0.41
INEQUALITY / GINI INDEX
3,444
TOTAL POPULATION
1,699
MALE POPULATION
1,745
FEMALE POPULATION
97.36
MALES / 100 FEMALES
102.71
FEMALES / 100 MALES
41.1
MEDIAN AGE
3.1
AVG FAMILY SIZE
2.6
AVG HOUSEHOLD SIZE
1,598
LABOR FORCE [ PEOPLE ]
57.6%
PERCENT IN LABOR FORCE
1.8%
UNEMPLOYMENT RATE
Welcome Zip Codes
Welcome Area Codes
Income in Welcome
Income Overview in Welcome
Per Capita Income in Welcome is $29,741, while median incomes of families and households are $73,235 and $59,348 respectively.
| Characteristic | Number | Measure |
| Per Capita Income | 3,444 | $29,741 |
| Median Family Income | 952 | $73,235 |
| Mean Family Income | 952 | $89,206 |
| Median Household Income | 1,300 | $59,348 |
| Mean Household Income | 1,300 | $76,147 |
| Income Deficit | 952 | $0 |
| Wage / Income Gap (%) | 3,444 | 20.19% |
| Wage / Income Gap ($) | 3,444 | 79.81¢ per $1 |
| Gini / Inequality Index | 3,444 | 0.41 |
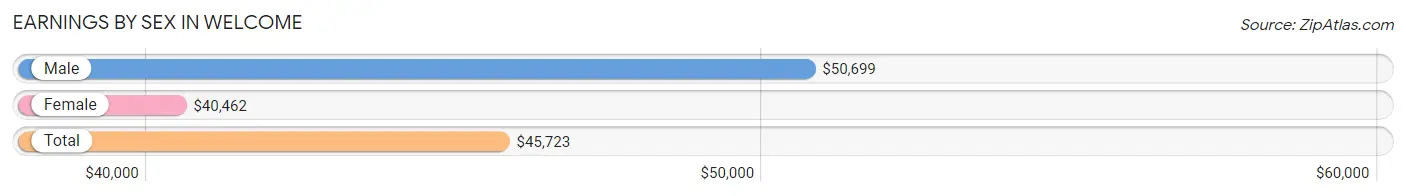
Earnings by Sex in Welcome
Average Earnings in Welcome are $45,723, $50,699 for men and $40,462 for women, a difference of 20.2%.
| Sex | Number | Average Earnings |
| Male | 907 (55.8%) | $50,699 |
| Female | 719 (44.2%) | $40,462 |
| Total | 1,626 (100.0%) | $45,723 |
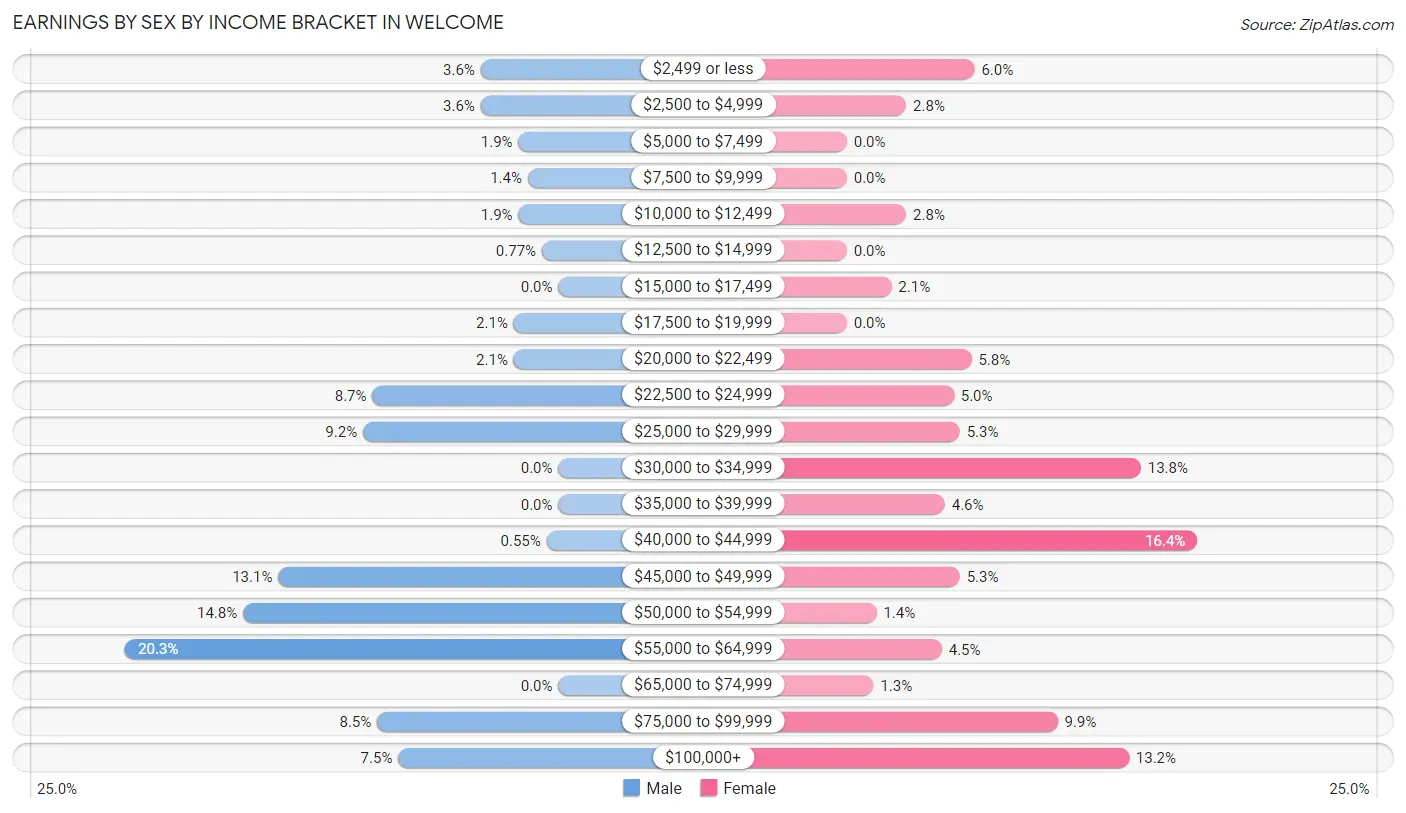
Earnings by Sex by Income Bracket in Welcome
The most common earnings brackets in Welcome are $55,000 to $64,999 for men (184 | 20.3%) and $40,000 to $44,999 for women (118 | 16.4%).
| Income | Male | Female |
| $2,499 or less | 33 (3.6%) | 43 (6.0%) |
| $2,500 to $4,999 | 33 (3.6%) | 20 (2.8%) |
| $5,000 to $7,499 | 17 (1.9%) | 0 (0.0%) |
| $7,500 to $9,999 | 13 (1.4%) | 0 (0.0%) |
| $10,000 to $12,499 | 17 (1.9%) | 20 (2.8%) |
| $12,500 to $14,999 | 7 (0.8%) | 0 (0.0%) |
| $15,000 to $17,499 | 0 (0.0%) | 15 (2.1%) |
| $17,500 to $19,999 | 19 (2.1%) | 0 (0.0%) |
| $20,000 to $22,499 | 19 (2.1%) | 42 (5.8%) |
| $22,500 to $24,999 | 79 (8.7%) | 36 (5.0%) |
| $25,000 to $29,999 | 83 (9.1%) | 38 (5.3%) |
| $30,000 to $34,999 | 0 (0.0%) | 99 (13.8%) |
| $35,000 to $39,999 | 0 (0.0%) | 33 (4.6%) |
| $40,000 to $44,999 | 5 (0.5%) | 118 (16.4%) |
| $45,000 to $49,999 | 119 (13.1%) | 38 (5.3%) |
| $50,000 to $54,999 | 134 (14.8%) | 10 (1.4%) |
| $55,000 to $64,999 | 184 (20.3%) | 32 (4.4%) |
| $65,000 to $74,999 | 0 (0.0%) | 9 (1.3%) |
| $75,000 to $99,999 | 77 (8.5%) | 71 (9.9%) |
| $100,000+ | 68 (7.5%) | 95 (13.2%) |
| Total | 907 (100.0%) | 719 (100.0%) |
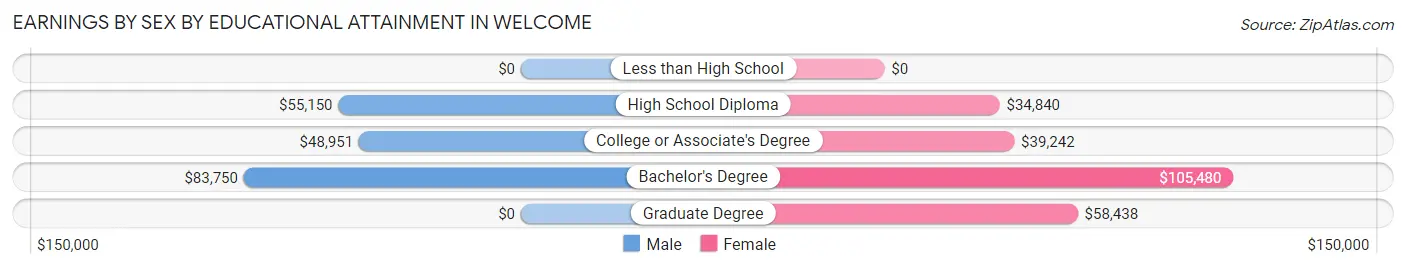
Earnings by Sex by Educational Attainment in Welcome
Average earnings in Welcome are $51,103 for men and $41,438 for women, a difference of 18.9%. Men with an educational attainment of bachelor's degree enjoy the highest average annual earnings of $83,750, while those with college or associate's degree education earn the least with $48,951. Women with an educational attainment of bachelor's degree earn the most with the average annual earnings of $105,480, while those with high school diploma education have the smallest earnings of $34,840.
| Educational Attainment | Male Income | Female Income |
| Less than High School | - | - |
| High School Diploma | $55,150 | $34,840 |
| College or Associate's Degree | $48,951 | $39,242 |
| Bachelor's Degree | $83,750 | $105,480 |
| Graduate Degree | - | - |
| Total | $51,103 | $41,438 |
Family Income in Welcome
Family Income Brackets in Welcome
According to the Welcome family income data, there are 224 families falling into the $50,000 to $74,999 income range, which is the most common income bracket and makes up 23.5% of all families. Conversely, the $35,000 to $49,999 income bracket is the least frequent group with only 10 families (1.1%) belonging to this category.
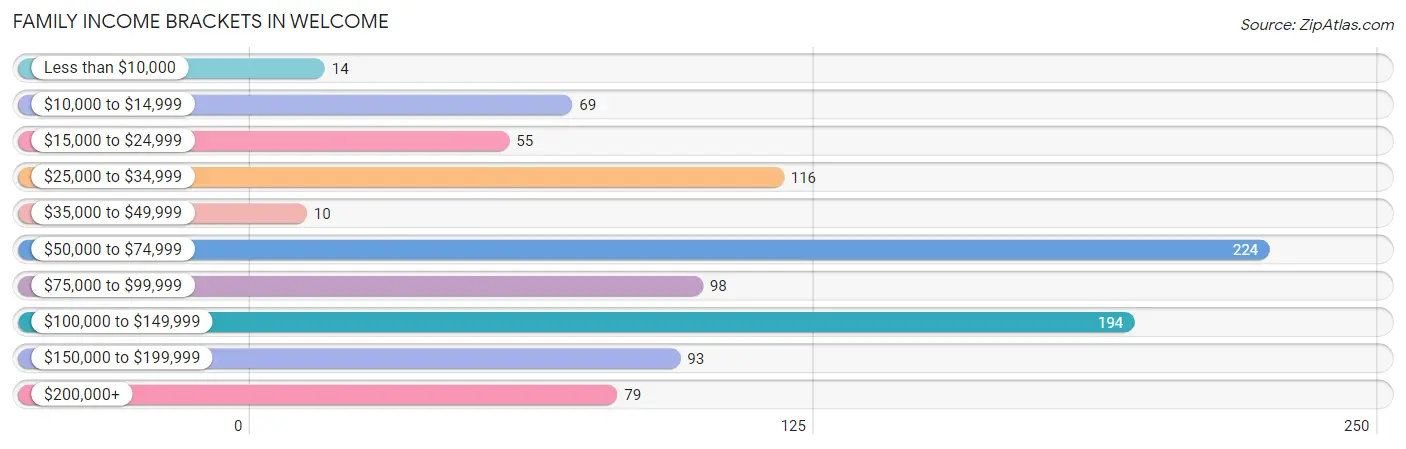
| Income Bracket | # Families | % Families |
| Less than $10,000 | 14 | 1.5% |
| $10,000 to $14,999 | 69 | 7.2% |
| $15,000 to $24,999 | 55 | 5.8% |
| $25,000 to $34,999 | 116 | 12.2% |
| $35,000 to $49,999 | 10 | 1.1% |
| $50,000 to $74,999 | 224 | 23.5% |
| $75,000 to $99,999 | 98 | 10.3% |
| $100,000 to $149,999 | 194 | 20.4% |
| $150,000 to $199,999 | 93 | 9.8% |
| $200,000+ | 79 | 8.3% |
Family Income by Famaliy Size in Welcome
4-person families (171 | 18.0%) account for the highest median family income in Welcome with $158,305 per family, while 4-person families (171 | 18.0%) have the highest median income of $39,576 per family member.
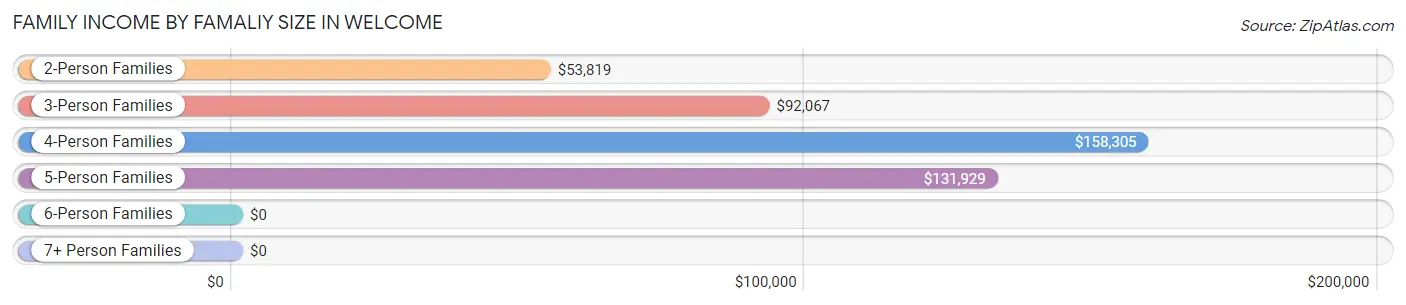
| Income Bracket | # Families | Median Income |
| 2-Person Families | 431 (45.3%) | $53,819 |
| 3-Person Families | 231 (24.3%) | $92,067 |
| 4-Person Families | 171 (18.0%) | $158,305 |
| 5-Person Families | 71 (7.5%) | $131,929 |
| 6-Person Families | 48 (5.0%) | $0 |
| 7+ Person Families | 0 (0.0%) | $0 |
| Total | 952 (100.0%) | $73,235 |
Family Income by Number of Earners in Welcome
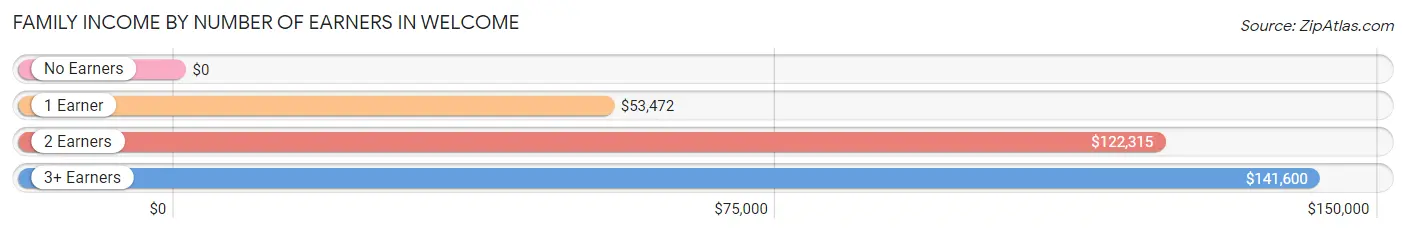
| Number of Earners | # Families | Median Income |
| No Earners | 241 (25.3%) | $0 |
| 1 Earner | 233 (24.5%) | $53,472 |
| 2 Earners | 402 (42.2%) | $122,315 |
| 3+ Earners | 76 (8.0%) | $141,600 |
| Total | 952 (100.0%) | $73,235 |
Household Income in Welcome
Household Income Brackets in Welcome
With 321 households falling in the category, the $50,000 to $74,999 income range is the most frequent in Welcome, accounting for 24.7% of all households. In contrast, only 31 households (2.4%) fall into the less than $10,000 income bracket, making it the least populous group.
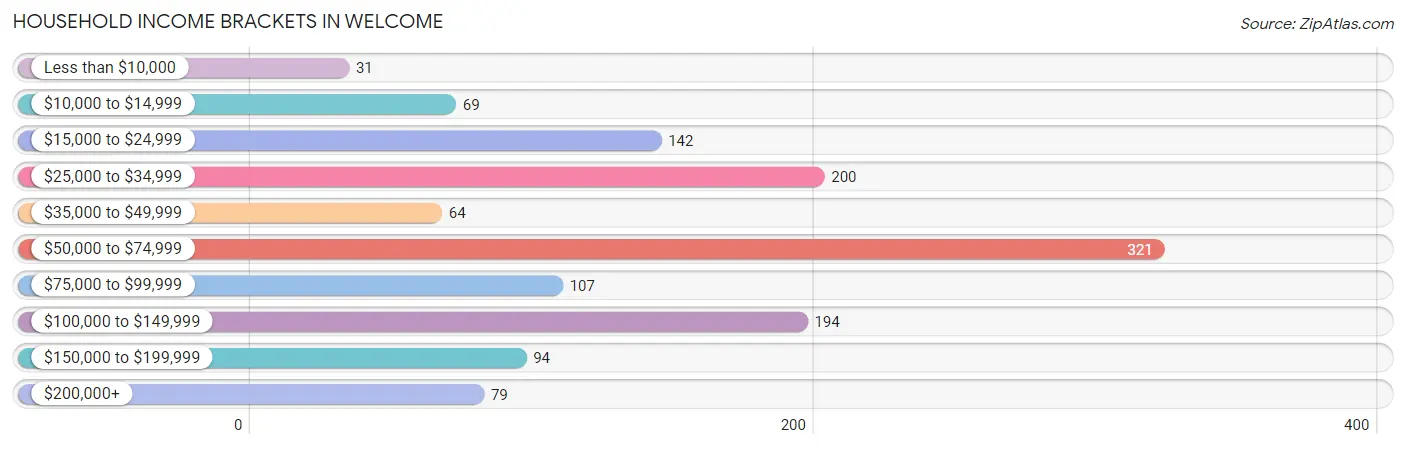
| Income Bracket | # Households | % Households |
| Less than $10,000 | 31 | 2.4% |
| $10,000 to $14,999 | 69 | 5.3% |
| $15,000 to $24,999 | 142 | 10.9% |
| $25,000 to $34,999 | 200 | 15.4% |
| $35,000 to $49,999 | 64 | 4.9% |
| $50,000 to $74,999 | 321 | 24.7% |
| $75,000 to $99,999 | 107 | 8.2% |
| $100,000 to $149,999 | 194 | 14.9% |
| $150,000 to $199,999 | 94 | 7.2% |
| $200,000+ | 79 | 6.1% |
Household Income by Householder Age in Welcome
The median household income in Welcome is $59,348, with the highest median household income of $68,258 found in the 25 to 44 years age bracket for the primary householder. A total of 450 households (34.6%) fall into this category. Meanwhile, the 15 to 24 years age bracket for the primary householder has the lowest median household income of $0, with 7 households (0.5%) in this group.
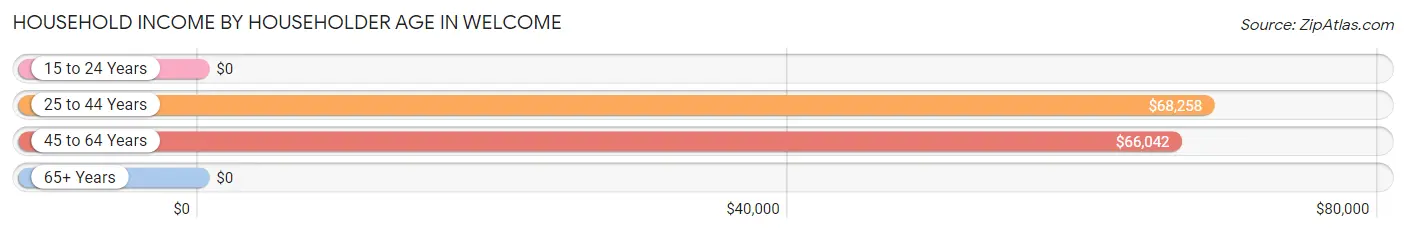
| Income Bracket | # Households | Median Income |
| 15 to 24 Years | 7 (0.5%) | $0 |
| 25 to 44 Years | 450 (34.6%) | $68,258 |
| 45 to 64 Years | 537 (41.3%) | $66,042 |
| 65+ Years | 306 (23.5%) | $0 |
| Total | 1,300 (100.0%) | $59,348 |
Poverty in Welcome
Income Below Poverty by Sex and Age in Welcome
With 7.1% poverty level for males and 8.5% for females among the residents of Welcome, 55 to 64 year old males and 6 to 11 year old females are the most vulnerable to poverty, with 86 males (29.7%) and 46 females (21.6%) in their respective age groups living below the poverty level.
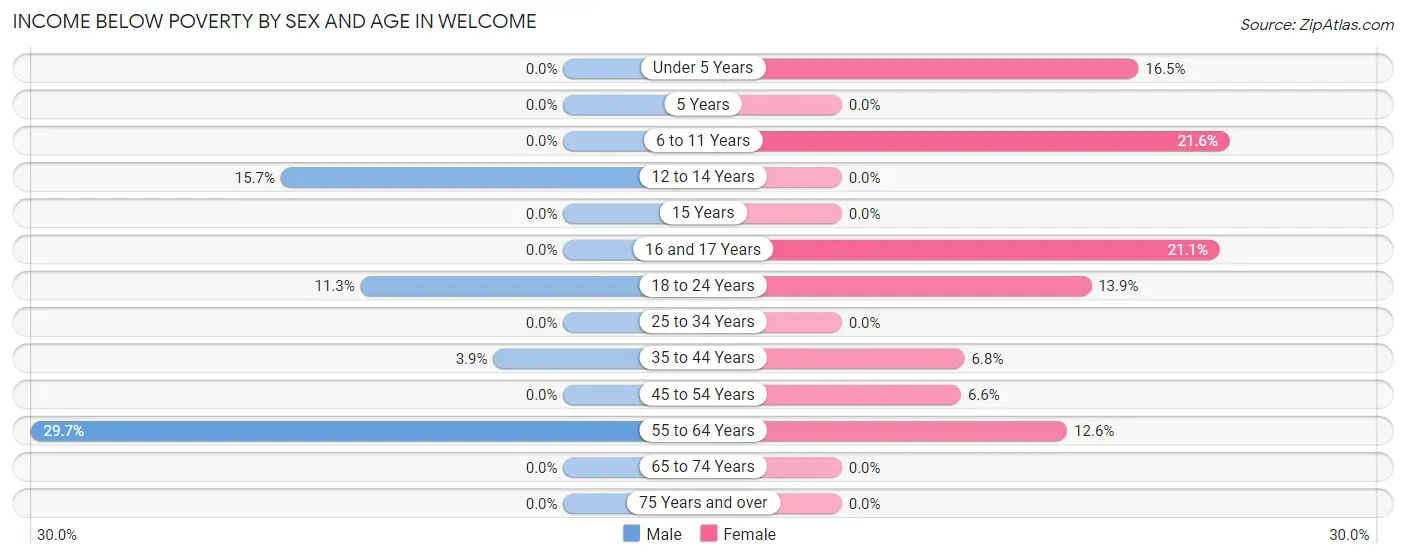
| Age Bracket | Male | Female |
| Under 5 Years | 0 (0.0%) | 18 (16.5%) |
| 5 Years | 0 (0.0%) | 0 (0.0%) |
| 6 to 11 Years | 0 (0.0%) | 46 (21.6%) |
| 12 to 14 Years | 14 (15.7%) | 0 (0.0%) |
| 15 Years | 0 (0.0%) | 0 (0.0%) |
| 16 and 17 Years | 0 (0.0%) | 16 (21.0%) |
| 18 to 24 Years | 7 (11.3%) | 10 (13.9%) |
| 25 to 34 Years | 0 (0.0%) | 0 (0.0%) |
| 35 to 44 Years | 14 (3.9%) | 13 (6.8%) |
| 45 to 54 Years | 0 (0.0%) | 15 (6.6%) |
| 55 to 64 Years | 86 (29.7%) | 31 (12.6%) |
| 65 to 74 Years | 0 (0.0%) | 0 (0.0%) |
| 75 Years and over | 0 (0.0%) | 0 (0.0%) |
| Total | 121 (7.1%) | 149 (8.5%) |
Income Above Poverty by Sex and Age in Welcome
According to the poverty statistics in Welcome, males aged under 5 years and females aged 12 to 14 years are the age groups that are most secure financially, with 100.0% of males and 100.0% of females in these age groups living above the poverty line.
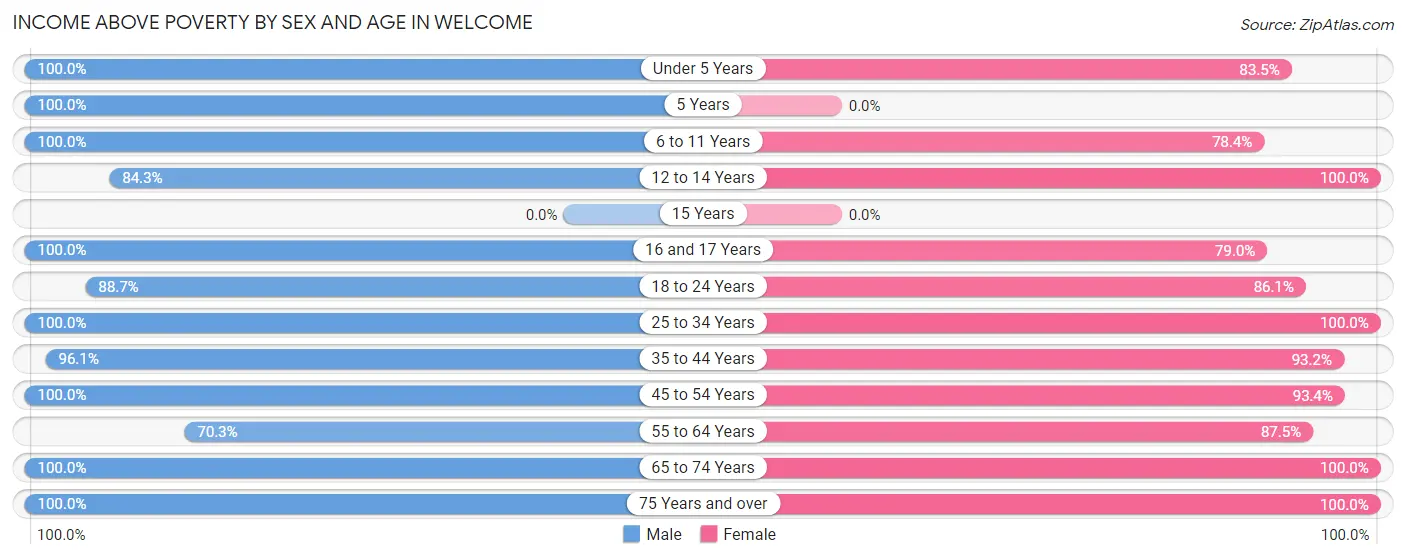
| Age Bracket | Male | Female |
| Under 5 Years | 50 (100.0%) | 91 (83.5%) |
| 5 Years | 18 (100.0%) | 0 (0.0%) |
| 6 to 11 Years | 120 (100.0%) | 167 (78.4%) |
| 12 to 14 Years | 75 (84.3%) | 64 (100.0%) |
| 15 Years | 0 (0.0%) | 0 (0.0%) |
| 16 and 17 Years | 23 (100.0%) | 60 (78.9%) |
| 18 to 24 Years | 55 (88.7%) | 62 (86.1%) |
| 25 to 34 Years | 209 (100.0%) | 293 (100.0%) |
| 35 to 44 Years | 345 (96.1%) | 177 (93.2%) |
| 45 to 54 Years | 140 (100.0%) | 211 (93.4%) |
| 55 to 64 Years | 204 (70.3%) | 216 (87.5%) |
| 65 to 74 Years | 184 (100.0%) | 155 (100.0%) |
| 75 Years and over | 149 (100.0%) | 100 (100.0%) |
| Total | 1,572 (92.8%) | 1,596 (91.5%) |
Income Below Poverty Among Married-Couple Families in Welcome
The poverty statistics for married-couple families in Welcome show that 3.8% or 31 of the total 819 families live below the poverty line. Families with 1 or 2 children have the highest poverty rate of 4.0%, comprising of 14 families. On the other hand, families with no children have the lowest poverty rate of 3.6%, which includes 17 families.
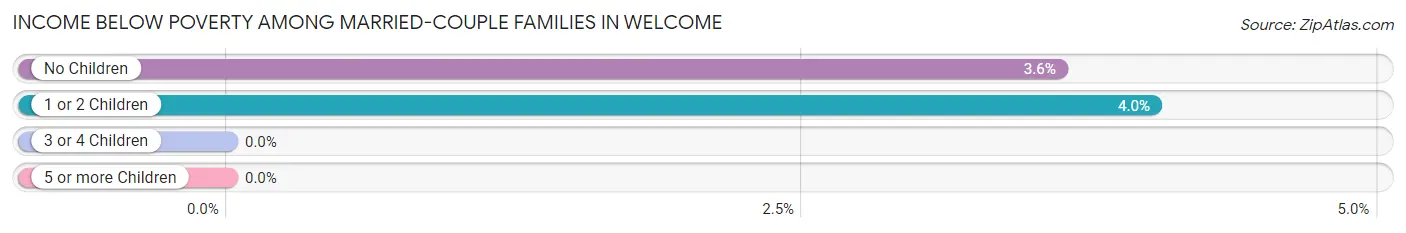
| Children | Above Poverty | Below Poverty |
| No Children | 454 (96.4%) | 17 (3.6%) |
| 1 or 2 Children | 334 (96.0%) | 14 (4.0%) |
| 3 or 4 Children | 0 (0.0%) | 0 (0.0%) |
| 5 or more Children | 0 (0.0%) | 0 (0.0%) |
| Total | 788 (96.2%) | 31 (3.8%) |
Income Below Poverty Among Single-Parent Households in Welcome
According to the poverty data in Welcome, 59.0% or 59 single-father households and 45.5% or 15 single-mother households are living below the poverty line. Among single-father households, those with 1 or 2 children have the highest poverty rate, with 59 households (80.8%) experiencing poverty. Likewise, among single-mother households, those with 1 or 2 children have the highest poverty rate, with 15 households (100.0%) falling below the poverty line.
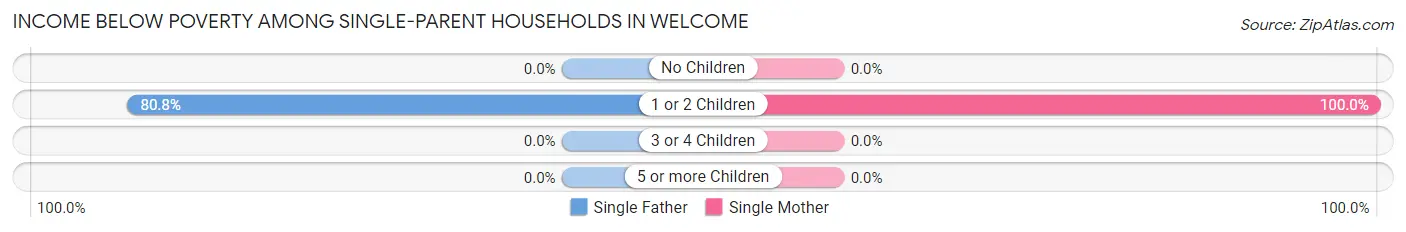
| Children | Single Father | Single Mother |
| No Children | 0 (0.0%) | 0 (0.0%) |
| 1 or 2 Children | 59 (80.8%) | 15 (100.0%) |
| 3 or 4 Children | 0 (0.0%) | 0 (0.0%) |
| 5 or more Children | 0 (0.0%) | 0 (0.0%) |
| Total | 59 (59.0%) | 15 (45.5%) |
Income Below Poverty Among Married-Couple vs Single-Parent Households in Welcome
The poverty data for Welcome shows that 31 of the married-couple family households (3.8%) and 74 of the single-parent households (55.6%) are living below the poverty level. Within the married-couple family households, those with 1 or 2 children have the highest poverty rate, with 14 households (4.0%) falling below the poverty line. Among the single-parent households, those with 1 or 2 children have the highest poverty rate, with 74 household (84.1%) living below poverty.
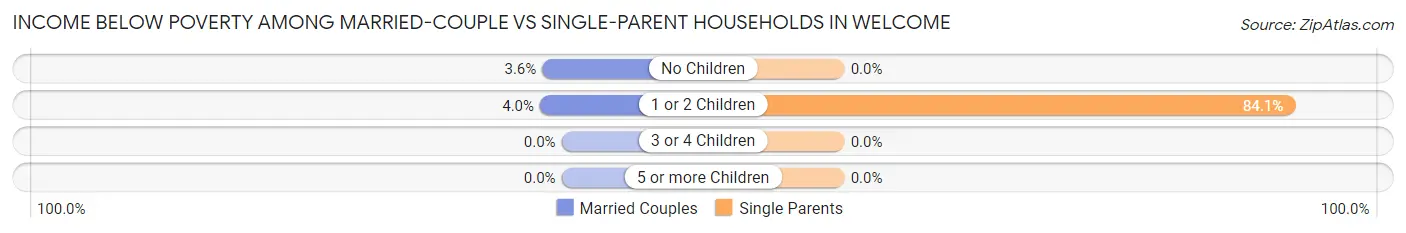
| Children | Married-Couple Families | Single-Parent Households |
| No Children | 17 (3.6%) | 0 (0.0%) |
| 1 or 2 Children | 14 (4.0%) | 74 (84.1%) |
| 3 or 4 Children | 0 (0.0%) | 0 (0.0%) |
| 5 or more Children | 0 (0.0%) | 0 (0.0%) |
| Total | 31 (3.8%) | 74 (55.6%) |
Race in Welcome
The most populous races in Welcome are White / Caucasian (3,309 | 96.1%), Hispanic or Latino (71 | 2.1%), and Some other Race (58 | 1.7%).
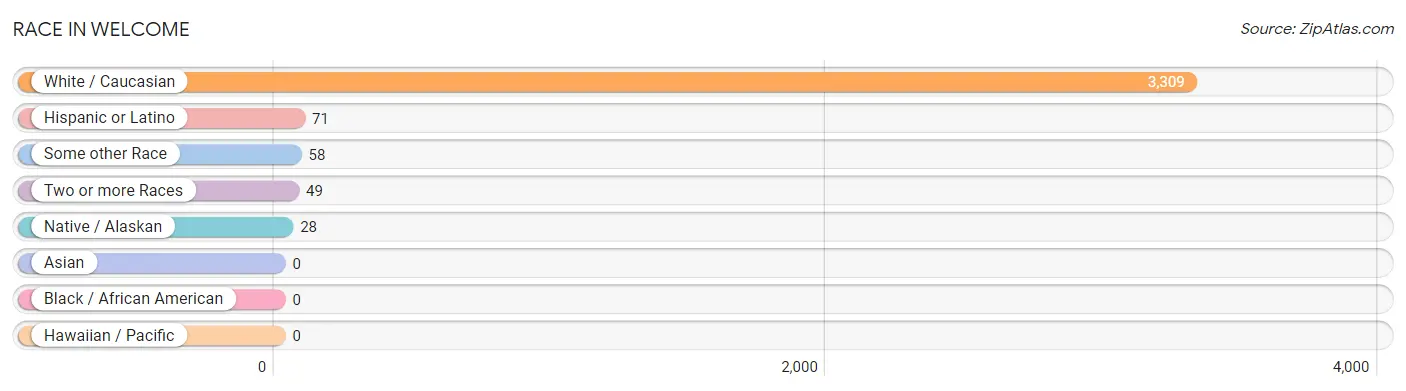
| Race | # Population | % Population |
| Asian | 0 | 0.0% |
| Black / African American | 0 | 0.0% |
| Hawaiian / Pacific | 0 | 0.0% |
| Hispanic or Latino | 71 | 2.1% |
| Native / Alaskan | 28 | 0.8% |
| White / Caucasian | 3,309 | 96.1% |
| Two or more Races | 49 | 1.4% |
| Some other Race | 58 | 1.7% |
| Total | 3,444 | 100.0% |
Ancestry in Welcome
The most populous ancestries reported in Welcome are German (571 | 16.6%), English (392 | 11.4%), Irish (295 | 8.6%), American (150 | 4.4%), and Scotch-Irish (118 | 3.4%), together accounting for 44.3% of all Welcome residents.
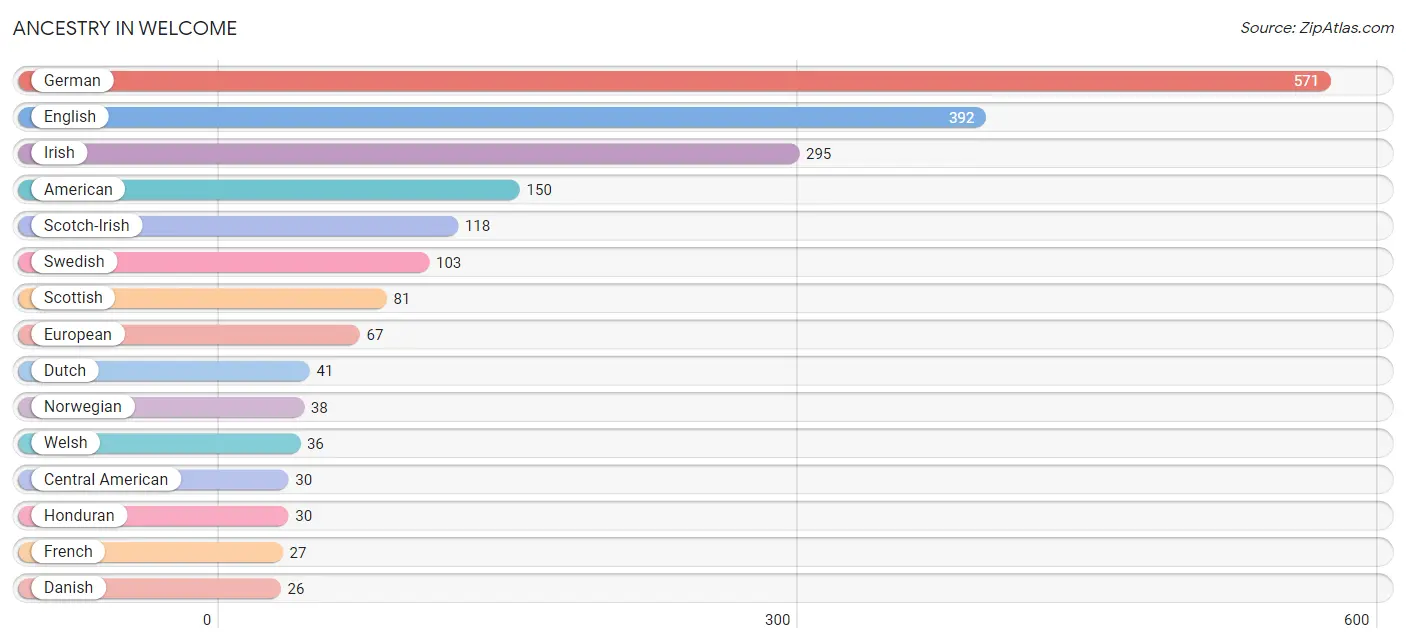
| Ancestry | # Population | % Population |
| American | 150 | 4.4% |
| British | 10 | 0.3% |
| Central American | 30 | 0.9% |
| Cherokee | 5 | 0.2% |
| Danish | 26 | 0.7% |
| Dutch | 41 | 1.2% |
| English | 392 | 11.4% |
| European | 67 | 1.9% |
| French | 27 | 0.8% |
| German | 571 | 16.6% |
| Honduran | 30 | 0.9% |
| Irish | 295 | 8.6% |
| Italian | 26 | 0.7% |
| Norwegian | 38 | 1.1% |
| Polish | 26 | 0.7% |
| Scotch-Irish | 118 | 3.4% |
| Scottish | 81 | 2.4% |
| Slavic | 12 | 0.4% |
| Swedish | 103 | 3.0% |
| Welsh | 36 | 1.1% | View All 20 Rows |
Immigrants in Welcome
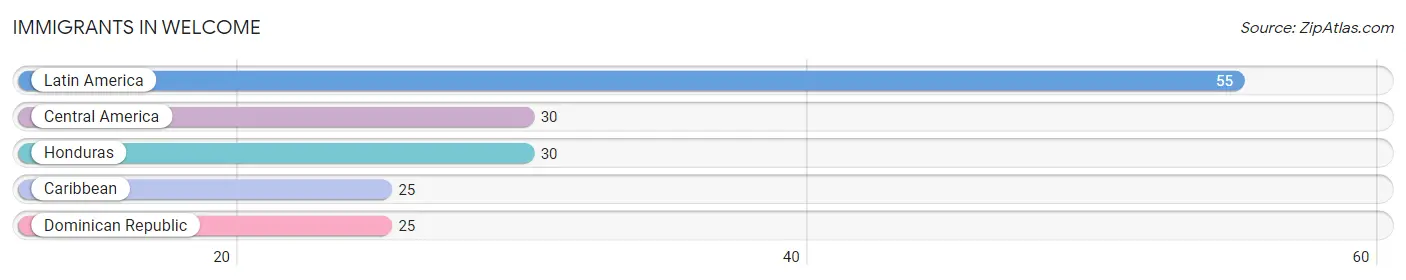
The most numerous immigrant groups reported in Welcome came from Latin America (55 | 1.6%), Central America (30 | 0.9%), Honduras (30 | 0.9%), Caribbean (25 | 0.7%), and Dominican Republic (25 | 0.7%), together accounting for 4.8% of all Welcome residents.
| Immigration Origin | # Population | % Population |
| Caribbean | 25 | 0.7% |
| Central America | 30 | 0.9% |
| Dominican Republic | 25 | 0.7% |
| Honduras | 30 | 0.9% |
| Latin America | 55 | 1.6% | View All 5 Rows |
Sex and Age in Welcome
Sex and Age in Welcome
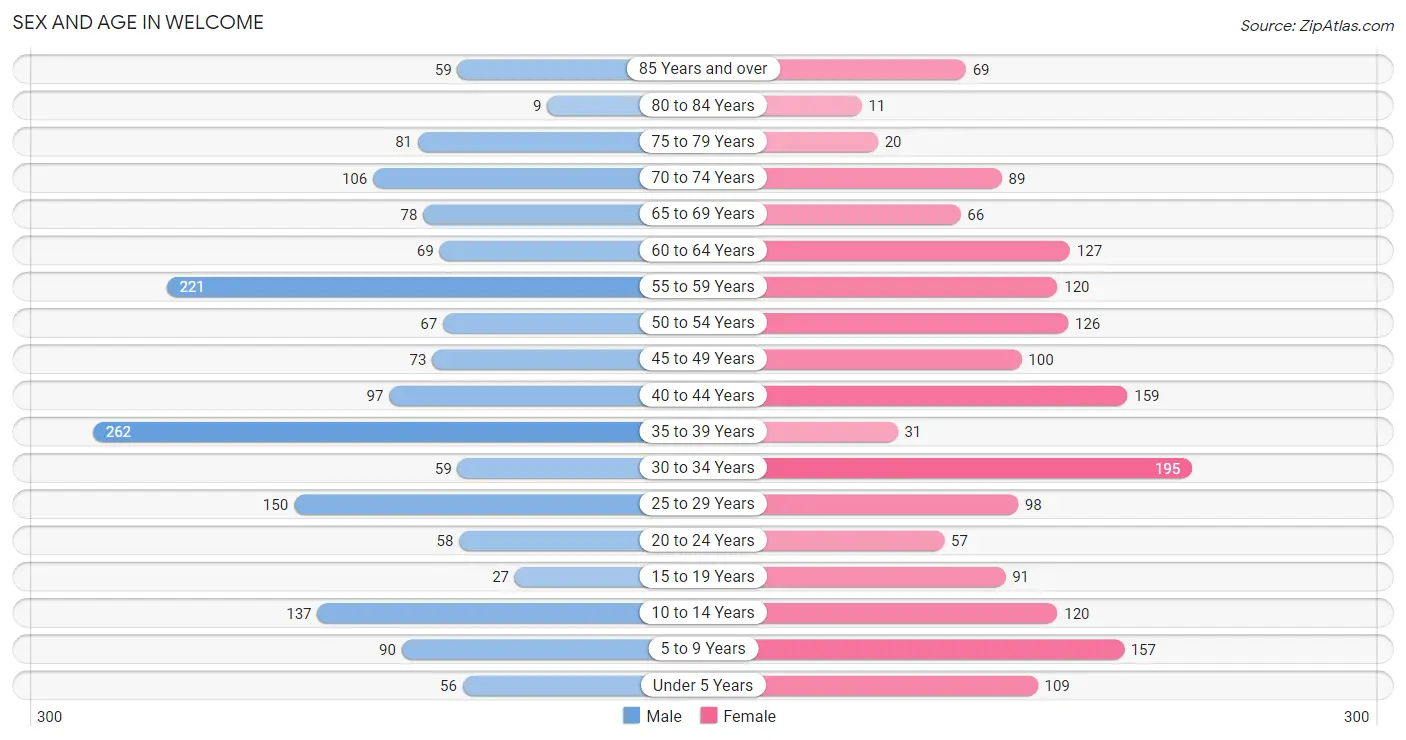
The most populous age groups in Welcome are 35 to 39 Years (262 | 15.4%) for men and 30 to 34 Years (195 | 11.2%) for women.
| Age Bracket | Male | Female |
| Under 5 Years | 56 (3.3%) | 109 (6.2%) |
| 5 to 9 Years | 90 (5.3%) | 157 (9.0%) |
| 10 to 14 Years | 137 (8.1%) | 120 (6.9%) |
| 15 to 19 Years | 27 (1.6%) | 91 (5.2%) |
| 20 to 24 Years | 58 (3.4%) | 57 (3.3%) |
| 25 to 29 Years | 150 (8.8%) | 98 (5.6%) |
| 30 to 34 Years | 59 (3.5%) | 195 (11.2%) |
| 35 to 39 Years | 262 (15.4%) | 31 (1.8%) |
| 40 to 44 Years | 97 (5.7%) | 159 (9.1%) |
| 45 to 49 Years | 73 (4.3%) | 100 (5.7%) |
| 50 to 54 Years | 67 (3.9%) | 126 (7.2%) |
| 55 to 59 Years | 221 (13.0%) | 120 (6.9%) |
| 60 to 64 Years | 69 (4.1%) | 127 (7.3%) |
| 65 to 69 Years | 78 (4.6%) | 66 (3.8%) |
| 70 to 74 Years | 106 (6.2%) | 89 (5.1%) |
| 75 to 79 Years | 81 (4.8%) | 20 (1.1%) |
| 80 to 84 Years | 9 (0.5%) | 11 (0.6%) |
| 85 Years and over | 59 (3.5%) | 69 (4.0%) |
| Total | 1,699 (100.0%) | 1,745 (100.0%) |
Families and Households in Welcome
Median Family Size in Welcome
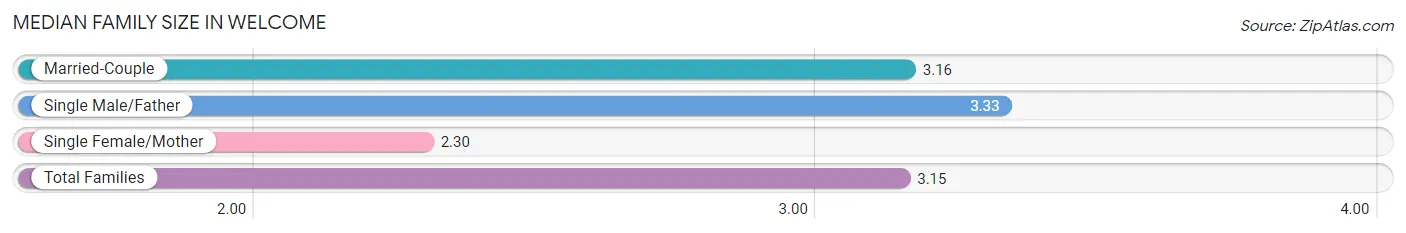
The median family size in Welcome is 3.15 persons per family, with single male/father families (100 | 10.5%) accounting for the largest median family size of 3.33 persons per family. On the other hand, single female/mother families (33 | 3.5%) represent the smallest median family size with 2.30 persons per family.
| Family Type | # Families | Family Size |
| Married-Couple | 819 (86.0%) | 3.16 |
| Single Male/Father | 100 (10.5%) | 3.33 |
| Single Female/Mother | 33 (3.5%) | 2.30 |
| Total Families | 952 (100.0%) | 3.15 |
Median Household Size in Welcome
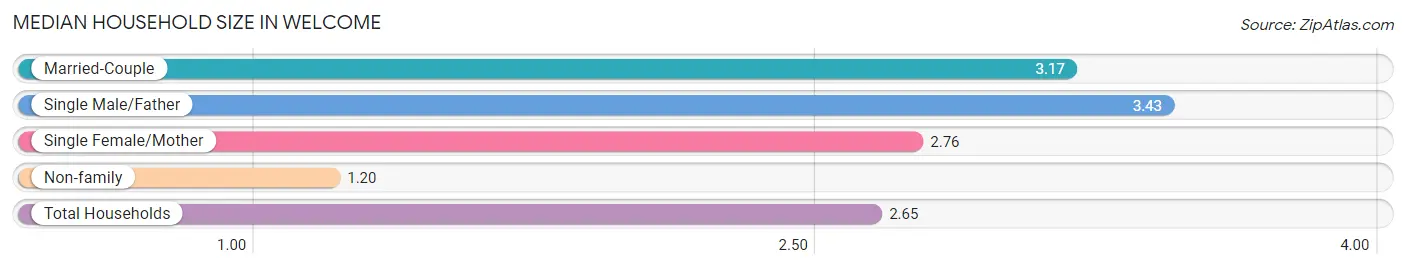
The median household size in Welcome is 2.65 persons per household, with single male/father households (100 | 7.7%) accounting for the largest median household size of 3.43 persons per household. non-family households (348 | 26.8%) represent the smallest median household size with 1.20 persons per household.
| Household Type | # Households | Household Size |
| Married-Couple | 819 (63.0%) | 3.17 |
| Single Male/Father | 100 (7.7%) | 3.43 |
| Single Female/Mother | 33 (2.5%) | 2.76 |
| Non-family | 348 (26.8%) | 1.20 |
| Total Households | 1,300 (100.0%) | 2.65 |
Household Size by Marriage Status in Welcome
Out of a total of 1,300 households in Welcome, 952 (73.2%) are family households, while 348 (26.8%) are nonfamily households. The most numerous type of family households are 2-person households, comprising 409, and the most common type of nonfamily households are 1-person households, comprising 276.
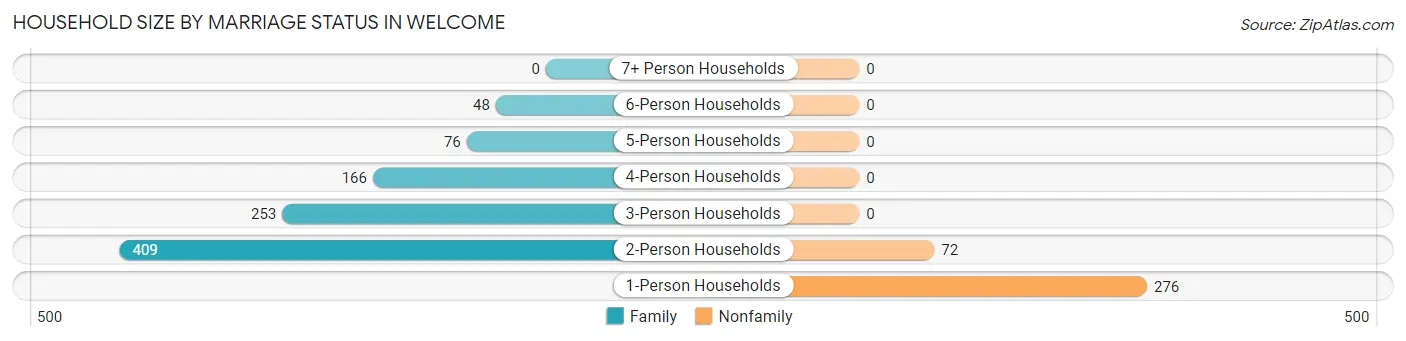
| Household Size | Family Households | Nonfamily Households |
| 1-Person Households | - | 276 (21.2%) |
| 2-Person Households | 409 (31.5%) | 72 (5.5%) |
| 3-Person Households | 253 (19.5%) | 0 (0.0%) |
| 4-Person Households | 166 (12.8%) | 0 (0.0%) |
| 5-Person Households | 76 (5.9%) | 0 (0.0%) |
| 6-Person Households | 48 (3.7%) | 0 (0.0%) |
| 7+ Person Households | 0 (0.0%) | 0 (0.0%) |
| Total | 952 (73.2%) | 348 (26.8%) |
Female Fertility in Welcome
Fertility by Age in Welcome
Average fertility rate in Welcome is 44.0 births per 1,000 women. Women in the age bracket of 20 to 34 years have the highest fertility rate with 94.0 births per 1,000 women. Women in the age bracket of 20 to 34 years acount for 100.0% of all women with births.
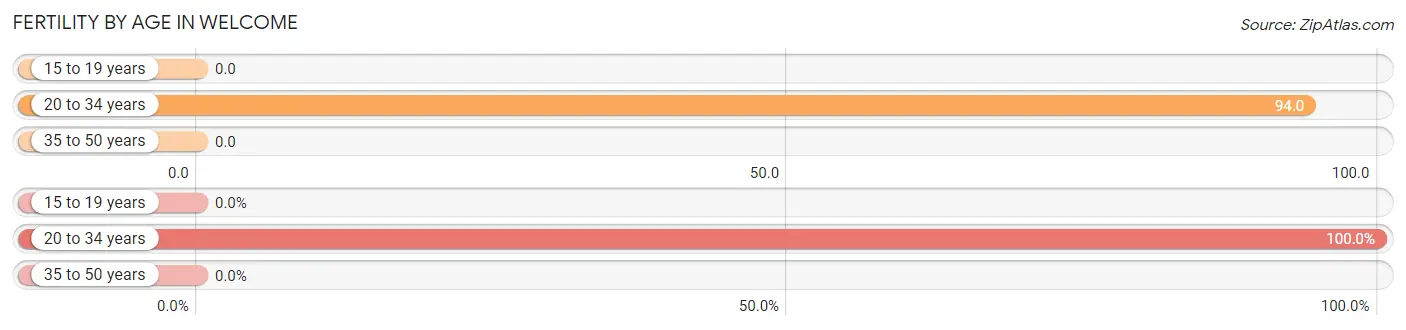
| Age Bracket | Women with Births | Births / 1,000 Women |
| 15 to 19 years | 0 (0.0%) | 0.0 |
| 20 to 34 years | 33 (100.0%) | 94.0 |
| 35 to 50 years | 0 (0.0%) | 0.0 |
| Total | 33 (100.0%) | 44.0 |
Fertility by Age by Marriage Status in Welcome
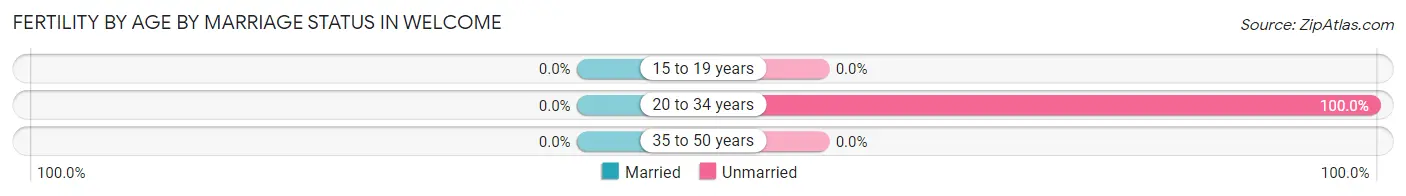
| Age Bracket | Married | Unmarried |
| 15 to 19 years | 0 (0.0%) | 0 (0.0%) |
| 20 to 34 years | 0 (0.0%) | 33 (100.0%) |
| 35 to 50 years | 0 (0.0%) | 0 (0.0%) |
| Total | 0 (0.0%) | 33 (100.0%) |
Fertility by Education in Welcome
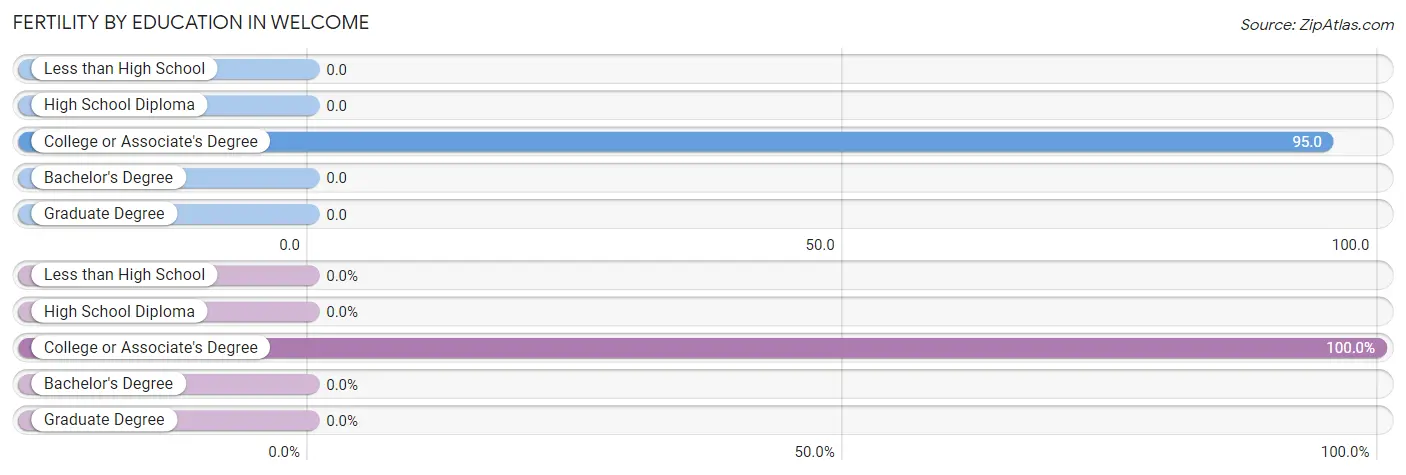
| Educational Attainment | Women with Births | Births / 1,000 Women |
| Less than High School | 0 (0.0%) | 0.0 |
| High School Diploma | 0 (0.0%) | 0.0 |
| College or Associate's Degree | 33 (100.0%) | 95.0 |
| Bachelor's Degree | 0 (0.0%) | 0.0 |
| Graduate Degree | 0 (0.0%) | 0.0 |
| Total | 33 (100.0%) | 44.0 |
Fertility by Education by Marriage Status in Welcome
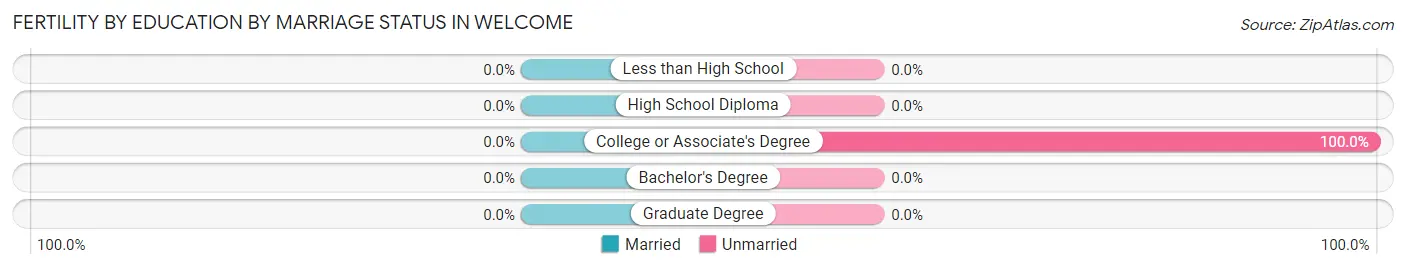
| Educational Attainment | Married | Unmarried |
| Less than High School | 0 (0.0%) | 0 (0.0%) |
| High School Diploma | 0 (0.0%) | 0 (0.0%) |
| College or Associate's Degree | 0 (0.0%) | 33 (100.0%) |
| Bachelor's Degree | 0 (0.0%) | 0 (0.0%) |
| Graduate Degree | 0 (0.0%) | 0 (0.0%) |
| Total | 0 (0.0%) | 33 (100.0%) |
Employment Characteristics in Welcome
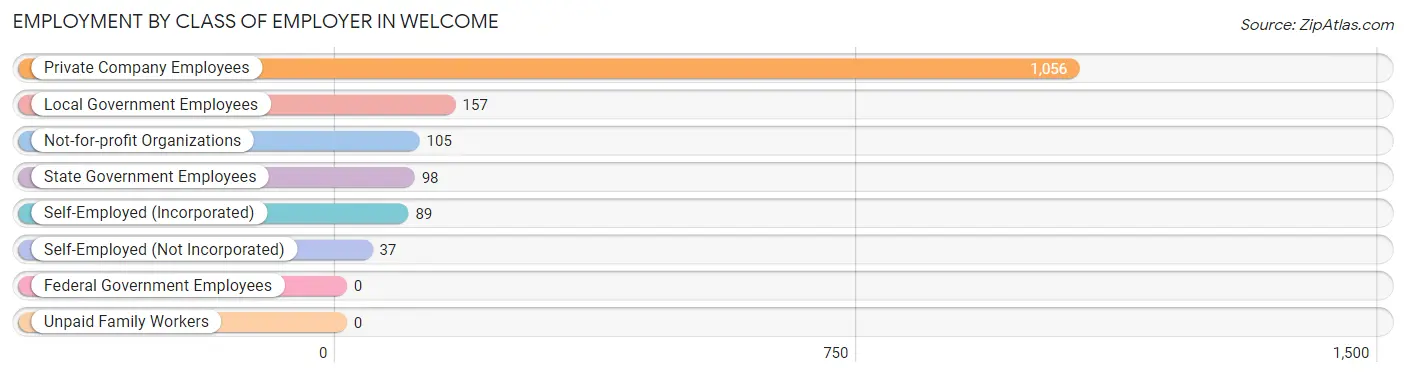
Employment by Class of Employer in Welcome
Among the 1,542 employed individuals in Welcome, private company employees (1,056 | 68.5%), local government employees (157 | 10.2%), and not-for-profit organizations (105 | 6.8%) make up the most common classes of employment.
| Employer Class | # Employees | % Employees |
| Private Company Employees | 1,056 | 68.5% |
| Self-Employed (Incorporated) | 89 | 5.8% |
| Self-Employed (Not Incorporated) | 37 | 2.4% |
| Not-for-profit Organizations | 105 | 6.8% |
| Local Government Employees | 157 | 10.2% |
| State Government Employees | 98 | 6.4% |
| Federal Government Employees | 0 | 0.0% |
| Unpaid Family Workers | 0 | 0.0% |
| Total | 1,542 | 100.0% |
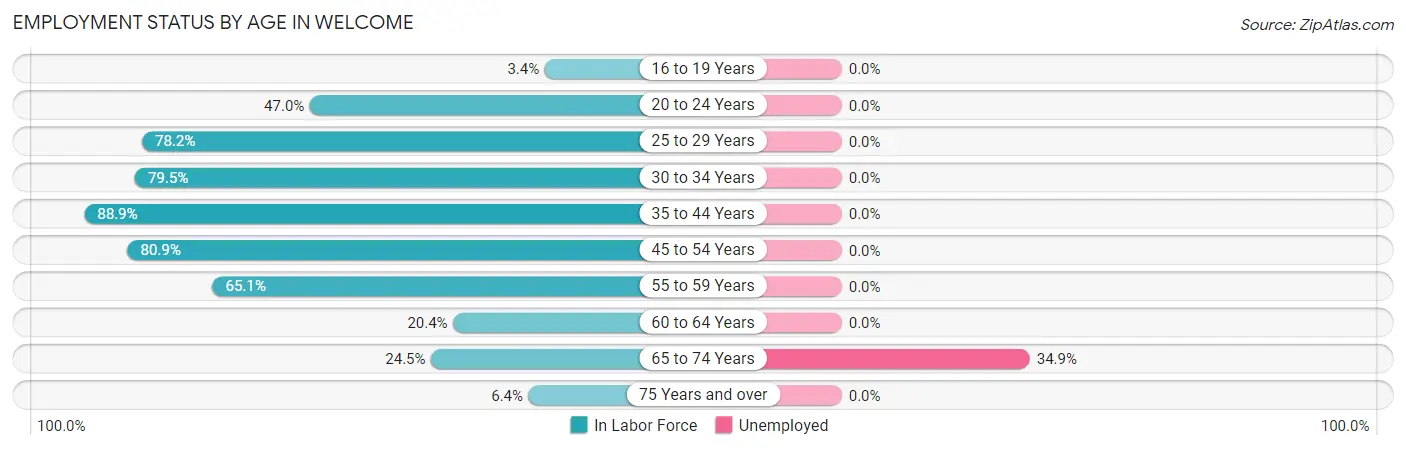
Employment Status by Age in Welcome
According to the labor force statistics for Welcome, out of the total population over 16 years of age (2,775), 57.6% or 1,598 individuals are in the labor force, with 1.8% or 29 of them unemployed. The age group with the highest labor force participation rate is 35 to 44 years, with 88.9% or 488 individuals in the labor force. Within the labor force, the 65 to 74 years age range has the highest percentage of unemployed individuals, with 34.9% or 29 of them being unemployed.
| Age Bracket | In Labor Force | Unemployed |
| 16 to 19 Years | 4 (3.4%) | 0 (0.0%) |
| 20 to 24 Years | 54 (47.0%) | 0 (0.0%) |
| 25 to 29 Years | 194 (78.2%) | 0 (0.0%) |
| 30 to 34 Years | 202 (79.5%) | 0 (0.0%) |
| 35 to 44 Years | 488 (88.9%) | 0 (0.0%) |
| 45 to 54 Years | 296 (80.9%) | 0 (0.0%) |
| 55 to 59 Years | 222 (65.1%) | 0 (0.0%) |
| 60 to 64 Years | 40 (20.4%) | 0 (0.0%) |
| 65 to 74 Years | 83 (24.5%) | 29 (34.9%) |
| 75 Years and over | 16 (6.4%) | 0 (0.0%) |
| Total | 1,598 (57.6%) | 29 (1.8%) |
Employment Status by Educational Attainment in Welcome
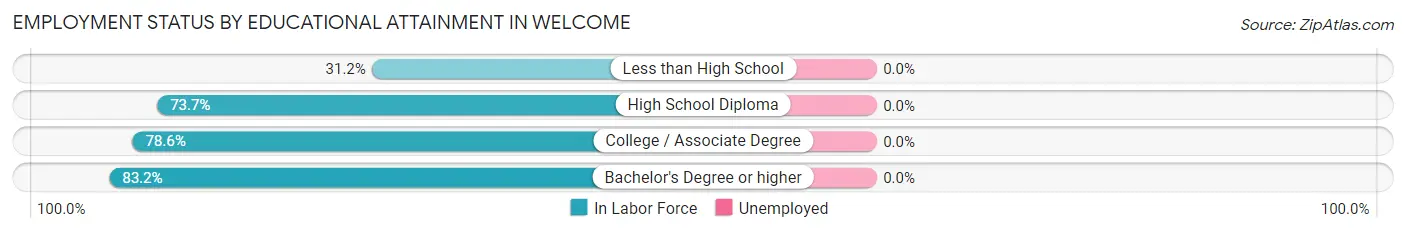
| Educational Attainment | In Labor Force | Unemployed |
| Less than High School | 44 (31.2%) | 0 (0.0%) |
| High School Diploma | 588 (73.7%) | 0 (0.0%) |
| College / Associate Degree | 592 (78.6%) | 0 (0.0%) |
| Bachelor's Degree or higher | 218 (83.2%) | 0 (0.0%) |
| Total | 1,442 (73.8%) | 0 (0.0%) |
Employment Occupations by Sex in Welcome
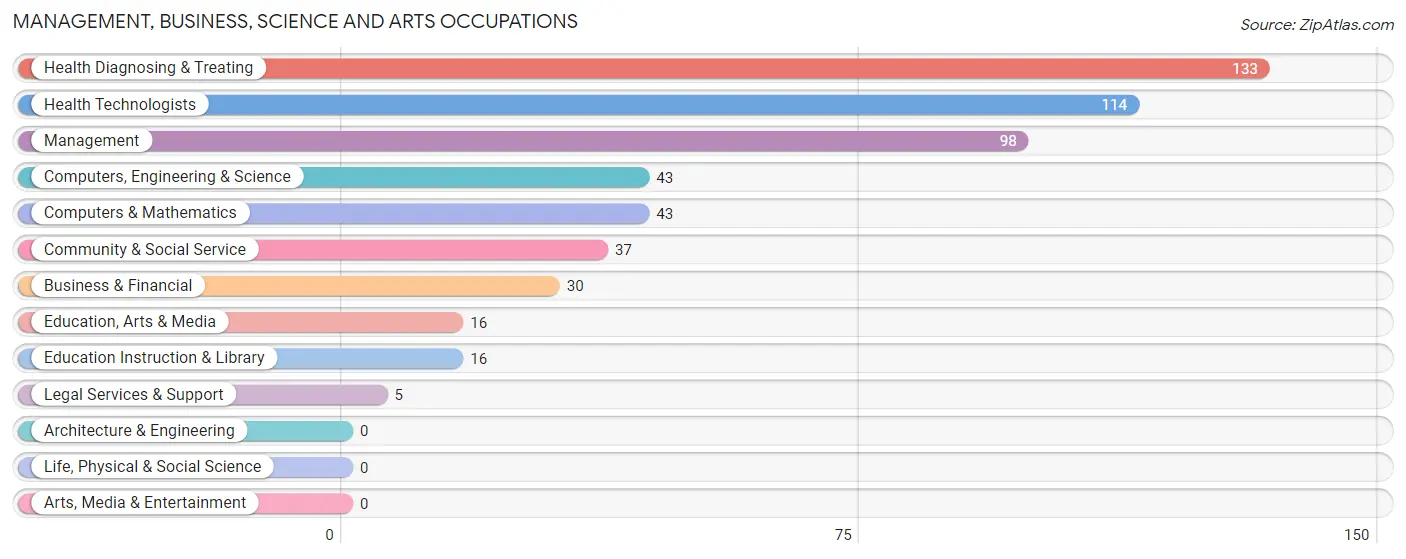
Management, Business, Science and Arts Occupations
The most common Management, Business, Science and Arts occupations in Welcome are Health Diagnosing & Treating (133 | 8.5%), Health Technologists (114 | 7.3%), Management (98 | 6.2%), Computers, Engineering & Science (43 | 2.7%), and Computers & Mathematics (43 | 2.7%).
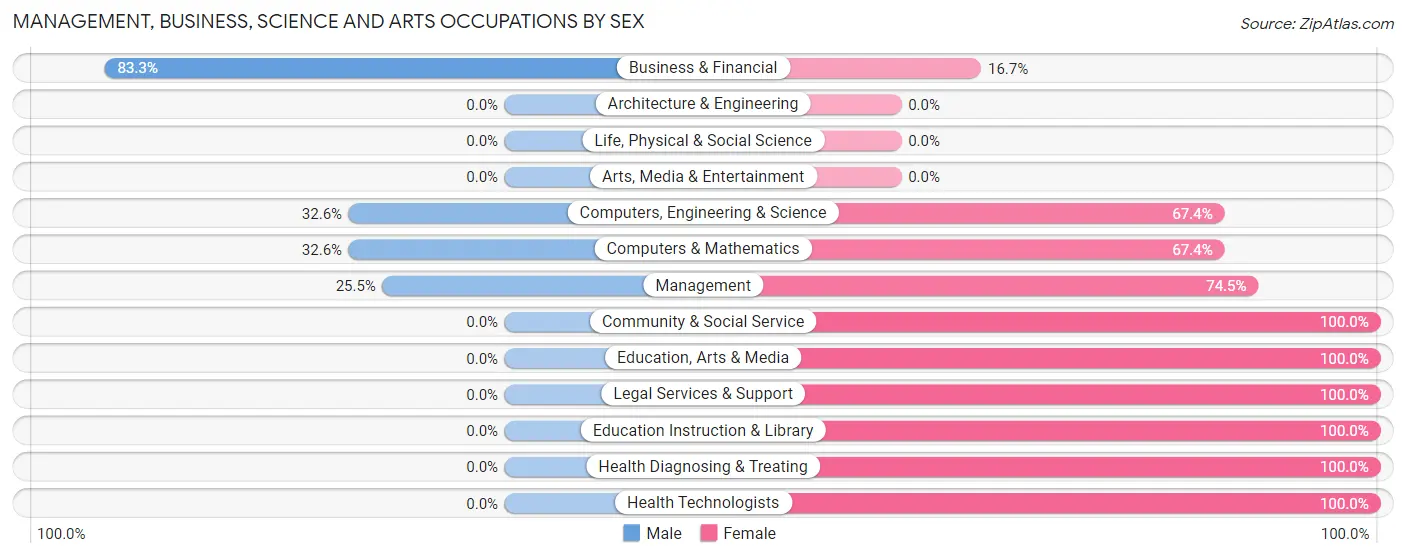
Management, Business, Science and Arts Occupations by Sex
Within the Management, Business, Science and Arts occupations in Welcome, the most male-oriented occupations are Business & Financial (83.3%), Computers, Engineering & Science (32.6%), and Computers & Mathematics (32.6%), while the most female-oriented occupations are Community & Social Service (100.0%), Education, Arts & Media (100.0%), and Legal Services & Support (100.0%).
| Occupation | Male | Female |
| Management | 25 (25.5%) | 73 (74.5%) |
| Business & Financial | 25 (83.3%) | 5 (16.7%) |
| Computers, Engineering & Science | 14 (32.6%) | 29 (67.4%) |
| Computers & Mathematics | 14 (32.6%) | 29 (67.4%) |
| Architecture & Engineering | 0 (0.0%) | 0 (0.0%) |
| Life, Physical & Social Science | 0 (0.0%) | 0 (0.0%) |
| Community & Social Service | 0 (0.0%) | 37 (100.0%) |
| Education, Arts & Media | 0 (0.0%) | 16 (100.0%) |
| Legal Services & Support | 0 (0.0%) | 5 (100.0%) |
| Education Instruction & Library | 0 (0.0%) | 16 (100.0%) |
| Arts, Media & Entertainment | 0 (0.0%) | 0 (0.0%) |
| Health Diagnosing & Treating | 0 (0.0%) | 133 (100.0%) |
| Health Technologists | 0 (0.0%) | 114 (100.0%) |
| Total (Category) | 64 (18.8%) | 277 (81.2%) |
| Total (Overall) | 878 (55.9%) | 692 (44.1%) |
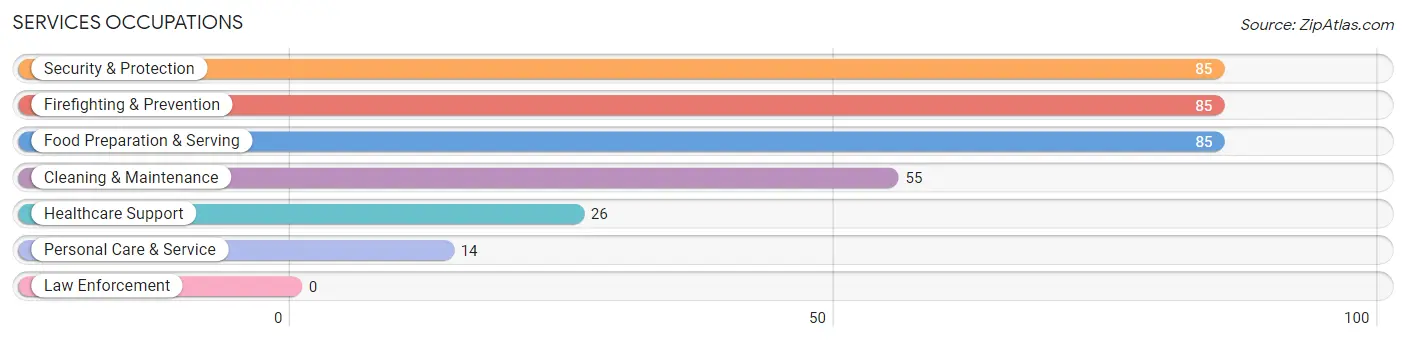
Services Occupations
The most common Services occupations in Welcome are Security & Protection (85 | 5.4%), Firefighting & Prevention (85 | 5.4%), Food Preparation & Serving (85 | 5.4%), Cleaning & Maintenance (55 | 3.5%), and Healthcare Support (26 | 1.7%).
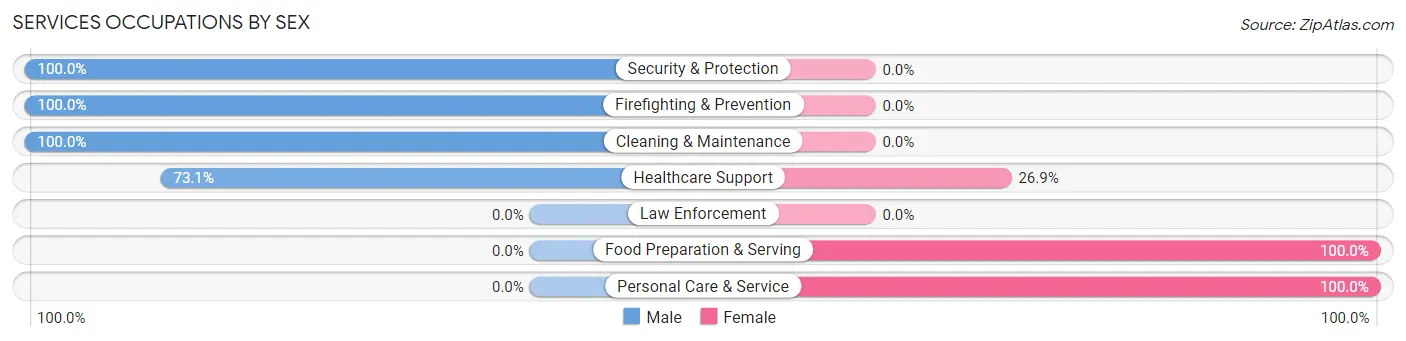
Services Occupations by Sex
Within the Services occupations in Welcome, the most male-oriented occupations are Security & Protection (100.0%), Firefighting & Prevention (100.0%), and Cleaning & Maintenance (100.0%), while the most female-oriented occupations are Food Preparation & Serving (100.0%), Personal Care & Service (100.0%), and Healthcare Support (26.9%).
| Occupation | Male | Female |
| Healthcare Support | 19 (73.1%) | 7 (26.9%) |
| Security & Protection | 85 (100.0%) | 0 (0.0%) |
| Firefighting & Prevention | 85 (100.0%) | 0 (0.0%) |
| Law Enforcement | 0 (0.0%) | 0 (0.0%) |
| Food Preparation & Serving | 0 (0.0%) | 85 (100.0%) |
| Cleaning & Maintenance | 55 (100.0%) | 0 (0.0%) |
| Personal Care & Service | 0 (0.0%) | 14 (100.0%) |
| Total (Category) | 159 (60.0%) | 106 (40.0%) |
| Total (Overall) | 878 (55.9%) | 692 (44.1%) |
Sales and Office Occupations
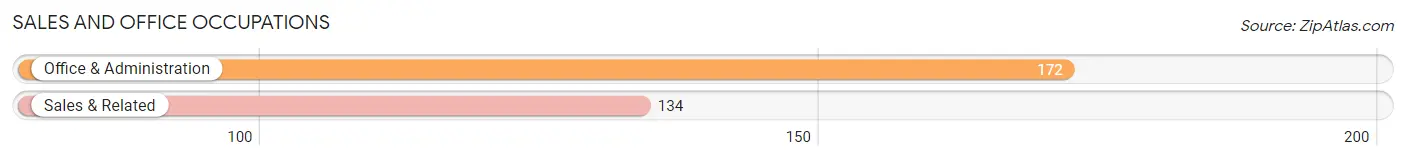
The most common Sales and Office occupations in Welcome are Office & Administration (172 | 11.0%), and Sales & Related (134 | 8.5%).
Sales and Office Occupations by Sex
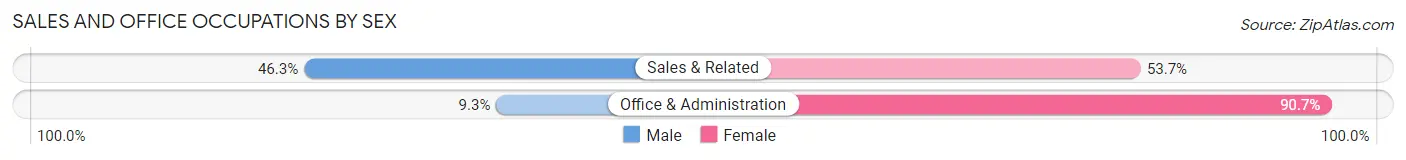
| Occupation | Male | Female |
| Sales & Related | 62 (46.3%) | 72 (53.7%) |
| Office & Administration | 16 (9.3%) | 156 (90.7%) |
| Total (Category) | 78 (25.5%) | 228 (74.5%) |
| Total (Overall) | 878 (55.9%) | 692 (44.1%) |
Natural Resources, Construction and Maintenance Occupations
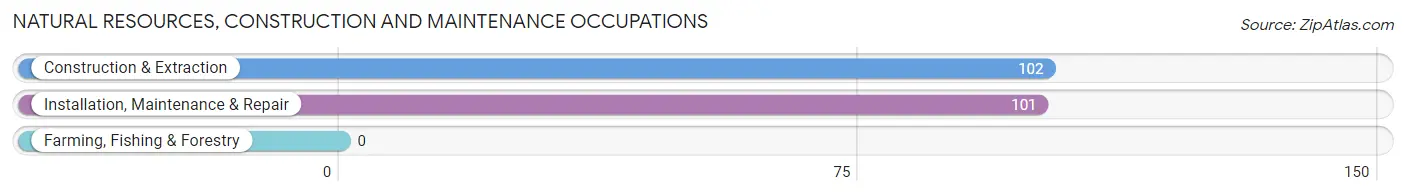
The most common Natural Resources, Construction and Maintenance occupations in Welcome are Construction & Extraction (102 | 6.5%), and Installation, Maintenance & Repair (101 | 6.4%).
Natural Resources, Construction and Maintenance Occupations by Sex
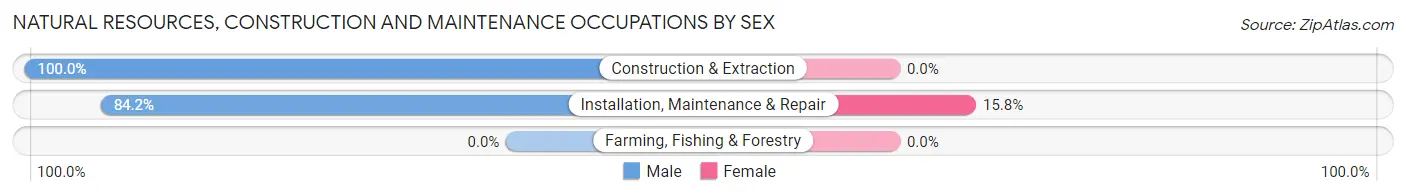
| Occupation | Male | Female |
| Farming, Fishing & Forestry | 0 (0.0%) | 0 (0.0%) |
| Construction & Extraction | 102 (100.0%) | 0 (0.0%) |
| Installation, Maintenance & Repair | 85 (84.2%) | 16 (15.8%) |
| Total (Category) | 187 (92.1%) | 16 (7.9%) |
| Total (Overall) | 878 (55.9%) | 692 (44.1%) |
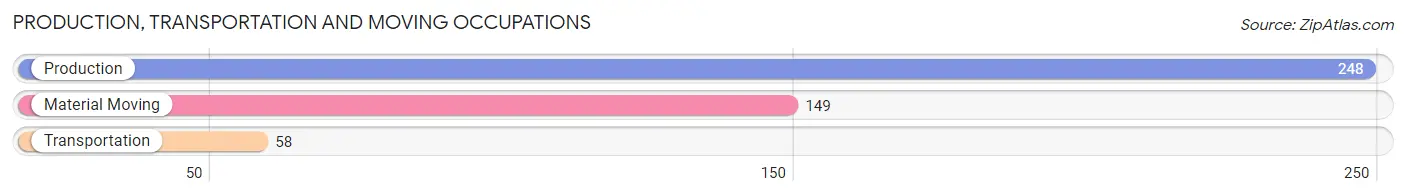
Production, Transportation and Moving Occupations
The most common Production, Transportation and Moving occupations in Welcome are Production (248 | 15.8%), Material Moving (149 | 9.5%), and Transportation (58 | 3.7%).
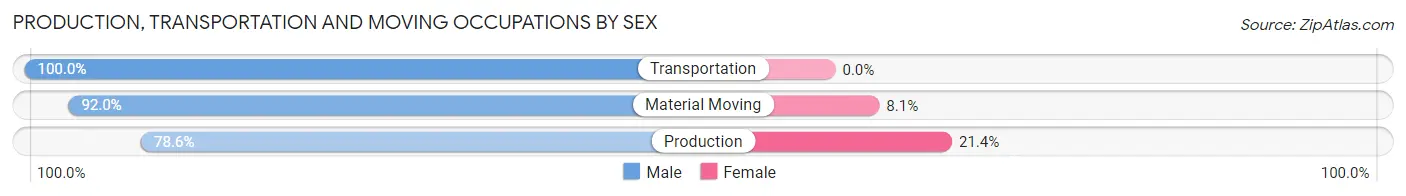
Production, Transportation and Moving Occupations by Sex
| Occupation | Male | Female |
| Production | 195 (78.6%) | 53 (21.4%) |
| Transportation | 58 (100.0%) | 0 (0.0%) |
| Material Moving | 137 (91.9%) | 12 (8.1%) |
| Total (Category) | 390 (85.7%) | 65 (14.3%) |
| Total (Overall) | 878 (55.9%) | 692 (44.1%) |
Employment Industries by Sex in Welcome
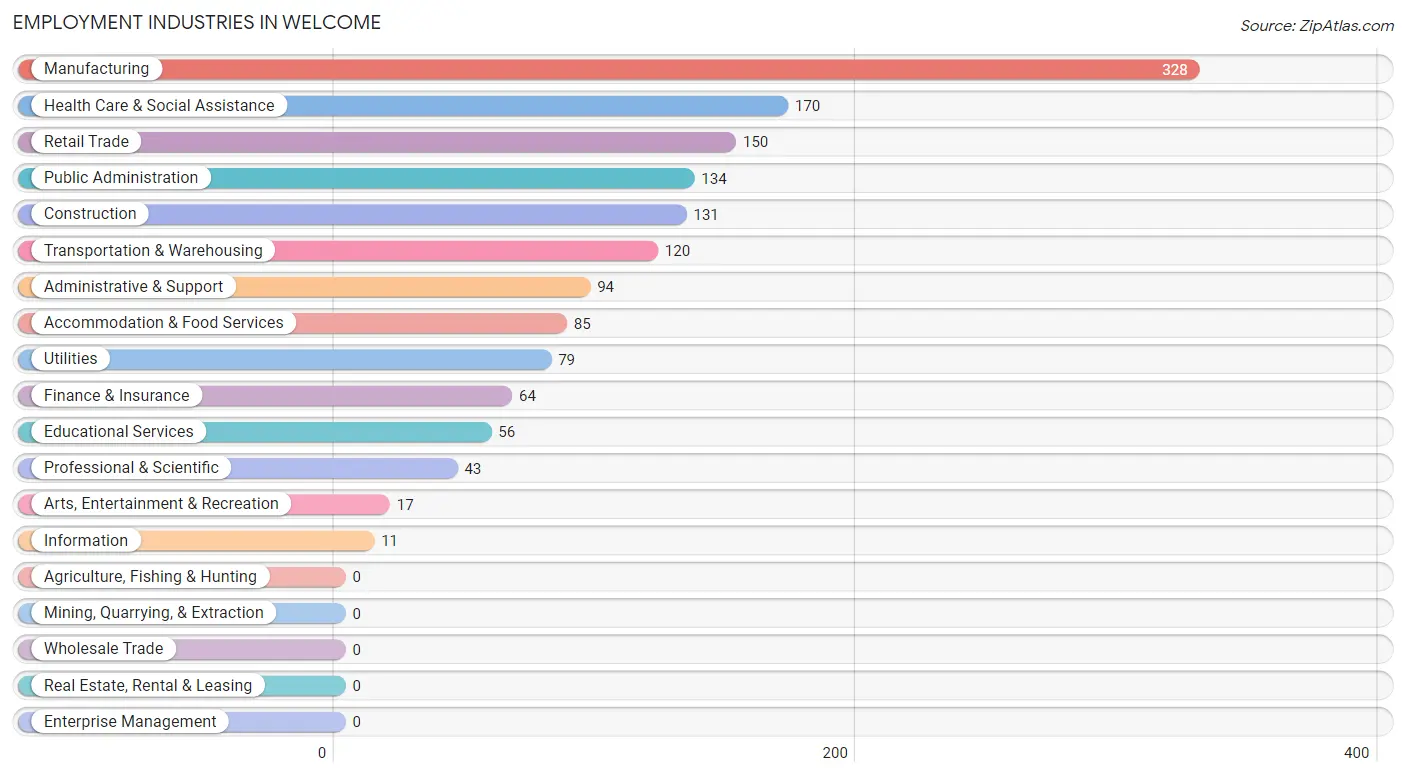
Employment Industries in Welcome
The major employment industries in Welcome include Manufacturing (328 | 20.9%), Health Care & Social Assistance (170 | 10.8%), Retail Trade (150 | 9.6%), Public Administration (134 | 8.5%), and Construction (131 | 8.3%).
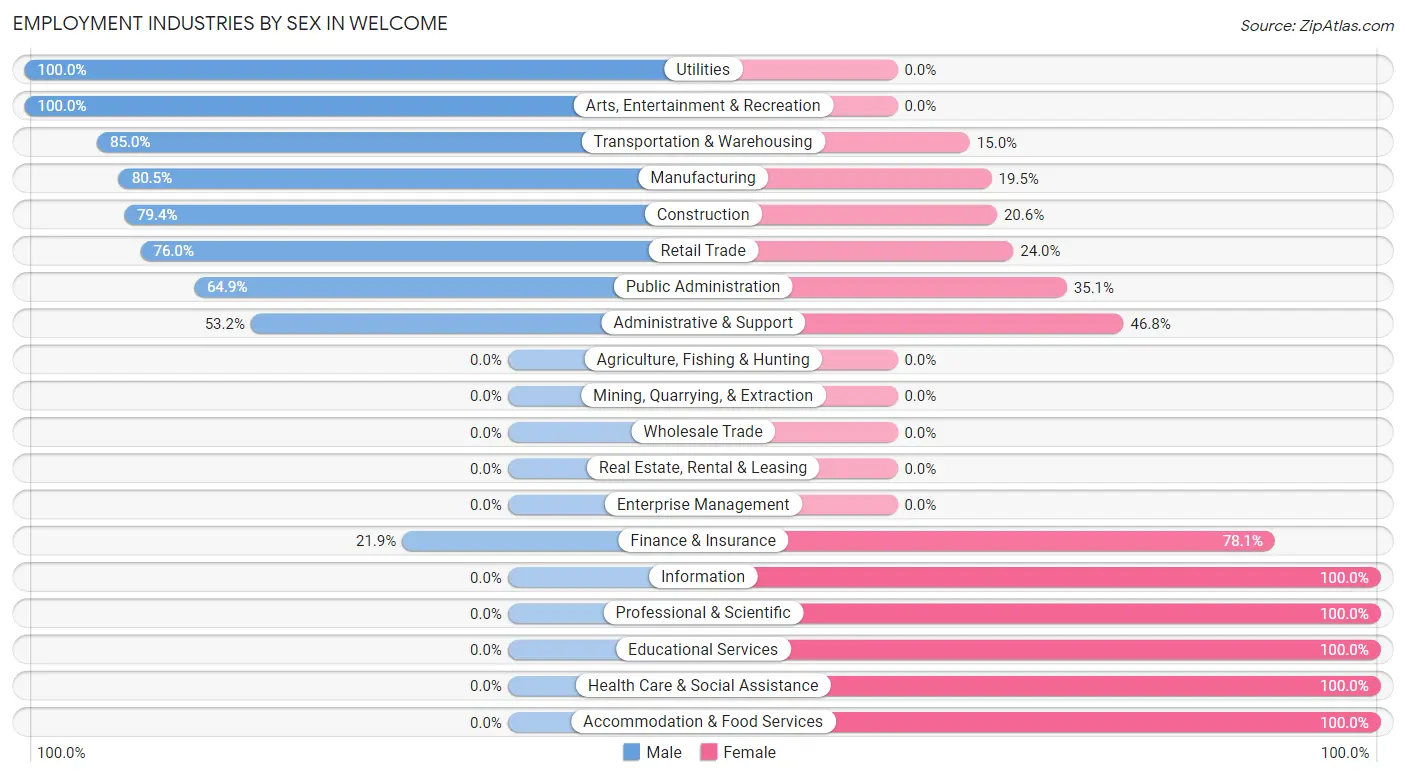
Employment Industries by Sex in Welcome
The Welcome industries that see more men than women are Utilities (100.0%), Arts, Entertainment & Recreation (100.0%), and Transportation & Warehousing (85.0%), whereas the industries that tend to have a higher number of women are Information (100.0%), Professional & Scientific (100.0%), and Educational Services (100.0%).
| Industry | Male | Female |
| Agriculture, Fishing & Hunting | 0 (0.0%) | 0 (0.0%) |
| Mining, Quarrying, & Extraction | 0 (0.0%) | 0 (0.0%) |
| Construction | 104 (79.4%) | 27 (20.6%) |
| Manufacturing | 264 (80.5%) | 64 (19.5%) |
| Wholesale Trade | 0 (0.0%) | 0 (0.0%) |
| Retail Trade | 114 (76.0%) | 36 (24.0%) |
| Transportation & Warehousing | 102 (85.0%) | 18 (15.0%) |
| Utilities | 79 (100.0%) | 0 (0.0%) |
| Information | 0 (0.0%) | 11 (100.0%) |
| Finance & Insurance | 14 (21.9%) | 50 (78.1%) |
| Real Estate, Rental & Leasing | 0 (0.0%) | 0 (0.0%) |
| Professional & Scientific | 0 (0.0%) | 43 (100.0%) |
| Enterprise Management | 0 (0.0%) | 0 (0.0%) |
| Administrative & Support | 50 (53.2%) | 44 (46.8%) |
| Educational Services | 0 (0.0%) | 56 (100.0%) |
| Health Care & Social Assistance | 0 (0.0%) | 170 (100.0%) |
| Arts, Entertainment & Recreation | 17 (100.0%) | 0 (0.0%) |
| Accommodation & Food Services | 0 (0.0%) | 85 (100.0%) |
| Public Administration | 87 (64.9%) | 47 (35.1%) |
| Total | 878 (55.9%) | 692 (44.1%) |
Education in Welcome
School Enrollment in Welcome
The most common levels of schooling among the 728 students in Welcome are elementary school (287 | 39.4%), middle school (199 | 27.3%), and college / undergraduate (125 | 17.2%).
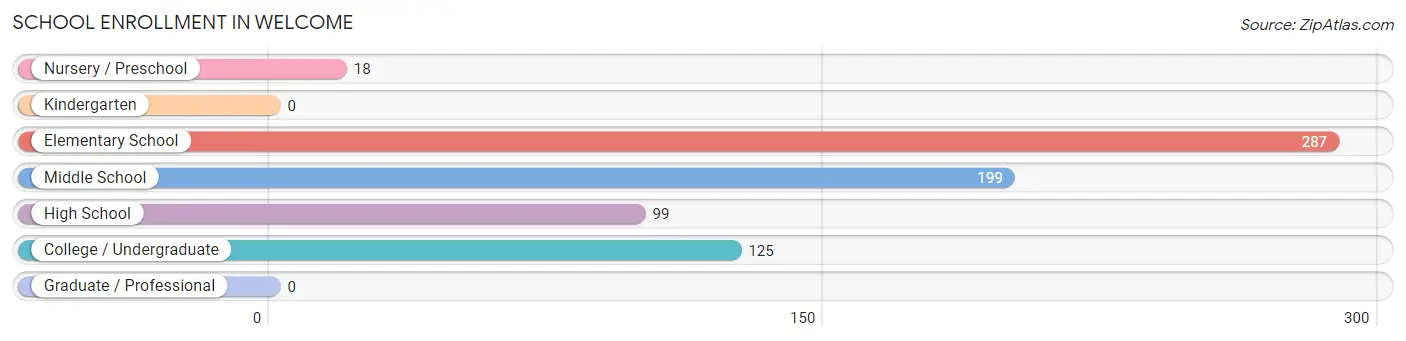
| School Level | # Students | % Students |
| Nursery / Preschool | 18 | 2.5% |
| Kindergarten | 0 | 0.0% |
| Elementary School | 287 | 39.4% |
| Middle School | 199 | 27.3% |
| High School | 99 | 13.6% |
| College / Undergraduate | 125 | 17.2% |
| Graduate / Professional | 0 | 0.0% |
| Total | 728 | 100.0% |
School Enrollment by Age by Funding Source in Welcome
Out of a total of 728 students who are enrolled in schools in Welcome, 28 (3.8%) attend a private institution, while the remaining 700 (96.2%) are enrolled in public schools. The age group of 10 to 14 year olds has the highest likelihood of being enrolled in private schools, with 23 (8.9% in the age bracket) enrolled. Conversely, the age group of 15 to 17 year olds has the lowest likelihood of being enrolled in a private school, with 99 (100.0% in the age bracket) attending a public institution.
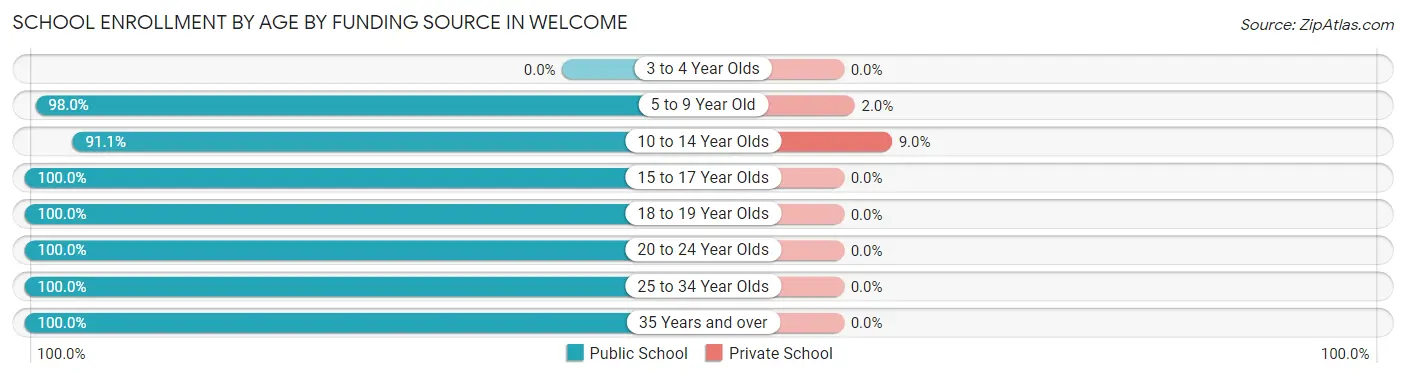
| Age Bracket | Public School | Private School |
| 3 to 4 Year Olds | 0 (0.0%) | 0 (0.0%) |
| 5 to 9 Year Old | 242 (98.0%) | 5 (2.0%) |
| 10 to 14 Year Olds | 234 (91.0%) | 23 (8.9%) |
| 15 to 17 Year Olds | 99 (100.0%) | 0 (0.0%) |
| 18 to 19 Year Olds | 19 (100.0%) | 0 (0.0%) |
| 20 to 24 Year Olds | 34 (100.0%) | 0 (0.0%) |
| 25 to 34 Year Olds | 5 (100.0%) | 0 (0.0%) |
| 35 Years and over | 67 (100.0%) | 0 (0.0%) |
| Total | 700 (96.2%) | 28 (3.8%) |
Educational Attainment by Field of Study in Welcome
Science & technology (127 | 38.3%), education (61 | 18.4%), physical & health sciences (56 | 16.9%), business (46 | 13.9%), and computers & mathematics (17 | 5.1%) are the most common fields of study among 332 individuals in Welcome who have obtained a bachelor's degree or higher.
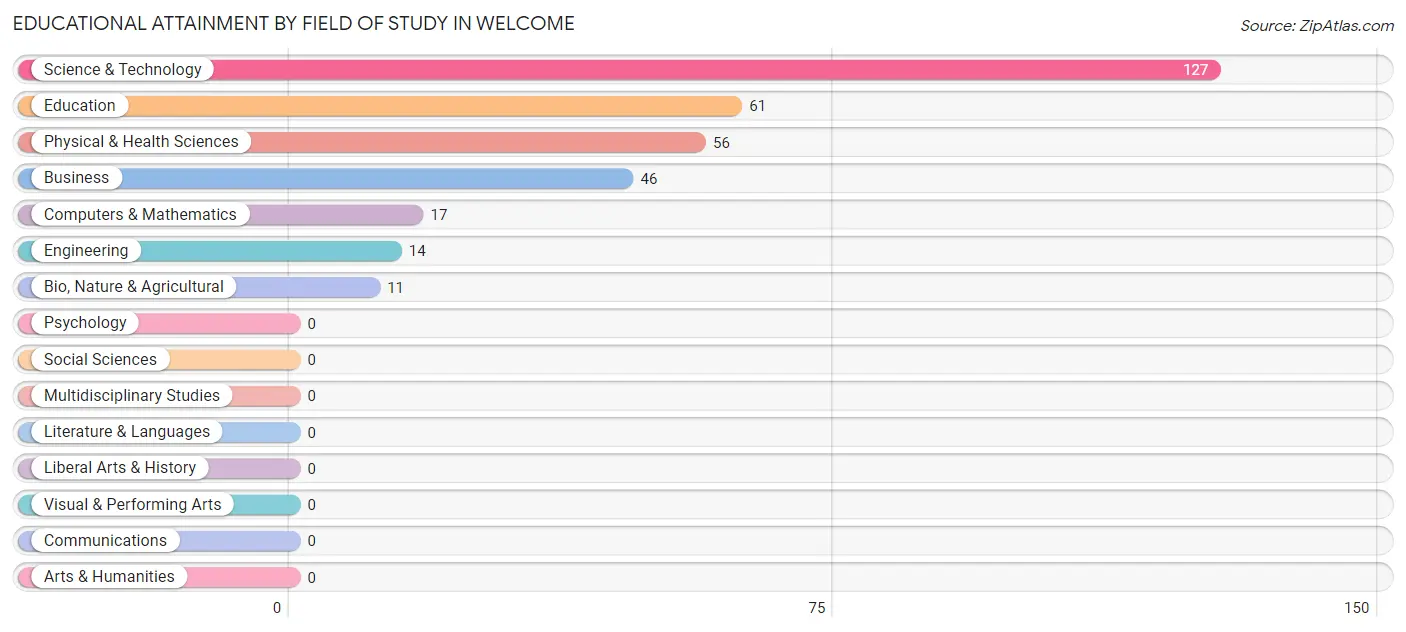
| Field of Study | # Graduates | % Graduates |
| Computers & Mathematics | 17 | 5.1% |
| Bio, Nature & Agricultural | 11 | 3.3% |
| Physical & Health Sciences | 56 | 16.9% |
| Psychology | 0 | 0.0% |
| Social Sciences | 0 | 0.0% |
| Engineering | 14 | 4.2% |
| Multidisciplinary Studies | 0 | 0.0% |
| Science & Technology | 127 | 38.3% |
| Business | 46 | 13.9% |
| Education | 61 | 18.4% |
| Literature & Languages | 0 | 0.0% |
| Liberal Arts & History | 0 | 0.0% |
| Visual & Performing Arts | 0 | 0.0% |
| Communications | 0 | 0.0% |
| Arts & Humanities | 0 | 0.0% |
| Total | 332 | 100.0% |
Transportation & Commute in Welcome
Vehicle Availability by Sex in Welcome
The most prevalent vehicle ownership categories in Welcome are males with 2 vehicles (339, accounting for 39.2%) and females with 2 vehicles (259, making up 50.1%).
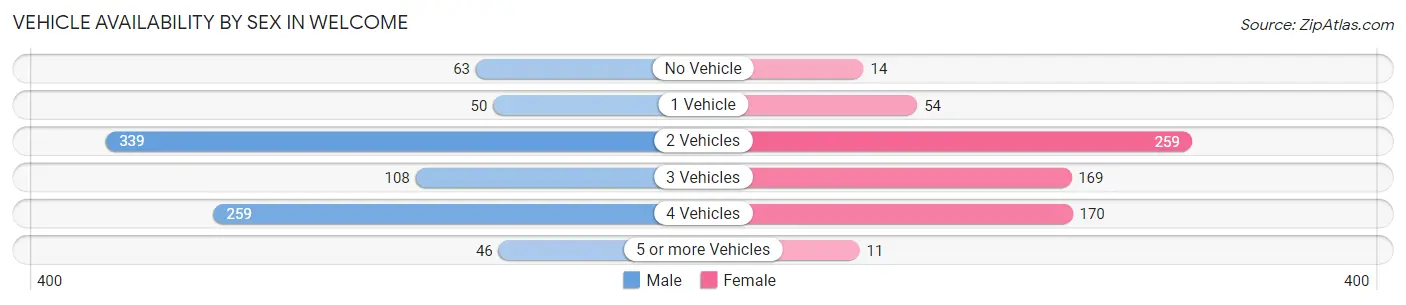
| Vehicles Available | Male | Female |
| No Vehicle | 63 (7.3%) | 14 (2.1%) |
| 1 Vehicle | 50 (5.8%) | 54 (8.0%) |
| 2 Vehicles | 339 (39.2%) | 259 (38.3%) |
| 3 Vehicles | 108 (12.5%) | 169 (25.0%) |
| 4 Vehicles | 259 (29.9%) | 170 (25.1%) |
| 5 or more Vehicles | 46 (5.3%) | 11 (1.6%) |
| Total | 865 (100.0%) | 677 (100.0%) |
Commute Time in Welcome
The most frequently occuring commute durations in Welcome are 30 to 34 minutes (333 commuters, 22.3%), 45 to 59 minutes (265 commuters, 17.7%), and 10 to 14 minutes (263 commuters, 17.6%).
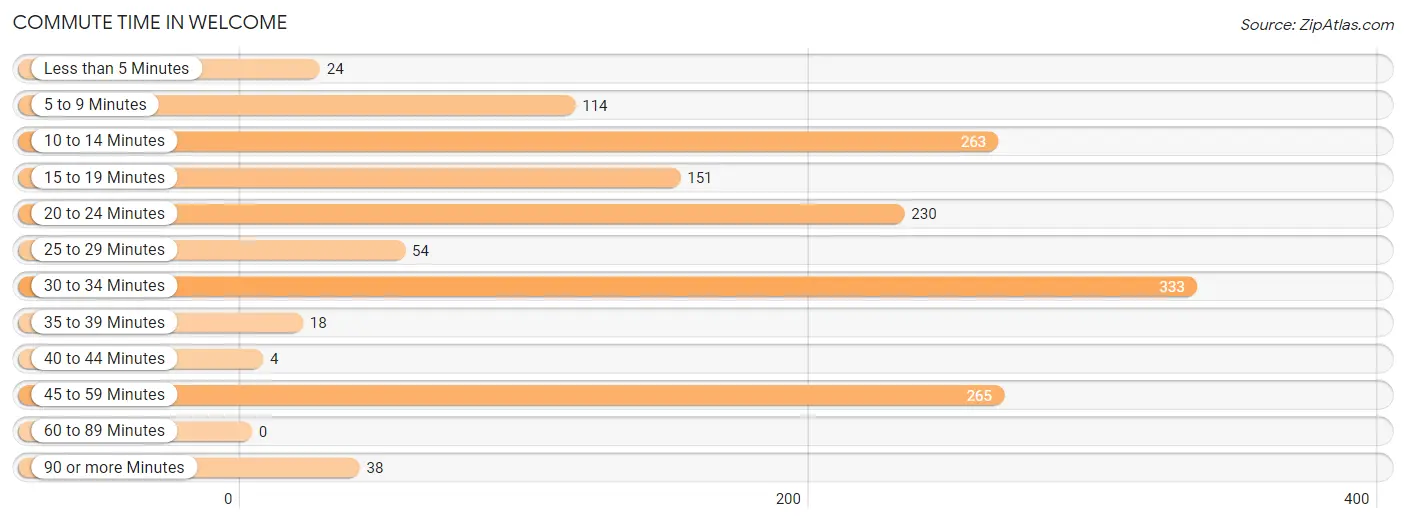
| Commute Time | # Commuters | % Commuters |
| Less than 5 Minutes | 24 | 1.6% |
| 5 to 9 Minutes | 114 | 7.6% |
| 10 to 14 Minutes | 263 | 17.6% |
| 15 to 19 Minutes | 151 | 10.1% |
| 20 to 24 Minutes | 230 | 15.4% |
| 25 to 29 Minutes | 54 | 3.6% |
| 30 to 34 Minutes | 333 | 22.3% |
| 35 to 39 Minutes | 18 | 1.2% |
| 40 to 44 Minutes | 4 | 0.3% |
| 45 to 59 Minutes | 265 | 17.7% |
| 60 to 89 Minutes | 0 | 0.0% |
| 90 or more Minutes | 38 | 2.5% |
Commute Time by Sex in Welcome
The most common commute times in Welcome are 30 to 34 minutes (244 commuters, 28.7%) for males and 20 to 24 minutes (167 commuters, 26.0%) for females.
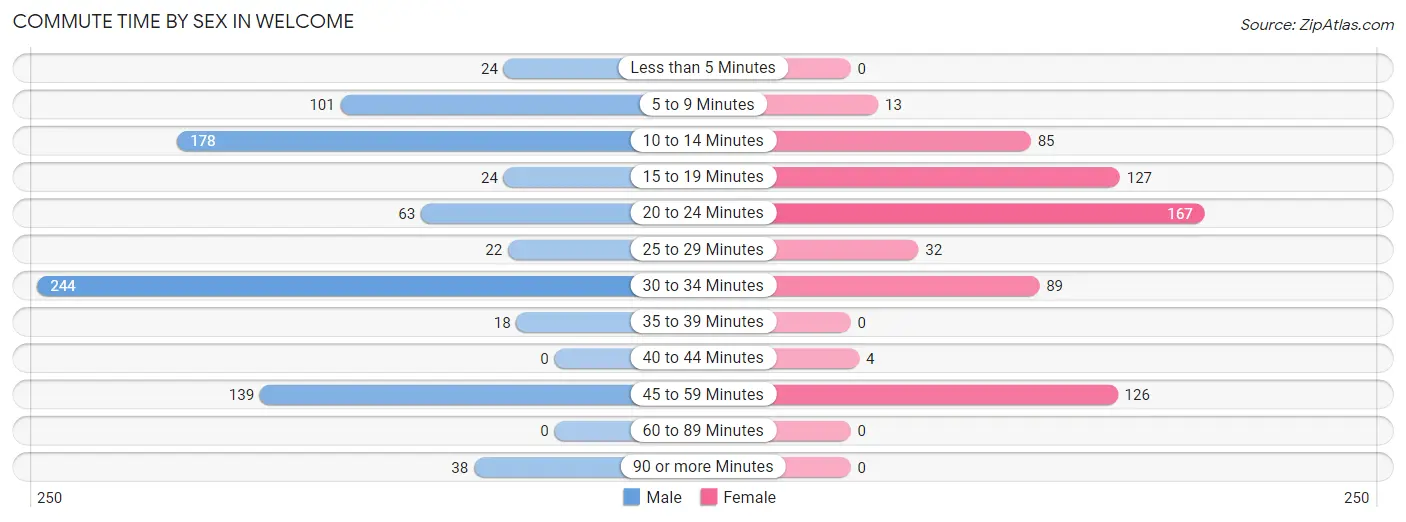
| Commute Time | Male | Female |
| Less than 5 Minutes | 24 (2.8%) | 0 (0.0%) |
| 5 to 9 Minutes | 101 (11.9%) | 13 (2.0%) |
| 10 to 14 Minutes | 178 (20.9%) | 85 (13.2%) |
| 15 to 19 Minutes | 24 (2.8%) | 127 (19.8%) |
| 20 to 24 Minutes | 63 (7.4%) | 167 (26.0%) |
| 25 to 29 Minutes | 22 (2.6%) | 32 (5.0%) |
| 30 to 34 Minutes | 244 (28.7%) | 89 (13.8%) |
| 35 to 39 Minutes | 18 (2.1%) | 0 (0.0%) |
| 40 to 44 Minutes | 0 (0.0%) | 4 (0.6%) |
| 45 to 59 Minutes | 139 (16.3%) | 126 (19.6%) |
| 60 to 89 Minutes | 0 (0.0%) | 0 (0.0%) |
| 90 or more Minutes | 38 (4.5%) | 0 (0.0%) |
Time of Departure to Work by Sex in Welcome
The most frequent times of departure to work in Welcome are 7:00 AM to 7:29 AM (116, 13.6%) for males and 7:00 AM to 7:29 AM (180, 28.0%) for females.
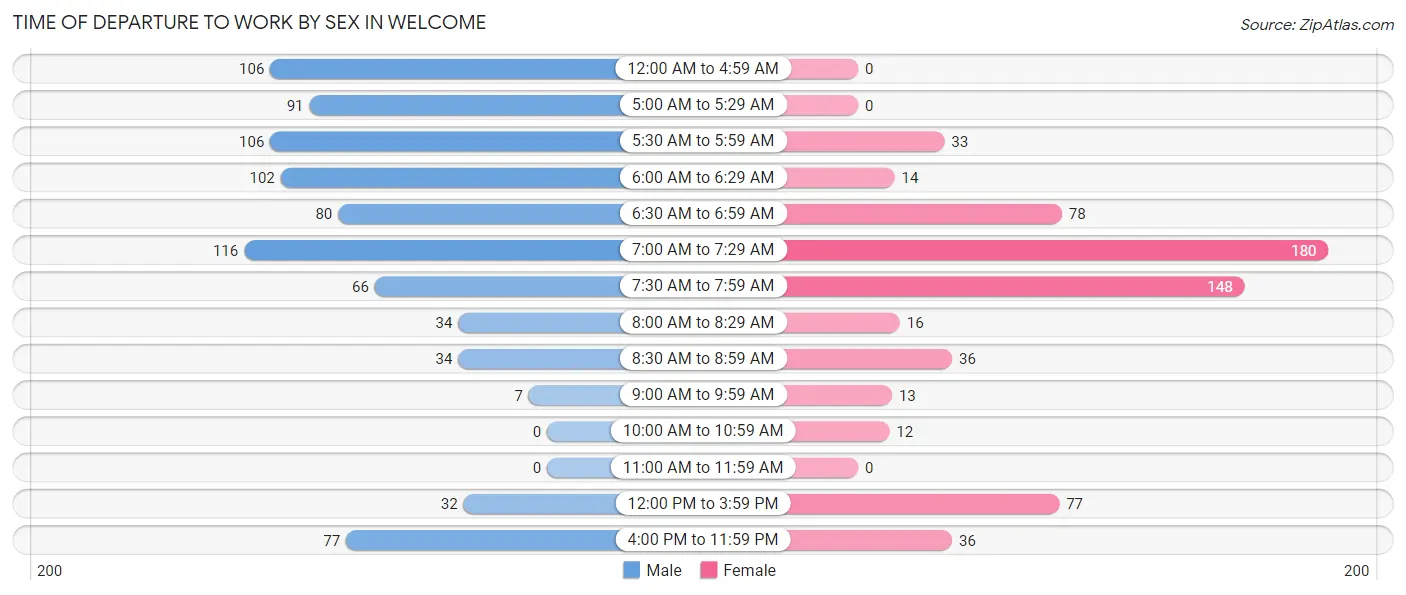
| Time of Departure | Male | Female |
| 12:00 AM to 4:59 AM | 106 (12.5%) | 0 (0.0%) |
| 5:00 AM to 5:29 AM | 91 (10.7%) | 0 (0.0%) |
| 5:30 AM to 5:59 AM | 106 (12.5%) | 33 (5.1%) |
| 6:00 AM to 6:29 AM | 102 (12.0%) | 14 (2.2%) |
| 6:30 AM to 6:59 AM | 80 (9.4%) | 78 (12.1%) |
| 7:00 AM to 7:29 AM | 116 (13.6%) | 180 (28.0%) |
| 7:30 AM to 7:59 AM | 66 (7.8%) | 148 (23.0%) |
| 8:00 AM to 8:29 AM | 34 (4.0%) | 16 (2.5%) |
| 8:30 AM to 8:59 AM | 34 (4.0%) | 36 (5.6%) |
| 9:00 AM to 9:59 AM | 7 (0.8%) | 13 (2.0%) |
| 10:00 AM to 10:59 AM | 0 (0.0%) | 12 (1.9%) |
| 11:00 AM to 11:59 AM | 0 (0.0%) | 0 (0.0%) |
| 12:00 PM to 3:59 PM | 32 (3.8%) | 77 (12.0%) |
| 4:00 PM to 11:59 PM | 77 (9.0%) | 36 (5.6%) |
| Total | 851 (100.0%) | 643 (100.0%) |
Housing Occupancy in Welcome
Occupancy by Ownership in Welcome
Of the total 1,300 dwellings in Welcome, owner-occupied units account for 1,012 (77.8%), while renter-occupied units make up 288 (22.2%).
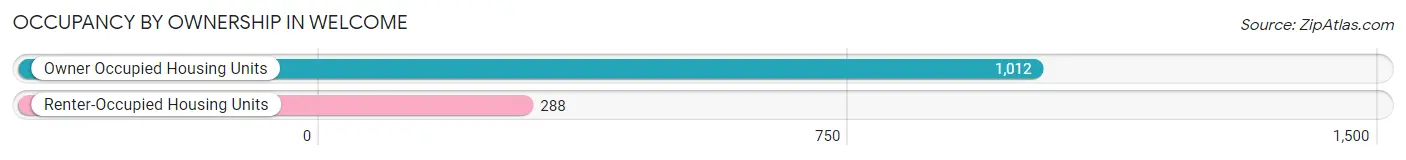
| Occupancy | # Housing Units | % Housing Units |
| Owner Occupied Housing Units | 1,012 | 77.8% |
| Renter-Occupied Housing Units | 288 | 22.2% |
| Total Occupied Housing Units | 1,300 | 100.0% |
Occupancy by Household Size in Welcome
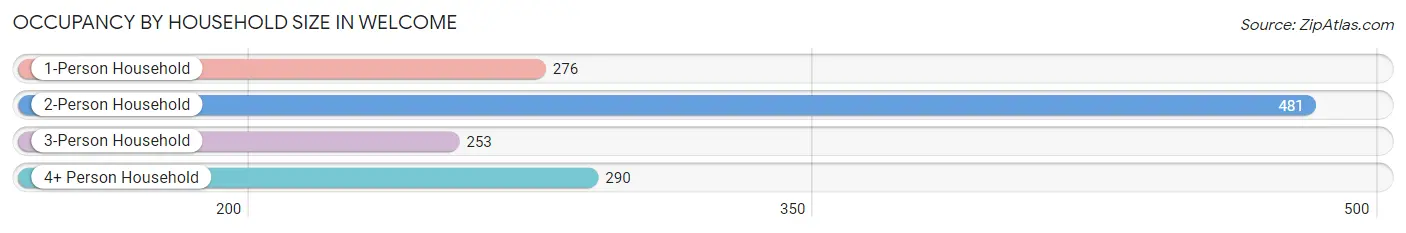
| Household Size | # Housing Units | % Housing Units |
| 1-Person Household | 276 | 21.2% |
| 2-Person Household | 481 | 37.0% |
| 3-Person Household | 253 | 19.5% |
| 4+ Person Household | 290 | 22.3% |
| Total Housing Units | 1,300 | 100.0% |
Occupancy by Ownership by Household Size in Welcome
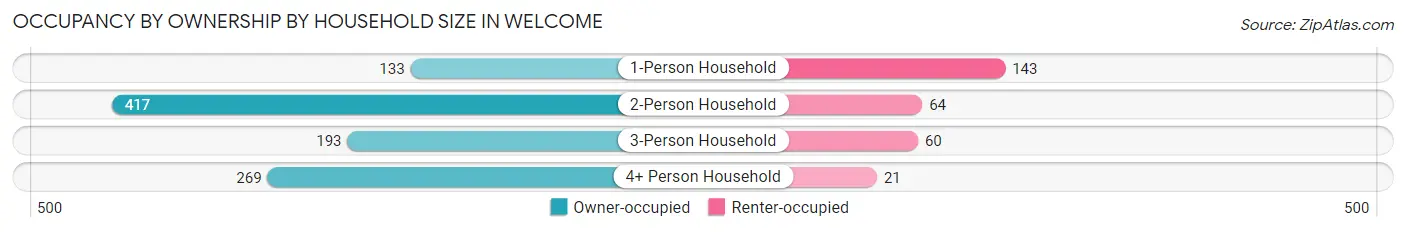
| Household Size | Owner-occupied | Renter-occupied |
| 1-Person Household | 133 (48.2%) | 143 (51.8%) |
| 2-Person Household | 417 (86.7%) | 64 (13.3%) |
| 3-Person Household | 193 (76.3%) | 60 (23.7%) |
| 4+ Person Household | 269 (92.8%) | 21 (7.2%) |
| Total Housing Units | 1,012 (77.8%) | 288 (22.2%) |
Occupancy by Educational Attainment in Welcome
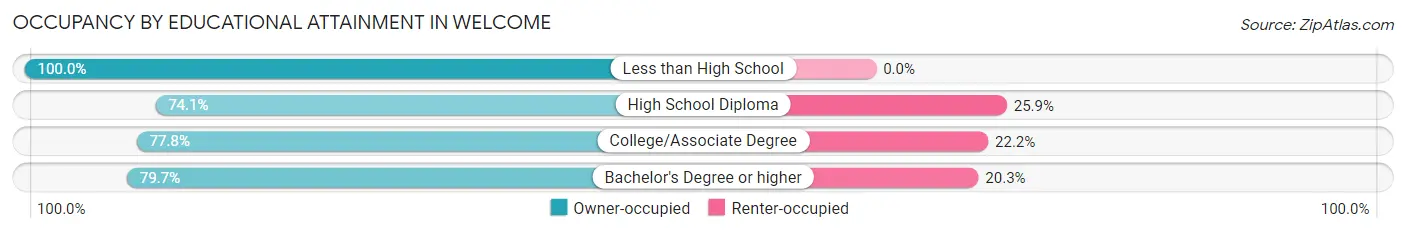
| Household Size | Owner-occupied | Renter-occupied |
| Less than High School | 89 (100.0%) | 0 (0.0%) |
| High School Diploma | 412 (74.1%) | 144 (25.9%) |
| College/Associate Degree | 452 (77.8%) | 129 (22.2%) |
| Bachelor's Degree or higher | 59 (79.7%) | 15 (20.3%) |
Occupancy by Age of Householder in Welcome
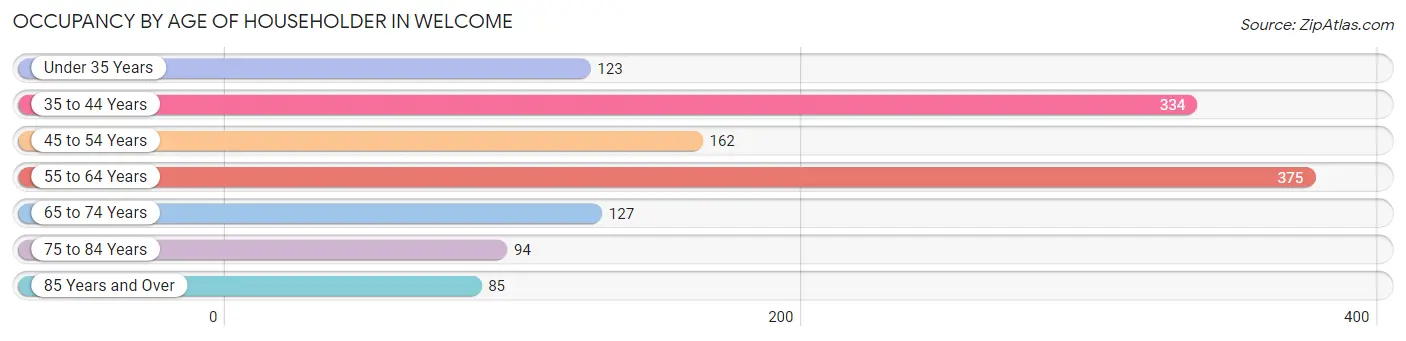
| Age Bracket | # Households | % Households |
| Under 35 Years | 123 | 9.5% |
| 35 to 44 Years | 334 | 25.7% |
| 45 to 54 Years | 162 | 12.5% |
| 55 to 64 Years | 375 | 28.8% |
| 65 to 74 Years | 127 | 9.8% |
| 75 to 84 Years | 94 | 7.2% |
| 85 Years and Over | 85 | 6.5% |
| Total | 1,300 | 100.0% |
Housing Finances in Welcome
Median Income by Occupancy in Welcome
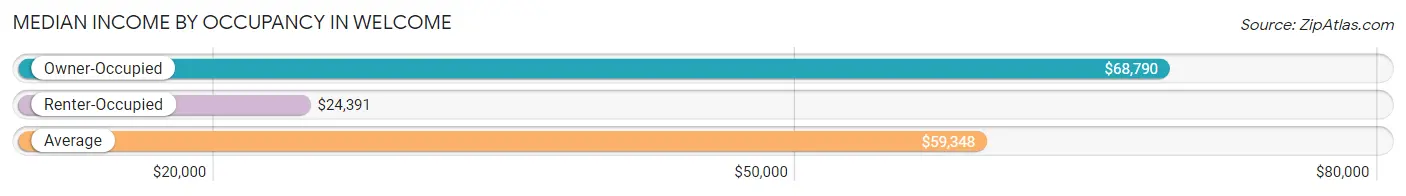
| Occupancy Type | # Households | Median Income |
| Owner-Occupied | 1,012 (77.8%) | $68,790 |
| Renter-Occupied | 288 (22.2%) | $24,391 |
| Average | 1,300 (100.0%) | $59,348 |
Occupancy by Householder Income Bracket in Welcome
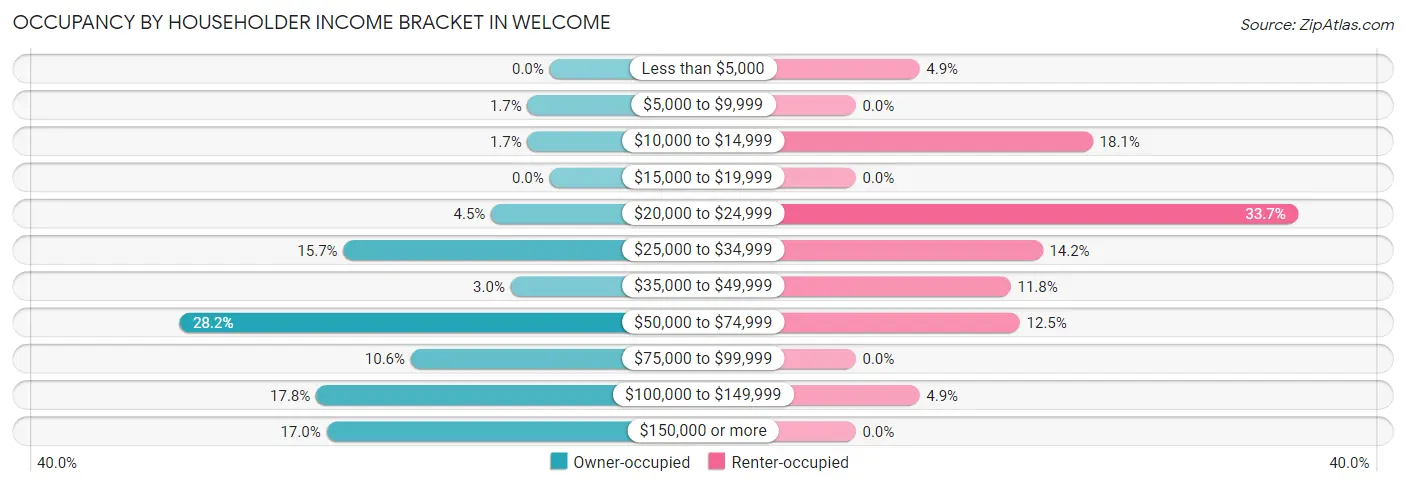
| Income Bracket | Owner-occupied | Renter-occupied |
| Less than $5,000 | 0 (0.0%) | 14 (4.9%) |
| $5,000 to $9,999 | 17 (1.7%) | 0 (0.0%) |
| $10,000 to $14,999 | 17 (1.7%) | 52 (18.1%) |
| $15,000 to $19,999 | 0 (0.0%) | 0 (0.0%) |
| $20,000 to $24,999 | 45 (4.4%) | 97 (33.7%) |
| $25,000 to $34,999 | 159 (15.7%) | 41 (14.2%) |
| $35,000 to $49,999 | 30 (3.0%) | 34 (11.8%) |
| $50,000 to $74,999 | 285 (28.2%) | 36 (12.5%) |
| $75,000 to $99,999 | 107 (10.6%) | 0 (0.0%) |
| $100,000 to $149,999 | 180 (17.8%) | 14 (4.9%) |
| $150,000 or more | 172 (17.0%) | 0 (0.0%) |
| Total | 1,012 (100.0%) | 288 (100.0%) |
Monthly Housing Cost Tiers in Welcome
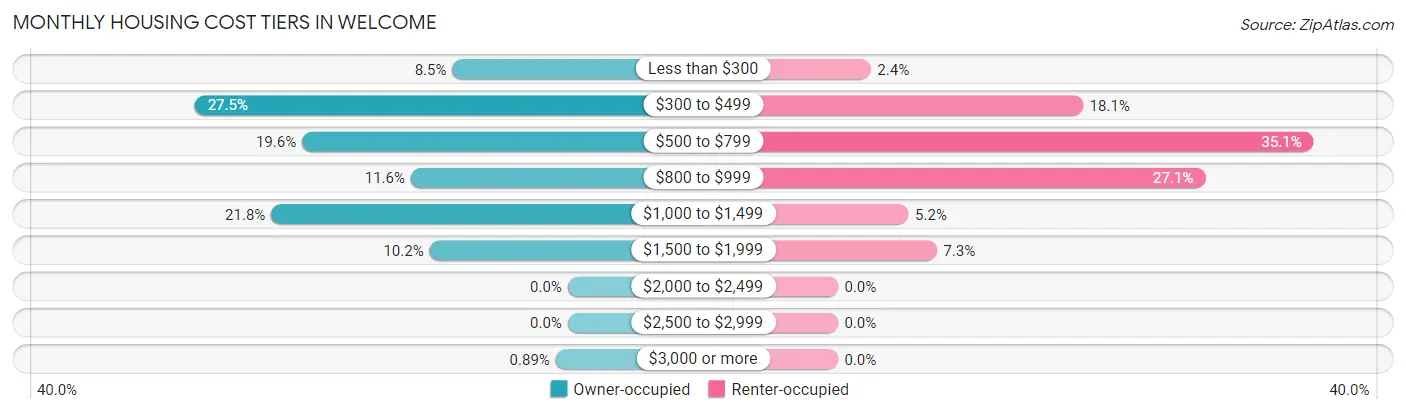
| Monthly Cost | Owner-occupied | Renter-occupied |
| Less than $300 | 86 (8.5%) | 7 (2.4%) |
| $300 to $499 | 278 (27.5%) | 52 (18.1%) |
| $500 to $799 | 198 (19.6%) | 101 (35.1%) |
| $800 to $999 | 117 (11.6%) | 78 (27.1%) |
| $1,000 to $1,499 | 221 (21.8%) | 15 (5.2%) |
| $1,500 to $1,999 | 103 (10.2%) | 21 (7.3%) |
| $2,000 to $2,499 | 0 (0.0%) | 0 (0.0%) |
| $2,500 to $2,999 | 0 (0.0%) | 0 (0.0%) |
| $3,000 or more | 9 (0.9%) | 0 (0.0%) |
| Total | 1,012 (100.0%) | 288 (100.0%) |
Physical Housing Characteristics in Welcome
Housing Structures in Welcome
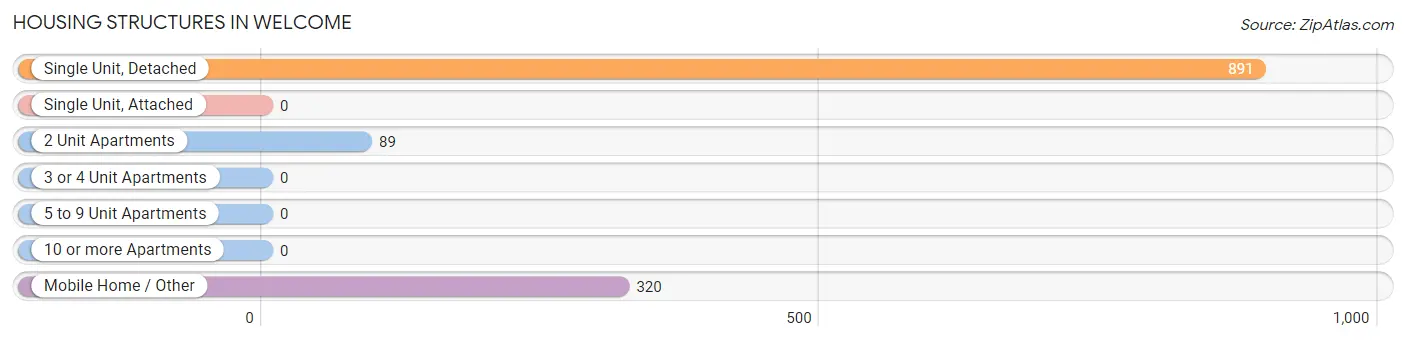
| Structure Type | # Housing Units | % Housing Units |
| Single Unit, Detached | 891 | 68.5% |
| Single Unit, Attached | 0 | 0.0% |
| 2 Unit Apartments | 89 | 6.9% |
| 3 or 4 Unit Apartments | 0 | 0.0% |
| 5 to 9 Unit Apartments | 0 | 0.0% |
| 10 or more Apartments | 0 | 0.0% |
| Mobile Home / Other | 320 | 24.6% |
| Total | 1,300 | 100.0% |
Housing Structures by Occupancy in Welcome
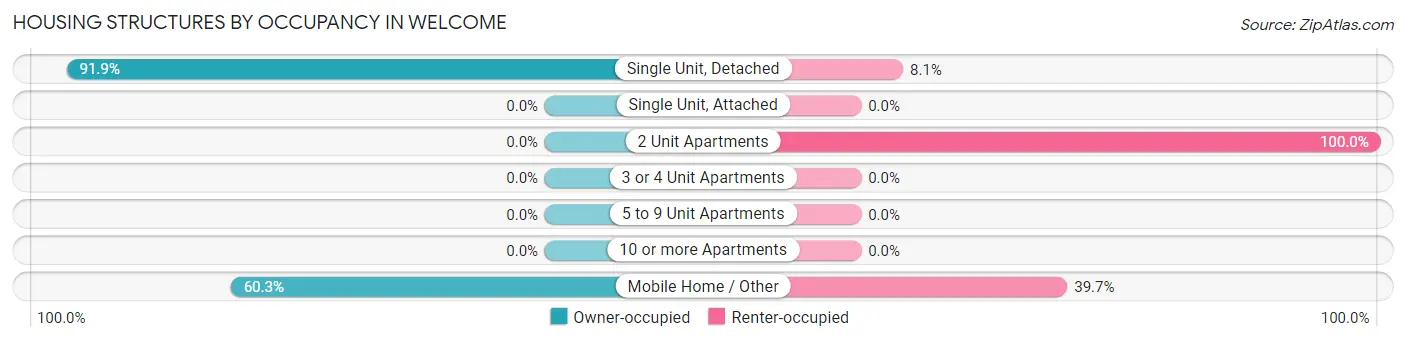
| Structure Type | Owner-occupied | Renter-occupied |
| Single Unit, Detached | 819 (91.9%) | 72 (8.1%) |
| Single Unit, Attached | 0 (0.0%) | 0 (0.0%) |
| 2 Unit Apartments | 0 (0.0%) | 89 (100.0%) |
| 3 or 4 Unit Apartments | 0 (0.0%) | 0 (0.0%) |
| 5 to 9 Unit Apartments | 0 (0.0%) | 0 (0.0%) |
| 10 or more Apartments | 0 (0.0%) | 0 (0.0%) |
| Mobile Home / Other | 193 (60.3%) | 127 (39.7%) |
| Total | 1,012 (77.8%) | 288 (22.2%) |
Housing Structures by Number of Rooms in Welcome
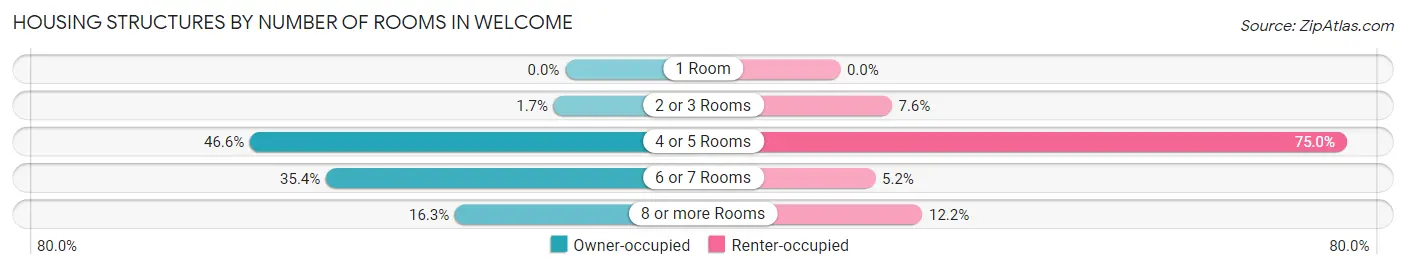
| Number of Rooms | Owner-occupied | Renter-occupied |
| 1 Room | 0 (0.0%) | 0 (0.0%) |
| 2 or 3 Rooms | 17 (1.7%) | 22 (7.6%) |
| 4 or 5 Rooms | 472 (46.6%) | 216 (75.0%) |
| 6 or 7 Rooms | 358 (35.4%) | 15 (5.2%) |
| 8 or more Rooms | 165 (16.3%) | 35 (12.1%) |
| Total | 1,012 (100.0%) | 288 (100.0%) |
Housing Structure by Heating Type in Welcome
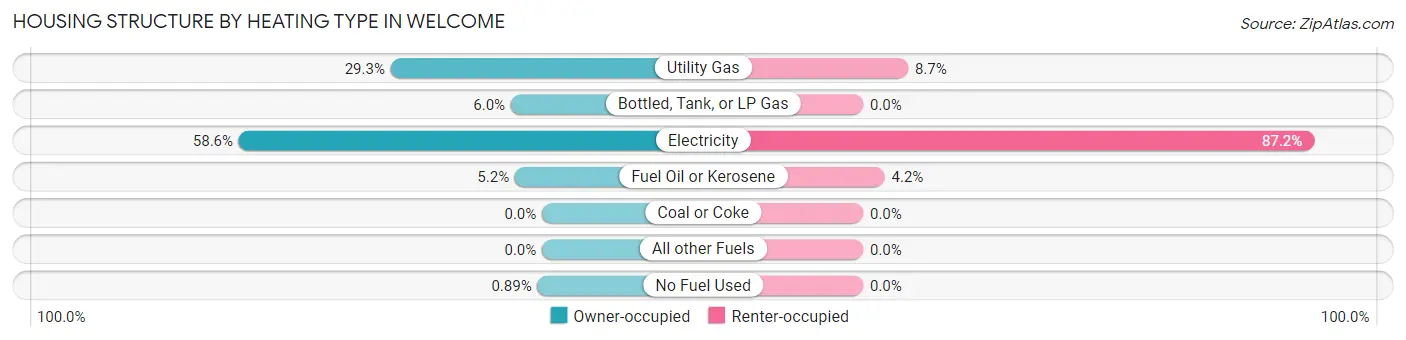
| Heating Type | Owner-occupied | Renter-occupied |
| Utility Gas | 296 (29.2%) | 25 (8.7%) |
| Bottled, Tank, or LP Gas | 61 (6.0%) | 0 (0.0%) |
| Electricity | 593 (58.6%) | 251 (87.2%) |
| Fuel Oil or Kerosene | 53 (5.2%) | 12 (4.2%) |
| Coal or Coke | 0 (0.0%) | 0 (0.0%) |
| All other Fuels | 0 (0.0%) | 0 (0.0%) |
| No Fuel Used | 9 (0.9%) | 0 (0.0%) |
| Total | 1,012 (100.0%) | 288 (100.0%) |
Household Vehicle Usage in Welcome
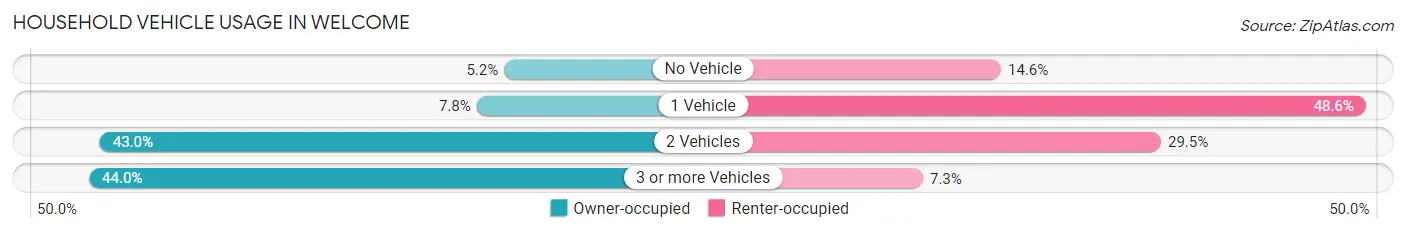
| Vehicles per Household | Owner-occupied | Renter-occupied |
| No Vehicle | 53 (5.2%) | 42 (14.6%) |
| 1 Vehicle | 79 (7.8%) | 140 (48.6%) |
| 2 Vehicles | 435 (43.0%) | 85 (29.5%) |
| 3 or more Vehicles | 445 (44.0%) | 21 (7.3%) |
| Total | 1,012 (100.0%) | 288 (100.0%) |
Real Estate & Mortgages in Welcome
Real Estate and Mortgage Overview in Welcome
| Characteristic | Without Mortgage | With Mortgage |
| Housing Units | 496 | 516 |
| Median Property Value | $113,600 | $171,300 |
| Median Household Income | $59,902 | $138 |
| Monthly Housing Costs | $387 | $9 |
| Real Estate Taxes | $951 | $20 |
Property Value by Mortgage Status in Welcome
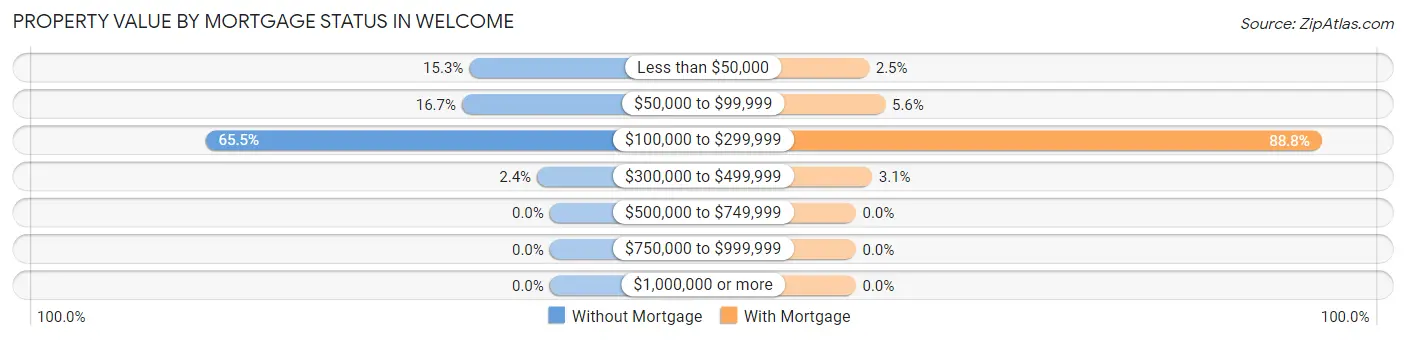
| Property Value | Without Mortgage | With Mortgage |
| Less than $50,000 | 76 (15.3%) | 13 (2.5%) |
| $50,000 to $99,999 | 83 (16.7%) | 29 (5.6%) |
| $100,000 to $299,999 | 325 (65.5%) | 458 (88.8%) |
| $300,000 to $499,999 | 12 (2.4%) | 16 (3.1%) |
| $500,000 to $749,999 | 0 (0.0%) | 0 (0.0%) |
| $750,000 to $999,999 | 0 (0.0%) | 0 (0.0%) |
| $1,000,000 or more | 0 (0.0%) | 0 (0.0%) |
| Total | 496 (100.0%) | 516 (100.0%) |
Household Income by Mortgage Status in Welcome
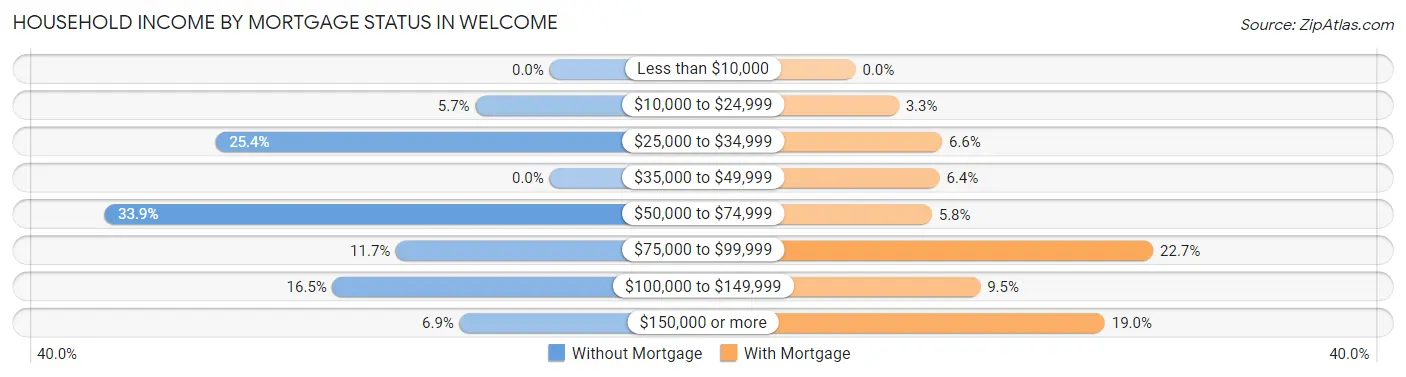
| Household Income | Without Mortgage | With Mortgage |
| Less than $10,000 | 0 (0.0%) | 0 (0.0%) |
| $10,000 to $24,999 | 28 (5.7%) | 17 (3.3%) |
| $25,000 to $34,999 | 126 (25.4%) | 34 (6.6%) |
| $35,000 to $49,999 | 0 (0.0%) | 33 (6.4%) |
| $50,000 to $74,999 | 168 (33.9%) | 30 (5.8%) |
| $75,000 to $99,999 | 58 (11.7%) | 117 (22.7%) |
| $100,000 to $149,999 | 82 (16.5%) | 49 (9.5%) |
| $150,000 or more | 34 (6.9%) | 98 (19.0%) |
| Total | 496 (100.0%) | 516 (100.0%) |
Property Value to Household Income Ratio in Welcome
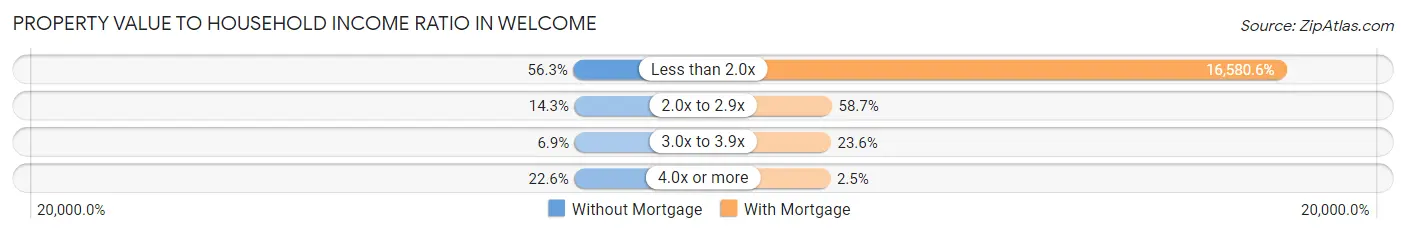
| Value-to-Income Ratio | Without Mortgage | With Mortgage |
| Less than 2.0x | 279 (56.2%) | 85,556 (16,580.6%) |
| 2.0x to 2.9x | 71 (14.3%) | 303 (58.7%) |
| 3.0x to 3.9x | 34 (6.9%) | 122 (23.6%) |
| 4.0x or more | 112 (22.6%) | 13 (2.5%) |
| Total | 496 (100.0%) | 516 (100.0%) |
Real Estate Taxes by Mortgage Status in Welcome
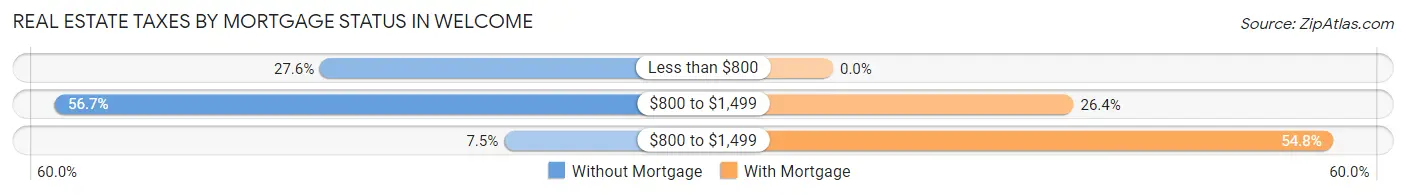
| Property Taxes | Without Mortgage | With Mortgage |
| Less than $800 | 137 (27.6%) | 0 (0.0%) |
| $800 to $1,499 | 281 (56.7%) | 136 (26.4%) |
| $800 to $1,499 | 37 (7.5%) | 283 (54.8%) |
| Total | 496 (100.0%) | 516 (100.0%) |
Health & Disability in Welcome
Health Insurance Coverage by Age in Welcome
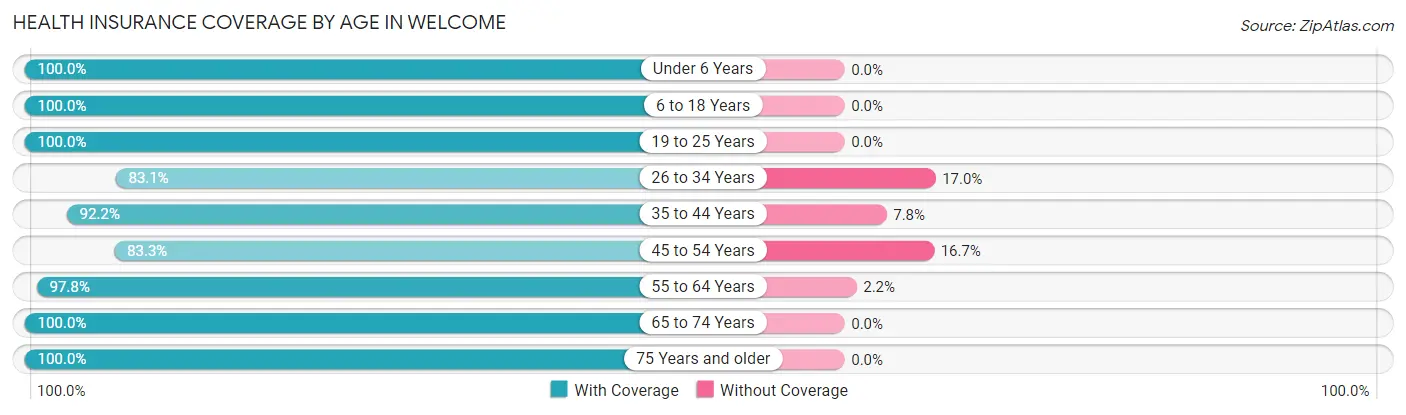
| Age Bracket | With Coverage | Without Coverage |
| Under 6 Years | 183 (100.0%) | 0 (0.0%) |
| 6 to 18 Years | 600 (100.0%) | 0 (0.0%) |
| 19 to 25 Years | 143 (100.0%) | 0 (0.0%) |
| 26 to 34 Years | 397 (83.1%) | 81 (17.0%) |
| 35 to 44 Years | 506 (92.2%) | 43 (7.8%) |
| 45 to 54 Years | 305 (83.3%) | 61 (16.7%) |
| 55 to 64 Years | 525 (97.8%) | 12 (2.2%) |
| 65 to 74 Years | 339 (100.0%) | 0 (0.0%) |
| 75 Years and older | 249 (100.0%) | 0 (0.0%) |
| Total | 3,247 (94.3%) | 197 (5.7%) |
Health Insurance Coverage by Citizenship Status in Welcome
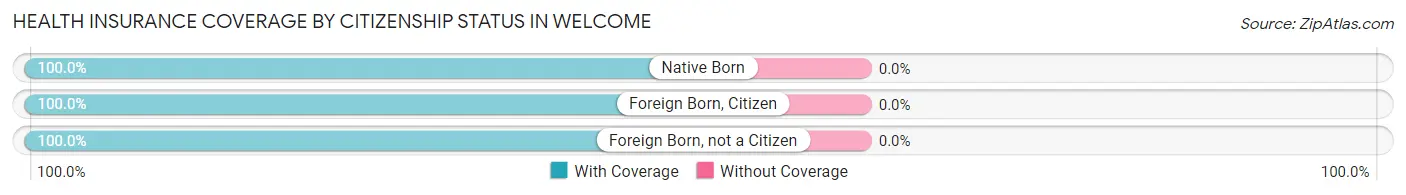
| Citizenship Status | With Coverage | Without Coverage |
| Native Born | 183 (100.0%) | 0 (0.0%) |
| Foreign Born, Citizen | 600 (100.0%) | 0 (0.0%) |
| Foreign Born, not a Citizen | 143 (100.0%) | 0 (0.0%) |
Health Insurance Coverage by Household Income in Welcome
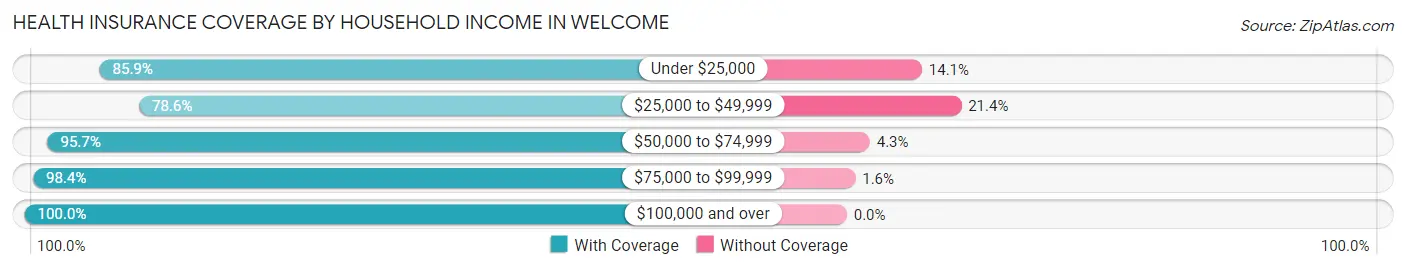
| Household Income | With Coverage | Without Coverage |
| Under $25,000 | 330 (85.9%) | 54 (14.1%) |
| $25,000 to $49,999 | 359 (78.6%) | 98 (21.4%) |
| $50,000 to $74,999 | 887 (95.7%) | 40 (4.3%) |
| $75,000 to $99,999 | 309 (98.4%) | 5 (1.6%) |
| $100,000 and over | 1,362 (100.0%) | 0 (0.0%) |
Public vs Private Health Insurance Coverage by Age in Welcome
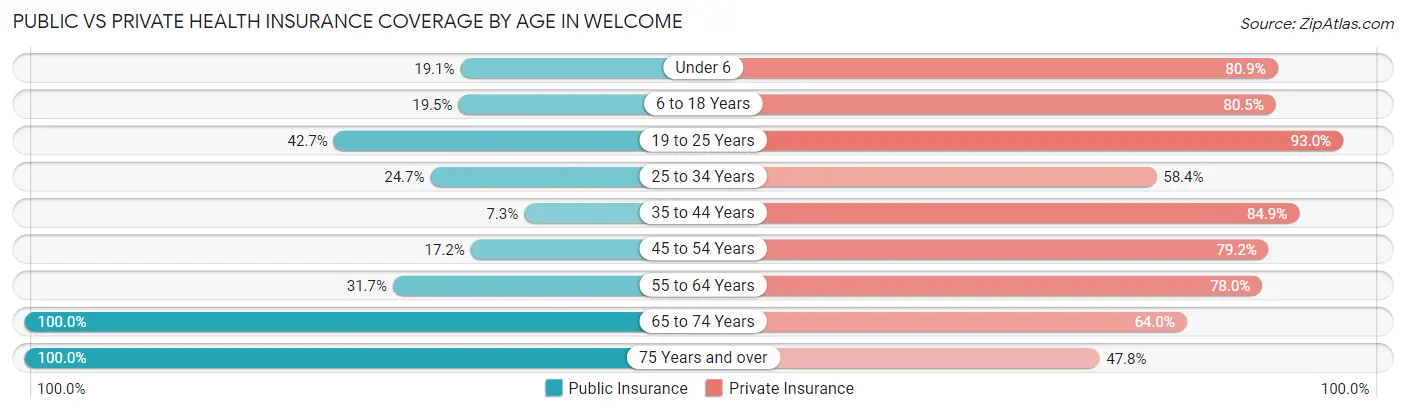
| Age Bracket | Public Insurance | Private Insurance |
| Under 6 | 35 (19.1%) | 148 (80.9%) |
| 6 to 18 Years | 117 (19.5%) | 483 (80.5%) |
| 19 to 25 Years | 61 (42.7%) | 133 (93.0%) |
| 25 to 34 Years | 118 (24.7%) | 279 (58.4%) |
| 35 to 44 Years | 40 (7.3%) | 466 (84.9%) |
| 45 to 54 Years | 63 (17.2%) | 290 (79.2%) |
| 55 to 64 Years | 170 (31.7%) | 419 (78.0%) |
| 65 to 74 Years | 339 (100.0%) | 217 (64.0%) |
| 75 Years and over | 249 (100.0%) | 119 (47.8%) |
| Total | 1,192 (34.6%) | 2,554 (74.2%) |
Disability Status by Sex by Age in Welcome
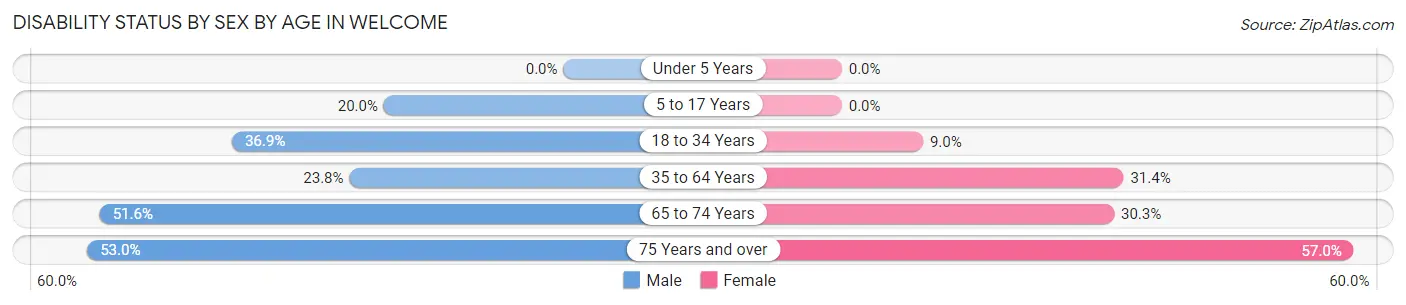
| Age Bracket | Male | Female |
| Under 5 Years | 0 (0.0%) | 0 (0.0%) |
| 5 to 17 Years | 50 (20.0%) | 0 (0.0%) |
| 18 to 34 Years | 100 (36.9%) | 33 (9.0%) |
| 35 to 64 Years | 188 (23.8%) | 208 (31.4%) |
| 65 to 74 Years | 95 (51.6%) | 47 (30.3%) |
| 75 Years and over | 79 (53.0%) | 57 (57.0%) |
Disability Class by Sex by Age in Welcome
Disability Class: Hearing Difficulty
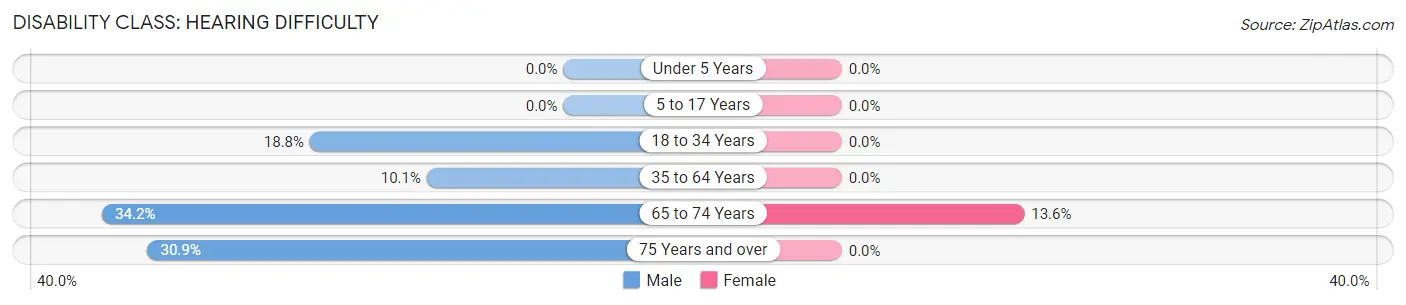
| Age Bracket | Male | Female |
| Under 5 Years | 0 (0.0%) | 0 (0.0%) |
| 5 to 17 Years | 0 (0.0%) | 0 (0.0%) |
| 18 to 34 Years | 51 (18.8%) | 0 (0.0%) |
| 35 to 64 Years | 80 (10.1%) | 0 (0.0%) |
| 65 to 74 Years | 63 (34.2%) | 21 (13.6%) |
| 75 Years and over | 46 (30.9%) | 0 (0.0%) |
Disability Class: Vision Difficulty
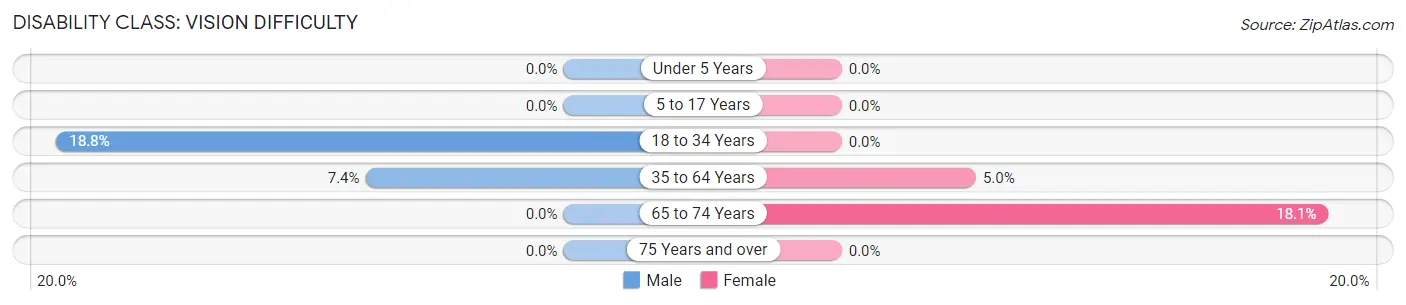
| Age Bracket | Male | Female |
| Under 5 Years | 0 (0.0%) | 0 (0.0%) |
| 5 to 17 Years | 0 (0.0%) | 0 (0.0%) |
| 18 to 34 Years | 51 (18.8%) | 0 (0.0%) |
| 35 to 64 Years | 58 (7.3%) | 33 (5.0%) |
| 65 to 74 Years | 0 (0.0%) | 28 (18.1%) |
| 75 Years and over | 0 (0.0%) | 0 (0.0%) |
Disability Class: Cognitive Difficulty
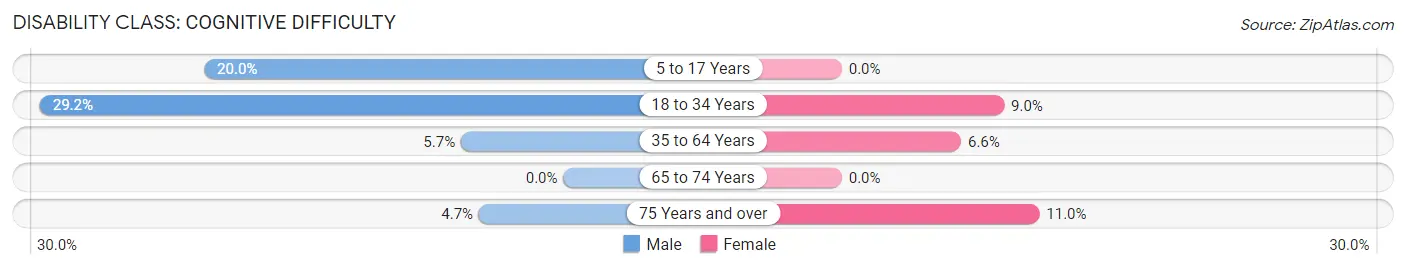
| Age Bracket | Male | Female |
| 5 to 17 Years | 50 (20.0%) | 0 (0.0%) |
| 18 to 34 Years | 79 (29.1%) | 33 (9.0%) |
| 35 to 64 Years | 45 (5.7%) | 44 (6.6%) |
| 65 to 74 Years | 0 (0.0%) | 0 (0.0%) |
| 75 Years and over | 7 (4.7%) | 11 (11.0%) |
Disability Class: Ambulatory Difficulty
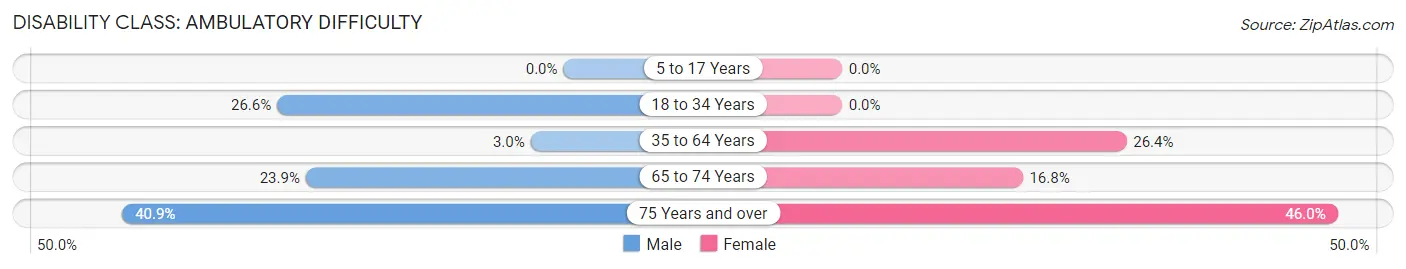
| Age Bracket | Male | Female |
| 5 to 17 Years | 0 (0.0%) | 0 (0.0%) |
| 18 to 34 Years | 72 (26.6%) | 0 (0.0%) |
| 35 to 64 Years | 24 (3.0%) | 175 (26.4%) |
| 65 to 74 Years | 44 (23.9%) | 26 (16.8%) |
| 75 Years and over | 61 (40.9%) | 46 (46.0%) |
Disability Class: Self-Care Difficulty
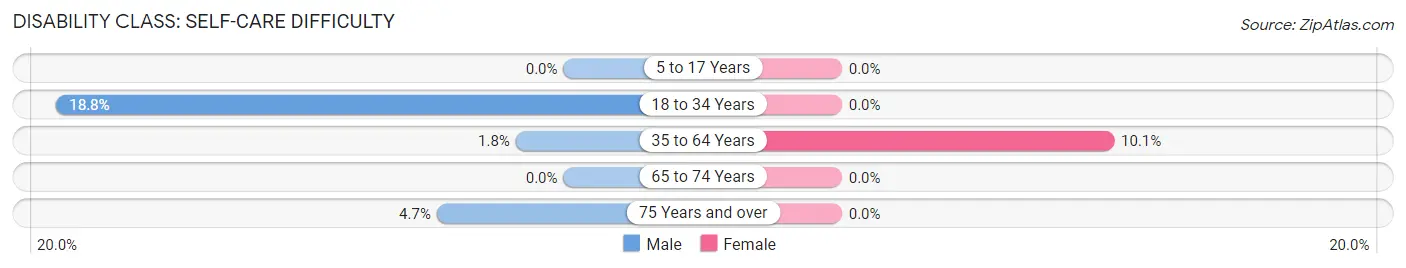
| Age Bracket | Male | Female |
| 5 to 17 Years | 0 (0.0%) | 0 (0.0%) |
| 18 to 34 Years | 51 (18.8%) | 0 (0.0%) |
| 35 to 64 Years | 14 (1.8%) | 67 (10.1%) |
| 65 to 74 Years | 0 (0.0%) | 0 (0.0%) |
| 75 Years and over | 7 (4.7%) | 0 (0.0%) |
Technology Access in Welcome
Computing Device Access in Welcome
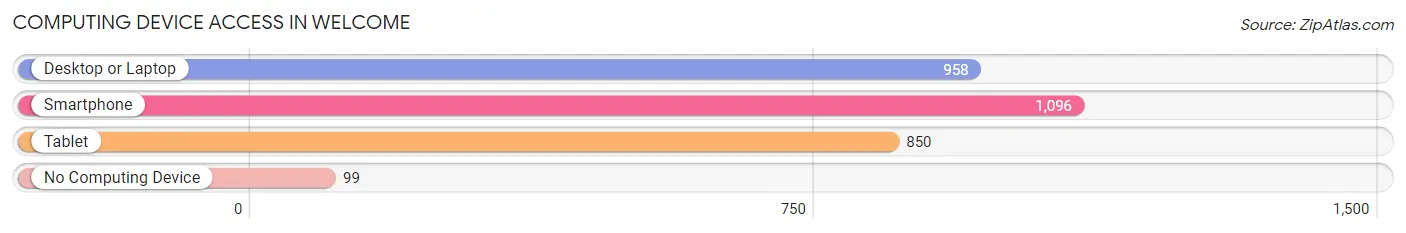
| Device Type | # Households | % Households |
| Desktop or Laptop | 958 | 73.7% |
| Smartphone | 1,096 | 84.3% |
| Tablet | 850 | 65.4% |
| No Computing Device | 99 | 7.6% |
| Total | 1,300 | 100.0% |
Internet Access in Welcome
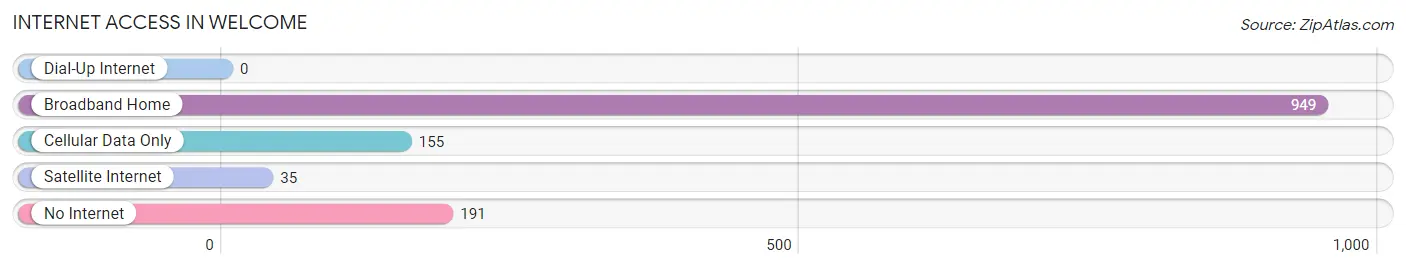
| Internet Type | # Households | % Households |
| Dial-Up Internet | 0 | 0.0% |
| Broadband Home | 949 | 73.0% |
| Cellular Data Only | 155 | 11.9% |
| Satellite Internet | 35 | 2.7% |
| No Internet | 191 | 14.7% |
| Total | 1,300 | 100.0% |
Welcome Summary
North Carolina is a state located in the southeastern United States. It is bordered by South Carolina to the south, Georgia to the southwest, Tennessee to the west, Virginia to the north, and the Atlantic Ocean to the east. North Carolina is the 28th most populous state in the United States, with an estimated population of 10.4 million in 2019. The state is divided into 100 counties and contains 552 municipalities.
Geography
North Carolina is located in the southeastern United States, between South Carolina and Virginia. It is bordered by the Atlantic Ocean to the east, Tennessee to the west, and Georgia to the southwest. The state has three distinct geographic regions: the Coastal Plain, the Piedmont, and the Appalachian Mountains. The Coastal Plain is a flat, low-lying area that stretches along the Atlantic coast. The Piedmont is a hilly region located between the Coastal Plain and the Appalachian Mountains. The Appalachian Mountains are the highest mountains in the eastern United States and form the western border of the state.
Economy
North Carolina has a diverse economy that is driven by agriculture, manufacturing, and technology. Agriculture is the state’s largest industry, accounting for over $80 billion in economic activity. The state is a major producer of tobacco, cotton, soybeans, and poultry. Manufacturing is the second-largest industry in the state, accounting for over $50 billion in economic activity. North Carolina is a major producer of furniture, textiles, and electronics. Technology is the third-largest industry in the state, accounting for over $30 billion in economic activity. The state is home to several major technology companies, including IBM, Cisco Systems, and Red Hat.
Demographics
North Carolina is a diverse state with a population of 10.4 million people. The state is majority white, with 66.3% of the population identifying as white. African Americans make up 22.2% of the population, while Hispanics and Latinos make up 8.7%. The state is also home to a large Native American population, with 1.5% of the population identifying as Native American. The median household income in the state is $50,584, and the median age is 38.
North Carolina is a state with a rich history, diverse geography, and vibrant economy. It is home to a diverse population and is a major producer of agriculture, manufacturing, and technology. The state is a great place to live, work, and visit, and its people are proud of their heritage and culture.
Common Questions
What is Per Capita Income in Welcome?
Per Capita income in Welcome is $29,741.
What is the Median Family Income in Welcome?
Median Family Income in Welcome is $73,235.
What is the Median Household income in Welcome?
Median Household Income in Welcome is $59,348.
What is Income or Wage Gap in Welcome?
Income or Wage Gap in Welcome is 20.2%.
Women in Welcome earn 79.8 cents for every dollar earned by a man.
What is Inequality or Gini Index in Welcome?
Inequality or Gini Index in Welcome is 0.41.
What is the Total Population of Welcome?
Total Population of Welcome is 3,444.
What is the Total Male Population of Welcome?
Total Male Population of Welcome is 1,699.
What is the Total Female Population of Welcome?
Total Female Population of Welcome is 1,745.
What is the Ratio of Males per 100 Females in Welcome?
There are 97.36 Males per 100 Females in Welcome.
What is the Ratio of Females per 100 Males in Welcome?
There are 102.71 Females per 100 Males in Welcome.
What is the Median Population Age in Welcome?
Median Population Age in Welcome is 41.1 Years.
What is the Average Family Size in Welcome
Average Family Size in Welcome is 3.1 People.
What is the Average Household Size in Welcome
Average Household Size in Welcome is 2.6 People.
How Large is the Labor Force in Welcome?
There are 1,598 People in the Labor Forcein in Welcome.
What is the Percentage of People in the Labor Force in Welcome?
57.6% of People are in the Labor Force in Welcome.
What is the Unemployment Rate in Welcome?
Unemployment Rate in Welcome is 1.8%.